ribosome profiling provides evidence that large noncoding
TRANSCRIPT

Matters Arising
Ribosome Profiling ProvidesEvidence that Large NoncodingRNAs Do Not Encode ProteinsMitchell Guttman,1,2,6,7,* Pamela Russell,1,6,7 Nicholas T. Ingolia,3 Jonathan S. Weissman,4 and Eric S. Lander1,2,5,*1Broad Institute of MIT and Harvard, 7 Cambridge Center, Cambridge, MA 02142, USA2Department of Biology, Massachusetts Institute of Technology, Cambridge, MA 02139, USA3Department of Embryology, Carnegie Institution for Science, Baltimore, MD 21218, USA4Howard Hughes Medical Institute, Department of Cellular and Molecular Pharmacology, University of California, San Francisco,San Francisco, CA 94158, USA5Department of Systems Biology, Harvard Medical School, Boston, MA 02114, USA6These authors contributed equally to this work7Present address: Division of Biology and Biological Engineering, California Institute of Technology, Pasadena, CA 91125, USA
*Correspondence: [email protected] (M.G.), [email protected] (E.S.L.)
http://dx.doi.org/10.1016/j.cell.2013.06.009
SUMMARY
Large noncoding RNAs are emerging as an importantcomponent in cellular regulation. Considerable evi-dence indicates that these transcripts act directlyas functional RNAs rather than through an encodedprotein product. However, a recent study of ribo-some occupancy reported that many large intergenicncRNAs (lincRNAs) are bound by ribosomes, raisingthe possibility that they are translated into proteins.Here, we show that classical noncoding RNAs and50 UTRs show the same ribosome occupancy aslincRNAs, demonstrating that ribosome occupancyalone is not sufficient to classify transcripts as cod-ing or noncoding. Instead, we define a metric basedon the known property of translation whereby trans-lating ribosomes are released upon encountering abona fide stop codon. We show that this metricaccurately discriminates between protein-codingtranscripts and all classes of known noncoding tran-scripts, including lincRNAs. Taken together, theseresults argue that the large majority of lincRNAs donot function through encoded proteins.
INTRODUCTION
The mammalian genome encodes many thousands of genes
thought to encode large noncoding RNAs (Birney et al., 2007;
Carninci et al., 2005; Derrien et al., 2012), including �3,500
termed ‘‘large intergenic noncoding RNAs’’ (lincRNAs) (Guttman
et al., 2009, 2010). The lincRNAs have recently been shown to
play key roles in diverse biological processes and are emerging
as an important class of regulatory molecules (Guttman et al.,
2011; Guttman and Rinn, 2012; Ørom et al., 2010; Ulitsky
et al., 2011; Wang and Chang, 2011). The lincRNAs resemble
240 Cell 154, 240–251, July 3, 2013 ª2013 Elsevier Inc.
messenger RNAs (mRNAs) with respect to transcription, length,
and splicing structure yet differ in that (1) they do not contain
open reading frames (ORFs) that show the cross-species muta-
tional pattern expected of evolutionarily conserved proteins
(Guttman et al., 2009, 2010); (2) they do not contain ORFs that
show the within-species substitution patterns expected of
recently evolved proteins (Figure S1 available online; Experi-
mental Procedures); (3) they tend to be highly enriched in the
nucleus (Derrien et al., 2012); (4) many physically interact with
chromatin regulatory proteins to affect gene expression (Gutt-
man et al., 2011; Guttman and Rinn, 2012; Wang and Chang,
2011); and (5) they rarely produce proteins detectable by mass
spectrometry (Banfai et al., 2012; Slavoff et al., 2013). Together,
these results suggest that lincRNAs function directly as RNA
molecules rather than through a translated protein product.
Recently, an approach termed ribosome profiling was
described that enables the global analysis of translation in a
wide range of organisms, including yeast and mammals. This
method involves digestion of RNA followed by separation of
80S ribosomes based on their size and density through a
sucrose cushion (Ingolia et al., 2009, 2011). The associated
RNAs are then sequenced to assess the occupancy of ribo-
somes on RNAs. Ribosome profiling can be used to identify
mRNAs associated with 80S ribosomes, distinguish ribosome-
free 30 UTRs on these messages, and assess the quantitative
dynamics of translation within translated regions (Ingolia et al.,
2009, 2011). Global identification of the locations of 80S ribo-
somes can be used to identify previously unknown translation
events. Defining the full set of translation products is important
for identifying regions that encode functional proteins (Stern-
Ginossar et al., 2012). Yet not all translation events lead to stable,
functional polypeptides. Instead, this translation could be impor-
tant for regulation of a downstream ORF (Geballe and Morris,
1994), contribute to the antigenic potential of pathogens (Starck
et al., 2008), regulate mRNA stability by inducing nonsense-
mediated decay (Smith and Steitz, 1998), and may even serve
as a source of proto-proteins enabling the evolution of novel
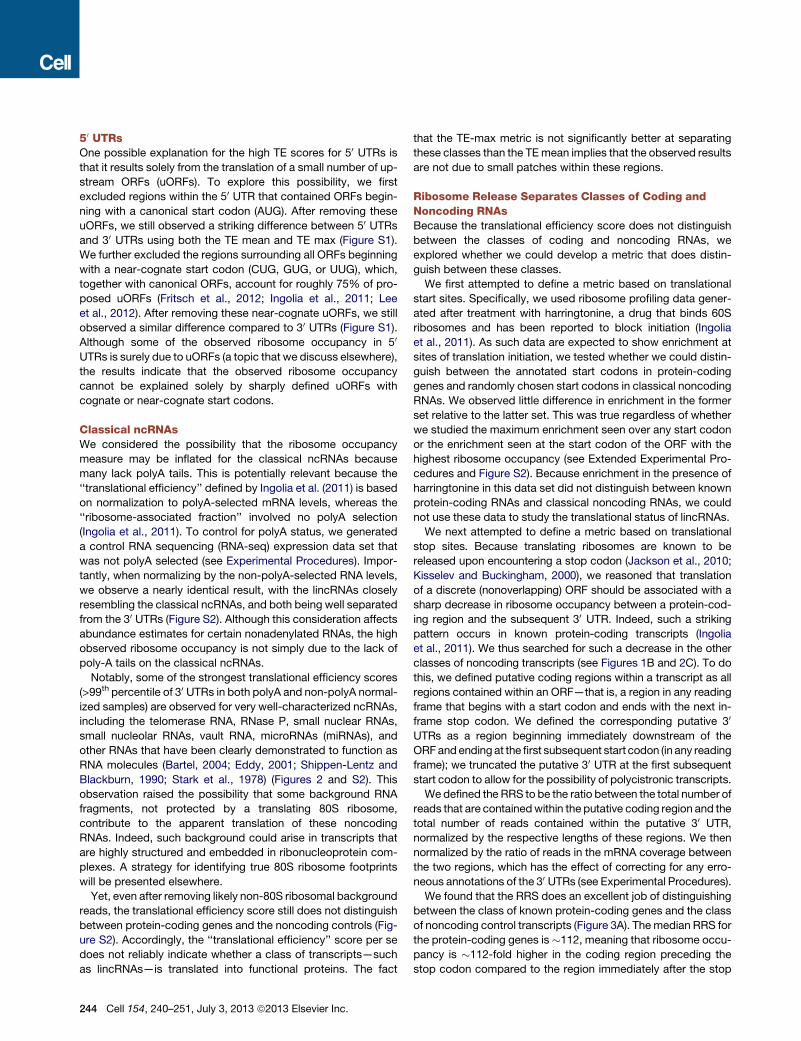
proteins (Carvunis et al., 2012). Finally, some eventsmay have no
biological function at all, representing biological noise without
deleterious consequence to the organism. Thus, the detection
of 80S ribosomes on an RNA does not alone provide evidence
that the RNA encodes a functional protein. For example, the
host messages for a number of small nucleolar RNAs (snoRNAs)
are translated, and this is used to induce rapid degradation
through the nonsense-mediated decay pathway, thereby allow-
ing disposal of the mature RNA after the snoRNAs have been ex-
tracted from intronic regions (Smith and Steitz, 1998). Thus, it is
important to develop strategies for using the 80S footprint data
provided by ribosome profiling experiments to distinguish true
messengers that encode functional proteins from those that
are noncoding.
Recently, it was reported that the ribosome occupancy of
most lincRNAs more closely resembles translated regions of
protein-coding genes compared to 30 UTRs, raising the possibil-
ity that lincRNAs are translated into functional proteins (Ingolia
et al., 2011). Given the many lines of evidence that lincRNAs
do not encode functional proteins, we examined the ribosome
profiling data in greater detail. In particular, we considered
whether noncoding RNAs should be expected to resemble 30
UTRs with respect to their ribosome profiles. There is an impor-
tant distinction between these two situations. When a ribosome
engaged in translating an ORF encounters a stop codon, it is
actively disassembled and is recycled (Jackson et al., 2010; Kis-
selev and Buckingham, 2000) (Figure 1A); this creates a sharp
drop in the ribosome occupancy in 30 UTRs relative to the
ORF. In contrast, in transcripts that have not been selected to
produce a distinct protein product, it is possible that the ribo-
some initiates translation at multiple locations and thus may
show significant occupancy across regions within the transcript
or even over the entire transcript. (In theory, ribosomes might
also scan the transcript without engaging in translation; we will
address this possibility elsewhere.) Thus, noncoding transcripts
might show very different ribosome profiles than 30 UTRs.Here, we study the pattern of ribosome occupancy on tran-
scripts to evaluate whether lincRNAs show evidence of encoding
functional proteins. In particular, we analyze the existing ribo-
some profiling data across other noncoding regions, including
50 UTRs and classical noncoding RNAs (such as small nuclear
and nucleolar RNAs, microRNA precursors, and large ncRNAs
such as telomerase RNA and RNase P), all of which are well
established to be noncoding (Eddy, 2001). We find that known
noncoding controls also show ribosome profiles that differ
from those of the 30 UTRs of protein-coding genes. Moreover,
50 UTRs resemble coding regions of protein-coding genes
more closely than do lincRNAs.
To systematically analyze the pattern of ribosome occupancy
across different classes of RNAs, we developed a metric that we
term the ribosome release score (RRS), which identifies func-
tional protein-coding transcripts with greater sensitivity by
detecting the termination of translation at the end of an ORF
(Jackson et al., 2010; Kisselev and Buckingham, 2000). We
show that the RRS sharply distinguishes between the class of
well-established protein-coding regions and other classes
such as 50 UTRs and classical ncRNAs and that the class of
lincRNAs closely resembles the other noncoding classes with
respect to this metric. Because 50 UTRs and classical ncRNAs
do not encode functional proteins, the similar pattern of ribo-
some occupancy on the lincRNAs indicates that they too are
unlikely, as a class, to produce functional proteins.
RESULTS
We began by defining a variety of control sets whose coding
status is well accepted: (1) the translated regions, 50 UTRs, and30 UTRs of 10,050 known protein-coding transcripts (‘‘genes
encoding typical-size proteins’’); (2) the translated regions of
639 known protein-coding transcripts encoding a protein with
<100 amino acids (‘‘genes encoding small proteins’’); and (3)
130 well-established noncoding RNAs that are well expressed
in mouse embryonic stem (ES) cells (referred to as ‘‘classical
noncoding RNAs’’), including small nuclear RNAs, small nucle-
olar RNAs, microRNA precursors, and large noncoding RNAs
(ncRNAs) such as telomerase RNA, RNase P, Neat1, and
Neat2/Malat1 (see Experimental Procedures).
Relative to these control sets, we analyzed a set of 167 ex-
pressed lincRNAs whose RNA levels were well represented in
the Ingolia et al. (2011) data set (see Experimental Procedures).
We previously defined these lincRNA transcripts based on a
chromatin signature of active transcription (Guttman et al.,
2009). This lincRNA set excludes a small group of 11 genes that
have short ORFs that show a pattern of evolutionary conservation
characteristic of protein-coding genes (Guttman et al., 2009; Lin
et al., 2011) and thus may encode a small protein; we refer to
this set as the codon substitution frequency (CSF)+ set (see
Experimental Procedures). In addition, this lincRNA set excludes
a small group of seven genes that have nonconserved long ORFs
but have been annotated as putative protein-coding genes based
on homology to other proteins (see Experimental Procedures).
We analyzed the previously published ribosomeprofiling data in
mouse ES cells (Ingolia et al., 2011) for each class of RNAs. We
note that the absolute level of ribosome occupancy (as assayed
by the ribosome profiling method) is not a useful metric because
it is strongly correlated with RNA levels for both coding and non-
coding transcripts (r = 0.89). To overcome this problem, a relative
metricwasproposedcalled the translational efficiency (TE) (Ingolia
et al., 2011). For each gene, this relative metric is defined as the
number of sequencing reads observed among ribosome-associ-
ated RNA divided by the number of reads in total poly-A+ RNA.
The TE score can be computed as either (1) the average value
(TE mean) across an entire feature (transcript or region) or (2) the
maximum value (TE max) in windows of a specified size within a
feature. Ingolia et al. (2011) based their conclusions on the TE-
max metric with a window size of 90 bases in order to account
for potential translation in short coding regionswithin a longer non-
coding transcript. Accordingly, we used the same metric.
We first confirmed the previous observations that (1) coding
regions differ sharply from 30 UTRs (Figures 1B–1D) and (2) the
lincRNAs resemble coding regions more closely than 30 UTRs(Figures 1C, 1D, and 2A). It was these observations that raised
the possibility that most lincRNAs are translated into proteins.
Interestingly, we found that the same observations applied
to the noncoding controls—that is, the classical noncoding
RNAs and 50 UTRs. As with the lincRNAs, these noncoding
Cell 154, 240–251, July 3, 2013 ª2013 Elsevier Inc. 241
B
A
Ribosome
mRNA
CSF
Ribosomeassembly
Translation
Stop5´ cap 3´
Ribosome release
40S scanning
Start AAAAAAA
5 UTR Coding region 3´ UTR
DC
0.001 0.01 0.1 1 10 100
0.0
0.2
0.4
0.6
0.8
1.0
TE−mean ribosome
Cum
ulat
ive
frequ
ency
lincRNAs
Classical ncRNA
Coding regions
3´ UTRs
5´ UTRs
Coding <100 aa
23 fold
121 fold
77 fold
0.001 0.01 0.1 1 10 100
0.0
0.2
0.4
0.6
0.8
1.0
TE−max 90-mer ribosome
24 fold
9 fold
11 fold
Cum
ulat
ive
frequ
ency
TE-max
Stat3
2.3 0.051.2 1.7 0.9 0.02
Sox2 Klf4
0.060.60.55 0.010.910.99
Ezh2
Cycloheximide
lincRNAs
Classical ncRNA
Coding regions
3´ UTRs
5´ UTRs
Coding <100 aa
40S 60S
80S
[0 – 50]
[0 – 50]
[0 – 50]
[0 – 50]
[0 – 50]
[0 – 50]
[0 – 100]
[0 – 100]
[0 – 100]
[0 – 100]
[0 – 100]
[0 – 100]
[–50, 50] [–50 ,50][–50, 50][–50, 50]
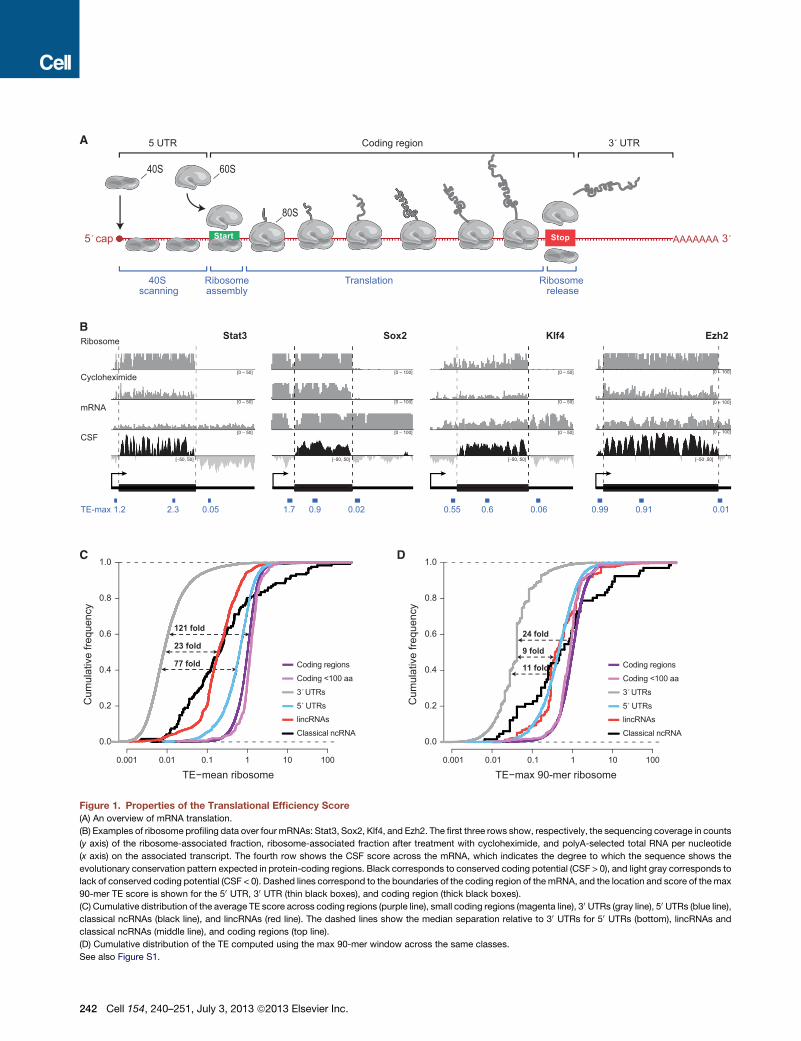
Figure 1. Properties of the Translational Efficiency Score
(A) An overview of mRNA translation.
(B) Examples of ribosome profiling data over four mRNAs: Stat3, Sox2, Klf4, and Ezh2. The first three rows show, respectively, the sequencing coverage in counts
(y axis) of the ribosome-associated fraction, ribosome-associated fraction after treatment with cycloheximide, and polyA-selected total RNA per nucleotide
(x axis) on the associated transcript. The fourth row shows the CSF score across the mRNA, which indicates the degree to which the sequence shows the
evolutionary conservation pattern expected in protein-coding regions. Black corresponds to conserved coding potential (CSF > 0), and light gray corresponds to
lack of conserved coding potential (CSF < 0). Dashed lines correspond to the boundaries of the coding region of the mRNA, and the location and score of themax
90-mer TE score is shown for the 50 UTR, 30 UTR (thin black boxes), and coding region (thick black boxes).
(C) Cumulative distribution of the average TE score across coding regions (purple line), small coding regions (magenta line), 30 UTRs (gray line), 50 UTRs (blue line),classical ncRNAs (black line), and lincRNAs (red line). The dashed lines show the median separation relative to 30 UTRs for 50 UTRs (bottom), lincRNAs and
classical ncRNAs (middle line), and coding regions (top line).
(D) Cumulative distribution of the TE computed using the max 90-mer window across the same classes.
See also Figure S1.
242 Cell 154, 240–251, July 3, 2013 ª2013 Elsevier Inc.
A
B Terc C
0010111.00.0001
0.001
0.01
0.1
1
10
100
1000
Gas5
RNase P
Neat1
snoRNA a24Tercmir291−295
Neat2/Malat1
Miat
Vault RNA U11 snRNAM
axim
um 9
0-m
er tr
ansl
atio
nal e
ffici
ency
RNA level
95%
5%
25%
75%
Frequency
Mrps33
35 aa
Ost4
38 aa
RNase P
[0 – 500]
[0 – 500]
[0 – 500]
[–50.000 – 50]
Ribosome
mRNA
CSF
18
Cycloheximide[0 – 500]
[0 – 500]
[0 – 500]
[–50.000 – 50]
[0 – 200]
[0 – 200]
[0 – 200]
[–50.000 – 50]
[0 – 250]
[0 – 250]
[0 – 250]
[–50.000 – 50]
69.047.084xam-ET
lincRNAsClassical ncRNAs
Coding regions3´ UTRs5´ UTRs
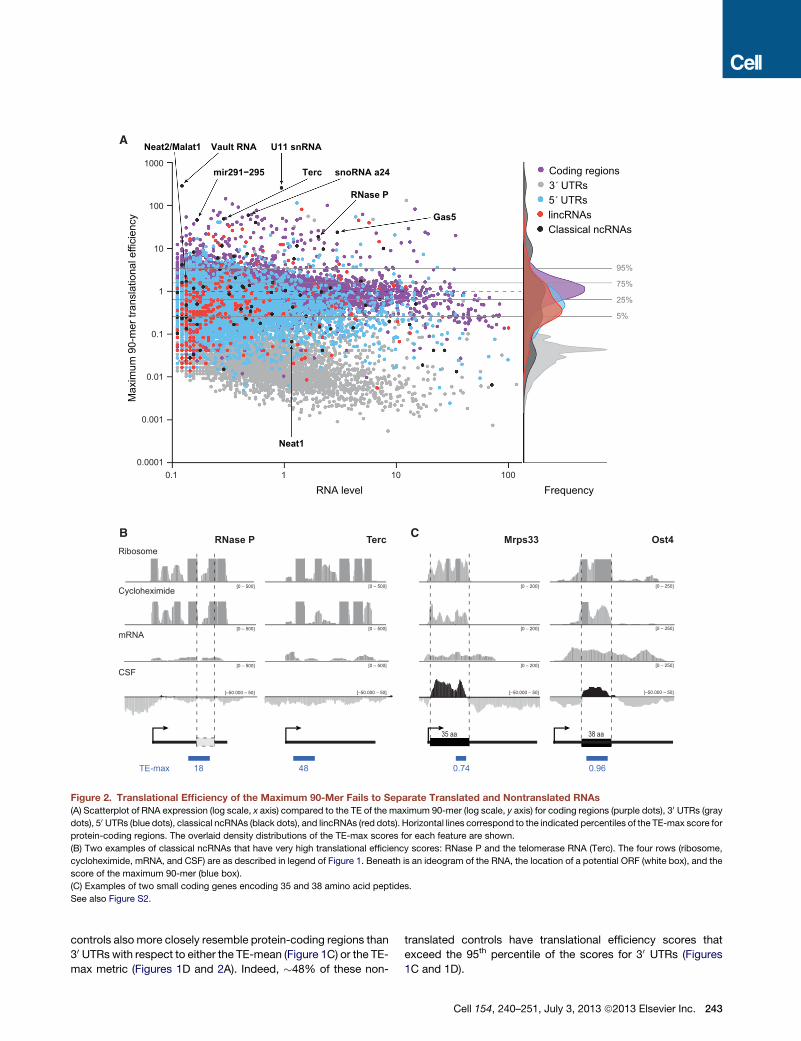
Figure 2. Translational Efficiency of the Maximum 90-Mer Fails to Separate Translated and Nontranslated RNAs
(A) Scatterplot of RNA expression (log scale, x axis) compared to the TE of the maximum 90-mer (log scale, y axis) for coding regions (purple dots), 30 UTRs (graydots), 50 UTRs (blue dots), classical ncRNAs (black dots), and lincRNAs (red dots). Horizontal lines correspond to the indicated percentiles of the TE-max score for
protein-coding regions. The overlaid density distributions of the TE-max scores for each feature are shown.
(B) Two examples of classical ncRNAs that have very high translational efficiency scores: RNase P and the telomerase RNA (Terc). The four rows (ribosome,
cycloheximide, mRNA, and CSF) are as described in legend of Figure 1. Beneath is an ideogram of the RNA, the location of a potential ORF (white box), and the
score of the maximum 90-mer (blue box).
(C) Examples of two small coding genes encoding 35 and 38 amino acid peptides.
See also Figure S2.
controls also more closely resemble protein-coding regions than
30 UTRs with respect to either the TE-mean (Figure 1C) or the TE-
max metric (Figures 1D and 2A). Indeed, �48% of these non-
translated controls have translational efficiency scores that
exceed the 95th percentile of the scores for 30 UTRs (Figures
1C and 1D).
Cell 154, 240–251, July 3, 2013 ª2013 Elsevier Inc. 243
50 UTRsOne possible explanation for the high TE scores for 50 UTRs is
that it results solely from the translation of a small number of up-
stream ORFs (uORFs). To explore this possibility, we first
excluded regions within the 50 UTR that contained ORFs begin-
ning with a canonical start codon (AUG). After removing these
uORFs, we still observed a striking difference between 50 UTRsand 30 UTRs using both the TE mean and TE max (Figure S1).
We further excluded the regions surrounding all ORFs beginning
with a near-cognate start codon (CUG, GUG, or UUG), which,
together with canonical ORFs, account for roughly 75% of pro-
posed uORFs (Fritsch et al., 2012; Ingolia et al., 2011; Lee
et al., 2012). After removing these near-cognate uORFs, we still
observed a similar difference compared to 30 UTRs (Figure S1).
Although some of the observed ribosome occupancy in 50
UTRs is surely due to uORFs (a topic that we discuss elsewhere),
the results indicate that the observed ribosome occupancy
cannot be explained solely by sharply defined uORFs with
cognate or near-cognate start codons.
Classical ncRNAsWe considered the possibility that the ribosome occupancy
measure may be inflated for the classical ncRNAs because
many lack polyA tails. This is potentially relevant because the
‘‘translational efficiency’’ defined by Ingolia et al. (2011) is based
on normalization to polyA-selected mRNA levels, whereas the
‘‘ribosome-associated fraction’’ involved no polyA selection
(Ingolia et al., 2011). To control for polyA status, we generated
a control RNA sequencing (RNA-seq) expression data set that
was not polyA selected (see Experimental Procedures). Impor-
tantly, when normalizing by the non-polyA-selected RNA levels,
we observe a nearly identical result, with the lincRNAs closely
resembling the classical ncRNAs, and both being well separated
from the 30 UTRs (Figure S2). Although this consideration affects
abundance estimates for certain nonadenylated RNAs, the high
observed ribosome occupancy is not simply due to the lack of
poly-A tails on the classical ncRNAs.
Notably, some of the strongest translational efficiency scores
(>99th percentile of 30 UTRs in both polyA and non-polyA normal-
ized samples) are observed for very well-characterized ncRNAs,
including the telomerase RNA, RNase P, small nuclear RNAs,
small nucleolar RNAs, vault RNA, microRNAs (miRNAs), and
other RNAs that have been clearly demonstrated to function as
RNA molecules (Bartel, 2004; Eddy, 2001; Shippen-Lentz and
Blackburn, 1990; Stark et al., 1978) (Figures 2 and S2). This
observation raised the possibility that some background RNA
fragments, not protected by a translating 80S ribosome,
contribute to the apparent translation of these noncoding
RNAs. Indeed, such background could arise in transcripts that
are highly structured and embedded in ribonucleoprotein com-
plexes. A strategy for identifying true 80S ribosome footprints
will be presented elsewhere.
Yet, even after removing likely non-80S ribosomal background
reads, the translational efficiency score still does not distinguish
between protein-coding genes and the noncoding controls (Fig-
ure S2). Accordingly, the ‘‘translational efficiency’’ score per se
does not reliably indicate whether a class of transcripts—such
as lincRNAs—is translated into functional proteins. The fact
244 Cell 154, 240–251, July 3, 2013 ª2013 Elsevier Inc.
that the TE-max metric is not significantly better at separating
these classes than the TEmean implies that the observed results
are not due to small patches within these regions.
Ribosome Release Separates Classes of Coding andNoncoding RNAsBecause the translational efficiency score does not distinguish
between the classes of coding and noncoding RNAs, we
explored whether we could develop a metric that does distin-
guish between these classes.
We first attempted to define a metric based on translational
start sites. Specifically, we used ribosome profiling data gener-
ated after treatment with harringtonine, a drug that binds 60S
ribosomes and has been reported to block initiation (Ingolia
et al., 2011). As such data are expected to show enrichment at
sites of translation initiation, we tested whether we could distin-
guish between the annotated start codons in protein-coding
genes and randomly chosen start codons in classical noncoding
RNAs. We observed little difference in enrichment in the former
set relative to the latter set. This was true regardless of whether
we studied the maximum enrichment seen over any start codon
or the enrichment seen at the start codon of the ORF with the
highest ribosome occupancy (see Extended Experimental Pro-
cedures and Figure S2). Because enrichment in the presence of
harringtonine in this data set did not distinguish between known
protein-coding RNAs and classical noncoding RNAs, we could
not use these data to study the translational status of lincRNAs.
We next attempted to define a metric based on translational
stop sites. Because translating ribosomes are known to be
released upon encountering a stop codon (Jackson et al., 2010;
Kisselev and Buckingham, 2000), we reasoned that translation
of a discrete (nonoverlapping) ORF should be associated with a
sharp decrease in ribosome occupancy between a protein-cod-
ing region and the subsequent 30 UTR. Indeed, such a striking
pattern occurs in known protein-coding transcripts (Ingolia
et al., 2011). We thus searched for such a decrease in the other
classes of noncoding transcripts (see Figures 1B and 2C). To do
this, we defined putative coding regions within a transcript as all
regions contained within an ORF—that is, a region in any reading
frame that begins with a start codon and ends with the next in-
frame stop codon. We defined the corresponding putative 30
UTRs as a region beginning immediately downstream of the
ORFand ending at the first subsequent start codon (in any reading
frame); we truncated the putative 30 UTR at the first subsequent
start codon to allow for the possibility of polycistronic transcripts.
We defined the RRS to be the ratio between the total number of
reads that are containedwithin the putative coding region and the
total number of reads contained within the putative 30 UTR,
normalized by the respective lengths of these regions. We then
normalized by the ratio of reads in the mRNA coverage between
the two regions, which has the effect of correcting for any erro-
neous annotations of the 30 UTRs (see Experimental Procedures).
We found that the RRS does an excellent job of distinguishing
between the class of known protein-coding genes and the class
of noncoding control transcripts (Figure 3A). Themedian RRS for
the protein-coding genes is�112, meaning that ribosome occu-
pancy is �112-fold higher in the coding region preceding the
stop codon compared to the region immediately after the stop
0.001 0.01 0.1 1 10 100 1,000
0.00
10.
010.
11
1010
01,
000
10,0
00lincRNAsClassical ncRNAs
Coding regions3´ UTRs5´ UTRs
95%3´ UTRs
95%3´ UTRs
Translational efficiency
Rib
osom
e re
leas
e sc
ore
(RR
S)
A
B
TE-max ORF RRS0.01 0.1 1 10 100 1,000
0
0.2
0.4
0.6
0.8
1
51-fold
C
Max RRS0.01 0.1 1 10 100 1,000
0
0.2
0.4
0.6
0.8
1
36-fold
lincRNAsClassical ncRNAs
3´ UTRs5´ UTRs
Coding regions
lincRNAsClassical ncRNAs
3´ UTRs5´ UTRs
Coding regions
3´ UTRs
Coding regions5´ UTRs
Classical ncRNAslincRNAs
Coding regions
5´ UTR
s
Classical ncR
NA
slincR
NA
s3´ U
TRs
Cum
ulat
ive
frequ
ency
Cum
ulat
ive
frequ
ency
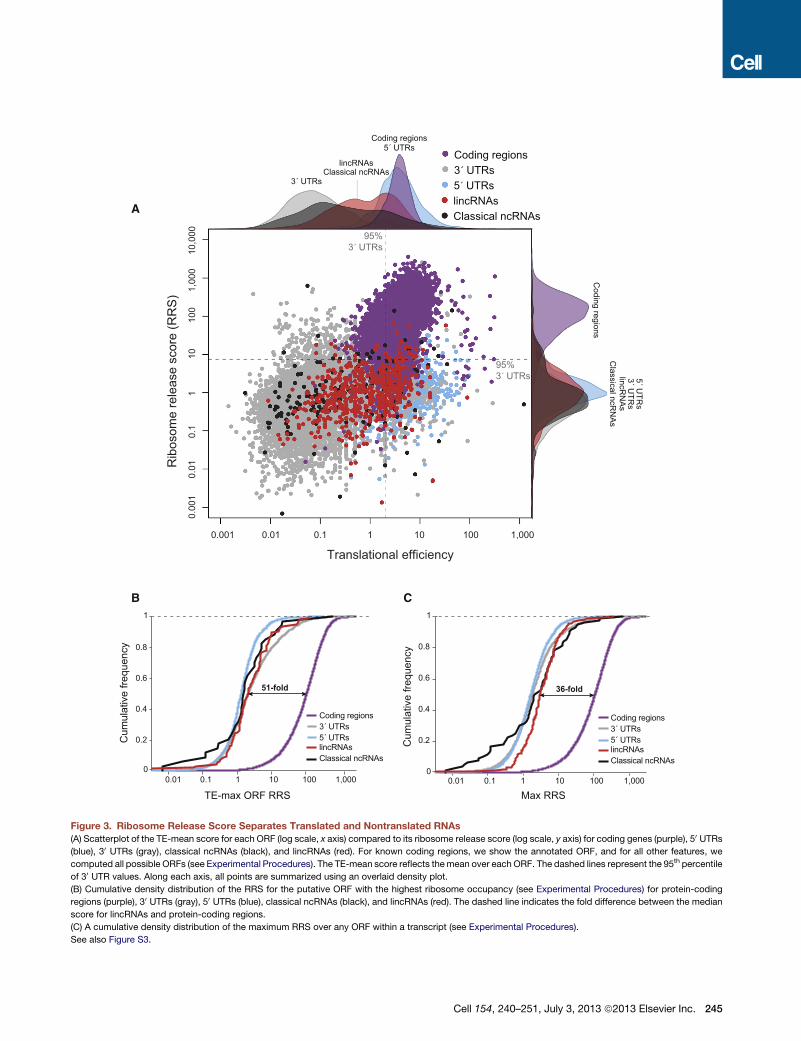
Figure 3. Ribosome Release Score Separates Translated and Nontranslated RNAs
(A) Scatterplot of the TE-mean score for each ORF (log scale, x axis) compared to its ribosome release score (log scale, y axis) for coding genes (purple), 50 UTRs(blue), 30 UTRs (gray), classical ncRNAs (black), and lincRNAs (red). For known coding regions, we show the annotated ORF, and for all other features, we
computed all possible ORFs (see Experimental Procedures). The TE-mean score reflects themean over each ORF. The dashed lines represent the 95th percentile
of 30 UTR values. Along each axis, all points are summarized using an overlaid density plot.
(B) Cumulative density distribution of the RRS for the putative ORF with the highest ribosome occupancy (see Experimental Procedures) for protein-coding
regions (purple), 30 UTRs (gray), 50 UTRs (blue), classical ncRNAs (black), and lincRNAs (red). The dashed line indicates the fold difference between the median
score for lincRNAs and protein-coding regions.
(C) A cumulative density distribution of the maximum RRS over any ORF within a transcript (see Experimental Procedures).
See also Figure S3.
Cell 154, 240–251, July 3, 2013 ª2013 Elsevier Inc. 245
codon (Figure 3A). By contrast, the RRS across all ORFs within
the classical ncRNAs, 50 UTRs, and 30 UTRs has a median of
0.81, reflecting roughly equal coverage before and after the
stop codon (Figure 3A).
We then examined the RRS for lincRNAs. Importantly, the
median RRS for lincRNAORFs is�1, which is similar to the other
noncoding regions and very different than for protein-coding re-
gions (Figures 3A and 4A–4E).
To account for the possibility that there may be a single ORF
buried within a long noncoding transcript, we repeated the
analysis by analyzing only the ORF with the highest ribosome
occupancy (as defined by the TE score). We still observed a
striking difference (�51-fold) between the class of protein-
coding regions (median RRS �112) and both the classical
ncRNAs and lincRNAs sets (median RRS 2.24 and 2.09, respec-
tively) (Figure 3B).
In addition, even when looking only at the ORFwith the highest
RRS (RRS max), we still observe a dramatic separation between
protein-coding RNAs and the noncoding RNAs, with an�36-fold
separation between themedians of coding regions and lincRNAs
(Figure 3C). Notably, this separation is larger than the 24-fold
separation observed between the medians of coding regions
and 30 UTRs using the TE-max metric (see Figure 1D).
Importantly, we note that the ability of the RRSmetric to sepa-
rate the classes of protein-coding regions and noncoding RNAs
is robust to the precise implementation of the metric. For
example, the RRS described above counts all reads overlapping
the putative coding region. This provides a robust estimate of the
ribosome occupancy and allows for the detection of tiny coding
regions, including those that are smaller than the fragments
(�30 nt) generated in the ribosome profiling assay. Indeed, the
only limitation for detection using this approach is the size of
the 30 UTR, which would have to be larger than the fragment
length generated in the ribosome profiling assay. Amore conser-
vative approachwould include only reads that are fully contained
within the putative coding region, which increases confidence in
the assignment of the ribosome reads but would prevent detec-
tion of tiny coding regions. Using this alternative implementation,
we obtain similar separations between the classes of known
protein-coding regions and all noncoding RNAs (Figure S3).
Similarly, the RRS described above used a trimmed 30 UTR to
account for possible polycistronic transcripts. If we alternatively
define the putative 30 UTR as the entire region following a stop
codon, we observe similar separations (Figure S4).
Although the RRS metric does an excellent job of distinguish-
ing between the class of protein-coding genes and the class of
noncoding RNAs, it does not provide a perfect classifier for indi-
vidual transcripts within these sets because there is overlap
between the distributions for coding and classical noncoding
transcripts (Figure 3A). The known protein-coding transcripts
with low RRS are primarily for transcripts with short 30 UTRs(less than the fragment length), where estimation of the 30 UTRcounts are less reliable. Other cases occur when the 30 UTRshave higher read coverage possibly due to ribosome read-
through, overlapping translation of antisense transcription, or
nonribosomal contamination. As such, conclusions about
coding potential of any individual transcript based on the RRS
alone should be taken with care.
246 Cell 154, 240–251, July 3, 2013 ª2013 Elsevier Inc.
Importantly, the RRS is intended as a relative metric to
compare different classes of transcripts. As such, the absolute
level of the RRS may not be informative because it will be
impacted by various features of a particular data set. Similarly,
the RRS is not intended to measure the relative proportion of
heterogeneous translation states, where some proportion of a
given transcript may be translated and the remainder nontrans-
lated; rather, it is meant to provide predominant translational
features of a class of transcripts (e.g., mRNAs are predominately
protein coding, and lincRNAs are predominantly noncoding).
Furthermore, the RRS is not designed to identify specific trans-
lated regions within a transcript containing multiple overlapping
or nearby translated regions. (We note that overlapping transla-
tion can act as a regulatory mechanism [Lu et al., 2004] or even
produce alternative functional proteins [e.g., Ink/ARF (Sharpless
and DePinho, 1999)].)
Taken together, the RRS shows strikingly different properties
than the TE score. The TE score distinguishes the class of 30
UTRs from all other RNA classes, whereas the RRS score
distinguishes protein-coding regions from all other RNA classes.
The TE score indicates that lincRNAs are bound by ribosomes
to the same extent as 50 UTRs or classical ncRNAs, whereas
the RRS indicates that lincRNAs, like 30 UTRs, 50 UTRs. andclassical ncRNAs, rarely show the known signatures of trans-
lational termination that are characteristic of protein-coding
regions.
Examination of Specific CasesTo further study the utility of the RRS, we revisited the previously
published lincRNA collections (Guttman et al., 2010, 2011). In
seven cases, transcripts that contain long ORFs (>100 amino
acids) but lacked any conservation of their ORFs had been sub-
sequently reannotated as putative protein-coding genes based
on their homology to other proteins (Pruitt et al., 2012). (These
include four RNAs associated with pluripotency [Guttman
et al., 2011].) Because these transcripts had been removed
from our lincRNA collections, they provided useful test cases
for the RRS method. Although the translational efficiency scores
for these seven transcripts resemble those for lincRNAs and
coding regions, the RRS scores clearly distinguish the seven
transcripts from lincRNAs and match those for coding regions;
this provides independent evidence that these seven transcripts
are likely to be translated. (We note that our lincRNA catalog con-
tains a handful of additional transcripts that contain long ORFs,
such as the Xist ncRNA, but show no evidence of coding poten-
tial based on evolutionary conservation or homology to known
proteins; these cases have low RRS.)
In addition to these 7 transcripts, 12 additional lincRNAs
showed high RRS but low CSF. These 12 transcripts also fail
to show other detectable signatures of translation such as
protein homology; they may also represent noise within the
RRS distribution, as a comparable proportion of the classical
ncRNA transcripts would be similarly mischaracterized
based on the RRS at this threshold (Figure 3A). This is con-
sistent with the observation above that RRS is not a perfect
classifier for individual transcripts. In contrast, methods such
as CSF demonstrate sharper discriminative power between
coding and noncoding transcripts (Guttman et al., 2009,
70 aa
linc1451 linc1281
80 aa
22.143.1
[0 – 50]
[0 – 50]
[0 – 50]
[–50,000 – 50]
0.001 0.01 0.1 1 10 100 1000−1500
−1000
−500
0
500
1000
1500
Ribosome Release Score (RRS)
Cod
on s
ubst
itutio
n fre
quen
cy (C
SF)
CSF = 50
A
uc009bio.2/transcript 1545
B C
17
ED
Small coding genes(annotated CDS)lincRNAs(all ORFs)
uc009ayt.1
uc009bio.2
uc007itn.1uc007xaz.2
uc008oeb.2
uc009lvh.1uc007itn.1
58 aa
RRS
uc009ayt.1/transcript 1544Ribosome
mRNA
CSF
Cycloheximide[0 – 247]
[0 – 94]
[0 – 50]
[–50,000 – 50]
14
[0 – 502]
[0 – 286]
[0 – 87]
[–50,000 – 50]
44 aa
RRS
Ribosome
mRNA
CSF
Cycloheximide
CSF+
CSF–
[0 – 50]
[0 – 50]
[0 – 50]
[–50,000 – 50]
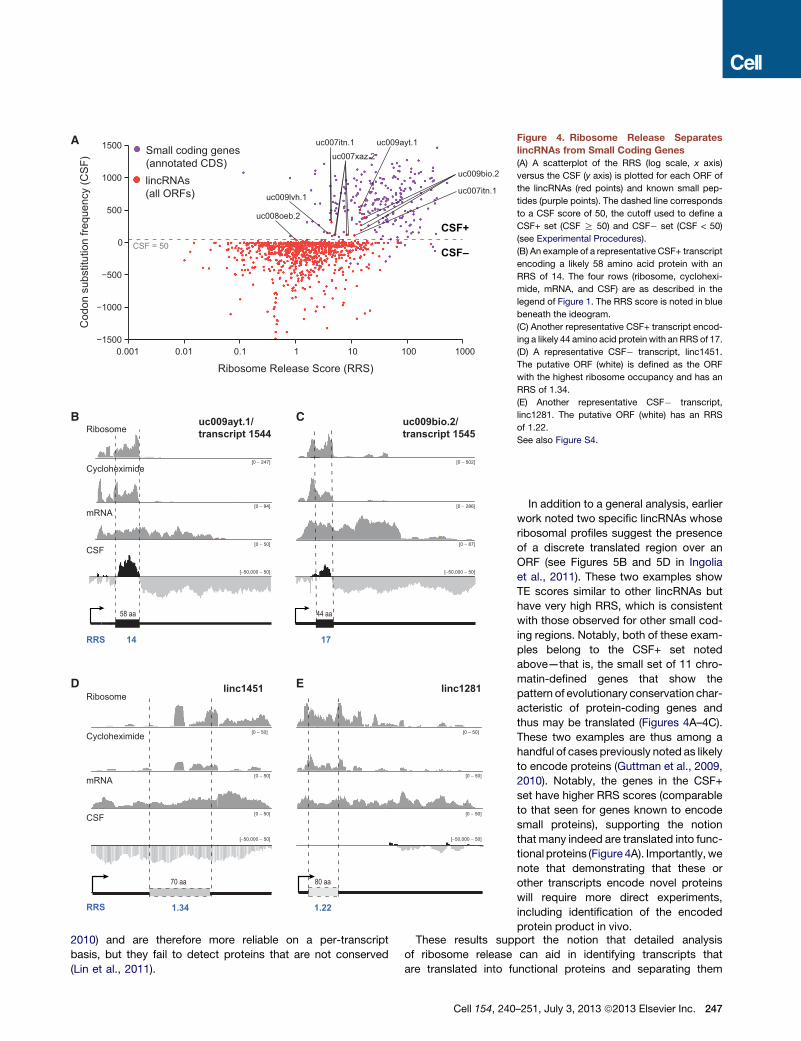
Figure 4. Ribosome Release Separates
lincRNAs from Small Coding Genes
(A) A scatterplot of the RRS (log scale, x axis)
versus the CSF (y axis) is plotted for each ORF of
the lincRNAs (red points) and known small pep-
tides (purple points). The dashed line corresponds
to a CSF score of 50, the cutoff used to define a
CSF+ set (CSF R 50) and CSF� set (CSF < 50)
(see Experimental Procedures).
(B) An example of a representative CSF+ transcript
encoding a likely 58 amino acid protein with an
RRS of 14. The four rows (ribosome, cyclohexi-
mide, mRNA, and CSF) are as described in the
legend of Figure 1. The RRS score is noted in blue
beneath the ideogram.
(C) Another representative CSF+ transcript encod-
ing a likely 44 amino acid protein with an RRS of 17.
(D) A representative CSF� transcript, linc1451.
The putative ORF (white) is defined as the ORF
with the highest ribosome occupancy and has an
RRS of 1.34.
(E) Another representative CSF� transcript,
linc1281. The putative ORF (white) has an RRS
of 1.22.
See also Figure S4.
2010) and are therefore more reliable on a per-transcript
basis, but they fail to detect proteins that are not conserved
(Lin et al., 2011).
Cell 154, 240
In addition to a general analysis, earlier
work noted two specific lincRNAs whose
ribosomal profiles suggest the presence
of a discrete translated region over an
ORF (see Figures 5B and 5D in Ingolia
et al., 2011). These two examples show
TE scores similar to other lincRNAs but
have very high RRS, which is consistent
with those observed for other small cod-
ing regions. Notably, both of these exam-
ples belong to the CSF+ set noted
above—that is, the small set of 11 chro-
matin-defined genes that show the
pattern of evolutionary conservation char-
acteristic of protein-coding genes and
thus may be translated (Figures 4A–4C).
These two examples are thus among a
handful of cases previously noted as likely
to encode proteins (Guttman et al., 2009,
2010). Notably, the genes in the CSF+
set have higher RRS scores (comparable
to that seen for genes known to encode
small proteins), supporting the notion
that many indeed are translated into func-
tional proteins (Figure 4A). Importantly,we
note that demonstrating that these or
other transcripts encode novel proteins
will require more direct experiments,
including identification of the encoded
protein product in vivo.
These results support the notion that detailed analysisof ribosome release can aid in identifying transcripts that
are translated into functional proteins and separating them
–251, July 3, 2013 ª2013 Elsevier Inc. 247
from the numerous transcripts likely to function directly as
RNAs.
DISCUSSION
The observation that lincRNAs have higher ribosome occupancy
than 30 UTRs raised questions about the biological function of
lincRNAs. Here, we show that a more complete analysis of the
ribosome profiling data argues that most do not function by
encoding small proteins. First, the ribosome occupancy
observed on lincRNAs is comparable to that seen on other
known noncoding RNAs; this implies that ribosome occupancy
per se is not a reliable indicator of whether a transcript functions
by encoding a protein. Second, the ribosomal profiling data
indicate that most lincRNAs, like other well-known noncoding
RNAs, do not show the sharp decrease in ribosome occupancy
following a stop codon that is consistently seen for known
protein-coding genes (including those encoding small proteins).
Taken together, these findings clearly demonstrate that
lincRNAs are likely to function directly as RNA molecules rather
than through encoded protein products.
If 50 UTRs, lincRNAs, and other known noncoding RNAs do not
act through encoded proteins, why do they exhibit any ribosome
occupancy at all? There are several possible explanations.
One possibility is that the fragments obtained in the ribosome
profiling experiments result from protection of RNA by nonribo-
somal RNA-protein complexes or other sources of nonribosomal
contamination. Indeed, some of the observed RNA fragments
likely do not represent true 80S ribosomal footprints in that there
are many fragments observed from classical noncoding RNAs
that are predominantly localized in the nucleus (such as telome-
rase RNA, RNase P, snRNAs, and others). Consistent with this
notion, the fragments derived fromboth cytoplasmic and nuclear
classical noncoding RNAs show a different size distribution than
that observed for protein-coding genes. In contrast, the distribu-
tions for 50 UTRs and lincRNAs resemble the distributions
observed for protein-coding genes. However, it is not possible
to determine whether individual fragments arise from the ribo-
some based solely on size, and at least some of the reads on
lincRNAs may also be nonribosomal contamination. Future
work, including the affinity purification of 80S ribosomes and
mass spectrometry of small peptides, will help address this topic
as well as provide more accurate determination of the transla-
tional status of individual transcripts.
The RRS metric is well suited to distinguish real translation
from nonribosomal contamination because it is robust to poten-
tial protection by nonribosomal proteins, as such protection
should show no bias for the presence of a stop codon. Further-
more, as the RRS involves comparing putative translated regions
within a transcript, it is robust to other potential sources of bias
that lead to higher levels of contaminating nonribosomal reads
on specific classes of RNA, such as that observed on the
classical ncRNAs.
An attractive possibility is that the presence of ribosomes on
some ncRNAs may reflect the default engagement of the trans-
lation machinery with any capped transcripts present in the
cytosol. In the absence of selective pressure for the use of a
specific start codon, ribosomes may initiate translation at
248 Cell 154, 240–251, July 3, 2013 ª2013 Elsevier Inc.
heterogeneous sites with a bias toward the beginning of the tran-
script. Additionally, ribosomes that encounter short ORFs may
be capable of reinitiating translation after encountering stop
codons. This may lead to the translation of multiple, overlapping
reading frames, biased toward the 50 end of the transcript.
Such engagement may produce 80S footprints but without the
translation of a predominant functional reading frame and
the sharp decrease in ribosome occupancy at its stop codon.
The RRS metric is well suited to distinguish this behavior
and thus provides a valuable metric to prioritize candidates
for more in-depth characterization using labor-intensive ap-
proaches such as mass spectrometry and or epitope tagging
that have been used to evaluate whether translation events
observed in ribosome profiling experiments contribute to a cell’s
proteome (Banfai et al., 2012; Slavoff et al., 2013; Stern-Ginossar
et al., 2012).
If classical ncRNAs and lincRNAs are bound by ribosomes,
even though they lack canonical features of translation, this
raises fascinating questions similar to those raised by pervasive
transcription, which occurs even in regions of the genome that
do not produce stable RNA products (Birney et al., 2007; Car-
ninci et al., 2005; Kapranov et al., 2007). Translation can have
functional implications beyond the production of a protein prod-
uct by affecting the stability, structure, and localization of an
RNA. It can also reflect noise with no direct functional role that
can be co-opted over the course of evolution in order to create
a new coding sequence. More work will be needed to determine
the biological implications of these diverse effects and their
impact on the biogenesis and functions of noncoding RNAs.
EXPERIMENTAL PROCEDURES
Filtering and Alignment of Sequencing Reads
We downloaded the data from the Gene Expression Omnibus (GEO) using
accession number GSE30839 (Ingolia et al., 2011). Fastq files were split into
two sets based on whether the libraries were generated by polyA tailing or
linker ligation. Samples generated by polyA tailing were directly aligned. For
the remaining samples, the fastq files were filtered by first clipping all reads
for the adaptor sequences using the FASTX-Toolkit version 0.013. We then
aligned all reads to the genome by using Tophat version 1.4.1, including a tran-
scriptome reference defined using our ab initio transcriptome reconstruction
of mouse ES cells (Guttman et al., 2010), along with all RefSeq- and UCSC-
defined transcripts.
We note that all analyses presented of translational efficiency and ribosome
release use the noncycloheximide-treated ribosome profiling data for consis-
tencywith the previous analysis (Ingolia et al., 2011). However, we note that the
results are comparable even when using cycloheximide-treated ribosome
profiling data.
Defining a Set of Classical Noncoding RNAs
We defined a set of classical noncoding RNAs. We first manually curated all
noncoding RNAs included in the RefSeq catalog. Specifically, we retained
ncRNAs that have been well characterized as noncoding, including snRNAs,
snoRNAs, miRNA precursors, snoRNA host genes, and large ncRNAs with
publications demonstrating a role as an RNA (such as Neat1, Neat2/Malat1,
and Gas5). We then added all small nuclear RNAs and miRNA precursors
downloaded from the functional RNA database (Kin et al., 2007). Finally, we
added a more extensive collection of literature-curated large ncRNAs, taken
from the functional RNA database (Kin et al., 2007). We mapped all RNAs to
the genome and filtered those that overlapped a known protein-coding
gene. We excluded all tiny RNAs < 50 nt because their short size (less than
the length of a sequencing read) made it difficult to estimate coverage. We
merged these different sets and collapsed all overlapping transcripts into a
single merged transcript. We excluded all translation-associated RNAs,
including tRNAs and ribosomal RNAs.
Defining a Set of lincRNAs
We started with all chromatin-defined lincRNAs with transcripts that had been
reconstructed from RNA-seq data (lincRNA V3). The lincRNA set was filtered
for all transcripts that contained a high CSF score or overlapped a known pro-
tein-coding transcript in the latest version of RefSeq (Pruitt et al., 2012), as pre-
viously described (Guttman et al., 2009, 2010). As the data set of Ingolia et al.
(2011) contains significantly lower coverage (by�5-fold) than the data used to
reconstruct the lincRNA transcripts, we sought to analyze only transcripts with
adequate coverage. Accordingly, we calculated the expression levels of each
lincRNA from the data set of Ingolia et al. (2011) and only those lincRNAs with
significant expression relative to the randomized genomic average (p < 0.01).
This yielded a set of 167 lincRNAs.
Defining ORFs
Using the orientation of each transcript, we defined all three possible frames
and identified all possible start codons. For each start codon, we then
searched for an in-frame stop codon. All regions defined by a start and stop
codon pair were defined as a putative ORF.
Excluding Upstream ORFs
To exclude the possibility that the high ribosome occupancy observed in 50
UTRs was due to the presence of upstream ORFs, we defined all ORFs based
on the presence of an AUG followed by an in-frame stop codon within the 50
UTR regions. We then created a modified transcript that contained all regions
except the putative ORFs and calculated the translational efficiency for the re-
maining regions. To exclude all possible near-cognate ORFs, we definedORFs
based on the presence of an AUG, CUG, GUG, or UUG start codon followed by
an in-frame stop codon.We then computed translational efficiency over the re-
maining regions.
Defining a CSF+ Set of Transcripts
Using the 167 lincRNA genes, we computed all possible ORFs and calculated
the CSF score for each ORF using the PhyloCSF package (Lin et al., 2011). We
utilized a PhyloCSF cutoff of 50 to generate a CSF� set (CSF < 50) and a CSF+
set (CSF > 50). We have previously shown that a CSF cutoff of 50 accurately
separates known protein-coding genes from known noncoding sequences
(Guttman et al., 2010). Using this cutoff, we identified 11 chromatin-defined
genes that exceed this cutoff (CSF+); based on their evolutionary conservation
pattern, these genes are likely to encode proteins.
Computing Translational Efficiency Score
We computed the TE score by counting the number of reads overlapping a
feature in the ribosome fraction and dividing by the number of reads in the total
RNA sample. For each feature, we counted only reads that were fully contained
within the feature (thus avoiding counting reads that overlap multiple features).
As the TE score is not a reliable estimator at low expression levels, we
computed a TE score only for those features that had significant mRNA
expression above a randomized genomic background (p < 0.01). We placed
no restrictions on the significance level for the ribosome coverage.
Defining the Maximum TE Score
We scanned a window of 90 nt across each transcript, with windows starting
and ending fully within the transcript or feature. We then calculated the TE
score, excluding windows with insufficient mRNA expression. We counted
only reads that were fully contained in each window. To account for the
difference in coverage level between ribosome and mRNA experiments, we
normalized the score by dividing by the median TE max of coding genes.
For consistency with the methods utilized previously by Ingolia et al. (2011),
we also computed the TE max by identifying the 90-mer window with the
largest number of positions covered by a ribosome read. In this case, ribo-
some reads were assigned to a nucleotide position as previously described
(Ingolia et al., 2011). Briefly, we assigned reads to positions from the 50 endof the fragment based on the following rules. For reads between (1) 29 and
30 nucleotides in length, we assigned the 15th position, (2) for reads 31–33
nucleotides in length, we assigned the 16th position, and (3) for reads between
34 and 35 nucleotides, we assigned the 17th position. We excluded all reads
with a size < 29 nucleotides and > 35 nucleotides from all calculations because
these are thought to represent nonribosomal contamination. If multiple
windows contained the same number of covered positions, we chose the
50-most window from the transcript start site as the maximum window as pre-
viously described. We then computed the TE score for this defined window
across all features. We identified comparable separations across classes
using both of these measures (Figure S2).
Computing ORFs with the Highest Ribosome Occupancy
We defined putative ORFs to be any region starting with an AUG start codon
and ending with an in-frame stop codon. We computed the TE score for
each ORF in the feature and retained the ORF with the highest TE score as
the ORF containing the highest ribosome occupancy. We similarly defined
all non-ORFs as regions that occurred between a stop codon and the next start
codon (in any frame). To score the TE max and TEmean for ORF and non-ORF
regions, we defined all ORF and non-ORFs within a transcript. We then
computed the TE max or TE mean using only the regions contained within
any of the ORF or non-ORF regions, respectively.
Generating a Non-PolyA-Selected RNA-Seq Data Set
To generate a control mRNA data set that was not limited to transcripts that
were polyadenylated, we generated a non-polyA-selected RNA-seq data set
using ribosomal depletion. We isolated RNA from wild-type mouse ES cells.
RNA was fragmented using 13 fragmentation buffer (Ambion AM8740) by
heating at 70�C for 15 min. RNA was then dephosphorylated using alkaline
phosphatase (Thermo EF0651). RNA was ligated using the partial Illumina
adaptor sequence with a 50-phosphate and 30-dideoxyC (AGATCGGAA
GAGCGTCGTGTA) using T4 RNA ligase 1 (NEB M0204). Ribosomal RNA
was depleted using 120-mer biotinylated probes complementary to the 28S,
18S, and 5.8S ribosomal RNA sequences. The hybrids were captured with
streptavidin magnetic beads (Invitrogen 650-01) and removed. The remaining
RNA was reverse transcribed using a primer complimentary to the linker
(TACACGACGCTCTTCCGAT) using AffinityScript RT (Agilent 200436) at
55�C for 45 min. The complementary DNA (cDNA) was ligated with a second
partial Illumina adaptor sequence with a 50-phosphate and 30-dideoxyC(AGATCGGAAGAGCACACGTCT) using T4 RNA ligase 1. A library was then
generated using PCR-containing primers with the entire Illumina adaptor
sequences using Phusion polymerase (NEB M0531) for 14 cycles. Libraries
were sequenced on the Illumina HiSeq using 44 base single-end reads.
Scoring Putative Start Codons Using Harringtonine Data
The four harringtonine data sets representing varying treatment times
(90 s, 120 s, 150 s, and 180 s) were analyzed separately. We defined the
enrichment over a start codon as follows. First, we defined a start codon
using the site of the AUG start codon. We then took all reads overlapping
the start codon and defined a ‘‘peak’’ as the total genomic span covered
by reads overlapping the start codon. We then counted all reads within
the peak and divided by the length of the peak. This score was then divided
by the total number of reads over the transcript divided by the length of
the transcript. This score was taken as the enrichment of harringtonine
values over a start codon compared to the rest of the transcript. For each
known coding region, we used the annotated start codon to compute the
enrichment of harringtonine overlapping the start codon. For noncoding
transcripts, we defined putative ORFs and used the AUG site of each
putative ORF as the putative start codon for analysis. We calculated the
harringtonine enrichment for noncoding transcript either by using the putative
ORF with the highest TE score or the ORF with the highest harringtonine
enrichment.
Defining the Ribosome Release Score
For each ORF, we computed the number of ribosome reads fully contained in
theORF divided by the number of ribosome reads fully contained in the 30 UTR,normalizing each count by the length of the respective region to define a pre-
liminary estimate of ribosome release strength. To account for drops in
Cell 154, 240–251, July 3, 2013 ª2013 Elsevier Inc. 249
ribosome coverage due to misannotated features or alternative termination
rather than a true stop codon, we also compute the same ratio on RNA reads.
The RNA ratio would be expected to show a similar drop in coverage under
these circumstances, but not for real stop codons. The RRS is defined as
the ratio of the two normalized ratios (ultimately eliminating the need to
normalize by region length):
RRS=
�CountCDSCount30UTR
�Ribosome�
CountCDSCount30UTR
�mRNA
As this score is normalized within a transcript, it accounts for differences in
expression levels of the transcript itself.
For known protein-coding genes, we used the annotated coding regions
and 30 UTRs to calculate the RRS. For noncoding transcripts, we computed
the RRS by first defining all possible ORFs. For each putative ORF, we defined
the 30 UTR as the region between the stop codon and the next possible start
codon (in any frame). The RRS score was defined only for ORFs with a signif-
icant expression level above randomized genomic background (p < 0.01). The
RRS was not defined for an ORF if there were no fully contained reads in the
ribosome fractions overlapping both the ORF and its 30 UTR. Because of
this, we also excluded all ORFs and 30 UTRs whose length was less than the
size of the sequencing read length. Finally, the RRS was not defined for non-
coding transcripts (such as telomerase RNA) that contain no ORFs. This led
to 89 lincRNAs and 79 classical ncRNAs for which the RRS was defined.
Although the RRS described above increases confidence that the ribosome
reads originate from the coding region, it prevents detection of tiny coding re-
gions, which are smaller than the read length used in the ribosome profiling
assay. Although, in theory, this is more conservative because it will miss tiny
ORFs, it is possible that these ORFs are the actual translated coding regions,
and therefore the RRS is quite low. Because of these limitations, we also
implemented an alternative version that did not require that the ribosome reads
be fully containedwithin theORF. In this case, we reasoned that any read over-
lapping the coding region would arise from a ribosome overlapping the coding
region, and we counted these as ribosome reads in the coding region. We
similarly computed the 30 UTR scores as any read overlapping the 30 UTR(excluding reads that also overlap the coding region that will artificially inflate
its estimate). Using this RRS measure, we observed comparable separations
between coding and all noncoding RNAs (Figures 3 and S3).
Importantly, we note that, even when including the entire 30 UTR rather than
truncating it by the presence of the next ORF, we obtain a comparable sepa-
ration to that observed using the truncated 30 UTRs. This demonstrates that
the RRS is a robust metric for determining translational status.
SUPPLEMENTAL INFORMATION
Supplemental Information includes four figures and can be found with this
article online at http://dx.doi.org/10.1016/j.cell.2013.06.009.
ACKNOWLEDGMENTS
We thank Manuel Garber and John Rinn for helpful discussions and thoughtful
comments on the manuscript, Moran Cabili and Jesse Engreitz for critical
reading and suggestions on the manuscript, Alex Shishkin for generating the
non-polyA-selected RNA-seq libraries, Shari Grossman for help with popula-
tion-level dN/dS calculations, and Leslie Gaffney for assistance with figures.
This work was funded by an NIH Director’s Early Independence Award
(DP5OD012190 to M.G.), NHGRI (U54HG003067 to E.S.L.), and funds from
the Broad Institute of MIT and Harvard.
Received: January 9, 2013
Revised: June 7, 2013
Accepted: June 10, 2013
Published: June 27, 2013
250 Cell 154, 240–251, July 3, 2013 ª2013 Elsevier Inc.
REFERENCES
Banfai, B., Jia, H., Khatun, J., Wood, E., Risk, B., Gundling, W.E., Jr., Kundaje,
A., Gunawardena, H.P., Yu, Y., Xie, L., et al. (2012). Long noncoding RNAs are
rarely translated in two human cell lines. Genome Res. 22, 1646–1657.
Bartel, D.P. (2004). MicroRNAs: genomics, biogenesis, mechanism, and func-
tion. Cell 116, 281–297.
Birney, E., Stamatoyannopoulos, J.A., Dutta, A., Guigo, R., Gingeras, T.R.,
Margulies, E.H., Weng, Z., Snyder, M., Dermitzakis, E.T., Thurman, R.E.,
et al.; ENCODE Project Consortium; NISC Comparative Sequencing Program;
Baylor College of Medicine Human Genome Sequencing Center; Washington
University Genome Sequencing Center; Broad Institute; Children’s Hospital
Oakland Research Institute. (2007). Identification and analysis of functional
elements in 1% of the human genome by the ENCODE pilot project. Nature
447, 799–816.
Carninci, P., Kasukawa, T., Katayama, S., Gough, J., Frith, M.C., Maeda, N.,
Oyama, R., Ravasi, T., Lenhard, B., Wells, C., et al.; FANTOM Consortium;
RIKEN Genome Exploration Research Group and Genome Science Group
(Genome Network Project Core Group). (2005). The transcriptional landscape
of the mammalian genome. Science 309, 1559–1563.
Carvunis, A.R., Rolland, T., Wapinski, I., Calderwood, M.A., Yildirim, M.A.,
Simonis, N., Charloteaux, B., Hidalgo, C.A., Barbette, J., Santhanam, B.,
et al. (2012). Proto-genes and de novo gene birth. Nature 487, 370–374.
Derrien, T., Johnson, R., Bussotti, G., Tanzer, A., Djebali, S., Tilgner, H., Guer-
nec, G., Martin, D., Merkel, A., Knowles, D.G., et al. (2012). The GENCODE v7
catalog of human long noncoding RNAs: analysis of their gene structure, evo-
lution, and expression. Genome Res. 22, 1775–1789.
Eddy, S.R. (2001). Non-coding RNA genes and the modern RNA world. Nat.
Rev. Genet. 2, 919–929.
Fritsch, C., Herrmann, A., Nothnagel, M., Szafranski, K., Huse, K., Schumann,
F., Schreiber, S., Platzer, M., Krawczak, M., Hampe, J., and Brosch, M. (2012).
Genome-wide search for novel human uORFs and N-terminal protein exten-
sions using ribosomal footprinting. Genome Res. 22, 2208–2218.
Geballe, A.P., and Morris, D.R. (1994). Initiation codons within 50-leaders of
mRNAs as regulators of translation. Trends Biochem. Sci. 19, 159–164.
Guttman, M., and Rinn, J.L. (2012). Modular regulatory principles of large non-
coding RNAs. Nature 482, 339–346.
Guttman, M., Amit, I., Garber, M., French, C., Lin, M.F., Feldser, D., Huarte, M.,
Zuk, O., Carey, B.W., Cassady, J.P., et al. (2009). Chromatin signature reveals
over a thousand highly conserved large non-coding RNAs in mammals. Nature
458, 223–227.
Guttman, M., Garber, M., Levin, J.Z., Donaghey, J., Robinson, J., Adiconis, X.,
Fan, L., Koziol, M.J., Gnirke, A., Nusbaum, C., et al. (2010). Ab initio recon-
struction of cell type-specific transcriptomes in mouse reveals the conserved
multi-exonic structure of lincRNAs. Nat. Biotechnol. 28, 503–510.
Guttman, M., Donaghey, J., Carey, B.W., Garber, M., Grenier, J.K., Munson,
G., Young, G., Lucas, A.B., Ach, R., Bruhn, L., et al. (2011). lincRNAs act in
the circuitry controlling pluripotency and differentiation. Nature 477, 295–300.
Ingolia, N.T., Ghaemmaghami, S., Newman, J.R., and Weissman, J.S. (2009).
Genome-wide analysis in vivo of translation with nucleotide resolution using
ribosome profiling. Science 324, 218–223.
Ingolia, N.T., Lareau, L.F., and Weissman, J.S. (2011). Ribosome profiling of
mouse embryonic stem cells reveals the complexity and dynamics of mamma-
lian proteomes. Cell 147, 789–802.
Jackson, R.J., Hellen, C.U., and Pestova, T.V. (2010). The mechanism of
eukaryotic translation initiation and principles of its regulation. Nat. Rev. Mol.
Cell Biol. 11, 113–127.
Kapranov, P., Cheng, J., Dike, S., Nix, D.A., Duttagupta, R., Willingham, A.T.,
Stadler, P.F., Hertel, J., Hackermuller, J., Hofacker, I.L., et al. (2007). RNA
maps reveal new RNA classes and a possible function for pervasive transcrip-
tion. Science 316, 1484–1488.
Kin, T., Yamada, K., Terai, G., Okida, H., Yoshinari, Y., Ono, Y., Kojima, A.,
Kimura, Y., Komori, T., and Asai, K. (2007). fRNAdb: a platform for mining/
annotating functional RNA candidates from non-coding RNA sequences.
Nucleic Acids Res. 35(Database issue), D145–D148.
Kisselev, L.L., and Buckingham, R.H. (2000). Translational termination comes
of age. Trends Biochem. Sci. 25, 561–566.
Lee, S., Liu, B., Lee, S., Huang, S.X., Shen, B., and Qian, S.B. (2012). Global
mapping of translation initiation sites in mammalian cells at single-nucleotide
resolution. Proc. Natl. Acad. Sci. USA 109, E2424–E2432.
Lin, M.F., Jungreis, I., and Kellis, M. (2011). PhyloCSF: a comparative geno-
mics method to distinguish protein coding and non-coding regions. Bioinfor-
matics 27, i275–i282.
Lu, P.D., Harding, H.P., and Ron, D. (2004). Translation reinitiation at alterna-
tive open reading frames regulates gene expression in an integrated stress
response. J. Cell Biol. 167, 27–33.
Ørom, U.A., Derrien, T., Beringer, M., Gumireddy, K., Gardini, A., Bussotti, G.,
Lai, F., Zytnicki, M., Notredame, C., Huang, Q., et al. (2010). Long noncoding
RNAs with enhancer-like function in human cells. Cell 143, 46–58.
Pruitt, K.D., Tatusova, T., Brown, G.R., and Maglott, D.R. (2012). NCBI Refer-
ence Sequences (RefSeq): current status, new features and genome annota-
tion policy. Nucleic Acids Res. 40(Database issue), D130–D135.
Sharpless, N.E., and DePinho, R.A. (1999). The INK4A/ARF locus and its two
gene products. Curr. Opin. Genet. Dev. 9, 22–30.
Shippen-Lentz, D., and Blackburn, E.H. (1990). Functional evidence for an
RNA template in telomerase. Science 247, 546–552.
Slavoff, S.A., Mitchell, A.J., Schwaid, A.G., Cabili, M.N., Ma, J., Levin, J.Z.,
Karger, A.D., Budnik, B.A., Rinn, J.L., and Saghatelian, A. (2013). Peptidomic
discovery of short open reading frame-encoded peptides in human cells. Nat.
Chem. Biol. 9, 59–64.
Smith, C.M., and Steitz, J.A. (1998). Classification of gas5 as a multi-small-
nucleolar-RNA (snoRNA) host gene and a member of the 50-terminal oligopyr-
imidine gene family reveals common features of snoRNA host genes. Mol. Cell.
Biol. 18, 6897–6909.
Starck, S.R., Ow, Y., Jiang, V., Tokuyama,M., Rivera, M., Qi, X., Roberts, R.W.,
and Shastri, N. (2008). A distinct translation initiation mechanism generates
cryptic peptides for immune surveillance. PLoS ONE 3, e3460.
Stark, B.C., Kole, R., Bowman, E.J., and Altman, S. (1978). Ribonuclease P: an
enzyme with an essential RNA component. Proc. Natl. Acad. Sci. USA 75,
3717–3721.
Stern-Ginossar, N., Weisburd, B., Michalski, A., Le, V.T., Hein, M.Y., Huang,
S.X., Ma, M., Shen, B., Qian, S.B., Hengel, H., et al. (2012). Decoding human
cytomegalovirus. Science 338, 1088–1093.
Ulitsky, I., Shkumatava, A., Jan, C.H., Sive, H., and Bartel, D.P. (2011).
Conserved function of lincRNAs in vertebrate embryonic development despite
rapid sequence evolution. Cell 147, 1537–1550.
Wang, K.C., and Chang, H.Y. (2011). Molecular mechanisms of long noncod-
ing RNAs. Mol. Cell 43, 904–914.
Cell 154, 240–251, July 3, 2013 ª2013 Elsevier Inc. 251

Supplemental Information
−6 −4 −2 0 2 4
0.0
0.2
0.4
0.6
0.8
1.0
log2(dN/dS)Max-TE ORF
lincRNAs
Coding regionsIntrons
B
Cum
ulat
ive
frequ
ency
Cum
ulat
ive
frequ
ency
−6 −4 −2 0 2 4
0.0
0.2
0.4
0.6
0.8
1.0
all ORFslog2(dN/dS)
A
lincRNAs
Coding regionsIntrons
C
Cum
ulat
ive
frequ
ency
TE−mean ribosome
D
Cum
ulat
ive
frequ
ency
TE−max ribosome
0.001 0.01 0.1 1 10 100
0.0
0.2
0.4
0.6
0.8
1.0
5’ UTRs (No ORF)
Coding regions
3´ UTRs
5´ UTRs
E
TE−mean ribosome
0.001 0.01 0.1 1 10 100
0.0
0.2
0.4
0.6
0.8
1.0
Cum
ulat
ive
frequ
ency
lincRNA (Non-ORF)
Coding regions
3´ UTRs
lincRNA (ORF)
TE−max ribosome
0.001 0.01 0.1 1 10 100
0.0
0.2
0.4
0.6
0.8
1.0
lincRNA (Non-ORF)
Coding regions
3´ UTRs
lincRNA (ORF)
F
Cum
ulat
ive
frequ
ency
0.001 0.01 0.1 1 10 100
0.0
0.2
0.4
0.6
0.8
1.0
5’ UTRs (No ORF)
Coding regions
3´ UTRs
5´ UTRs
5’ UTRs (No near-cognate)
Figure S1. Properties of the Translational Efficiency Score, Related to Figure 1
(A and B) lincRNAs do not show substitution patterns consistent with protein-coding regions across mice. (a) The number of non-synonymous substitutions (dN)
and the number of synonymous substitutions (dS) were computed from single nucleotide polymorphisms across 17 mouse strains (see Experimental Pro-
cedures). The cumulative density distribution of the log of the dN/dS ratio is shown for the known protein-coding regions (blue) and for all ORFs in intronic regions
(green) and lincRNAs (red). (b) The cumulative density distribution of the log of the dN/dS ratio is shown for the known protein-coding regions (blue) and for the
ORF with the maximum ribosome occupancy for intronic regions (green) and lincRNAs (red). (c-f) Ribosome occupancy on 50-UTRs and lincRNAs are not due to
the presence of open-reading-frames.
(C) The cumulative density distribution of the TE-mean across 30-UTRs (gray), coding regions (purple), 50-UTRs (light blue), 50-UTRs excluding all AUG defined
uORFs (dark blue), and 50-UTRs excluding all uORFs defined by AUG, CUG, UUG, or GUG start codons.
(D) The cumulative density distribution of the TE-max across 90 base windows for the 30-UTRs (gray), coding regions (purple), 50-UTRs (light blue), and 50-UTRsexcluding all uORFs (dark blue).
(E) The cumulative density distribution of the TE-mean across 30-UTRs (gray), coding regions (purple), lincRNA regions within an ORF (dark red), and lincRNA
regions not containing an ORF (light red).
(F) The cumulative density distribution of the TE-max across 90 basewindows for the 30-UTRs (gray), coding regions (purple), lincRNA regions within anORF (dark
red), and lincRNA regions not containing an ORF (light red).
Cell 154, 240–251, July 3, 2013 ª2013 Elsevier Inc. S1

1.0
TE−mean ribosomeNormalized by non-polyA RNA
Cum
ulat
ive
frequ
ency
0.001 0.01 0.1 1 10 100
0.0
0.2
0.4
0.6
0.8
lincRNAs
Classical ncRNA
Coding regions
3´ UTRs
5´ UTRs
0.01 0.1 1 10 100
0.0
0.2
0.4
0.6
0.8
1.0
Cum
ulat
ive
frequ
ency
lincRNAs
Classical ncRNA
Coding regions
3´ UTRs
5´ UTRs
TE−max ribosomeNormalized by non-polyA RNA
B C
0.1 1 10 100
0.0001
0.001
0.01
0.1
1
10
100
1000
Max
imum
den
sity
90-
mer
tran
slat
iona
l effi
cien
cy
Expression
95%
5%
25%
75%
lincRNAsClassical ncRNAs
Coding regions3´ UTRs5´ UTRs
Frequency
A
150s
0.1 1 10 100 1,0000
0.10.20.30.40.50.60.70.80.91
Cum
ulat
ive
Fre
quen
cy
180s
0.1 1 10 100 1,0000
0.10.20.30.40.50.60.70.80.91
Cum
ulat
ive
Fre
quen
cy
90s
0.1 1 10 100 1,0000
0.10.20.30.40.50.60.70.80.91
Cum
ulat
ive
Fre
quen
cy
lincRNAsClassical ncRNA
Coding regions3´ UTRs5´ UTRs
D
0.1 1 10 100 1,0000
0.10.20.30.40.50.60.70.80.91
Cum
ulat
ive
Fre
quen
cy
lincRNAsClassical ncRNA
Coding regions3´ UTRs5´ UTRs
Harringtonin enrichment at start codon Harringtonin enrichment at start codon Harringtonin enrichment at start codon0.1 1 10 100 1,0000
0.10.20.30.40.50.60.70.80.91
Cum
ulat
ive
Fre
quen
cy
150s
0.1 1 10 100 1,0000
0.10.20.30.40.50.60.70.80.91
Cum
ulat
ive
Fre
quen
cy
180s90s
EHarringtonin enrichment at start codon Harringtonin enrichment at start codon Harringtonin enrichment at start codon
Figure S2. Translational Efficiency of the Window with Maximum Ribosome Protected Density Fails to Separate Translated and Non-
translated RNAs, Related to Figure 2
(A) To identify regions within transcripts that may be translated, we scanned 90-mer windows and identified the window with the maximum density of unique
ribosome protected sites. For each of thesemaximumdensity windows, we computed the translational efficiency using only reads contained within the expected
ribosome protected fragment length distribution (see Experimental Procedures). The scatter plot of RNA expression (log scale, x axis) compared to the trans-
lational efficiency of the maximum density 90-mer window (TE score, log scale, y axis) for coding regions (purple dots), 30-UTRs (gray dots), 50-UTRs (blue dots),
classical ncRNAs (black dots), and lincRNAs (red dots). Horizontal lines correspond to the 5th, 25th, 50th, 75th, and 95th percentiles of the translational efficiency
score for protein-coding regions. The overlaid density distributions of the max-density TE scores for each feature class are shown.
(B andC) The translational efficiency score calculated using non-polyA selectedmRNA fails to separate coding and non-coding RNAs. (B) Cumulative distribution
of the average translational efficiency score for the untreated ribosome fractions compared to non-polyA selected mRNA across coding regions (purple line), 30-UTRs (gray line), 50-UTRs (blue line), classical ncRNAs (black line), and lincRNAs (red line). (C) Cumulative distribution of the translational efficiency computed
using the max 90-mer window across the same classes.
(D and E) Ribosome occupancy at start codons, following treatment with harringtonine, does not separate translated and non-translated RNAs. Cumulative
density distribution of the enrichment of harringtonine-treated samples at defined start codons for coding regions (purple), 30-UTRs (gray), 50-UTRs (blue),
lincRNAs (red), and classical ncRNAs (black). Different harringtonine treatment times are shown (90 s, 120 s, 150 s, and 180 s). For coding regions of protein-
coding mRNAs, the annotated start codon is used in all panels. For all other features, (D) shows the maximum peak identified over all putative ORFs in the
transcript. (E) shows enrichment at the ORF relative to the highest ribosome occupancy in untreated conditions.
S2 Cell 154, 240–251, July 3, 2013 ª2013 Elsevier Inc.
0.001 0.01 0.1 1 10 100 10000.001
0.01
0.1
1
10
100
1000
10,000
Translational efficiency
Rib
osom
e re
leas
e sc
ore
(RR
S)
95%3´ UTRs
3´ UTRs
Coding regions5´ UTRs
Classical ncRNAsIntronslincRNAs
Coding regions
5´ U
TRs
Classical ncR
NA
sIntronslincR
NA
s3
´ UTR
s
95%3´ UTRs
A
27 fold
TE-max ORF RRS
55 fold
0.01 0.1 1 10 100 1000
IntronsClassical ncRNAs
Coding regions3´ UTRs5´ UTRs
lincRNAsClassical ncRNAs
3´ UTRs5´ UTRsIntrons
Coding regions
B
Cum
ulat
ive
frequ
ency
0.0
0.2
0.4
0.6
0.8
1.0
Max RRS0.01 0.1 1 10 100 1000
lincRNAsClassical ncRNAs
3´ UTRs5´ UTRsIntrons
Coding regions
C
Cum
ulat
ive
frequ
ency
0.0
0.2
0.4
0.6
0.8
1.0
lincRNAs
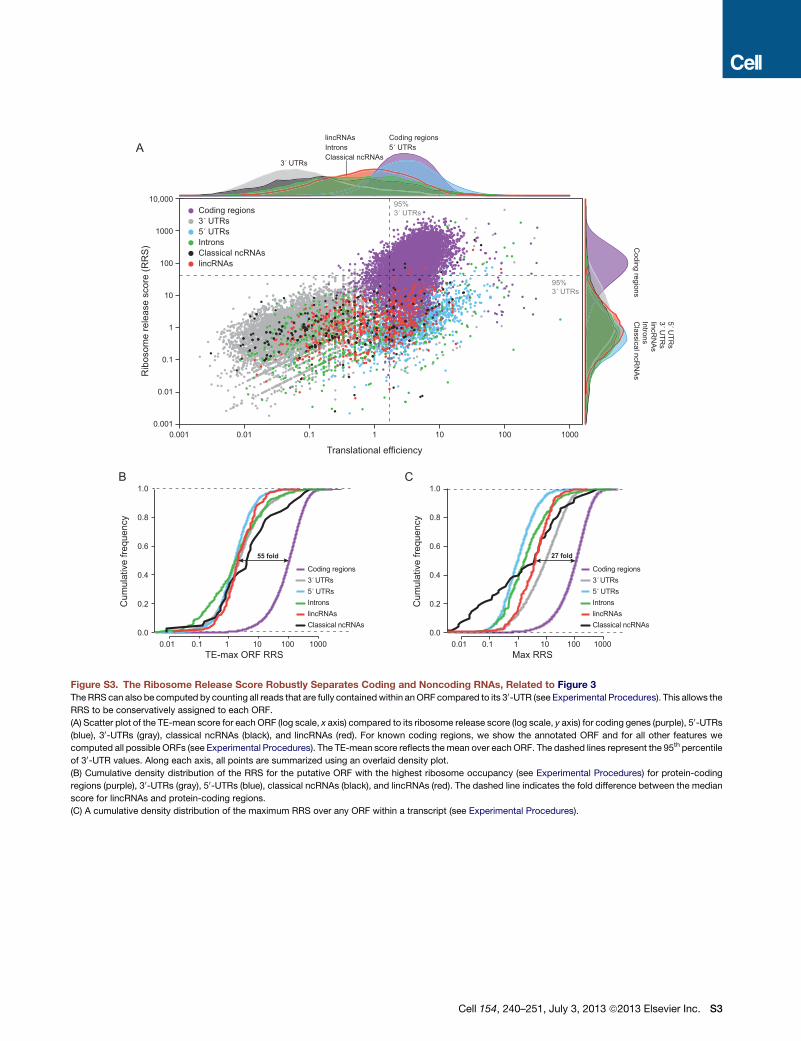
Figure S3. The Ribosome Release Score Robustly Separates Coding and Noncoding RNAs, Related to Figure 3
TheRRS can also be computed by counting all reads that are fully containedwithin anORF compared to its 30-UTR (see Experimental Procedures). This allows the
RRS to be conservatively assigned to each ORF.
(A) Scatter plot of the TE-mean score for each ORF (log scale, x axis) compared to its ribosome release score (log scale, y axis) for coding genes (purple), 50-UTRs(blue), 30-UTRs (gray), classical ncRNAs (black), and lincRNAs (red). For known coding regions, we show the annotated ORF and for all other features we
computed all possible ORFs (see Experimental Procedures). The TE-mean score reflects themean over each ORF. The dashed lines represent the 95th percentile
of 30-UTR values. Along each axis, all points are summarized using an overlaid density plot.
(B) Cumulative density distribution of the RRS for the putative ORF with the highest ribosome occupancy (see Experimental Procedures) for protein-coding
regions (purple), 30-UTRs (gray), 50-UTRs (blue), classical ncRNAs (black), and lincRNAs (red). The dashed line indicates the fold difference between the median
score for lincRNAs and protein-coding regions.
(C) A cumulative density distribution of the maximum RRS over any ORF within a transcript (see Experimental Procedures).
Cell 154, 240–251, July 3, 2013 ª2013 Elsevier Inc. S3
0.01 0.1 1 10 100 1,0000
0.2
0.4
0.6
0.8
1
Ribosome Release Score
Cum
ulat
ive
Freq
uenc
y
Coding regions
lincRNAs (all ORFs)lincRNAs (TE-max ORF)
Small coding regions
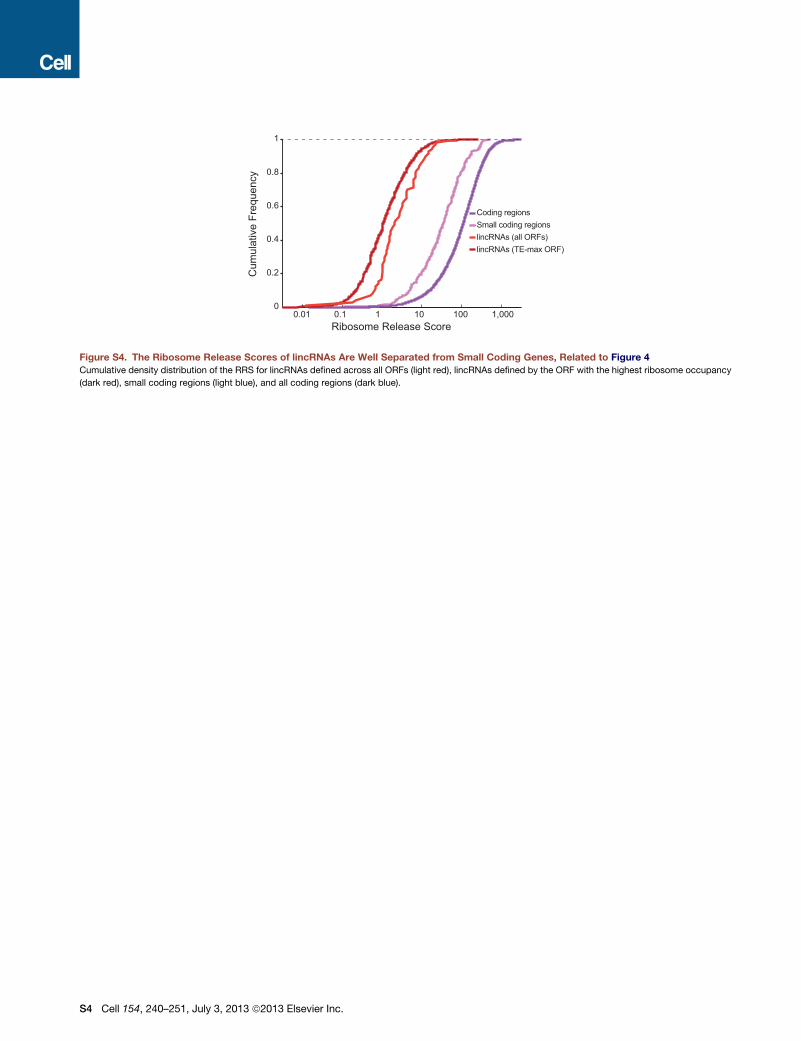
Figure S4. The Ribosome Release Scores of lincRNAs Are Well Separated from Small Coding Genes, Related to Figure 4
Cumulative density distribution of the RRS for lincRNAs defined across all ORFs (light red), lincRNAs defined by the ORF with the highest ribosome occupancy
(dark red), small coding regions (light blue), and all coding regions (dark blue).
S4 Cell 154, 240–251, July 3, 2013 ª2013 Elsevier Inc.