ri &klfdjr 3uhvv 6wdeoh 85
TRANSCRIPT

http://www.jstor.org/stable/3555284
Your use of the JSTOR archive indicates your acceptance of JSTOR's Terms and Conditions of Use, available athttp://www.jstor.org/page/info/about/policies/terms.jsp. JSTOR's Terms and Conditions of Use provides, in part, that unlessyou have obtained prior permission, you may not download an entire issue of a journal or multiple copies of articles, and youmay use content in the JSTOR archive only for your personal, non-commercial use.
Please contact the publisher regarding any further use of this work. Publisher contact information may be obtained athttp://www.jstor.org/action/showPublisher?publisherCode=ucpress.
Each copy of any part of a JSTOR transmission must contain the same copyright notice that appears on the screen or printedpage of such transmission.
JSTOR is a not-for-profit service that helps scholars, researchers, and students discover, use, and build upon a wide range ofcontent in a trusted digital archive. We use information technology and tools to increase productivity and facilitate new formsof scholarship. For more information about JSTOR, please contact [email protected].
The University of Chicago Press is collaborating with JSTOR to digitize, preserve and extend access to TheJournal of Political Economy.
http://www.jstor.org

Beyond the Median: Voter Preferences, District Heterogeneity, and Political Representation
Elisabeth R. Gerber University of Michigan
Jeffrey B. Lewis University of California, Los Angeles
Despite the centrality of the median voter prediction in political econ- omy models, overwhelming empirical evidence shows that legislators regularly take positions that diverge significantly from the preferences of the median voter in their districts. However, all these empirical studies to date lack the necessary data to directly measure the pref- erences of the median voter. We utilize a unique data set consisting of individual-level voting data that allows us to construct direct mea- sures of voter preferences. We find that legislators are most con- strained by the preferences of the median voter in homogeneous districts.
I. Introduction
Political representation concerns the relationship between citizen pref- erences and government behavior. Studies of representation seek to compare what legislators do with what the people in their districts want. Most of these studies take as their theoretical starting point some variant of the median voter model, which predicts that the logic of spatial competition will force legislators to take positions that correspond to the preferences of the median voter in their districts. Despite the the-
We thank Mo Fiorina, Scott Page, Keith Poole, Jim Snyder, and two anonymous referees for helpful comments. Gerber acknowledges the Center for Advanced Study in the Be- havioral Sciences, Stanford, Calif.
[Journal of Political Economy, 2004, vol. 112, no. 6] ? 2004 by The University of Chicago. All rights reserved. 0022-3808/2004/11206-0001$10.00
1364

BEYOND THE MEDIAN 1365
oretical robustness of the median voter prediction, however, overwhelm- ing empirical evidence indicates that legislators regularly take positions that diverge significantly from their districts' median.'
In this paper, we provide a more compelling test of the median voter model by constructing superior measures of voter preferences from a unique new data set. This data set consists of 2.8 million actual individ- ual-level vote returns, from which we estimate the means, medians, and variances of voters' ideological preferences within a sample of legislative districts. This fuller mapping of districts' ideological landscapes allows us to connect the policy preferences of voters within a district more accurately to the voting behavior of the legislators who represent them. As a result, we are able to estimate the conditional impact of the median voter's preference-when the median voter model does and does not hold-on legislator behavior. We also speak directly to the issue of dis- trict heterogeneity by considering how diverse electoral constituencies affect the quality of political representation.
The paper is organized as follows. In Section II, we briefly review the literature on political representation. In Sections III and IV, we describe our measures of voter preferences and legislator behavior, respectively. In Section V, we present and discuss the results of regression analyses of legislator roll call voting. We conclude in Section VI by discussing the implications of our findings for our understanding of political representation.
II. Models of Political Representation The typical theoretical framework underlying analyses of political rep- resentation is a spatial voting model in which citizens' preferences are indexed by their ideal points, usually along a single policy dimension.2 A mapping is then posited between this set of ideal points and each legislator's roll call votes or other behavior. The object of this mapping is essentially to identify weights to apply to each citizen's ideal point in the determination of each legislator's votes. Perhaps the most widely employed theoretical mapping derives from the median voter theorem, which assigns all of the weight to the voter with the median ideal point (Hotelling 1929; Downs 1957; Black 1958; Enelow and Hinich 1984).
Despite the strong and robust theoretical predictions of the median
'In the theoretical literature, legislators respond to the district's median voter. To the extent that election day turnout is biased toward certain social groups, the median voter's preference may diverge substantially from the median citizen's preference. Empirical studies may employ proxies of either citizen or voter preferences, depending on data availability and the nature of the specific question at hand.
2 Extending the policy space to multiple dimensions significantly complicates the basic underlying spatial model. See Schofield (1978), McKelvey (1979), and many others on majority voting in multidimensional space.

1366 JOURNAL OF POLITICAL ECONOMY
voter model, overwhelming empirical evidence shows that legislators regularly take positions that diverge significantly from their districts' median (see Stratmann [1995] for a review). In response to this evi- dence, scholars have developed a body of alternative theoretical models that suggest that weight be applied to voters at nonmedian positions (Hinich 1977); to legislators' own ideal points (Wittman 1977; Calvert 1985; Alesina and Rosenthal 1996); to the ideal points of campaign contributors (Stratmann 1995); to members of their parties and so- called reelection constituencies (Fiorina 1974; Aldrich 1983; Peltzman 1984); to legislative leaders (Rohde 1991; Cox and McCubbins 1993; Aldrich 1995); or to voters in other districts (Austen-Smith and Banks 1988; Snyder 1994). See Goff and Grier (1993) and Bender and Lott (1996) for recent reviews of this literature.
While the theoretical literature suggests a large number of potential weightings, relatively few of them have been subjected to extensive em- pirical scrutiny because of a lack of data necessary to construct reliable measures of potentially relevant preferences. One recent series of pa- pers, building on early works by Kau and Rubin (1979), Kalt and Zupan (1984), Peltzman (1984, 1985), and others, seek to estimate the relative importance or weighting of two sets of factors on legislator behavior- average voter (or citizen) preferences and legislator ideology-in some cases also accounting for the effects of campaign contributions (Strat- mann 1995, 1996; Borck 1996; Levitt 1996), national party preferences (Levitt 1996), or electoral competition (McArthur and Marks 1988; Bender 1991; Coates and Munger 1995). Two main approaches to es- timating voter preferences appear in this literature: either preferences are proxied as a linear combination of district-level economic and de- mographic variables, or they are measured by election returns or survey data, aggregated to the district level. For the most part, these studies concur that both voter preferences and legislator ideology shape leg- islative behavior; they disagree about the relative importance and sig- nificance of these effects.
Given their approaches to estimating voter preferences described above, the extant empirical studies imply that the influence of "voter preferences" can be fully captured by a single statistic measuring mean or median voter preferences. However, this assumption is valid only if one of two very restrictive conditions holds: either the predictions of the median voter model hold perfectly and so information about other constituency characteristics is superfluous, or relevant district prefer- ences are sufficiently homogeneous that the median voter's preference is indistinguishable from other potential constraints on legislator behavior.
Rather than assuming that one of these restrictive conditions is true, we advance the debate on political representation by utilizing a unique

BEYOND THE MEDIAN 1367
new data set to construct measures of voter preferences that go beyond central tendencies and aggregate-level proxies. The data set consists of voting records for 2.8 million individual voters over a set of 13 statewide ballot propositions and four partisan candidate races. These data allow us to estimate the distribution of voter preferences, including the me- dians, means, and variances, within each of 55 legislative districts (and for subconstituency voting groups), as described below. This additional information about district preferences allows us to measure much more accurately the impact of the median voter's preference on legislator behavior and to separate the impact of these preferences from the effects of other influences, especially the influences of a legislator's party.
Our measures of voter preferences also allow us to speak directly to the issue of district heterogeneity and to consider how diverse electoral constituencies affect the quality of political representation. Ex ante, it is not obvious how district heterogeneity might affect legislator behavior. One possibility is that heterogeneity is irrelevant: legislators still con- verge to their district's median, even if many voters have policy pref- erences that diverge substantially from that position. This view is con- sistent with the stylized unidimensional, vote-maximizing spatial model that predicts convergence to the median, independent of the distri- bution of voter preferences. A second possibility is that heterogeneity allows legislators some discretion in where they position themselves. This view requires us to relax some of the spatial voting model's most re- strictive assumptions (such as complete information, consideration of policy positions only, vote maximization, etc.). A third possibility is that heterogeneity induces greater electoral competition and, hence, forces legislators to be even more responsive to their vote-maximizing median position. Our empirical analyses allow us to test these alternative hypotheses.
Our interest in district heterogeneity is not novel, and indeed, a num- ber of existing empirical studies attempt to estimate the impact of district composition on legislator behavior. Kalt and Zupan (1990) find that the residuals from a model of senators' scores on rating scales of the Amer- icans for Democratic Action (ADA) are larger (in absolute value) for senators from states with greater voter heterogeneity (measured as less consistently liberal than the national average). Goff and Grier (1993) find that differences in same-state senators' voting records can be largely explained by heterogeneity in the state's income distribution, ethnic makeup, and workforce composition. Bailey and Brady (1998) find that state population heterogeneity, as measured by an index of state socio- economic and cultural diversity, significantly affects senators' votes on trade legislation. All three of these studies conclude that ignoring the effect of heterogeneity produces misleading inferences. They imply that

1368 JOURNAL OF POLITICAL ECONOMY
the effect of voter preferences on legislator behavior is fundamentally different in heterogeneous states.
Armed with the ability to measure preference heterogeneity directly, we build on these studies, confirming some of their results and pro- ducing new insights as well. We find that the effect of the median voter's preference is quite different in homogeneous and heterogeneous dis- tricts. Regression analyses reveal that the effect of the median voter on legislator roll call voting behavior decreases as the variance in district preferences increases. In addition, we find that legislator behavior is significantly influenced by a legislator's partisan constituency, indepen- dent of the effects of district median, and that the relative impact of party increases with district preference heterogeneity. On the basis of these analyses, we conclude that district composition significantly con- ditions the relationship between a district's median voter's preference and a legislator's roll call votes: in homogeneous districts, the district median is a good predictor of legislator behavior; as districts become more heterogeneous, the effects of legislative party become relatively more important.
III. Measuring District Preferences
We study the linkages between voter preferences, district heterogeneity, and legislator behavior in Los Angeles County, California, in the early 1990s. Because of its size and diversity, Los Angeles County presents an ideal case in which to study the relationship between voters and their representatives. Los Angeles County contains 24 California Assembly districts, 14 California Senate districts, and 17 U.S. House districts. All but four of the congressional districts and three of the Senate districts are entirely contained within the county borders. The county includes inner-city, suburban, and semirural districts, as well as ethnically diverse and ethnically homogeneous districts. The legislators that Los Angeles County sent to the U.S. House of Representatives in 1992 include three of the House's 15 most liberal (Waters, Tucker, and Roybal-Allard) and two of its 15 most conservative (Royce and Drier). These representatives reflect the broad ideological range of their constituencies.
To estimate the preferences of Los Angeles County voters, we analyze data from all 2.8 million ballots cast in the county in the 1992 general election. The computer file that contains these data was generated as a by-product of the punch card ballot system used in the election. Each record contains a complete enumeration of all the vote choices made by a given voter, as well as identifying information about the legislative district in which the ballot was cast. These vote choices include races for federal, state, county, and local legislative offices. They also include

BEYOND THE MEDIAN 1369
13 statewide ballot measures and a number of local ballot measures.3 By observing the joint distribution of vote choices of all voters at the individual level, we are able to recover much more detailed information about the distribution of voter preferences in a large number of legis- lative districts than has previously been possible.
Our estimation of voter preferences relies primarily on voting data on the statewide ballot measures. The ballot measures contained on the 1992 ballot tap some of the main dimensions of political conflict in the United States (infrastructure, taxes, health care reform, and social pol- icy), as well as some questions on technical government operations. Of particular interest to public economists, at least eight of these measures directly relate to public resource allocation issues (e.g., bonds, fees, taxes, and budgets). Descriptions of the statewide propositions on the 1992 ballot are shown in table 1.
The proposition voting data are analogous to the roll call voting data commonly used to construct measures of legislator policy positions. For each voter, we have a voting record on a series of binary legislative proposals. Lewis (2001) develops a technique for estimating the mean, median, and variance of the distribution of voter preferences within each of a set of predetermined groups (e.g., electoral districts) from data on a small number of observed binary choices. We use a similar estimation procedure in this analysis. Essentially, our approach assumes a simple spatial voting model, partitions voters into groups on the basis of geography (districts) and partisan voting patterns (which we describe below), estimates parameters of subgroup (normal) voting distributions, and then estimates each district's overall distribution as a discrete mix- ture of (normal) distributions for each partisan subgroup. Because our estimation approach is novel in the political economy literature, we present summary statistics of our estimates in table 2. Details are con- tained in the Appendix.
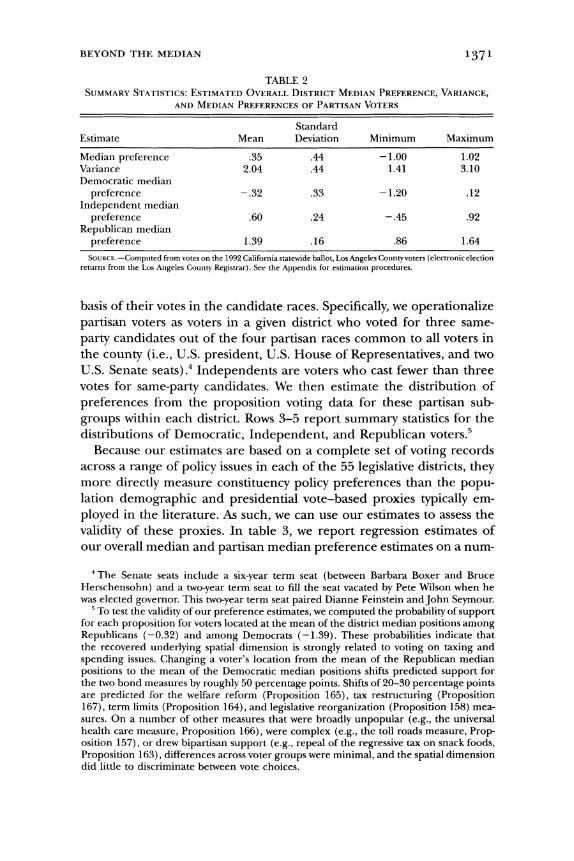
Table 2 reports summary statistics of our estimates of district com- position. The scale is normalized such that the most liberal district's mean is -1 and the most conservative district's mean is 1. The variance of preferences within districts ranges from 1.41 to 3.10. In addition, because our estimates are based on individual-level data that contain voting records on both the ballot propositions and partisan candidate races, we are able to identify members of partisan subgroups on the
' There are two types of these ballot measures: initiatives, which qualify for the ballot via citizen petition, and referendums, which are passed by the relevant legislature and are placed on the ballot automatically for voter ratification (see Waters 2003). Because Prop- osition 159 posed a question very similar to Proposition 158, we dropped it from the analysis. Votes on Propositions 158 and 159 are much more highly correlated than votes on any other proposition pair, and including both of them in our analyses results in the recovery of a policy dimension that is dominated by these two items.

TABLE 1 STATEWIDE BALLOT PROPOSITIONS, CALIFORNIA, NOVEMBER 1992
Number Title* Topic Outcome 155 1992 School Facilities Bond Act (R) $900 million bond issue to provide capital outlay for pub- P: 52%
lic schools 156 Passenger Rail and Clean Air Bond Act of 1992 (R) $1 billion bond issue for light rail F: 49% 157 Toll Roads and Highways (R) Prohibits state collection of tolls on once-private toll roads F: 29% 158 Office of California Analyst (R) Creates office, to be exempt from Proposition 140 legisla- F: 41%
tive expenditure limits 160 Property Tax Exemption (R) Exempts home of person (or spouse) who dies while on P: 52%
active military service 161 Physician-Assisted Death. Terminal Condition (I) Allows terminally ill patient to obtain medication to end F: 46%
patient's own life 162 Public Employees' Retirement Systems (I) Changes responsibilities and requirements of public em- P: 51%
ployees' retirement system boards 163 Ends Taxation of Certain Food Products (I) Exempts candy, bottled water, and snack foods from sales P: 66%
and use taxes 164 Congressional Term Limits (I) Excludes from the ballot persons who have served 6 years P: 62%
in the U.S. House or 12 years in the U.S. Senate 165 Budget Process. Welfare. Procedural and Substantive Grants governor power to reduce spending to balance F: 46%
Changes (I) budget, limits cost-of-living adjustments in specified wel- fare programs, and reduces Aid to Families with Depen- dent Children
166 Basic Health Care Coverage (I) Requires employers to provide basic health care coverage F: 32% 167 State Taxes (I) Raises top income tax rates, repeals 1991 sales tax hike, F: 42%
provides renters tax credits, and other tax provisions SouRcE. -California Secretary of State (1992a). * R refers to referendum and I to initiative.
BEYOND THE MEDIAN 1371
TABLE 2 SUMMARY STATISTICS: ESTIMATED OVERALL DISTRICT MEDIAN PREFERENCE, VARIANCE,
AND MEDIAN PREFERENCES OF PARTISAN VOTERS
Standard Estimate Mean Deviation Minimum Maximum Median preference .35 .44 -1.00 1.02 Variance 2.04 .44 1.41 3.10 Democratic median
preference -.32 .33 -1.20 .12 Independent median
preference .60 .24 -.45 .92 Republican median
preference 1.39 .16 .86 1.64 SOURCE.-Computed from votes on the 1992 California statewide ballot, Los Angeles County voters (electronic election
returns from the Los Angeles County Registrar). See the Appendix for estimation procedures.
basis of their votes in the candidate races. Specifically, we operationalize partisan voters as voters in a given district who voted for three same- party candidates out of the four partisan races common to all voters in the county (i.e., U.S. president, U.S. House of Representatives, and two U.S. Senate seats).' Independents are voters who cast fewer than three votes for same-party candidates. We then estimate the distribution of preferences from the proposition voting data for these partisan sub- groups within each district. Rows 3-5 report summary statistics for the distributions of Democratic, Independent, and Republican voters.5
Because our estimates are based on a complete set of voting records across a range of policy issues in each of the 55 legislative districts, they more directly measure constituency policy preferences than the popu- lation demographic and presidential vote-based proxies typically em- ployed in the literature. As such, we can use our estimates to assess the validity of these proxies. In table 3, we report regression estimates of our overall median and partisan median preference estimates on a num-
4 The Senate seats include a six-year term seat (between Barbara Boxer and Bruce Herschensohn) and a two-year term seat to fill the seat vacated by Pete Wilson when he was elected governor. This two-year term seat paired Dianne Feinstein andJohn Seymour.
5 To test the validity of our preference estimates, we computed the probability of support for each proposition for voters located at the mean of the district median positions among Republicans (-0.32) and among Democrats (-1.39). These probabilities indicate that the recovered underlying spatial dimension is strongly related to voting on taxing and spending issues. Changing a voter's location from the mean of the Republican median positions to the mean of the Democratic median positions shifts predicted support for the two bond measures by roughly 50 percentage points. Shifts of 20-30 percentage points are predicted for the welfare reform (Proposition 165), tax restructuring (Proposition 167), term limits (Proposition 164), and legislative reorganization (Proposition 158) mea- sures. On a number of other measures that were broadly unpopular (e.g., the universal health care measure, Proposition 166), were complex (e.g., the toll roads measure, Prop- osition 157), or drew bipartisan support (e.g., repeal of the regressive tax on snack foods, Proposition 163), differences across voter groups were minimal, and the spatial dimension did little to discriminate between vote choices.
1372 JOURNAL OF POLITICAL ECONOMY
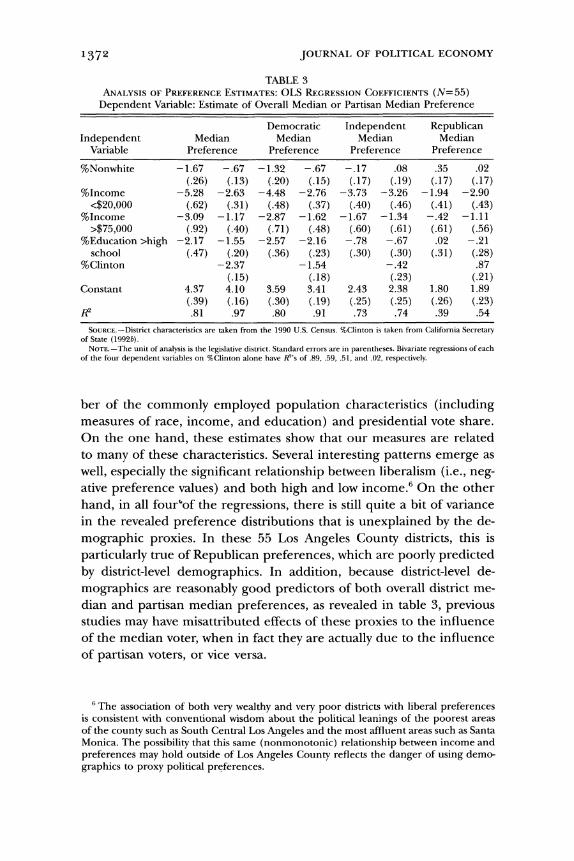
TABLE 3 ANALYSIS OF PREFERENCE ESTIMATES: OLS REGRESSION COEFFICIENTS (N=55)
Dependent Variable: Estimate of Overall Median or Partisan Median Preference
Democratic Independent Republican Independent Median Median Median Median
Variable Preference Preference Preference Preference
%Nonwhite -1.67 -.67 -1.32 -.67 -.17 .08 .35 .02 (.26) (.13) (.20) (.15) (.17) (.19) (.17) (.17)
%Income -5.28 -2.63 -4.48 -2.76 -3.73 -3.26 -1.94 -2.90 <$20,000 (.62) (.31) (.48) (.37) (.40) (.46) (.41) (.43)
%Income -3.09 -1.17 -2.87 -1.62 -1.67 -1.34 -.42 -1.11 >$75,000 (.92) (.40) (.71) (.48) (.60) (.61) (.61) (.56)
%Education >high -2.17 -1.55 -2.57 -2.16 -.78 -.67 .02 -.21 school (.47) (.20) (.36) (.23) (.30) (.30) (.31) (.28)
%Clinton -2.37 -1.54 -.42 .87 (.15) (.18) (.23) (.21)
Constant 4.37 4.10 3.59 3.41 2.43 2.38 1.80 1.89 (.39) (.16) (.30) (.19) (.25) (.25) (.26) (.23)
R2 .81 .97 .80 .91 .73 .74 .39 .54 SOURCE.--District characteristics are taken from the 1990 U.S. Census. %Clinton is taken from California Secretary
of State (1992b). NOTE.--The unit of analysis is the legislative district. Standard errors are in parentheses. Bivariate regressions of each
of the four dependent variables on %Clinton alone have R2's of .89, .59, .51, and .02, respectively.
ber of the commonly employed population characteristics (including measures of race, income, and education) and presidential vote share. On the one hand, these estimates show that our measures are related to many of these characteristics. Several interesting patterns emerge as well, especially the significant relationship between liberalism (i.e., neg- ative preference values) and both high and low income.6 On the other hand, in all four"of the regressions, there is still quite a bit of variance in the revealed preference distributions that is unexplained by the de- mographic proxies. In these 55 Los Angeles County districts, this is particularly true of Republican preferences, which are poorly predicted by district-level demographics. In addition, because district-level de- mographics are reasonably good predictors of both overall district me- dian and partisan median preferences, as revealed in table 3, previous studies may have misattributed effects of these proxies to the influence of the median voter, when in fact they are actually due to the influence of partisan voters, or vice versa.
6 The association of both very wealthy and very poor districts with liberal preferences is consistent with conventional wisdom about the political leanings of the poorest areas of the county such as South Central Los Angeles and the most affluent areas such as Santa Monica. The possibility that this same (nonmonotonic) relationship between income and preferences may hold outside of Los Angeles County reflects the danger of using demo- graphics to proxy political preferences.

BEYOND THE MEDIAN 1373 IV. Measuring Legislator Behavior
Several methods exist that allow researchers to infer legislators' policy positions from their roll call voting behavior. Most notable and com- monly used are interest group ratings such as ADA scores, NOMINATE scores (Poole and Rosenthal 1985, 1997), Heckman-Snyder scores (Heckman and Snyder 1997), and scores based on a recently developed Markov chain-Monte Carlo method (Clinton, Jackman, and Rivers 2004). A general finding of this literature is that a single left-right di- mension accounts for a very large amount of the variation in legislators' roll call voting records. For this study, we use Poole and Rosenthal's NOMINATE procedure to estimate legislators' left-right positions.
Our data consist of roll call voting data for members from three different legislative bodies (the California Assembly, California Senate, and U.S. House of Representatives). In order to make comparisons across these three chambers, we need a way of placing members from each of the chambers in the same policy space. The problem is that no roll call scaling technique (including NOMINATE) produces a scale that has any natural metric. In particular, incomparability in estimates across the three chambers can enter in three ways. First, the underlying dimension or dimensions may not be the same in each chamber. Second, the units of the NOMINATE scores may not be comparable. Third, the zero point of the scales may not be comparable. Without a way to address these problems, comparisons of NOMINATE scores generated from sep- arate sets of roll call votes (in this case, votes from different chambers) are invalid.
We construct NOMINATE scores that are comparable across legisla- tures by using information from three interest groups (the League of Conservation Voters, the Chamber of Commerce, and the AFL-CIO) that rated members of each of the three legislative bodies. These interest groups create ratings for each legislator that are calculated as the per- centage of times each legislator shared the position of the group on a roll call vote of salience to the group. Groups report the votes they use to construct their scores and the positions they took on those votes. As such, while these groups did not actually "vote" in the three chambers, they took positions on the bills considered by them. Thus we can con- struct a "voting record" for each group in each chamber. The group is said to have abstained on all roll calls that it did not factor into its rating score and to have voted "nay" or "yea" according to its stated preference on all roll calls that were used in the score. These "voting records" are then added to the records of the "real" legislators (see below), and the groups' ideal points are estimated along with those of the legislators.7
7 The AFL-CIO ratings involve 135 votes, the Chamber of Commerce ratings involve 89 votes, and the League of Conservation Voters ratings involve 99 votes.

1374 JOURNAL OF POLITICAL ECONOMY
TABLE 4 SUMMARY STATISTICS: FIRST-DIMENSION NOMINATE SCORES BY
CHAMBER
Standard Chamber Mean Median Deviation
U.S. House: All -.09 -.27 .61 California -.12 -.47 .75
California Assembly -.11 -.37 .59 California Senate -.02 -.20 .47
SouRcE.--Computed from legislator roll call votes. See the text and Poole and Rosenthal (1985, 1997) for estimation procedures.
Assuming that groups' ideal points do not vary across chambers, we can use these groups to anchor the issue space.8
We then form a large data set comprising all nonunanimous votes cast in each of the three chambers in 1993 and 1994.9 The data set includes not only those members from Los Angeles County, but all members serving in each chamber (as well as the three interest groups). Inclusion of these other members improves the efficiency of the esti- mation and allows us to compare the scores of Los Angeles's delegations to those of other members of each chamber. The NOMINATE proce- dure is then applied to this large set of data, and comparable estimates of the spatial locations of each member in each chamber are recovered. Analysis of the means, medians, and standard deviations of the first- dimension NOMINATE scores reveals high levels of consistency across chambers, with no significant differences in these statistics.'o Consistent with Poole and Rosenthal's findings for the U.S. Congress, a single dimension has great explanatory power. Conditioning voting decisions on the first-dimension NOMINATE score results in an overall classifi- cation success across all the roll calls of 89.7 percent. In comparison to a naive model, an 89.7 percent correct classification represents a 67 percent reduction in error. Adding two more dimensions to the model increases the overall classification success to nearly 91.3 percent and increases the percent reduction in error to 0.72. Table 4 reports sum- mary statistics for these scores by chamber.
V. District Composition and Legislator Behavior
We now use our estimates of legislator behavior, district median pref- erences, district heterogeneity, and partisan median preferences to test
8A similar approach is taken by Poole and Rosenthal (1997). 9 There were 6,166 such votes in the State Assembly, 1,758 such votes in the State Senate,
and 1,093 such votes in the U.S. House. "' When we test interchamber differences in NOMINATE means, F(2, 52) = 0.15, p =
0.86.

BEYOND THE MEDIAN 1375
TABLE 5 DETERMINANTS OF LEGISLATOR BEHAVIOR: OLS REGRESSION COEFFICIENTS (N= 55)
Dependent Variable: Legislator's First-Dimension NOMINATE Score
Independent Variable Model 1 Model 2 Model 3 Model 4
Median preference .87 .09 .75 .86 (.15) (.07) (.28) (.31)
Party ideology 1.12 1.07 1.22 (.06) (.06) (.19)
Median preference -.29 -.30 x variance (.12) (.12)
Partisan preference -.12 (.15)
Constant -.49 -.07 -.14 -.13 (.09) (.04) (.05) (.05)
RJ2 .37 .92 .93 .93 NOTE. -Standard errors are in parentheses. Median preference and variance are as described in table 2. Party ideology
is the median NOMINATE score of the members of a legislator's party delegation in his or her chamber. Partisan preference is Democratic median preference for Democratic legislators and is Republican median preference for Republican legislators (there are no Independent legislators in our sample).
hypotheses about the effects of voter preferences on political represen- tation. Table 5 presents the results of these analyses. Each column re- ports ordinary least squares (OLS) regression coefficients and standard errors for different model specifications." The unit of analysis in each regression is a legislative district, and the dependent variable is the legislator's first-dimension NOMINATE score.
We begin by analyzing the baseline relationship between legislator policy positions and overall district median preferences (median prefer- ence). To the extent that legislators are constrained by the median voter in their district, we hypothesize that legislators, on average, will take positions that are more liberal when their district's median is more liberal and that are more conservative when their district's median is more conservative. Because the NOMINATE scale and the voter pref- erence scale are not directly comparable, no stronger prediction than monotonicity can be made. However, if the median voter theorem is to be taken literally, then residual variation in the regression would result only from nonlinearity in the mapping from the preference scale on which the voters are located to the scale on which the legislators are located. Thus any sizable residual variation must be interpreted as ev- idence against the empirical validity of the median voter prediction. Model 1 of table 5 presents the results of this analysis.
We find a positive relationship between legislator behavior and district
" Because each of the independent variables is estimated and not measured directly, we considered an error correction model to account for this measurement error. However, with our enormous sample sizes for estimating voter preferences and party ideology, the standard errors of these estimates are minuscule, and hence the error correction model makes no difference.

1376 JOURNAL OF POLITICAL ECONOMY
median preferences, as predicted. On average, legislators in conservative districts (high median) take more conservative policy positions (high NOMINATE score), and vice versa. However, the R2 of only .37 reflects the limited explanatory power of the bare-bones median voter hypoth- esis. In model 2, however, when we add a variable measuring the effect of the legislator's party (party ideology, operationalized as the median NOMINATE score for the legislator's party delegation in his or her chamber), the R2 increases to .92 and the independent effect of the median voter's preference becomes small and insignificant.12 Because the party delegation's median is measured on the same scale as the individual legislators' positions, the magnitude of the effect of party is directly interpretable. The estimated coefficient of 1.12 suggests that Los Angeles County's legislators are somewhat more extreme, on av- erage, than their statewide or national partisan caucuses. By contrast, chamber party median accounts for 10 percentage points less variation in representatives' NOMINATE scores nationwide and statewide (i.e., 82 percent). Thus Los Angeles County legislators are somewhat more polarized and homogeneous within party than legislators statewide or nationwide.
Model 3 presents one of the main results of the paper. In this re- gression, we add an interaction between median preference and vari- ance within each district. We find that once we account for the mediating effect of district heterogeneity, the median voter's preference once again becomes positive and significant, even when we control for the effects of the legislator's party. We interpret the significant negative coefficient on the interaction to indicate that the effect of median preference decreases as heterogeneity (i.e., variance) increases. In other words, in heterogeneous districts, legislators are largely unconstrained by their overall median, and party pressures dominate legislative behavior. As variance decreases (i.e., as the district becomes more homogeneous), legislators are more constrained by the preferences of their districts' median voter.
In model 4, we further consider the impact of party on legislator behavior. Since Key (1964), political scientists have long distinguished between the dual roles of political parties as components of legislative institutions (i.e., party in the legislature) and as organizing factors in electoral politics (i.e., party in the electorate). In terms of its impact on legislator behavior, works such as Fiorina (1974), Fenno (1978), Peltz- man (1985), Goff and Grier (1993), Swain (1993), Jung, Kenny, and
12 This effect is hardly surprising, given that party dominates roll call voting in all three chambers in the 1990s. Thus the simple correlation between the party delegations' NOM- INATE scores and individual legislator NOMINATE scores is .96. Other measures of party effects such as a simple dummy variable are similarly highly correlated with the NOMINATE scores (r = .95).

BEYOND THE MEDIAN 1377
Lott (1994), Brady and Schwartz (1995), Levitt (1996), Stratmann (1996), and others emphasize the role of partisan electoral constitu- encies on legislator behavior, that is, of the party in the electorate. This view of representation posits that legislators respond to core constitu- encies, especially voters from the same party, as opposed to their dis- trictwide median voter.
Model 4 adds a measure of partisan median preferences (partisan preference) to the previous specification. This variable takes on the value of Democratic median preference for Democratic legislators and Re- publican median preference for Republican legislators (there are no Independent legislators in our sample). However, despite the theoretical expectation that legislators will respond to partisan preferences, we see that the estimated effect of partisan preferences is small and statistically insignificant. In this specification, the preferences of partisan constit- uency (i.e., party in the electorate) are swamped by the legislative cham- ber party median (i.e., party in the legislature)." However, we caution the reader against drawing a strong conclusion about the relative im- pacts of legislative and electoral party.'4 It is clear that model 4 is char- acterized by a high degree of multicollinearity, especially between the two party variables. Bivariate correlations between the independent var- iables are all extremely high, with r(partyideology, partisanpreference)
= .94. The R' resulting from a regression of either party variable on the other independent variables exceeds .97. And when partisan preference is added to model 4, the standard error on party ideology more than triples.'" It is interesting to note that despite this extreme multicollin- earity, party ideology remains significant whereas partisan preference does not. We speculate that because both legislator NOMINATE scores and party ideology are measured on the same scale and partisan pref- erence is measured on a different scale that may not be an exact affine transformation of the NOMINATE scale, some of the effect of electoral party may be picked up by the legislative party variable. Ultimately, though, because both the voters and legislators of Los Angeles County
"1 The correlation between legislative party median and partisan constituency median is .94.
'4 Our conclusion here mirrors that of Peltzman (1984), who finds that legislative party is not a statistically significant predictor of senators' ADA scores when partisan constituency preference measures are included in the regression, but cautions that "these results should not be interpreted to say that interest rather than political kinship really determines voting patterns. There is much collinearity between party affiliation and the characteristics of supporters and contributors, perhaps too much for such a conclusion to be confidently drawn" (p. 195). " In a parallel analysis that includes partisan preference but not party ideology (not reported here), the standard error on partisan preference also triples when party ideology is added to the estimation. In this case, the coefficient on partisan preference also changes from .75 to -.12.

1378 JOURNAL OF POLITICAL ECONOMY
are so highly polarized by party, it is difficult to pin down the source of the partisan effect.'"
VI. Conclusion
In summary, this paper considers the relationship between citizens and legislators, and especially how district composition affects this relation- ship. These questions are fundamental to our understanding of rep- resentation in modern American legislatures, since many districts are characterized by a high degree of preference heterogeneity. We employ a unique data set to estimate the distribution of voter preferences within legislative districts. We find that district composition affects the rela- tionship between voter preferences and legislator behavior in a number of ways. District median preference is a better predictor of legislator behavior in homogeneous districts than in heterogeneous districts. In other words, legislators take policy positions that are close to their dis- trict's median when many constituents share these preferences. In het- erogeneous districts, median preference is a much less powerful pre- dictor of legislative behavior. Legislators from heterogeneous districts often take policy positions that diverge substantially from the median voter in their district. This result is robust to a variety of model speci- fications. It suggests that our standard spatial voting models, with their predictions of convergence to the median, do not apply well to situations in which legislators represent heterogeneous districts.
We then test for the relationship between legislator behavior, median preference, partisan preference, party, and district composition. We find strong support for the hypothesis that legislators from homogeneous districts continue to represent their overall district median, with partisan pressures exerting some influence as well. Legislators from heteroge- neous districts, by contrast, are much more responsive to party pressures at the expense of the median voter in their districts.
These results have important implications for the study of political representation. If legislators from heterogeneous districts represent the interests of only a subset of their constituents, then the people who live in those districts but who are not part of the legislator's core constituency really lose out. In terms of having their preferences expressed in policy, they would be better off in different districts along with like-minded citizens and representatives. Some research has explored this question, both theoretically and empirically, in the context of racial redistricting (Lublin 1997; Epstein and O'Halloran 1999). We see our research as a
16 In previous studies using nationwide samples, the ability to separate the effects of legislative party and partisan constituency turns largely on the existence of Southern Democrats whose partisan constituency preferences diverged significantly from the pref- erences of the Democratic caucus in the U.S. House.

BEYOND THE MEDIAN 1379
generalization of the insights from that literature. In addition, our re- search has implications for the future study of political representation. To the extent that legislators fail to converge to their district's median position, standard spatial explanations offer little insight. Numerous studies, including many discussed in this paper, have considered some of the factors that lead legislators to diverge from their district's median preference (or fail to converge); however, most of these studies rely on nonspatial explanations. An important direction for future research in- volves specifying the conditions under which the standard spatial ex- planations of legislative behavior do and do not apply.
Appendix A Method for Inferring District Ideal Point Distributions from Indi- vidual-Level Proposition Voting Data
Assume that voters' decisions on each of a set of ballot propositions, j = 1, 2, ..., J, can be described by a simple spatial voting model (Enelow and Hinich 1984). In particular, let the utility that voter i = 1, 2, ..., N receives as a result of the outcome of a proposition election be
U(A,, Oi) = -(A, - 0,)2 + eiA'
where A, E (, S}}, Pj is the policy that is implemented if proposition j passes, Sj is the status quo policy that continues if proposition j fails, 0O is voter i's ideal point, and eiA is a random utility shock. Assume sincere voting in the sense that voter i votes for proposition j if U(Pj, Oi)> U(S,, O,) and against it otherwise."7 Letting
=0 if voter i votes against proposition j
I1 if voter i votes for proposition j, we can write for each i and j
Prob(V. = 1,10) = Prob(U(J, 0,) - U(S,, 0;) > 0)
SProb(-p2 + 20, + 0 + e,, + S," - 2S,0 + 0,2 _ -E s> 0)
= Prob(S2 - I' + 2(, - S,), > E,, - e,,). When each EiA is assumed to be independentlyand identically drawn from a standard normal distribution, (Eiiq - ECp) ~ N(O, N2) and
Prob(1{ = 1) = (s2 - p2 + 2(,- Sj)O
where 4) is the standard normal cumulative distribution function. Letting S2 - p2
S -2
17 Sincere voting is a weakly undominated strategy in this model.
1380 JOURNAL OF POLITICAL ECONOMY
and
2(Pi- S) \
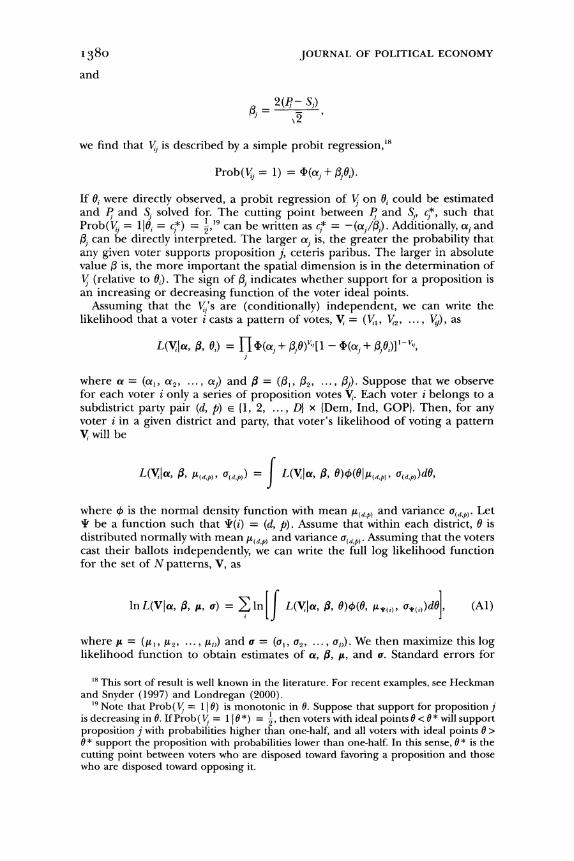
we find that Vi, is described by a simple probit regression,'8
Prob(V, = 1) = ,4I(a + ,3i0).
If 0i were directly observed, a probit regression of TV on 0, could be estimated and Pj and Sj solved for. The cutting point between 1 and S,, cj*, such that Prob(i =
1|, = e)*) = ,'" can be written as
cj =
-(aj/i3). Additionally, aj and 1, can be directly interpreted. The larger a1 is, the greater the probability that any given voter supports proposition j, ceteris paribus. The larger in absolute value 0 is, the more important the spatial dimension is in the determination of Vj (relative to 06). The sign of Oj indicates whether support for a proposition is an increasing or decreasing function of the voter ideal points.
Assuming that the V1's are (conditionally) independent, we can write the likelihood that a voter i casts a pattern of votes, Vi = (VV1, V, ..., 1'J), as
L(iila, #, 0i) = H 4(Oj
, + Vj)V"[1 -- -
(j(oj" + 3jO,)]1-V,
where a = (a,, a2, ..., a.
) and 3 = (01, ,32 ...., j). Suppose that we observe
for each voter i only a series of proposition votes Vi. Each voter i belongs to a subdistrict party pair (d, p) E {1, 2, ..., DI x IDem, Ind, GOP}. Then, for any voter i in a given district and party, that voter's likelihood of voting a pattern Vi will be
L(Va, , .(d,p) o (d,p)) = f L(Va, 13, O)4(O|pd,,p, U(dp))dO,
where 4 is the normal density function with mean (d,p) and variance •(d,p).
Let NY be a function such that I(i) = (d, p). Assume that within each district, 0 is distributed normally with mean /(d,p) and variance a(d,p). Assuming that the voters cast their ballots independently, we can write the full log likelihood function for the set of N patterns, V, as
InL(Vja, ,, , ) = Ilnrf L(YIa, [,
O)4(0, q,,,, ,,i))d0,
(Al)
where ~ = (A 1, A2. A. D ~>) and o = (ao, o2r ... •a,). We then maximize this log
likelihood function to obtain estimates of ca, 3, 1, and u. Standard errors for
18 This sort of result is well known in the literature. For recent examples, see Heckman and Snyder (1997) and Londregan (2000). " Note that Prob(V = 1 10) is monotonic in 0. Suppose that support for proposition j is decreasing in 0. If Prob(V = 1 10 *) = I, then voters with ideal points 0 < 0 * will support proposition j with probabilities higher than one-half, and all voters with ideal points 0 > 0* support the proposition with probabilities lower than one-half. In this sense, 0* is the cutting point between voters who are disposed toward favoring a proposition and those who are disposed toward opposing it.

BEYOND THE MEDIAN 1381 the estimated parameters can be obtained in the usual way. For purposes of identification, the values of one (L(d,p), U(d,p)) pair are fixed to (0, 1).20
Methods for estimating similar likelihood functions were first introduced in the psychometric literature on test taking (see Bock and Aitken 1981).2 A com- plete treatment of the exact statistical model presented here including issues of estimation and robustness and extensions can be found in Lewis (2001).
Given estimates of the mean and variance of the preference distribution of each subdistrict party pair, the mean and variance of the distribution of voters of each district and partisan constituency within each district can be found using standard formulas for the means and variances of finite mixtures of normal distributions. The median of the distribution of voters within a given district or subdistrict is found by solving
SPdp)4h(mI(dp), U(,p)) =
for m, where P(d,p) is the proportion of the voters in a given district or district partisan groups who reside in a given subdistrict, I P(d,p) = 1, and the summation runs over all the subdistrict party pairs that constitute the district.
References
Aldrich,John H. 1983. "A Downsian Spatial Model with Party Activism." American Polit. Sci. Rev. 77 (December): 974-90.
. . 1995. Why Parties? The Origin and Transformation of Political Parties in America. Chicago: Univ. Chicago Press.
Alesina, Alberto, and Howard Rosenthal. 1996. "A Theory of Divided Govern- ment." Econometrica 64 (November): 1311-41.
Austen-Smith, David, and Jeffrey Banks. 1988. "Elections, Coalitions, and Leg- islative Outcomes." American Polit. Sci. Rev. 82 Uune): 405-22.
Bailey, Michael. 2000. "A Random Effects Approach to Legislative Ideal Point Estimation." Paper presented at the annual meetings of the Midwest Political Science Assoc., Chicago (April).
Bailey, Michael, and David W. Brady. 1998. "Heterogeneity and Representation: The Senate and Free Trade." AmericanJ. Polit. Sci. 42 (April): 524-44.
Bender, Bruce. 1991. "The Influence of Ideology on Congressional Voting." Econ. Inquiry 29 (July): 416-28.
Bender, Bruce, and John R. Lott, Jr. 1996. "Legislator Voting and Shirking: A Critical Review of the Literature." Public Choice 87 (April): 67-100.
Black, Duncan. 1958. The Theory of Committees and Elections. Cambridge: Cam- bridge Univ. Press.
Bock, R. Darrell, and Murray Aitken. 1981. "Marginal Maximum Likelihood Estimation of Item Parameters: Application of an EM Algorithm." Psychometrika 46 (December): 443-59.
Borck, Rainald. 1996. "Ideology and Interest Groups." Public Choice 88 (July): 147-60.
Brady, David, and Edward P. Schwartz. 1995. "Ideology and Interests in Con-
20 Identification in factor analytic models such as the one presented here generally requires either the fixing of location and scale of the latent factor (as was done here) or the fixing of one (a', 3j) pair.
21 In political science, similar models have been considered in the context of roll call voting by Bailey (2000) and Londregan (2000).

1382 JOURNAL OF POLITICAL ECONOMY
gressional Voting: The Politics of Abortion in the U.S. Senate." Public Choice 84 (July): 25-48.
California Secretary of State. 1992a. California Ballot Pamphlet. Sacramento: Sec- retary of State.
--. 1992b. Statement of the Vote. Sacramento: Secretary of State. Calvert, Randall L. 1985. "The Value of Biased Information: A Rational Choice
Model of Political Advice." J. Politics 47 (May): 530-55. Clinton, Joshua, Simon Jackman, and Douglas Rivers. 2004. "The Statistical Anal-
ysis of Roll Call Data." American Polit. Sci. Rev. 98 (May): 355-70. Coates, Dennis, and Michael Munger. 1995. "Legislative Voting and the Eco-
nomic Theory of Politics." Southern Econ. J. 61 (January): 861-72. Cox, Gary W., and Mathew D. McCubbins. 1993. Legislative Leviathan: Party Gov-
ernment in the House. Berkeley: Univ. California Press. Downs, Anthony. 1957. An Economic Theory of Democracy. New York: Harper &
Row. Enelow, James M., and Melvin J. Hinich. 1984. The Spatial Theory of Voting: An
Introduction. Cambridge: Cambridge Univ. Press. Epstein, David, and Sharyn O'Halloran. 1999. "Measuring the Electoral and
Policy Impact of Majority-Minority Voting Districts." American J. Polit. Sci. 43 (April): 367-95.
Fenno, Richard F., Jr. 1978. Home Style: House Members in Their Districts. Boston: Little, Brown.
Fiorina, Morris P. 1974. Representatives, Roll Calls, and Constituencies. Lexington, Mass.: Heath.
Goff, Brian L., and Kevin B. Grier. 1993. "On the (Mis) Measurement of Legislator Ideology and Shirking." Public Choice 76 (June): 5-20.
Heckman, James J., and James M. Snyder, Jr. 1997. "Linear Probability Models of the Demand for Attributes with an Empirical Application to Estimating the Preferences of Legislators." RandJ. Econ. 28 (special issue): S142-S189.
Hinich, Melvin J. 1977. "Equilibrium in Spatial Voting: The Median Voter Result Is an Artifact." J. Econ. Theory 16 (December): 208-19.
Hotelling, Harold. 1929. "Stability in Competition." Econ. J. 39 (March): 41-57. Jung, Gi-Ryong, Lawrence W. Kenny, andJohn R. Lott,Jr. 1994. "An Explanation
for Why Senators from the Same State Vote Differently So Frequently."J Public Econ. 54 (May): 65-96.
Kalt, Joseph P., and Mark A. Zupan. 1984. "Capture and Ideology in the Eco- nomic Theory of Politics." A.E.R. 74 (June): 279-300.
.. 1990. "The Apparent Ideological Behavior of Legislators: Testing for Principal-Agent Slack in Political Institutions." J. Law and Econ. 33 (April): 103-31.
Kau, James B., and Paul H. Rubin. 1979. "Self-Interest, Ideology, and Logrolling in Congressional Voting." J Law and Econ. 22 (October): 365-84.
Key, V. 0. 1964. Politics, Parties, and Pressure Groups. 5th ed. New York: Crowell. Levitt, Steven D. 1996. "How Do Senators Vote? Disentangling the Role of Voter
Preferences, Party Affiliation, and Senator Ideology." A.E.R. 86 (June): 425-41. Lewis, Jeffrey B. 2001. "Estimating Voter Preference Distributions from Individ-
ual-Level Voting Data." Polit. Analysis 9 (3): 275-97. Londregan, John. 2000. "Estimating Legislators' Preferred Points." Polit. Analysis
8 (1): 25-56. Lublin, David. 1997. The Paradox of Representation: Racial Gerrymandering and Mi-
nority Interests in Congress. Princeton, N.J.: Princeton Univ. Press. McArthur, John, and Stephen V. Marks. 1988. "Constituent Interest vs. Legislator

BEYOND THE MEDIAN 1383
Ideology: The Role of Political Opportunity Cost." Econ. Inquiry 26 (July): 461- 70.
McKelvey, Richard D. 1979. "General Conditions for Global Intransitivities in Formal Voting Models." Econometrica 47 (September): 1085-1112.
Peltzman, Sam. 1984. "Constituent Interest and Congressional Voting." J. Law and Econ. 27 (April): 181-210.
-- . 1985. "An Economic Interpretation of the History of Congressional Voting in the Twentieth Century." A.E.R. 75 (September): 656-75.
Poole, Keith T., and Howard Rosenthal. 1985. "A Spatial Model for Legislative Roll Call Analysis." AmericanJ. Polit. Sci. 29 (May): 357-84.
•- . 1997. Congress: A Political-Economic History of Roll Call Voting. Oxford: Oxford Univ. Press.
Rohde, David W. 1991. Parties and Leaders in the Postreform House. Chicago: Univ. Chicago Press.
Schofield, Norman. 1978. "Instability of Simple Dynamic Games." Rev. Econ. Studies 45 (October): 575-94.
Snyder, James M., Jr. 1994. "Safe Seats, Marginal Seats, and Party Platforms: The Logic of Platform Differentiation." Econ. and Politics 6 (November): 201-13.
Stratmann, Thomas. 1995. "Campaign Contributions and Congressional Voting: Does the Timing of Contributions Matter?" Rev. Econ. Statis. 77 (February): 127-36.
-- . 1996. "How Reelection Constituencies Matter: Evidence from Political Action Committees' Contributions and Congressional Voting."J. Law andEcon. 39 (October): 603-35.
Swain, Carol M. 1993. Black Faces, Black Interests: The Representation of African Americans in Congress. Cambridge, Mass.: Harvard Univ. Press.
Waters, M. Dane. 2003. Initiative and Referendum Almanac. Durham, N.C.: Carolina Academic Press.
Wittman, Donald A. 1977. "Candidates with Policy Preferences: A Dynamic Model." J. Econ. Theory 14 (February): 180-89.