rhode island wildlife action plan · rhode island wildlife action plan chapter 2 rhode island’s...
TRANSCRIPT
Rhode Island
Wildlife
Action Plan
Chapter 2
Rhode Island’s Fish and Wildlife Habitat
CHAPTER 2: RHODE ISLAND’S FISH AND WILDLIFE HABITAT
Chapter 2 - i
Chapter 2: Table of Contents
Introduction ................................................................................................................................................. 3
Rhode Island’s Landscape ......................................................................................................................... 4
Physiography ....................................................................................................................................... 4
Geology ................................................................................................................................................. 5
Soils ...................................................................................................................................................... 8
Climate .................................................................................................................................................. 9
Ecological Regions of Rhode Island’s Landscape ................................................................................ 10
Ecological Habitat and Vegetation Systems .......................................................................................... 12
Uplands ............................................................................................................................................... 15
Early Successional Habitats ............................................................................................................. 21
Agricultural Lands ............................................................................................................................. 22
Wetlands ............................................................................................................................................. 25
Aquatic Habitat Systems .......................................................................................................................... 31
Lakes and Ponds ....................................................................................................................................... 34
Marine Habitats ......................................................................................................................................... 35
Identifying Key Habitats ........................................................................................................................... 38
Citations and Sources .............................................................................................................................. 47
CHAPTER 2: RHODE ISLAND’S FISH AND WILDLIFE HABITAT
Chapter 2 - iii
Chapter 2: List of Figures
Figure 2-1. Physiography of Rhode Island .................................................................................................... 5
Figure 2-2. Bedrock Geology Map of Rhode Island ...................................................................................... 7
Figure 2-3. Soils Map of Rhode Island .......................................................................................................... 9
Figure 2-4. TNC Ecoregions Map ............................................................................................................... 11
Figure 2-5. EPA Ecoregions for Massachusetts, Rhode Island, and Connecticut...................................... 12
Figure 2-6. Land Use/Land Cover Map of Rhode Island ............................................................................ 13
Figure 2-7. Extent of forest in Rhode Island. ............................................................................................. 17
Figure 2-8. Distribution of Forest Blocks >500 Acres ................................................................................. 19
Figure 2-9. Distribution of Non-forested Upland Habitats in Rhode Island ................................................. 21
Figure 2-10. Distribution of Farmland in Rhode Island ............................................................................... 23
Figure 2-11. Distribution of Prime and Important Farm Soils in Rhode Island ........................................... 24
Figure 2-12. Freshwater Wetland Distribution in Rhode Island .................................................................. 26
Figure 2-13. Distribution of Estuarine Wetlands in Rhode Island .............................................................. 29
Figure 2-14. Impaired Waters of Rhode Island for One of More Designated Uses .................................... 31
Figure 2-15. Distribution of Cold Water Streams in Rhode Island. ............................................................. 33
Figure 2-16. Bathymetry of Rhode Island Marine Waters ........................................................................... 35
Figure 2-17. Rhode Island’s Marine Habitats .............................................................................................. 37
Figure 2-18. Habitat Resources Identified by the Rhode Islan Resource Protection Project ..................... 39
Chapter 2: List of Tables
Table 2-1. Acreage of Forest Types in Rhode Island ................................................................................. 16
Table 2-2. Approximate Forest Area in Rhode Island from 1630 to 2011 .................................................. 18
Table 2-3. Acreage of Non-forested Upland Habitats in Rhode Island ....................................................... 20
Table 2-4. Acreage of Fresh Water Wetland Habitats in Rhode Island ...................................................... 25
Table 2-5. Primary Flowing Water Habitats in Rhode Island with Estimated Percent of Each in State ................................................................................... 32
Table 2-6. Key Habitats for SGCN in Rhode Island .................................................................................... 42
CHAPTER 2: RHODE ISLAND’S FISH AND WILDLIFE HABITAT
Chapter 2 - 3
Introduction
The distribution and abundance of Rhode Island’s wildlife is governed by the availability and quality of
habitat. Habitat is defined as the place where an animal normally lives, often characterized by a dominant
plant form or physical characteristic (e.g., stream habitat and forest habitat). The state’s varied geology,
soil types, topography, and hydrology support a range of plant communities that provide a complex
ecological framework of habitats for Rhode Island’s fish and wildlife diversity. This document uses the
term “habitat” to include ecological communities, vegetation communities, geographic features, and other
discrete entities that can be mapped that support fish or wildlife species of greatest conservation need
(SGCN). This chapter identifies Rhode Island’s Key Habitats, addressing Element 2 regarding their
relative condition and extent in the state.
Rhode Island is part of the northeastern U.S. region that extends from Maine to Virginia. A brief
overview of this region provides a context for understanding Rhode Island’s contribution to regional
biodiversity. The Northeast is more than 60% forested, with an average forest age of 60 years. It contains
more than 200,000 miles of rivers and streams, 34,000 water bodies, and more than 6 million acres of
wetlands. Eleven globally unique habitats, from sandy barrens to limestone glade, support 2,700 restricted
rare species. Habitat fragmentation is one of the greatest challenges to regional biodiversity, as the region
is crisscrossed by more than 732,000 miles of roads. The region also has the highest density of dams and
other obstacles to fish passage in the country, with an average of 7 dams and 106 road-stream crossings
per 100 miles of river (Martin and Apse 2011). Conversion to human use has also impacted much of the
northeast landscape, with one-third of forested land and one-quarter of wetlands already converted from
its natural state to other uses through human activity. Total wetland area has expanded slightly in the
Northeast over the past 20 years, although 67% of wetlands are close to roads and thus have likely
experienced some form of disruption, alteration, or species loss (Anderson et al. 2013a).
A conservation status assessment of regionally significant fish and wildlife species and habitats was
completed by The Nature Conservancy (TNC) in 2011 with support from NEAFWA (Anderson and
Olivero Sheldon 2011). TNC applied key indicators and measures for tracking wildlife status developed
by the NEAFWA Monitoring and Performance Reporting Framework and detailed in the report
“Monitoring the Conservation of Fish and Wildlife in the Northeast: A Report on the Monitoring and
Performance Reporting Framework for the Northeast Association of Fish and Wildlife Agencies”
(NEAFWA 2008) (refer to Chapter 5). The conservation status assessment reports the condition of key
habitats and species groups (e.g., bird population trends) in the region, and this information is
summarized below. http://www.rcngrants.org/sites/default/files/final_reports/Conservation-Status-of-
Fish-Wildlife-and-Natural-Habitats.pdf.
The recent geospatial condition analysis project (Anderson et al. 2013b) assesses several important
metrics of the condition of 116 terrestrial and aquatic habitats across the Northeast using the standardized
region-wide habitat mapping data of streams and terrestrial ecosystems developed through the RCN Grant
Program (Gawler 2008). The geospatial condition report is a companion to the Northeast Habitat Guides.
It presents additional information on the condition and levels of human impact on the habitats in the
region http://nature.ly/habitatguides.
CHAPTER 2: RHODE ISLAND’S FISH AND WILDLIFE HABITAT
Chapter 2 - 4
One-sixth (16%) of the region is conserved and five percent of that land is secured explicitly for nature
(GAP 1 or 2). The secured land is held by more than 6,000 fee owners and 2,000 easement holders. State
government is the largest public conservation land owner, with 12 million acres, followed by federal
government, which holds 6 million acres. Private lands held in easements account for 3 million acres and
land owned by private non-profit land trusts accounts for another 1.4 million acres. Land conversion,
however, outweighs land conserved by roughly 2:1 (28%:16%) (Anderson et al. 2013a).
Approximately 23% of the terrestrial habitats and 63% of mountain habitats are conserved in the
Northeast. A few low-elevation coastal habitats including the Central Atlantic Coastal Plain Maritime
Forest (89%) and Great Lakes Dune and Swale (69%) were also well conserved. Piedmont habitats were
the least conserved habitats in the region, especially the Southern Piedmont Mesic Forest (3%), Southern
Piedmont Dry Oak-Pine Forest (3%), Piedmont Hardpan Woodland and Forest (2%) and Southern
Piedmont Glade and Barrens (0%). Among wetlands, the Atlantic Coastal Plain Peatland Pocosin and
Canebrake (99%) and Atlantic Coastal Plain Northern Bog (72%) were habitats with a high percentage of
conserved acreage (Anderson et al. 2013a).
The geospatial analysis also provides metrics which follow the Northeast Monitoring and Performance
Reporting Framework (NEAFWA 2008). These are calculated relative to each habitat type using the
region-wide maps, which allow each habitat in the region to be evaluated across its entire range. Please
see:
https://www.conservationgateway.org/ConservationByGeography/NorthAmerica/UnitedStates/edc/Pages/
geospatial.aspx.
Rhode Island’s Landscape
From the maritime beaches of South County and Block Island, to the extensive wetland systems of the
Wood-Pawcatuck River watershed, to the rolling forests of western Rhode Island, and the farmland in
Newport County, the state’s total land area of 1,054 square miles supports a wide variety of habitats for
fish and wildlife. Western Rhode Island is largely rural, while the region surrounding Narragansett Bay is
increasingly urban. In fact, Rhode Island is the second-most densely populated state in the country and
pressure from human use can be significantly greater during the summer, especially in coastal areas.
Development pressures on the remaining natural landscape continue to rise, threatening the health of
many of the state’s ecosystems. The state has developed numerous conservation and management plans to
protect its natural resources, and this SWAP serves as a catalyst to coordinate these existing plans.
Physiography
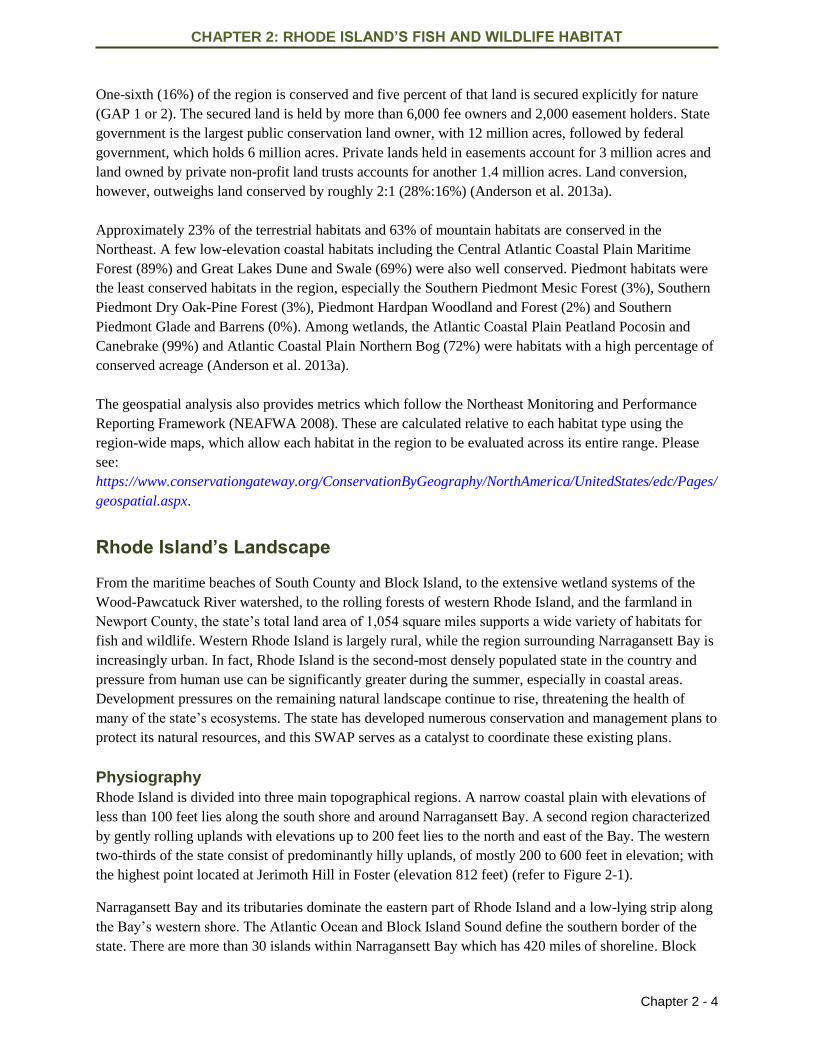
Rhode Island is divided into three main topographical regions. A narrow coastal plain with elevations of
less than 100 feet lies along the south shore and around Narragansett Bay. A second region characterized
by gently rolling uplands with elevations up to 200 feet lies to the north and east of the Bay. The western
two-thirds of the state consist of predominantly hilly uplands, of mostly 200 to 600 feet in elevation; with
the highest point located at Jerimoth Hill in Foster (elevation 812 feet) (refer to Figure 2-1).
Narragansett Bay and its tributaries dominate the eastern part of Rhode Island and a low-lying strip along
the Bay’s western shore. The Atlantic Ocean and Block Island Sound define the southern border of the
state. There are more than 30 islands within Narragansett Bay which has 420 miles of shoreline. Block
CHAPTER 2: RHODE ISLAND’S FISH AND WILDLIFE HABITAT
Chapter 2 - 5
Island is a well-known landmark 12 miles south of the Rhode Island coast and 14 miles from Montauk
Point, Long Island. RI DEM has produced an interactive, on-line Environmental Resources Map that
illustrates the state’s topography at http://www.dem.ri.gov/maps/index.htm#GV.
Figure 2-1. Physiography of Rhode Island. Source: Ray Sterner, John
Hopkins University, Applied Physics Laboratory 2014
Geology
The geologic history of Rhode Island includes two periods of mountain-building followed by extensive
periods of erosion that produced the state’s current lowland and gently rolling topography (Gibbs et al.
1995; Quinn 1997). The fault lines produced by Rhode Island’s mountain-building phases are still present
in the Narragansett Bay area and occasionally rock the state with minor earthquakes. The highest
magnitude earthquake centered within Rhode Island occurred on June 10, 1951, with an epicenter near
Slocum and a magnitude of 4.6 (Wheeler et al. 2000). More recently, a magnitude 3.5 earthquake was felt
near Newport on March 11, 1976 (Stover and Coffman 1993). Some areas of the state occasionally
CHAPTER 2: RHODE ISLAND’S FISH AND WILDLIFE HABITAT
Chapter 2 - 6
experience stronger earthquakes that are centered elsewhere in the Northeast and eastern Canada (see
Figure 2-2).
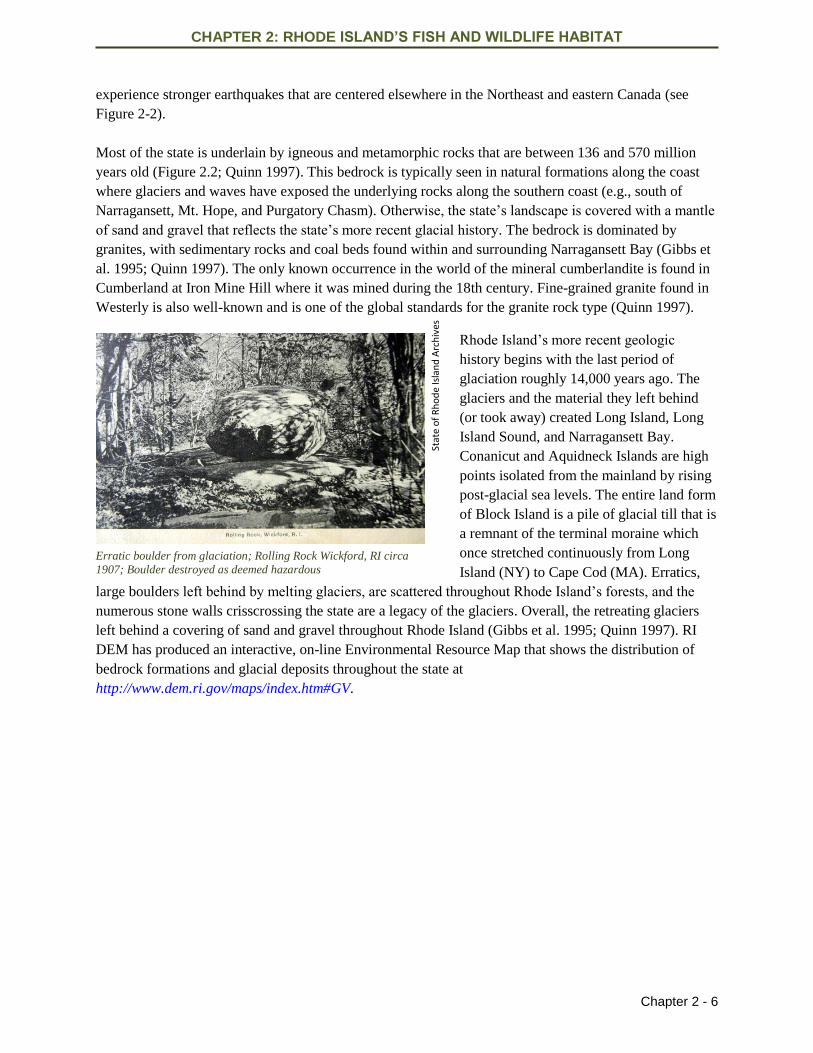
Most of the state is underlain by igneous and metamorphic rocks that are between 136 and 570 million
years old (Figure 2.2; Quinn 1997). This bedrock is typically seen in natural formations along the coast
where glaciers and waves have exposed the underlying rocks along the southern coast (e.g., south of
Narragansett, Mt. Hope, and Purgatory Chasm). Otherwise, the state’s landscape is covered with a mantle
of sand and gravel that reflects the state’s more recent glacial history. The bedrock is dominated by
granites, with sedimentary rocks and coal beds found within and surrounding Narragansett Bay (Gibbs et
al. 1995; Quinn 1997). The only known occurrence in the world of the mineral cumberlandite is found in
Cumberland at Iron Mine Hill where it was mined during the 18th century. Fine-grained granite found in
Westerly is also well-known and is one of the global standards for the granite rock type (Quinn 1997).
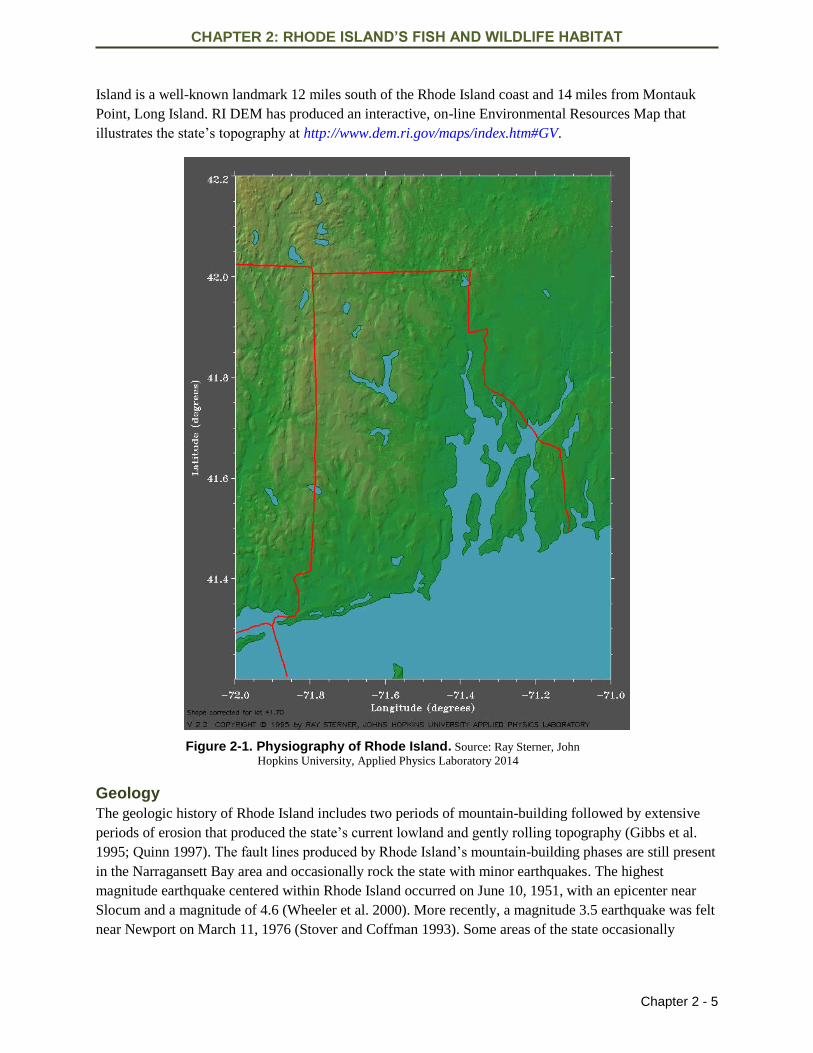
Rhode Island’s more recent geologic
history begins with the last period of
glaciation roughly 14,000 years ago. The
glaciers and the material they left behind
(or took away) created Long Island, Long
Island Sound, and Narragansett Bay.
Conanicut and Aquidneck Islands are high
points isolated from the mainland by rising
post-glacial sea levels. The entire land form
of Block Island is a pile of glacial till that is
a remnant of the terminal moraine which
once stretched continuously from Long
Island (NY) to Cape Cod (MA). Erratics,
large boulders left behind by melting glaciers, are scattered throughout Rhode Island’s forests, and the
numerous stone walls crisscrossing the state are a legacy of the glaciers. Overall, the retreating glaciers
left behind a covering of sand and gravel throughout Rhode Island (Gibbs et al. 1995; Quinn 1997). RI
DEM has produced an interactive, on-line Environmental Resource Map that shows the distribution of
bedrock formations and glacial deposits throughout the state at
http://www.dem.ri.gov/maps/index.htm#GV.
Stat
e o
f R
ho
de
Isla
nd
Arc
hiv
es
Erratic boulder from glaciation; Rolling Rock Wickford, RI circa
1907; Boulder destroyed as deemed hazardous
CHAPTER 2: RHODE ISLAND’S FISH AND WILDLIFE HABITAT
Chapter 2 - 7
Figure 2-2. Bedrock Geology Map of Rhode Island. Source: RI TNC 2014
The glacial history of Rhode Island is the predominant factor responsible for the state’s present landscape
and landforms (Gibbs et al. 1995). The Charlestown Moraine, a ridge of sand and gravel, extends inland
along the coast from Westerly to Narragansett and corresponds to similar landforms on Long Island
(Gibbs et al. 1995; Quinn 1997). Worden Pond and Great Swamp in South Kingstown are remnants of a
larger water body created behind the dam formed by the Charlestown Moraine. Other glacial features
found in Rhode Island include drumlins; streamlined hills oriented in the direction the glacier moved
CHAPTER 2: RHODE ISLAND’S FISH AND WILDLIFE HABITAT
Chapter 2 - 8
across the landscape; and eskers which are sinuous ridges of sand and gravel that formed underneath a
melting glacier. Kettle holes are depressions created when chunks of glacial ice melted to form lakes,
ponds and wetlands (Gibbs et al. 1995; Quinn 1997).
At the end of the last glacial period the climate warmed and melting ice eventually caused the sea level to
rise several hundred feet. Long Island and Block Island Sounds were originally freshwater lakes that
became sounds when flooded by marine waters. Narragansett Bay was once a series of inland river
valleys that were drowned with saltwater, forming a network of estuaries and islands (Gibbs et al. 1995;
Quinn 1997).
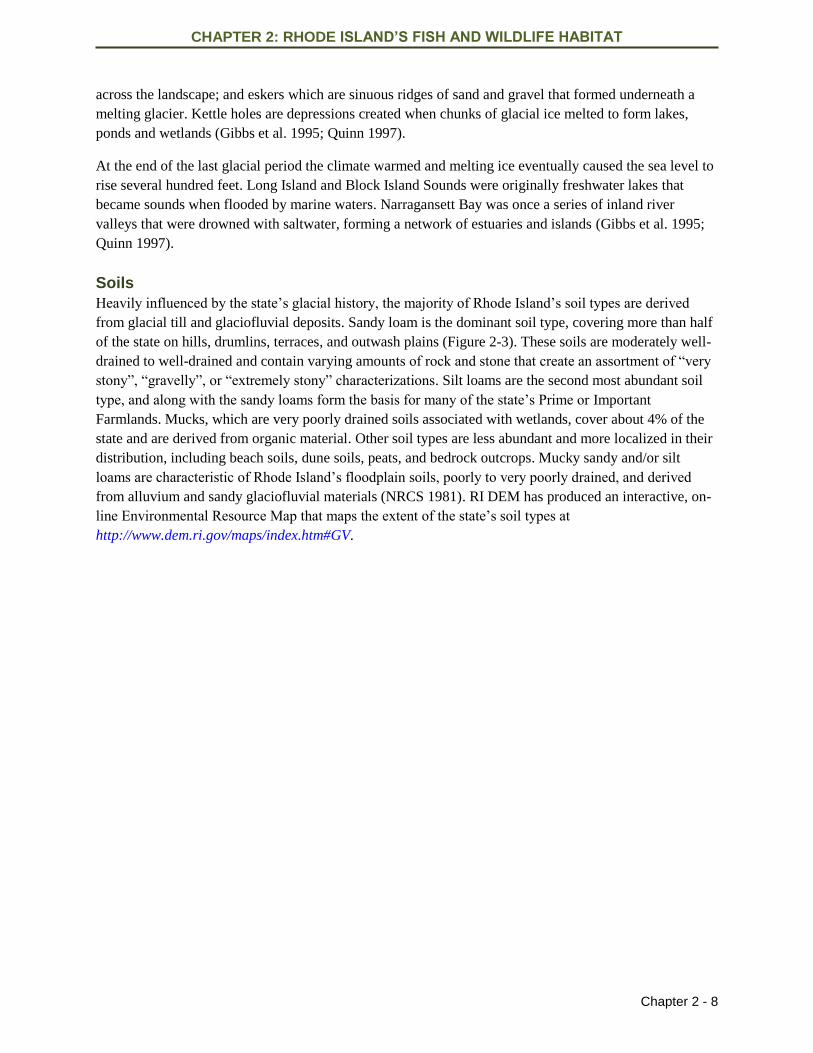
Soils
Heavily influenced by the state’s glacial history, the majority of Rhode Island’s soil types are derived
from glacial till and glaciofluvial deposits. Sandy loam is the dominant soil type, covering more than half
of the state on hills, drumlins, terraces, and outwash plains (Figure 2-3). These soils are moderately well-
drained to well-drained and contain varying amounts of rock and stone that create an assortment of “very
stony”, “gravelly”, or “extremely stony” characterizations. Silt loams are the second most abundant soil
type, and along with the sandy loams form the basis for many of the state’s Prime or Important
Farmlands. Mucks, which are very poorly drained soils associated with wetlands, cover about 4% of the
state and are derived from organic material. Other soil types are less abundant and more localized in their
distribution, including beach soils, dune soils, peats, and bedrock outcrops. Mucky sandy and/or silt
loams are characteristic of Rhode Island’s floodplain soils, poorly to very poorly drained, and derived
from alluvium and sandy glaciofluvial materials (NRCS 1981). RI DEM has produced an interactive, on-
line Environmental Resource Map that maps the extent of the state’s soil types at
http://www.dem.ri.gov/maps/index.htm#GV.
CHAPTER 2: RHODE ISLAND’S FISH AND WILDLIFE HABITAT
Chapter 2 - 9
Figure 2-3. Soils Map of Rhode Island. Source: The Nature Conservancy, Rhode Island Chapter
Climate
Rhode Island’s climate is largely governed by its proximity and exposure to the Atlantic Ocean, with
coastal areas tending to have slightly moderated temperatures (Gibbs et al. 1995). Average precipitation
in Rhode Island is approximately 43.09 inches annually, and the mean annual temperature is 49.4 ºF.
January is the coldest month of the year (mean temperature of 29.1ºF), and July the warmest month (mean
CHAPTER 2: RHODE ISLAND’S FISH AND WILDLIFE HABITAT
Chapter 2 - 10
temperature of 70.4 ºF; NOAA 2014). This annual variation creates distinct seasons that affect or
influence use of the state’s land and waterscapes by a variety of migratory fish and wildlife. Precipitation
is more uniform than temperature through the four seasons, with summer (June through August) slightly
drier than the other three seasons (NOAA 2014). Overall, the state’s weather is known for its frequent and
dramatic changes, with temperatures that can shift up to 50 degrees in one week (Gibbs et al. 1995).
Blizzards and hurricanes occasionally affect the state, as do tornadoes, ice storms, and flash floods. The
most significant recent storm to impact Rhode Island was hurricane Sandy on October 29, 2012. Damage
from the storm resulted in more than $35 million paid to flood insurance policy holders (FEMA 2013).
Many aspects of the global climate are changing rapidly, and the primary drivers of that change are
human in origin. Evidence supporting climate change abounds, from the top of the atmosphere to the
depths of the oceans (Kennedy et al. 2010). This evidence has been painstakingly compiled by scientists
and engineers from around the world using satellites, weather balloons, thermometers at surface stations,
and many other tools for monitoring the Earth’s climate system. The sum total of this evidence tells an
unambiguous convincing story that the planet is warming. Temperatures at the surface, in the troposphere
(the active weather layer extending up to about 8 to 12 miles above the ground), and in the oceans have
all increased in recent decades. Snow and ice coverage has decreased in most areas. Water vapor has been
increasing in the lower atmosphere, due to increased evaporation from the warmer surface. Sea levels are
rising. Changes in other indicators such as length of growing season have been observed in many areas.
Worldwide, changes in average climate conditions have been accompanied by upward trends in extremes
of heat, cold, drought, and heavy precipitation events (Alexander et al. 2006). Recent studies have already
detected changes in the phenology (flowering time) of plants caused by global warming, including those
of Miller-Rushing and Primack (2008) and Primack et al. (2004).
Rhode Island has been growing warmer and wetter since 1895, with annual precipitation increasing at a
rate of approximately 1 inch per decade and the mean annual temperature rising at 0.2 ºF per decade
(NOAA 2014). Climate change is given special consideration in the RI WAP because its scope reaches
beyond the state’s borders and because it exacerbates many other threats to wildlife and affects each
species differently. Thus, incorporating climate change considerations into the WAP is vital for the
development and implementation of effective conservation actions.
The Manomet Center for Conservation Sciences and the National Wildlife Federation (MCCS and NWF
2012), and NatureServe (2014) have assessed the vulnerability of northeastern fish and wildlife and their
habitats to climate change and published a series of reports to help effectively plan conservation efforts at
state and regional scales under a changing climate regime. Their work identifies species and habitats that
may be especially vulnerable to climate change and predicts how these species and habitats will adapt
under different climate scenarios. The results of these studies relevant to Rhode Island habitats are
detailed in Chapter 3. In addition, the reports outline potential adaptation options that can be used to
safeguard vulnerable habitats and species, and this information is detailed in Chapter 4.
Ecological Regions of Rhode Island’s Landscape
Several ecological classifications of the Northeast have been developed that place Rhode Island and its
wildlife resources within a national setting, allowing Rhode Island to participate in and benefit from
regional and national conservation efforts with a variety of partner agencies and organizations.
In a broad context, the U.S. Forest Service (USFS) classification system places Rhode Island in a single
Ecoregional Province (McNab and Avers 1994; Bailey 1995; Rudis 1999), specifically within the Lower
CHAPTER 2: RHODE ISLAND’S FISH AND WILDLIFE HABITAT
Chapter 2 - 11
New England Section of the Eastern Broadleaf Forest Province. The Lower New England Section is
characterized by glacially-influenced landforms descending to coastal lowlands, with forests dominated
by northern hardwoods, Appalachian oaks, and northeastern oak-pine associations. In this section,
ecosystems have been disturbed by human settlement. This disturbance, in turn, has resulted in an
ecological shift to a system that lacks large predators and suffers from an imbalance between plant
resources and herbivores (Rudis 1999).
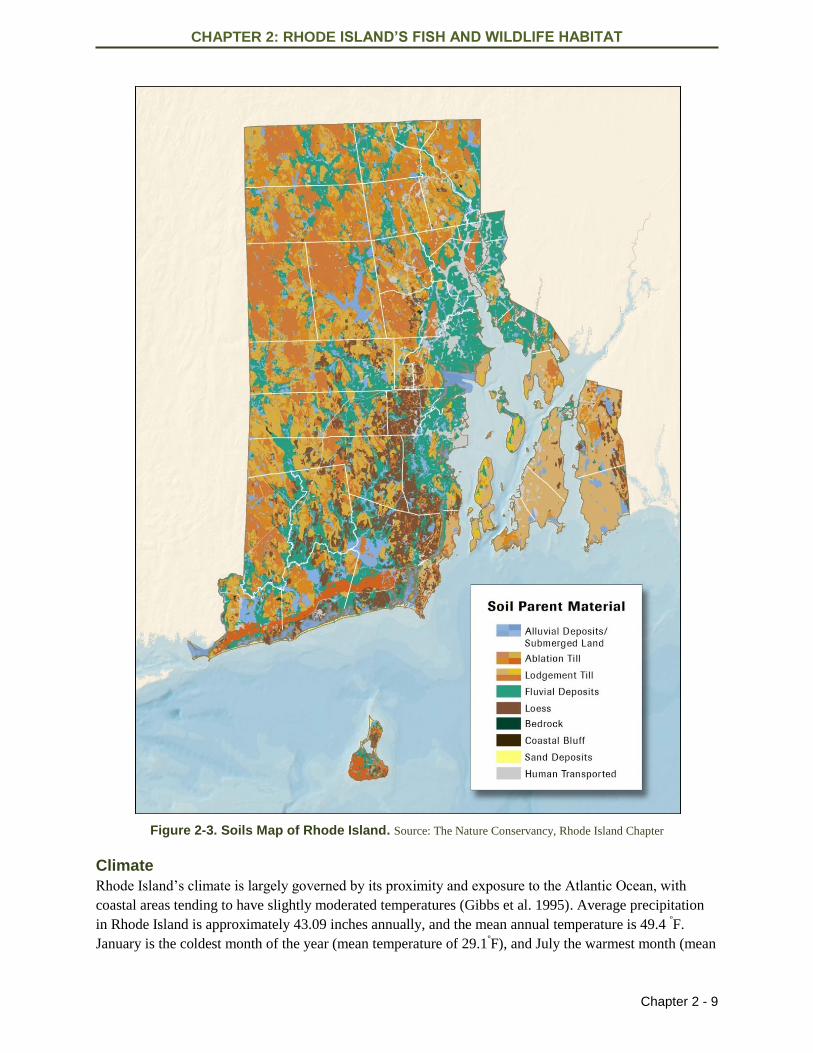
TNC has classified North American ecoregions to incorporate concepts of conservation biology and
ecology when developing meaningful biodiversity conservation plans (Groves et al. 2002; see Figure 2-
4). Characteristic species of flora and fauna and examples of characteristic natural communities have been
used to develop conservation priorities for each ecoregion. According to the TNC classification the
northwestern portion of Rhode Island falls within the Lower New England – Northern Piedmont
Ecoregion, and the coastal area is within the North Atlantic Coast Ecoregion. TNC has drafted
conservation plans for both ecoregions, describing the vegetative communities and biological resources of
each (Sneddon et al. 1998; Beers and Davison 1999; Barbour et al. 2003).
Figure 2-4. The Nature Conservancy Ecoregions Map. Source: The Nature Conservancy, Rhode Island Chapter
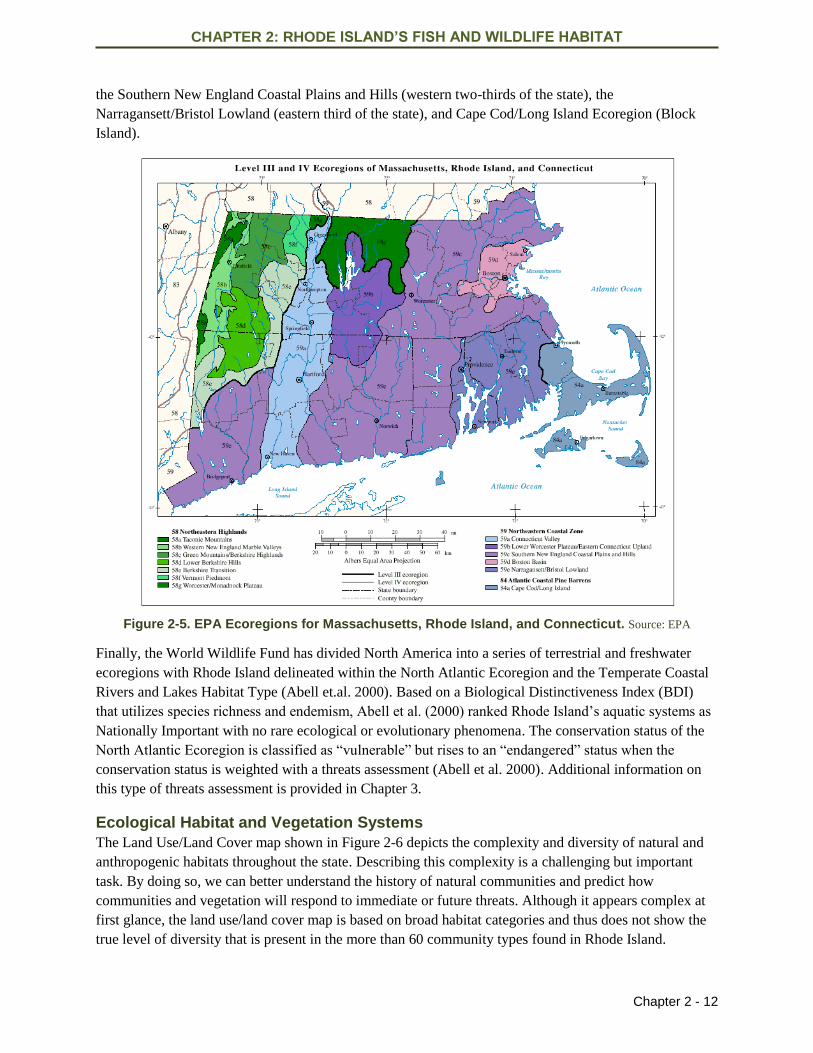
EPA collaborated with the Massachusetts Department of Environmental Protection (MA DEP) to draft an
ecoregion classification for Massachusetts, Rhode Island and Connecticut (Figure 2-5). The EPA system
utilizes a hierarchical classification system with Rhode Island falling within the Northeastern Coastal
Zone and Atlantic Coastal Pine Barrens Level III Ecoregions; only Block Island is in the latter, with the
rest of the state in the former (Omernik 1995). Rhode Island is within three Level IV draft ecoregions –
CHAPTER 2: RHODE ISLAND’S FISH AND WILDLIFE HABITAT
Chapter 2 - 12
the Southern New England Coastal Plains and Hills (western two-thirds of the state), the
Narragansett/Bristol Lowland (eastern third of the state), and Cape Cod/Long Island Ecoregion (Block
Island).
Figure 2-5. EPA Ecoregions for Massachusetts, Rhode Island, and Connecticut. Source: EPA
Finally, the World Wildlife Fund has divided North America into a series of terrestrial and freshwater
ecoregions with Rhode Island delineated within the North Atlantic Ecoregion and the Temperate Coastal
Rivers and Lakes Habitat Type (Abell et.al. 2000). Based on a Biological Distinctiveness Index (BDI)
that utilizes species richness and endemism, Abell et al. (2000) ranked Rhode Island’s aquatic systems as
Nationally Important with no rare ecological or evolutionary phenomena. The conservation status of the
North Atlantic Ecoregion is classified as “vulnerable” but rises to an “endangered” status when the
conservation status is weighted with a threats assessment (Abell et al. 2000). Additional information on
this type of threats assessment is provided in Chapter 3.
Ecological Habitat and Vegetation Systems
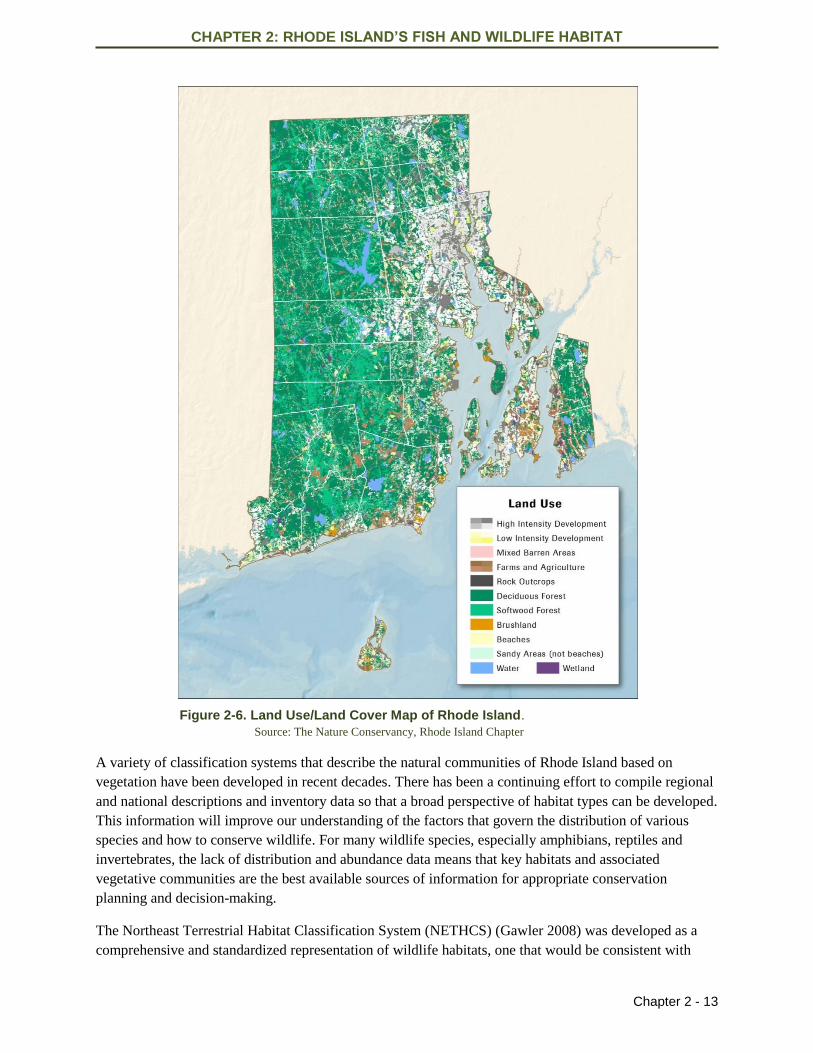
The Land Use/Land Cover map shown in Figure 2-6 depicts the complexity and diversity of natural and
anthropogenic habitats throughout the state. Describing this complexity is a challenging but important
task. By doing so, we can better understand the history of natural communities and predict how
communities and vegetation will respond to immediate or future threats. Although it appears complex at
first glance, the land use/land cover map is based on broad habitat categories and thus does not show the
true level of diversity that is present in the more than 60 community types found in Rhode Island.
CHAPTER 2: RHODE ISLAND’S FISH AND WILDLIFE HABITAT
Chapter 2 - 13
Figure 2-6. Land Use/Land Cover Map of Rhode Island.
Source: The Nature Conservancy, Rhode Island Chapter
A variety of classification systems that describe the natural communities of Rhode Island based on
vegetation have been developed in recent decades. There has been a continuing effort to compile regional
and national descriptions and inventory data so that a broad perspective of habitat types can be developed.
This information will improve our understanding of the factors that govern the distribution of various
species and how to conserve wildlife. For many wildlife species, especially amphibians, reptiles and
invertebrates, the lack of distribution and abundance data means that key habitats and associated
vegetative communities are the best available sources of information for appropriate conservation
planning and decision-making.
The Northeast Terrestrial Habitat Classification System (NETHCS) (Gawler 2008) was developed as a
comprehensive and standardized representation of wildlife habitats, one that would be consistent with
CHAPTER 2: RHODE ISLAND’S FISH AND WILDLIFE HABITAT
Chapter 2 - 14
other regional classification and mapping efforts. This classification formed the basis for a GIS map of
ecological systems based on 70,000 inventory points contributed by the State Natural Heritage programs
(NHPs) and the U.S. Department of Agriculture (USDA)-USFS Forest Inventory and Analysis (FIA)
program. The goal was to create an accurate model of where these habitats occur. In addition, the
Northeast Habitat Guide: A Companion to the Terrestrial and Aquatic Maps has been published by TNC
(Anderson et al. 2013b). It includes a profile of each habitat type in the Northeast, as well as distribution
maps, state acreage figures, identification of species of conservation concern, and assessment of overall
conditions in the region.
Ecological systems are defined as recurring groups of biological communities that are found in similar
physical environments and are influenced by similar dynamic ecological processes, such as fire or
flooding. They provide a classification framework that is readily able to be mapped, often from remote
imagery, and also readily identifiable by conservation and resource managers in the field. They are based
on biogeographic region, landscape scale, dominant cover type, and disturbance regime. Examples in
Rhode Island include Central Appalachian Dry Oak-Pine Forest and Northern Atlantic Coastal Plain
Sandy Beach.
Ecological systems are vegetation-based and may be described as a collection of plant associations that
occur together in some combination on the ground. Individually, these associations can be used as
relatively fine-scale mapping units. They can be useful in characterizing a specific area and driving local
management decisions, but are often not amenable to mapping at a regional scale. The fine-scale
classification of Rhode Island’s ecological systems is provided by the Rhode Island Ecological
Communities Classification (RIECC; Enser et al. 2011). This classification framework was designed to
support development of a detailed ecological communities map and database serving multiple
conservation needs in Rhode Island including, but not limited to, the RI WAP. RIECC was the
predecessor of a project to acquire aerial photography (6” pixel resolution, 4-band orthophoto) and Light
Detection and Radar (LIDAR) elevation data for the state of Rhode Island and, from this, to produce the
digital (i.e., GIS) ecological communities database (RI DEM 2014).
The RIECC is an amalgamation of two previously published classifications: the NETHCS described
above, and the Natural Communities of Rhode Island (NCRI; Enser and Lundgren 2005). The NCRI was
developed by conducting on-site ecological surveys to describe the natural communities (associations)
within Rhode Island. Site-based descriptions can provide a level of detail that would not be identifiable
from remote imagery. Development of the NCRI was a joint project of TNC and the RI NHP to define the
ecological diversity of natural communities in Rhode Island as a guide for conserving the full array of
biodiversity in the state. It is essentially a catalog of the natural communities that occur in Rhode Island
based on the physical environment, climate, and natural disturbance regimes in this part of the North
American continent.
The NCRI does not include anthropogenic communities (those created by and persisting under the
influence of humans). However, the NETHCS does provide guidance in assigning anthropogenic
(cultural) communities which are included in the RIECC. The classification first defines three basic
systems within which all communities can be grouped. These systems are Uplands, Palustrine, and
Estuarine.
CHAPTER 2: RHODE ISLAND’S FISH AND WILDLIFE HABITAT
Chapter 2 - 15
Uplands
This system consists of upland or terrestrial communities, forested and non-forested, which have well-
drained soils and a vegetated cover that is never dominated by hydrophytes, even if the soil surface is
seasonally flooded or saturated.
Forested Uplands
The Northeast was formerly 91% forested, supporting thousands of plant and animal species. Almost one-
third of that original forested land, a total of 39 million acres, has since been converted to other land uses.
Converted forest land exceeds the amount of forested land conserved for nature by a ratio of 6:1, and
conserved lands are spread unevenly across forest types. For example, upland boreal forests are 30%
conserved with 12% secured for nature. Northern hardwoods are 23% conserved with 8% primarily for
nature. Oak-pine forests are only 17% conserved with 5% primarily for nature (Anderson and Olivero
Sheldon 2011).
Forests in the Northeast region are fragmented by 732,000 miles of permanent roads. On average, 43% of
the forest occurs in blocks less than 5,000 acres that are completely encircled by major roads, resulting in
an almost 60% loss of local connectivity. Current patterns indicate that securing land has been an
effective strategy for preventing fragmentation as there is a high proportion of conserved land within most
of the remaining large contiguous forest blocks.
Forests in the region average only 60 years old, regardless of forest type, and they are overwhelmingly
composed of small trees 2” to 6” in diameter. Upland boreal forests are the most heavily logged, and they
differ from the other types in having fewer large-diameter trees. Out of almost 7,000 forest samples
collected in this region by the USDA-USFS FIA program, no forest stands were dominated by old trees or
had the majority of their canopy composed of trees more than 20” in diameter.
Situated in the southern New England portion of the Appalachian Forest, Rhode Island is naturally a
forested place. There is general agreement among ecologists that prior to European settlement more than
90% of the state was forested by deciduous trees, primarily oaks and Red Maple. Coniferous forests
constituted about 15% of the state’s forest land with White Pine, Pitch Pine, and hemlock the only
naturally-occurring upland species. Mature forests support a high diversity of wildlife species in an array
of canopy, sub-canopy, shrub, and ground vegetation layers, and there is strong evidence that the largest
forest tracts, ranging up to thousands of hectares, support the highest diversity of forest species.
In addition to spatial characteristics, the structure of forest vegetation is an important attribute
determining the diversity of forest species. Historically, forests of interior New England have undergone
frequent, small-scale natural disturbances in the form of tree wind-throws that removed individual trees or
groups of trees, resulting in canopy breaks. Major catastrophic disturbances from hurricanes and wild
fires occurred much less frequently. Natural disturbances create forests that are structurally diverse, with
dense nesting cover at the shrub and ground levels that support a higher diversity of forest-nesting birds.
The European colonists that settled in Rhode Island cleared nearly all of the original deciduous, hardwood
forest, about two-thirds of it for agriculture. By the mid-18th century, however, industry had replaced
agriculture as Rhode Island’s dominant employment and many farm fields were abandoned. An estimated
30% of the lost woodlands were restored through natural succession of these abandoned fields. As a
result, almost all of the state’s current forests are second-growth. Today’s forests are concentrated in the
CHAPTER 2: RHODE ISLAND’S FISH AND WILDLIFE HABITAT
Chapter 2 - 16
western part of the state, where RI DEM has several large preserved tracts and development pressures
have been lower than in the highly urbanized coastal areas. Nevertheless, forestland is increasingly
fragmented throughout the state as more of it is converted a second time to individual home sites.
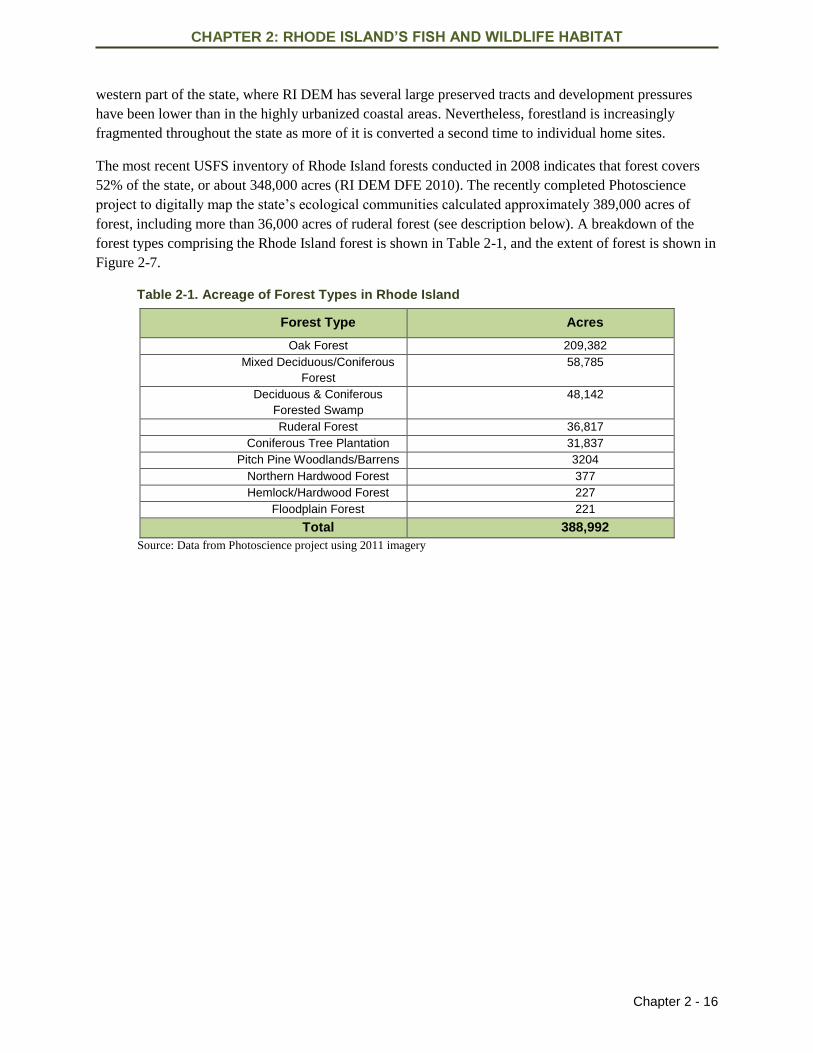
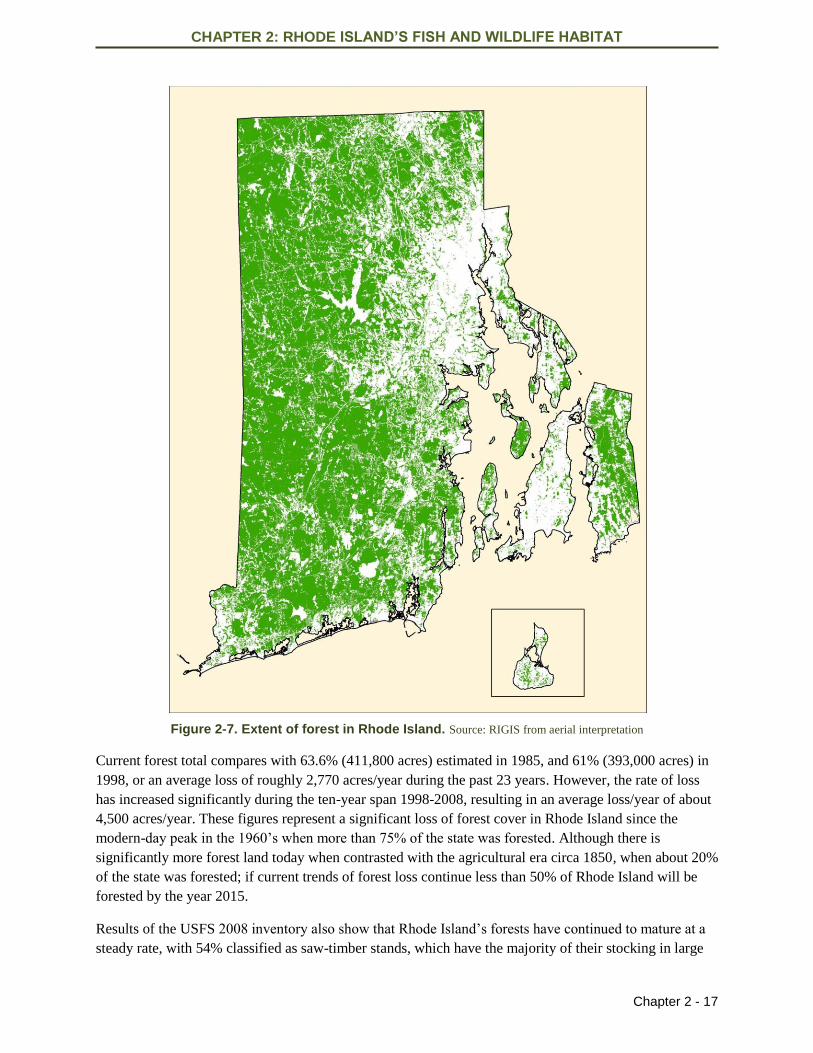
The most recent USFS inventory of Rhode Island forests conducted in 2008 indicates that forest covers
52% of the state, or about 348,000 acres (RI DEM DFE 2010). The recently completed Photoscience
project to digitally map the state’s ecological communities calculated approximately 389,000 acres of
forest, including more than 36,000 acres of ruderal forest (see description below). A breakdown of the
forest types comprising the Rhode Island forest is shown in Table 2-1, and the extent of forest is shown in
Figure 2-7.
Table 2-1. Acreage of Forest Types in Rhode Island
Forest Type Acres
Oak Forest 209,382
Mixed Deciduous/Coniferous
Forest
58,785
Deciduous & Coniferous
Forested Swamp
48,142
Ruderal Forest 36,817
Coniferous Tree Plantation 31,837
Pitch Pine Woodlands/Barrens 3204
Northern Hardwood Forest 377
Hemlock/Hardwood Forest 227
Floodplain Forest 221
Total 388,992
Source: Data from Photoscience project using 2011 imagery
CHAPTER 2: RHODE ISLAND’S FISH AND WILDLIFE HABITAT
Chapter 2 - 17
Figure 2-7. Extent of forest in Rhode Island. Source: RIGIS from aerial interpretation
Current forest total compares with 63.6% (411,800 acres) estimated in 1985, and 61% (393,000 acres) in
1998, or an average loss of roughly 2,770 acres/year during the past 23 years. However, the rate of loss
has increased significantly during the ten-year span 1998-2008, resulting in an average loss/year of about
4,500 acres/year. These figures represent a significant loss of forest cover in Rhode Island since the
modern-day peak in the 1960’s when more than 75% of the state was forested. Although there is
significantly more forest land today when contrasted with the agricultural era circa 1850, when about 20%
of the state was forested; if current trends of forest loss continue less than 50% of Rhode Island will be
forested by the year 2015.
Results of the USFS 2008 inventory also show that Rhode Island’s forests have continued to mature at a
steady rate, with 54% classified as saw-timber stands, which have the majority of their stocking in large
CHAPTER 2: RHODE ISLAND’S FISH AND WILDLIFE HABITAT
Chapter 2 - 18
trees. An increase of 20% in this size class since 1985 reflects the aging of trees in the pole-timber
category, which declined to 40% of forest cover during the same period, with seedling-sapling stands
remaining consistent at 6% cover.
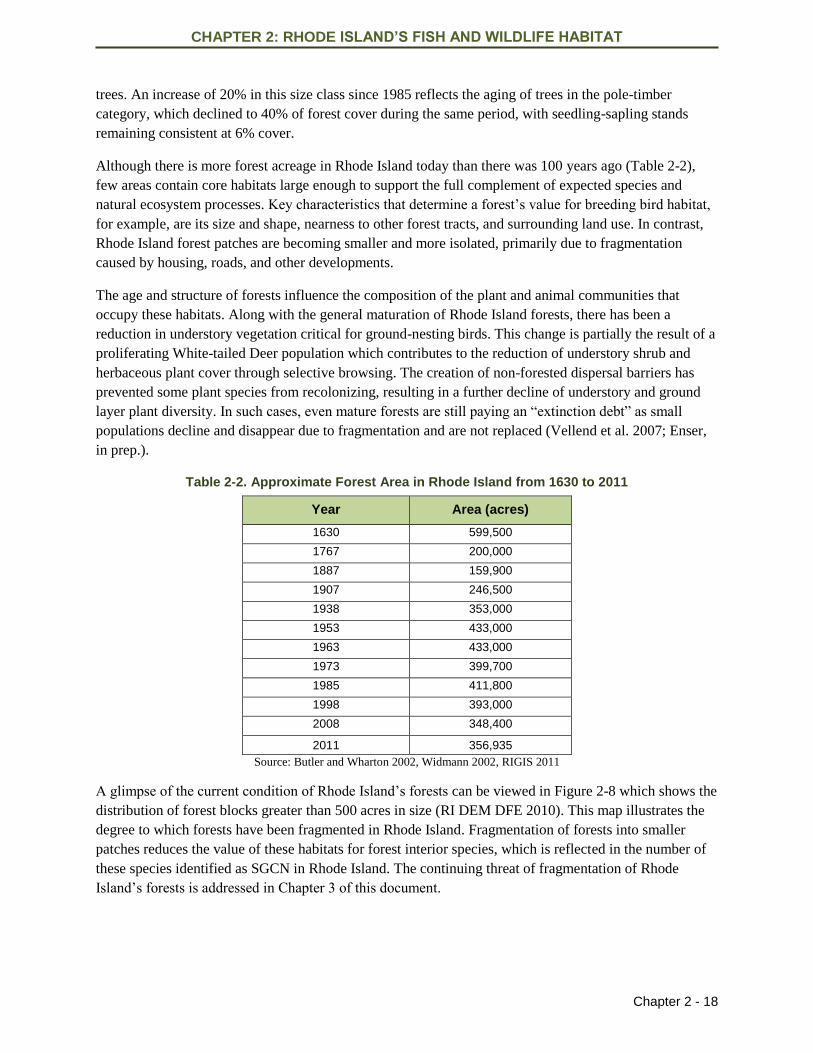
Although there is more forest acreage in Rhode Island today than there was 100 years ago (Table 2-2),
few areas contain core habitats large enough to support the full complement of expected species and
natural ecosystem processes. Key characteristics that determine a forest’s value for breeding bird habitat,
for example, are its size and shape, nearness to other forest tracts, and surrounding land use. In contrast,
Rhode Island forest patches are becoming smaller and more isolated, primarily due to fragmentation
caused by housing, roads, and other developments.
The age and structure of forests influence the composition of the plant and animal communities that
occupy these habitats. Along with the general maturation of Rhode Island forests, there has been a
reduction in understory vegetation critical for ground-nesting birds. This change is partially the result of a
proliferating White-tailed Deer population which contributes to the reduction of understory shrub and
herbaceous plant cover through selective browsing. The creation of non-forested dispersal barriers has
prevented some plant species from recolonizing, resulting in a further decline of understory and ground
layer plant diversity. In such cases, even mature forests are still paying an “extinction debt” as small
populations decline and disappear due to fragmentation and are not replaced (Vellend et al. 2007; Enser,
in prep.).
Table 2-2. Approximate Forest Area in Rhode Island from 1630 to 2011
Year Area (acres)
1630 599,500
1767 200,000
1887 159,900
1907 246,500
1938 353,000
1953 433,000
1963 433,000
1973 399,700
1985 411,800
1998 393,000
2008 348,400
2011 356,935
Source: Butler and Wharton 2002, Widmann 2002, RIGIS 2011
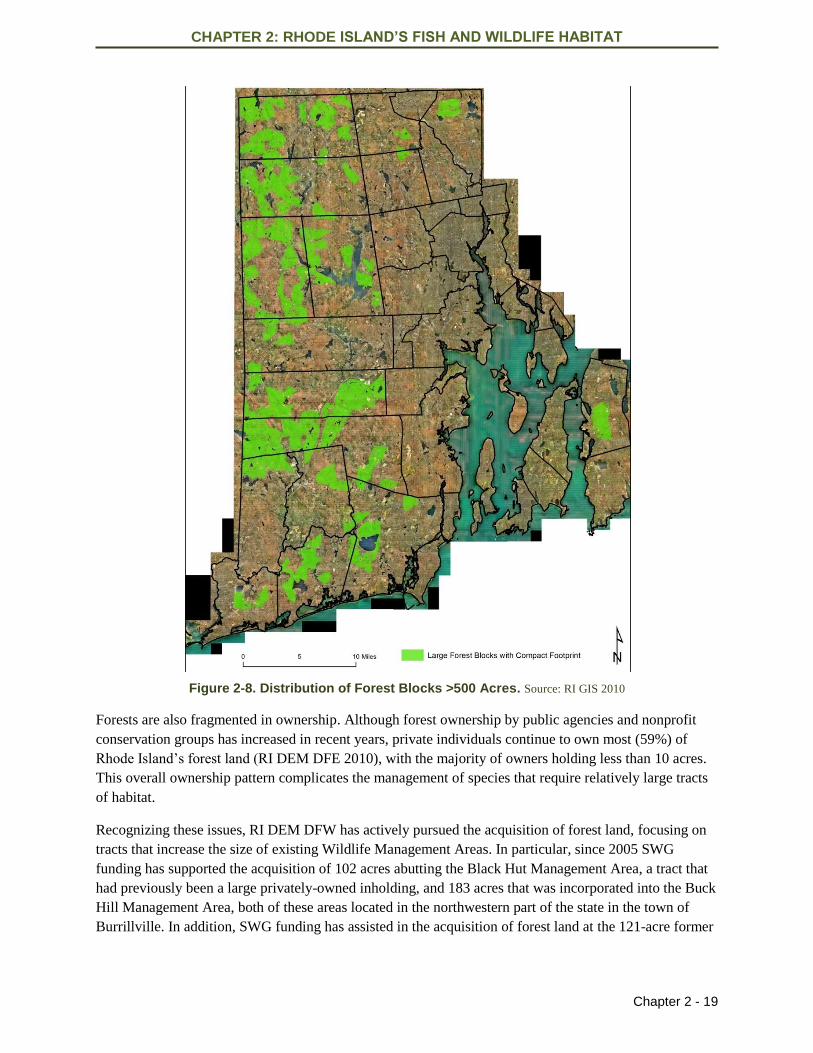
A glimpse of the current condition of Rhode Island’s forests can be viewed in Figure 2-8 which shows the
distribution of forest blocks greater than 500 acres in size (RI DEM DFE 2010). This map illustrates the
degree to which forests have been fragmented in Rhode Island. Fragmentation of forests into smaller
patches reduces the value of these habitats for forest interior species, which is reflected in the number of
these species identified as SGCN in Rhode Island. The continuing threat of fragmentation of Rhode
Island’s forests is addressed in Chapter 3 of this document.
CHAPTER 2: RHODE ISLAND’S FISH AND WILDLIFE HABITAT
Chapter 2 - 19
Figure 2-8. Distribution of Forest Blocks >500 Acres. Source: RI GIS 2010
Forests are also fragmented in ownership. Although forest ownership by public agencies and nonprofit
conservation groups has increased in recent years, private individuals continue to own most (59%) of
Rhode Island’s forest land (RI DEM DFE 2010), with the majority of owners holding less than 10 acres.
This overall ownership pattern complicates the management of species that require relatively large tracts
of habitat.
Recognizing these issues, RI DEM DFW has actively pursued the acquisition of forest land, focusing on
tracts that increase the size of existing Wildlife Management Areas. In particular, since 2005 SWG
funding has supported the acquisition of 102 acres abutting the Black Hut Management Area, a tract that
had previously been a large privately-owned inholding, and 183 acres that was incorporated into the Buck
Hill Management Area, both of these areas located in the northwestern part of the state in the town of
Burrillville. In addition, SWG funding has assisted in the acquisition of forest land at the 121-acre former
CHAPTER 2: RHODE ISLAND’S FISH AND WILDLIFE HABITAT
Chapter 2 - 20
Tiverton Rod and Gun Club in Newport County, and over 400 acres of the Grills Preserve in Hopkinton,
Washington County.
Statistics on forest cover in Rhode Island generally do not take into account the small tracts of forest that
remain within the most heavily developed sections of the state such as in municipal parks, cemeteries,
hospital grounds, schools, and other marginally protected sites. Ruderal forests, as these habitats are
referred to in the RIECC, support a surprisingly high number of species that can include SGCN such as
gray catbird and eastern towhee.
Ruderal forests are classified as such because the replacement of native species with exotics has altered
the plant species composition dramatically. In these cases, the forest community is not recognizable as
any RIECC forest type. Despite changes in species composition ruderal forests support canopy and
cavity-nesting birds, and these upland forests are often associated with small wetlands, especially Red
Maple swamps. Ruderal forests also serve as valuable resting and feeding areas for migrating birds.
Non-Forested Uplands
Under natural circumstances, non-forested uplands are created by disturbances to the forest which can be
due to regular daily conditions (e.g., coastal wind and salt spray), or occasional catastrophic events such
as hurricanes. Before European settlement, indigenous peoples periodically burned areas to maintain their
openness, but after settlement most of the state was cleared for agricultural and other purposes. During the
past century the landscape has been continually altered by clearing, regrowth of forest, and subsequently
by more clearing, which has resulted in a wide distribution of non-forested habitats in various stages of
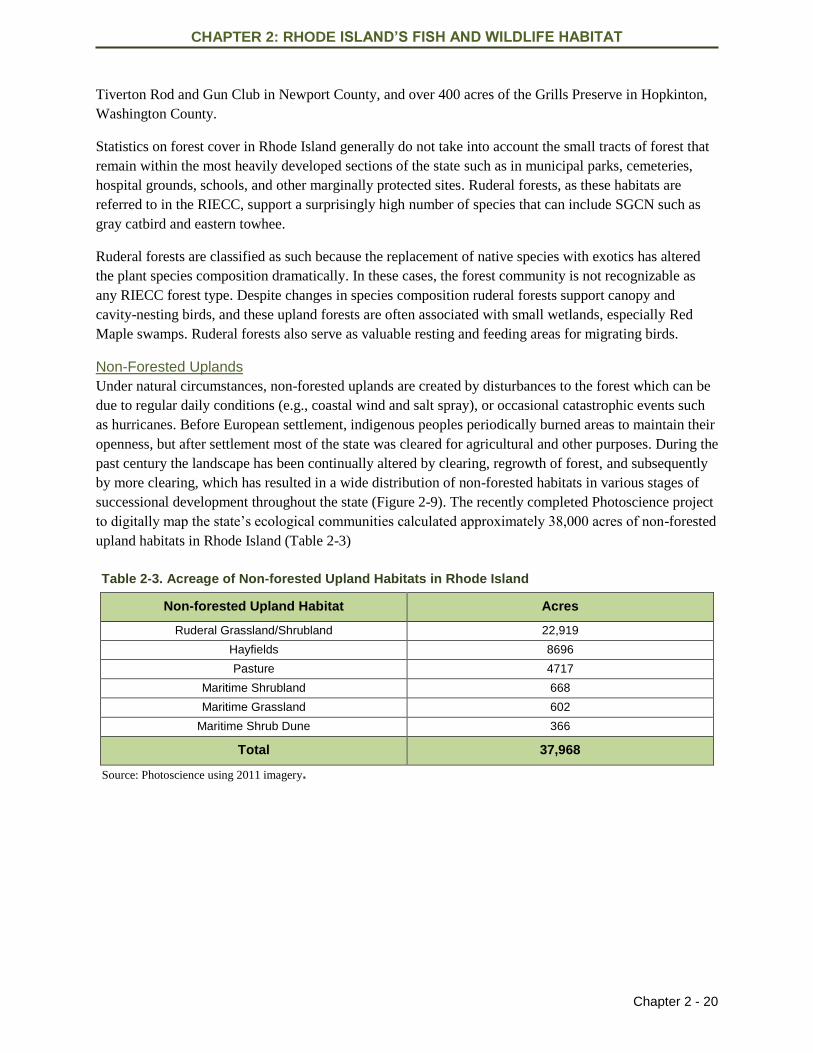
successional development throughout the state (Figure 2-9). The recently completed Photoscience project
to digitally map the state’s ecological communities calculated approximately 38,000 acres of non-forested
upland habitats in Rhode Island (Table 2-3)
Table 2-3. Acreage of Non-forested Upland Habitats in Rhode Island
Non-forested Upland Habitat Acres
Ruderal Grassland/Shrubland 22,919
Hayfields 8696
Pasture 4717
Maritime Shrubland 668
Maritime Grassland 602
Maritime Shrub Dune 366
Total 37,968
Source: Photoscience using 2011 imagery.
CHAPTER 2: RHODE ISLAND’S FISH AND WILDLIFE HABITAT
Chapter 2 - 21
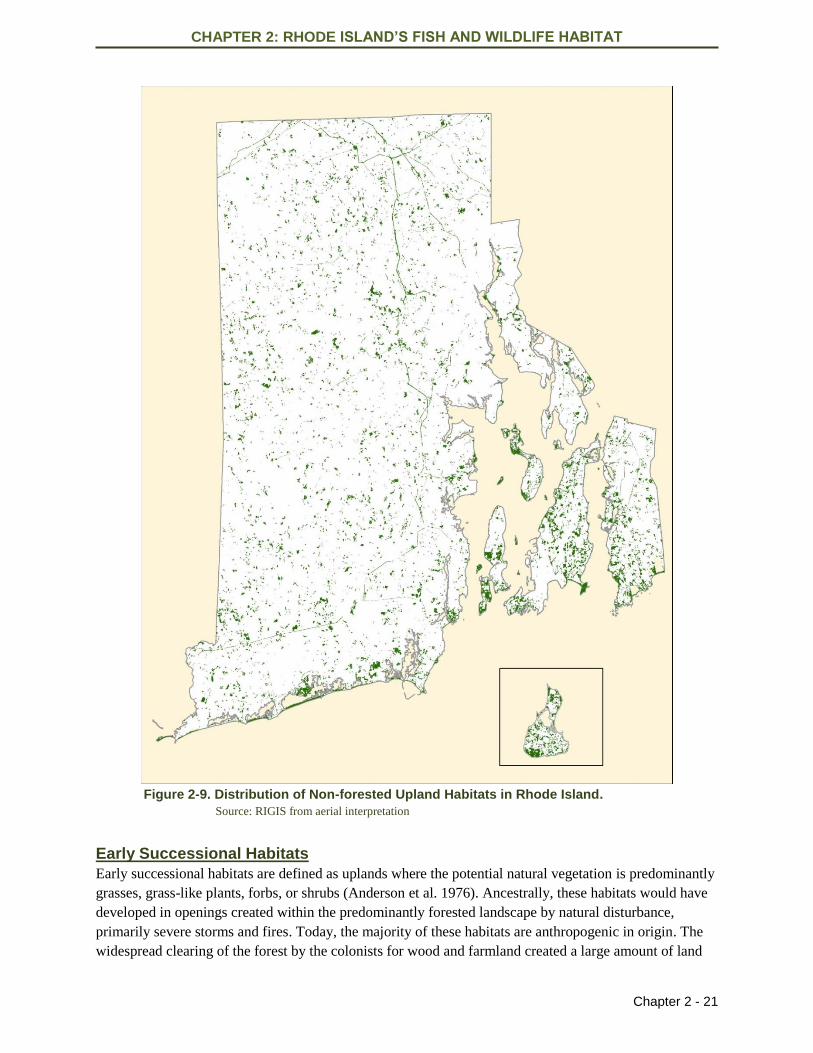
Figure 2-9. Distribution of Non-forested Upland Habitats in Rhode Island.
Source: RIGIS from aerial interpretation
Early Successional Habitats
Early successional habitats are defined as uplands where the potential natural vegetation is predominantly
grasses, grass-like plants, forbs, or shrubs (Anderson et al. 1976). Ancestrally, these habitats would have
developed in openings created within the predominantly forested landscape by natural disturbance,
primarily severe storms and fires. Today, the majority of these habitats are anthropogenic in origin. The
widespread clearing of the forest by the colonists for wood and farmland created a large amount of land
CHAPTER 2: RHODE ISLAND’S FISH AND WILDLIFE HABITAT
Chapter 2 - 22
that could quickly return to early successional habitat. This pattern occurred mostly during the post-Civil
War era, when large tracts of farmland were abandoned. Today, abandonment of farmland has stabilized
and most old field habitat is created and maintained on State Managed Areas (SMAs), other conserved
lands, and private properties under management agreements. Other places where early successional
habitats are fostered include logging sites and utility rights-of-way (electric power-lines and gas
pipelines) (Enser, pers. comm., March 5, 2014).
The condition of early successional habitats in Rhode Island depends on the reference point used to make
the assessment. During the pre-settlement period, when natural disturbances governed the amount and
distribution of shrublands, this habitat comprised an estimated 3% of inland habitats, where large-scale
disturbances were very infrequent. Near the coast, with regular maritime winds and a higher storm
frequency, shrublands were more extensive, comprising more than 15% of coastal forests, and
populations of shrubland animals probably reached their greatest densities in these habitats (Litvaitis
2003).
Shrubland wildlife significantly benefited from the increase in old field habitat that reached its peak circa
1870 when less than 30% of the state was forested. Since that time there has been a steady decline in
shrubland habitat as old fields succeed to forest and old farms are converted to residential and commercial
developments. According to Buffum (2011), 3.3% of the state is currently shrubland habitat, although
coverage varies widely. Coastal communities, where natural shrublands reach their greatest extent, have
the highest coverage, for example Block Island (31%) and Jamestown (15%). Inland areas average
roughly 2% shrub cover, mostly anthropogenic early successional types. Approximately 82% of the
power-lines in Rhode Island were classified as shrublands based on the descriptive methodology used
(Buffum 2011).
Wildlife managers cannot rely on natural disturbances to maintain or create enough shrubland habitat to
support certain SGCN that require it. Therefore, anthropogenic methods are used to create and augment
natural shrublands. Litviatis (2003) points out that such an approach should not jeopardize the survival of
species affiliated with other habitats, especially mature forests, and efforts to provide shrubland habitats
in human-dominated landscapes should incorporate existing modified lands to avoid additional habitat
fragmentation. Large, clustered patches of shrubland habitat may be more practical and beneficial in
coastal areas where the creation and maintenance of ruderal shrublands can augment naturally-maintained
shrubland habitats.
Agricultural Lands
According to the USDA Census of Agriculture, there were 1,243 farms in Rhode Island in 2012, an
increase of 44% from the 858 reported in 2002. Correspondingly, there was a 14% increase in farmed
acreage during the same period, from 61,223 to 69,589 acres. Interestingly, the average farm size declined
from 71 acres to 56 acres during the same period, and 35% of farms are currently less than10 acres in
size, reflecting the recent interest in establishing small operations to supply specific products for the
clientele at farmer’s markets (USDA 2014) (refer to Figures 2-10 and 2-11).
The market value of Rhode Island’s agricultural operations is $59.7 million, which is down 9% from a
value of $65.9 million in 2007. Approximately 61% of sales income is from nursery stock and turf
(USDA 2014). A positive change in the agricultural industry in Rhode Island is the increase of direct
marketing (i.e., the direct sale of agricultural products from the farm to the consumer). This form of
marketing has led to an increase in the number of roadside farm stands, Pick-Your-Own operations, and
CHAPTER 2: RHODE ISLAND’S FISH AND WILDLIFE HABITAT
Chapter 2 - 23
farmers’ markets. The original 2005 RI WAP cited a total of 15 farmer’s markets in Rhode Island. By
2013 that number had grown to 50 (RI DEM Div. Agriculture 2014). The cost of farmland also continues
to rise, and farmers identify the lack of access to affordable farmland as a key challenge to agricultural
growth and stability. At $13,600 per acre, the value of Rhode Island’s farm real estate is the highest in the
country. For more information please see
www.farmland.org/documents/RI_agriculture_5yr_strategicplan.pdf.
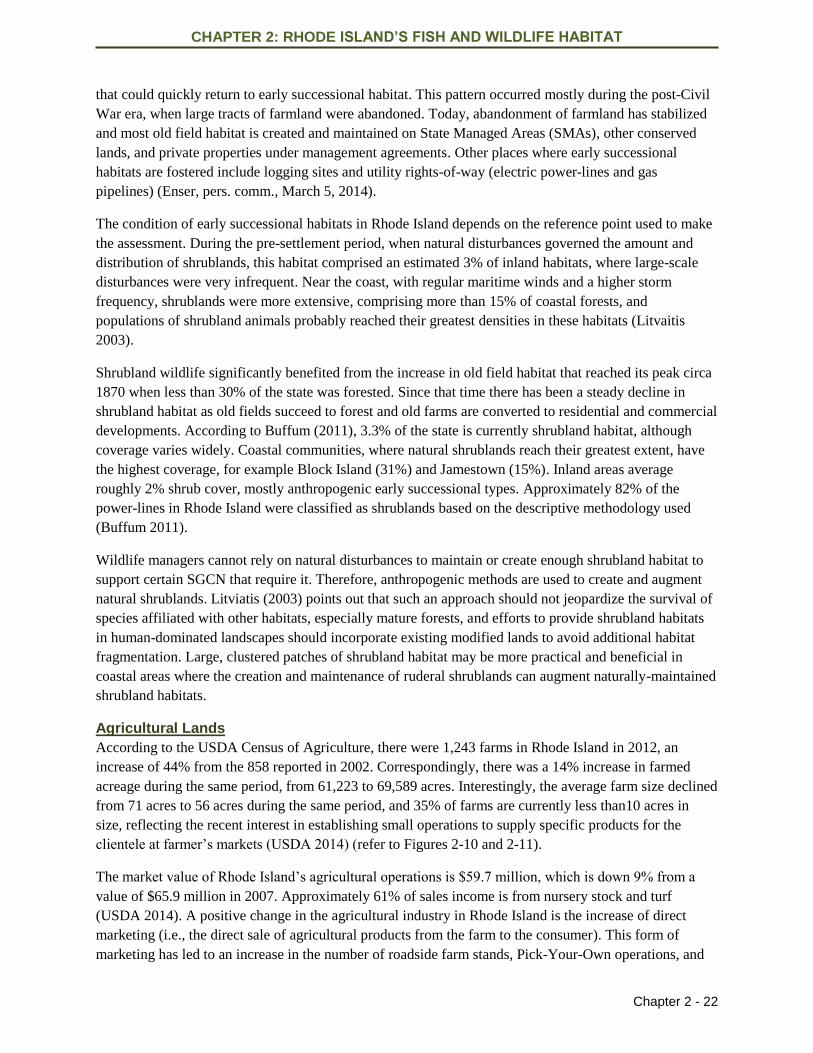
Figure 2-10. Distribution of Farmland in Rhode Island.
Source: The Nature Conservancy, Rhode Island Chapter
CHAPTER 2: RHODE ISLAND’S FISH AND WILDLIFE HABITAT
Chapter 2 - 24
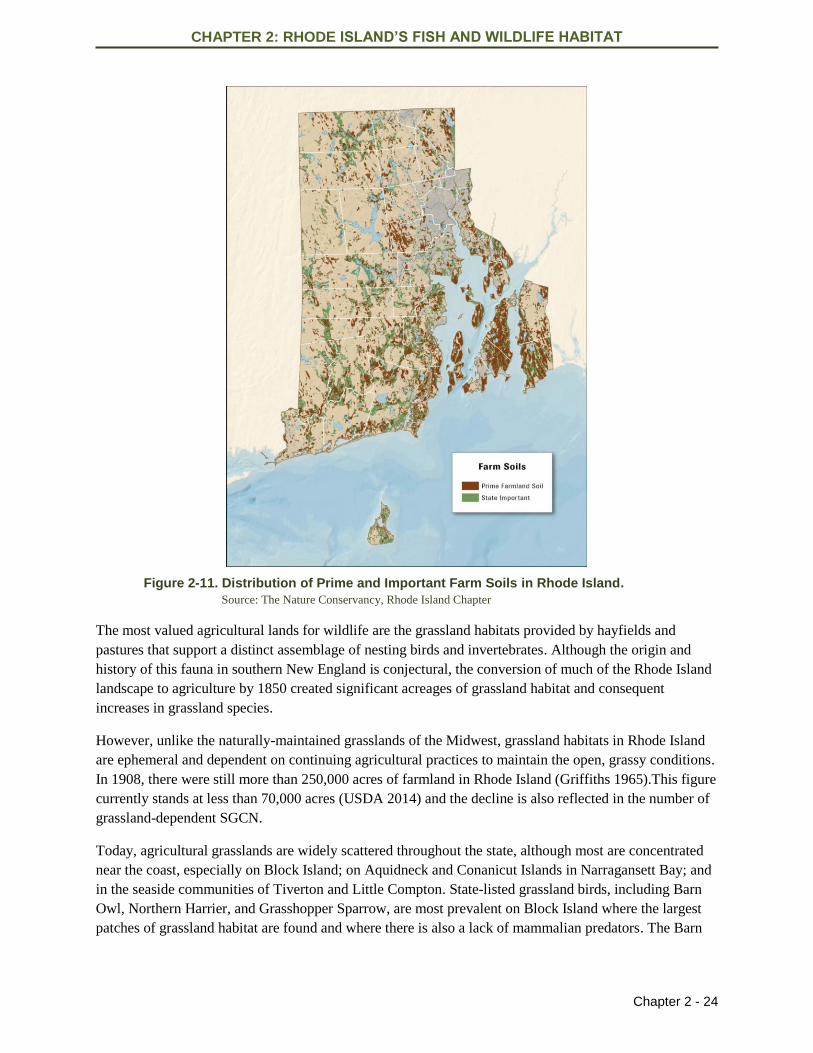
Figure 2-11. Distribution of Prime and Important Farm Soils in Rhode Island.
Source: The Nature Conservancy, Rhode Island Chapter
The most valued agricultural lands for wildlife are the grassland habitats provided by hayfields and
pastures that support a distinct assemblage of nesting birds and invertebrates. Although the origin and
history of this fauna in southern New England is conjectural, the conversion of much of the Rhode Island
landscape to agriculture by 1850 created significant acreages of grassland habitat and consequent
increases in grassland species.
However, unlike the naturally-maintained grasslands of the Midwest, grassland habitats in Rhode Island
are ephemeral and dependent on continuing agricultural practices to maintain the open, grassy conditions.
In 1908, there were still more than 250,000 acres of farmland in Rhode Island (Griffiths 1965).This figure
currently stands at less than 70,000 acres (USDA 2014) and the decline is also reflected in the number of
grassland-dependent SGCN.
Today, agricultural grasslands are widely scattered throughout the state, although most are concentrated
near the coast, especially on Block Island; on Aquidneck and Conanicut Islands in Narragansett Bay; and
in the seaside communities of Tiverton and Little Compton. State-listed grassland birds, including Barn
Owl, Northern Harrier, and Grasshopper Sparrow, are most prevalent on Block Island where the largest
patches of grassland habitat are found and where there is also a lack of mammalian predators. The Barn
CHAPTER 2: RHODE ISLAND’S FISH AND WILDLIFE HABITAT
Chapter 2 - 25
Owl also nests on Aquidneck Island where some larger farms remain in the towns of Portsmouth and
Middletown.
Grassland species have declined because much of the original farmland was abandoned or more recently
sold and converted to other uses. In addition, farmland is managed more intensively today to maximize
production, with more frequent haying schedules often coinciding with the nesting periods of grassland
birds. Also, the amount of grassland in contiguous blocks is critical to determining the value of a specific
tract of land for these grassland species. For example, Upland Sandpiper and Grasshopper Sparrow
generally do not inhabit grasslands less than 50 acres in size. As a consequence, the distribution of these
birds is mostly limited to larger non-agricultural grasslands found at airports and military reservations.
Wetlands
Palustrine, Fresh Water Wetlands
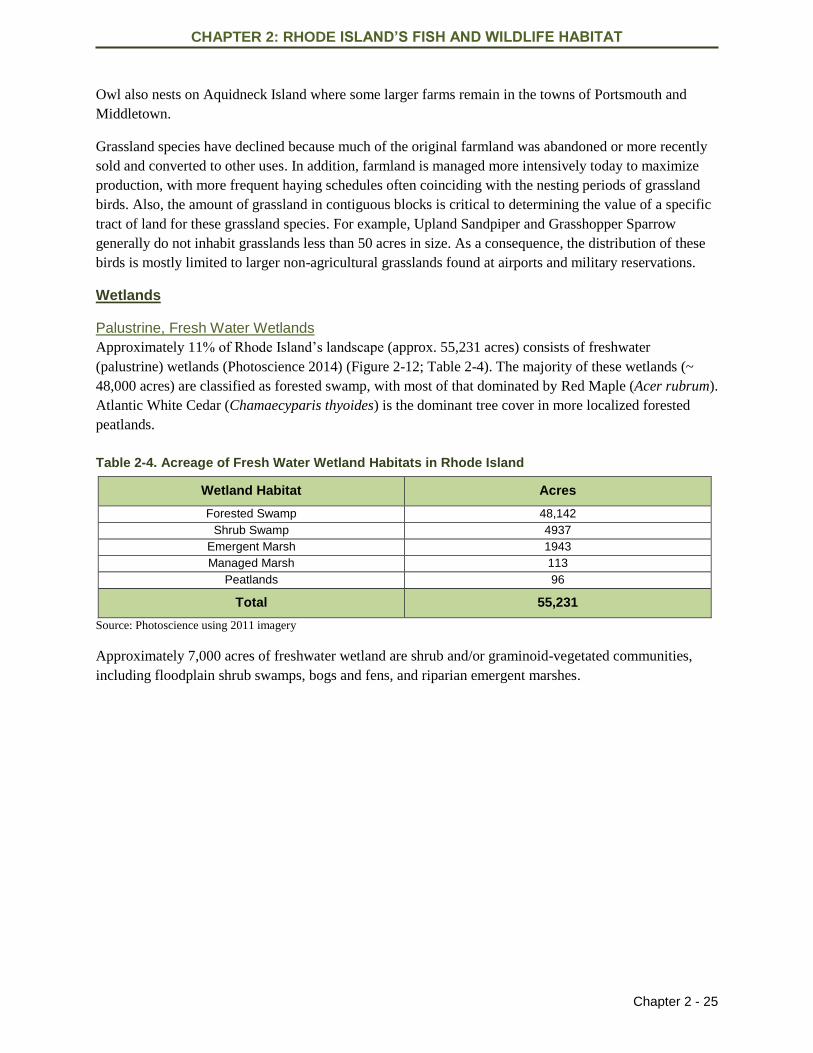
Approximately 11% of Rhode Island’s landscape (approx. 55,231 acres) consists of freshwater
(palustrine) wetlands (Photoscience 2014) (Figure 2-12; Table 2-4). The majority of these wetlands (~
48,000 acres) are classified as forested swamp, with most of that dominated by Red Maple (Acer rubrum).
Atlantic White Cedar (Chamaecyparis thyoides) is the dominant tree cover in more localized forested
peatlands.
Table 2-4. Acreage of Fresh Water Wetland Habitats in Rhode Island
Wetland Habitat Acres
Forested Swamp 48,142
Shrub Swamp 4937
Emergent Marsh 1943
Managed Marsh 113
Peatlands 96
Total 55,231
Source: Photoscience using 2011 imagery
Approximately 7,000 acres of freshwater wetland are shrub and/or graminoid-vegetated communities,
including floodplain shrub swamps, bogs and fens, and riparian emergent marshes.
CHAPTER 2: RHODE ISLAND’S FISH AND WILDLIFE HABITAT
Chapter 2 - 26
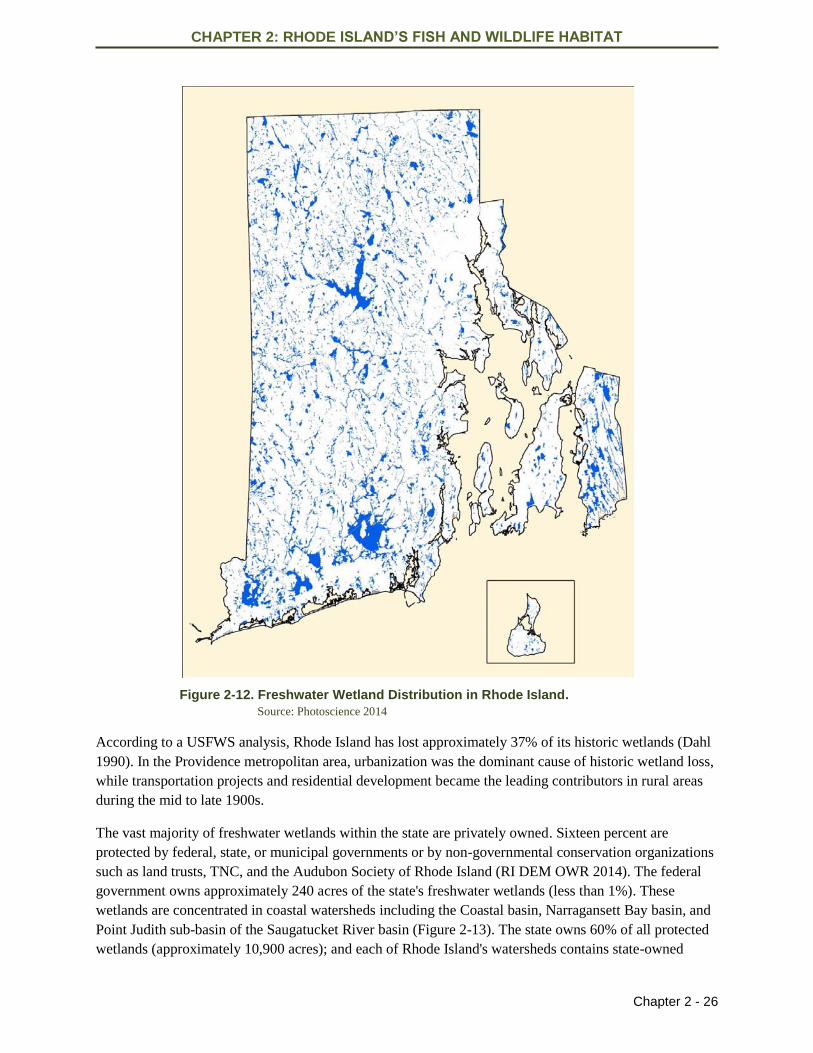
Figure 2-12. Freshwater Wetland Distribution in Rhode Island.
Source: Photoscience 2014
According to a USFWS analysis, Rhode Island has lost approximately 37% of its historic wetlands (Dahl
1990). In the Providence metropolitan area, urbanization was the dominant cause of historic wetland loss,
while transportation projects and residential development became the leading contributors in rural areas
during the mid to late 1900s.
The vast majority of freshwater wetlands within the state are privately owned. Sixteen percent are
protected by federal, state, or municipal governments or by non-governmental conservation organizations
such as land trusts, TNC, and the Audubon Society of Rhode Island (RI DEM OWR 2014). The federal
government owns approximately 240 acres of the state's freshwater wetlands (less than 1%). These
wetlands are concentrated in coastal watersheds including the Coastal basin, Narragansett Bay basin, and
Point Judith sub-basin of the Saugatucket River basin (Figure 2-13). The state owns 60% of all protected
wetlands (approximately 10,900 acres); and each of Rhode Island's watersheds contains state-owned
CHAPTER 2: RHODE ISLAND’S FISH AND WILDLIFE HABITAT
Chapter 2 - 27
freshwater wetlands. Freshwater wetlands owned by municipal governments and non-governmental
organizations also are found in each of the watersheds. Municipal governments own approximately 4,500
acres of wetlands; non-governmental organizations own approximately 2,400 acres.
Since 1998, the RI DEM has monitored freshwater wetland loss and gain through its wetland regulatory
program, and results to date indicate that (permitted) freshwater wetland loss is minimal. From 2001 to
2003 there was a combined (permitted) loss of 4.72 acres of wetlands; in years 2007 and 2008 the
combined loss was only 1.5 acres (RI DEM OWR 2009).
Wetland protection efforts have increased in recent years with several of the state’s conservation and
grant programs giving priority to projects that involve wetland restoration, enhancement or preservation.
RI DEM, in conjunction with New England Interstate Water Pollution Control Commission, has
published the Rhode Island Freshwater Wetland Monitoring and Assessment Plan (RIFWMAP,
NEIWPCC and RI DEM 2006). The long-term objectives of this plan are to develop baseline data to
evaluate wetland condition and to assess the cumulative impacts on wetlands in Rhode Island. This plan is
comprehensive and takes a landscape-level approach to assessment and management, utilizing identified
core indicators such as wetland plant richness to assess wetland quality.
The initial work has focused largely on developing a Rhode Island-specific rapid assessment method
(RAM), building on work that has been completed in other states. Development and application of a
RAM will facilitate watershed-based conditional reporting and will support objectives identified in the
RIFWMAP. With support of the EPA and the Rhode Island Natural History Survey, several projects have
been completed that are of particular interest in assessing the condition of palustrine habitats. These
include: Rapid Assessment of Wetland Condition of Atlantic White Cedar Swamps, Bogs, and Fens
(Kutcher 2011); Integrating Rapid Assessment with Biological and Landscape Indicators of Freshwater
Wetland Condition (Kutcher 2012); and, Developing Floristic Quality Assessment Methods for
Evaluating Freshwater Wetland Condition (Kutcher 2013). An updated Wetland Assessment and
Monitoring Plan is scheduled for completion in mid-2014 (Murphy, pers. comm., February 2014).
Estuarine Wetlands
With a coastline of more than 400 miles, Rhode Island supports a significant number of estuarine habitats,
defined as wetlands where fresh and salt waters mix (Figure 2-13.). NOAA has recognized the ecological
value of Rhode Island’s estuaries by establishing one of 26 National Estuarine Research Reserves
(NERR) in Narragansett Bay http://www.census.gov/compendia/statab/2012/tables/12s0364.pdf.
Estuarine habitats are primarily governed by the degree of daily tidal exchange and consequent water
salinity. Habitats include tidal creeks, tidal flats, and salt marshes. Protected coves, bays, and lagoons of
Rhode Island estuarine waters contain over 1,748 acres of sand and mud flats, also known as tidal flats.
These dynamic habitats become fully exposed at low tide and are formed from the deposition of estuarine
silts, clays and marine animal detritus. Tidal flats support a large population of wildlife, and are
significant staging areas for large concentrations of migrating sandpipers, terns, plovers, and other
shorebirds and waterfowl.
The predominant estuarine habitat in Rhode Island is salt marsh (~3438 acres), which is actually a mosaic
of communities dominated by plants adapted to varying salinity levels that are maintained by the degree
of daily inundation of salt water. The largest salt marsh complexes develop within protected coves, bays,
and salt ponds (Figure 2-13), but about 10% of these habitats are fringe marshes less than 5 yards wide
CHAPTER 2: RHODE ISLAND’S FISH AND WILDLIFE HABITAT
Chapter 2 - 28
and mostly found along the upper portions of Narragansett Bay and its tidal tributaries. Fringe marsh
habitat is vulnerable to coastal development and the use of “hard” materials like concrete, metal, and
stone to protect eroding shorelines. Over 30% of Rhode Island’s coastal shoreline has been displaced by
hard materials (Freedman 2012).
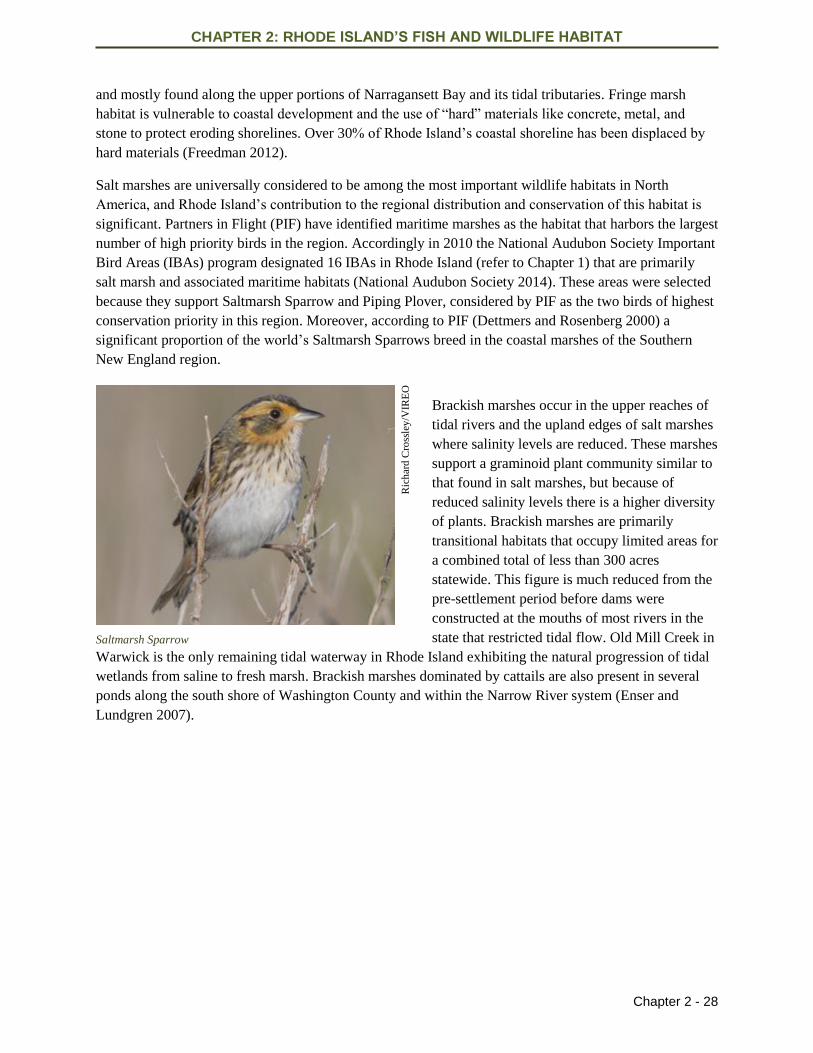
Salt marshes are universally considered to be among the most important wildlife habitats in North
America, and Rhode Island’s contribution to the regional distribution and conservation of this habitat is
significant. Partners in Flight (PIF) have identified maritime marshes as the habitat that harbors the largest
number of high priority birds in the region. Accordingly in 2010 the National Audubon Society Important
Bird Areas (IBAs) program designated 16 IBAs in Rhode Island (refer to Chapter 1) that are primarily
salt marsh and associated maritime habitats (National Audubon Society 2014). These areas were selected
because they support Saltmarsh Sparrow and Piping Plover, considered by PIF as the two birds of highest
conservation priority in this region. Moreover, according to PIF (Dettmers and Rosenberg 2000) a
significant proportion of the world’s Saltmarsh Sparrows breed in the coastal marshes of the Southern
New England region.
Brackish marshes occur in the upper reaches of
tidal rivers and the upland edges of salt marshes
where salinity levels are reduced. These marshes
support a graminoid plant community similar to
that found in salt marshes, but because of
reduced salinity levels there is a higher diversity
of plants. Brackish marshes are primarily
transitional habitats that occupy limited areas for
a combined total of less than 300 acres
statewide. This figure is much reduced from the
pre-settlement period before dams were
constructed at the mouths of most rivers in the
state that restricted tidal flow. Old Mill Creek in
Warwick is the only remaining tidal waterway in Rhode Island exhibiting the natural progression of tidal
wetlands from saline to fresh marsh. Brackish marshes dominated by cattails are also present in several
ponds along the south shore of Washington County and within the Narrow River system (Enser and
Lundgren 2007).
Ric
har
d C
ross
ley
/VIR
EO
Saltmarsh Sparrow
CHAPTER 2: RHODE ISLAND’S FISH AND WILDLIFE HABITAT
Chapter 2 - 29
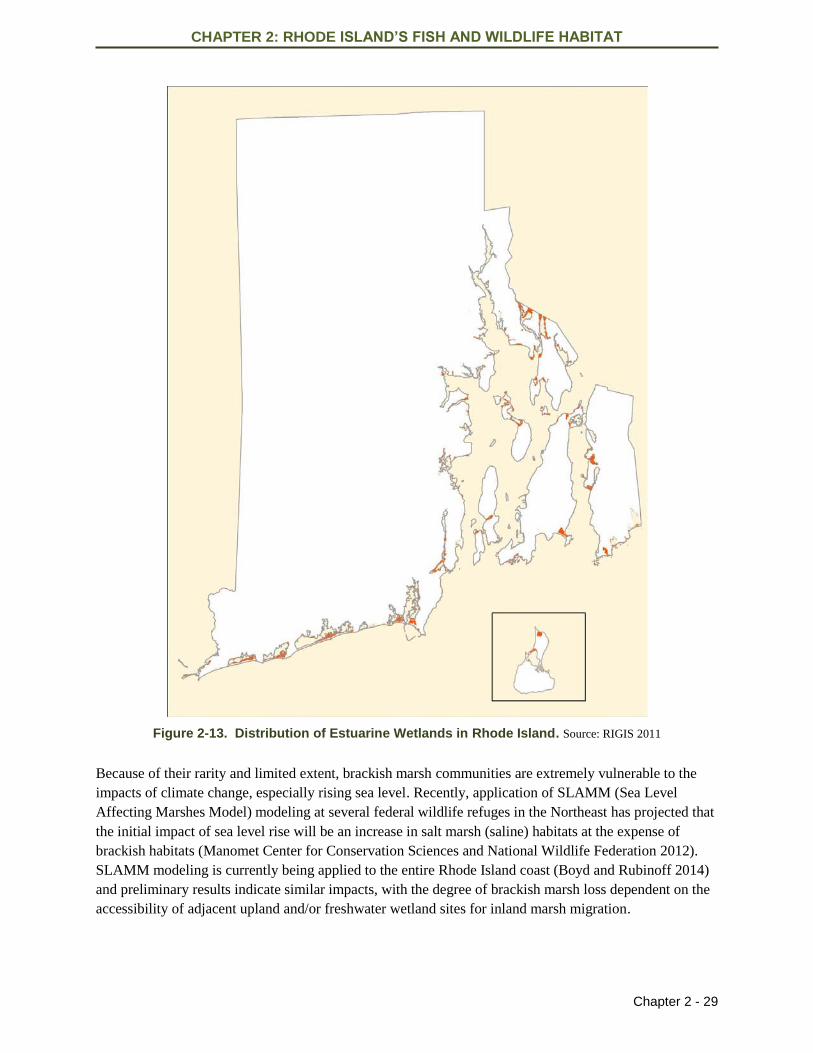
Figure 2-13. Distribution of Estuarine Wetlands in Rhode Island. Source: RIGIS 2011
Because of their rarity and limited extent, brackish marsh communities are extremely vulnerable to the
impacts of climate change, especially rising sea level. Recently, application of SLAMM (Sea Level
Affecting Marshes Model) modeling at several federal wildlife refuges in the Northeast has projected that
the initial impact of sea level rise will be an increase in salt marsh (saline) habitats at the expense of
brackish habitats (Manomet Center for Conservation Sciences and National Wildlife Federation 2012).
SLAMM modeling is currently being applied to the entire Rhode Island coast (Boyd and Rubinoff 2014)
and preliminary results indicate similar impacts, with the degree of brackish marsh loss dependent on the
accessibility of adjacent upland and/or freshwater wetland sites for inland marsh migration.
CHAPTER 2: RHODE ISLAND’S FISH AND WILDLIFE HABITAT
Chapter 2 - 30
More than 50% (approximately 4,000 acres) of the estuarine marshes present in Rhode Island at the time
of European settlement have been lost (Cowardin et al. 1979), primarily by draining or filling to provide
sites for coastal development, including docks, marinas, petroleum storage facilities, industrial parks,
junkyards, and landfills. Moreover, most currently existing estuarine marshes have been ditched and
sprayed for mosquito control. These impacts have been reduced or eliminated to varying degrees, but
estuarine habitats face a newer threat. Climate change vulnerability assessments, including those prepared
by the Manomet (Manomet Center for Conservation Sciences and National Wildlife Federation 2012),
consistently identify brackish marshes as the most vulnerable to the impacts of climate change, especially
rising sea level.
Subtidal estuarine aquatic Eelgrass beds are also a valuable habitat in Rhode Island. Eelgrass plays a
crucial role in the health of coastal systems because it provides critical habitat for juvenile marine life,
helps stabilize sediments, and aids in filtering particles from the water column. In 2006 and 2007, more
than 400 acres of Eelgrass were mapped in Narragansett Bay, a significant increase compared to the
approximately 100 acres mapped in 1996. However, it was also noted that although Eelgrass cover had
increased during the past 10 years in Narragansett Bay, the acreage was still an order of magnitude less
than the 6,000 acres of Eelgrass found in Buzzards Bay, Massachusetts, an estuary of comparable size to
Narragansett Bay (Bradley, Raposa, and Tuxbury 2007). In 2012, a survey of all submerged aquatic
vegetation (SAV) in Rhode Island coastal waters calculated a 23.6% increase in Eelgrass acreage in
Narragansett Bay, from 408 acres to 504.2 acres. This survey found that most SAV in the survey area
(89.4%) was Eelgrass, with an additional 146.5 acres of Widgeon Grass found in Greenwich Bay,
Ninigret and Green Hill Ponds, and Briggs Marsh in Little Compton (Bradley et al. 2012).
The major causes of impairment in coastal and estuarine waters of Rhode Island are bacterial
contamination and nutrient enrichment. Marine and estuarine waters are exhibiting an increased array of
nutrient-associated symptoms, including low dissolved oxygen levels, fish kills, Eelgrass loss, macroalgae
blooms, and a gradual shift in the dominant fish communities from benthic (i.e., bottom-dwelling) to
pelagic (i.e., water column-dwelling) species (RI DEM 2003). The major sources of bacterial
contamination are combined sewer overflows (CSOs) in certain locations, including the Upper Bay and
Newport Harbor, and storm water discharges. Discharges from wastewater treatment facilities, CSOs,
failing on-site wastewater systems, and urban runoff are the major sources of nutrient enrichment, which
is integral to low dissolved oxygen problems in the estuarine portions of the Providence and Seekonk
Rivers (RI DEM OWR 2012).
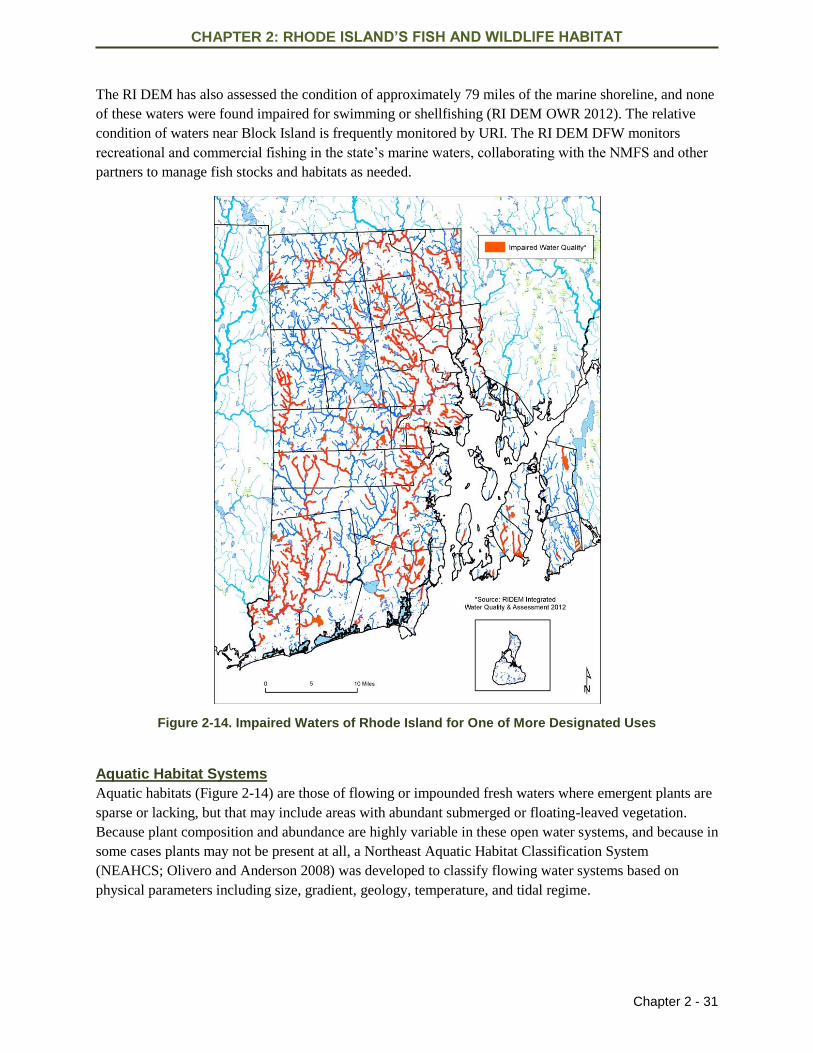
RI DEM OWR evaluates the capability of estuarine habitats to support their designated human-uses, and
the most recent evaluation of nearly 100% of these habitats (158.96 sq. miles) was conducted in 2012.
This evaluation determined that approximately 36% (56.97 sq. miles) of the total estuarine habitats are
fully supporting all of their designated uses. Approximately 35% (56.26 sq. miles) are impaired for one or
more of their designated uses (Figure 2-14), and 31.5% (50 sq. miles) have an impairment requiring Total
Maximum Daily Load (TMDL) development. TMDL development are caps on the amounts of pollutants
that waterbodies can receive and still meet water quality standards, and they are required by EPA for
waters classified as impaired under the Clean Water Act. Data show that 54% (59.16 sq. miles) of the
estuarine square miles assessed for aquatic life use are fully supporting that use; 76% (100 sq. miles) of
the waters designated and assessed for shellfish consumption are fully supporting the use; and, 100% of
the estuarine square miles assessed for fish consumption are considered to be fully supporting that use (RI
DEM OWR 2012).
CHAPTER 2: RHODE ISLAND’S FISH AND WILDLIFE HABITAT
Chapter 2 - 31
The RI DEM has also assessed the condition of approximately 79 miles of the marine shoreline, and none
of these waters were found impaired for swimming or shellfishing (RI DEM OWR 2012). The relative
condition of waters near Block Island is frequently monitored by URI. The RI DEM DFW monitors
recreational and commercial fishing in the state’s marine waters, collaborating with the NMFS and other
partners to manage fish stocks and habitats as needed.
Figure 2-14. Impaired Waters of Rhode Island for One of More Designated Uses
Aquatic Habitat Systems
Aquatic habitats (Figure 2-14) are those of flowing or impounded fresh waters where emergent plants are
sparse or lacking, but that may include areas with abundant submerged or floating-leaved vegetation.
Because plant composition and abundance are highly variable in these open water systems, and because in
some cases plants may not be present at all, a Northeast Aquatic Habitat Classification System
(NEAHCS; Olivero and Anderson 2008) was developed to classify flowing water systems based on
physical parameters including size, gradient, geology, temperature, and tidal regime.
CHAPTER 2: RHODE ISLAND’S FISH AND WILDLIFE HABITAT
Chapter 2 - 32
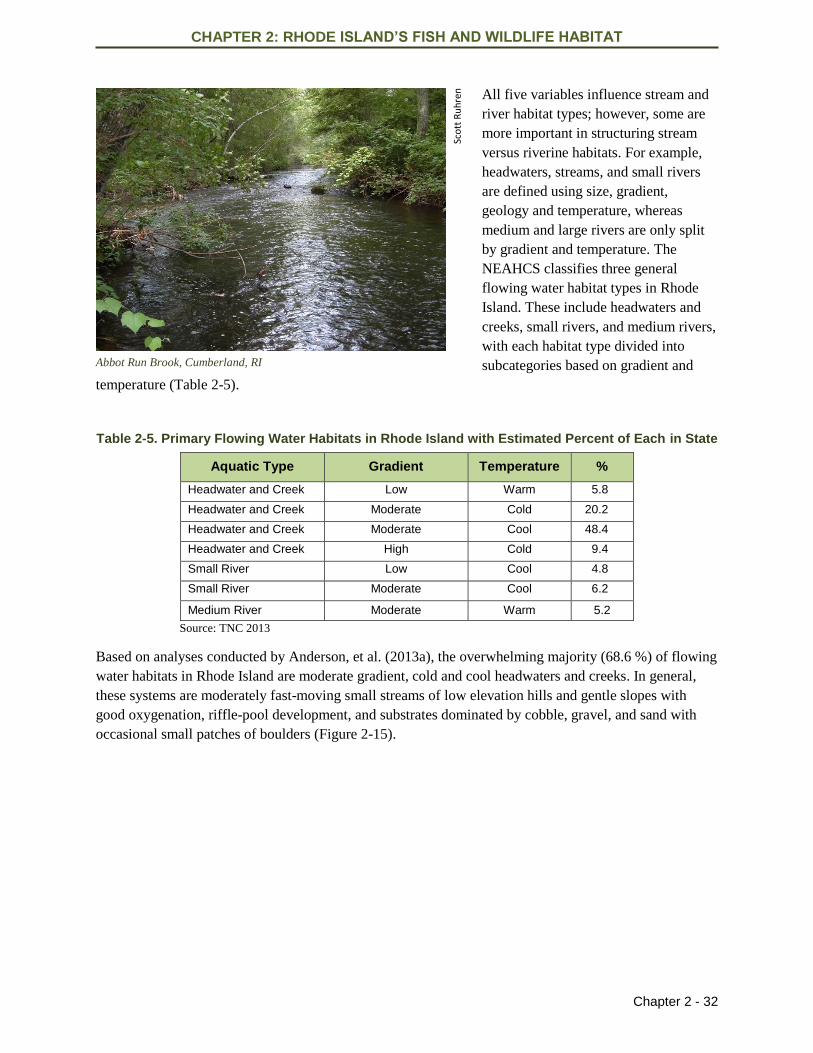
All five variables influence stream and
river habitat types; however, some are
more important in structuring stream
versus riverine habitats. For example,
headwaters, streams, and small rivers
are defined using size, gradient,
geology and temperature, whereas
medium and large rivers are only split
by gradient and temperature. The
NEAHCS classifies three general
flowing water habitat types in Rhode
Island. These include headwaters and
creeks, small rivers, and medium rivers,
with each habitat type divided into
subcategories based on gradient and
temperature (Table 2-5).
Table 2-5. Primary Flowing Water Habitats in Rhode Island with Estimated Percent of Each in State
Aquatic Type Gradient Temperature %
Headwater and Creek Low Warm 5.8
Headwater and Creek Moderate Cold 20.2
Headwater and Creek Moderate Cool 48.4
Headwater and Creek High Cold 9.4
Small River Low Cool 4.8
Small River Moderate Cool 6.2
Medium River Moderate Warm 5.2
Source: TNC 2013
Based on analyses conducted by Anderson, et al. (2013a), the overwhelming majority (68.6 %) of flowing
water habitats in Rhode Island are moderate gradient, cold and cool headwaters and creeks. In general,
these systems are moderately fast-moving small streams of low elevation hills and gentle slopes with
good oxygenation, riffle-pool development, and substrates dominated by cobble, gravel, and sand with
occasional small patches of boulders (Figure 2-15).
Sco
tt R
uh
ren
Abbot Run Brook, Cumberland, RI
CHAPTER 2: RHODE ISLAND’S FISH AND WILDLIFE HABITAT
Chapter 2 - 33
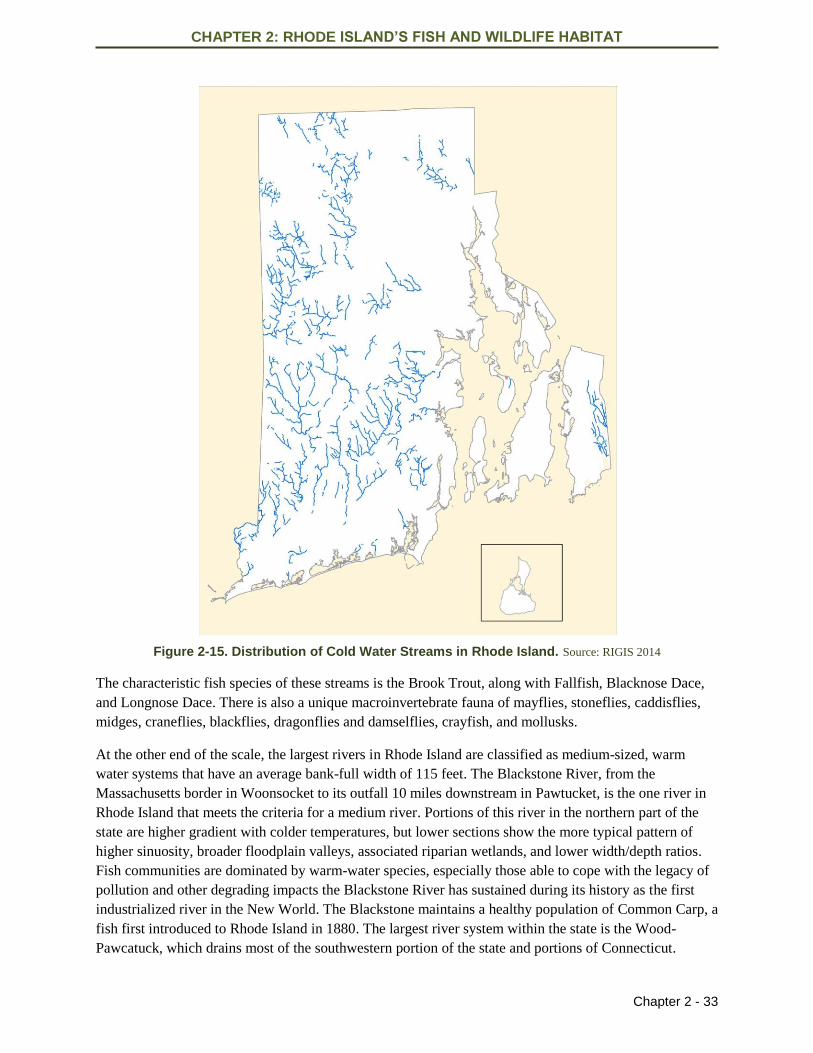
Figure 2-15. Distribution of Cold Water Streams in Rhode Island. Source: RIGIS 2014
The characteristic fish species of these streams is the Brook Trout, along with Fallfish, Blacknose Dace,
and Longnose Dace. There is also a unique macroinvertebrate fauna of mayflies, stoneflies, caddisflies,
midges, craneflies, blackflies, dragonflies and damselflies, crayfish, and mollusks.
At the other end of the scale, the largest rivers in Rhode Island are classified as medium-sized, warm
water systems that have an average bank-full width of 115 feet. The Blackstone River, from the
Massachusetts border in Woonsocket to its outfall 10 miles downstream in Pawtucket, is the one river in
Rhode Island that meets the criteria for a medium river. Portions of this river in the northern part of the
state are higher gradient with colder temperatures, but lower sections show the more typical pattern of
higher sinuosity, broader floodplain valleys, associated riparian wetlands, and lower width/depth ratios.
Fish communities are dominated by warm-water species, especially those able to cope with the legacy of
pollution and other degrading impacts the Blackstone River has sustained during its history as the first
industrialized river in the New World. The Blackstone maintains a healthy population of Common Carp, a
fish first introduced to Rhode Island in 1880. The largest river system within the state is the Wood-
Pawcatuck, which drains most of the southwestern portion of the state and portions of Connecticut.
CHAPTER 2: RHODE ISLAND’S FISH AND WILDLIFE HABITAT
Chapter 2 - 34
There are 1,420 river miles in Rhode Island of which 882 miles (62%) were monitored in 2012 to assess
their condition and ability to support aquatic life, fish consumption, water supply, and recreational uses.
Overall, the majority (69%) of the miles assessed were found to fully support aquatic life; however,
approximately 31% are considered to be impaired (Figure 2-18; RI DEM OWR 2012).
Pathogens are the major cause of impairment, originating from point and non-point sources such as CSOs,
seepage from failing septic systems, runoff during storm events, and agriculture, as well as from natural
sources (e.g., waterfowl). Other significant causes of impairment include biodiversity impacts (i.e.,
impairment of the biological community on wadeable streams). These appear to be mostly due to
nonpoint sources of pollution such as runoff (RI DEM OWR 2012).
As the RI DEM OWR Aquatic Invasive Species program has expanded monitoring efforts, invasive
plants have been found to be a management issue in rivers and streams (see Chapter 3). Another noted
cause of non-support is from low levels of metals that arrive in aquatic systems from a variety of sources
including permitted industrial and municipal discharges, CSOs, and storm drains. Another potential
source of low level metals, one that is not routinely evaluated and characterized, is contaminated
sediments. Non-point sources such as urban runoff and sources from outside the state’s borders are also
significant contributors of metals in Rhode Island’s rivers (RI DEM OWR 2012).
Lakes and Ponds
The ecological communities of open water bodies are defined by physical characteristics including size,
depth, and nutrient levels. Oligotrophic lakes and ponds are generally low in nutrients, well-oxygenated,
and deep enough to undergo thermal stratification during the summer and winter. Only a few water bodies
in Rhode Island exhibit these characteristics, the best examples being Wallum Lake in Burrillville and
Beach Pond in Exeter. The majority of Rhode Island’s ponds are eutrophic systems that are nutrient-rich
and too shallow to undergo thermal stratification. Water clarity is usually reduced due to algae
accumulation, and bottom sediments are mucky.
There are 20,749 acres of lakes and ponds in Rhode Island, and 70% are 50 acres or less. Only four
exceed 500 acres: Watchaug Pond, Flat River Reservoir (Johnson’s Pond), Worden Pond, and the largest,
Scituate Reservoir, which at more than 13,000 acres supplies water to nearly half of the state’s population
(RI DEM OWR 2014).
The RI DEM OWR also assesses the water quality and aquatic health of the state’s lakes and ponds. In
2012, this assessment covered 91% of the state’s lake and pond acreage, with about 55% (8,454.78 acres)
considered to be impaired for one or more of their designated uses. Major causes of non-support are high
bacteria and nutrient levels, mainly from non-point sources such as urban and storm-water runoff. Internal
nutrient recycling, waterfowl, wildlife, agriculture, and septic systems are suspected sources of non-
support in lakes. Another major cause of non-support, in terms of total acreage affected, is from the
incursion of metals. This major cause of impairment is largely associated with elevated levels of mercury
found in fish tissue (RI DEM OWR 2012).
The largest cause of impairment to lakes and ponds in Rhode Island is due to the presence of aquatic
invasive species. Documentation of this problem has been developed through seasonal surveys and
coordinated reporting among RI DEM, URI Watershed Watch and the Rhode Island Natural History
Survey. The resulting data allows a better characterization of the extent of aquatic invasive plants in
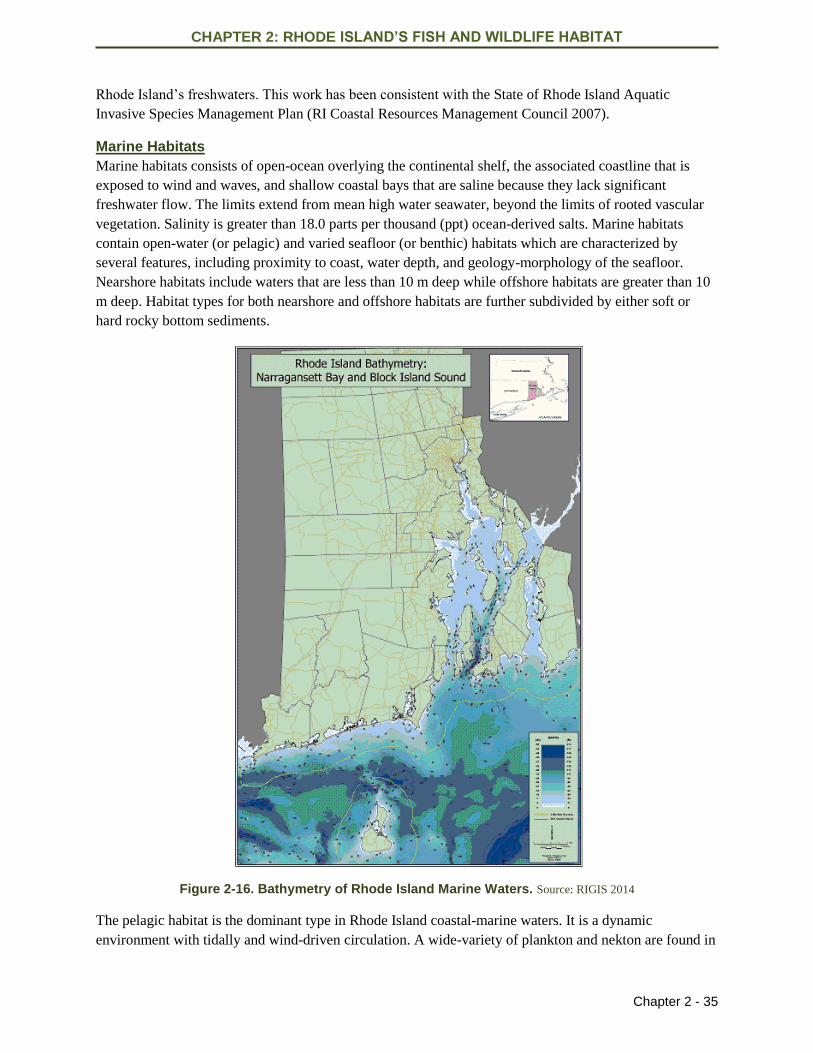
CHAPTER 2: RHODE ISLAND’S FISH AND WILDLIFE HABITAT
Chapter 2 - 35
Rhode Island’s freshwaters. This work has been consistent with the State of Rhode Island Aquatic
Invasive Species Management Plan (RI Coastal Resources Management Council 2007).
Marine Habitats
Marine habitats consists of open-ocean overlying the continental shelf, the associated coastline that is
exposed to wind and waves, and shallow coastal bays that are saline because they lack significant
freshwater flow. The limits extend from mean high water seawater, beyond the limits of rooted vascular
vegetation. Salinity is greater than 18.0 parts per thousand (ppt) ocean-derived salts. Marine habitats
contain open-water (or pelagic) and varied seafloor (or benthic) habitats which are characterized by
several features, including proximity to coast, water depth, and geology-morphology of the seafloor.
Nearshore habitats include waters that are less than 10 m deep while offshore habitats are greater than 10
m deep. Habitat types for both nearshore and offshore habitats are further subdivided by either soft or
hard rocky bottom sediments.
Figure 2-16. Bathymetry of Rhode Island Marine Waters. Source: RIGIS 2014
The pelagic habitat is the dominant type in Rhode Island coastal-marine waters. It is a dynamic
environment with tidally and wind-driven circulation. A wide-variety of plankton and nekton are found in
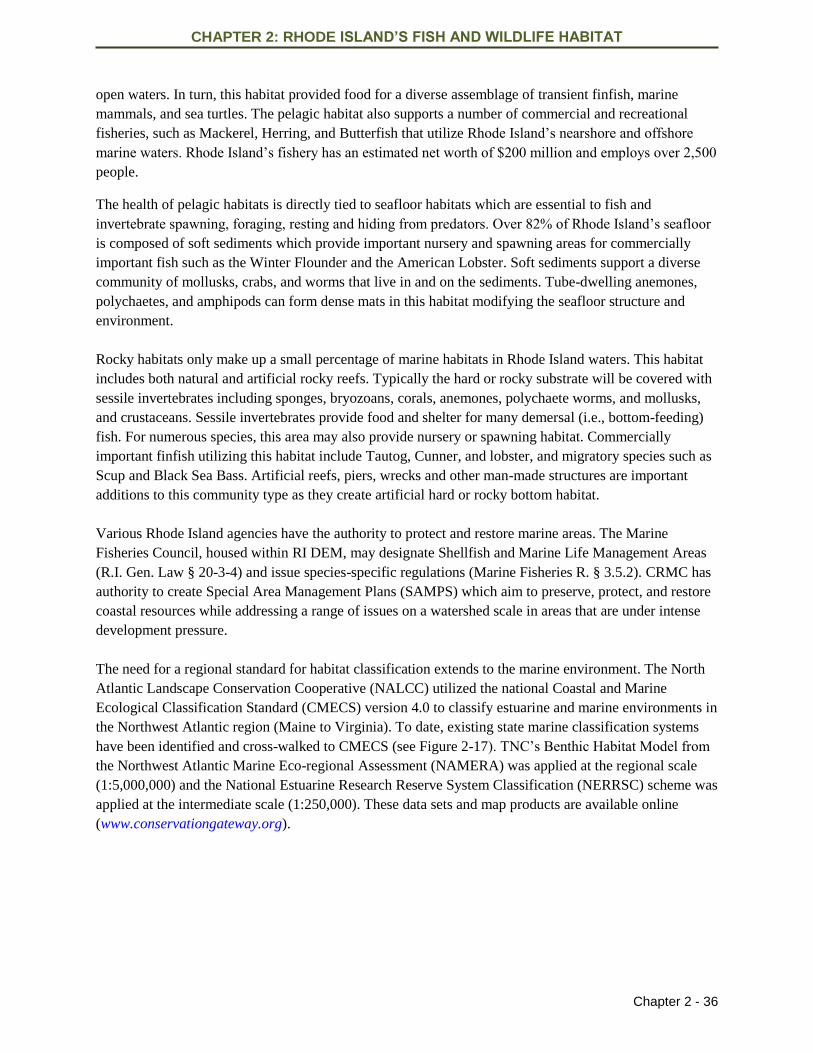
CHAPTER 2: RHODE ISLAND’S FISH AND WILDLIFE HABITAT
Chapter 2 - 36
open waters. In turn, this habitat provided food for a diverse assemblage of transient finfish, marine
mammals, and sea turtles. The pelagic habitat also supports a number of commercial and recreational
fisheries, such as Mackerel, Herring, and Butterfish that utilize Rhode Island’s nearshore and offshore
marine waters. Rhode Island’s fishery has an estimated net worth of $200 million and employs over 2,500
people.
The health of pelagic habitats is directly tied to seafloor habitats which are essential to fish and
invertebrate spawning, foraging, resting and hiding from predators. Over 82% of Rhode Island’s seafloor
is composed of soft sediments which provide important nursery and spawning areas for commercially
important fish such as the Winter Flounder and the American Lobster. Soft sediments support a diverse
community of mollusks, crabs, and worms that live in and on the sediments. Tube-dwelling anemones,
polychaetes, and amphipods can form dense mats in this habitat modifying the seafloor structure and
environment.
Rocky habitats only make up a small percentage of marine habitats in Rhode Island waters. This habitat
includes both natural and artificial rocky reefs. Typically the hard or rocky substrate will be covered with
sessile invertebrates including sponges, bryozoans, corals, anemones, polychaete worms, and mollusks,
and crustaceans. Sessile invertebrates provide food and shelter for many demersal (i.e., bottom-feeding)
fish. For numerous species, this area may also provide nursery or spawning habitat. Commercially
important finfish utilizing this habitat include Tautog, Cunner, and lobster, and migratory species such as
Scup and Black Sea Bass. Artificial reefs, piers, wrecks and other man-made structures are important
additions to this community type as they create artificial hard or rocky bottom habitat.
Various Rhode Island agencies have the authority to protect and restore marine areas. The Marine
Fisheries Council, housed within RI DEM, may designate Shellfish and Marine Life Management Areas
(R.I. Gen. Law § 20-3-4) and issue species-specific regulations (Marine Fisheries R. § 3.5.2). CRMC has
authority to create Special Area Management Plans (SAMPS) which aim to preserve, protect, and restore
coastal resources while addressing a range of issues on a watershed scale in areas that are under intense
development pressure.
The need for a regional standard for habitat classification extends to the marine environment. The North
Atlantic Landscape Conservation Cooperative (NALCC) utilized the national Coastal and Marine
Ecological Classification Standard (CMECS) version 4.0 to classify estuarine and marine environments in
the Northwest Atlantic region (Maine to Virginia). To date, existing state marine classification systems
have been identified and cross-walked to CMECS (see Figure 2-17). TNC’s Benthic Habitat Model from
the Northwest Atlantic Marine Eco-regional Assessment (NAMERA) was applied at the regional scale
(1:5,000,000) and the National Estuarine Research Reserve System Classification (NERRSC) scheme was
applied at the intermediate scale (1:250,000). These data sets and map products are available online
(www.conservationgateway.org).
CHAPTER 2: RHODE ISLAND’S FISH AND WILDLIFE HABITAT
Chapter 2 - 37
Figure 2-17. Rhode Island’s Marine Habitats. Source: The Nature Conservancy, Rhode Island Chapter
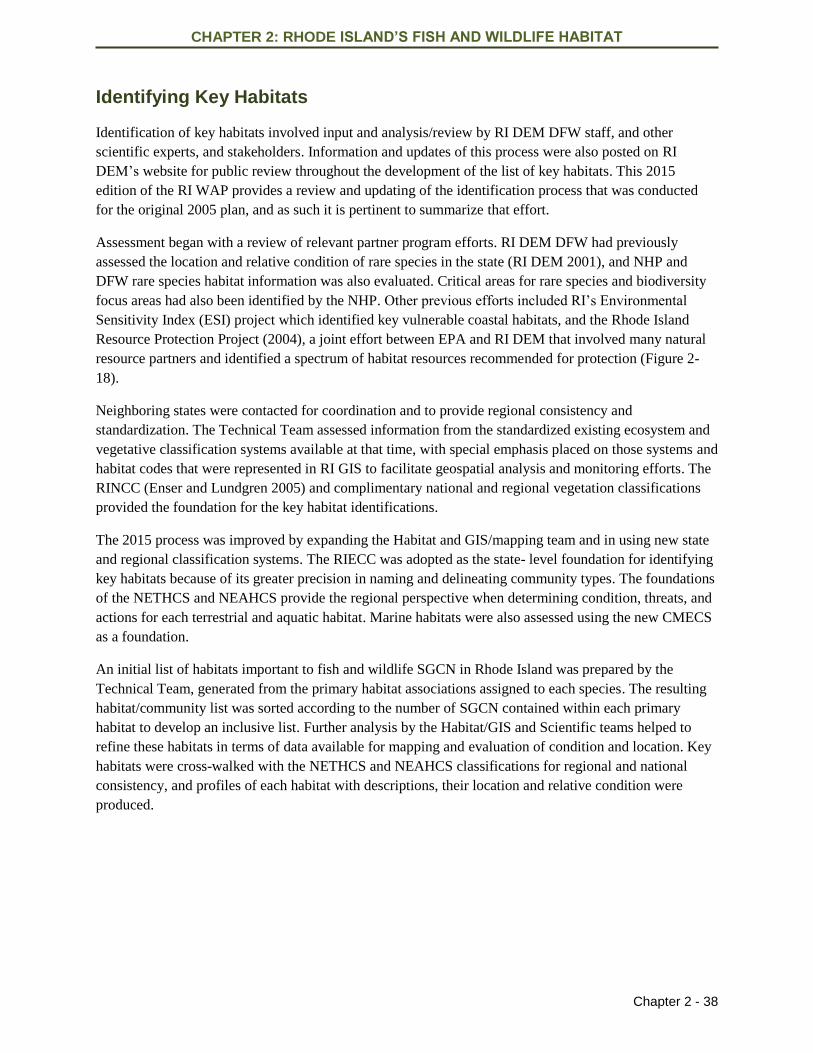
CHAPTER 2: RHODE ISLAND’S FISH AND WILDLIFE HABITAT
Chapter 2 - 38
Identifying Key Habitats
Identification of key habitats involved input and analysis/review by RI DEM DFW staff, and other
scientific experts, and stakeholders. Information and updates of this process were also posted on RI
DEM’s website for public review throughout the development of the list of key habitats. This 2015
edition of the RI WAP provides a review and updating of the identification process that was conducted
for the original 2005 plan, and as such it is pertinent to summarize that effort.
Assessment began with a review of relevant partner program efforts. RI DEM DFW had previously
assessed the location and relative condition of rare species in the state (RI DEM 2001), and NHP and
DFW rare species habitat information was also evaluated. Critical areas for rare species and biodiversity
focus areas had also been identified by the NHP. Other previous efforts included RI’s Environmental
Sensitivity Index (ESI) project which identified key vulnerable coastal habitats, and the Rhode Island
Resource Protection Project (2004), a joint effort between EPA and RI DEM that involved many natural
resource partners and identified a spectrum of habitat resources recommended for protection (Figure 2-
18).
Neighboring states were contacted for coordination and to provide regional consistency and
standardization. The Technical Team assessed information from the standardized existing ecosystem and
vegetative classification systems available at that time, with special emphasis placed on those systems and
habitat codes that were represented in RI GIS to facilitate geospatial analysis and monitoring efforts. The
RINCC (Enser and Lundgren 2005) and complimentary national and regional vegetation classifications
provided the foundation for the key habitat identifications.
The 2015 process was improved by expanding the Habitat and GIS/mapping team and in using new state
and regional classification systems. The RIECC was adopted as the state- level foundation for identifying
key habitats because of its greater precision in naming and delineating community types. The foundations
of the NETHCS and NEAHCS provide the regional perspective when determining condition, threats, and
actions for each terrestrial and aquatic habitat. Marine habitats were also assessed using the new CMECS
as a foundation.
An initial list of habitats important to fish and wildlife SGCN in Rhode Island was prepared by the
Technical Team, generated from the primary habitat associations assigned to each species. The resulting
habitat/community list was sorted according to the number of SGCN contained within each primary
habitat to develop an inclusive list. Further analysis by the Habitat/GIS and Scientific teams helped to
refine these habitats in terms of data available for mapping and evaluation of condition and location. Key
habitats were cross-walked with the NETHCS and NEAHCS classifications for regional and national
consistency, and profiles of each habitat with descriptions, their location and relative condition were
produced.
CHAPTER 2: RHODE ISLAND’S FISH AND WILDLIFE HABITAT
Chapter 2 - 39
Figure 2-18. Habitat Resources Identified by the Rhode Island Resource Protection Project.
Source: RI RPP 2004
This process resulted in the identification of 84 key habitats (Table 2-6), a number that is 18% higher than
the 58 key habitats identified in the 2005 Plan. The increase is due to recognition of the diversity among
habitats provided through improved methods of classification and delineation in both the field and
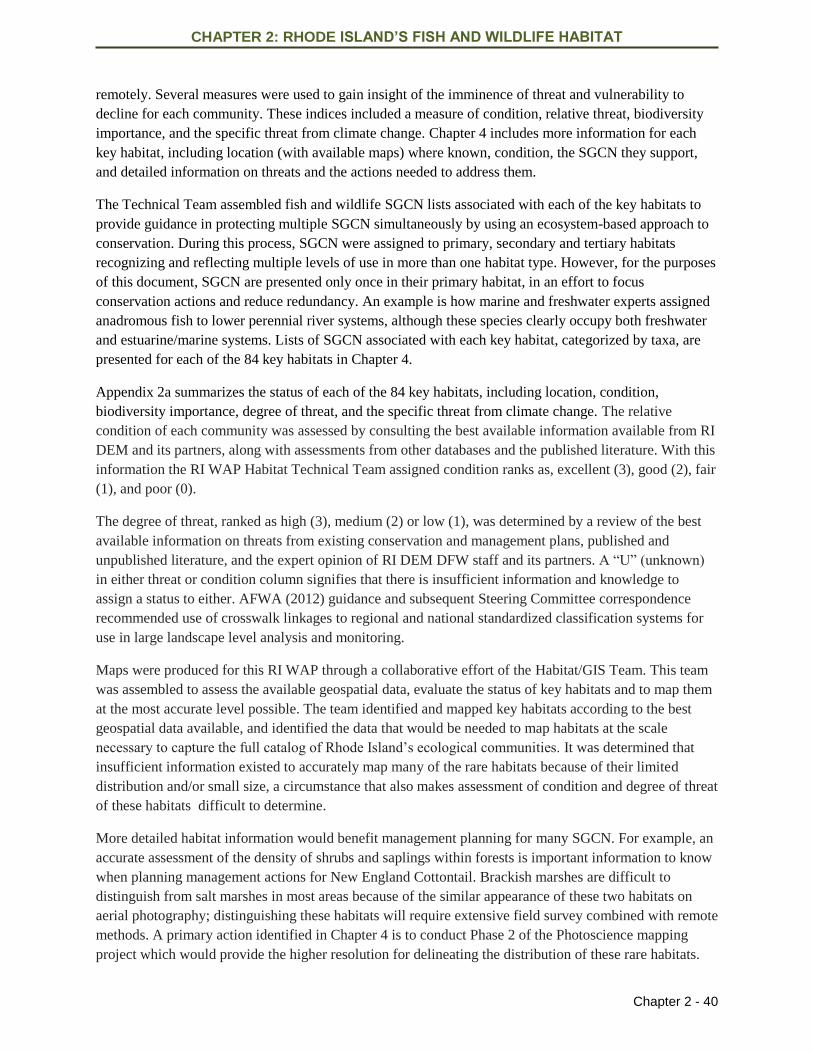
CHAPTER 2: RHODE ISLAND’S FISH AND WILDLIFE HABITAT
Chapter 2 - 40
remotely. Several measures were used to gain insight of the imminence of threat and vulnerability to
decline for each community. These indices included a measure of condition, relative threat, biodiversity
importance, and the specific threat from climate change. Chapter 4 includes more information for each
key habitat, including location (with available maps) where known, condition, the SGCN they support,
and detailed information on threats and the actions needed to address them.
The Technical Team assembled fish and wildlife SGCN lists associated with each of the key habitats to
provide guidance in protecting multiple SGCN simultaneously by using an ecosystem-based approach to
conservation. During this process, SGCN were assigned to primary, secondary and tertiary habitats
recognizing and reflecting multiple levels of use in more than one habitat type. However, for the purposes
of this document, SGCN are presented only once in their primary habitat, in an effort to focus
conservation actions and reduce redundancy. An example is how marine and freshwater experts assigned
anadromous fish to lower perennial river systems, although these species clearly occupy both freshwater
and estuarine/marine systems. Lists of SGCN associated with each key habitat, categorized by taxa, are
presented for each of the 84 key habitats in Chapter 4.
Appendix 2a summarizes the status of each of the 84 key habitats, including location, condition,
biodiversity importance, degree of threat, and the specific threat from climate change. The relative
condition of each community was assessed by consulting the best available information available from RI
DEM and its partners, along with assessments from other databases and the published literature. With this
information the RI WAP Habitat Technical Team assigned condition ranks as, excellent (3), good (2), fair
(1), and poor (0).
The degree of threat, ranked as high (3), medium (2) or low (1), was determined by a review of the best
available information on threats from existing conservation and management plans, published and
unpublished literature, and the expert opinion of RI DEM DFW staff and its partners. A “U” (unknown)
in either threat or condition column signifies that there is insufficient information and knowledge to
assign a status to either. AFWA (2012) guidance and subsequent Steering Committee correspondence
recommended use of crosswalk linkages to regional and national standardized classification systems for
use in large landscape level analysis and monitoring.
Maps were produced for this RI WAP through a collaborative effort of the Habitat/GIS Team. This team
was assembled to assess the available geospatial data, evaluate the status of key habitats and to map them
at the most accurate level possible. The team identified and mapped key habitats according to the best
geospatial data available, and identified the data that would be needed to map habitats at the scale
necessary to capture the full catalog of Rhode Island’s ecological communities. It was determined that
insufficient information existed to accurately map many of the rare habitats because of their limited
distribution and/or small size, a circumstance that also makes assessment of condition and degree of threat
of these habitats difficult to determine.
More detailed habitat information would benefit management planning for many SGCN. For example, an
accurate assessment of the density of shrubs and saplings within forests is important information to know
when planning management actions for New England Cottontail. Brackish marshes are difficult to
distinguish from salt marshes in most areas because of the similar appearance of these two habitats on
aerial photography; distinguishing these habitats will require extensive field survey combined with remote
methods. A primary action identified in Chapter 4 is to conduct Phase 2 of the Photoscience mapping
project which would provide the higher resolution for delineating the distribution of these rare habitats.
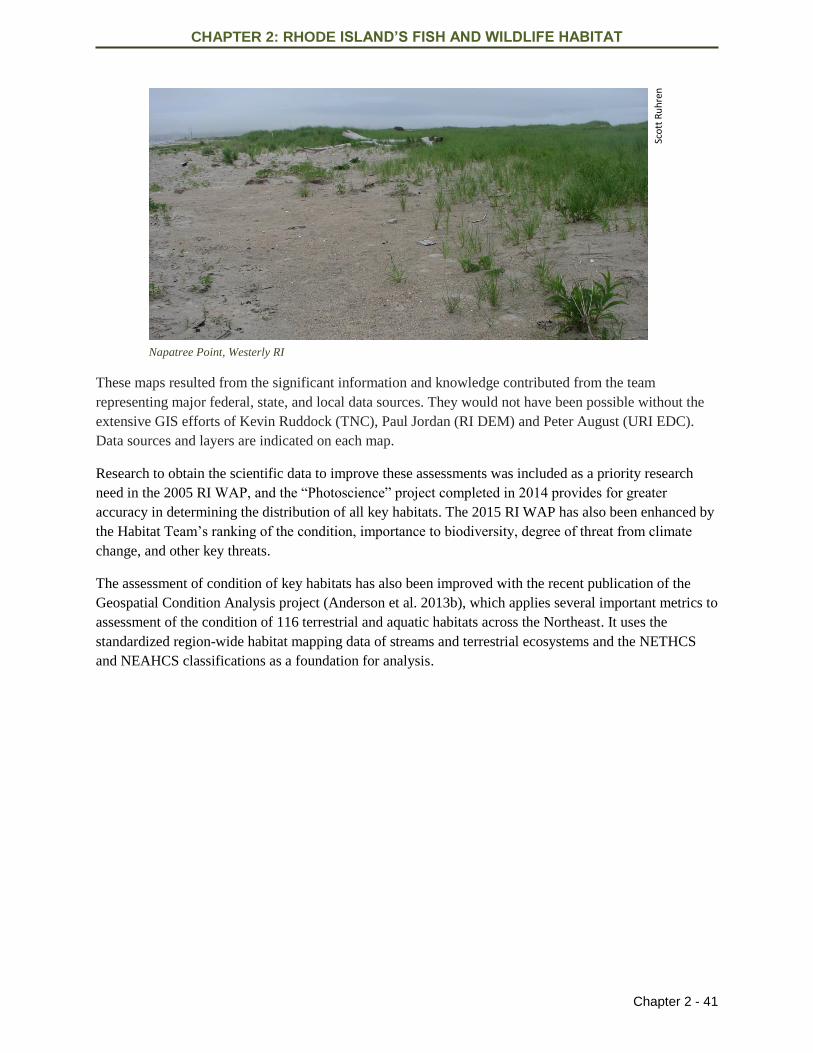
CHAPTER 2: RHODE ISLAND’S FISH AND WILDLIFE HABITAT
Chapter 2 - 41
Sco
tt R
uh
ren
Napatree Point, Westerly RI
These maps resulted from the significant information and knowledge contributed from the team
representing major federal, state, and local data sources. They would not have been possible without the
extensive GIS efforts of Kevin Ruddock (TNC), Paul Jordan (RI DEM) and Peter August (URI EDC).
Data sources and layers are indicated on each map.
Research to obtain the scientific data to improve these assessments was included as a priority research
need in the 2005 RI WAP, and the “Photoscience” project completed in 2014 provides for greater
accuracy in determining the distribution of all key habitats. The 2015 RI WAP has also been enhanced by
the Habitat Team’s ranking of the condition, importance to biodiversity, degree of threat from climate
change, and other key threats.
The assessment of condition of key habitats has also been improved with the recent publication of the
Geospatial Condition Analysis project (Anderson et al. 2013b), which applies several important metrics to
assessment of the condition of 116 terrestrial and aquatic habitats across the Northeast. It uses the
standardized region-wide habitat mapping data of streams and terrestrial ecosystems and the NETHCS
and NEAHCS classifications as a foundation for analysis.
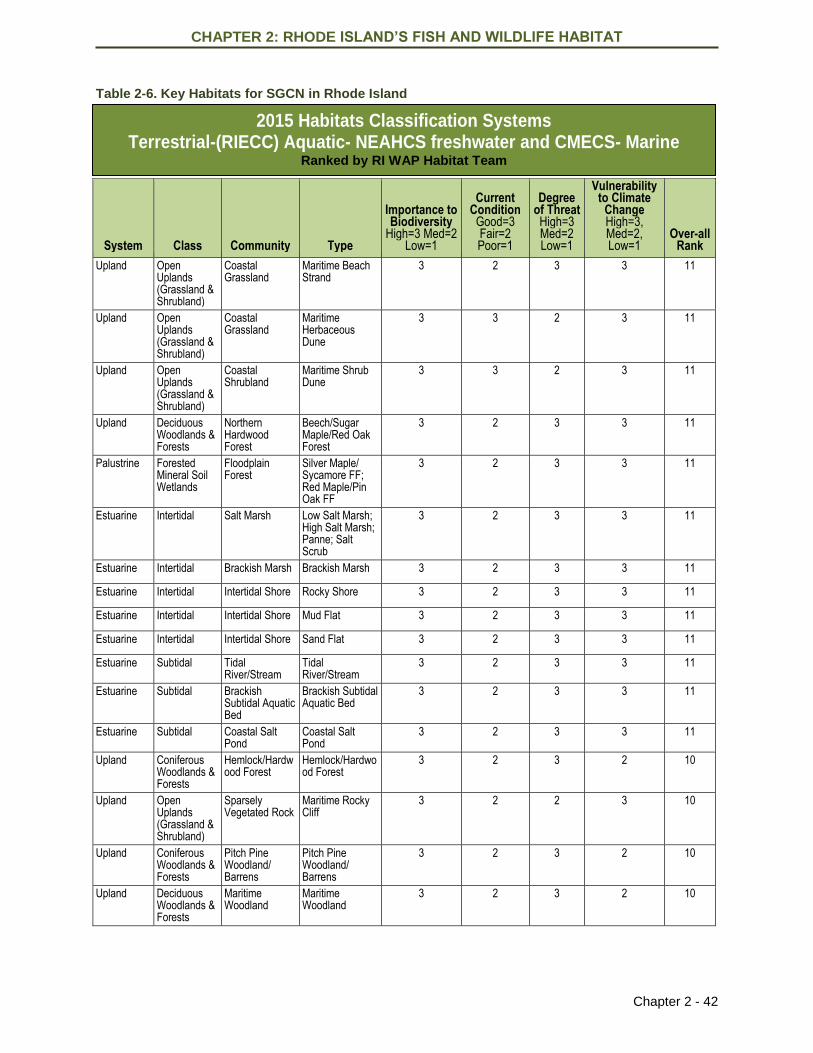
CHAPTER 2: RHODE ISLAND’S FISH AND WILDLIFE HABITAT
Chapter 2 - 42
Table 2-6. Key Habitats for SGCN in Rhode Island
System Class Community Type
Importance to Biodiversity
High=3 Med=2 Low=1
Current Condition
Good=3 Fair=2 Poor=1
Degree of Threat High=3 Med=2 Low=1
Vulnerability to Climate
Change High=3, Med=2, Low=1
Over-all Rank
Upland Open Uplands (Grassland & Shrubland)
Coastal Grassland
Maritime Beach Strand
3 2 3 3 11
Upland Open Uplands (Grassland & Shrubland)
Coastal Grassland
Maritime Herbaceous Dune
3 3 2 3 11
Upland Open Uplands (Grassland & Shrubland)
Coastal Shrubland
Maritime Shrub Dune
3 3 2 3 11
Upland Deciduous Woodlands & Forests
Northern Hardwood Forest
Beech/Sugar Maple/Red Oak Forest
3 2 3 3 11
Palustrine Forested Mineral Soil Wetlands
Floodplain Forest
Silver Maple/ Sycamore FF; Red Maple/Pin Oak FF
3 2 3 3 11
Estuarine Intertidal Salt Marsh Low Salt Marsh; High Salt Marsh; Panne; Salt Scrub
3 2 3 3 11
Estuarine Intertidal Brackish Marsh Brackish Marsh 3 2 3 3 11
Estuarine Intertidal Intertidal Shore Rocky Shore 3 2 3 3 11
Estuarine Intertidal Intertidal Shore Mud Flat 3 2 3 3 11
Estuarine Intertidal Intertidal Shore Sand Flat 3 2 3 3 11
Estuarine Subtidal Tidal River/Stream
Tidal River/Stream
3 2 3 3 11
Estuarine Subtidal Brackish Subtidal Aquatic Bed
Brackish Subtidal Aquatic Bed
3 2 3 3 11
Estuarine Subtidal Coastal Salt Pond
Coastal Salt Pond
3 2 3 3 11
Upland Coniferous Woodlands & Forests
Hemlock/Hardwood Forest
Hemlock/Hardwood Forest
3 2 3 2 10
Upland Open Uplands (Grassland & Shrubland)
Sparsely Vegetated Rock
Maritime Rocky Cliff
3 2 2 3 10
Upland Coniferous Woodlands & Forests
Pitch Pine Woodland/ Barrens
Pitch Pine Woodland/ Barrens
3 2 3 2 10
Upland Deciduous Woodlands & Forests
Maritime Woodland
Maritime Woodland
3 2 3 2 10
2015 Habitats Classification Systems Terrestrial-(RIECC) Aquatic- NEAHCS freshwater and CMECS- Marine
Ranked by RI WAP Habitat Team
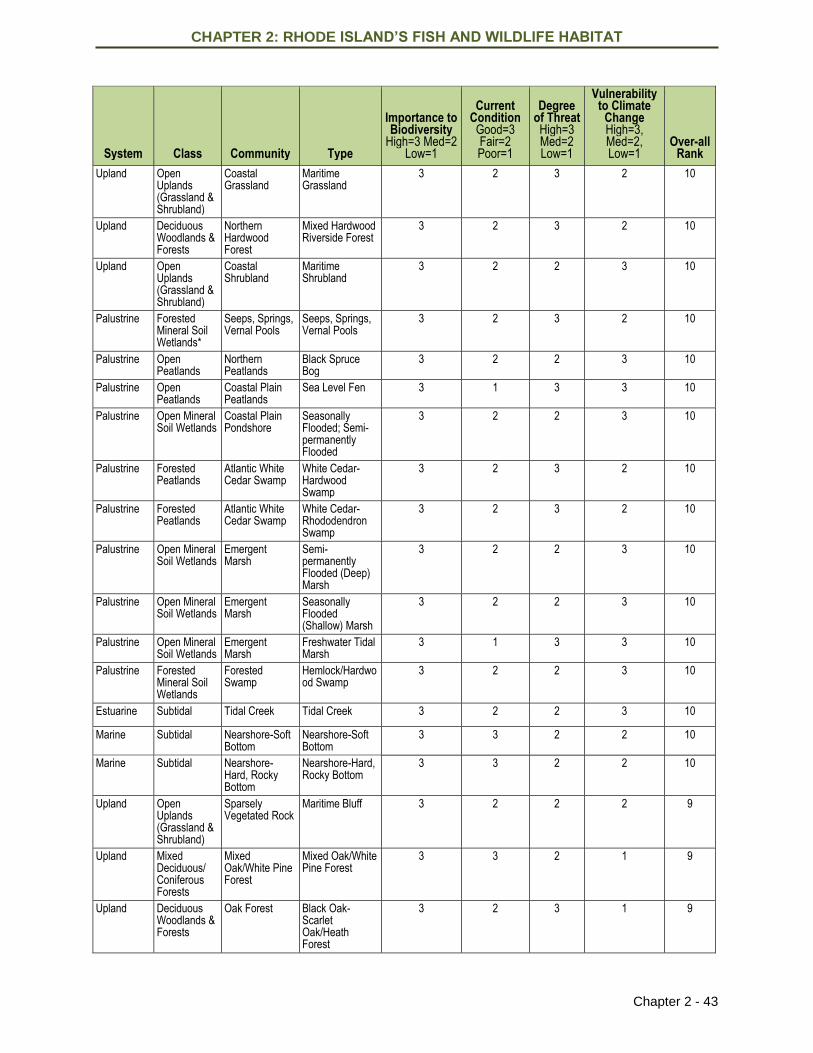
CHAPTER 2: RHODE ISLAND’S FISH AND WILDLIFE HABITAT
Chapter 2 - 43
System Class Community Type
Importance to Biodiversity
High=3 Med=2 Low=1
Current Condition
Good=3 Fair=2 Poor=1
Degree of Threat High=3 Med=2 Low=1
Vulnerability to Climate
Change High=3, Med=2, Low=1
Over-all Rank
Upland Open Uplands (Grassland & Shrubland)
Coastal Grassland
Maritime Grassland
3 2 3 2 10
Upland Deciduous Woodlands & Forests
Northern Hardwood Forest
Mixed Hardwood Riverside Forest
3 2 3 2 10
Upland Open Uplands (Grassland & Shrubland)
Coastal Shrubland
Maritime Shrubland
3 2 2 3 10
Palustrine Forested Mineral Soil Wetlands*
Seeps, Springs, Vernal Pools
Seeps, Springs, Vernal Pools
3 2 3 2 10
Palustrine Open Peatlands
Northern Peatlands
Black Spruce Bog
3 2 2 3 10
Palustrine Open Peatlands
Coastal Plain Peatlands
Sea Level Fen 3 1 3 3 10
Palustrine Open Mineral Soil Wetlands
Coastal Plain Pondshore
Seasonally Flooded; Semi-permanently Flooded
3 2 2 3 10
Palustrine Forested Peatlands
Atlantic White Cedar Swamp
White Cedar-Hardwood Swamp
3 2 3 2 10
Palustrine Forested Peatlands
Atlantic White Cedar Swamp
White Cedar-Rhododendron Swamp
3 2 3 2 10
Palustrine Open Mineral Soil Wetlands
Emergent Marsh
Semi-permanently Flooded (Deep) Marsh
3 2 2 3 10
Palustrine Open Mineral Soil Wetlands
Emergent Marsh
Seasonally Flooded (Shallow) Marsh
3 2 2 3 10
Palustrine Open Mineral Soil Wetlands
Emergent Marsh
Freshwater Tidal Marsh
3 1 3 3 10
Palustrine Forested Mineral Soil Wetlands
Forested Swamp
Hemlock/Hardwood Swamp
3 2 2 3 10
Estuarine Subtidal Tidal Creek Tidal Creek 3 2 2 3 10
Marine Subtidal Nearshore-Soft Bottom
Nearshore-Soft Bottom
3 3 2 2 10
Marine Subtidal Nearshore-Hard, Rocky Bottom
Nearshore-Hard, Rocky Bottom
3 3 2 2 10
Upland Open Uplands (Grassland & Shrubland)
Sparsely Vegetated Rock
Maritime Bluff 3 2 2 2 9
Upland Mixed Deciduous/ Coniferous Forests
Mixed Oak/White Pine Forest
Mixed Oak/White Pine Forest
3 3 2 1 9
Upland Deciduous Woodlands & Forests
Oak Forest Black Oak-Scarlet Oak/Heath Forest
3 2 3 1 9
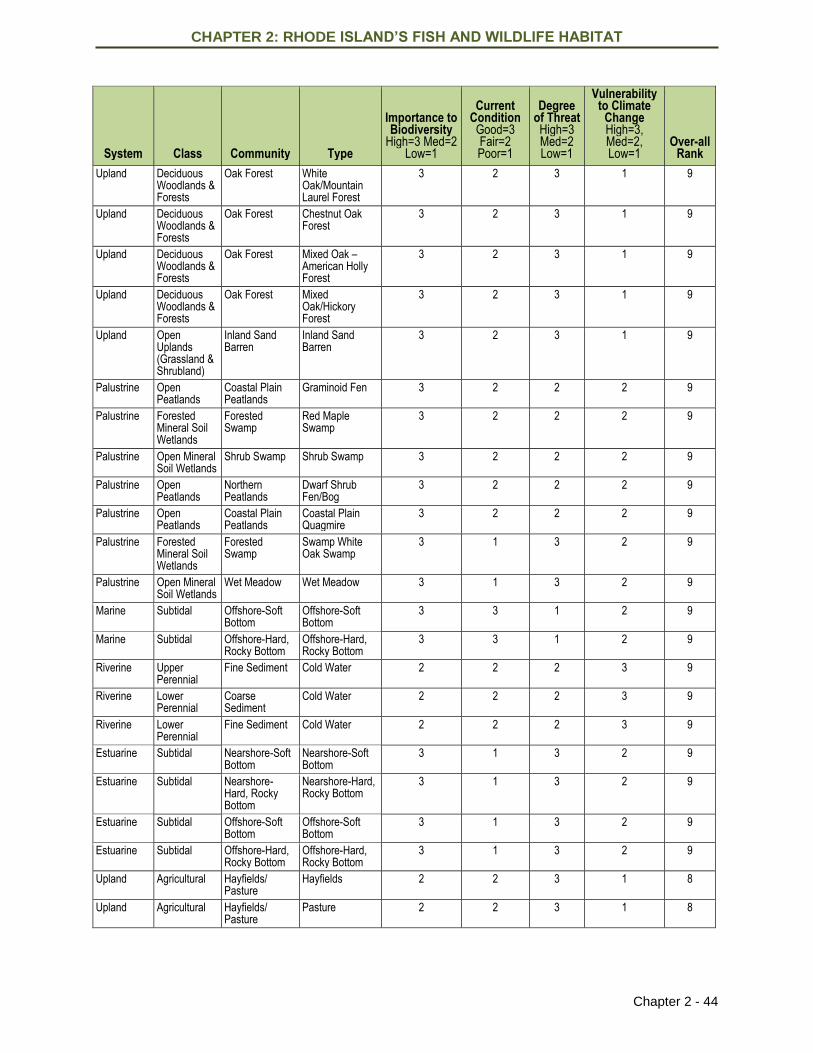
CHAPTER 2: RHODE ISLAND’S FISH AND WILDLIFE HABITAT
Chapter 2 - 44
System Class Community Type
Importance to Biodiversity
High=3 Med=2 Low=1
Current Condition
Good=3 Fair=2 Poor=1
Degree of Threat High=3 Med=2 Low=1
Vulnerability to Climate
Change High=3, Med=2, Low=1
Over-all Rank
Upland Deciduous Woodlands & Forests
Oak Forest White Oak/Mountain Laurel Forest
3 2 3 1 9
Upland Deciduous Woodlands & Forests
Oak Forest Chestnut Oak Forest
3 2 3 1 9
Upland Deciduous Woodlands & Forests
Oak Forest Mixed Oak – American Holly Forest
3 2 3 1 9
Upland Deciduous Woodlands & Forests
Oak Forest Mixed Oak/Hickory Forest
3 2 3 1 9
Upland Open Uplands (Grassland & Shrubland)
Inland Sand Barren
Inland Sand Barren
3 2 3 1 9
Palustrine Open Peatlands
Coastal Plain Peatlands
Graminoid Fen 3 2 2 2 9
Palustrine Forested Mineral Soil Wetlands
Forested Swamp
Red Maple Swamp
3 2 2 2 9
Palustrine Open Mineral Soil Wetlands
Shrub Swamp Shrub Swamp 3 2 2 2 9
Palustrine Open Peatlands
Northern Peatlands
Dwarf Shrub Fen/Bog
3 2 2 2 9
Palustrine Open Peatlands
Coastal Plain Peatlands
Coastal Plain Quagmire
3 2 2 2 9
Palustrine Forested Mineral Soil Wetlands
Forested Swamp
Swamp White Oak Swamp
3 1 3 2 9
Palustrine Open Mineral Soil Wetlands
Wet Meadow Wet Meadow 3 1 3 2 9
Marine Subtidal Offshore-Soft Bottom
Offshore-Soft Bottom
3 3 1 2 9
Marine Subtidal Offshore-Hard, Rocky Bottom
Offshore-Hard, Rocky Bottom
3 3 1 2 9
Riverine Upper Perennial
Fine Sediment Cold Water 2 2 2 3 9
Riverine Lower Perennial
Coarse Sediment
Cold Water 2 2 2 3 9
Riverine Lower Perennial
Fine Sediment Cold Water 2 2 2 3 9
Estuarine Subtidal Nearshore-Soft Bottom
Nearshore-Soft Bottom
3 1 3 2 9
Estuarine Subtidal Nearshore-Hard, Rocky Bottom
Nearshore-Hard, Rocky Bottom
3 1 3 2 9
Estuarine Subtidal Offshore-Soft Bottom
Offshore-Soft Bottom
3 1 3 2 9
Estuarine Subtidal Offshore-Hard, Rocky Bottom
Offshore-Hard, Rocky Bottom
3 1 3 2 9
Upland Agricultural Hayfields/ Pasture
Hayfields 2 2 3 1 8
Upland Agricultural Hayfields/ Pasture
Pasture 2 2 3 1 8
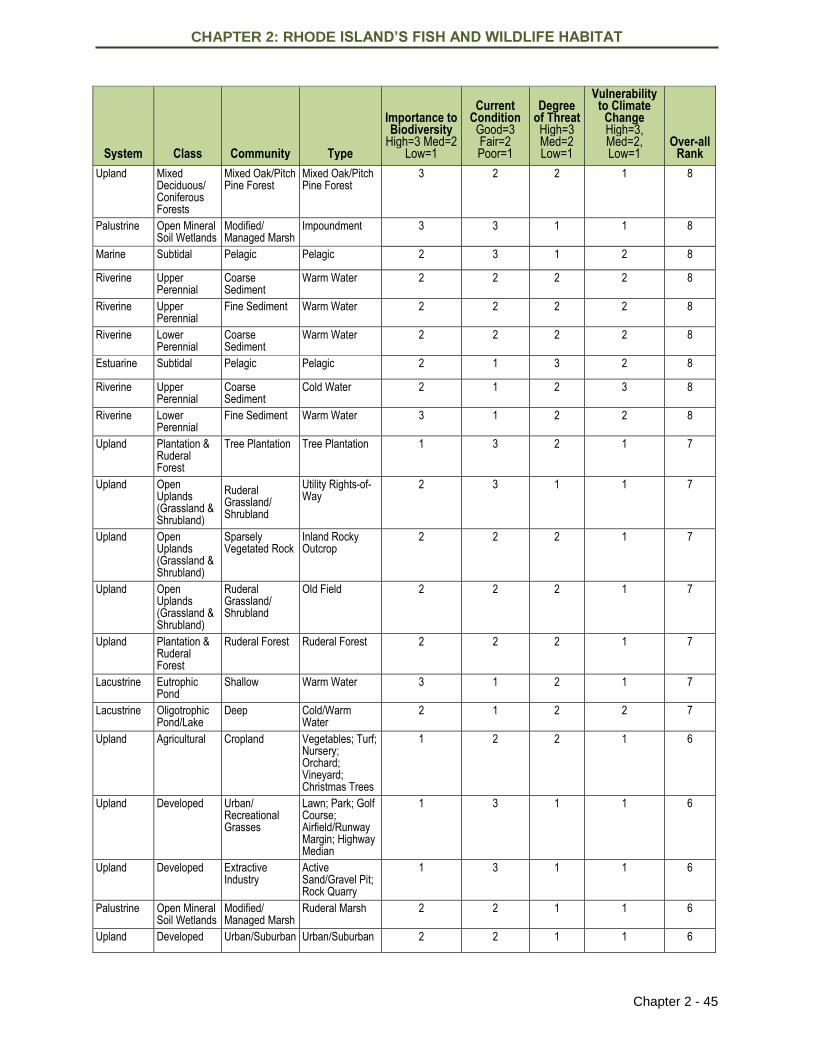
CHAPTER 2: RHODE ISLAND’S FISH AND WILDLIFE HABITAT
Chapter 2 - 45
System Class Community Type
Importance to Biodiversity
High=3 Med=2 Low=1
Current Condition
Good=3 Fair=2 Poor=1
Degree of Threat High=3 Med=2 Low=1
Vulnerability to Climate
Change High=3, Med=2, Low=1
Over-all Rank
Upland Mixed Deciduous/ Coniferous Forests
Mixed Oak/Pitch Pine Forest
Mixed Oak/Pitch Pine Forest
3 2 2 1 8
Palustrine Open Mineral Soil Wetlands
Modified/ Managed Marsh
Impoundment 3 3 1 1 8
Marine Subtidal Pelagic Pelagic 2 3 1 2 8
Riverine Upper Perennial
Coarse Sediment
Warm Water 2 2 2 2 8
Riverine Upper Perennial
Fine Sediment Warm Water 2 2 2 2 8
Riverine Lower Perennial
Coarse Sediment
Warm Water 2 2 2 2 8
Estuarine Subtidal Pelagic Pelagic 2 1 3 2 8
Riverine Upper Perennial
Coarse Sediment
Cold Water 2 1 2 3 8
Riverine Lower Perennial
Fine Sediment Warm Water 3 1 2 2 8
Upland Plantation & Ruderal Forest
Tree Plantation Tree Plantation 1 3 2 1 7
Upland Open Uplands (Grassland & Shrubland)
Ruderal Grassland/ Shrubland
Utility Rights-of-Way
2 3 1 1 7
Upland Open Uplands (Grassland & Shrubland)
Sparsely Vegetated Rock
Inland Rocky Outcrop
2 2 2 1 7
Upland Open Uplands (Grassland & Shrubland)
Ruderal Grassland/ Shrubland
Old Field 2 2 2 1 7
Upland Plantation & Ruderal Forest
Ruderal Forest Ruderal Forest 2 2 2 1 7
Lacustrine Eutrophic Pond
Shallow Warm Water 3 1 2 1 7
Lacustrine Oligotrophic Pond/Lake
Deep Cold/Warm Water
2 1 2 2 7
Upland Agricultural Cropland Vegetables; Turf; Nursery; Orchard; Vineyard; Christmas Trees
1 2 2 1 6
Upland Developed Urban/ Recreational Grasses
Lawn; Park; Golf Course; Airfield/Runway Margin; Highway Median
1 3 1 1 6
Upland Developed Extractive Industry
Active Sand/Gravel Pit; Rock Quarry
1 3 1 1 6
Palustrine Open Mineral Soil Wetlands
Modified/ Managed Marsh
Ruderal Marsh 2 2 1 1 6
Upland Developed Urban/Suburban Urban/Suburban 2 2 1 1 6
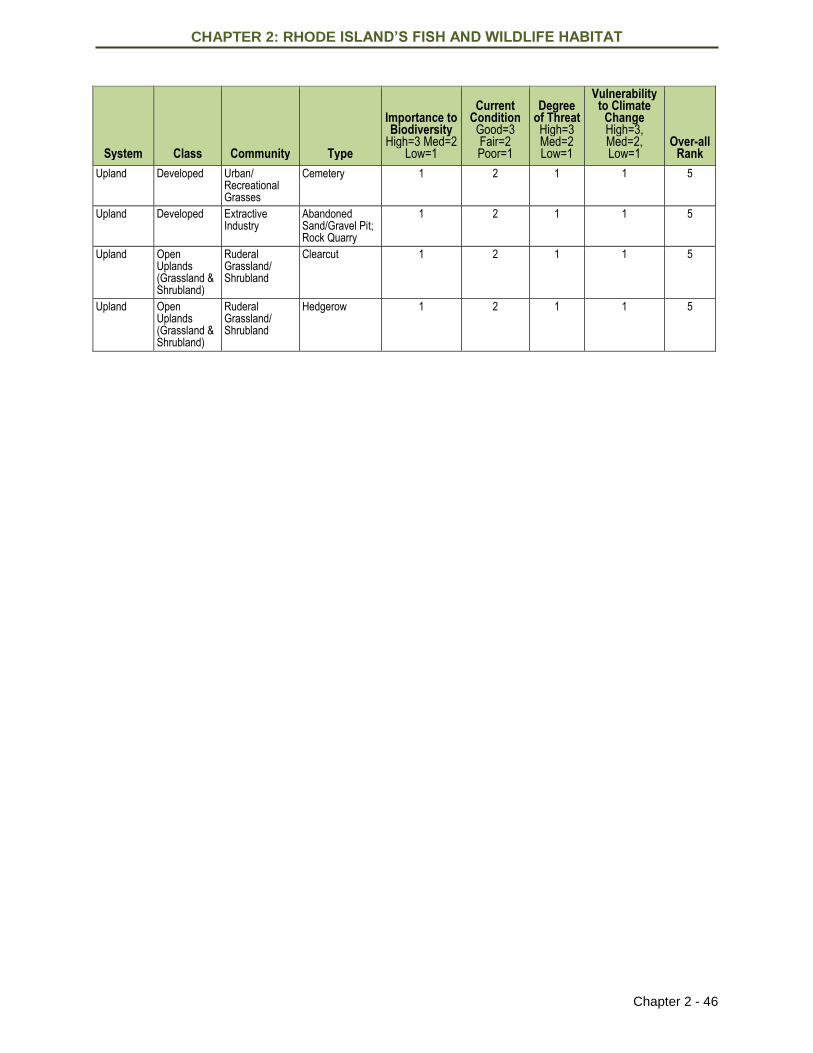
CHAPTER 2: RHODE ISLAND’S FISH AND WILDLIFE HABITAT
Chapter 2 - 46
System Class Community Type
Importance to Biodiversity
High=3 Med=2 Low=1
Current Condition
Good=3 Fair=2 Poor=1
Degree of Threat High=3 Med=2 Low=1
Vulnerability to Climate
Change High=3, Med=2, Low=1
Over-all Rank
Upland Developed Urban/ Recreational Grasses
Cemetery 1 2 1 1 5
Upland Developed Extractive Industry
Abandoned Sand/Gravel Pit; Rock Quarry
1 2 1 1 5
Upland Open Uplands (Grassland & Shrubland)
Ruderal Grassland/ Shrubland
Clearcut 1 2 1 1 5
Upland Open Uplands (Grassland & Shrubland)
Ruderal Grassland/ Shrubland
Hedgerow 1 2 1 1 5
CHAPTER 2: RHODE ISLAND’S FISH AND WILDLIFE HABITAT
Chapter 2 - 47
Citations and Sources
Alexander, L. V., et al. (2006), Global observed changes in daily climate extremes of temperature and
precipitation, J. Geophys. Res., 111, D05109, doi:10.1029/2005JD006290.
Anderson, J. R., E. E. Hardy, J. T. Roach, and R. E. Witmer. 1976. A land use and land cover
classification system for use with remote sensor data. U.S. Geological Survey Professional Paper
964.
Anderson, M.G., M. Clark, and A. Olivero Sheldon. 2011. Resilient Sites for Species Conservation in the
Northeast and Mid-Atlantic Region. The Nature Conservancy, Eastern Conservation Science.
122pp.Available online at: http://static.rcngrants.org/sites/default/files/final_reports/Resilient-
Sites-for-Species-Conservation%281%29.pdf
Anderson, M.G., M. Clark, C.E. Ferree, A. Jospe, A. Olivero Sheldon, and K.J. Weaver. 2013a. Northeast
Habitat Guides: A companion to the terrestrial and aquatic habitat maps. Submitted to the
Regional Conservation Needs Grants Program of the Northeast Association of Fish and Wildlife
Agencies. The Nature Conservancy, Eastern Conservation Science, Eastern Regional Office.
Boston, MA. 394 pp.
http://static.rcngrants.org/sites/default/files/news_files/Northeast%20Aquatic%20and%20Terrest
rial%20Habitat%20Guide.pdf
Anderson, M.G., M. Clark, C.E. Ferree, A. Jospe, and A. Olivero Sheldon. 2013b. Condition of the
Northeast Terrestrial and Aquatic Habitats: a geospatial analysis and tool set. Submitted to the
Regional Conservation Needs Grants Program of the Northeast Association of Fish and Wildlife
Agencies. The Nature Conservancy, Eastern Conservation Science.
http://easterndivision.s3.amazonaws.com/Geospatial/ConditionoftheNortheastTerrestrialandAqu
aticHabitats.pdf
Association of Fish and Wildlife Agencies (AFWA), Teaming With Wildlife Committee, State Wildlife
Action Plan Best Practices Working Group. 2012. Best Practices for State Wildlife Action
Plans—Voluntary Guidance to States for Revision and Implementation. Washington, DC:
Association of Fish and Wildlife Agencies. 80pp. Available online at:
http://www.fishwildlife.org/files/SWAPBestPractices.pdf
Bailey, R. G. 1995. Description of the ecoregions of the United States. U.S. Forest Service. Miscellaneous
Publication 1391 (Revised), with Separate Map at a Scale of 1:7,500,000, Washington, D.C.
Barbour, H., M. G. Anderson, S. Khanna, A. Olivero, and B. Zaremba. 2003. Lower New England –
northern Piedmont ecoregional conservation plan; edited first iteration. The Nature Conservancy,
Northeast and Caribbean Division, Boston, Massachusetts.
Beers, A., and S. Davison. 1999. North Atlantic coast ecoregional conservation plan. The Nature
Conservancy, Arlington, Virginia.
Boyd, J. and P. Rubinoff. 2014. Results of SLAMM modeling in Rhode Island. RI Sea Grant and RI
Coastal Resources Management Council.
Bradley, M., K. Raposa, and S. Tuxbury. 2007. Report on the Analysis of True-color Aerial Photography
to Map and Inventory Zostera marina L. in Narragansett Bay and Block Island, Rhode Island.
Page 1-16 and 9 Mapsheets. Rhode Island Natural History Survey.
Bradley, M., R. Hudson, M. Cole Ekberg, K. Raposa, and A. MacLachlan. 2012. Mapping Submerged
Aquatic Vegetation (SAV) in Rhode Island Coastal Waters. Available on line at:
http://www.savebay.org/file/2012_Mapping_Submerged_Aquatic_Vegetation_final_report_4_20
13.pdf
CHAPTER 2: RHODE ISLAND’S FISH AND WILDLIFE HABITAT
2-48
Buffum, B. 2011. Can forest management maintain the extent of shrubland habitat in Rhode Island? A
spatial analysis. Kingston, Rhode Island: Department of Natural Resources Science, University of
Rhode Island.
Butler, B. J. and E. H. Wharton, editors. 2002. The forests of Rhode Island. USDA, Forest Service,
Northeastern Research Station, NE-INF-155-02.
Cowardin, L. M., V. Carter, F. C. Golet, and E. T. LaRoe. 1979. Classification of wetlands and deepwater
habitats of the United States. U.S. Fish and Wildlife Service Publication FWS/OBS-79/31,
Washington, D.C.
Dahl, T. E. 1990. Wetlands loss in the United States 1780’s to 1980’s. U.S. Department of Interior, Fish
and Wildlife Service, Washington, D.C.
Dettmers, R. and K. V. Rosenberg. 2000. Draft partners in flight landbird conservation plan:
physiographic area 09, southern New England, version 1. Partners in Flight, Northeast Region,
Ithaca, New York.
Enser, R., D. Gregg, C. Sparks, P. August, P. Jordan, J. Coit, C. Raithel, B. Tefft, B. Payton, C. Brown,
C. LaBash, S. Comings, and K. Ruddock. 2011. Rhode Island Ecological Communities
Classification. Technical Report. Rhode Island Natural History Survey, Kingston, RI.
Enser, R.W. and J. A. Lundgren. 2005. Natural communities of Rhode Island. Rhode Island Natural
Heritage Program, Department of Environmental Management and The Nature Conservancy of
Rhode Island, Providence, Rhode Island.
Federal Emergency Management Agency (FEMA). 2013. New England: One year after hurricane Sandy.
News Release 14-03, October 29, 2013.
Freedman, J. 2012. As Cited in Living Shorelines. Non-Structural Erosion Control Practices. Rhode
Island Land and Water Summit. 2014. PowerPoint created by D.S. Brown, K. Ruddock, R. Smith,
The Nature Conservancy, and USFWS.
http://www.landandwaterpartnership.org/documents/Summit2014/2G_Erosion_Control.pdf
Gawler, S. C. 2008. Northeastern Terrestrial Wildlife Habitat Classification. Report to the Virginia
Department of Game and Inland Fisheries on behalf of the Northeast Association of Fish and
Wildlife Agencies and the National Fish and Wildlife Foundation. NatureServe, Boston,
Massachusetts. 102 pp.
Gibbs, E., T. Corey, M. Schwartz, D. Grossman-Garber, C. Jaworski, and M. Buchert. 1995. Guide to
Rhode Island’s natural places. Rhode Island Sea Grant, University of Rhode Island, Narragansett,
Rhode Island.
Griffiths, L. 1965. One hundred years of agriculture in Rhode Island. University of Rhode Island Bulletin
378.
Kennedy, J. J., P. W. Thorne, T. C. Peterson, R. A. Reudy, P. A. Stott, D. E. Parker, S. A. Good, H. A.
Titchner, and K. M. Willett, 2010: How do we know the world has warmed? [in “State of the
Climate in 2009”]. Bulletin of the American Meteorological Society, 91, S26-27,
doi:10.1175/BAMS-91-7-StateoftheClimate.
Kutcher, T. E. 2011. Rapid Assessment of Freshwater Wetland Condition: Atlantic White Cedar Swamps,
Bogs, and Fens. Development and Demonstration of a Rapid Assessment Method for Freshwater
Wetlands in Rhode Island, Year 4. RI Natural History Survey and RIDEM, Office of Water
Resources. 1-39.
Kutcher, T. E. 2012. Integrating rapid assessment with biological and landscape indicators of freshwater
wetland condition. RI Natural History Survey and RIDEM Office of Water Resources. 1-48.
CHAPTER 2: RHODE ISLAND’S FISH AND WILDLIFE HABITAT
2-49
Kutcher, T. E. 2013. Developing floristic quality assessment methods for evaluating freshwater wetland
condition. RI Natural History Survey and RIDEM Office of Water Resources. 1-32.
Litvaitis, J. A. 2003. Are pre-Columbian conditions relevant baselines for managed forests in the
northeastern United States? Forest Ecology and Management.183:113-126.
Manomet Center for Conservation Sciences and National Wildlife Federation. 2012. The Vulnerabilities
of Fish and Wildlife Habitats in the Northeast to Climate Change. A Report to the Northeastern
Association of Fish and Wildlife Agencies and the North Atlantic Landscape Conservation
Cooperative. Manomet, MA. 183 pp. Available online at:
http://rcngrants.org/content/assessing-likely-impacts-climate-change-northeastern-fish-and-
wildlife-habitats-and-species
Martin, E. H. and C. D. Apse. 2011. Northeast Aquatic Connectivity: An Assessment of Dams on
Northeastern Rivers. The Nature Conservancy, Eastern Freshwater Program.
McNab, W. H., and P. E. Avers. 1994. Ecological subregions of the United States: section descriptions.
U.S. Department of Agriculture Forest Service, WO-WSA-5, Washington, DC.
Miller-Rushing, A.J. and R. B. Primack. 2008. Global warming and flowering times in Thoreau’s
Concord: a community perspective. Ecology, 89(2), 2008, pp. 332–341.
Murphy, Carol. 2014. Personal Communication of February 26.
National Audubon Society. 2014. Important bird areas in Rhode Island.
http://netapp.audubon.org/iba/state/US-RI
Natural Resources Conservation Service (NRCS). 1981. Rhode Island soil survey. U.S. Department of
Agriculture, Providence, Rhode Island. Portions available online at
http://efotg.nrcs.usda.gov/treemenuFS.aspx?Fips=44007&MenuName=menuRI.zip.
NEAFWA 2008. Monitoring the Conservation of Fish and Wildlife in the Northeast: A Report on the
Monitoring and Performance Reporting Framework for the Northeast Association of Fish and
Wildlife Agencies”
http://rcngrants.org/sites/default/files/final_reports/NE%20Monitoring%20and%20Performance
%20Reporting%20Framework.pdf
NEIWPCC and RI DEM (New England Interstate Water Pollution Control Commission and Rhode Island
Department of Environmental Management). 2006. Rhode Island freshwater wetlands monitoring
and assessment plan. Rhode Island Department of Environmental Management Office of Water
Resources, Providence, RI. 58pp.
NOAA. 2014. National Weather Service Data from Rhode Island.
http://www.nws.noaa.gov/view/states.php?state=RI. Accessed December 15, 2014.
Olivero, A. and M. Anderson. 2008. Northeast Aquatic Habitat Classification System. Submitted to the
Regional Conservation Needs Grants Program of the Northeast Association of Fish and Wildlife
Agencies. The Nature Conservancy, Eastern Conservation Science. 88 pp.
http://rcngrants.org/content/northeastern-aquatic-habitat-classification-project
Omernik, J. M. 1995. Ecoregions: a spatial framework for environmental management. Pages 49-62 in W.
S. Davis, and T. P. Simon, editors. Biological assessment and criteria tools for water resource
planning and decision making. Lewis, CRC Press, Boca Raton, Florida.
Photoscience 2014. Distribution of Palustrine Wetlands in Rhode Island. GIS Map.
Photoscience. 2014. Wetland Distribution in Rhode Island. GIS Map.
CHAPTER 2: RHODE ISLAND’S FISH AND WILDLIFE HABITAT
2-50
Primack, D., C. Imbres, R. B. Primack, A. J. Miller-Rushing, and P. Del Tredici. 2004. Herbarium
specimens demonstrate earlier flowering times in response to warming in Boston. American
Journal of Botany 91:1260–1264.
Quinn, A. W. 1997. Rhode Island geology for the non-geologist. Rhode Island Natural History Survey,
Kingston, Rhode Island.
Rhode Island Geographic Information System (RIGIS). 2011. Data Distribution System. Environmental
Data Center, University of Rhode Island, Kingston, Rhode Island. http://www.edc.uri.edu/rigis.
Accessed December 10, 2014
RI Coastal Resources Management Council. 2007. Rhode Island aquatic invasive species management
plan. Available online at: http://www.anstaskforce.gov/State%20Plans/RI_SMP_Draft.pdf
RI DEM. 2001. Rare native animals of Rhode Island. Rhode Island Department of Environmental
Management, Natural Heritage Program, Providence, Rhode Island. Available online at
http://www.dem.ri.gov/pubs/index.htm. Accessed on July 1, 2004.
RI DEM. 2014. Mapping and LIDAR
RI DEM Division of Agriculture. 2014. Directory of Rhode Island Farmer's Markets. Available online at:
http://www.dem.ri.gov/programs/bnatres/agricult/pdf/rimarkets.pdf
RI DEM Division of Forest Environment. 2010. Rhode Island forest resources assessment and strategies:
“A path to tomorrow’s forests.” 1-59. http://www.dem.ri.gov/programs/bnatres/forest/index.htm.
RI DEM. Office of Water Resources (OWR). 2012. 2012 Integrated water quality monitoring and
assessment report.66pp. Available online at:
http://www.dem.ri.gov/programs/benviron/water/quality/pdf/iwqmon12.pdf
RI DEM Office of Water Resources (OWR). 2012. State of Rhode Island 2012 303(d) list of impaired
waters. Available online at: http://www.dem.ri.gov/pubs/303d/303d12.pdf
RI DEM Office of Water Resources (OWR). 2009. Wetland Regulation and Protection Status and Trends.
http://www.dem.ri.gov/programs/benviron/water/wetlands/pdfs/status09.pdf. Accessed December
10, 2014.
RI DEM Office of Water Resources (OWR). 2014.
http://www.dem.ri.gov/programs/benviron/water/quality/surfwq/lakeindx.htm. Accessed
December 10, 2014.
Rhode Island Resource Protection Project. 2004. http://www.edc.uri.edu/rirpp/. Accessed December 15,
2014.
Rudis, V. A. 1999. Ecological subregion codes by county, coterminous United States. A technical
document supporting the 2000 USDA Forest Service RPA Assessment. U.S. Department of
Agriculture, Forest Service, Southern Research Station, General Technical Report SRS-36,
Asheville, North Carolina.
Sneddon, L., M. Anderson, and J. Lundgren. 1998. International classification of ecological communities:
terrestrial vegetation of the northeastern United States. January 1999 Working Draft. Unpublished
Report. Association for Biodiversity Information / The Nature Conservancy, Eastern Resource
Office, and Natural Heritage Programs of the Northeastern U.S, Boston, Massachusetts.
Stover, C. W., and J. L. Coffman. 1993. Seismicity of the United States, 1568-1989 (Revised). U.S.
Geological Survey Professional Paper 1527.
USDA. 2014. 2012 Census of Agriculture. National Agricultural Statistics Service.
http://www.agcensus.usda.gov/Publications/2012/. Accessed December 15, 2014
CHAPTER 2: RHODE ISLAND’S FISH AND WILDLIFE HABITAT
2-51
Vellend, M., K. Verheyen, K. M. Flinn, H. Jacquemyn, A. Kolb, H. Van Calster, G., Peterken, B. Jessen
Graae, J. Bellemare, O. Honnay, J. Brunet, M. Wulf, F. Gerhard and M. Hermy. 2007.
Homogenization of forest plant communities and weakening of species–environment
relationships via agricultural land use. J. Ecology. 95:565-573.
Wheeler, R. L., N. K. Trevor, A. C. Tarr, and A. J. Crone. 2000. Earthquakes in and near the northeastern
United States, 1638-1998, Version 1.1. U.S. Geological Survey Geologic Investigations Series I-
2737, Denver, Colorado. Available online at http://neic.usgs.gov/neis/states/rhode_island/.
Accessed August 24, 2004.
Widmann, R. H. 2002. Trends in Rhode Island forests: a half century of change. USDA, Forest Service,
Northeastern Research Station, NE-INF-144-02, Newton Square, Pennsylvania.