rhahn mitral stenosis 10/10/2016 - american society of...
TRANSCRIPT
Rhahn Mitral Stenosis 10/10/2016
1
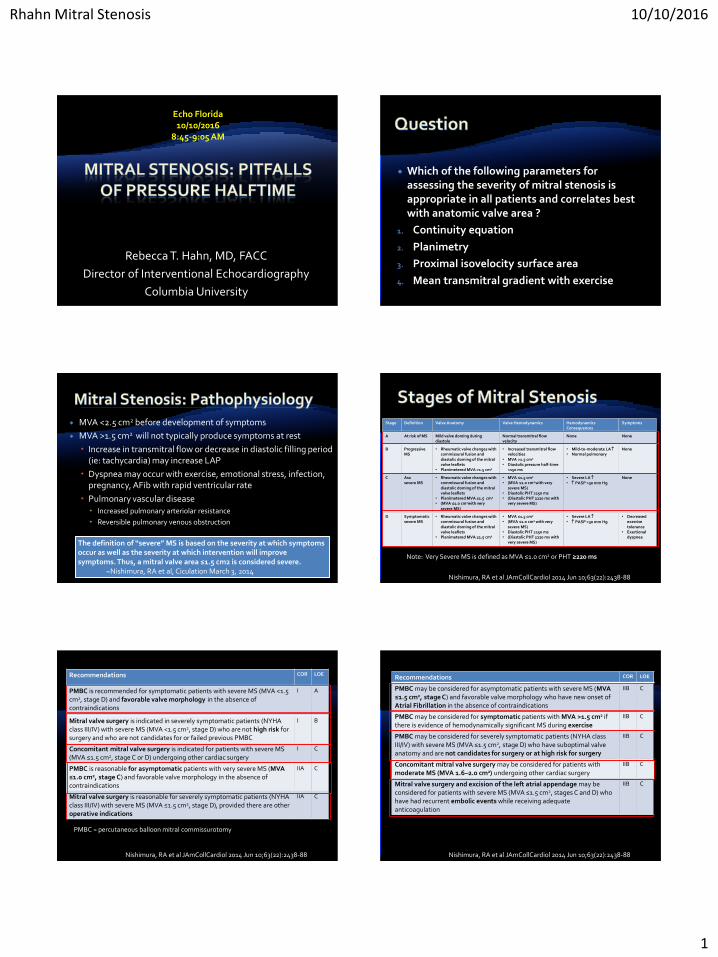
Rebecca T. Hahn, MD, FACC
Director of Interventional Echocardiography
Columbia University
Echo Florida10/10/2016
8:45-9:05 AM
Which of the following parameters for assessing the severity of mitral stenosis is appropriate in all patients and correlates best with anatomic valve area ?
1. Continuity equation
2. Planimetry
3. Proximal isovelocity surface area
4. Mean transmitral gradient with exercise
MVA <2.5 cm2 before development of symptoms
MVA >1.5 cm2 will not typically produce symptoms at rest
Increase in transmitral flow or decrease in diastolic filling period (ie: tachycardia) may increase LAP
Dyspnea may occur with exercise, emotional stress, infection, pregnancy, AFib with rapid ventricular rate
Pulmonary vascular disease Increased pulmonary arteriolar resistance
Reversible pulmonary venous obstruction
The definition of “severe” MS is based on the severity at which symptoms occur as well as the severity at which intervention will improve symptoms. Thus, a mitral valve area ≤1.5 cm2 is considered severe.
~Nishimura, RA et al, Ciculation March 3, 2014
Stage Definition Valve Anatomy Valve Hemodynamics Hemodynamics Consequences
Symptoms
A At risk of MS Mild valve doming duringdiastole
Normal transmitral flow velocity
None None
B Progressive MS
• Rheumatic valve changes with commissural fusion and diastolic doming of the mitral valve leaflets
• Planimetered MVA >1.5 cm2
• Increased transmitral flow velocities
• MVA >1.5 cm2
• Diastolic pressure half-time <150 ms
• Mild-to-moderate LA • Normal pulmonary
None
C Asxsevere MS
• Rheumatic valve changes with commissural fusion and diastolic doming of the mitral valve leaflets
• Planimetered MVA ≤1.5 cm2
• (MVA ≤1.0 cm2with very severe MS)
• MVA ≤1.5 cm2
• (MVA ≤1.0 cm2 with very severe MS)
• Diastolic PHT ≥150 ms• (Diastolic PHT ≥220 ms with
very severe MS)
• Severe LA • PASP >30 mm Hg
None
D Symptomaticsevere MS
• Rheumatic valve changes with commissural fusion and diastolic doming of the mitral valve leaflets
• Planimetered MVA ≤1.5 cm2
• MVA ≤1.5 cm2
• (MVA ≤1.0 cm2 with very severe MS)
• Diastolic PHT ≥150 ms• (Diastolic PHT ≥220 ms with
very severe MS)
• Severe LA • PASP >30 mm Hg
• Decreased exercise tolerance
• Exertionaldyspnea
Nishimura, RA et al JAmCollCardiol 2014 Jun 10;63(22):2438-88
Note: Very Severe MS is defined as MVA ≤1.0 cm2 or PHT ≥220 ms
Recommendations COR LOE
PMBC is recommended for symptomatic patients with severe MS (MVA <1.5 cm2, stage D) and favorable valve morphology in the absence of contraindications
I A
Mitral valve surgery is indicated in severely symptomatic patients (NYHA class III/IV) with severe MS (MVA <1.5 cm2, stage D) who are not high risk for surgery and who are not candidates for or failed previous PMBC
I B
Concomitant mitral valve surgery is indicated for patients with severe MS (MVA ≤1.5 cm2, stage C or D) undergoing other cardiac surgery
I C
PMBC is reasonable for asymptomatic patients with very severe MS (MVA ≤1.0 cm2, stage C) and favorable valve morphology in the absence of contraindications
IIA C
Mitral valve surgery is reasonable for severely symptomatic patients (NYHA class III/IV) with severe MS (MVA ≤1.5 cm2, stage D), provided there are other operative indications
IIA C
Nishimura, RA et al JAmCollCardiol 2014 Jun 10;63(22):2438-88
PMBC = percutaneous balloon mitral commissurotomy
Recommendations COR LOE
PMBC may be considered for asymptomatic patients with severe MS (MVA ≤1.5 cm2, stage C) and favorable valve morphology who have new onset of Atrial Fibrillation in the absence of contraindications
IIB C
PMBC may be considered for symptomatic patients with MVA >1.5 cm2 if there is evidence of hemodynamically significant MS during exercise
IIB C
PMBC may be considered for severely symptomatic patients (NYHA class III/IV) with severe MS (MVA ≤1.5 cm2, stage D) who have suboptimal valve anatomy and are not candidates for surgery or at high risk for surgery
IIB C
Concomitant mitral valve surgery may be considered for patients with moderate MS (MVA 1.6–2.0 cm2) undergoing other cardiac surgery
IIB C
Mitral valve surgery and excision of the left atrial appendage may be considered for patients with severe MS (MVA ≤1.5 cm2, stages C and D) who have had recurrent embolic events while receiving adequate anticoagulation
IIB C
Nishimura, RA et al JAmCollCardiol 2014 Jun 10;63(22):2438-88
Rhahn Mitral Stenosis 10/10/2016
2
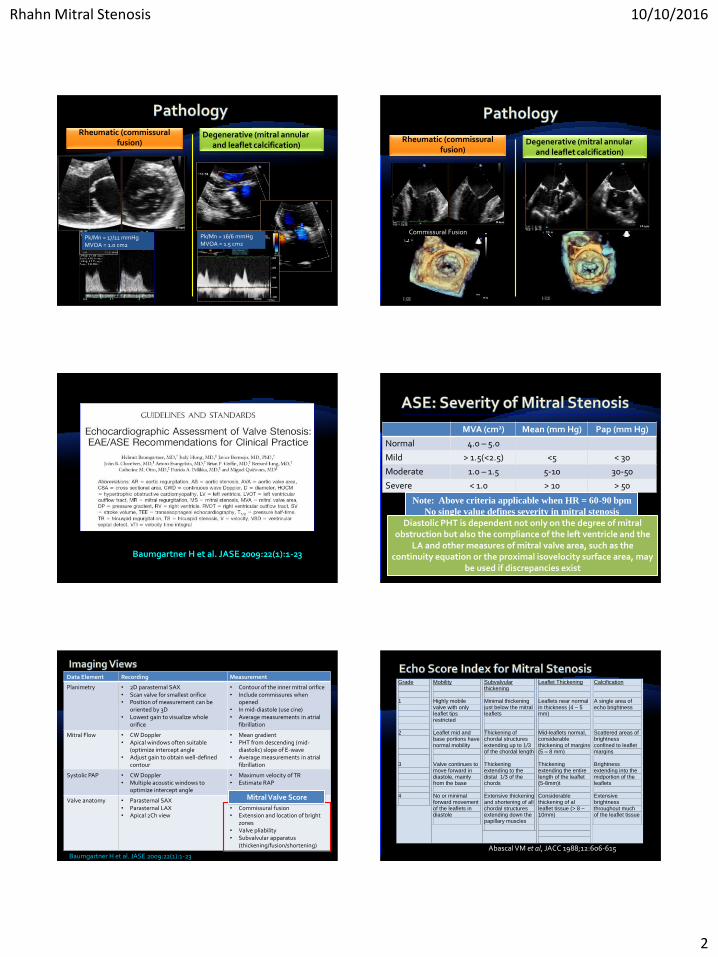
Rheumatic (commissural fusion)
Degenerative (mitral annular and leaflet calcification)
Pk/Mn = 16/6 mmHgMVOA = 1.5 cm2
Pk/Mn = 17/11 mmHgMVOA = 1.0 cm2
Commissural Fusion
Rheumatic (commissural fusion)
Degenerative (mitral annular and leaflet calcification)
Baumgartner H et al. JASE 2009:22(1):1-23 Baumgartner H et al. JASE 2009:22(1):1-23
Note: Above criteria applicable when HR = 60-90 bpm
No single value defines severity in mitral stenosis
MVA (cm2) Mean (mm Hg) Pap (mm Hg)
Normal 4.0 – 5.0
Mild > 1.5(<2.5) <5 < 30
Moderate 1.0 – 1.5 5-10 30-50
Severe < 1.0 > 10 > 50
Diastolic PHT is dependent not only on the degree of mitral obstruction but also the compliance of the left ventricle and the
LA and other measures of mitral valve area, such as the continuity equation or the proximal isovelocity surface area, may
be used if discrepancies exist
Data Element Recording Measurement
Planimetry • 2D parasternal SAX• Scan valve for smallest orifice• Position of measurement can be
oriented by 3D• Lowest gain to visualize whole
orifice
• Contour of the inner mitral orifice• Include commissures when
opened• In mid-diastole (use cine)• Average measurements in atrial
fibrillation
Mitral Flow • CW Doppler• Apical windows often suitable
(optimize intercept angle• Adjust gain to obtain well-defined
contour
• Mean gradient• PHT from descending (mid-
diastolic) slope of E-wave• Average measurements in atrial
fibrillation
Systolic PAP • CW Doppler• Multiple acoustic windows to
optimize intercept angle
• Maximum velocity of TR• Estimate RAP
Valve anatomy • Parasternal SAX• Parasternal LAX• Apical 2Ch view
• Valve thickness• Commissural fusion• Extension and location of bright
zones• Valve pliability• Subvalvular apparatus
(thickening/fusion/shortening)
Baumgartner H et al. JASE 2009:22(1):1-23
Mitral Valve Score
Grade 1
2 3 4
Mobility Highly mobile valve with only leaflet tips restricted Leaflet mid and base portions have normal mobility Valve continues to move forward in diastole, mainly from the base No or minimal forward movement of the leaflets in diastole
Subvalvular thickening Minimal thickening just below the mitral leaflets Thickening of chordal structures extending up to 1/3 of the chordal length Thickening extending to the distal 1/3 of the chords Extensive thickening and shortening of all chordal structures extending down the papillary muscles
Leaflet Thickening Leaflets near normal in thickness (4 – 5 mm) Mid-leaflets normal, considerable thickening of margins (5 – 8 mm) Thickening extending the entire length of the leaflet (5-8mm)t Considerable thickening of al leaflet tissue (> 8 – 10mm)
Calcification A single area of echo brightness Scattered areas of brightness confined to leaflet margins Brightness extending into the midportion of the leaflets Extensive brightness throughout much of the leaflet tissue
Abascal VM et al, JACC 1988;12:606-615
Rhahn Mitral Stenosis 10/10/2016
3
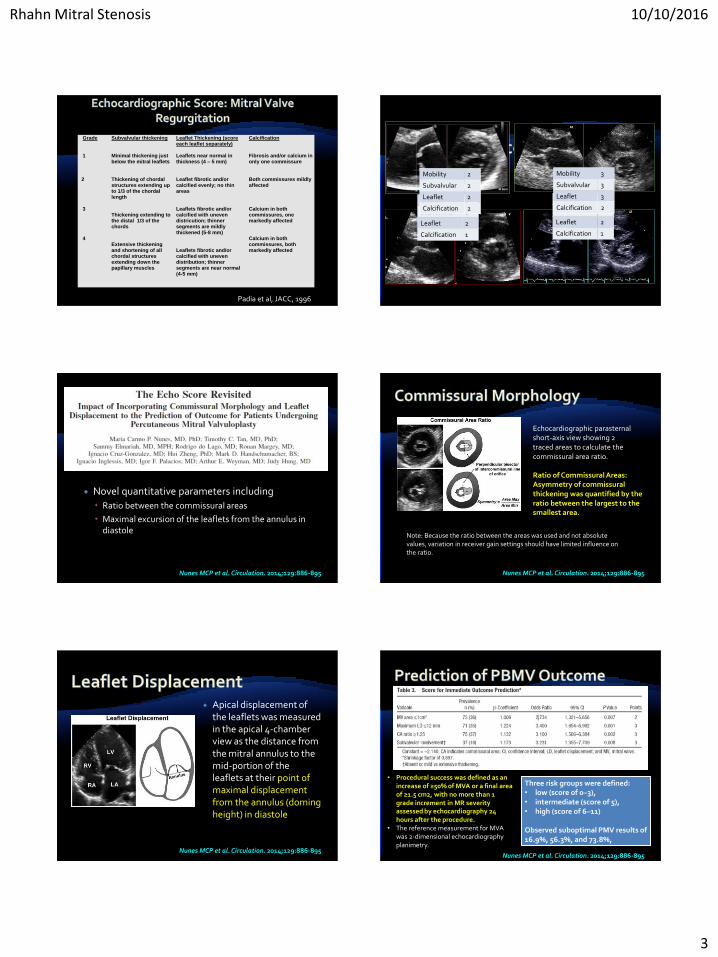
Grade 1
2 3 4
Subvalvular thickening Minimal thickening just below the mitral leaflets Thickening of chordal structures extending up to 1/3 of the chordal length Thickening extending to the distal 1/3 of the chords Extensive thickening and shortening of all chordal structures extending down the papillary muscles
Leaflet Thickening (score each leaflet separately) Leaflets near normal in thickness (4 – 5 mm) Leaflet fibrotic and/or calcified evenly; no thin areas Leaflets fibrotic and/or calcified with uneven districution; thinner segments are mildly thickened (5-8 mm) Leaflets fibrotic and/or calcified with uneven distribution; thinner segments are near normal (4-5 mm)
Calcification Fibrosis and/or calcium in only one commissure Both commissures mildly affected Calcium in both commissures, one markedly affected Calcium in both commissures, both markedly affected
Padia et al, JACC, 1996
Mobility 1
Subvalvular 1
Leaflet 2
Calcification 1
Mobility 1
Subvalvular 2
Leaflet 2
Calcification 1
Mobility 2
Subvalvular 2
Leaflet 2
Calcification 2
Mobility 3
Subvalvular 3
Leaflet 3
Calcification 2
Novel quantitative parameters including
Ratio between the commissural areas
Maximal excursion of the leaflets from the annulus in diastole
Nunes MCP et al. Circulation. 2014;129:886-895
Ratio of Commissural Areas: Asymmetry of commissural thickening was quantified by the ratio between the largest to the smallest area.
Echocardiographic parasternal short-axis view showing 2 traced areas to calculate the commissural area ratio.
Note: Because the ratio between the areas was used and not absolute values, variation in receiver gain settings should have limited influence on the ratio.
Nunes MCP et al. Circulation. 2014;129:886-895
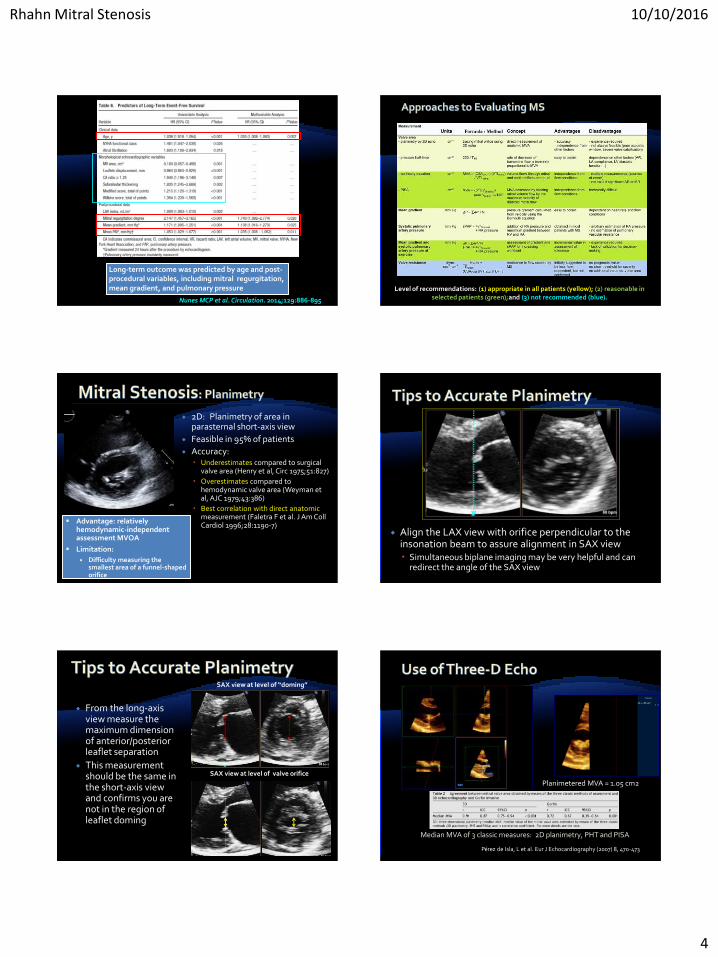
Apical displacement of the leaflets was measured in the apical 4-chamber view as the distance from the mitral annulus to the mid-portion of the leaflets at their point of maximal displacement from the annulus (doming height) in diastole
Nunes MCP et al. Circulation. 2014;129:886-895
• Procedural success was defined as an increase of ≥50% of MVA or a final area of ≥1.5 cm2, with no more than 1 grade increment in MR severity assessed by echocardiography 24 hours after the procedure.
• The reference measurement for MVA was 2-dimensional echocardiography planimetry.
Three risk groups were defined: • low (score of 0–3),• intermediate (score of 5), • high (score of 6–11)
Observed suboptimal PMV results of 16.9%, 56.3%, and 73.8%,
Nunes MCP et al. Circulation. 2014;129:886-895
Rhahn Mitral Stenosis 10/10/2016
4
Long-term outcome was predicted by age and post-procedural variables, including mitral regurgitation, mean gradient, and pulmonary pressure
Nunes MCP et al. Circulation. 2014;129:886-895
Level of recommendations: (1) appropriate in all patients (yellow); (2) reasonable in selected patients (green);and (3) not recommended (blue).
2D: Planimetry of area in parasternal short-axis view
Feasible in 95% of patients
Accuracy: Underestimates compared to surgical
valve area (Henry et al, Circ 1975;51:827)
Overestimates compared to hemodynamic valve area (Weyman et al, AJC 1979;43:386)
Best correlation with direct anatomic measurement (Faletra F et al. J Am CollCardiol 1996;28:1190-7)
• Advantage: relatively hemodynamic-independent assessment MVOA
• Limitation:
Difficulty measuring the smallest area of a funnel-shaped orifice
Align the LAX view with orifice perpendicular to the insonation beam to assure alignment in SAX view Simultaneous biplane imaging may be very helpful and can
redirect the angle of the SAX view
From the long-axis view measure the maximum dimension of anterior/posterior leaflet separation
This measurement should be the same in the short-axis view and confirms you are not in the region of leaflet doming
SAX view at level of “doming”
SAX view at level of valve orifice
Planimetered MVA = 1.05 cm2
Pérez de Isla, L et al. Eur J Echocardiography (2007) 8, 470-473
Median MVA of 3 classic measures: 2D planimetry, PHT and PISA
Rhahn Mitral Stenosis 10/10/2016
5
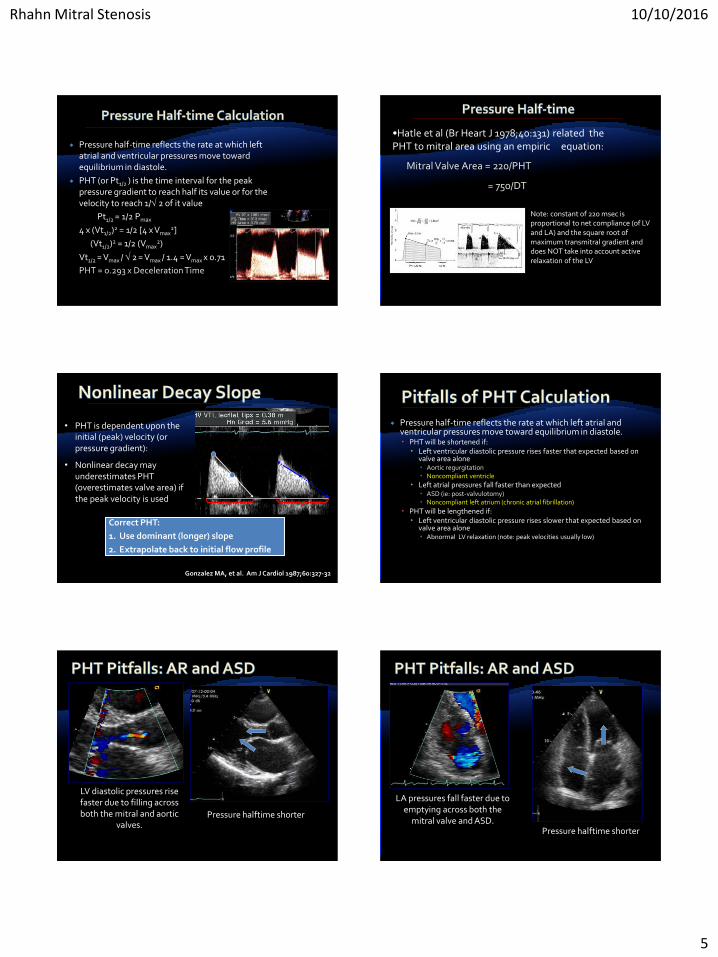
Pressure half-time reflects the rate at which left atrial and ventricular pressures move toward equilibrium in diastole.
PHT (or Pt1/2 ) is the time interval for the peak pressure gradient to reach half its value or for the velocity to reach 1/ 2 of it value
Pt1/2 = 1/2 Pmax
4 x (Vt1/2)2 = 1/2 [4 x Vmax2]
(Vt1/2)2 = 1/2 (Vmax2)
Vt1/2 = Vmax / 2 = Vmax / 1.4 = Vmax x 0.71
PHT = 0.293 x Deceleration Time
•Hatle et al (Br Heart J 1978;40:131) related the PHT to mitral area using an empiric equation:
Mitral Valve Area = 220/PHT
= 750/DT
Note: constant of 220 msec is proportional to net compliance (of LV and LA) and the square root of maximum transmitral gradient and does NOT take into account active relaxation of the LV
• PHT is dependent upon the initial (peak) velocity (or pressure gradient):
• Nonlinear decay may underestimates PHT (overestimates valve area) if the peak velocity is used
Correct PHT:
1. Use dominant (longer) slope
2. Extrapolate back to initial flow profile
Gonzalez MA, et al. Am J Cardiol 1987;60:327-32
Pressure half-time reflects the rate at which left atrial and ventricular pressures move toward equilibrium in diastole. PHT will be shortened if:
Left ventricular diastolic pressure rises faster that expected based on valve area alone Aortic regurgitation Noncompliant ventricle
Left atrial pressures fall faster than expected ASD (ie: post-valvulotomy) Noncompliant left atrium (chronic atrial fibrillation)
PHT will be lengthened if: Left ventricular diastolic pressure rises slower that expected based on
valve area alone Abnormal LV relaxation (note: peak velocities usually low)
LV diastolic pressures rise faster due to filling across both the mitral and aortic
valves.Pressure halftime shorter
LA pressures fall faster due to emptying across both the
mitral valve and ASD.Pressure halftime shorter
Rhahn Mitral Stenosis 10/10/2016
6
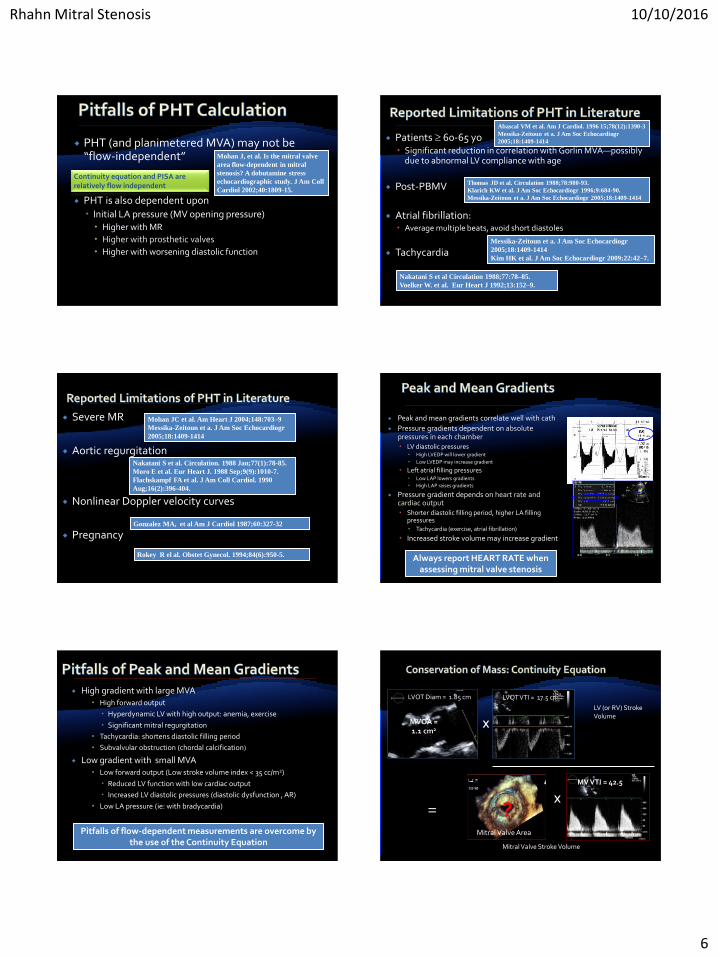
PHT (and planimetered MVA) may not be “flow-independent”
PHT is also dependent upon Initial LA pressure (MV opening pressure) Higher with MR
Higher with prosthetic valves
Higher with worsening diastolic function
Mohan J, et al. Is the mitral valve
area flow-dependent in mitral
stenosis? A dobutamine stress
echocardiographic study. J Am Coll
Cardiol 2002;40:1809-15.
Continuity equation and PISA are relatively flow independent
Patients 60-65 yo Significant reduction in correlation with Gorlin MVA—possibly
due to abnormal LV compliance with age
Post-PBMV
Atrial fibrillation: Average multiple beats, avoid short diastoles
Tachycardia
Abascal VM et al. Am J Cardiol. 1996 15;78(12):1390-3
Messika-Zeitoun et a. J Am Soc Echocardiogr
2005;18:1409-1414
Thomas JD et al. Circulation 1988;78:980-93.
Klarich KW et al. J Am Soc Echocardiogr 1996;9:684-90.
Messika-Zeitoun et a. J Am Soc Echocardiogr 2005;18:1409-1414
Messika-Zeitoun et a. J Am Soc Echocardiogr
2005;18:1409-1414
Kim HK et al. J Am Soc Echocardiogr 2009;22:42–7.
Nakatani S et al Circulation 1988;77:78–85.
Voelker W. et al. Eur Heart J 1992;13:152–9.
Severe MR
Aortic regurgitation
Nonlinear Doppler velocity curves
PregnancyGonzalez MA, et al Am J Cardiol 1987;60:327-32
Rokey R el al. Obstet Gynecol. 1994;84(6):950-5.
Mohan JC et al. Am Heart J 2004;148:703–9
Messika-Zeitoun et a. J Am Soc Echocardiogr
2005;18:1409-1414
Nakatani S et al. Circulation. 1988 Jan;77(1):78-85.
Moro E et al. Eur Heart J. 1988 Sep;9(9):1010-7.
Flachskampf FA et al. J Am Coll Cardiol. 1990
Aug;16(2):396-404.
Peak and mean gradients correlate well with cath
Pressure gradients dependent on absolute pressures in each chamber LV diastolic pressures
High LVEDP will lower gradient
Low LVEDP may increase gradient
Left atrial filling pressures Low LAP lowers gradients
High LAP raises gradients
Pressure gradient depends on heart rate and cardiac output Shorter diastolic filling period, higher LA filling
pressures Tachycardia (exercise, atrial fibrillation)
Increased stroke volume may increase gradient
Always report HEART RATE when assessing mitral valve stenosis
High gradient with large MVA High forward output
Hyperdynamic LV with high output: anemia, exercise
Significant mitral regurgitation
Tachycardia: shortens diastolic filling period
Subvalvular obstruction (chordal calcification)
Low gradient with small MVA Low forward output (Low stroke volume index < 35 cc/m2)
Reduced LV function with low cardiac output
Increased LV diastolic pressures (diastolic dysfunction , AR)
Low LA pressure (ie: with bradycardia)
Pitfalls of flow-dependent measurements are overcome by the use of the Continuity Equation
X=
Mitral Valve Area
?
LV (or RV) Stroke Volume
Mitral Valve Stroke Volume
LVOT Diam = 1.85 cm LVOT VTI = 17.5 cm
X
MV VTI = 42.5
MVOA = 1.1 cm2
Rhahn Mitral Stenosis 10/10/2016
7
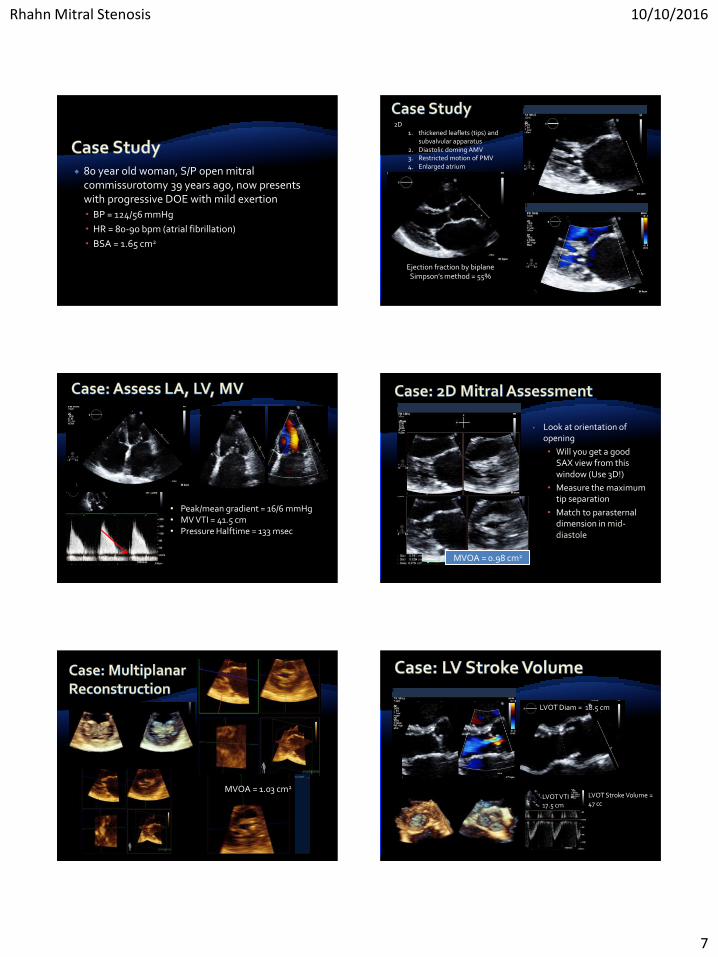
80 year old woman, S/P open mitral commissurotomy 39 years ago, now presents with progressive DOE with mild exertion
BP = 124/56 mmHg
HR = 80-90 bpm (atrial fibrillation)
BSA = 1.65 cm2
Ejection fraction by biplane Simpson’s method = 55%
2D1. thickened leaflets (tips) and
subvalvular apparatus2. Diastolic doming AMV3. Restricted motion of PMV4. Enlarged atrium
• Peak/mean gradient = 16/6 mmHg• MV VTI = 41.5 cm• Pressure Halftime = 133 msec
MVOA = 0.98 cm2
• Look at orientation of opening
• Will you get a good SAX view from this window (Use 3D!)
• Measure the maximum tip separation
• Match to parasternal dimension in mid-diastole
MVOA = 1.03 cm2
LVOT VTI = 17.5 cm
LVOT Diam = 18.5 cm
LVOT Stroke Volume = 47 cc
Rhahn Mitral Stenosis 10/10/2016
8
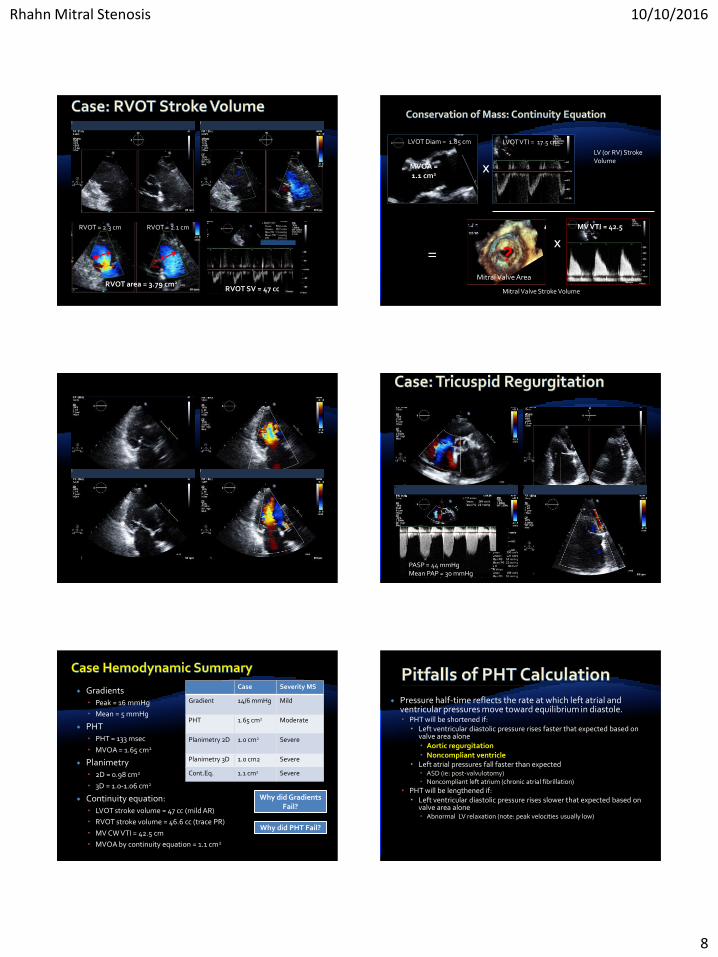
RVOT = 2.3 cm RVOT = 2.1 cm
RVOT area = 3.79 cm2
RVOT SV = 47 cc
X=
Mitral Valve Area
?
LV (or RV) Stroke Volume
Mitral Valve Stroke Volume
LVOT Diam = 1.85 cm LVOT VTI = 17.5 cm
X
MV VTI = 42.5
MVOA = 1.1 cm2
PASP = 44 mmHgMean PAP = 30 mmHg
Gradients Peak = 16 mmHg
Mean = 5 mmHg
PHT PHT = 133 msec
MVOA = 1.65 cm2
Planimetry 2D = 0.98 cm2
3D = 1.0-1.06 cm2
Continuity equation: LVOT stroke volume = 47 cc (mild AR)
RVOT stroke volume = 46.6 cc (trace PR)
MV CW VTI = 42.5 cm
MVOA by continuity equation = 1.1 cm2
Case Severity MS
Gradient 14/6 mmHg Mild
PHT 1.65 cm2 Moderate
Planimetry 2D 1.0 cm2 Severe
Planimetry 3D 1.0 cm2 Severe
Cont.Eq. 1.1 cm2 Severe
Why did Gradients Fail?
Why did PHT Fail?
Pressure half-time reflects the rate at which left atrial and ventricular pressures move toward equilibrium in diastole. PHT will be shortened if:
Left ventricular diastolic pressure rises faster that expected based on valve area alone Aortic regurgitation Noncompliant ventricle
Left atrial pressures fall faster than expected ASD (ie: post-valvulotomy) Noncompliant left atrium (chronic atrial fibrillation)
PHT will be lengthened if: Left ventricular diastolic pressure rises slower that expected based on
valve area alone Abnormal LV relaxation (note: peak velocities usually low)
Rhahn Mitral Stenosis 10/10/2016
9
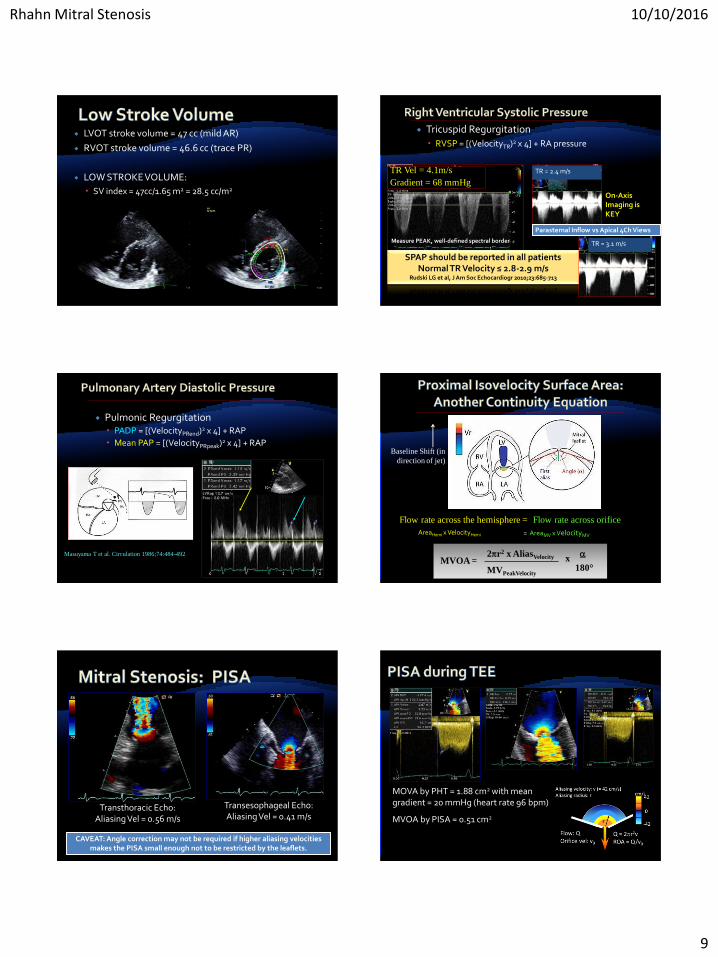
LVOT stroke volume = 47 cc (mild AR)
RVOT stroke volume = 46.6 cc (trace PR)
LOW STROKE VOLUME:
SV index = 47cc/1.65 m2 = 28.5 cc/m2
Tricuspid Regurgitation
RVSP = [(VelocityTR)2 x 4] + RA pressure
TR Vel = 4.1m/s
Gradient = 68 mmHg
SPAP should be reported in all patientsNormal TR Velocity ≤ 2.8-2.9 m/s
Rudski LG et al, J Am Soc Echocardiogr 2010;23:685-713
Measure PEAK, well-defined spectral border TR = 3.1 m/s
TR = 2.4 m/s
On-Axis Imaging is KEY
Parasternal Inflow vs Apical 4Ch Views
Pulmonic Regurgitation PADP = [(VelocityPRend)2 x 4] + RAP
Mean PAP = [(VelocityPRpeak)2 x 4] + RAP
Masuyama T et al. Circulation 1986;74:484-492
Flow rate across the hemisphere =
AreaHemi x VelocityHemi
Flow rate across orifice
= AreaMV x VelocityMV
Baseline Shift (in
direction of jet)
2r2 x AliasVelocity
MVPeakVelocity
x
180°MVOA =
Transthoracic Echo: Aliasing Vel = 0.56 m/s
Transesophageal Echo: Aliasing Vel = 0.41 m/s
CAVEAT: Angle correction may not be required if higher aliasing velocities makes the PISA small enough not to be restricted by the leaflets.
MOVA by PHT = 1.88 cm2 with mean gradient = 20 mmHg (heart rate 96 bpm)
MVOA by PISA = 0.51 cm2
Rhahn Mitral Stenosis 10/10/2016
10
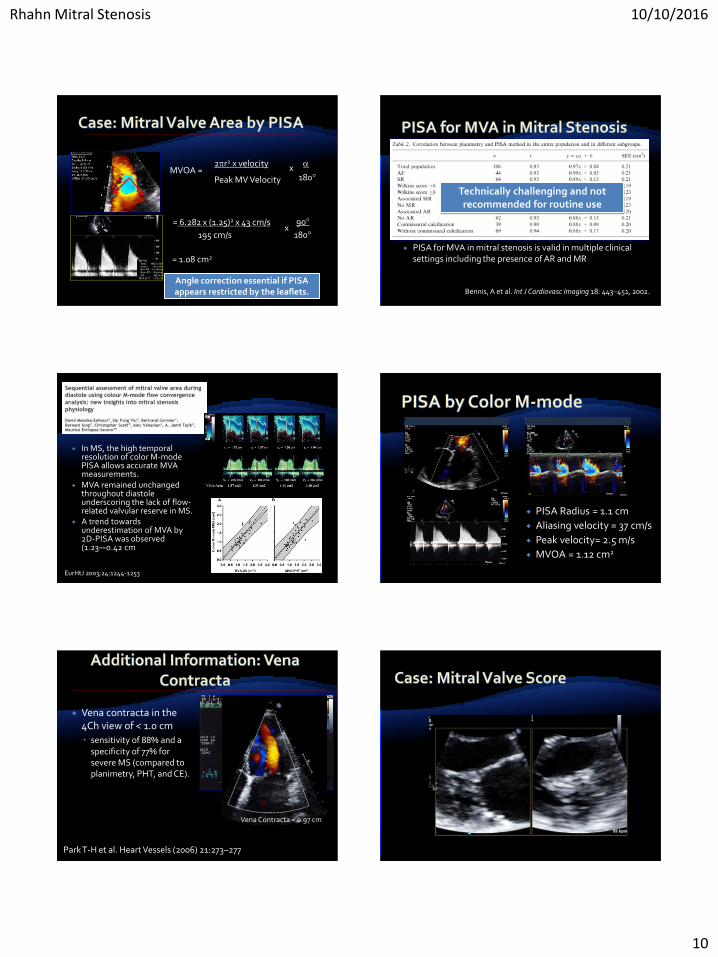
2r2 x velocity
Peak MV Velocityx
180°MVOA =
= 6.282 x (1.25)2 x 43 cm/s
195 cm/sx
90°
180°
= 1.08 cm2
Angle correction essential if PISA appears restricted by the leaflets.
PISA for MVA in mitral stenosis is valid in multiple clinical settings including the presence of AR and MR
Bennis, A et al. Int J Cardiovasc Imaging 18: 443–451, 2002.
Technically challenging and not recommended for routine use
In MS, the high temporal resolution of color M-mode PISA allows accurate MVA measurements.
MVA remained unchanged throughout diastole underscoring the lack of flow-related valvular reserve in MS.
A trend towards underestimation of MVA by 2D-PISA was observed (1.23―0.42 cm
EurHtJ 2003;24:1244-1253
PISA Radius = 1.1 cm
Aliasing velocity = 37 cm/s
Peak velocity= 2.5 m/s
MVOA = 1.12 cm2
Vena contracta in the 4Ch view of < 1.0 cm
sensitivity of 88% and a specificity of 77% for severe MS (compared to planimetry, PHT, and CE).
Park T-H et al. Heart Vessels (2006) 21:273–277
Vena Contracta = 0.97 cm
Rhahn Mitral Stenosis 10/10/2016
11
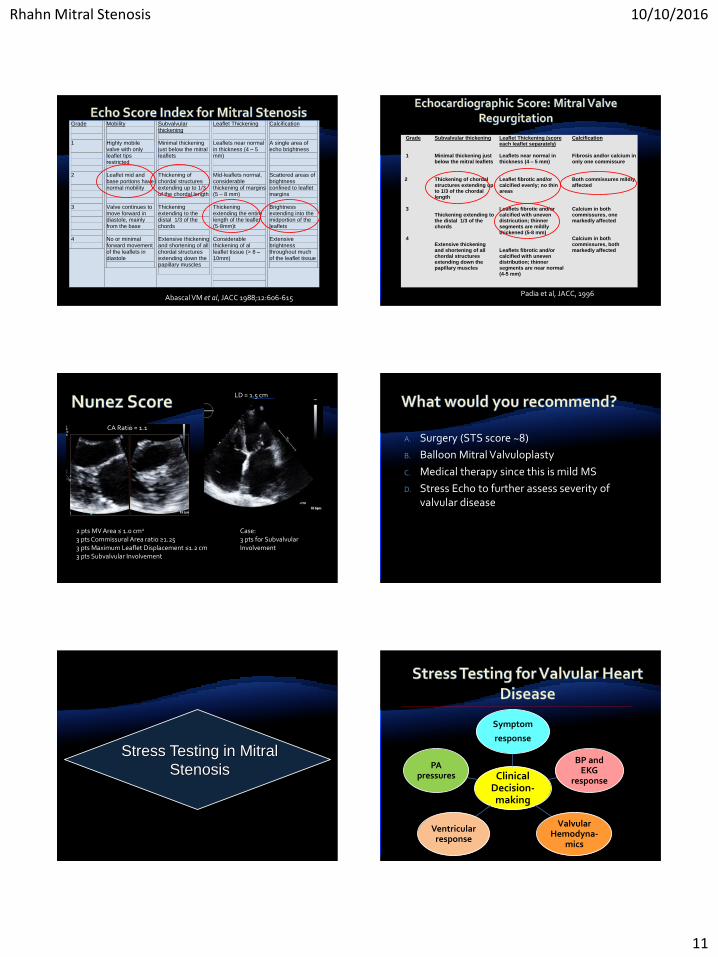
Grade 1
2 3 4
Mobility Highly mobile valve with only leaflet tips restricted Leaflet mid and base portions have normal mobility Valve continues to move forward in diastole, mainly from the base No or minimal forward movement of the leaflets in diastole
Subvalvular thickening Minimal thickening just below the mitral leaflets Thickening of chordal structures extending up to 1/3 of the chordal length Thickening extending to the distal 1/3 of the chords Extensive thickening and shortening of all chordal structures extending down the papillary muscles
Leaflet Thickening Leaflets near normal in thickness (4 – 5 mm) Mid-leaflets normal, considerable thickening of margins (5 – 8 mm) Thickening extending the entire length of the leaflet (5-8mm)t Considerable thickening of al leaflet tissue (> 8 – 10mm)
Calcification A single area of echo brightness Scattered areas of brightness confined to leaflet margins Brightness extending into the midportion of the leaflets Extensive brightness throughout much of the leaflet tissue
Abascal VM et al, JACC 1988;12:606-615
Grade 1
2 3 4
Subvalvular thickening Minimal thickening just below the mitral leaflets Thickening of chordal structures extending up to 1/3 of the chordal length Thickening extending to the distal 1/3 of the chords Extensive thickening and shortening of all chordal structures extending down the papillary muscles
Leaflet Thickening (score each leaflet separately) Leaflets near normal in thickness (4 – 5 mm) Leaflet fibrotic and/or calcified evenly; no thin areas Leaflets fibrotic and/or calcified with uneven districution; thinner segments are mildly thickened (5-8 mm) Leaflets fibrotic and/or calcified with uneven distribution; thinner segments are near normal (4-5 mm)
Calcification Fibrosis and/or calcium in only one commissure Both commissures mildly affected Calcium in both commissures, one markedly affected Calcium in both commissures, both markedly affected
Padia et al, JACC, 1996
2 pts MV Area ≤ 1.0 cm2
3 pts Commissural Area ratio ≥1.253 pts Maximum Leaflet Displacement ≤1.2 cm3 pts Subvalvular Involvement
Case: 3 pts for Subvalvular Involvement
LD = 1.5 cm
CA Ratio = 1.1
A. Surgery (STS score ~8)
B. Balloon Mitral Valvuloplasty
C. Medical therapy since this is mild MS
D. Stress Echo to further assess severity of valvular disease
Stress Testing in Mitral
Stenosis Clinical Decision-making
Symptom
response
BP and EKG
response
Valvular Hemodyna-
mics
Ventricular response
PA pressures
Rhahn Mitral Stenosis 10/10/2016
12
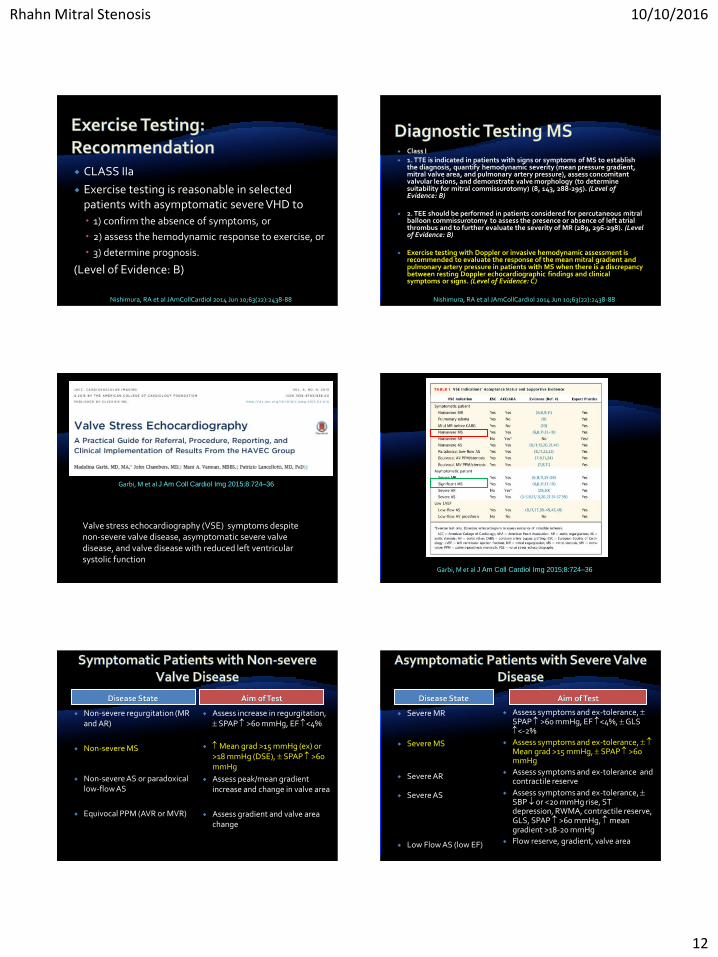
CLASS IIa
Exercise testing is reasonable in selected patients with asymptomatic severe VHD to
1) confirm the absence of symptoms, or
2) assess the hemodynamic response to exercise, or
3) determine prognosis.
(Level of Evidence: B)
Nishimura, RA et al JAmCollCardiol 2014 Jun 10;63(22):2438-88
Class I 1. TTE is indicated in patients with signs or symptoms of MS to establish
the diagnosis, quantify hemodynamic severity (mean pressure gradient, mitral valve area, and pulmonary artery pressure), assess concomitant valvular lesions, and demonstrate valve morphology (to determine suitability for mitral commissurotomy) (8, 143, 288-295). (Level of Evidence: B)
2. TEE should be performed in patients considered for percutaneous mitral balloon commissurotomy to assess the presence or absence of left atrial thrombus and to further evaluate the severity of MR (289, 296-298). (Level of Evidence: B)
Exercise testing with Doppler or invasive hemodynamic assessment is recommended to evaluate the response of the mean mitral gradient and pulmonary artery pressure in patients with MS when there is a discrepancy between resting Doppler echocardiographic findings and clinical symptoms or signs. (Level of Evidence: C)
Nishimura, RA et al JAmCollCardiol 2014 Jun 10;63(22):2438-88
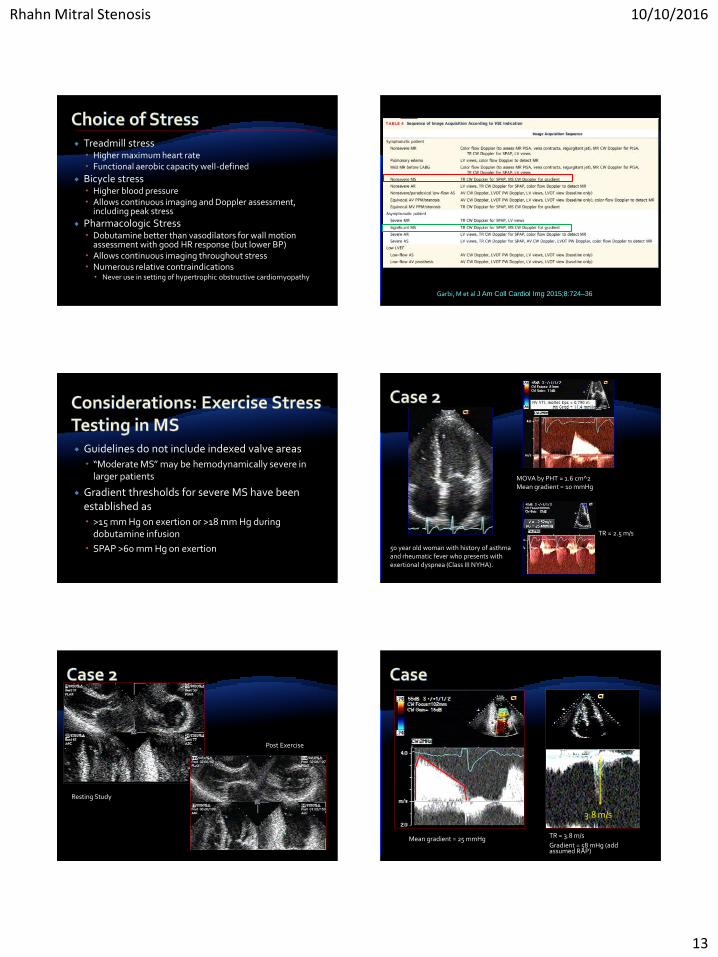
Garbi, M et al J Am Coll Cardiol Img 2015;8:724–36
Valve stress echocardiography (VSE) symptoms despite non-severe valve disease, asymptomatic severe valve disease, and valve disease with reduced left ventricular systolic function
Garbi, M et al J Am Coll Cardiol Img 2015;8:724–36
Disease State Aim of Test
Non-severe regurgitation (MR and AR)
Non-severe MS
Non-severe AS or paradoxical low-flow AS
Equivocal PPM (AVR or MVR)
Assess increase in regurgitation, SPAP >60 mmHg, EF <4%
Mean grad >15 mmHg (ex) or >18 mmHg (DSE), SPAP >60 mmHg
Assess peak/mean gradient increase and change in valve area
Assess gradient and valve area change
Disease State Aim of Test
Severe MR
Severe MS
Severe AR
Severe AS
Low Flow AS (low EF)
Assess symptoms and ex-tolerance, SPAP >60 mmHg, EF <4%, GLS <-2%
Assess symptoms and ex-tolerance, Mean grad >15 mmHg, SPAP >60 mmHg
Assess symptoms and ex-tolerance and contractile reserve
Assess symptoms and ex-tolerance, SBP or <20 mmHg rise, ST depression, RWMA, contractile reserve, GLS, SPAP >60 mmHg, mean gradient >18-20 mmHg
Flow reserve, gradient, valve area
Rhahn Mitral Stenosis 10/10/2016
13
Treadmill stress Higher maximum heart rate Functional aerobic capacity well-defined
Bicycle stress Higher blood pressure Allows continuous imaging and Doppler assessment,
including peak stress
Pharmacologic Stress Dobutamine better than vasodilators for wall motion
assessment with good HR response (but lower BP) Allows continuous imaging throughout stress Numerous relative contraindications
Never use in setting of hypertrophic obstructive cardiomyopathy
Garbi, M et al J Am Coll Cardiol Img 2015;8:724–36
Guidelines do not include indexed valve areas
“Moderate MS” may be hemodynamically severe in larger patients
Gradient thresholds for severe MS have been established as
>15 mm Hg on exertion or >18 mm Hg during dobutamine infusion
SPAP >60 mm Hg on exertion
MOVA by PHT = 1.6 cm^2Mean gradient = 10 mmHg
TR = 2.5 m/s
50 year old woman with history of asthma and rheumatic fever who presents with exertional dyspnea (Class III NYHA).
Resting Study
Post Exercise
3.8 m/s
Mean gradient = 25 mmHg TR = 3.8 m/s
Gradient = 58 mHg (add assumed RAP)

Rhahn Mitral Stenosis 10/10/2016
14
Calculation of mitral valve area by Doppler methods is controversial
Reliability of PHT calculation questionable
Mean transmitral gradients and peak tricuspid regurgitant velocities are reliable
Patient’s symptoms reliable
Exercise-induced pulmonary hypertension(>60-70 mmHg) warrants close follow-up
Nishimura, RA et al JAmCollCardiol 2014 Jun 10;63(22):2438-88
Which of the following parameters for assessing the severity of mitral stenosis is appropriate in all patients and correlates best with anatomic valve area ?
1. Continuity equation
2. Planimetry
3. Proximal isovelocity surface area
4. Mean transmitral gradient with exercise
Planimetry using 2D echocardiography of the mitral orifice has the advantage of being a direct measurement of mitral valve area and, unlike other methods, does not involve any hypothesis regarding flow conditions, cardiac chamber compliance, or associated valvular lesions.
In practice, planimetry has been shown to have the best correlation with anatomical valve area as assessed on explanted valves. For these reasons, planimetry is considered as the reference measurement of mitral valve area.
Baumgartner H et al. JASE 2009:22(1):1-23Level of recommendations: (1) appropriate in all patients (yellow); (2) reasonable in
selected patients (green);and (3) not recommended (blue).
Commissural Fusion
Rheumatic (commissural fusion)
Degenerative (mitral annular and leaflet calcification)
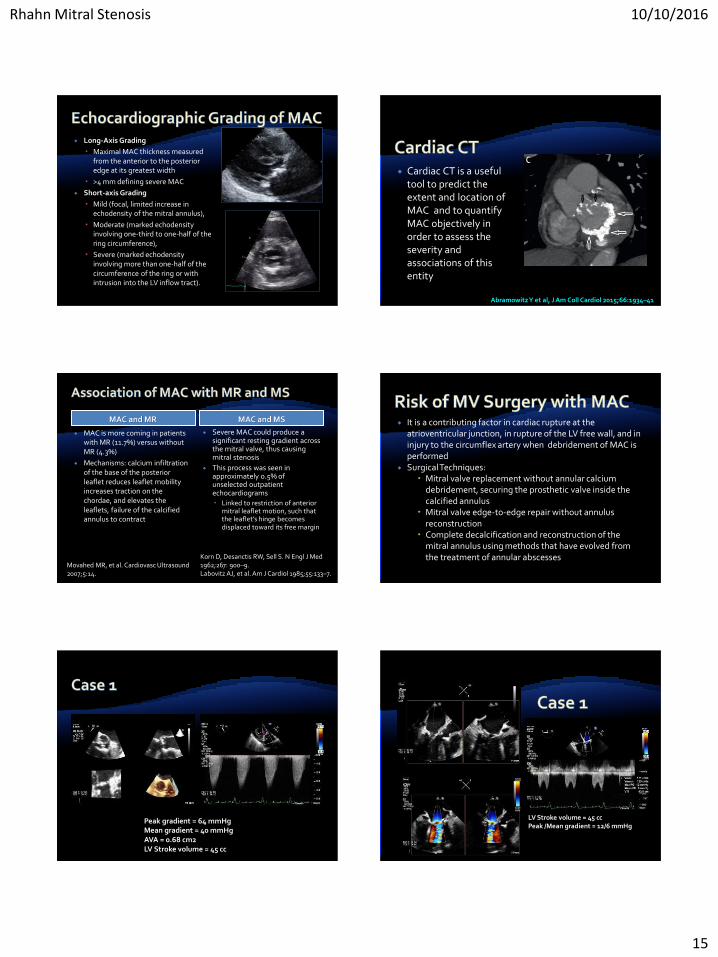
Abramowitz Y et al, J Am Coll Cardiol 2015;66:1934–41
• Mitral annulus calcification (MAC) is a chronic, degenerative process in the fibrous base of the mitral valve
• Mechanisms, such as atherosclerosis and abnormal calcium-phosphorus metabolism, also contribute to the development of MAC
• MAC is associated with an increased incidence of cardiovascular disease, mitral valve disease, arrhythmias, and mortality.
Rhahn Mitral Stenosis 10/10/2016
15
Long-Axis Grading
Maximal MAC thickness measured from the anterior to the posterior edge at its greatest width
>4 mm defining severe MAC
Short-axis Grading
Mild (focal, limited increase in echodensity of the mitral annulus),
Moderate (marked echodensityinvolving one-third to one-half of the ring circumference),
Severe (marked echodensityinvolving more than one-half of the circumference of the ring or with intrusion into the LV inflow tract).
Cardiac CT is a useful tool to predict the extent and location of MAC and to quantify MAC objectively in order to assess the severity and associations of this entity
Abramowitz Y et al, J Am Coll Cardiol 2015;66:1934–41
MAC and MR MAC and MS
MAC is more coming in patients with MR (11.7%) versus without MR (4.3%)
Mechanisms: calcium infiltration of the base of the posterior leaflet reduces leaflet mobility increases traction on the chordae, and elevates the leaflets, failure of the calcified annulus to contract
Severe MAC could produce a significant resting gradient across the mitral valve, thus causing mitral stenosis
This process was seen in approximately 0.5% of unselected outpatient echocardiograms
Linked to restriction of anterior mitral leaflet motion, such that the leaflet’s hinge becomes displaced toward its free margin
Movahed MR, et al. Cardiovasc Ultrasound 2007;5:14.
Korn D, Desanctis RW, Sell S. N Engl J Med 1962;267: 900–9.Labovitz AJ, et al. Am J Cardiol 1985;55:133–7.
It is a contributing factor in cardiac rupture at the atrioventricular junction, in rupture of the LV free wall, and in injury to the circumflex artery when debridement of MAC is performed
Surgical Techniques: Mitral valve replacement without annular calcium
debridement, securing the prosthetic valve inside the calcified annulus
Mitral valve edge-to-edge repair without annulus reconstruction
Complete decalcification and reconstruction of the mitral annulus using methods that have evolved from the treatment of annular abscesses
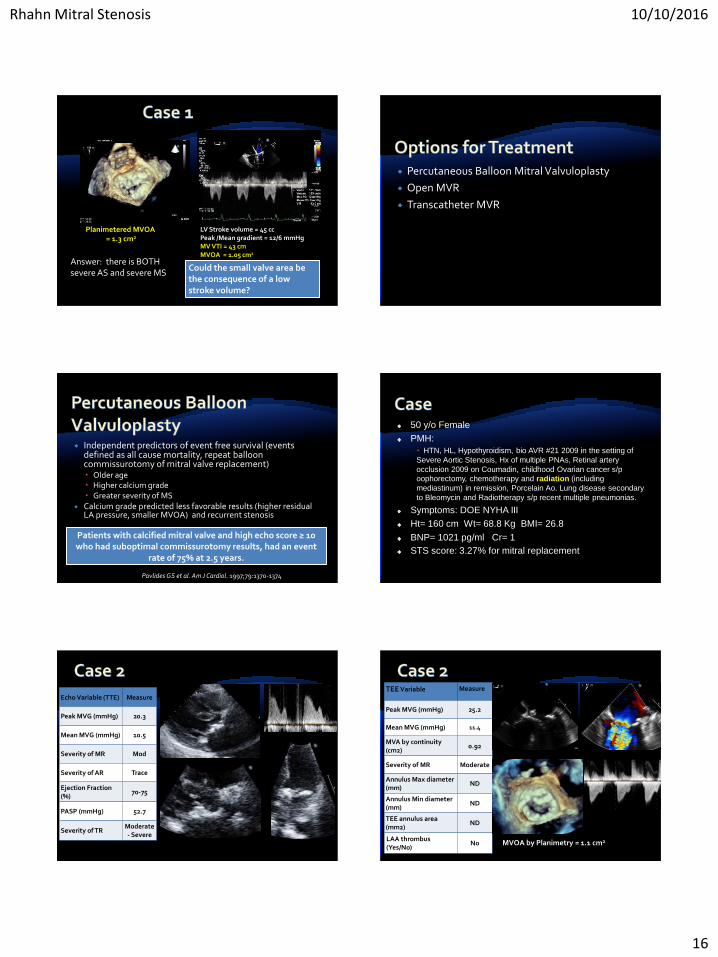
Peak gradient = 64 mmHgMean gradient = 40 mmHgAVA = 0.68 cm2LV Stroke volume = 45 cc
LV Stroke volume = 45 ccPeak /Mean gradient = 12/6 mmHg
Rhahn Mitral Stenosis 10/10/2016
16
LV Stroke volume = 45 ccPeak /Mean gradient = 12/6 mmHgMV VTI = 43 cmMVOA = 1.05 cm2
Planimetered MVOA= 1.3 cm2
Could the small valve area be the consequence of a low stroke volume?
Answer: there is BOTH severe AS and severe MS
Percutaneous Balloon Mitral Valvuloplasty
Open MVR
Transcatheter MVR
Independent predictors of event free survival (events defined as all cause mortality, repeat balloon commissurotomy of mitral valve replacement) Older age Higher calcium grade Greater severity of MS
Calcium grade predicted less favorable results (higher residual LA pressure, smaller MVOA) and recurrent stenosis
Patients with calcified mitral valve and high echo score ≥ 10 who had suboptimal commissurotomy results, had an event
rate of 75% at 2.5 years.
Pavlides GS et al. Am J Cardiol. 1997;79:1370-1374
50 y/o Female
PMH:
HTN, HL, Hypothyroidism, bio AVR #21 2009 in the setting of
Severe Aortic Stenosis, Hx of multiple PNAs, Retinal artery
occlusion 2009 on Coumadin, childhood Ovarian cancer s/p
oophorectomy, chemotherapy and radiation (including
mediastinum) in remission, Porcelain Ao. Lung disease secondary
to Bleomycin and Radiotherapy s/p recent multiple pneumonias.
Symptoms: DOE NYHA III
Ht= 160 cm Wt= 68.8 Kg BMI= 26.8
BNP= 1021 pg/ml Cr= 1
STS score: 3.27% for mitral replacement
Echo Variable (TTE) Measure
Peak MVG (mmHg) 20.3
Mean MVG (mmHg) 10.5
Severity of MR Mod
Severity of AR Trace
Ejection Fraction (%)
70-75
PASP (mmHg) 52.7
Severity of TRModerate - Severe
TEE Variable Measure
Peak MVG (mmHg) 25.2
Mean MVG (mmHg) 11.4
MVA by continuity(cm2)
0.92
Severity of MR Moderate
Annulus Max diameter (mm)
ND
Annulus Min diameter (mm)
ND
TEE annulus area (mm2)
ND
LAA thrombus (Yes/No)
No MVOA by Planimetry = 1.1 cm2
Rhahn Mitral Stenosis 10/10/2016
17
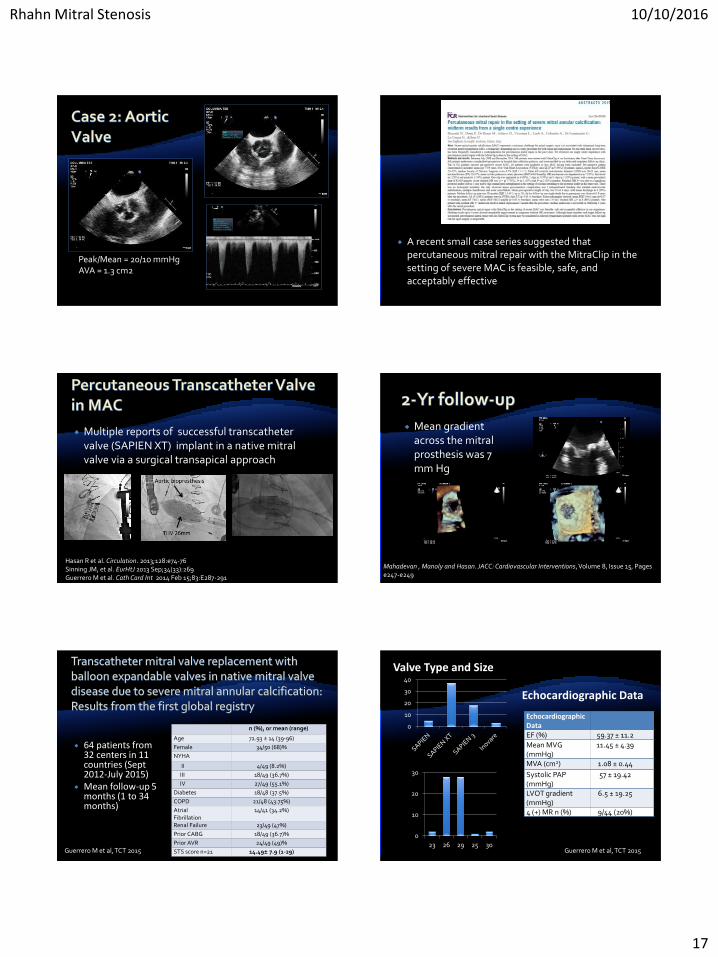
Peak/Mean = 20/10 mmHgAVA = 1.3 cm2
A recent small case series suggested that percutaneous mitral repair with the MitraClip in the setting of severe MAC is feasible, safe, and acceptably effective
Multiple reports of successful transcatheter valve (SAPIEN XT) implant in a native mitral valve via a surgical transapical approach
Hasan R et al. Circulation. 2013;128:e74-76Sinning JM, et al. EurHtJ 2013 Sep;34(33):269Guerrero M et al. Cath Card Int 2014 Feb 15;83:E287-291
Mean gradient across the mitral prosthesis was 7 mm Hg
Mahadevan , Manoly and Hasan. JACC: Cardiovascular Interventions, Volume 8, Issue 15, Pages e247-e249
64 patients from 32 centers in 11 countries (Sept 2012-July 2015)
Mean follow-up 5 months (1 to 34 months)
Guerrero M et al, TCT 2015
n (%), or mean (range)
Age 72.93 ± 14 (39-96)
Female 34/50 (68)%
NYHA
II 4/49 (8.2%)
III 18/49 (36.7%)
IV 27/49 (55.1%)
Diabetes 18/48 (37.5%)
COPD 21/48 (43.75%)
Atrial Fibrillation
14/41 (34.2%)
Renal Failure 23/49 (47%)
Prior CABG 18/49 (36.7)%
Prior AVR 24/49 (49)%
STS score n=21 14.49± 7.9 (1-29)
Valve Type and Size
0
10
20
30
40
0
10
20
30
23 26 29 25 30
EchocardiographicDataEF (%) 59.37 ± 11.2
Mean MVG(mmHg)
11.45 ± 4.39
MVA (cm2) 1.08 ± 0.44
Systolic PAP (mmHg)
57 ± 19.42
LVOT gradient(mmHg)
6.5 ± 19.25
4 (+) MR n (%) 9/44 (20%)
Echocardiographic Data
Guerrero M et al, TCT 2015
Rhahn Mitral Stenosis 10/10/2016
18
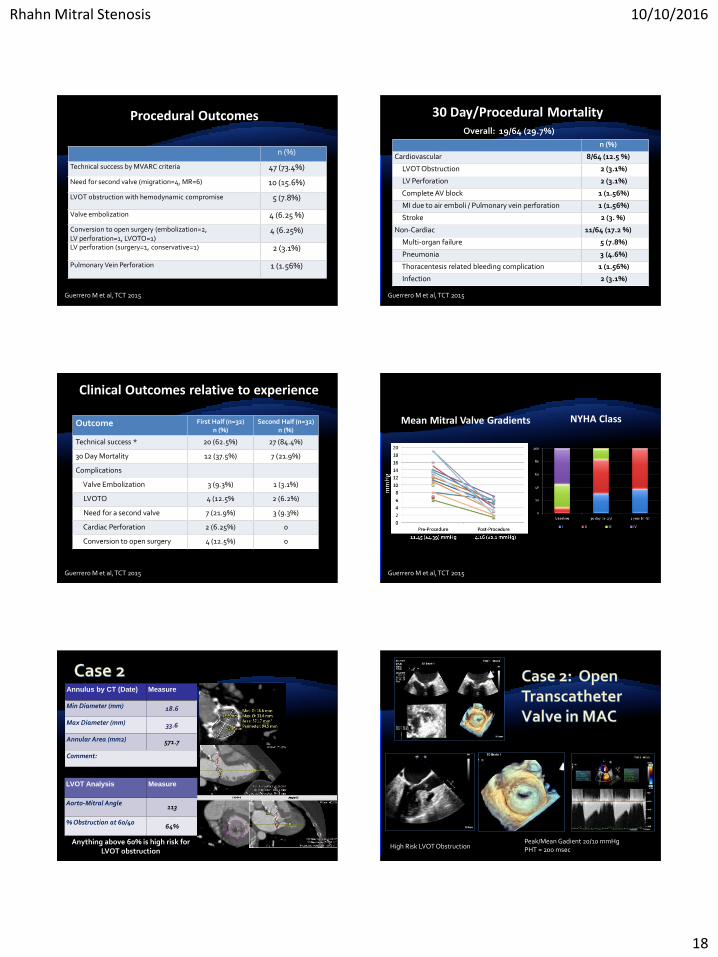
Procedural Outcomes
n (%)
Technical success by MVARC criteria 47 (73.4%)
Need for second valve (migration=4, MR=6) 10 (15.6%)
LVOT obstruction with hemodynamic compromise 5 (7.8%)
Valve embolization 4 (6.25 %)
Conversion to open surgery (embolization=2, LV perforation=1, LVOTO=1)
4 (6.25%)
LV perforation (surgery=1, conservative=1) 2 (3.1%)
Pulmonary Vein Perforation 1 (1.56%)
Guerrero M et al, TCT 2015
30 Day/Procedural Mortality
n (%)
Cardiovascular 8/64 (12.5 %)
LVOT Obstruction 2 (3.1%)
LV Perforation 2 (3.1%)
Complete AV block 1 (1.56%)
MI due to air emboli / Pulmonary vein perforation 1 (1.56%)
Stroke 2 (3. %)
Non-Cardiac 11/64 (17.2 %)
Multi-organ failure 5 (7.8%)
Pneumonia 3 (4.6%)
Thoracentesis related bleeding complication 1 (1.56%)
Infection 2 (3.1%)
Overall: 19/64 (29.7%)
Guerrero M et al, TCT 2015
Clinical Outcomes relative to experience
Outcome First Half (n=32)n (%)
Second Half (n=32)n (%)
Technical success * 20 (62.5%) 27 (84.4%)
30 Day Mortality 12 (37.5%) 7 (21.9%)
Complications
Valve Embolization 3 (9.3%) 1 (3.1%)
LVOTO 4 (12.5% 2 (6.2%)
Need for a second valve 7 (21.9%) 3 (9.3%)
Cardiac Perforation 2 (6.25%) 0
Conversion to open surgery 4 (12.5%) 0
Guerrero M et al, TCT 2015
Mean Mitral Valve Gradients
Guerrero M et al, TCT 2015
NYHA Class
Annulus by CT (Date) Measure
Min Diameter (mm) 18.6
Max Diameter (mm) 33.6
Annular Area (mm2) 571.7
Comment:
LVOT Analysis Measure
Aorto-Mitral Angle113
% Obstruction at 60/4064%
Anything above 60% is high risk for LVOT obstruction
High Risk LVOT ObstructionPeak/Mean Gadient 20/10 mmHgPHT = 200 msec
Rhahn Mitral Stenosis 10/10/2016
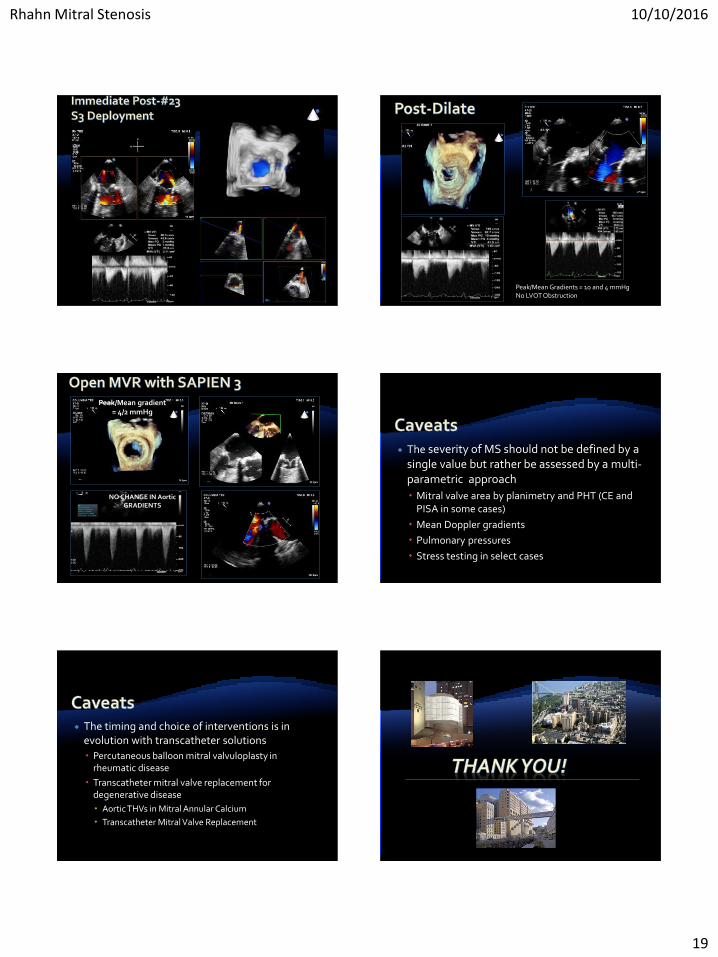
19
Peak/Mean Gradients = 10 and 4 mmHgNo LVOT Obstruction
NO CHANGE IN Aortic GRADIENTS
Peak/Mean gradient = 4/2 mmHg
The severity of MS should not be defined by a single value but rather be assessed by a multi-parametric approach
Mitral valve area by planimetry and PHT (CE and PISA in some cases)
Mean Doppler gradients
Pulmonary pressures
Stress testing in select cases
The timing and choice of interventions is in evolution with transcatheter solutions
Percutaneous balloon mitral valvuloplasty in rheumatic disease
Transcatheter mitral valve replacement for degenerative disease
Aortic THVs in Mitral Annular Calcium
Transcatheter Mitral Valve Replacement