rfms glycan characterization techniques for … glycan characterization techniques for...
TRANSCRIPT

RFMS Glycan Characterization Techniques for Biotherapeutics
Dr Mark Hilliard, NIBRT
Waters THE SCIENCE OF WHAT’S POSSIBLETM
The Complexity of Glycosylation
Glycosylation is the most common posttranslational modification. Glycosylation of proteins is a complex process leading to
‘glycoforms’ of the same protein.
Glycans are branched, therefore leading to a higher degree of structural complexity (unlike DNA and proteins ).
Sugar chains can be linked to the protein through either the nitrogen atom of asparagine residues (N-linked glycans) or via the hydroxyl group of serine and threonine residues (O-linked glycans).

Biopharmaceuticals and recombinant proteins: Quality control – the determination of correct product glycosylation is essential in order to ensure the efficacy and safety of therapeutic products.
International Conference on Harmonisation (ICH) Guideline Q6B requires carbohydrate content, structure, and glycosylation sites
present on therapeutic proteins to be characterised as extensively as possible
Motivation for Understanding Glycosylation

Classes of N-Linked Glycans
Complex Hybrid High Mannose

Asn
Asn Desialylation of intravenous immunoglobulin abrogates its anti-inflammatory properties Kaneko et al (2006). Science; 313(5787): 670-673
Loss of sialylation decreases EPO half-life from 2 h to 10 min Fukuda et al (1989). Blood; 73(1): 84-89
Asn Presence of gal-α(1,3)-gal can induce anaphylaxis (shock) and can be present on biotherapeutics Chung et al (2006). N Engl J Med; 358(11): 1109-1117
Influence on Biopharmaceutical Production
Asn
Asn
Half of the population have antibodies against β(1,2)-xylose and α(1,3)-core fucose Bardor et al (1995). Glycobiology; 13(6): 427-434

Glycosylated Therapeutic Proteins
Over 190 EMA/FDA Approved Therapeutic Proteins. Over 127 are Glycoproteins (>66%) (Walsh: Nature
Biotechnology 28, 917–924 (2010)

Glycan Release Considerations
• Different enzymes exist that facilitate the easy release of N-glycans from glycoproteins.
PNGase F / PNGase A cleavage site Endoglycosidase cleavage site: Endo F1,
Endo H, Endo M, Endo B
N X≠P
S/T
High Mannose N-glycans
Endo D cleaves paucimannose sugars
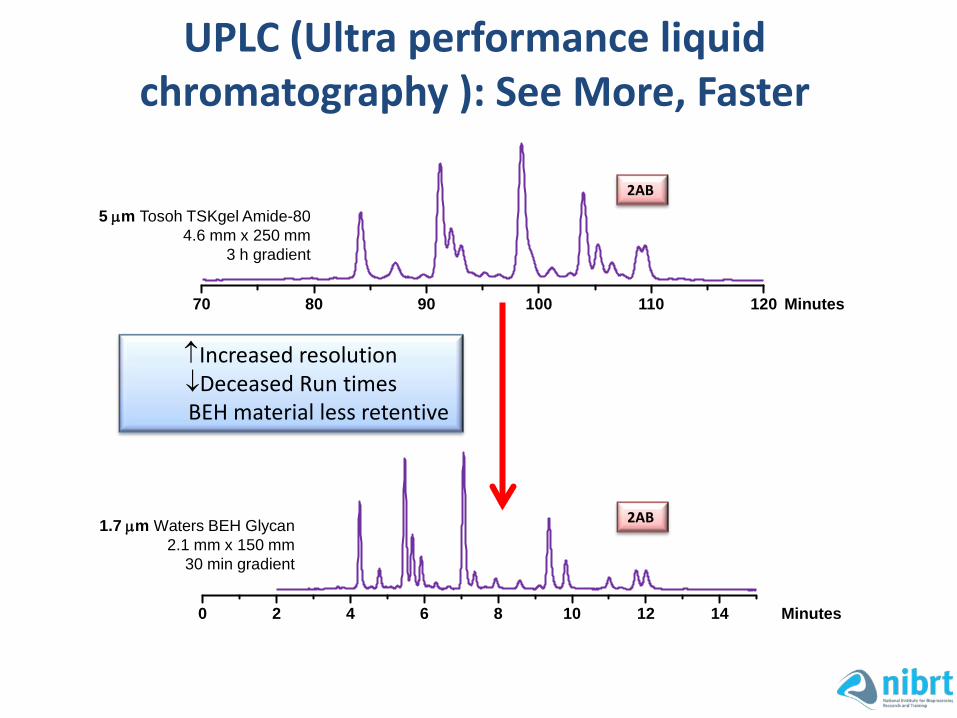
UPLC (Ultra performance liquid chromatography ): See More, Faster
70 80 90 100 110 120 Minutes
5 µm Tosoh TSKgel Amide-80 4.6 mm x 250 mm
3 h gradient
2 4 6 8 10 12 14 0 Minutes
1.7 µm Waters BEH Glycan 2.1 mm x 150 mm
30 min gradient
↑Increased resolution ↓Deceased Run times
BEH material less retentive
2AB
2AB
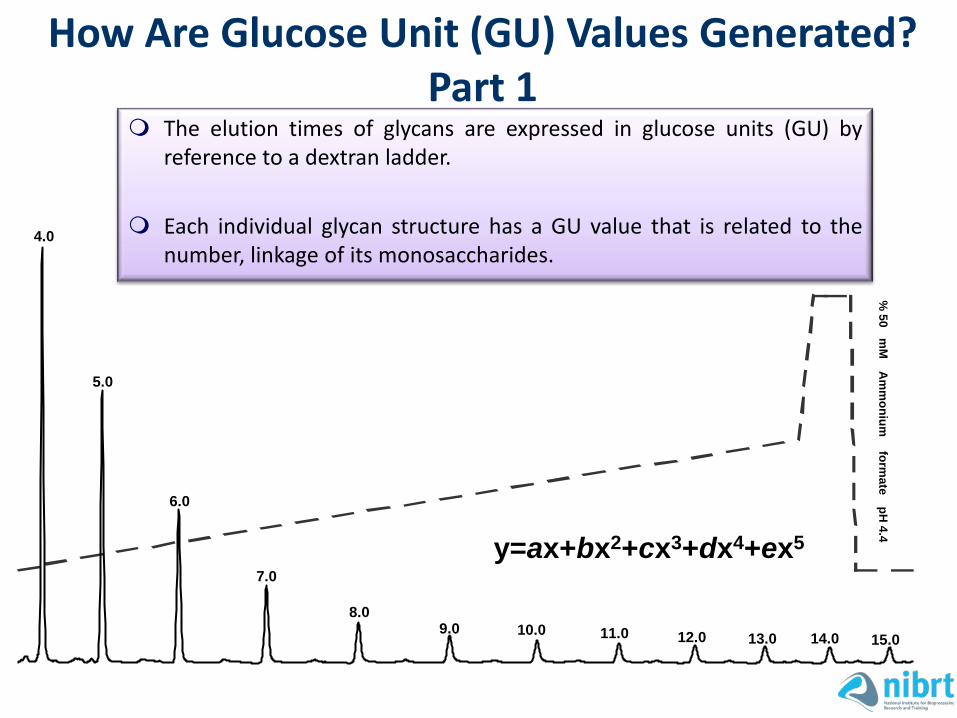
The elution times of glycans are expressed in glucose units (GU) by reference to a dextran ladder.
Each individual glycan structure has a GU value that is related to the
number, linkage of its monosaccharides.
% 50 m
M
Am
monium
form
ate pH
4.4
4.0
5.0
6.0
7.0
8.0 9.0 10.0 11.0 12.0 13.0 14.0 15.0
y=ax+bx2+cx3+dx4+ex5
How Are Glucose Unit (GU) Values Generated? Part 1
Retention Time (min)
5.0
6.0
7.0 8.0
9.0 10.0 11.0
5.41
5.77
6.25
6.71
6.
84
6.95
7.
08
7.20
7.52
7.63
7.
76
8.05
8.41
8.81
9.04
9.67
10.0
10
.2
5.89
0 16
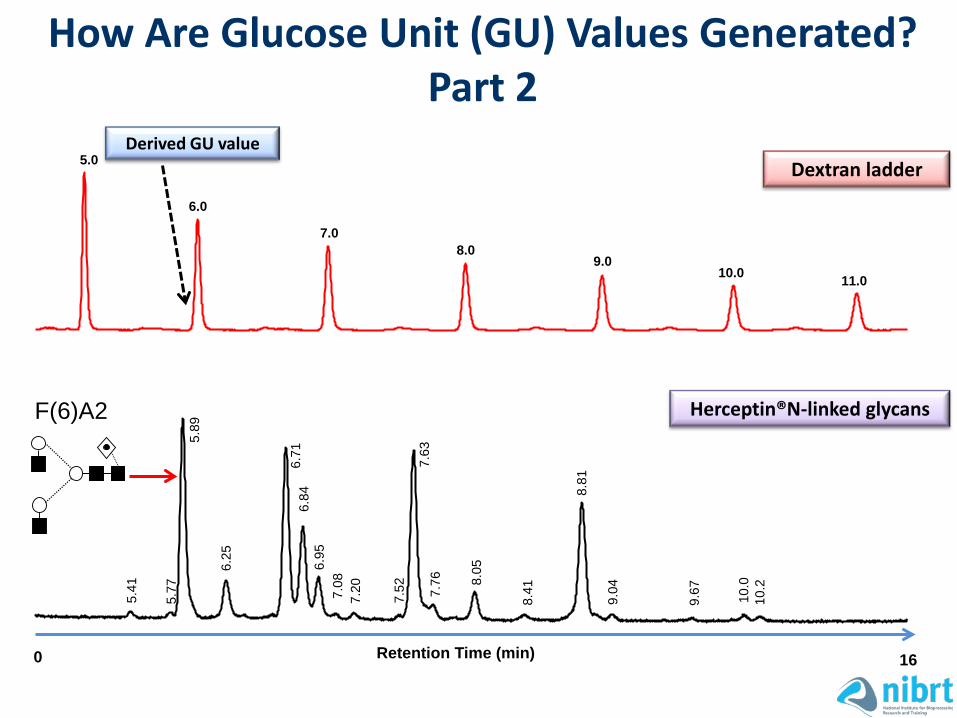
Dextran ladder
Herceptin®N-linked glycans F(6)A2
Derived GU value
How Are Glucose Unit (GU) Values Generated? Part 2

GU Value Caveats • Whilst GU values are helpful, their validity is dependent upon:
– The column chemistry and separation conditions used for their generation, – The sugar ladder used for their annotation, – The method used to fit the regression line, – Associated R2 value.
10 20 30 40 50 60 70 80 90 100 110 120 130 140Retention Time [min]
1 2 3 4 5 6 7 8 9 10 11 12 13 14 15 16GU
Glc (α1→6)n
Glc (α1→4)n
Mittermayr & Guttman, Electrophoresis, 33, 2012, 1000-7

GU Increments with Sugar Addition Linkage position
2 3
4
8 6
2 3
4
8 6
2 3
4
8 6
2 3
4
8 6
Linkage position
unknown linkage
β - linkage
- linkage
Linkage type
unknown linkage
- linkage
α - linkage
Linkage type
Glc
GlcNAc
Gal
GalNAc
Fuc
NeuNAc
Man
Symbol for sugar
Xylose
NeuNAc
Man
Xylose
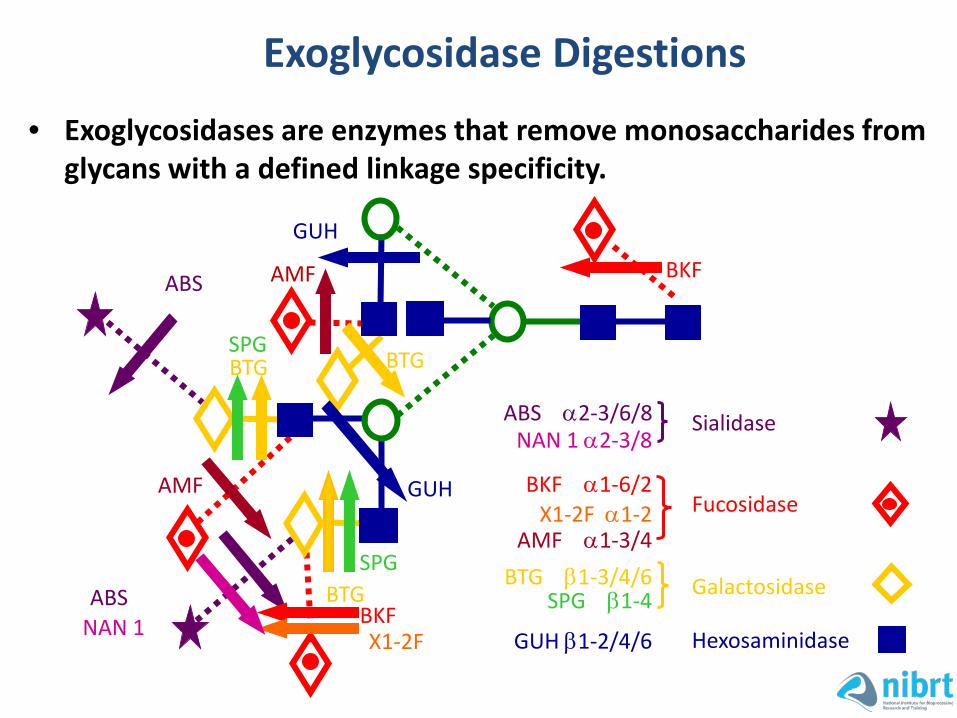
Exoglycosidase Digestions
• Exoglycosidases are enzymes that remove monosaccharides from glycans with a defined linkage specificity.
ABS NAN 1
ABS α2-3/6/8 NAN 1 α2-3/8
Sialidase
ABS
AMF
BKF
X1-2F
AMF
BKF
BKF α1-6/2 X1-2F α1-2 Fucosidase
AMF α1-3/4
SPG BTG
SPG BTG
BTG
SPG β1-4 BTG β1-3/4/6 Galactosidase
GUH
GUH
GUH β1-2/4/6 Hexosaminidase

RELEASED LABELLED GLYCANS
Wash
Elute Elute
Dry
Resuspend
Dry
2-AB Label
Formic Acid
Elute
Biotherapeutic denaturation with RapiGest SF
PNGase F
Exoglycosidase array of Etanercept by UPLC analysis
Search Glycobase 3.2 for preliminary identification
Overview of N-linked Glycan Release with UPLC Analysis
Identification
Glycan identity confirmed by mass spectrometry HILIC-FLR-MS/MS
FLR
MS1
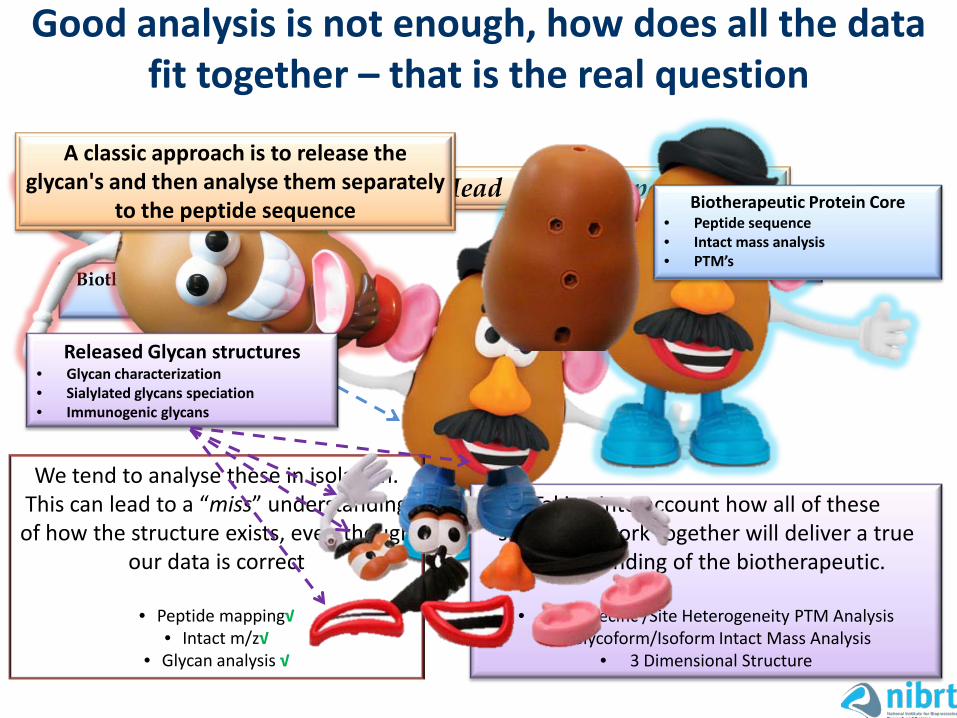
Biotherapeutic Protein Core
Glycan Structures
Mr. Potato Head “Biotherapeutic”
We tend to analyse these in isolation. This can lead to a “miss” understanding of how the structure exists, even though
our data is correct
• Peptide mapping√ • Intact m/z√
• Glycan analysis √
Taking into account how all of these structures work together will deliver a true
understanding of the biotherapeutic.
• Site Specific /Site Heterogeneity PTM Analysis • Glycoform/Isoform Intact Mass Analysis
• 3 Dimensional Structure
Good analysis is not enough, how does all the data fit together – that is the real question
Biotherapeutic Protein Core • Peptide sequence • Intact mass analysis • PTM’s
Released Glycan structures • Glycan characterization • Sialylated glycans speciation • Immunogenic glycans
A classic approach is to release the glycan's and then analyse them separately
to the peptide sequence

RapiFluor-MS (RFMS) label provides over X10 FLR and X100 MS sensitivity compared to the 2AB label
A
B
MS1 analysis
MS1 analysis
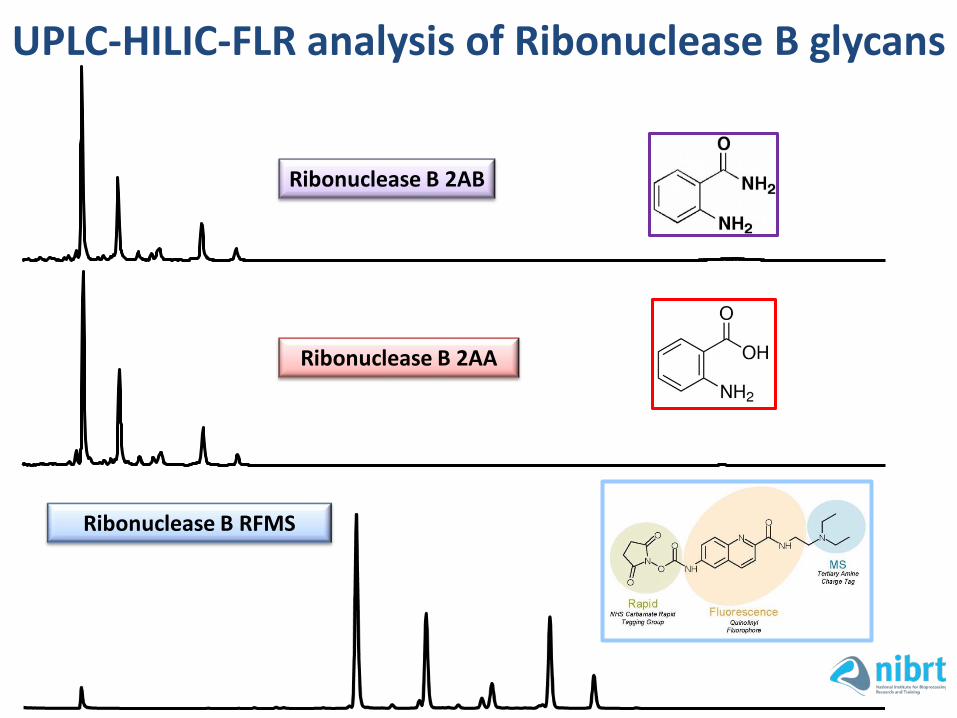
Ribonuclease B 2AB
Ribonuclease B 2AA
Ribonuclease B RFMS
UPLC-HILIC-FLR analysis of Ribonuclease B glycans

2-aminobenzoic acid 2-aminobenzamide
2-aminopyridine 2-aminoacridone Aniline
There are a number of Tags available, but the standard labeling method can take days
to complete!
2AB/2AA N-Glycan sample preparation
Labeling can take 1-2 days, sometimes longer!!
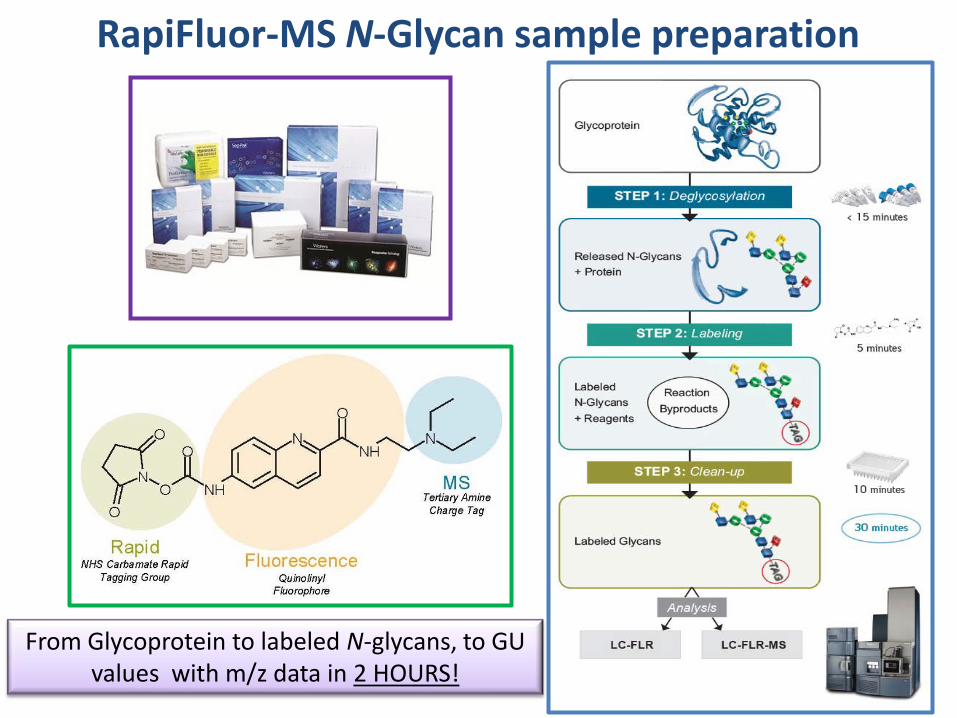
RapiFluor-MS N-Glycan sample preparation
From Glycoprotein to labeled N-glycans, to GU values with m/z data in 2 HOURS!
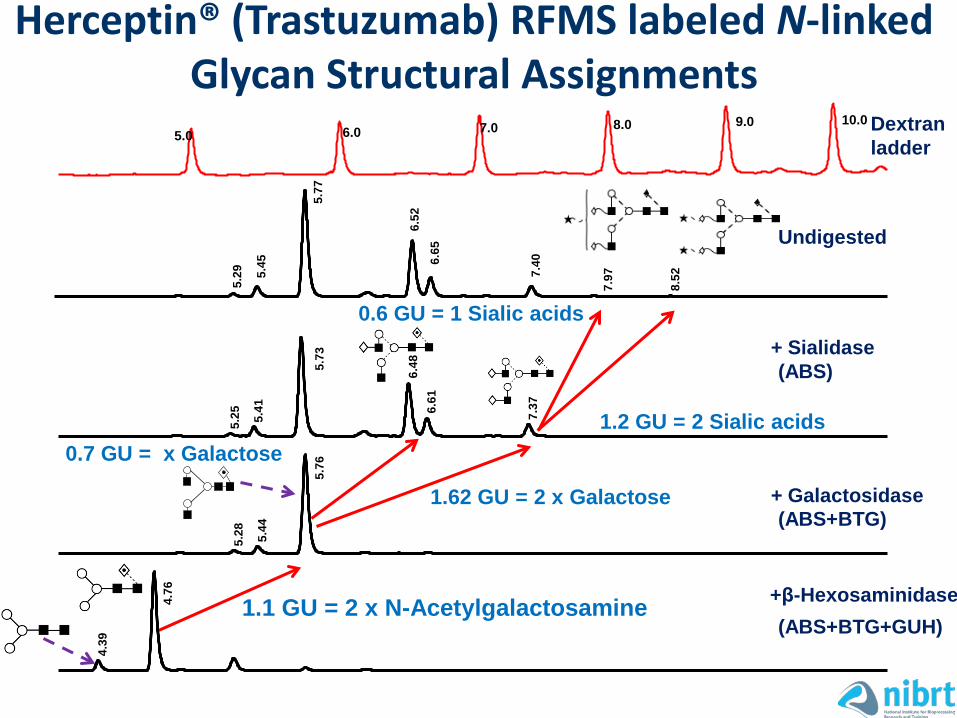
5.29
5.45
5.77
6.52
6.
65
7.40
7.97
8.52
5.0 6.0 7.0 8.0 9.0 10.0
5.28
5.44
5.76
+ Galactosidase (ABS+BTG)
5.25
5.41
5.73
6.48
6.
61
7.37
+ Sialidase (ABS)
Dextran ladder
0.6 GU = 1 Sialic acids
1.2 GU = 2 Sialic acids
Undigested
1.1 GU = 2 x N-Acetylgalactosamine
4.39
4.76
+β-Hexosaminidase (ABS+BTG+GUH)
1.62 GU = 2 x Galactose
0.7 GU = x Galactose
Herceptin® (Trastuzumab) RFMS labeled N-linked Glycan Structural Assignments
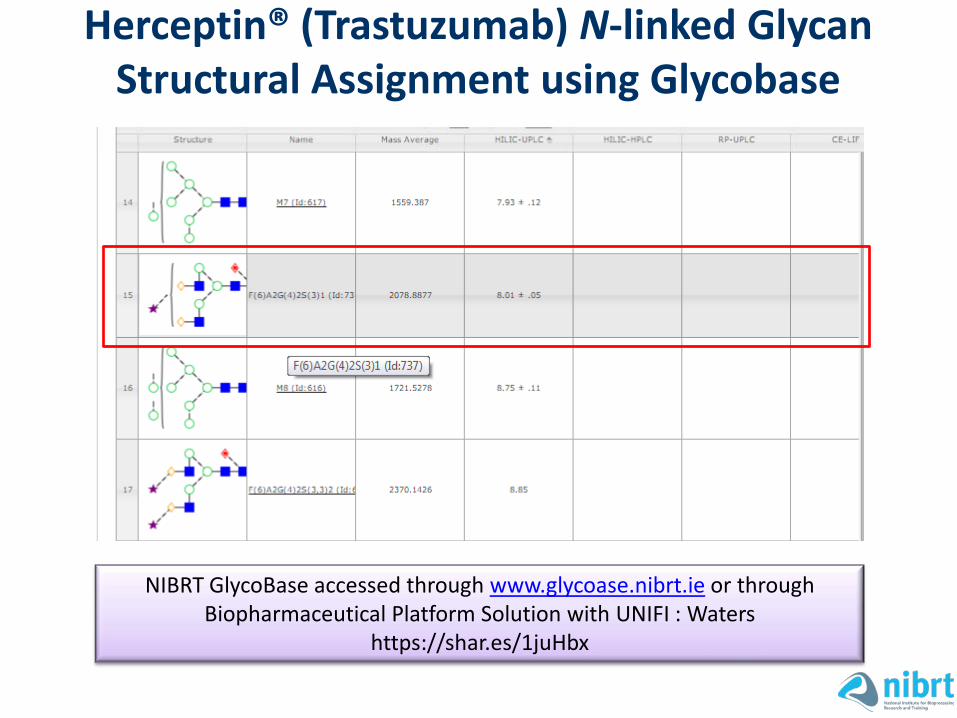
Herceptin® (Trastuzumab) N-linked Glycan Structural Assignment using Glycobase
NIBRT GlycoBase accessed through www.glycoase.nibrt.ie or through Biopharmaceutical Platform Solution with UNIFI : Waters
https://shar.es/1juHbx
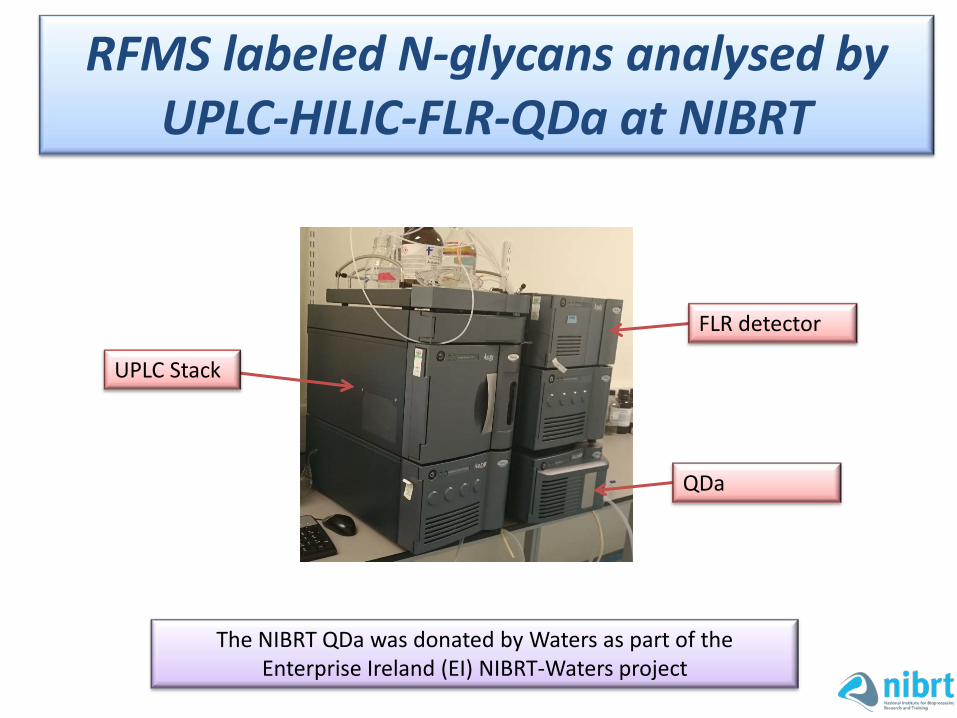
RFMS labeled N-glycans analysed by UPLC-HILIC-FLR-QDa at NIBRT
UPLC Stack
FLR detector
QDa
The NIBRT QDa was donated by Waters as part of the Enterprise Ireland (EI) NIBRT-Waters project

UPLC-HILIC-FLR-QDa analysis EU
0.00
100.00
200.00
300.00
400.00
500.00
600.00
700.00
800.00
900.00
1000.00
1100.00
1200.00In
tens
ity
0.0
2.0x10⁶
4.0x10⁶
6.0x10⁶
8.0x10⁶
1.0x10⁷
1.2x10⁷
1.4x10⁷
1.6x10⁷
1.8x10⁷
2.0x10⁷
2.2x10⁷
2.4x10⁷
Minutes10.00 11.00 12.00 13.00 14.00 15.00 16.00 17.00 18.00 19.00 20.00 21.00 22.00 23.00 24.00 25.00
FLR*
QDa
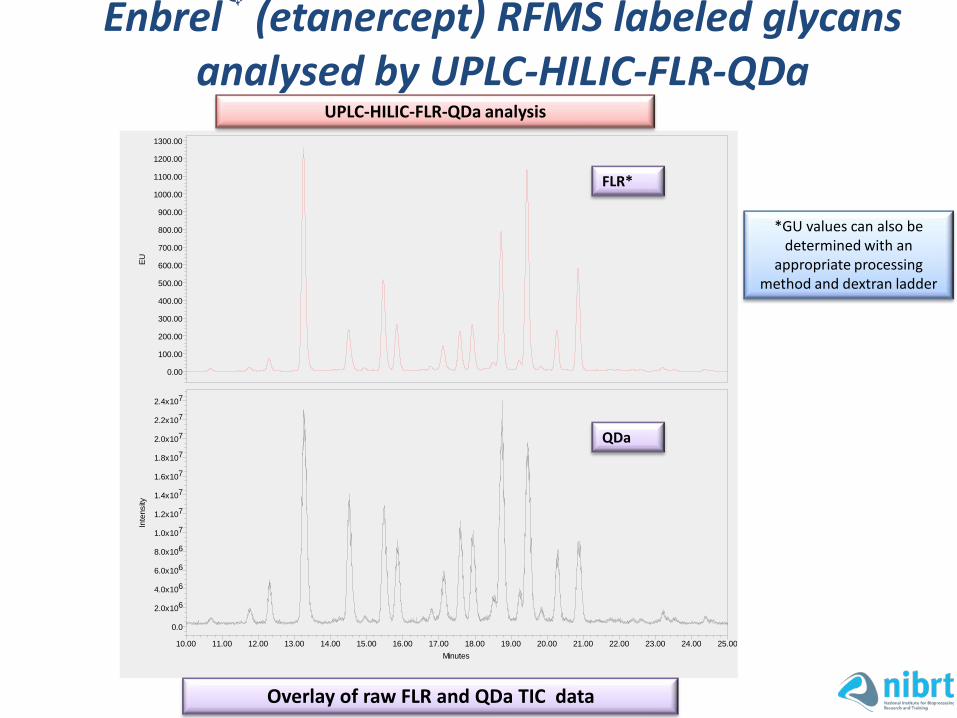
Overlay of raw FLR and QDa TIC data
Herceptin RFMS labeled glycans analysed by UPLC-HILIC-FLR-QDa
*GU values can also be determined with an
appropriate processing method and dextran ladder
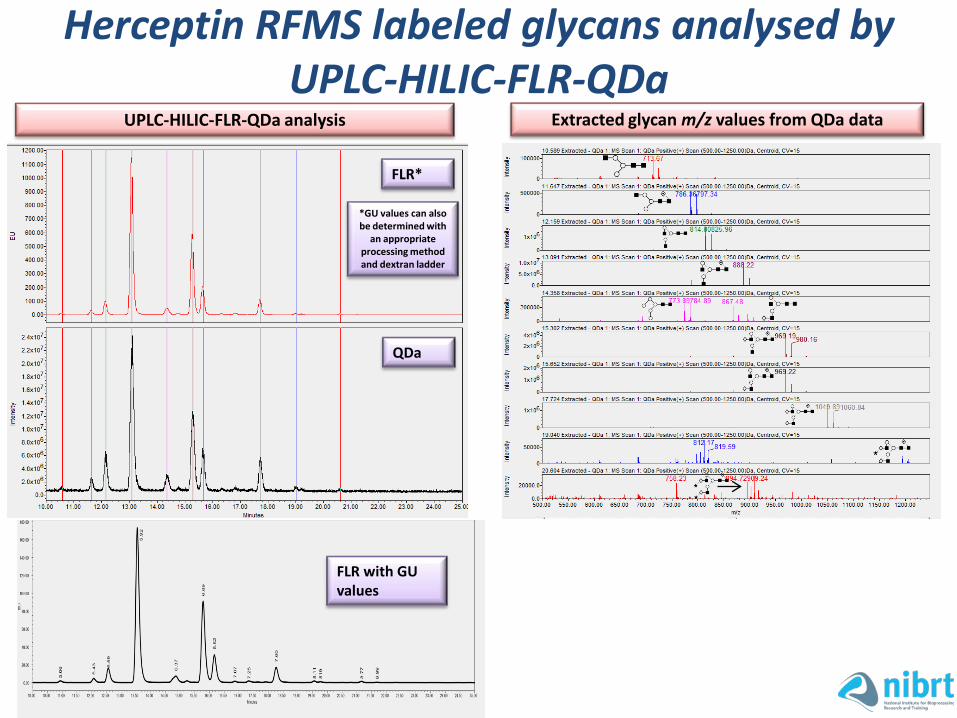
FLR*
QDa
UPLC-HILIC-FLR-QDa analysis Extracted glycan m/z values from QDa data
*GU values can also be determined with
an appropriate processing method and dextran ladder
FLR with GU values
Herceptin RFMS labeled glycans analysed by UPLC-HILIC-FLR-QDa
EU
0.00
100.00
200.00
300.00
400.00
500.00
600.00
700.00
800.00
900.00
1000.00
1100.00
1200.00
1300.00In
tens
ity
0.0
2.0x10⁶
4.0x10⁶
6.0x10⁶
8.0x10⁶
1.0x10⁷
1.2x10⁷
1.4x10⁷
1.6x10⁷
1.8x10⁷
2.0x10⁷
2.2x10⁷
2.4x10⁷
Minutes10.00 11.00 12.00 13.00 14.00 15.00 16.00 17.00 18.00 19.00 20.00 21.00 22.00 23.00 24.00 25.00
UPLC-HILIC-FLR-QDa analysis
FLR*
Overlay of raw FLR and QDa TIC data
Enbrel® (etanercept) RFMS labeled glycans analysed by UPLC-HILIC-FLR-QDa
QDa
*GU values can also be determined with an
appropriate processing method and dextran ladder
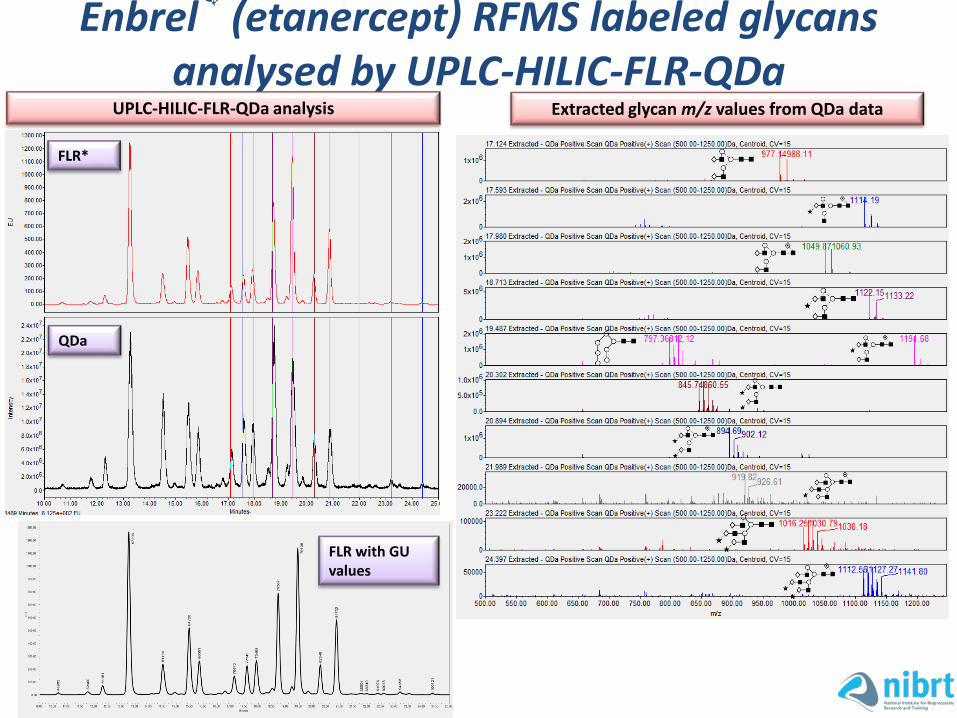
Enbrel® (etanercept) RFMS labeled glycans analysed by UPLC-HILIC-FLR-QDa
UPLC-HILIC-FLR-QDa analysis Extracted glycan m/z values from QDa data
FLR*
QDa
FLR with GU values
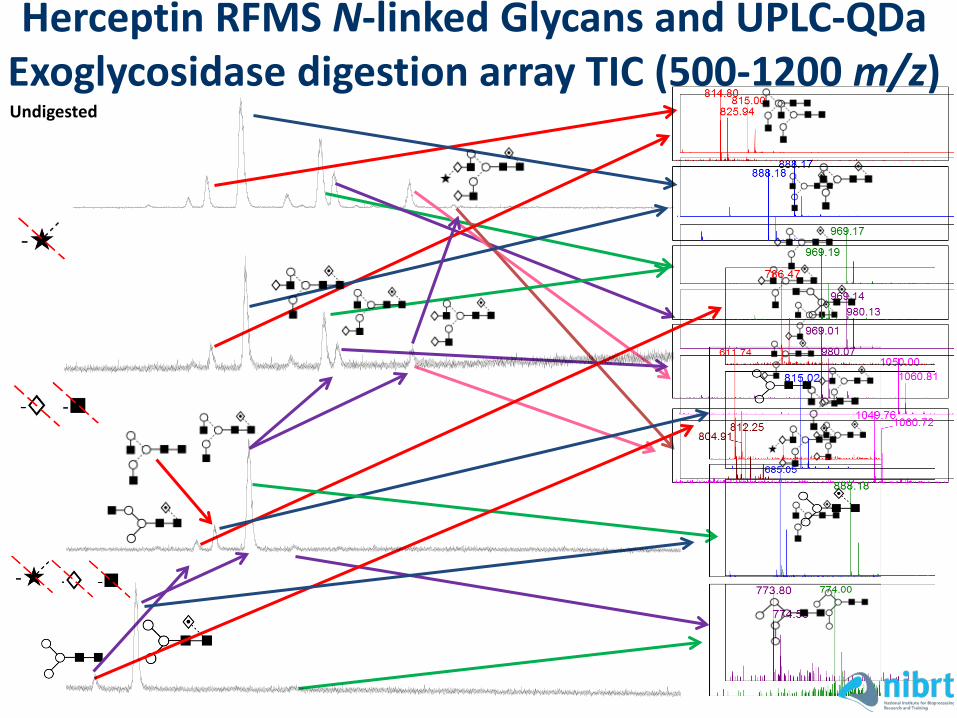
Undigested
Herceptin RFMS N-linked Glycans and UPLC-QDa Exoglycosidase digestion array TIC (500-1200 m/z)

Development of a novel workflow for monitoring O-Glycans utilising the new Waters QDa system
N-linked sites= 3 • 2 in the TNF-α receptor
• 1 in the Fc region
O-linked sites=13, hinge
region. Very challenging.
TNF-α receptor
Fc region
Etanercept, Enbrel

What about O-Glycans?
S
T
S
*Typical CHO O-glycans: Core 1, Mono- and Disialyl Core 1. Found on Enbrel, FC-Fusion and EPO biotherapeutics
P
Characterization of O-glycosylation is considerably more complicated than the analysis of their N-linked counterparts:
• Generally lower carbohydrate to protein ratio, sensitivity considerations
• Multicore structures, see below • Chemical release often necessary
*

Chemical release is also possible, normally base catalyzed beta elimination type reactions. But there can be issues with chemical artifacts (peeling products).
Base: Hydrazine, hydroxide, ammonia
Reducing sugars possible (labeling) , peeling reactions problematic
Reducing agents
More stable alditols formed, subsequent labeling not possible
OH
How do we release O-Glycans?
LC-PGC-MS (Agilent /Thermo Fisher)
UPLC-HILIC-FLR-MS (MS friendly tags preferred)
LC-MS-UNIFI O-Glycan database (Waters)

UPLC Analysis of Procainamide labeled Bovine Fetuin O-Glycans (HILIC Plate clean up)
Ammonia-based β-elimination release (16hrs 65c)
Desalting via evaporation (1 day)
Procainamide labeling (or other MS friendly tag)
HILCI plate clean up vs traditional paper chorography
UPLC method optimization for QDA
N-linked Glycans
Preliminary assignments
O-linked Glycans
UPLC-HILIC- FLR
Peeling product!
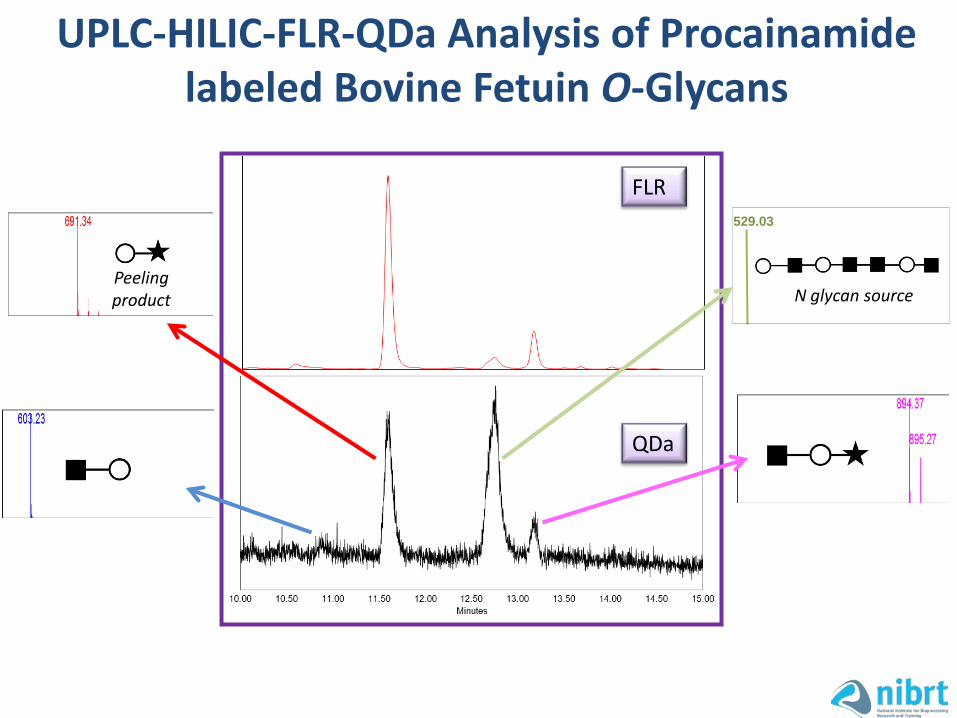
UPLC-HILIC-FLR-QDa Analysis of Procainamide labeled Bovine Fetuin O-Glycans
FLR
QDa
529.03
N glycan source Peeling product

Acknowledgments
Waters THE SCIENCE OF WHAT’S POSSIBLETM