reynolds group holdings · pdf filethis presentation may contain “forward-looking ......
TRANSCRIPT

Reynolds Group Holdings Limited
Q2 2015 Results
August 6, 2015

1
This presentation may contain “forward-looking statements” as that term is defined in the Private Securities Litigation Reform Act of 1995. Forward-looking statements include, without limitation, any statement that may predict, forecast, indicate or imply future results, performance or achievements, and may contain the words “believe”, “anticipate”, “expect”, “estimate”, “intend”, “project”, “plan”, “will likely continue”, “will likely result”, or words or phrases with similar meaning. Forward-looking statements involve risks and uncertainties, including, without limitation, economic, competitive, governmental and technological factors outside of the control of Reynolds Group Holdings Limited (“RGHL”, “Reynolds” or the “Company”), that may cause Reynolds’ business, strategy or actual results to differ materially from the forward-looking statements. Factors that could cause actual results to differ materially from the forward-looking statements include without limitation:
risks related to the future costs of raw materials, energy and freight;
risks related to economic downturns in our target markets;
risks related to changes in consumer lifestyle, eating habits, nutritional preferences and health-related and environmental concerns that may harm our business and financial performance;
risks related to complying with environmental, health and safety laws or as a result of satisfying any liability or obligation imposed under such laws;
risks related to the impact of a loss of any of our key manufacturing facilities;
risks related to our exposure to environmental liabilities and potential changes in legislation or regulation;
risks related to our dependence on key management and other highly skilled personnel;
risks related to the consolidation of our customer bases, competition and pricing pressure;
risks related to exchange rate fluctuations;
risks related to dependence on the protection of our intellectual property and the development of new products;
risks related to our pension plans;
risks related to strategic transactions, including completed and future acquisitions or dispositions, such as the risks that we may be unable to complete an acquisition or disposition in the timeframe anticipated, on its original terms, or at all, or that we may not be able to achieve some or all of the benefits that we expect to achieve from such transactions, including risks related to integration of our acquired businesses, or that a disposition may have an unanticipated affect on our retained businesses;
risks related to our hedging activities which may result in significant losses and in period-to-period earnings volatility;
risks related to our suppliers of raw materials and any interruption in our supply of raw materials;
risks related to our substantial indebtedness and our ability to service our current and future indebtedness;
risks related to increases in interest rates which would increase the cost of servicing our debt;
risks related to restrictive covenants in certain of our outstanding notes and our other indebtedness which could adversely affect our business by limiting our operating and strategic flexibility; and
risks related to other factors discussed or referred to in our quarterly reports and our annual report, including in the section entitled “Risk Factors.”
Some financial information in this presentation has been rounded and, as a result, the figures shown as totals in this presentation may vary slightly from the exact arithmetic aggregation of the figures that precede them. The attached information is not an offer to sell or a solicitation of an offer to purchase any security in the United States or elsewhere and shall not constitute an offer, solicitation or sale in any state or jurisdiction in which, or to any person to whom such an offer, solicitation or sale would be unlawful. No securities may be offered or sold within the United States or to U.S. persons absent registration or an applicable exemption from registration requirements. Any public offering of securities to be made in the United States will be made by means of a prospectus that may be obtained from any issuer of such securities and that will contain detailed information about us.
Disclaimer

2
Explanatory Note on Non-GAAP Financial Measures
In this presentation, we utilize certain non-GAAP financial measures, including EBITDA, Adjusted EBITDA and Pro Forma Adjusted EBITDA, that in each case are not recognized under IFRS or U.S. GAAP. These measures are presented as we believe that they and similar measures are widely used in the markets in which we operate as a means of evaluating a company’s operating performance and financing structure. They may not be comparable to other similarly titled measures of other companies and are not measurements under IFRS, U.S. GAAP or other generally accepted accounting principles, nor should they be considered as substitutes for the information contained in the financial statements included in this presentation.
EBITDA, a measure used by our management to measure operating performance, is defined as profit (loss) from continuing operations plus income tax, net financial expenses, depreciation of property, plant and equipment and amortization of intangible assets. EBITDA is not a measure of our financial condition, liquidity or profitability and should not be considered as a substitute for profit (loss) for the year, operating profit or any other performance measures derived in accordance with IFRS or as a substitute for cash flow from operating activities as a measure of our liquidity in accordance with IFRS.
Adjusted EBITDA is calculated as EBITDA adjusted for particular items relevant to explaining operating performance. These adjustments include significant items of an unusual nature that cannot be attributed to ordinary business operations, including items such as non-cash pension income or expense, restructuring and redundancy costs and gains and losses in relation to the valuation of derivatives. Pro Forma Adjusted EBITDA is defined as Adjusted EBITDA as adjusted to provide the full-period effect of implemented cost savings programs, divestments, acquisition synergies and business acquisitions to the extent not reflected in Adjusted EBITDA. Adjusted EBITDA is not a presentation made in accordance with IFRS, is not a measure of financial condition, liquidity or profitability and should not be considered as an alternative to profit (loss) for the period determined in accordance with IFRS or operating cash flows determined in accordance with IFRS. The determination of Pro Forma Adjusted EBITDA contains a number of estimates and assumptions that may prove to be incorrect and differ materially from actual.
Additionally, EBITDA, Adjusted EBITDA and Pro Forma Adjusted EBITDA are not intended to be a measure of free cash flow for management’s discretionary use, as it does not take into account certain items such as interest and principal payments on our indebtedness, working capital needs, tax payments and capital expenditures. We believe that the inclusion of EBITDA, Adjusted EBITDA and Pro Forma Adjusted EBITDA in this presentation is appropriate to provide additional information to investors about our operating performance to provide a measure of operating results unaffected by differences in capital structures, capital investment cycles and ages of related assets among otherwise comparable companies. Because not all companies calculate EBITDA, Adjusted EBITDA and Pro Forma Adjusted EBITDA identically, the presentation of these non-GAAP financial measures may not be comparable to other similarly titled measures in other companies.
Disclaimer

3
Presenters Overview
Marshall White Closures
Tom Degnan Chief Executive Officer
John Rooney Evergreen
Allen Hugli Chief Financial Officer
Lance Mitchell Reynolds Consumer Products
John McGrath Pactiv Foodservice
Malcolm Bundey Graham Packaging

4
Reynolds Group Holdings Limited
Tom Degnan

$539 $574
Q2 2014 Q2 2015
$3,056$2,913
Q2 2014 Q2 2015
Reynolds Group Revenue and Adjusted EBITDA
Adjusted EBITDA QTD
($ in millions)
5
-5%
Revenue QTD
($ in millions)
+6%
$959 $961
YTD Q2 2014 YTD Q2 2015
$5,783 $5,600
YTD Q2 2014 YTD Q2 2015
Adjusted EBITDA YTD
($ in millions)
-3%
Revenue YTD
($ in millions)

6
Evergreen
John Rooney

$1,691 $1,706
LTM Q2 2014 LTM Q2 2015
$425 $416
Q2 2014 Q2 2015
7
Evergreen Revenue
LTM Q2 2014 vs. LTM Q2 2015
Q2 2014 vs. Q2 2015
($ in millions)
($ in millions)
Revenue decreased by 2% to $416 million in Q2
2015
Decrease primarily driven by:
− Lower sales volume from carton packaging
and paper products, partially offset by price
and product mix improvements in carton
packaging and liquid packaging board
LTM revenue increased by 1% to $1,706 million
-2%
+1%
$831 $825
YTD Q2 2014 YTD Q2 2015
YTD Q2 2014 vs. YTD Q2 2015
($ in millions)
-1%

$72 $77
Q2 2014 Q2 2015
$256$280
LTM Q2 2014 LTM Q2 2015
8
Evergreen Adjusted EBITDA
LTM Q2 2014 vs. LTM Q2 2015
Q2 2014 vs. Q2 2015
($ in millions)
($ in millions)
Adjusted EBITDA increased by 7% to $77
million in Q2 2015
Increase primarily driven by:
− Lower input costs, primarily resin, fiber and
energy
− Price and product mix improvements for
carton packaging
− Partially offset by lower sales volume in
carton packaging and paper products
LTM Adjusted EBITDA increased by 9% to
$280 million
+7%
+9%
$123$132
YTD Q2 2014 YTD Q2 2015
YTD Q2 2014 vs. YTD Q2 2015
($ in millions)
+7%

9
Closures
Marshall White

$1,166$1,061
LTM Q2 2014 LTM Q2 2015
$584$517
YTD Q2 2014 YTD Q2 2015
$318$271
Q2 2014 Q2 2015
10
Closures Revenue
Revenue decreased by 15% to $271 million in Q2 2015
Decrease primarily driven by:
− Unfavorable foreign currency impact due to the net strengthening of the dollar
− Unfavorable price primarily due to the pass through of lower resin costs to the customer
LTM revenue decreased by 9% to $1,061 million
-15%
-9%
LTM Q2 2014 vs. LTM Q2 2015
Q2 2014 vs. Q2 2015
($ in millions)
($ in millions)
-11%
YTD Q2 2014 vs. YTD Q2 2015
($ in millions)

$173 $169
LTM Q2 2014 LTM Q2 2015
$51$46
Q2 2014 Q2 2015
11
Closures Adjusted EBITDA
Adjusted EBITDA decreased by 10% to $46 million in Q2 2015
Decrease primarily driven by:
− Higher overall manufacturing expense
− Unfavorable foreign currency impact due
to the net strengthening of the dollar
− Partially offset by favorable price and mix
and lower SGA expense
LTM Adjusted EBITDA decreased by 2% to
$169 million
LTM Q2 2014 vs. LTM Q2 2015
Q2 2014 vs. Q2 2015
-10%
-2%
($ in millions)
($ in millions)
$91$83
YTD Q2 2014 YTD Q2 2015
YTD Q2 2014 vs. YTD Q2 2015
-9%
($ in millions)

12
Reynolds Consumer Products
Lance Mitchell

$2,761$2,957
LTM Q2 2014 LTM Q2 2015
$722 $762
Q2 2014 Q2 2015
Reynolds Consumer Products Revenue
13
Revenue increased by 6% to $762 million in Q2 2015
Increase primarily driven by:
− Higher pricing across most product lines
− Additional sales volume from a small
business acquisition in mid-2014
LTM revenue increased by 7% to $2,957 million
LTM Q2 2014 vs. LTM Q2 2015
Q2 2014 vs. Q2 2015
+6%
+7%
($ in millions)
($ in millions)
$1,330$1,409
YTD Q2 2014 YTD Q2 2015
YTD Q2 2014 vs. YTD Q2 2015
+6%
($ in millions)
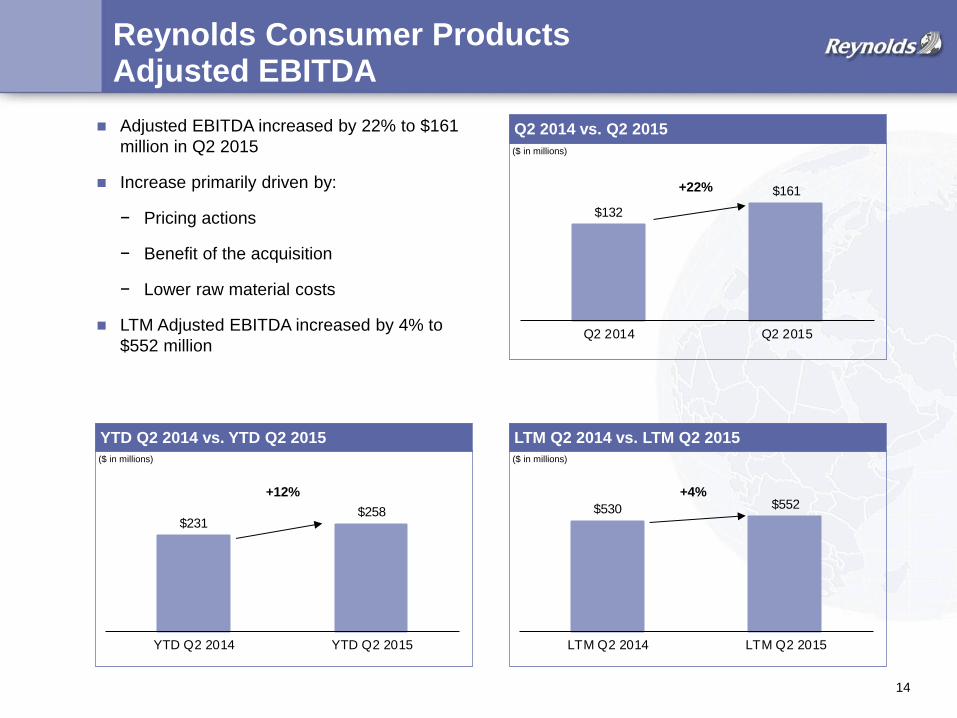
$132
$161
Q2 2014 Q2 2015
Reynolds Consumer Products Adjusted EBITDA
Adjusted EBITDA increased by 22% to $161
million in Q2 2015
Increase primarily driven by:
− Pricing actions
− Benefit of the acquisition
− Lower raw material costs
LTM Adjusted EBITDA increased by 4% to
$552 million
14
$530 $552
LTM Q2 2014 LTM Q2 2015
LTM Q2 2014 vs. LTM Q2 2015
Q2 2014 vs. Q2 2015
+22%
+4%
($ in millions)
($ in millions)
$231$258
YTD Q2 2014 YTD Q2 2015
YTD Q2 2014 vs. YTD Q2 2015
+12%
($ in millions)

15
Pactiv Foodservice
John McGrath

Total segment revenue increased by 1% to $1,044 million in Q2 2015
Increase primarily driven by:
− Incremental sales volume driven by growth in
the foodservice and food packaging markets
and from Reynolds Consumer Products’
small business acquisition in the prior year
− Partially offset by lower revenue due to the
sale of the building products business and
unfavorable foreign currency impact
LTM total segment revenue increased by 1% to
$4,053 million
$3,998 $4,053
LTM Q2 2014 LTM Q2 2015
Pactiv Foodservice Revenue
LTM Q2 2014 vs. LTM Q2 2015
Q2 2014 vs. Q2 2015
($ in millions)
($ in millions)
16
$1,038 $1,044
Q2 2014 Q2 2015
+1%
+1%
$1,965 $1,984
YTD Q2 2014 YTD Q2 2015
YTD Q2 2014 vs. YTD Q2 2015
($ in millions)
+1%

Adjusted EBITDA increased by 15% to $176 million in Q2 2015
Increase primarily driven by:
− Lower raw material costs and improved
operational performance
− Partially offset by negative foreign currency
impact and higher employee-related costs
LTM Adjusted EBITDA decreased by 9% to $550
million
17
LTM Q2 2014 vs. LTM Q2 2015
Q2 2014 vs. Q2 2015
($ in millions)
($ in millions)
$606$550
LTM Q2 2014 LTM Q2 2015
$153$176
Q2 2014 Q2 2015
+15%
-9%
Pactiv Foodservice Adjusted EBITDA
YTD Q2 2014 vs. YTD Q2 2015
($ in millions)
$277 $274
YTD Q2 2014 YTD Q2 2015
-1%

18
Graham Packaging
Malcolm Bundey

$2,908$2,575
LTM Q2 2014 LTM Q2 2015
Graham Packaging Revenue
Revenue decreased by 15% to $635 million in Q2 2015
Decrease primarily driven by:
− Lower sales volume
− Lower pricing due to lower resin costs
− Unfavorable foreign currency impact
LTM revenue decreased by 11% to $2,575
million
19
LTM Q2 2014 vs. LTM Q2 2015
($ in millions)
-11%
Q2 2014 vs. Q2 2015
($ in millions)
$746$635
Q2 2014 Q2 2015
-15%
$1,460$1,290
YTD Q2 2014 YTD Q2 2015
YTD Q2 2014 vs. YTD Q2 2015
($ in millions)
-12%

$140$123
Q2 2014 Q2 2015
Graham Packaging Adjusted EBITDA
Adjusted EBITDA decreased by 12% to $123 million in Q2 2015
Decrease primarily driven by:
− Lower sales volume
− Unfavorable foreign currency impact
− Partially offset by favorable resin cost
LTM Adjusted EBITDA decreased by 16% to
$425 million
-12%
$504$425
LTM Q2 2014 LTM Q2 2015
LTM Q2 2014 vs. LTM Q2 2015
Q2 2014 vs. Q2 2015
($ in millions)
-16%
($ in millions)
20
$257$236
YTD Q2 2014 YTD Q2 2015
YTD Q2 2014 vs. YTD Q2 2015
-8%
($ in millions)

21
Reynolds Group Financial Overview
Allen Hugli

$2,027 $1,998 $61
LTM Q2 2014 LTM Q2 2015
PF Adjusted
(2(2(2(2 (1)(2(2(2(2 (1)(2(2(2(2 (1)(2(2(2(2 (1)
22
$11,695 $11,483
LTM Q2 2014 LTM Q2 2015
Reynolds Group Revenue and Adjusted EBITDA
Adjusted EBITDA
($ in millions)
Revenue
($ in millions)
(1) Annualization impact of cost savings programs and full period effect of the divestiture of the Pactiv Foodservice building products business.

23
Reynolds Group Capital Expenditures
Capital expenditures decreased from $158
million to $92 million in Q2 2015
Decrease primarily driven by:
− Lower spend at Pactiv Foodservice as
expansion and plant rebuild projects in
2014 were completed
− Lower capex at SIG as the business was
sold in March 2015
$118
$158
$92
Q2 2014 Q2 2015Disc. Operations
Q2 2014 vs. Q2 2015
($ in millions)
-42%
(1)
(1) Represents the SIG segment.
$540$434
$741
$571
LTM Q2 2014 LTM Q2 2015Disc. Operations
LTM Q2 2014 vs. LTM Q2 2015
($ in millions)
-23%
(1)
(1) Represents the SIG segment.
$252$197
$342
$226
YTD Q2 2014 YTD Q2 2015Disc. Operations
YTD Q2 2014 vs. YTD Q2 2015
($ in millions)
-34%
(1)
(1) Represents the SIG segment.

24
Key Investment Highlights
Leading Market
Positions
Iconic Brands
High Barriers to
Entry
Significant Global Scale
Stable and Diversified Business
Mix
Broadest Product
Lines
Diversified Blue-Chip Global
Customer Base
World Class Manufacturing
Facilities
Ability to Manage Raw
Material Costs
Broad and Deep
Management Team
Significant Free Cash Flow
Allows Rapid Deleveraging
25
Appendix

26
Reynolds Group Revenue and Adjusted EBITDA
(In $ millions) For the six month period ended June 30, 2015
Evergreen Closures
Reynolds
Consumer
Products
Pactiv
Foodservice
Graham
Packaging
Corporate
Unallocated Total
Total external revenue 769 510 1,324 1,707 1,290 - 5,600
Total inter-segment revenue 56 7 85 277 - (425) -
Total segment revenue 825 517 1,409 1,984 1,290 (425) 5,600
Adjusted EBITDA from continuing operations 132 83 258 274 236 (22) 961
For the six month period ended June 30, 2014
Evergreen Closures
Reynolds
Consumer
Products
Pactiv
Foodservice
Graham
Packaging
Corporate
Unallocated Total
Total external revenue 780 578 1,269 1,696 1,460 - 5,783
Total inter-segment revenue 51 6 61 269 - (387) -
Total segment revenue 831 584 1,330 1,965 1,460 (387) 5,783
Adjusted EBITDA from continuing operations 123 91 231 277 257 (20) 959
27
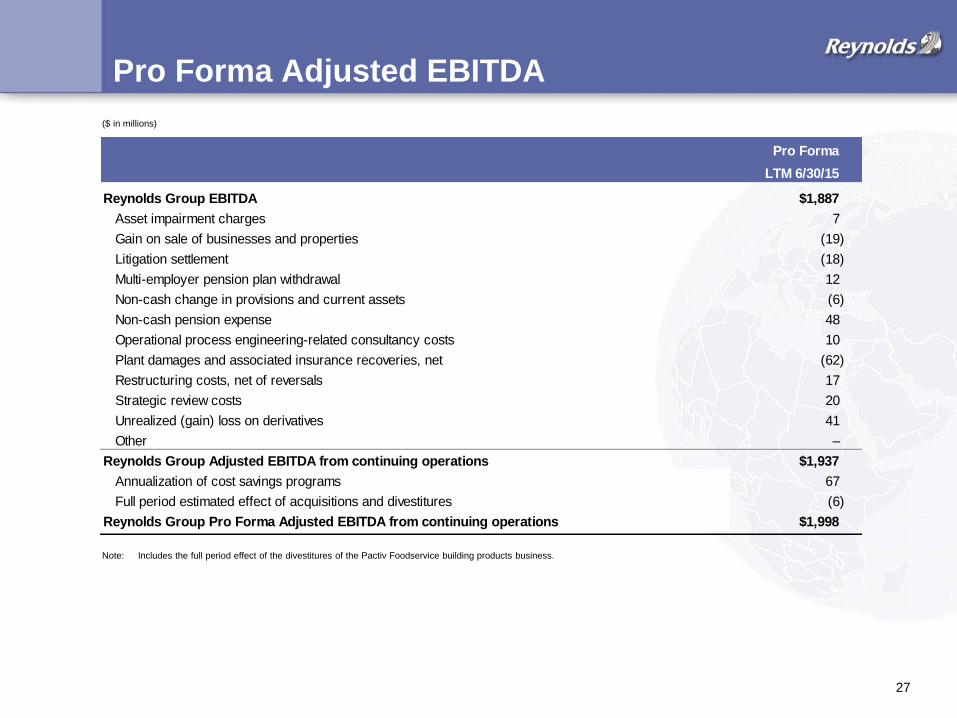
Pro Forma Adjusted EBITDA
Pro Forma
LTM 6/30/15
Reynolds Group EBITDA $1,887
Asset impairment charges 7
Gain on sale of businesses and properties (19)
Litigation settlement (18)
Multi-employer pension plan withdrawal 12
Non-cash change in provisions and current assets (6)
Non-cash pension expense 48
Operational process engineering-related consultancy costs 10
Plant damages and associated insurance recoveries, net (62)
Restructuring costs, net of reversals 17
Strategic review costs 20
Unrealized (gain) loss on derivatives 41
Other –
Reynolds Group Adjusted EBITDA from continuing operations $1,937
Annualization of cost savings programs 67
Full period estimated effect of acquisitions and divestitures (6)
Reynolds Group Pro Forma Adjusted EBITDA from continuing operations $1,998
Note: Includes the full period effect of the divestitures of the Pactiv Foodservice building products business.
($ in millions)

28
Capitalization Summary
($ in millions)
(1) Under the credit agreement, the Securitization Facility is excluded from Total Secured Debt for the purpose of the calculation of the Senior Secured First Lien Leverage Ratio and the
Total Leverage Ratio. All leverage ratios in the table above are calculated excluding the Securitization Facility.
(2) Cash net of overdrafts, if any.
(3) Primarily consists of local working capital facilities and finance leases.
(4) Related party borrowings.
(5) Excludes derivative liabilities of $42 million.
(6) Adjusted for full period effect of implemented cost savings programs, divestitures, acquisition synergies and business acquisitions and divestitures to the extent not reflected in Adjusted
EBITDA.
Net Multiple
6/30/2015 of EBITDA(1)
Cash(2)
$1,552
Senior Secured Term Loans $2,456
Senior Secured Notes 5,450
Securitization Facility(1)
425
Other Secured Debt(3)
44
Total Secured Debt $8,375 3.2x
Senior Unsecured Notes 4,201
Total Senior Guaranteed Debt $12,576 5.3x
Pactiv Unsecured Notes 792
Total Senior Debt $13,368 5.7x
Senior Subordinated Notes 590
Other Debt(4)
1
Total Debt(5)
$13,959 6.0x
Pro Forma Adjusted EBITDA from continuing operations(6)
$1,998bn