rex hadoop et r
TRANSCRIPT

1 1
REX Hadoop et R Optimisation de
campagnes publicitaires

2 2
! Directeur Technique ! Référent technique pôle
performance
! OSSGTP Member
! JUGLausanne co-leader
! Commiter MOJO
Philippe Kernévez

3 3
AVAILABLE DATA
Agenda
BRING YOUR OWN ALGORITHM 5
2
FIRST ANALYSIS 4
PLATEFORM & PROCESSING 3
ISSUES 6
CONTEXT 1

4 4
Context

5 5
! AdExchange
! DSP : Demande side plateforme
! SSP : Sell side plateform
! Click / CPC (cost per clicks)
! Convs / CR (Conversion rate)
! BYOA : Bring Your Own Algorithm
Vocabulary

6 6
! e
Context : online advertiser

7 7
Behind the screen

8 8
Spree7 activity

9 9
Publisher AdServer
SSP (Adx, MS Ad Exchange,
AdScale, ...)
DSP (MediaMath)
Spree7
Other
Camp.1 / Str.1
Camp.1 / Str.2
Camp.2 / Str...
Camp.1 / Str.1
Camp.1 / Str.2
Camp.2 / Str...
...
...
Bid mecanism
0.25
0.26
0.32
1.28
0.15
0.18
0.29
0.76
1.28
0.76
! Publisher sends Ad request to SSP ! SSP sends Ad Request to DSP(s)
! SSP send bids requests to ‘some’ campaigns of DSP providing ! Position of ads ! Size ! Browser language ! etc.
! Each campaign computes a ‘fair price’ ! This price is calculated with MediaMath
algorithm based on campaigns configurations
! The DSP selects the winner ` ! The SSP selects the winner : the better price at the cost of the second

10 10
! Improve the knowledge of bids ! Analyse data at bid level, instead of days aggregated data
! Use the “Bring Your Own Algorithm” mechanism provided by MediaMath to improve ! BYOA : compute the fair price ! Click rates / Bid price, based on a better knowledge of users ! Initialisation phase (2 weeks) of a campaign
Aim of the project

11 11
! Installation of the infrastructure ! Configuration of the Hadoop cluster ! Setup of import flows ! Cleaning of data
! Improvement of the data knowledge ! Improvement of log files (new fields)
! Valid the relevance of the approach ! Create custom algorithm setup (Bring Your Own Algorithm)
Approach

12 12
Available data
13 13
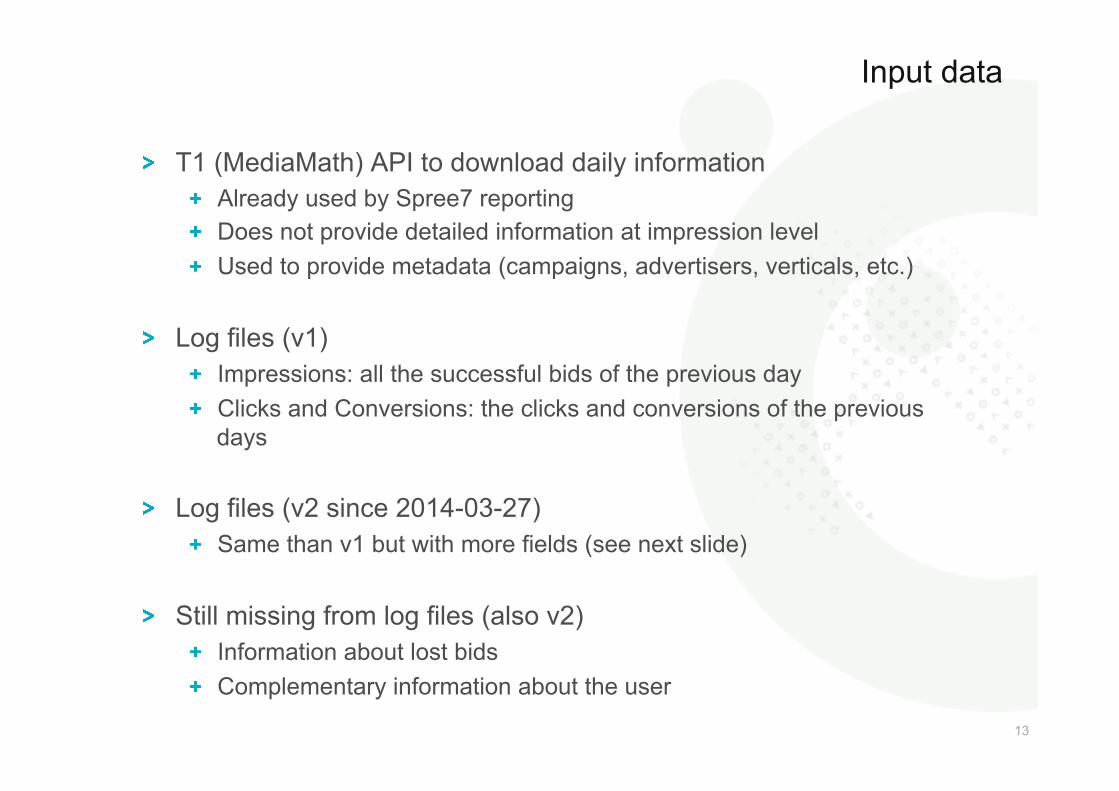
! T1 (MediaMath) API to download daily information ! Already used by Spree7 reporting ! Does not provide detailed information at impression level ! Used to provide metadata (campaigns, advertisers, verticals, etc.)
! Log files (v1) ! Impressions: all the successful bids of the previous day ! Clicks and Conversions: the clicks and conversions of the previous
days
! Log files (v2 since 2014-03-27) ! Same than v1 but with more fields (see next slide)
! Still missing from log files (also v2) ! Information about lost bids ! Complementary information about the user
Input data

14 14
! Impression ! Auction Id (technical unique ID) ! Impression timestamp (Mediamath’s server time) ! Campaign, strategy, goal type & goal value ! UUID (technical Id of the browser) ! Browser ! Creative (size & name) ! Site ! Exchange ! Media cost
! Agency ! Additional costs & total spend ! User time (local for the user) ! Geographical (country, state) ! Connection speed, DMA, ISP name ! Deal ID ! Fold position (top, bottom or unknown) ! User frequency ! OS ! Browser language
Log Files
V1
Additional in V2

15 15
! Clicks ! UUID ! Auction ID ! Click timestamp ! Pagetype ! Agency, advertiser, campaign ! Creative, site, exchange ! Goal type & value ! Browser key
! Convs ! Impression timestamp ! Conversion timestamp ! UUID ! Pixel ! PV_PC_Flag ! Agency, advertiser, campaign, strategy ! Creative, site
Log files

17 17
! 72 columns from 13 tables ! 796 millions rows (29/09/2014)
Denorm table
Timestamps User+day year month part MM_UUID …. click conv adv_name vertical campaign Country Isp Region Dma FoldPosition ConSpeed Browser OS02.09.14+11:10:04 Tuesday 2014 9 morning 5a5231M991… 1 1 PM_1und1 Telecom. APP_1_UKMClassicUK Virgin Leeds ITV above Cable FF Windows02.09.15+13:12:17 Tuesday 2014 9 midday 352435M008… 1 0 Facebook Telecom. APP_1_UKMClassicUK Sky London GBMUTVbottom DSL Chrome Mac… … … … … … … … … … … … … … … … … … … …
Imps ClicksConvs
LOG FILES API STATIC FILES
campaigns,advertisers,& verticals
Country,Isp,
Region,Dma,
FoldPosition,ConSpeed,
Broser & OS

18 18
1. Import metadata 2. Download and import Imps, Clicks & Convs 3. Remove duplicated rows (Imps, Click & Convs) 4. Import and join data into denorm 5. Reporting about last day import
+/- 7h every night (no incremental import)
Import process

19 19
Plateform & Processing

20 20
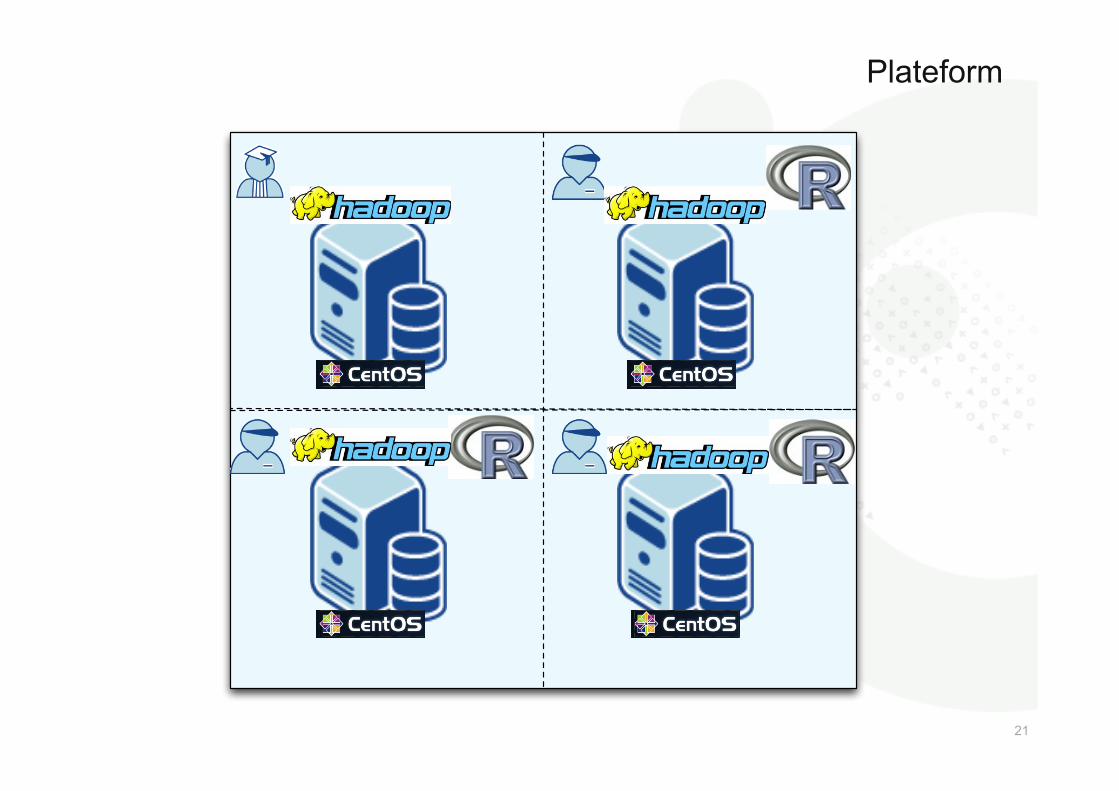
! 4 servers PX 60 @ Hetzner (4*95€/month) ! 32 Go RAM ! 1 proc Intel® Xeon® E3-1270 v3 (4 core / 8 thread) ! 4 * 2To SATA 6Gb/s à 7200 trs/m ! 2 * 1Gb Network interfaces
! Solution based on Apache Hadoop ! 1 Hadoop master + workers ! Allows linear scalability of disk, ram or CPU
! Hadoop : ! virtual storage (20TB) & replication (*3) [HDFS] ! Web interface [Hue/Hive] ! Processing & IO distribution [Map/Reduce]
Hadoop cluster
21 21
Plateform

22 22
Apache Hadoop - Hortonworks distribution
Hadoop is a set of Apache frameworks and more…
! DataStorage (HDFS) ! Runs on commodity hardware (usually Linux) ! Horizontally scalable
! Processing (MapReduce) ! Parallelisable (scalable) processing
! Other Tools / Frameworks ! Data Access
! Hbase, Hive, Pig, Mahout ! Tools
! Hue, Sqoop ! Monitoring
! Greenplum, Cloudera
Monitoring & Alerting
Tools & Libraries
Data Access
MapReduce
Hadoop Code - HDFS
Source : http://tinyurl.com/k39qxjt

23 23
! Only 300Go of log files…
! After denormalisation we have +/- 4Go of data ! Some time we do ‘snaphots’ of database ! Data clearing requires lot of I/O ! Only 6 months of history ! Business is growing ! Small business data as for now
! More accurate geo-localisation ! Weather ! History ! Etc.
! Price
Why Hadoop cluster ?

24 24
! BigData (Wikipedia): ! « Big data is an all-encompassing term for any collection of data sets
so large and complex that it becomes difficult to process using traditional data processing applications. »
! Machine learning ! Limited by RAM, <100 Go
! We use Bigdata for ! filtering and clustering rows, ! restricting colunms ! Aggregregate rows
BIG DATA != Machine learning

25 25
MapReduce Pattern [1/2]
Map Shuffle Reduce
V list(K,V) (K, list(V)) list(K,V)

26 26
MapReduce Pattern [2/2]
Map Shuffle Reduce
V list(K,V) (K, list(V)) list(K,V)
SELECT AVG(COST)
SELECT MEDIA_COSTFROM DENORM
GROUP BY EXCHANGE
(Key, Value)(Adx, 0.25)(Adx, 0.30)(Adx, 0.02)
....
(Key, Value)(AdScale, 2.5)
(AdScale, 3.30)(AdScale, 1.23)
....
(Key, Value)(FB, 1.23)(FB, 2.3)(FB, 1.2)
....
Key AvgAdx 0.314
AdScale 0.12FB 0.45

27 27
Stage: Stage-1 Map Reduce Alias -> Map Operator Tree: stats_campaign TableScan filterExpr: expr: (campaign_goal_type = 'cpc’) Filter Operator predicate: expr: (campaign_goal_type = 'cpc’) Reduce Operator Tree: Group By Operator aggregations: expr: count(VALUE._col0) File Output Operator
Hive SQL-like language to use Map/Reduce
explain select count(*) from publigroupe.stats_campaign where campaign_goal_type = 'cpc’

28 28
FROM ( SELECT campaign_id, campaign_name, media_cost, ... FROM data_denorm WHERE goal_type='cpa' CLUSTER BY campaign_id, exchange_id ) t1 INSERT INTO TABLE byoa_stat REDUCE campaign_id, campaign_name, media_cost, ... USING ‘decision_tree_cpa.R' AS campaign_name, nb_imp, classification_error, prevision_error , … ROW FORMAT DELIMITED FIELDS TERMINATED BY '\t';
Mixte & plusieurs étage
K VK VK V
K VK VK VK V
K VK V
K VK VK V
K VK VK VK V
K VK V
CLUSTER BY DISTRIBUTED BY

29 29
! One reducer = List(V,V1 (or more)
! Vrai également pour Python…
Limitation R : la RAM
K VK VK V
K VK VK VK V
K VK V
K VK VK V
K VK VK VK V
K VK V

30 30
Exemple R

31 31
First analysis : improve data knowledge

32 32
●
●
● ●
●
●
●
●●
●
●●
● ●
● ●●
●●
●
●
●
●
●
●●
●
●
●
●
●
●
●
●●
●
●
●
● ●
●●
●
●
●
●
●
●
●
●
●
●
●●
●
● ● ●
●
●
●
●
●
● ●
●
●
●
●
●
●
●
●
●
●●
●
●
●
●
●
●
●
●●
●
●
●
● ●
●
●
●
●
●
●
●
●
●
●
●
●
● ●
●●
● ●
●
●
●
●
●
●
●
●● ●
●
●
●
●
●
●
●
●
●
●
●
●
● ● ● ● ● ●
●
● ● ●
●
●
●
● ● ●
●
●
●
●
●
●●
●
●
●●
●
●●
●
●
●
●
●●
●
●
●
●
●
●
●
●
●
●
●
●
●
●
●
●
●
●
●
●
●
●
●
●
●●
●
●
●
●●
●
●
0.00000
0.00025
0.00050
0.00075
0.00100
0 10 20 30 40 50rank
clic
k_ra
te
campaign_goal_type●
●
●
●
cpacpcreachspend
Click rate of all campaigns with linear regression
Global statistics [1/4]
Rank = number of time an impression has been displayed to a user (MM_UUID) during a campaign
Does the click rate depend on the rank (number of impressions for the same user) ?

33 33
Global statistics [2/4]
Does the ‘time to click’ depend on the exchange ?

34 34
Global statistics [3/4]
How many impressions distributed by rank ?

35 35
Global statistics [4/4]
What is the campaign click rates of campaign by exchange ?

36 36
! Do we observe a significant difference between click rates depending on the creative ? è Split by [campaign / strategy / exchange] è Split by campaign (aggregation of the results of the strategies & exchanges) ! (At the beginning (v1) creative was the most significance variable)
! Which campaigns seem to be interesting to go further ?
Significance of creative

37 37
Confidence interval

38 38
For a campaign List of (strategies & exchange)
Low click-rate
High click-rate
Limited incertitude interval
Big incertitude interval
Best candidate

39 39
Global (per groupe)

40 40
Bring Your Own Algorithm

41 41
MediaMath expectation

42 42
! We try to find the propability of a click/conv for a bid… ! It’s easy to have pretty good algorithm with 99.99% of success :
! We finally decide to use a statistical approach : ! on each node tx = nb_click/nb_impression ! And we need to find an approach to select the best variables
Classical machine learning limitations
return NO_CLICK;
43 43
! What are the « best variables » ? ! I.e. the best way to split the dataset into subgroups that are
homogeneous regarding an output variable (eg. click/⌐click or conv/⌐conv)
! Could be: creative ID, country, region, hour, connection speed, etc. è the only limit is the imagination… and data availability!
! We used a well-known data-mining method to select these variables: decision-trees ! Decisions-trees describe the dataset into a hierarchy of best variables
to predict the output variable
Selecting the best variables
44 44
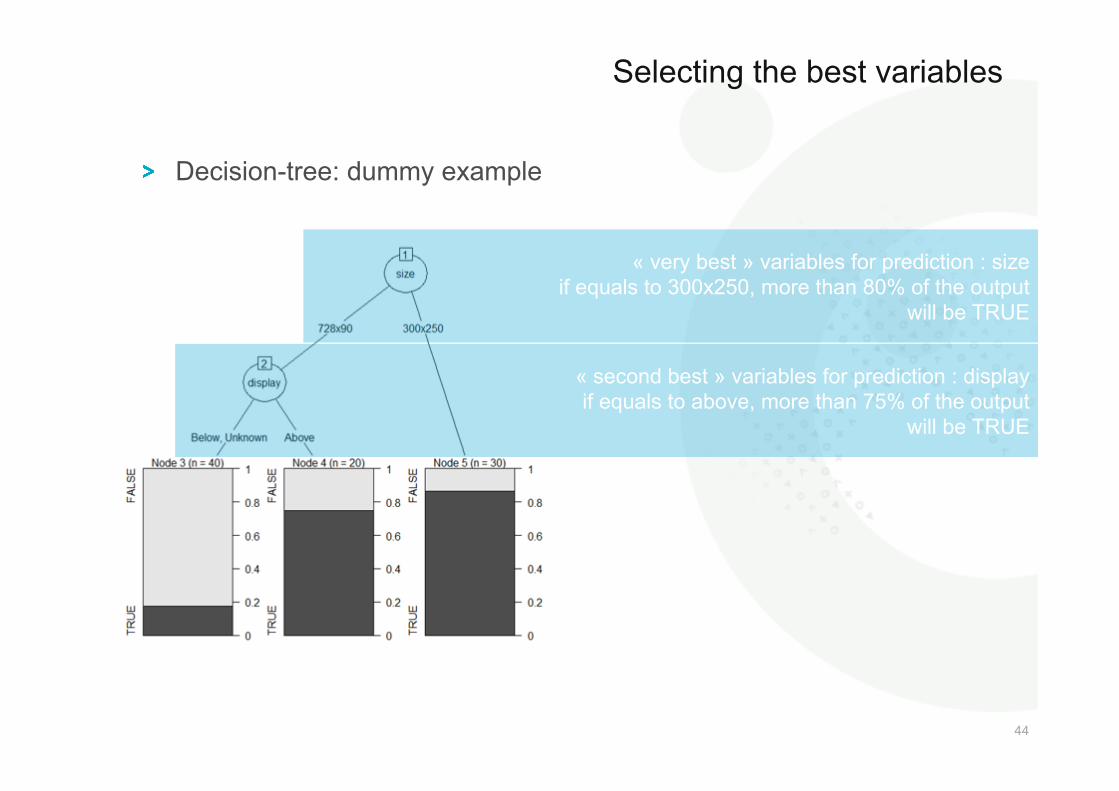
! Decision-tree: dummy example
Selecting the best variables
« very best » variables for prediction : size if equals to 300x250, more than 80% of the output
will be TRUE
« second best » variables for prediction : display if equals to above, more than 75% of the output
will be TRUE

45 45
! Imbalanced dataset : one of the output variable value (click/conv) is very much scarce than the other (⌐click/⌐conv) ! Decision-tree – and other classification methods – in general suffer
when data are skewed towards one class ! Many solutions exist, sometime theoretically complex
! We use a pragmatic approach : resampling of n (n big) balanced dataset, to train and test a decision-tree model
Problem (and solution)
Original dataset
⌐click
click Train dataset
click
click
Random selection of 90% of click data
(quantity = Q)
Random selection of Q ⌐click data
Test dataset click
click
Random selection of 10% of click data
(quantity = q)
Random selection of q ⌐click data
Train & test model
Repeat n resampling

46 46
! Result : n models are trained and tested. For each one, we get ! The quality of the model (classification error and prediction error) ! The best variables (eg. on the top of the decisions trees)
! Information can the be aggregated for the n experiments
Data-mining process output
Overall quality for byoa_09092014/CPA/152152

47 47
Data-mining process output Best variables for byoa_09092014/CPA/152152 (1)
Detected as discriminant in a
lot of experiments
Detected as discriminant in a
few of experiments
Names of the variables
Num
ber o
f app
ariti
on in
sim
ulat
ions

48 48
Data-mining process output Best variables for byoa_09092014/CPA/152152 (2)
Best discriminating
variables through all n experiments
! The top k best variables are selected to construct the MediaMath Bring Your Own Algorithm tree

49 49
1. Split denorm data by campaign/exchange 2. Create randomly 50 train and test datasets
1. Estimate best variables 3. Select the 5 best variables in average 4. Create the BYOA
1. XML file for Mediamath 2. Graphic for human understanding 3. Summary 4. Error histograms & variables importance (cf previous slides)
+/- 5h each night (2h30 for CPA and 2h30 for CPC)
BYOA process

50 50
How the branches are created
Modem (20001)36 imps15.34
Net Speed
Parent node : 7:00 AM394 impression
click rate = 5.07 ‰
Hour
Hour >> Net Speed >> Day
No click for this value stop this branch (click rate = 0)
Not enough value to decide keep the parent click rate
Better child node with significancerecompute the click rate
Worse node with significancerecompute the click rate

52 52
Issues

53 53
! Time required to have reliable data
! Stability of the log files generation
! Learning curve for data knowledge
! Find a good algorithm
! Duration of processing
! R integration ! RHive was not compatible with our versions ! Needs development for integration
! R framework ! Java framework
Issues


55 55
Annexes

56 56
! Pictures ! http://www.neospire.net/
! https://www.flickr.com/photos/st3f4n/
! http://commons.wikimedia.org/wiki/File:Blackboard_450.jpg
Credits