revolutions and inequality in north africa and the middle...
TRANSCRIPT

0
AFRICAN DEVELOPMENT BANK GROUP CHIEF ECONOMIST COMPLEX
Revolutions and Inequality in North
Africa and the Middle East
PROF. MTHULI NCUBE*
CHIEF ECONOMIST & VICE PRESIDENT
AFRICAN DEVELOPMENT BANK
BP 323, 1002 TUNIS
TUNISIA
E-Mail: [email protected]

1
I. INTRODUCTION The Middle East and North Africa (MENA), made up of the Arabian Peninsula, the Levant, and North Africa (Figure 1), has one of the fastest growing populations in the world. In 2011, its population was estimated at 355 million. The region has vast reserves of oil and natural gas: estimates in 2011 put its known oil reserves at more than 50% of the global total while its known gas reserves were estimated at more than 40% of the world total. At the same time, the region accounts for over 35% of world oil production and over 20% of global natural gas production.
Figure 1: Map of the MENA Region
Of recent, the region has been experiencing what has come to be known as the “Arab Spring” or the “Arab Revolution” - a revolutionary wave of demonstrations, protests, strikes, marches and rallies that began on 18 December 2010. The “revolution” was sparked by the first protests that occurred in Tunisia on 18 December 2010 in Sidi Bouzid, following Mohamed Bouazizi's self-immolation in protest of police ill-treatment. The Tunisian experience quickly sparked a wave of major unrest in the region, spreading to Algeria, Bahrain, Egypt, Iraq, Jordan, Kuwait, Morocco, Syria, Yemen, and other countries. Minor protests also occurred in Lebanon, Mauritania, Oman, Saudi Arabia, Sudan, Israel, Iran, and even to some countries in West Africa. A major characteristic of the protests is that they were sustained by the use of social media, especially Facebook, hence the coinage, “Facebook revolutions”. While that of Syria is still raging, long-established political regimes have been overthrown in four countries, namely, Tunisia, Egypt, Libya, and Yemen. The “revolution” has also been a catalyst for ambitious and extensive reforms in a number of countries in the region.

2
In addition to demands for more economic and political inclusion, the “revolution” in the MENA region had been sparked by a refusal to any longer tolerate the gross socio-economic inequality perpetuated by long-entrenched “elite” in power. Thus, in many countries today, the issue of inequality has come to the front burner of international and national discourse with a view to finding solutions. Therefore, in addition to equity reasons, there are good economic and political reasons to be concerned about inequality and its various dimensions (Figure 2). Figure 2: Dimensions of Inequality
Source: http://www.bized.co.uk/educators/16-19/economics/development/activity/inequality.htm This brief contributes to this debate along several dimensions. The main objective is to support
regional institutions’ and development partners’ efforts to generate practical information about
tackling inequality and promoting inclusive development. Thus, in Section II, the brief outlines why inequality matters. Section III reviews the situation of income poverty and income inequality in the region. It also explores how income poverty and income inequality have evolved over the past few years. Section IV goes beyond income inequality by looking at the regions’ performance in education and health as well as various dimensions of gender inequality in education and the labor market, including overall gender gap. Section V examines some effects of income inequality in the MENA region. Section VI concludes with key policy implications.

3
II. WHY DOES INEQUALITY MATTER? Tackling the problem of income inequality is important because inequality negatively affects progress toward the Millennium Development Goals (MDGs) and poverty reduction generally; it results in inefficient resource allocation, wasted productive potential, high dependency ratio, and impaired institutional development (Anyanwu, 2011). In particular, inequality retards development generally: slowing economic growth (Figure 3); resulting in health and social problems, including worsened education outcomes; exacerbating poverty (Figure 4) and unemployment (Figure 5); leading to severer social inequalities, especially among children; and generating social and political instability and conflicts (Figure 6) as exemplified by the “Arab revolution” (see also Ortiz and Cummins, 2011; Marshall and Cole, 2011). Figure 3: Per Capita GDP Growth & Income Inequality in MENA; Figure 4: Poverty & Income Inequality in MENA
Source: Authors, using World Bank (2012) Data.
Figure 5: Unemployment Rate & Income Inequality in MENA; Figure 6: Civil Warfare and Income Inequality in MENA
Algeria
Djibouti
Egypt
IranIraq
IsraelJordan
Morocco
Qatar
Syria
Tunisia
West Bank and Gaza
Yemen
-20
24
6
Pe
r C
ap
ita G
DP
Gro
wth
Rate
30 35 40 45Income Inequality
(mean) gdppcga Fitted values
Iran, Islamic Rep.
Iran, Islamic Rep.
Yemen, Rep.
Iran, Islamic Rep.
Tunisia
West Bank and Gaza
Djibouti
JordanIran, Islamic Rep.Jordan
Tunisia
Tunisia
Jordan
Jordan
Algeria
Iran, Islamic Rep.
Egypt, Arab Rep.
Egypt, Arab Rep.
West Bank and Gaza
Egypt, Arab Rep.Egypt, Arab Rep. Morocco
MoroccoMorocco
Tunisia
Jordan
Iraq
Algeria
Jordan
MoroccoEgypt, Arab Rep.
Tunisia
Morocco
Jordan
Yemen, Rep.
Syrian Arab Republic
05
10
15
20
Po
vert
y H
ea
dco
un
t R
atio a
t $
1.2
5 p
er
da
y
30 35 40 45 50Income Inequality
Poverty headcount ratio at $1.25 a day (PPP) Fitted values

4
Source: Authors, using World Bank (2012) Data.
III. INCOME POVERTY AND INCOME INEQUALITY
3.1 Income Poverty
Income poverty in the MENA region is among the lowest in the world: it is low (and declining) compared to other regions of the world (Figure 7). For example, in 2008, the headcount index for international poverty line of US$1.25 a day (2005 PPP) in MENA was just 2.7% as against 47.5% in Sub-Saharan Africa (SSA). At the US$2.00 a day international poverty line, MENA’s figures stood at 13.9% against 69.2% in SSA. Figures 7: Regional Breakdown of Headcount Index for International Poverty Lines of US$1.25 a day (2005 PPP), 1981-2008
Source: Authors, using World Bank (2012) Data
Figures 8: Regional Breakdown of Headcount Index for International Poverty Lines of US$2.00 a day (2005 PPP), 1981-2008
Algeria
Djibouti
Egypt
Iran
Iraq
Israel
Jordan Morocco
Qatar
Syria
Tunisia
West Bank and Gaza
Yemen
01
02
03
04
05
0
Une
mplo
ym
ent R
ate
30 35 40 45Income Inequality
(mean) uttlf Fitted values
Algeria
DjiboutiEgypt
Iran
Iraq IsraelJordan
Morocco
Qatar
Syria
TunisiaYemen0.5
11
.5
Civ
il W
ar
30 35 40 45Income Inequality
(mean) civwar Fitted values
0
20
40
60
80
100
1981 1984 1987 1990 1993 1996 1999 2002 2005 2008
Pe
rce
nt
Sub-Saharan Africa South Asia
East Asia & Pacific Latin America & Caribbean
Eastern Europe & Central Asia Middle East & North Africa

5
Source: Authors, using World Bank (2012) Data.
On average basis, income poverty in the MENA region is also relatively low compared to other regions of the world (Figure 9). However, significant differences exist among countries. For example, as Figure 10 shows, Yemen and Djibouti hold the unviable record of the highest income poverty in the MENA region. Figure 9: Mean Poverty among the World's Regions (Most Recent Data)
Source: Authors, using World Bank (2012) Data.
Figure 10: Mean Poverty among Selected MENA Countries (Most Recent Data)
0
10
20
30
40
50
60
70
80
90
100
1981 1984 1987 1990 1993 1996 1999 2002 2005 2008
Sub-Saharan Africa
South Asia
East Asia & Pacific
Latin America & Caribbean
Eastern Europe & CentralAsia
Middle East & North Africa
0 20 40 60 80
Middle East & North Africa
East Asia & Pacific
Europe & Central Asia
Latin America & Caribbean
South Asia
Sub-Saharan Africa
North Africa
Middle East
Poverty gap at $1.25 a day (PPP)(%)
Poverty gap at $2 a day (PPP) (%)
Poverty headcount ratio at $1.25a day (PPP) (% of population)
Poverty headcount ratio at $2 aday (PPP)

6
Source: Authors, using World Bank (2012) Data.
3.2 Income Inequality As Figure 11 shows, MENA’s average real GDP per capita is not low by international standards, averaging US$6,478 in 2009 against just US$2,025 for Sub-Saharan Africa. Figure 11: GDP per Capita, PPP (Constant 2005 International US$) by Region
Source: Authors, using World Bank (2012) Data.
However, natural resource and demographic endowments as well as the rising middle class in the Gulf Cooperation Council (GCC) countries have largely shaped the huge differences in real per capita GDP among MENA countries (Figure 12).
0,00 10,00 20,00 30,00 40,00 50,00
Algeria
Djibouti
Egypt, Arab Rep.
Iran, Islamic Rep.
Iraq
Jordan
Morocco
Syrian Arab Republic
Tunisia
West Bank and Gaza
Yemen, Rep.
Poverty gap at $1.25 a day (PPP)(%)
Poverty gap at $2 a day (PPP) (%)
Poverty headcount ratio at $1.25 aday (PPP) (% of population)
Poverty headcount ratio at $2 aday (PPP)
0 2000 4000 6000 8000 10000 12000
Middle East & North Africa (2009)
East Asia & Pacific (2010)
Europe & Central Asia (2010)
Latin America & Caribbean (2010)
South Asia (2010)
Sub-Saharan Africa (2010)

7
Figure 12: GDP Per Capita, PPP (Constant 2005 International US$)(20009 Data)
Source: Authors, using World Bank (2012) Data.
Unfortunately, income share held by the poorest 20% in the MENA region is negligible at 6.8% (Figure 13). Figure 13: Income Share held by the Poorest 20% by Region
Source: Authors, using World Bank (2012) Data.
0 10000 20000 30000 40000 50000 60000 70000 80000
Qatar
United Arab Emirates
Israel
Oman
Saudi Arabia
Libya
Lebanon
Iran, Islamic Rep.
Tunisia
Algeria
Egypt, Arab Rep.
Jordan
Morocco
Iraq
Yemen, Rep.
Djibouti
0
10
20
30
40
50
60
Income share held byhighest 20%
Income share held bylowest 20%

8
Most recent data show that though MENA has relatively high income inequality (38.2%), it is still slightly better than East Asia and the Pacific (39.2%) and much better than SSA (45.4%) and Latin America and the Caribbean (51.9%) (Figure 14). Figure 14: Income Inequality by Region (Most Recent Data)
Source: Authors, using World Bank (2012) Data.
However, the MENA average masks significant country variations in the region. For example, available data (Figure 15) show that South Sudan, Iran, Tunisia, Qatar, Djibouti and Morocco are the top-5 least egalitarian countries in the region. Figure 15: Country Differences in Income Inequality in MENA (Most Recent Data)
Source: Authors, using World Bank (2012) Data.
0 10 20 30 40 50 60
Middle East & North Africa
East Asia & Pacific
Europe & Central Asia
Latin America & Caribbean
North America
South Asia
Sub-Saharan Africa
North Africa
Middle East
0 5 10 15 20 25 30 35 40 45 50
South Sudan
Iran, Islamic Rep.
Tunisia
Qatar
Djibouti
Morocco
Israel
Algeria
Jordan
West Bank and Gaza
Syrian Arab Republic
Yemen, Rep.
Egypt, Arab Rep.
Iraq

9
IV. BEYOND INCOME INEQUALITY
Apart from income inequality, policy makers are also concerned about other dimensions of inequality, including those in education and health. There is also great concern about gender inequality in these social indices and especially those related to the labor market. 4.1 Performance in Education and Health
As Figure 16 shows, despite recent progress, the MENA region still lags advanced regions in secondary education enrolment. MENA’s lag in tertiary education enrolment is even worse (Figure 17), with only 22% enrolment as at 2009 compared with 72% for North America and Western Europe and 65% for Central and East Europe, respectively. As demonstrated in Figure 18, the poor knowledge index further confirms MENA’s need to enhance its educational performance. While the health indicators are not great in MENA, they are still far better than those in SSA and South Asia (Figure 19). Though the MENA region has made significant progress in reducing child and infant mortality, adult mortality (especially that of the male) and maternal mortality are still high.
Figure 16: Comparative Gross Enrolment Ratio - Secondary Education
Figure 17: Comparative Gross Enrolment Ratio - Tertiary Education
0
20
40
60
80
100
120
199819992000200120022003200420052006200720082009
Middle East and North Africa
Central and Eastern Europe
Central Asia
East Asia and the Pacific
Latin America and theCaribbean
North America and WesternEurope

10
Source: Authors, using data from the UNESCO
Figure 18: Knowledge Index Scores by Regions, 2009
Source: Authors, using data from the UNESCO.
0
10
20
30
40
50
60
70
80
199819992000200120022003200420052006200720082009
Gro
ss E
nro
lme
nt
Rat
io
Middle East and North Africa
Central and Eastern Europe
Central Asia
East Asia and the Pacific
Latin America and theCaribbean
North America and WesternEurope
South and West Asia
0
1
2
3
4
5
6
7
8
9
10
WesternEurope
Europeand
CentralAsia
East Asiaand thePacific
MiddleEast and
NorthAfrica
LatinAmerica
SouthAsia
Africa
Ind
ex Knowledge Index
Innovation Index
Education Index
ICT Index

11
Figure 19: Health Indicators by Regions, 2009
Source: Authors, using World Bank (2012) Data.
4.2 Gender Inequality in Education
Though there is room for improvement (especially in female adult literacy), gender equality in education appears impressive in the MENA region (Figure 20).
0 100 200 300 400 500
Middle East & North Africa
East Asia & Pacific
Europe & Central Asia
Latin America & Caribbean
North America
South Asia
Sub-Saharan Africa
Life expectancy at birth, total(years)
Mortality rate, infant (per 1,000live births)
Mortality rate, adult, male (per1,000 male adults)
Mortality rate, adult, female (per1,000 female adults)
Maternal mortality ratio(modeled estimate, per 100,000live births)
Mortality rate, under-5 (per1,000 live births)

12
Figure 20: Gender Inequalities in Education
Source: Authors, using World Bank (2012) Data.
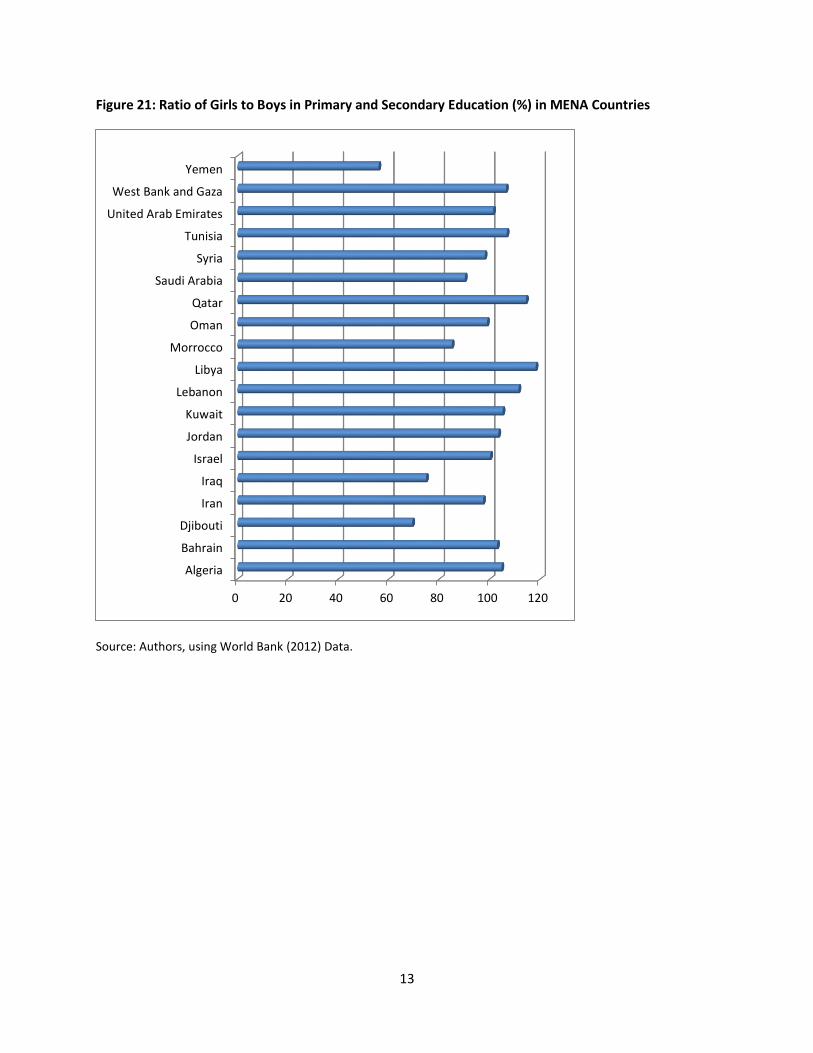
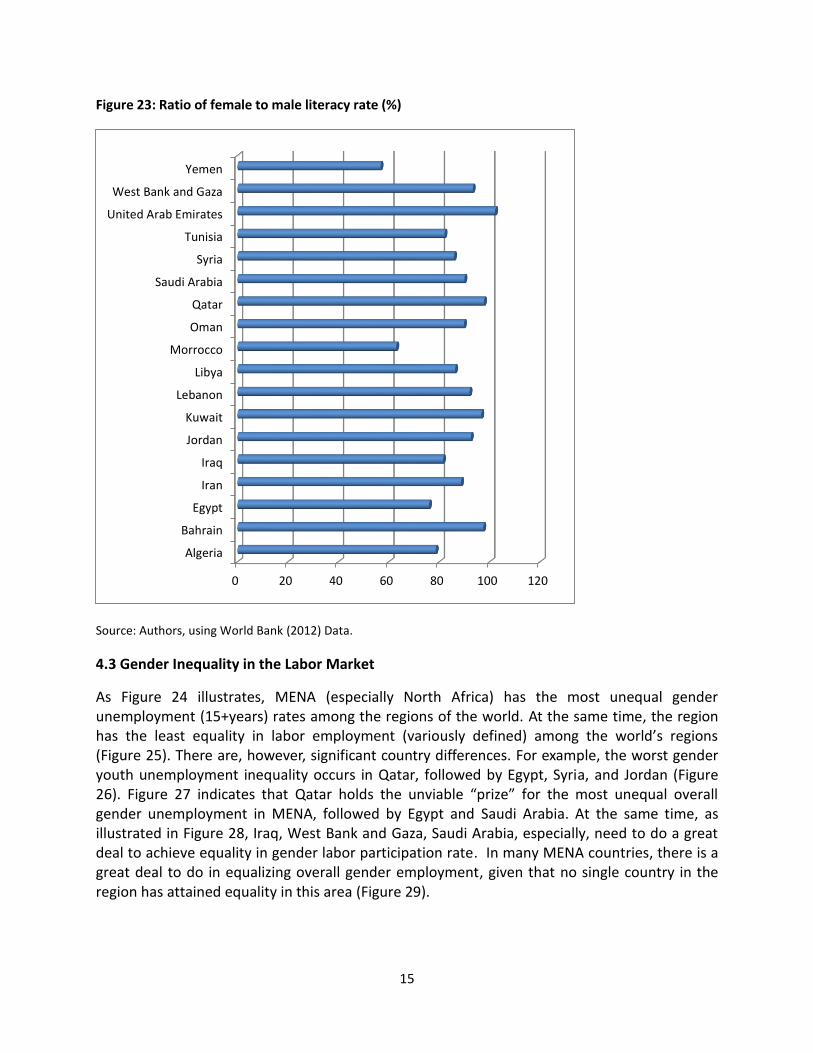
Again, the MENA average hides significant country variations in the region. As Figure 21 illustrates, Yemen, Djibouti and Iraq need to do much more to equalize gender enrolment in secondary education. Also, Yemen, Djibouti and Morocco are still lagging in gender equality in tertiary education enrolment (Figure 22). In addition, many MENA countries are yet to achieve equality in adult literacy. This is particularly so in Yemen, Morocco, Egypt and Algeria (Figure 23).
0
20
40
60
80
100
120
140
Ratio of female to malesecondary enrollment (%)
Ratio of female to male tertiaryenrollment (%)
Ratio of young literate femalesto males (% ages 15-24)
Ratio of female to male adultliteracy rate (%)
13
Figure 21: Ratio of Girls to Boys in Primary and Secondary Education (%) in MENA Countries
Source: Authors, using World Bank (2012) Data.
0 20 40 60 80 100 120
Algeria
Bahrain
Djibouti
Iran
Iraq
Israel
Jordan
Kuwait
Lebanon
Libya
Morrocco
Oman
Qatar
Saudi Arabia
Syria
Tunisia
United Arab Emirates
West Bank and Gaza
Yemen

14
Figure 22: Ratio of Female to Male Tertiary Education Enrollment (%)
Source: Authors, using World Bank (2012) Data.
0 100 200 300 400 500
Algeria
Djibouti
Iran
Israel
Jordan
Lebanon
Morrocco
Oman
Qatar
Saudi Arabia
Tunisia
West Bank and Gaza
Yemen
15
Figure 23: Ratio of female to male literacy rate (%)
Source: Authors, using World Bank (2012) Data.
4.3 Gender Inequality in the Labor Market
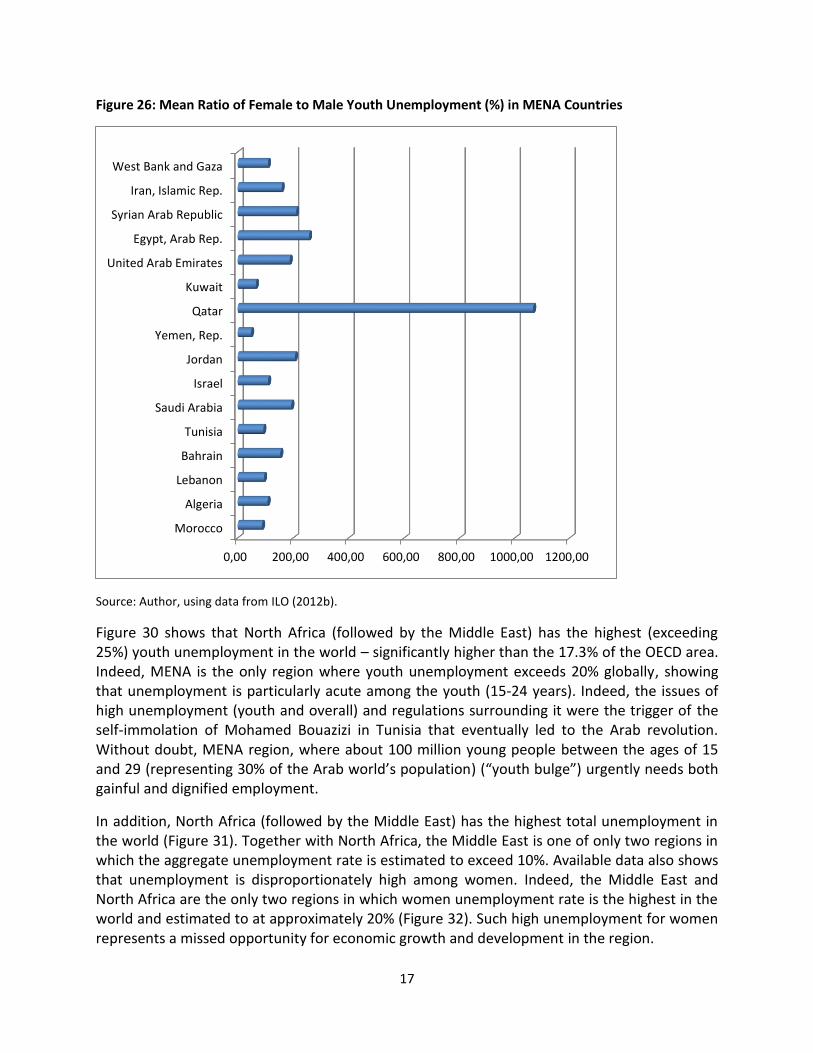
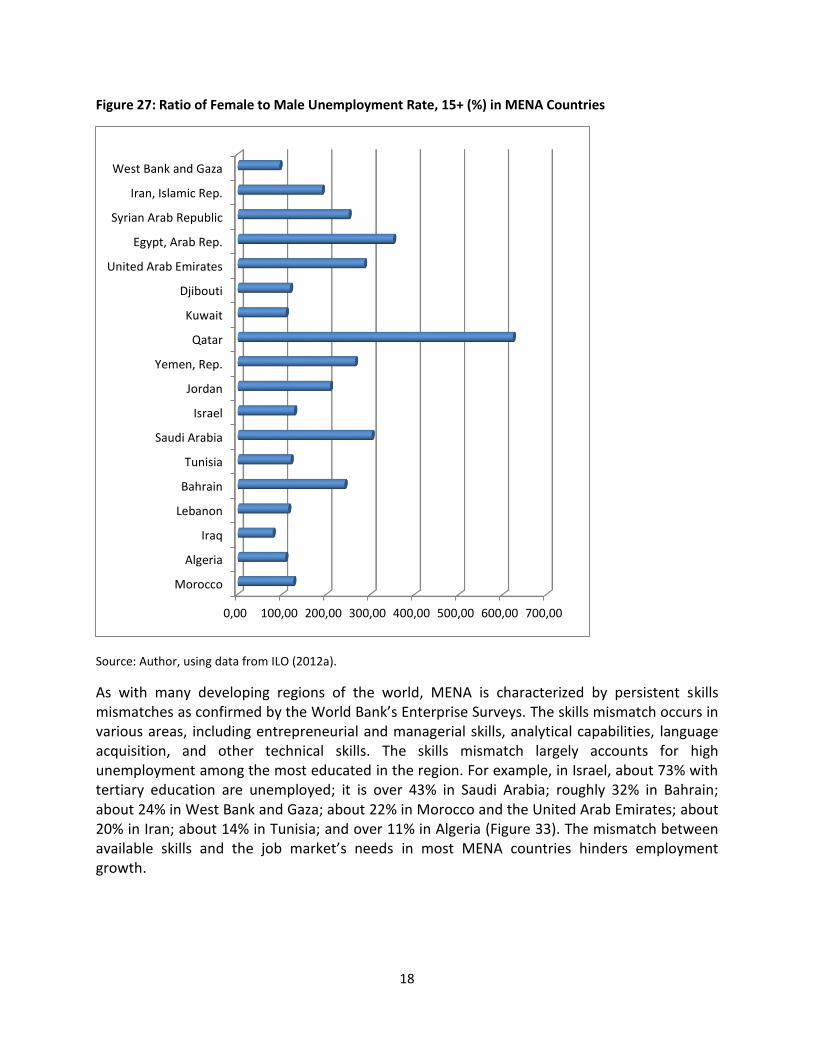
As Figure 24 illustrates, MENA (especially North Africa) has the most unequal gender unemployment (15+years) rates among the regions of the world. At the same time, the region has the least equality in labor employment (variously defined) among the world’s regions (Figure 25). There are, however, significant country differences. For example, the worst gender youth unemployment inequality occurs in Qatar, followed by Egypt, Syria, and Jordan (Figure 26). Figure 27 indicates that Qatar holds the unviable “prize” for the most unequal overall gender unemployment in MENA, followed by Egypt and Saudi Arabia. At the same time, as illustrated in Figure 28, Iraq, West Bank and Gaza, Saudi Arabia, especially, need to do a great deal to achieve equality in gender labor participation rate. In many MENA countries, there is a great deal to do in equalizing overall gender employment, given that no single country in the region has attained equality in this area (Figure 29).
0 20 40 60 80 100 120
Algeria
Bahrain
Egypt
Iran
Iraq
Jordan
Kuwait
Lebanon
Libya
Morrocco
Oman
Qatar
Saudi Arabia
Syria
Tunisia
United Arab Emirates
West Bank and Gaza
Yemen

16
Figure 24: Ratio of Female to Male Unemployment (Total and Youth) (Most Recent Data)
Source: Author, using data from ILO (2012a,b).
Figure 25: Gender Equality in Labor Force/Employment by Region (Most Recent Data)
Source: Author, using data from ILO (2012a).
0 50 100 150 200 250
Middle East & North Africa
East Asia & Pacific
Europe & Central Asia
Latin America & Caribbean
North America
South Asia
Sub-Saharan Africa
North Africa
Middle East
Ratio of female to male unemployment rate, 15+ (%)
Ratio of female to male youth unemployment (%)
0 20 40 60 80 100
Middle East & North Africa
East Asia & Pacific
Europe & Central Asia
Latin America & Caribbean
North America
South Asia
Sub-Saharan Africa
North Africa
Middle East
Labor force, female (% of totallabor force)
Ratio of female to male laborparticipation rate, 15+ (%)
Ratio of female to maleemployment, 15+ (%)
Ratio of female to male youthemployment (%)
17
Figure 26: Mean Ratio of Female to Male Youth Unemployment (%) in MENA Countries
Source: Author, using data from ILO (2012b).
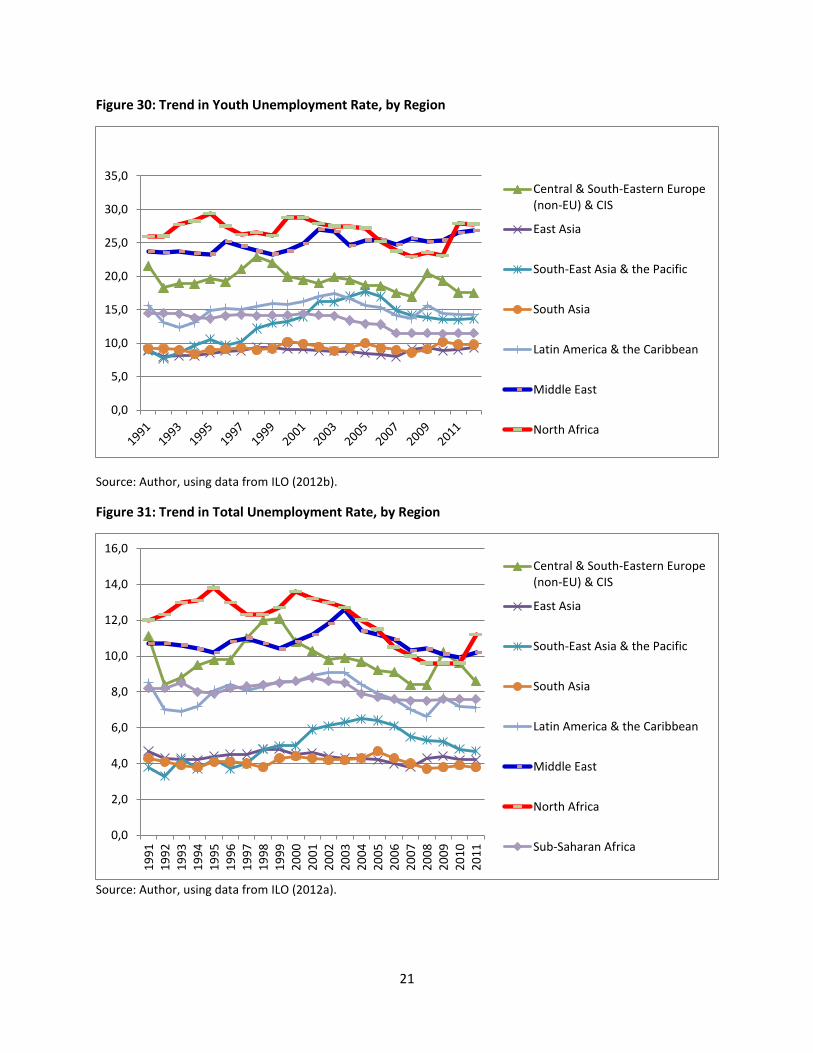
Figure 30 shows that North Africa (followed by the Middle East) has the highest (exceeding 25%) youth unemployment in the world – significantly higher than the 17.3% of the OECD area. Indeed, MENA is the only region where youth unemployment exceeds 20% globally, showing that unemployment is particularly acute among the youth (15-24 years). Indeed, the issues of high unemployment (youth and overall) and regulations surrounding it were the trigger of the self-immolation of Mohamed Bouazizi in Tunisia that eventually led to the Arab revolution. Without doubt, MENA region, where about 100 million young people between the ages of 15 and 29 (representing 30% of the Arab world’s population) (“youth bulge”) urgently needs both gainful and dignified employment.
In addition, North Africa (followed by the Middle East) has the highest total unemployment in the world (Figure 31). Together with North Africa, the Middle East is one of only two regions in which the aggregate unemployment rate is estimated to exceed 10%. Available data also shows that unemployment is disproportionately high among women. Indeed, the Middle East and North Africa are the only two regions in which women unemployment rate is the highest in the world and estimated to at approximately 20% (Figure 32). Such high unemployment for women represents a missed opportunity for economic growth and development in the region.
0,00 200,00 400,00 600,00 800,00 1000,00 1200,00
Morocco
Algeria
Lebanon
Bahrain
Tunisia
Saudi Arabia
Israel
Jordan
Yemen, Rep.
Qatar
Kuwait
United Arab Emirates
Egypt, Arab Rep.
Syrian Arab Republic
Iran, Islamic Rep.
West Bank and Gaza
18
Figure 27: Ratio of Female to Male Unemployment Rate, 15+ (%) in MENA Countries
Source: Author, using data from ILO (2012a).
As with many developing regions of the world, MENA is characterized by persistent skills mismatches as confirmed by the World Bank’s Enterprise Surveys. The skills mismatch occurs in various areas, including entrepreneurial and managerial skills, analytical capabilities, language acquisition, and other technical skills. The skills mismatch largely accounts for high unemployment among the most educated in the region. For example, in Israel, about 73% with tertiary education are unemployed; it is over 43% in Saudi Arabia; roughly 32% in Bahrain; about 24% in West Bank and Gaza; about 22% in Morocco and the United Arab Emirates; about 20% in Iran; about 14% in Tunisia; and over 11% in Algeria (Figure 33). The mismatch between available skills and the job market’s needs in most MENA countries hinders employment growth.
0,00 100,00 200,00 300,00 400,00 500,00 600,00 700,00
Morocco
Algeria
Iraq
Lebanon
Bahrain
Tunisia
Saudi Arabia
Israel
Jordan
Yemen, Rep.
Qatar
Kuwait
Djibouti
United Arab Emirates
Egypt, Arab Rep.
Syrian Arab Republic
Iran, Islamic Rep.
West Bank and Gaza

19
Figure 28: Ratio of Female to Male Labor Participation Rate, 15+ (%) in MENA Countries
Source: Author, using data from ILO (2012b).
0,00 10,00 20,00 30,00 40,00 50,00 60,00 70,00 80,00
Libya
Morocco
Algeria
Iraq
Lebanon
Bahrain
Tunisia
Saudi Arabia
Israel
Oman
Jordan
Yemen, Rep.
Qatar
Kuwait
Djibouti
United Arab Emirates
Egypt, Arab Rep.
Syrian Arab Republic
Iran, Islamic Rep.
West Bank and Gaza

20
Figure 29: Ratio of Female to Male Employment, 15+ (%) in MENA Countries
Source: Author, using data from the World Bank (2012a).
0,00 10,00 20,00 30,00 40,00 50,00 60,00 70,00 80,00
Libya
Morocco
Algeria
Iraq
Lebanon
Bahrain
Tunisia
Saudi Arabia
Israel
Oman
Jordan
Yemen, Rep.
Qatar
Kuwait
United Arab Emirates
Egypt, Arab Rep.
Syrian Arab Republic
Iran, Islamic Rep.
West Bank and Gaza
21
Figure 30: Trend in Youth Unemployment Rate, by Region
Source: Author, using data from ILO (2012b).
Figure 31: Trend in Total Unemployment Rate, by Region
Source: Author, using data from ILO (2012a).
0,0
5,0
10,0
15,0
20,0
25,0
30,0
35,0Central & South-Eastern Europe(non-EU) & CIS
East Asia
South-East Asia & the Pacific
South Asia
Latin America & the Caribbean
Middle East
North Africa
0,0
2,0
4,0
6,0
8,0
10,0
12,0
14,0
16,0
19
91
19
92
19
93
19
94
19
95
19
96
19
97
19
98
19
99
20
00
20
01
20
02
20
03
20
04
20
05
20
06
20
07
20
08
20
09
20
10
20
11
Central & South-Eastern Europe(non-EU) & CIS
East Asia
South-East Asia & the Pacific
South Asia
Latin America & the Caribbean
Middle East
North Africa
Sub-Saharan Africa

22
Figure 32: Trend in Women Unemployment Rate, by Region
Source: Author, using data from ILO (2012a).
Figure 33: Unemployment by Tertiary Education in MENA
Source: Authors, using World Bank (2012) Data.
0,0
5,0
10,0
15,0
20,0
25,01
99
11
99
21
99
31
99
41
99
51
99
61
99
71
99
81
99
92
00
02
00
12
00
22
00
32
00
42
00
52
00
62
00
72
00
82
00
92
01
02
01
1
Central & South-Eastern Europe(non-EU) & CIS
East Asia
South-East Asia & the Pacific
South Asia
Latin America & the Caribbean
Middle East
North Africa
Sub-Saharan Africa
0 10 20 30 40 50 60 70 80
Israel (2007)
Saudi Arabia (2009)
Bahrain (2007)
West Bank & Gaza (2007)
Morocco (2005)
United Arab Emirates (2005)
Iran (2005)
Tunisia (2005)
Algeria (2004)

23
4.4 Overall Gender Gap
MENA countries have very poor overall gender gap (economic participation and opportunity, educational attainment, health and survival, and political empowerment) scores and ranking (Figure 34). Indeed, in the overall Index scores, the Middle East and North Africa region occupies the last place amongst the regions of the world. In addition, while MENA region has closed a little over 58% of its gender gap, North America (with topmost scores) and Europe and Central Asia have closed over 70% of their gender gaps. Even Latin America and the Caribbean, Asia and the Pacific, and sub-Saharan Africa regions have closed between 60% and 70% of their gender gaps. Also, among the sub-indices of the gender gap, the MENA region takes the bottom spot in economic participation and opportunity, and political empowerment. Its performance in the other indices - educational attainment and health and survival - are not good enough either. Figure 34: Gender Gap Scores in 2011 - Top Performers vs Bottom-15 MENA Countries (rank out of 135
in bracket)
Source: Authors, using data Hausmann, Tyson, and Zahidi (2011).
0 0,1 0,2 0,3 0,4 0,5 0,6 0,7 0,8 0,9
Iceland (1)
Norway (2)
Finland (3)
Sweden (4)
Ireland (5)
Israel (55)
United Arab Emirates (103)
Kuwait (105)
Tunisia (108)
Bahrain (110)
Qatar (111)
Jordan (117)
Lebanon (118)
Algeria (121)
Egypt (123)
Syria (124)
Iran (125)
Oman (127)
Morocco (129)
Saudi Arabia (131)
Yemen (135)
24
V. SOME EFFECTS OF INCOME INEQUALITY
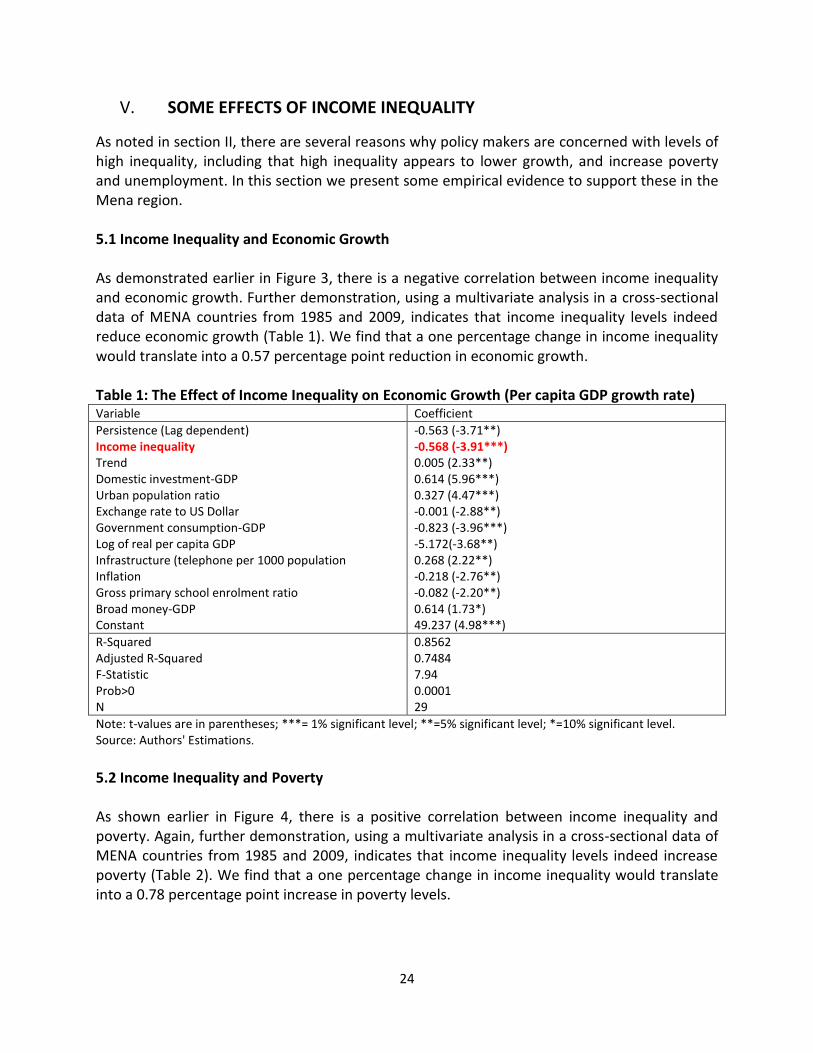
As noted in section II, there are several reasons why policy makers are concerned with levels of high inequality, including that high inequality appears to lower growth, and increase poverty and unemployment. In this section we present some empirical evidence to support these in the Mena region. 5.1 Income Inequality and Economic Growth As demonstrated earlier in Figure 3, there is a negative correlation between income inequality and economic growth. Further demonstration, using a multivariate analysis in a cross-sectional data of MENA countries from 1985 and 2009, indicates that income inequality levels indeed reduce economic growth (Table 1). We find that a one percentage change in income inequality would translate into a 0.57 percentage point reduction in economic growth. Table 1: The Effect of Income Inequality on Economic Growth (Per capita GDP growth rate) Variable Coefficient
Persistence (Lag dependent) Income inequality Trend Domestic investment-GDP Urban population ratio Exchange rate to US Dollar Government consumption-GDP Log of real per capita GDP Infrastructure (telephone per 1000 population Inflation Gross primary school enrolment ratio Broad money-GDP Constant
-0.563 (-3.71**) -0.568 (-3.91***) 0.005 (2.33**) 0.614 (5.96***) 0.327 (4.47***) -0.001 (-2.88**) -0.823 (-3.96***) -5.172(-3.68**) 0.268 (2.22**) -0.218 (-2.76**) -0.082 (-2.20**) 0.614 (1.73*) 49.237 (4.98***)
R-Squared Adjusted R-Squared F-Statistic Prob>0 N
0.8562 0.7484 7.94 0.0001 29
Note: t-values are in parentheses; ***= 1% significant level; **=5% significant level; *=10% significant level. Source: Authors' Estimations.
5.2 Income Inequality and Poverty As shown earlier in Figure 4, there is a positive correlation between income inequality and poverty. Again, further demonstration, using a multivariate analysis in a cross-sectional data of MENA countries from 1985 and 2009, indicates that income inequality levels indeed increase poverty (Table 2). We find that a one percentage change in income inequality would translate into a 0.78 percentage point increase in poverty levels.

25
Table 2: The Effect of Income Inequality on Poverty Variable Coefficient
Income inequality Foreign direct investment-GDP Domestic investment-GDP Openness Exchange rate to US Dollar Population growth rate Log of real per capita GDP GDP growth rate Inflation Gross primary school enrolment ratio Oil rent-GDP Constant
0.777 (4.62***) 0.298 (2.91**) -0.339 (-2.08*) -.0108 (-3.89**) -0.011 (5.39***) 1.439 (2.69**) -9.837 (-4.11**) -0.189 (-1.57) 0.529 (4.21**) 0.225 (3.43**) -0.447 (-3.26**) 37.023 (2.49**)
R-Squared Adjusted R-Squared F-Statistic Prob>0 N
0.8914 0.7718 7.46 0.0018 22
Note: t-values are in parentheses; ***= 1% significant level; **=5% significant level; *=10% significant level. Source: Authors' Estimations.
5.3 Income Inequality and Unemployment In Figure 5, we showed that there is a positive correlation between income inequality and unemployment. Using the same data set, we show empirically that income inequality levels increase unemployment rate (Table 3). Our finding shows that a one percentage change in income inequality would translate into a 0.78 percentage point increase in unemployment rate. Table 3: The Effect of Income Inequality on Unemployment Rate Variable Coefficient
Income inequality Foreign direct investment-GDP Domestic investment-GDP Exchange rate to US Dollar Population growth rate Log of real per capita GDP GDP growth rate Constant
0.776 (4.03**) -0.011 (-0.06) -0.473 (-2.40**) 0.203 (8.71***) 1.577 (1.47) -3.118 (-2.71**) 0.161 (0.61) 10.006 (0.93)
R-Squared Adjusted R-Squared F-Statistic Prob>0 N
0.9872 0.9726 67.57 0.0000 16
Note: t-values are in parentheses; ***= 1% significant level; **=5% significant level; *=10% significant level. Source: Authors' Estimations.

26
VI. CONCLUSIONS AND POLICY IMPLICATIONS
Income poverty in MENA is among the lowest in the world but there are huge country differences. MENA also has relatively high GDP per capita, but again there are significant country differences. However measured, we have shown that inequality is high in the MENA region though with significant country variations. Inequality retards development and creates socio-political instability. Apart from helping to trigger the Arab revolution, it is now of significant concern to policy makers the world over. We have used simple correlations to show that high income inequality reduces economic growth, increases poverty, unemployment and societal conflicts in the MENA region. Though there had been recent progress in educational performance, MENA is still lagging in secondary and tertiary enrolment as well as overall education index. Gender equality in education is impressive but with room for improvement – again there considerable country differences. Certain health indicators are fairly good. Huge gender inequality exists in the MENA labor market and overall gender gap is very huge. All three unemployment rates - for the youth, female youth and women - are the highest for any region in the world. We have also used empirical evidence to illustrate that high income inequality reduces economic growth, and increases poverty and unemployment in the region. Inequality in MENA is not inevitable, but it is up to policy makers to develop comprehensive strategies for inclusive development (not just growth) and better wealth distribution. While, MENA countries must grow their economies on a sustainable basis, this is not sufficient to tackle inequality. Countries need to strike a balance between equity and growth and mainstream equity in the development agenda. Land and property rights reforms, especially to benefit rural dwellers (particularly women) are needed. Policies to reforming tax and benefits will be needed to increase desirable and fair redistributive effects. Government transfers – both in cash and in-kind (both within and across MENA countries) – have an important role to play while the review of existing tax provisions for both equity considerations and current revenue requirements is necessary.
A word of caution is important. ‘Taxing for growth’ strategies exacerbate economic inequalities -- and are particularly gender regressive. Most ‘tackling inequality’ strategies are gender-indifferent and thus fail to benefit women equally. And not all taxes are “born” equal, given their differential impacts! However, it will be neither effective nor financially sustainable to use government transfers and taxes alone as redistribution strategies. Government policy reforms are needed as supplement to tax-based redistribution, in particular, to facilitate and encourage access to employment, education, health, opportunities, assets and wealth for under-represented groups. Effective policies that invest in human capital of the workforce are needed. Policies that promote the up-skilling, better training and education for the low-skilled workforce are

27
imperative. Both the up-skilling, labor market training, educational reforms that conform with industry needs will also help address the skills mismatches existing in the MENA countries. Since unemployment benefits, social protection and employment protection are part of the core ILO labor conventions that member states have ratified, it is imperative that these conventions are being upheld by countries in the region. Indeed, the Arab revolution provides a unique opportunity for the majority of MENA countries that are still lacking proper social insurance systems to enact innovative policies and strengthen labor legislation. Governments need also to foster inclusive societies and working environments, enforcing anti-discrimination laws and supporting equal opportunities and empowering women. In the wake of the Arab revolution, governments in the MENA region should start encouraging entrepreneurship and access to financing, especially for the youth. The region needs entrepreneurs ready and able to explore new opportunities. The youth (especially women) need training in entrepreneurship and to be encouraged to take risks and start businesses and subsequently become employers themselves (WEF, 2012a, b).
Governments in the region need to dialogue with large employers in addressing unemployment through strategic skills planning, skills development, and skills matching. In addition, they need to develop innovative public-private partnerships and the opportunities for collaboration among large employers, governments and other relevant stakeholders such as higher and vocational educational institutions to transform institutional structures and strengthen the region’s economy.
Without doubt, sustainable inclusive growth and development as well as inclusive governance should be the basis for policy-makers and leaders in the MENA region to bridge the transformation between the turmoil of the current revolution and the promise of the future.
References
Anyanwu, John C (2011), “International Remittances and Income Inequality in Africa”, Review of Economic and Business Studies, Vol. IV, Issue 1, pp.117-148. Hausmann, R., Tyson, L. D. and Zahidi, S. (2011), The Global Gender Gap Report 2011, Insight Report, World Economic Forum. ILO (2012a), Global Employment Trends: Preventing a Deeper Jobs Crisis, ILO, Geneva. ILO (2012b), Global Employment Trends for Youth 2012, ILO, Geneva. Lopez, H. J. and Perry, G (2008), Inequality in Latin America: Determinants and Consequences, World Bank Policy Research Working Paper 4504, World Bank, Washington, DC.

28
Ortiz, I. and Cummins, M. (2011), Global Inequality: Beyond the Bottom Billion: A Rapid Review of Income Distribution in 141 Countries, UNICEF Social and Economic Policy Working Paper, April, UNICEF, New York. WEF (2012a), World Economic Forum on the Middle East, North Africa and Eurasia: Bridging Regions in Transformation, Regional Agenda, Istanbul, Turkey, 4-6 June 2012. WEF (2012b), Addressing the 100 Million Youth Challenge: Perspectives on Youth Employment in the Arab World in 2012, Regional Agenda, WEF. World Bank (2012), World Development Indicators 2012, Washington, DC, World Bank.