revisiting the unified model of active galactic nuclei
TRANSCRIPT

AA53CH10-Netzer ARI 16 July 2015 12:38
Revisiting the Unified Modelof Active Galactic NucleiHagai NetzerSchool of Physics and Astronomy, Tel Aviv University, Tel Aviv 69978,Israel; email: [email protected]
Annu. Rev. Astron. Astrophys. 2015. 53:365–408
First published online as a Review in Advance onJune 18, 2015
The Annual Review of Astronomy and Astrophysics isonline at astro.annualreviews.org
This article’s doi:10.1146/annurev-astro-082214-122302
Copyright c© 2015 by Annual Reviews.All rights reserved
Keywords
active galaxies, unification, black holes, accretion disks, central torus, starformation, AGN surveys, interferometry, mergers
Abstract
This review describes recent developments related to the unified model ofactive galactic nuclei (AGNs). It focuses on new ideas about the origin andproperties of the central obscurer (torus) and the connection to its sur-roundings. The review does not address radio unification. AGN tori mustbe clumpy but uncertainties about their properties persist. Today’s mostpromising models involve disk winds of various types and hydrodynamicsimulations that link the large-scale galactic disk to the inner accretion flow.Infrared (IR) studies greatly improved our understanding of the spectral en-ergy distribution of AGNs, but they are hindered by various selection effects.X-ray samples are more complete. The dependence of the covering factorof the torus on luminosity is a basic relationship that remains unexplained.There is also much confusion regarding real type-II AGNs, which do notfit into a simple unification scheme. The most impressive recent results aredue to IR interferometry, which is not in accord with most torus models,and the accurate mapping of central ionization cones. AGN unification maynot apply to merging systems and is possibly restricted to secularly evolvinggalaxies.
365
Ann
u. R
ev. A
stro
n. A
stro
phys
. 201
5.53
:365
-408
. Dow
nloa
ded
from
ww
w.a
nnua
lrev
iew
s.or
g A
cces
s pr
ovid
ed b
y U
nive
rsid
ade
de S
ao P
aulo
(U
SP)
on 0
6/21
/18.
For
per
sona
l use
onl
y.

AA53CH10-Netzer ARI 16 July 2015 12:38
1. THE AGN FAMILY: CLASSIFICATION AND UNIFICATION
1.1. AGN Classification
An active galactic nucleus (AGN) is defined here as a galaxy containing a massive (>105 M�)accreting black hole (BH) with an Eddington ratio exceeding the (somewhat arbitrary) limit ofLAGN/LEdd = 10−5, where LAGN is the bolometric luminosity and LEdd = 1.5×1038 M B H /M� ergs−1 is the Eddington luminosity for a solar composition gas. This definition excludes the Milky WayGalaxy but includes a large number of low-ionization nuclear emission-line regions (LINERs)and low-ionization radio galaxies. Most AGNs include several of the following components.
� A subparsec-rotation-dominated accretion flow that is usually referred to as an accretiondisk. Optically thick disks can be geometrically thin (thin accretion disk) or thick (slim, orthick, accretion disk). (The terminology here is not very clear and both names are used forsystems that are not geometrically thin. In this article I use the term slim disk.) Optically thinaccretion disks or flows are occasionally advection dominated. Such structures are referredto as radiatively inefficient accretion flow (RIAF), or advection-dominated accretion flow(ADAF) (Narayan 2005).
� High-density, dust-free gas clouds moving at roughly Keplerian velocities at a luminosity-dependent distance of 0.01–1 pc from the BH (the broad-line region, BLR).
� An axisymmetric dusty structure with luminosity-dependent dimensions of 0.1–10 pc (thecentral torus).
� Lower-density, lower-velocity ionized gas (narrow-line region, NLR) extending from justoutside the torus to hundreds and even thousands of parsecs along the general direction ofthe opening in the torus (ionization cones). Most of this gas contains dust except for veryclose in, in a region referred to as the coronal line region.
� A very thin molecular maser disk similar in size to the torus.� A central radio jet occasionally associated with γ -ray emission.
These components have been discussed extensively in numerous books and review articles (Bland-ford et al. 1990, Antonucci 1993, Robson 1996, Peterson 1997, Krolik 1998, Osterbrock & Ferland2006, Ho 2008, Netzer 2013, Heckman & Best 2014), and the reader is referred to these referencesfor more information.
AGN unification proposes that the large diversity of observed AGN properties can be explainedby a small number of physical parameters. The old unification scheme (Antonucci 1993, Urry& Padovani 1995, Urry 2003) is a courageous attempt to combine the ever-increasing numberof subgroups into a general picture with two parameters: the torus inclination to the line ofsight (LOS) and the source luminosity (unification by inclination). This scheme is perhaps thesimplest possible way to characterize the known fact that the nuclear continuum and emission-line radiation of AGNs can suffer wavelength-dependent scattering, absorption, and reflection onthe way out. These effects can take place in the torus, in the disk of the host galaxy, in stellarand nuclear outflows, and inside the BLR itself. Heckman & Best (2014) suggested that AGNscan be separated into two major groups: radiative-mode AGNs and jet-mode AGNs. Most ofthe energy output in radiative-mode AGNs is in the form of electromagnetic radiation and isa direct result of matter accretion through a central optically thick accretion disk. This groupis referred to in the literature as Seyfert galaxies or quasi-stellar objects (QSOs). About 10% ofthe sources in this group are radio-loud, showing a highly collimated, relativistic radio jet and,occasionally, a γ -ray jet. Radiative-mode AGNs are efficient accretors with LAGN/LEdd ≥ 0.01.An alternative name, based on the level of ionization of the NLR gas, is high-ionization AGNs(also called high-excitation AGNs). The prime energy output of jet-mode AGNs is bulk kinetic
366 Netzer
Ann
u. R
ev. A
stro
n. A
stro
phys
. 201
5.53
:365
-408
. Dow
nloa
ded
from
ww
w.a
nnua
lrev
iew
s.or
g A
cces
s pr
ovid
ed b
y U
nive
rsid
ade
de S
ao P
aulo
(U
SP)
on 0
6/21
/18.
For
per
sona
l use
onl
y.

AA53CH10-Netzer ARI 16 July 2015 12:38
energy transported in two-sided jets. Their typical Eddington ratio is much smaller and the jetsare most likely powered via a RIAF. The members of this group are low-luminosity radio galaxiesand LINERs, and an alternative spectroscopic definition is low-ionization AGNs. In the localUniverse, the mean BH mass of LINERs is larger than that of radiative-mode AGNs.
This review concerns mostly radiative-mode AGNs, and the reader is referred to Ho (2008)and Heckman & Best (2014) for more information about radio-mode sources. The exceptions aresome LINERs with total electromagnetic radiation that equals and even exceeds, the jet kineticenergy. I do not discuss radio-loud, radiative-mode AGNs—which excludes approximately 10%of radiative-mode AGNs—although most of their properties are indistinguishable from those ofthe radio-quiet sources. In this review I address the following subgroups.
1.1.1. Type-I AGNs. These sources show broad (1,000–20,000 km s−1) permitted and semifor-bidden emission lines and a bright, nonstellar, central point source visible at all wavelengths thatare not contaminated by stellar light. Almost all low- to intermediate-luminosity type-I AGNsshow strong, high-ionization narrow emission lines, many of which are forbidden lines. Mostpapers refer to these sources as Seyfert 1 galaxies or QSOs. Narrow emission lines are missingfrom the spectrum of many high-luminosity type-I AGNs. Many papers distinguish between sev-eral subgroups of type-I AGNs such as type 1.5, type 1.8, or type 1.9. This labeling refers to therelative intensity of the broad and narrow components of the Balmer lines; e.g., type 1.9 AGNshave a stronger narrow component. Here I refer to all such objects as type-Ii, where “i” standsfor intermediate (in some papers “i” refers to broad Paschen lines). This designation has been asource of much confusion, because some of the spectroscopic characteristics have little to do withthe conditions near the BH (e.g., reddening in the host galaxy) and weak broad lines can also bethe result of line and continuum variations.
1.1.2. Type-II AGNs. These sources contain strong narrow (300–1,000 km s−1) near-infrared(NIR)-optical-UV emission lines that are somewhat broader than those observed in emission-linegalaxies of similar types. The lines show clear indications of photoionization by a nonstellarsource. The strongest lines are [O III] λ5007, [N II] λ6584, [O II] λ3727, [O IV] λ25.9 μm, [Ne V]λ3426, C IV λ1549, and the hydrogen Balmer and Lyman lines. Like type-I AGNs, type-II AGNsalso show a point X-ray source. Advances in mid-infrared (MIR) spectroscopy resulted in attemptsto identify type-II AGNs by the equivalent width (EW) of the silicate 9.7 μm absorption featurein their spectrum. Such methods are not in good agreement with optical classification. Type-IIAGNs are further divided into two subgroups. The first group contains hidden type-I sourceswith broad emission lines seen in polarized light. The second group is less accurately definedand is occasionally referred to as real type-II or true type-II AGNs. They show similar widthand excitation narrow lines but no detectable broad lines and little X-ray absorption. Their meanluminosity is below the luminosity of the type-II objects with hidden broad lines. In the localUniverse, such objects may represent as much as 30% of all type-II objects although estimatesof this fraction vary a lot between studies (Panessa & Bassani 2002, Tran 2003, Shi et al. 2010,Brightman & Nandra 2011b, Marinucci et al. 2012, Merloni et al. 2014).
1.1.3. LINERs. LINERs are AGNs characterized by their low-ionization, narrow emissionlines from gas that is ionized by a nonstellar source. Typical strong emission lines in this groupare [N II] λ6584, [N II] λ6584, and [S II] λ6731, and the Balmer lines. I only address LINERswith EW(Hα) ≥ 3 A to avoid confusion with gas ionized by post-asymptotic giant branch (AGB)stars (e.g., Cid Fernandes et al. 2011). LINERs can be divided into type-I (broad emission lines)and type-II (only narrow emission lines) LINERs. Some but not all LINERs show point-like
www.annualreviews.org • AGN Unification 367
Ann
u. R
ev. A
stro
n. A
stro
phys
. 201
5.53
:365
-408
. Dow
nloa
ded
from
ww
w.a
nnua
lrev
iew
s.or
g A
cces
s pr
ovid
ed b
y U
nive
rsid
ade
de S
ao P
aulo
(U
SP)
on 0
6/21
/18.
For
per
sona
l use
onl
y.

AA53CH10-Netzer ARI 16 July 2015 12:38
X-ray and UV sources and UV and X-ray variations (Maoz 2007, Hernandez-Garcıa et al. 2013).Detailed reviews of LINERs are given by Ho (2008) and Heckman & Best (2014).
1.1.4. Lineless AGNs. This subgroup consists of AGNs with extremely weak, sometimes com-pletely undetected emission lines. They present a nonstellar central source and, occasionally, con-tinuum variability. This general group includes two distinct subgroups: low-luminosity sources(e.g., Trump et al. 2009) and very high-luminosity sources (e.g., Shemmer et al. 2010, Meusinger& Balafkan 2014).
Classifying type-I AGNs is relatively easy except for cases in which the BLR is heavily reddenedby foreground dust. Identifying and classifying narrow-emission-line AGNs are more challenging,especially when no hard X-ray data are available, partly because pure star-forming (SF) galaxies(also called HII galaxies), which are more numerous than AGNs, also show the same strong narrowemission lines. An efficient way to separate the groups is to make use of diagnostic diagrams (seeBaldwin et al. 1981, Veilleux & Osterbrock 1987, Kauffmann et al. 2003, Kewley et al. 2006)that compare various line ratios that differ according to the nature of the ionizing continuum(stellar or nonstellar). The most useful line ratios are [O III] λ5007/Hβ, [N II] λ6584/Hα, and[O I] λ6300/Hα. Diagnostic diagrams show several well-defined regions: one that includes high-ionization AGNs, one that includes mostly LINERs, and one that is occupied by SF galaxies. Theregion between the pure SF systems and AGNs is occupied by composite sources, which haveintermediate spectral properties.
Most AGNs known to date were found in large surveys, such as the Sloan Digital Sky Survey(SDSS), through spectroscopic observations with relatively large apertures (e.g., 3 arcsec in theSDSS). The host galaxies of most AGNs are SF galaxies (Rosario et al. 2012, 2013). We canestimate the total emitted SF luminosity, LSF, and distinguish AGN-dominated (LAGN > LSF)from SF-dominated (LSF > LAGN) systems. For example, in the spectroscopic 3-arcsec SDSSsample, such a comparison shows that many composite sources are SF-dominated galaxies.Difficulties in identifying AGNs in composite sources can affect the census of local type-II AGNs,their luminosity functions, and their mass functions. The census of type-I AGNs is based on othermethods and is not subjected to such uncertainties beyond a redshift of approximately 0.1. Table 1provides some of these numbers.
1.2. The Observed Signature of a Central Obscurer
A central obscurer in the vicinity of the BH, with a spherical or axisymmetric geometry, results inseveral characteristic properties that can be recognized by a remote observer.
Table 1 The fraction of strong-emission-line sources, at two redshift intervals, as derived fromdiagnostic diagrams of SDSS objects from the Data Release 7 of the catalog
Redshifta SF galaxies LINERs Type-II AGNs Composite sources0.05–0.1 0.755 0.035 0.04 0.170.15–0.2 0.605 0.035 0.11 0.25
aThe total number of sources in the 0.05–0.1 redshift interval is 108,353 and the number in the 0.15–0.2 interval is 17,572.The selection includes all emission-line objects for which the lines that were used for the classification have asignal-to-noise ratio larger than 3. This introduces a large bias against sources at higher redshifts, especially weak-lineLINERs (courtesy of D. Rosario).Abbreviations: AGN, active galactic nucleus; LINER, low-ionization nuclear emission-line region; SDSS, Sloan DigitalSky Survey; SF, star forming.
368 Netzer
Ann
u. R
ev. A
stro
n. A
stro
phys
. 201
5.53
:365
-408
. Dow
nloa
ded
from
ww
w.a
nnua
lrev
iew
s.or
g A
cces
s pr
ovid
ed b
y U
nive
rsid
ade
de S
ao P
aulo
(U
SP)
on 0
6/21
/18.
For
per
sona
l use
onl
y.

AA53CH10-Netzer ARI 16 July 2015 12:38
1.2.1. Optical-UV absorption and reflection. The original unification scheme (Antonucci 1993and references therein) included a central axisymmetric dusty structure with a column densitylarge enough to completely obscure the central source in some directions. This obscurer is usuallyreferred to as the central torus, a somewhat ambiguous name that is, nevertheless, retained here.The matter distribution of the simplest torus is smooth. More elaborate structures, made of clumpsand interclump material, are preferred by today’s observations. The gas at the inner radius of thetorus is ionized by the central source. Deeper in, the torus contains dusty molecular gas.
It is interesting to study the observational consequences of placing such a simple geometricalstructure around the central BH and accretion disk. The first prediction is that the obscuringcolumn depends on inclination to the LOS, where inclination is measured relative to the z axisof the system (the direction perpendicular to the central disk). Small inclinations, close to face-on, allow a clear view of the central source and high inclinations result in large obscuration atUV-optical wavelengths.
The second prediction is based on the fact that electromagnetic radiation reflected off dustgrains and free electrons is polarized, with angle and percentage polarization dependent on ge-ometry and wavelength. The seminal work of Antonucci & Miller (1985) is among the first ofmany papers that show how to detect hidden broad emission lines using spectropolarimetry andhow to infer the BLR kinematics and overall geometry from such observations. Later and deeperpolarimetry (e.g., Tran 2003) shows a large fraction of type-II AGNs with no hint of polarizedbroad lines. While other explanations, such as Compton thick obscurers, have been proposed(e.g., Marinucci et al. 2012), it seems that many such objects are unobscured but void of BLR gas,such as the real type-II AGNs (Section 1.1) that show no detectable broad lines even when notobscured.
1.2.2. X-ray absorption reflection and emission. The next unavoidable consequence iscolumn-density-dependent X-ray absorption. The assumption used here is of an isotropicallyemitting central X-ray source, possibly a hot corona over the central part of the accretion disk.For a Compton-thin torus, with N H < 1.25 × 1024 cm−2, the obscuring column density can bemeasured by modeling the observed spectrum, provided the intrinsic spectral energy distribution(SED) and the gas metallicity are known (for solar metallicity gas, most of the X-ray absorptionbeyond 0.3 keV is due to metals).
Several X-ray spectral features can help diagnose the torus properties. The first feature is theCompton hump, an excess of radiation at approximately 20 keV due to the down scattering ofhard X-ray photons. Almost all type-I AGNs show Compton humps in their spectra (scatteringand reflection are used quite loosely in the literature and both terms refer to Compton scatteringfollowed by absorption; see, e.g., Netzer 1993).
The second feature is due to the reflection off electrons in highly ionized gas. Here the reflectedradiation is a mirror image of the intrinsic continuum with intensity that, for all practical purposes,depends only on the geometrical covering factor ( fC = �/4π , where � is the solid angle subtendedby the torus). This fraction rarely exceeds a few percent.
The third spectral feature is the Kα iron line. This emission feature is a collection of fluorescence(Auger) Kα transitions and recombination of H-like and He-like iron at energies between 6.4 and7 keV, depending on the specific ion. The lines are broad and of high ionization if originatingfrom the surface of the central accretion disk or they are narrow and occasionally of low ionizationif originating from X-ray illumination of the cold gas in the torus. In cases in which the X-raycontinuum is unobscured, the EW of the narrow Kα line depends on the number of absorbedE > 7.1 keV photons. For a typical X-ray SED and solar metallicity gas, this is estimated to beEW(Kα) ≈ fC ×N H /1021 eV, where complications such as multiple scattering have been ignored
www.annualreviews.org • AGN Unification 369
Ann
u. R
ev. A
stro
n. A
stro
phys
. 201
5.53
:365
-408
. Dow
nloa
ded
from
ww
w.a
nnua
lrev
iew
s.or
g A
cces
s pr
ovid
ed b
y U
nive
rsid
ade
de S
ao P
aulo
(U
SP)
on 0
6/21
/18.
For
per
sona
l use
onl
y.

AA53CH10-Netzer ARI 16 July 2015 12:38
(note that NH is not necessarily the LOS absorbing column; see Section 3.3). For a torus with acovering factor of 0.5 and a column density of 1023 cm−2, EW(Kα) is approximately 50–100 eV.Indeed, many type-I AGNs show narrow Kα lines with this EW (Bianchi et al. 2009, Ricci et al.2013, and references therein). An even clearer signature of a central torus is the large EW(Kα)in Compton-thick sources. In this case, much of the Kα line reaches the observer without beingabsorbed but most of the central continuum radiation is blocked by the torus. The observer cansee only the much weaker reflected continuum, which raises the observed EW dramatically. It canreach 1–2 keV.
1.2.3. Ionization cones. The unobscured ionizing radiation of the central source reaches thegas in the galaxy, causing heat and ionization. As a result, various narrow lines are emitted. Atorus-like geometry results in two ionization cones (or bicone). Depending on the geometry andinclination to the LOS, one of the cones may not be observed.
1.2.4. The dusty boundary of the broad-line region. The dust sublimation temperature, Tsub,is the maximum temperature attained by a dust grain before it evaporates. Tsub depends on thesize and composition of the dust grain and the local flux. For interstellar medium (ISM)-typegraphite grains, the maximum sublimation temperature is T sub � 1,800 K and for silicate grains,T sub � 1,400 K. These numbers can be used to derive a mean sublimation radius, 〈Rsub〉, which isthe minimum radius at which a grain of a certain size can survive the local radiation field. Averagingover ISM-type grain sizes, one obtains the following mean sublimation distances for graphite (C)and silicate (Si) grains (e.g., Barvainis 1987):
〈Rsub,C〉 � 0.5L1/246
[1,800T sub
]2.6
f (θ ) pc; 〈Rsub,Si〉 � 1.3L1/246
[1,500T sub
]2.6
f (θ ) pc, (1)
where L46 = LAGN/1046 erg s−1 and f (θ ) is an angle-dependent term that allows for anisotropyof the central source radiation (Netzer & Trakhtenbrot 2014). For an isotropic source f (θ ) = 1and for a thin disk with electron scattering atmosphere, f (θ ) = [cos θ (1 + 2 cos θ )/3]1/2 (Netzer2013). The above numbers are computed for a mean grain size of a = 0.05 μm and the distancedepends roughly on a−2.
Dust can compete effectively with the ionization of the gas because of its large-absorptioncross sections at all wavelengths longer than approximately 0.02 μm. For highly ionized gas,N dust/N H0 ∝ N gas/N H0 ∝ U H, where UH is the ionization parameter defined over the hydrogenLyman continuum (Netzer 2013). At high levels of ionization, the dust absorbs a larger fractionof the photons capable of ionizing hydrogen and helium. This absorption reduces the size of theionized part of the cloud and lowers the intensity of most emission lines. Emission-line photonsproduced far from the surface of an ionized, dusty gas cloud suffer additional attenuation on theirway out because of absorption by the dust. This is most noticeable in lines with high optical depth,where the large number of scatterings of the line photons considerably increases the path length.Thus, a clear prediction of the torus scenario is that the high-velocity gas near the BH will bedivided into two distinct regions: dust-free gas with strong line emission and dusty gas with weakline emission (Netzer & Laor 1993).
1.2.5. Infrared emission. A clear prediction of any torus model is a broad IR SED with a totalluminosity that depends almost entirely on the fraction of the radiation from the central sourceabsorbed by dust in the torus (a combination of optical depth and covering factor). The radiationmay be emitted isotropically or anisotropically, depending on the optical depth and exact geometry.The SED is predicted to show several silicate features centered around 9.7 μm and 18 μm, either
370 Netzer
Ann
u. R
ev. A
stro
n. A
stro
phys
. 201
5.53
:365
-408
. Dow
nloa
ded
from
ww
w.a
nnua
lrev
iew
s.or
g A
cces
s pr
ovid
ed b
y U
nive
rsid
ade
de S
ao P
aulo
(U
SP)
on 0
6/21
/18.
For
per
sona
l use
onl
y.

AA53CH10-Netzer ARI 16 July 2015 12:38
in absorption or emission, depending on the exact geometry and LOS optical depth. The emittedradiation of basically all AGNs varies in time. This variation results in time-dependent incidentflux on the inner torus walls and time-dependent NIR and MIR emission by the dust.
1.3. Unification Schemes
Unification scheme usually refers to two different categories: IR-optical-UV-X-ray unificationand radio unification. The first category involves a central dusty torus and can explain the majordifferences between type-I and type-II AGNs with a surprisingly small number of assumptions. Itwas first suggested in the late 1980s. The second category combines the torus with a relativistic jetobserved in approximately 10% of all high-ionization AGNs. The jet is launched in the vicinityof the BH and is aligned with the symmetry axis of the system. Radio unification can be usedto make specific predictions about the observed properties of compact and extended radio-loudAGNs. Radio unification is not covered in this review, but the reader is referred to Urry (2003) andTadhunter (2008) for references on this topic. LINERs were not included in the first unificationschemes.
Recent observations of larger samples of AGNs, and more detailed information about specificsources, lead to the conclusion that the old unification scheme requires three major modifica-tions. The first modification relates to the physics and structure of the central obscurer. Thesecond modification realizes that there are real differences between various subgroups, beyondthe dependence on luminosity and torus inclination. These differences can be due to the natureof the central powerhouse (e.g., a RIAF instead of high-efficiency accretion flow) and to the factthat some AGNs lack one or more of the main components, e.g., a BLR or a NLR. The thirdmodification relates to BH and galaxy evolution. This review focuses on these modifications.
1.4. The Era of Selection Effects
Understanding the cosmological evolution of supermassive BHs is key to understanding galaxyevolution. This requires reliable luminosity and mass functions that depend on AGN classification.Although large surveys such as SDSS contain hundreds of thousands of AGNs up to z ∼ 7, thissurvey, and basically all others, is hindered by various selection effects. Because the topic of thisreview is AGN unification, I only mention selection effects that can bias AGN classification.
The use of diagnostic diagrams in spectroscopic surveys such as SDSS to obtain complete AGNsamples is limited to low redshift. Beyond z ∼ 0.2, type-II AGNs with weaker emission lines dropfrom the sample because of poor signal-to-noise ratios and contamination by stellar absorptionlines (weak-line LINERs are already missing from such samples at redshifts as small as 0.1). Atz ≥ 0.4, the Hα line, which is crucial for the classification, is shifted beyond the observable range.An alternative method to detect luminous type-II AGNs up to z ∼ 0.83 (Reyes et al. 2008 andreferences therein) is to search for strong [O III] lines relative to Hβ, which is required not toshow a broad component. Unfortunately, large IR spectroscopic surveys are not yet available,and alternative diagnostics, based on emission lines at shorter wavelengths, are not as reliable.Broad-emission-line AGNs are detected by their continuum shape and their broad emission lines.At z ≤ 0.1, the least luminous type-I AGNs drop from such samples because of strong stellarcontinuum and large-amplitude continuum variations.
Reddening and obscuration are other reasons for losing sources from large samples. At smallredshift, type-II AGNs are affected more than type-I AGNs are. IR-selected samples are less proneto reddening but are biased toward sources with a larger covering factor and against sources withlarge inclination angles (see Section 2). They are also contaminated by emission from SF regions
www.annualreviews.org • AGN Unification 371
Ann
u. R
ev. A
stro
n. A
stro
phys
. 201
5.53
:365
-408
. Dow
nloa
ded
from
ww
w.a
nnua
lrev
iew
s.or
g A
cces
s pr
ovid
ed b
y U
nive
rsid
ade
de S
ao P
aulo
(U
SP)
on 0
6/21
/18.
For
per
sona
l use
onl
y.

AA53CH10-Netzer ARI 16 July 2015 12:38
in the galaxy. MIR photometric surveys, like those based on observations from the Spitzer spacetelescope (Stern et al. 2005), are efficient in differentiating AGNs from nonactive galaxies. How-ever, as will be shown below, the IR-SED is not uniform enough to unambiguously differentiatebetween AGN types, and type-II classification is most problematic. Host galaxy contaminationaffects how low-luminosity AGNs are measured over the entire rest-frame range of 0.3–2 μm. Se-lecting and classifying AGNs by their hard X-ray continuum is arguably the most reliable methodat almost all redshifts. The completeness of this method depends on the energy and flux limitof the specific sample, and various sophisticated methods have been developed to allow for suchbiases. A major difficulty is the detection of highly obscured, large-column-density X-ray sourcesat high redshift.
A comprehensive comparison of the efficiency of various methods to discover AGNs is givenby Merloni & Heinz (2013). According to their study (see their figure 16 and related explanation),the missing fractions of AGNs in various samples depend on the bolometric luminosity and areroughly optical (B-band) samples, from 70% at LAGN = 1047 erg s−1 to 90% at LAGN = 1042 ergs−1; MIR (15 μm) samples, from 50% at LAGN = 1047 erg s−1 to 70% at LAGN = 1042 erg s−1; andhard X-ray (2–10 keV) samples, from 0% at LAGN = 1047 erg s−1 to 40% at LAGN = 1042 erg s−1.
In Sections 2 and 3 I review today’s torus models and torus observations, respectively. I describeadditional, smaller-scale and larger-scale obscurers in Section 4, ionization cones in Section 5, andother galactic components connected to the torus in Section 6. In Section 7 I explain why AGNunification may not apply to major mergers. Finally, Section 8 is a short summary of the mainpoints of this review.
2. DISK AND TORUS MODELS
2.1. Central Disks and Central Tori
How large and how massive is the central structure? How is it connected to the BLR and accretiondisk on its inner side, and to the ISM of the host galaxy on its outer side? Is it a torus, a disk, orsome other shape? Is such a structure typical of all large bulge galaxies or is BH accretion essentialto form and maintain it? And most important, how is this structure formed in active galaxies? Theglobal theoretical framework is presented in this section and the observational consequences arepresented in Section 3.
The terminology used in this area of research requires some clarification because central disk,central torus, and central accretion disk have been used quite loosely. In this review, inner accre-tion disk refers to the accretion flow inside the sublimation radius, where the accreted gas is losingangular momentum through molecular, magnetic, or other sources of viscosity. Many AGNsmust contain a much larger disk-like structure, 1–100 pc in size, that connects the inner disk to thehost galaxy. The inner part of this structure can have a thick geometry, in which case it becomesthe inner torus. The entire structure, which can extend beyond the torus, is the central disk orthe Q disk (after the Toomre stability parameter Q, see below). The central disk contains a largeamount of molecular gas that, given a large-enough column density, undergoes, e.g., SF activityassociated with supernovae (SN) explosions and the growth of a nuclear star cluster. Some of theseprocesses result in local effective viscosity that can make this entire structure a large accretiondisk, where gas loses its angular momentum and drifts into the center. The angular momentumof the large disk is not necessarily aligned with the angular momentum of the inner disk. Thereis also no known reason why such a large disk maintains its properties throughout the accretionepisode.
372 Netzer
Ann
u. R
ev. A
stro
n. A
stro
phys
. 201
5.53
:365
-408
. Dow
nloa
ded
from
ww
w.a
nnua
lrev
iew
s.or
g A
cces
s pr
ovid
ed b
y U
nive
rsid
ade
de S
ao P
aulo
(U
SP)
on 0
6/21
/18.
For
per
sona
l use
onl
y.

AA53CH10-Netzer ARI 16 July 2015 12:38
2.2. General Models
Two general types of central disks and central tori have been considered. The first type is theoret-ical models (e.g., Krolik & Begelman 1988, Emmering et al. 1992, Collin & Zahn 1999, Beckert& Duschl 2004, Schartmann et al. 2005, Elitzur & Shlosman 2006, Honig & Beckert 2007, Krolik2007, Collin & Zahn 2008, Vollmer et al. 2008, Wada et al. 2009, Schartmann et al. 2010, Wada2012) that were developed to explore specific aspects such as the formation, stability, shape, andevolution of the central structure. The models attempt to answer two fundamental questions.(a) What is the mechanism that removes angular momentum from galactic infalling gas, thus al-lowing the feeding of the central BH? (b) What mechanisms maintain a thick gaseous structure fora long period of time? Important processes considered in this context include blob motions alongmagnetic field lines, colliding magnetic clumps, radiation-pressure-supported dusty clumps, SF-driven turbulence, SN explosions, and AGN and stellar feedback via radiation pressure and winds,among others. Several analytic and semianalytic models have been proposed, but the hydrodynamicsimulations seem to provide more realistic ways to model this complex situation. The second type isphenomenological, ad hoc models that make assumptions about the size, composition, and geome-try of the torus to explain the observations, mostly the spatially resolved images and the NIR–MIRSED (e.g., Pier & Krolik 1992, Fritz et al. 2006, Nenkova et al. 2008a, Honig et al. 2010, Stalevskiet al. 2012). These types of models neglect the connection between the torus and its surroundings.
A natural way to describe the accretion problem is to start from the inner disk, assumed in mostmodels to be geometrically thin and optically thick, where the local viscosity allows radial drift ofmaterial all the way to the innermost stable circular orbit (ISCO). A natural outer boundary ofthe accretion disk is its self-gravity radius, RSG, which is the location where local gravity exceedsthe vertical component of the central BH gravity and the disk becomes unstable (Q = 1). Thisradius is given by
RSG � 1,680M −2/99 α2/9[LAGN/LEdd]4/9[η/0.1]−4/9 Rg , (2)
where M 9 = M BH/109 M�; α is the viscosity parameter, which is of the order of 0.01–0.1; η is themass-to-radiation conversion efficiency, and Rg is, again, the gravitational radius (Laor & Netzer1989). For a stationary M 9 = 1 BH and a thin accretion disk radiating at LAGN/LEdd ∼ 0.1,RSG � 0.04 pc.
In the absence of additional local heating sources, Q drops below unity beyond the self-gravityradius and the disk is fragmented into clouds that move in the same general plane. The gap thatis formed prevents the inflow of additional, more distant material to the center. According tosome models (Collin & Zahn 1999, 2008; Duschl & Britsch 2006), a marginally stable situationwith Q ∼ 1 can be maintained over a large distance beyond RSG owing to collisions betweenclouds, SF activity, and SN explosions that produce turbulence and local viscosity. Such processesallow accretion from much larger radii. For very massive BHs, such a marginally unstable disk canextend to approximately 100 pc and beyond. A challenge of models of this type is to combine allthese processes into a coherent SF history that will allow researchers to follow the evolution ofthe nuclear star cluster.
Another comprehensive semianalytic model by Vollmer et al. (2008) considers gas infall fromthe galaxy, which results in the formation of a clumpy central disk. This leads to the formationof a torus through three phases of evolution: (a) An initial short and massive gas infall leads tothe formation of a turbulent and stellar wind-driven Q ∼ 1 disk. This is followed by energeticSF processes. (b) Once the SN explodes, the intercloud medium is removed, leaving a massive,geometrically thick collisional disk with a decreasing yet still high mass accretion rate. (c) When the
www.annualreviews.org • AGN Unification 373
Ann
u. R
ev. A
stro
n. A
stro
phys
. 201
5.53
:365
-408
. Dow
nloa
ded
from
ww
w.a
nnua
lrev
iew
s.or
g A
cces
s pr
ovid
ed b
y U
nive
rsid
ade
de S
ao P
aulo
(U
SP)
on 0
6/21
/18.
For
per
sona
l use
onl
y.

AA53CH10-Netzer ARI 16 July 2015 12:38
mass accretion rate has significantly decreased, the torus becomes thin and transparent, similarto the circumnuclear disk in the center of the Milky Way (e.g., Alig et al. 2013). Numericalhydrodynamic simulations by Schartmann et al. (2010) follow the final stages of the model, focusingon BH feeding during the second and third phases. Low-velocity stellar winds, during the AGBphase, starting some 50 Myr after the onset of SF, are suggested to contain enough gas to feeda small central BH for a period of approximately 108 years. The origin of such winds is a quasi-spherical star cluster with little angular momentum. The winds collide and form a central thindisk, and the gas is accreted onto the BH via an unspecified viscosity mechanism. Such models arecurrently limited to small, few × 107 M� BHs.
A gaseous torus cannot retain a large height-to-radius ratio with pure rotation. Star clusters canretain such a shape but the gas between the stars cannot because cloud collision drives the gas to theplane on a few dynamic timescales. Maintaining a thick gaseous structure requires high-velocityturbulent motion, or outflow motion, and seems to work better in a clumpy medium where thereare frequent cloud collisions (Beckert & Duschl 2004). Other mechanisms proposed to maintaina thick structure involve UV, optical, and IR radiation pressure (e.g., Honig & Beckert 2007,Krolik 2007, Czerny & Hryniewicz 2011, Wada 2012); magnetic winds (Emmering et al. 1992,Konigl & Kartje 1994, Elitzur & Shlosman 2006); and SF activity in the inflowing gas. UV-opticalradiation by the central accretion disk, and locally (inside the torus) emitted IR radiation, can becombined into a plausible scheme that helps solve the scale height problem. Here clumps arepushed in the radial direction by the radiation from the central source in a way that depends onLAGN/LEdd (Honig & Beckert 2007, Wada 2012). The central source heats the dust in the clumps,which in turn emit IR radiation. The local IR flux diffuses outward and is absorbed and reemittedby neighboring clumps, which results in a radiation pressure force that balances or overcomesthe z-component of the central source gravity (Krolik 2007). In this scenario, an active AGN isnecessary to both produce the toroidal structure and maintain its thick structure.
The disk wind scenario proposed in Emmering et al. (1992) and discussed in numerous otherpapers (Konigl & Kartje 1994, Kartje & Konigl 1996, Bottorff et al. 2000, Elitzur & Shlosman2006, Elitzur & Ho 2009) consists of a continuous large disk that is fed by cold material from thehost galaxy. Close to the BH, it develops a magnetocentrifugal wind that supports rising clumps.In this scenario, the torus is merely a region in the wind that happens to provide a toroid-clumpystructure. Clumps inside the sublimation radius are dust-free and can be viewed as BLR clouds.At larger distances, the clumps are dusty and can be viewed as part of the torus. The exact columndensity of the clumps differs from one model to the next. It may depend on the magnetic fieldproperties, the ratio of the external accretion rate to the mass outflow rate from the disk, and otherfactors. The clumps most relevant to the observations are those capable of emitting strong lines,with a column density of at least 1022 cm−2. As the clumps rise from the disk, their column densitydrops dramatically and they disappear from view. The mass outflow rate in several wind modelsis somewhat smaller than the mass accretion rate through the disk.
A recent development is the understanding that dust can survive in the atmosphere of the inneraccretion disk at all distances where the disk effective temperature, Teff , is below the sublimationtemperature (Czerny & Hryniewicz 2011). Simple estimates show that at a distance of RBLR (theemissivity-weighted radius of the BLR), Teff ∼ 1,000 K, roughly the dust sublimation temperature.This raises the possibility that, starting from this distance, the local radiation pressure acting onthe local grains is effective enough to raise dusty clumps from the disk surface. As the clumps rise,they are no longer shielded from the central radiation field, which is more intense than the localfield; they are being pushed in a radial direction and the dust evaporates. This reduces the push inthe vertical direction and the clumps fall back onto the surface of the disk. Further away, the grainsin the lifted material can survive the central radiation field and they form a clumpy thick structure.
374 Netzer
Ann
u. R
ev. A
stro
n. A
stro
phys
. 201
5.53
:365
-408
. Dow
nloa
ded
from
ww
w.a
nnua
lrev
iew
s.or
g A
cces
s pr
ovid
ed b
y U
nive
rsid
ade
de S
ao P
aulo
(U
SP)
on 0
6/21
/18.
For
per
sona
l use
onl
y.

AA53CH10-Netzer ARI 16 July 2015 12:38
109
108
107
106
105
1 10
Nor
mal
ized
line
lum
inos
ity
(egr
sec
–1)
r (pc)
Hβ
Lα
CIV 1549
MgII 2800
λLλ (5100 Å) = 1046 erg sec–1
2x solar metallicity
Figure 1Relative line emissivities per unit covering factor for twice solar metallicity BLR gas as a function of distancefrom the central BH. For the AGN luminosity considered here (7 × 1046 erg s−1), the graphite sublimationradius is at 1.32 pc and the silicate sublimation radius is at 3.5 pc. These distances are clearly visible owing tothe large drop in the intensity of all lines resulting from the absorption of the ionizing radiation by the grainsand to the selective depletion of most metals. Note that some line emission is still present well within thedusty torus (for details of the model, see Mor & Netzer 2012). Abbreviations: AGN, active galactic nucleus;BH, black hole; BLR, broad-line region.
This failed wind scenario is claimed to explain several BLR observations. Its main uncertaintiesare related to the nature of accretion disks (e.g., thin, thick), the variability of the radiation fromthe central source, and most importantly, the question of whether the local disk radiation pressurecan support very large-column-density dusty clumps.
Disk outflow models, magnetocentrifugal wind, or radiation-pressure-driven wind results inone continuous structure whose geometry is dictated by the global accretion process and whosedivision into dusty and dust-free regions depends entirely on the central radiation field. A majordistinction between the dust-free clouds closer in (BLR clouds) and the dusty clouds farther awayis the efficiency of line formation. Line formation can be calculated by photoionization modelsthat provide the predicted emissivity of a specific broad emission line as a function of distance fromthe central ionizing source. One example is shown in Figure 1. The parameters of the dust-freeclouds in this model were chosen to reproduce a typical broad-line spectrum with the correct RBLR.The graph shows the dramatic decrease in line emissivity at the graphite and silicate sublimationradii due to the appearance of grains that absorb most of the ionizing flux. The details of the lineemissivity depend on the run of ionization parameter, but the global behavior must be typical.Note that line emissivities do not drop to zero and there is additional emission from the dustypart inside the torus.
Perhaps the most realistic models of today are numerical hydrodynamic simulations that includemost but not all the processes discussed above. The three-dimensional hydrodynamic simulationsof Wada et al. (2009) and Wada (2012) are perhaps the most detailed of their kind. They treat theISM around a BH with ∼107 M� and assume SF and viscosity, which increase during the SN phase.
www.annualreviews.org • AGN Unification 375
Ann
u. R
ev. A
stro
n. A
stro
phys
. 201
5.53
:365
-408
. Dow
nloa
ded
from
ww
w.a
nnua
lrev
iew
s.or
g A
cces
s pr
ovid
ed b
y U
nive
rsid
ade
de S
ao P
aulo
(U
SP)
on 0
6/21
/18.
For
per
sona
l use
onl
y.

AA53CH10-Netzer ARI 16 July 2015 12:38
Wada et al. (2009) consider only stellar feedback and track atomic and molecular hydrogen with aspatial resolution of 0.125 pc. In a quasi-equilibrium state, the gas forms an inhomogeneous diskwith a typical diameter of approximately 30 pc. The velocity field of the disk is highly turbulent inthe torus region, and the average SN rate is small but large enough to energize the thick structure.The computed gas column densities are consistent with those derived by X-ray observations. Amore advanced version of the calculation (Wada 2012) includes AGN radiation pressure (AGNfeedback). This drives a fountain, and the interaction between the nonsteady outflow and inflowresults in the formation of a geometrically thick turbulent torus. Figure 2 shows face-on andedge-on views of the density in one such model.
a
b
y (p
c)
z (p
c)
log(
dens
ity)
(M
pc–3
)
x (pc)
x (pc)
30
20
10
0
–10
–20
15
10
5
0
–5
–10
–15
4.0
3.0
2.0
1.0
0.0
–1.0
–2.0
–30 –20 –10 0 10 20 30
–30
–30 –20 –10 0 10 20 30
Figure 2(a) Face-on and edge-on density maps of a central toroidal structure resulting from gas infall toward a 107-M� BH in the center of aspiral galaxy as calculated by Wada et al. (2009). Physical processes included in the simulations are SF activity, SN explosions, andstellar feedback (figure courtesy of K. Wada). (b) Edge-on view of the two-phase phenomenological model of Stalevski et al. (2012)showing high-condensation clumps in yellow-orange colors and lower-density interclump dust in blue (figure courtesy of M. Stalevski).Abbreviations: SF, star forming; SN, supernova.
376 Netzer
Ann
u. R
ev. A
stro
n. A
stro
phys
. 201
5.53
:365
-408
. Dow
nloa
ded
from
ww
w.a
nnua
lrev
iew
s.or
g A
cces
s pr
ovid
ed b
y U
nive
rsid
ade
de S
ao P
aulo
(U
SP)
on 0
6/21
/18.
For
per
sona
l use
onl
y.

AA53CH10-Netzer ARI 16 July 2015 12:38
Present-day numerical calculations have limited scope; in particular they treat low-mass BHsand low-accretion-rate systems. It is not at all clear that such scenarios are applicable to AGNswith a BH mass of the order of 109 M� and accretion rates of the order of 1 M� year−1. Athigh accretion rates, the local stellar population may be different, the SF events more violent,and the stellar population in the central region different from the one observed in nearbysystems.
Two other consequences of all torus models are considered here. The first consequence isthe connection between the typical dimensions of the torus and the gravitational potential of thegalaxy, which can be quantified by considering the sphere of influence of the central BH. Thissphere determines the relative importance of the BH gravity and the bulge gravity for material atthe center. It is defined as
RBH,sph = GM BH
σ 2∗� 10.7
M BH
108 M�
[ σ∗200 km s−1
]−2pc, (3)
where σ ∗ is the stellar velocity dispersion in the bulge. For LAGN/LEdd = 0.1, this correspondsto few × 106(σ∗/200 km s−1)−2 Rg . For nearby AGNs, RBH,sph ∼ 10 pc, similar to and even smallerthan the predicted outer dimension of the torus. Thus, the gravitational influence of the stars inthe bulge is comparable to that of the central BH and must be included in the calculations.
The second consequence is related to broad-line observations. All the models considered hererequire continuous flow of gas, from several parsecs to the ISCO. This would block the view of partof the BLR behind the disk in type-I AGNs that are observed close to face-on. The observationalimplications of this scenario have not been studied so far. The masses in both the torus and thecentral accretion disk are of the order of 1% of the BH mass, which, given an accretion rate thatproduces LAGN/LEdd = 0.1, could supply enough gas for few×106 years. This raises the possibilitythat a long accretion episode of approximately 108 years is broken into several shorter episodesduring which the inner disk is disconnected from the outer flow.
An interesting variant of the general torus formation scenario, proposed by Wang et al. (2010,2011b), moves the SF activity to inside the dust sublimation radius. This model is not concernedwith the issues of torus formation and stability. It merely assumes the existence of a central torusthat serves as a source of mass supply to the innermost region. The model includes a thin, centralaccretion disk around the central BH and fragmented clouds between RSG and the inner walls ofthe torus. SF activity and SN explosions take place inside the torus walls, and the duration of oneaccretion episode is estimated to be few × 106 years. This would result in approximately 106 starsthat may eventually settle into a central star cluster.
2.3. Phenomenological Torus Models
Phenomenological torus models refer to ad hoc models that enable a more accurate treatmentof the radiative transfer and better modeling of the emitted SED and the images of the torus atdifferent wavelengths.
2.3.1. Continuous and clumpy tori. Three generic types of phenomenological torus models arecontinuous (or smooth) gas distribution models (e.g., Pier & Krolik 1992, Efstathiou & Rowan-Robinson 1995, Granato et al. 1997, Dullemond & van Bemmel 2005, Fritz et al. 2006), clumpytorus models (e.g., Dullemond & van Bemmel 2005; Nenkova et al. 2008a,b; Honig et al. 2010),and composite (a combination of clumpy and continuous) models (Stalevski et al. 2012). Feltreet al. (2012) compare the first two types, and Lira et al. (2013) provide a comparison of two clumpytorus models based on fitting the spectra of type-II AGNs.
www.annualreviews.org • AGN Unification 377
Ann
u. R
ev. A
stro
n. A
stro
phys
. 201
5.53
:365
-408
. Dow
nloa
ded
from
ww
w.a
nnua
lrev
iew
s.or
g A
cces
s pr
ovid
ed b
y U
nive
rsid
ade
de S
ao P
aulo
(U
SP)
on 0
6/21
/18.
For
per
sona
l use
onl
y.

AA53CH10-Netzer ARI 16 July 2015 12:38
All phenomenological models are axisymmetric and the torus inner walls are assumed to be atthe dust sublimation radius. Unfortunately, the definition of this radius can differ between modelsbecause of the different types of grains and the exact method used to estimate the bolometricluminosity of the central sources. Some of the models, e.g., Stalevski et al. (2012), take intoaccount the radiation from an anisotropic central source. This adds an angular term to the torusequations [f(θ ) in Equation 1] to describe the shrinking sublimation radius at large polar angles.In this case, the torus equatorial plane reaches the outer boundary of the central accretion disk.The effect is more noticeable in the case of slim disks, for which the dependence of radiation fromthe central source on polar angles is more noticeable (Kawaguchi & Mori 2010, 2011; Wang et al.2014).
The important parameters of the continuous phenomenological models are the inner and outerradii of the torus, the density profile, and the opening angle. Additional parameters of clumpy torimodels include the column density of individual clumps, the radial distribution of the clumps (thisreplaces the run of gas density in the smooth model), the filling factor, and the density distributionof the clumps. Present-day phenomenological models do not yet include different types of grainsin different parts of the torus, although this has been considered in simpler (from the point of viewof radiative transfer) models (Schartmann et al. 2008).
Radiative transfer is relatively easy to handle in continuous dusty tori but not in clumpy tori.Different studies adopt different approaches to solve this problem. The analytical 1D calculationsof Nenkova et al. (2008a) are limited in their ability to treat complicated geometries but can covera large parameter space with different clump sizes, torus opening angles, and clump distributions.The 3D calculations of Honig et al. (2010) and Stalevski et al. (2012) are examples of models usinga Monte Carlo transfer technique, combined with ray-tracing, which allows for more accuratesolutions and, in principle, can deal with different grain sizes and compositions. However, thecalculations are computationally intensive and the parameter space explored more limited.
Continuous dust distribution models are characterized by a monotonically decreasing dusttemperature as a function of distance from the BH due to the F ∝ r−2 term and the attenuationof the incident radiation by the dust. In such models, every radius corresponds to a certain tem-perature. One prediction of continuous models is strong silicate 9.7 μm absorption in cases inwhich the total optical depth at this wavelength exceeds unity. This is simply the result of materialfarther away absorbing the flux emitted at this wavelength by the inner torus walls. This effect ispredicted to be most noticeable in type-II sources seen at large inclination angles (e.g., Nenkovaet al. 2008a).
There are two fundamental reasons why the SEDs of clumpy torus models are different. First,the illuminated and back sides of individual clumps radiate at different temperatures, which allowsa certain location in the torus to have a large range of temperatures rather than a single temperaturetypical of continuous models. Second, and more important, gaps between the clumps allow a free,unattenuated LOS from the center to deep inside the torus. A clump at several Rsub can emit at thelocal, distance-dependent dust temperature, spreading the high-temperature regions over largerparts of the torus. Two important consequences are that the strength of the 9.7 μm absorptionfeature is much below its predicted strength in continuous distribution cases, and the anisotropy ofthe emitted radiation is smaller. An obvious limitation is the assumption of empty space betweenthe clouds in a system where cloud collision and evaporation are unavoidable.
Composite models are perhaps the most realistic. In composite models, the volume betweenclumps is filled with diluted dusty gas, which absorbs part of the incident optical-UV radiationand part of the locally emitted NIR and MIR radiation. The main features of the pure clumpycase are preserved but additional attenuation by the intercloud dust and gas must be taken intoaccount. Figure 2 shows a schematic structure of the composite torus model of Stalevski et al.
378 Netzer
Ann
u. R
ev. A
stro
n. A
stro
phys
. 201
5.53
:365
-408
. Dow
nloa
ded
from
ww
w.a
nnua
lrev
iew
s.or
g A
cces
s pr
ovid
ed b
y U
nive
rsid
ade
de S
ao P
aulo
(U
SP)
on 0
6/21
/18.
For
per
sona
l use
onl
y.

AA53CH10-Netzer ARI 16 July 2015 12:38
101
a b
10 100 1 10 100
100
1,000
Wavelength (μm) Wavelength (μm)
Mean type-I SEDN
orm
aliz
ed λL
λ (er
g se
c–1)
i = 40i = 40i = 60i = 60
i = 80i = 80
i = 0i = 0
Figure 3(a) A comparison of the Stalevski et al. (2012) models (black curves) and the observed Mor & Netzer (2012)composite type-I SED model (red line) that contains dust emission from the NLR (see Section 3). Themodels are marked with the viewing angle to the torus. (b) The SED of a three-cloud obscurer. The columndensities of the clouds are 1023 cm−2 and the gas-to-dust ratio is galactic. Two of the clouds contain puregraphite grains, are located at the graphite sublimation radius, and are three times farther away. The thirdcloud contains ISM-type dust and is located 100 times farther away than the first cloud. The covering factorsare 0.1, 0.3, and 0.3, respectively. The solid black line is the combination of the three individual SEDs thatare marked by dashed lines. The blue line is the SED of the central disk. Abbreviations: ISM, interstellarmedium; NLR, narrow-line region; SED, spectral energy distribution.
(2012) and Figure 3 exhibits several SEDs computed with this model. The SEDs are comparedwith the composite type-I SED of Mor & Netzer (2012).
To illustrate the difficulty in deriving specific torus properties from comparing models withobservations, I show in Figure 3 a basic model that was constructed by combining the emittedfluxes of three (!) dusty clouds with the same column density, 1023 cm−2. The clouds are locatedat different distances from an accreting BH. Two of them contain pure graphite grains and thethird cloud contains graphite and silicate grains similar to what is found in the ISM (see the figurecaption for details). This simplest possible theoretical SED is already in reasonable agreement withthe observations suggesting that doubling or tripling the number of clouds is all that is requiredto get a good fit.
Finally, we should note two other types of phenomenological models, the tilted disk model ofLawrence & Elvis (2010) and the combined torus plus dusty polar wind model of Honig et al.(2013). The first model is discussed in Section 4 and the second in Section 3.
2.3.2. Anisotropy and covering factor. Each of the models discussed above has its own effectivecovering factor. For smooth torus models, this is simply a matter of geometry and the wavelength-dependent optical depths. For clumpy models, the covering factor depends on the number of cloudsand their 3D distribution. In the straw person model of Antonucci (1993), the covering factor is
www.annualreviews.org • AGN Unification 379
Ann
u. R
ev. A
stro
n. A
stro
phys
. 201
5.53
:365
-408
. Dow
nloa
ded
from
ww
w.a
nnua
lrev
iew
s.or
g A
cces
s pr
ovid
ed b
y U
nive
rsid
ade
de S
ao P
aulo
(U
SP)
on 0
6/21
/18.
For
per
sona
l use
onl
y.

AA53CH10-Netzer ARI 16 July 2015 12:38
assumed to be the same for all sources of a given luminosity. The implication for large samples istranslated to a simple expression: fC = Ntype-II/Ntype-I. The realization of a significant spread in fC
at a given luminosity suggests that the covering factor is a second unification parameter (Elitzur2012). In this case, the relative number of type-I and type-II sources still defines the mean fC , buta source is more likely to be classified as type-II if its covering factor is larger than the mean andas type-I if it is smaller than the mean. Thus, the high covering factor tail of the fC distributioncontains more type-II AGNs, and the mean covering factor of type-I AGNs is smaller than themean of type-II AGNs if objects are selected by their optical properties. More quantitatively, ifwe define the covering factor probability distribution of sources with luminosity L as P( fC ,L), andthe probability of a type-I source from this population to have a covering factor fC , PI ( fC ,L), wecan write,
PI ( fC , L) = (1 − fC )P ( fC , L); PI I ( fC , L) = fC P ( fC , L). (4)
Because of the finite probability of seeing the central source at any inclination through a clumpymedium (assuming no dusty interclump material), some sources classified spectroscopically as type-I AGNs have high inclination angles. Similarly, an obscuration by a single large cloud can resultin the appearance of a type-II spectrum. This interesting possibility can be tested by observations.For example, the angle of polarization of hidden broad emission lines in face-on tori is predicted tobe different from that in edge-on tori. The presence of a lower-density, dusty intercloud medium(Stalevski et al. 2012) changes this simple estimation, but the overall dependence on the angulardistribution of the clumps is still an important feature of all clumpy torus models.
Anisotropy is a second characteristic of all torus models. It is most noticeable in continuousgas distribution tori, in which the lowest-distance dust, which is directly heated by the centralsource, can only be seen from small inclination angles. In clumpy tori, there are always gaps in thedistribution and hot clumps can be seen at larger inclination angles. This reduces the anisotropy.Inspection of several models by Stalevski et al. (2012) and Nenkova et al. (2008b) designed to fitobserved SEDs suggests that for wavelengths that are optically thick to the torus-emitted radiation,the anisotropy is roughly proportional to cos i, where i is the inclination to the LOS. This is similarto the expected anisotropy of the central accretion disk. At longer wavelengths, where the dustoptical depth is smaller, the emission is more isotropic, and at FIR wavelengths the torus emitsmore like a sphere.
A general, somewhat simplistic approach that does not take into account wavelength depen-dences is nevertheless useful for improving the estimated geometrical covering factor for type-IAGNs. This approach requires an isotropy parameter b that varies from 1 (complete isotropy) to0 (maximum anisotropy) and a general dust anisotropy function, a(b, fC). Assume a case in whichthe (unknown) covering factor of the torus is fC and the total AGN bolometric luminosity, LAGN,is completely isotropic and seen, unattenuated, through the opening in the torus; i.e., (1−fC) LAGN
escapes the system. The total dust emission is fC LAGN and the emission through the opening (i.e.,the part a remote observer can see) is Ldust = (1− b fC ) fC LAGN. Recall that flux measurements re-fer to luminosity per unit solid angle [i.e., divide the AGN and dust emission through the openingby (1−fC)]; we can define an observed ratio, R = Ldust/LAGN, and relate it to the covering factorby requiring R = a(b, fC ) fC , where the anisotropy function is,
a = 1 − b fC
1 − fC. (5)
This gives a(b, fC ) = 1 for complete isotropy (b = 1) and a(b, fC ) = 1/(1 − fC ) for maximumanisotropy (b = 0), as required. For example, in a case in which fC = 0.7, complete isotropy of
380 Netzer
Ann
u. R
ev. A
stro
n. A
stro
phys
. 201
5.53
:365
-408
. Dow
nloa
ded
from
ww
w.a
nnua
lrev
iew
s.or
g A
cces
s pr
ovid
ed b
y U
nive
rsid
ade
de S
ao P
aulo
(U
SP)
on 0
6/21
/18.
For
per
sona
l use
onl
y.

AA53CH10-Netzer ARI 16 July 2015 12:38
dust emission gives R = fC , maximum anisotropy gives R = 3.33 fC , and an intermediate casewith b = 0.5 gives R = 2.17 fC .
Finally, in optically thick tori, the covering factor may also be related to the narrow-lineintensities, because the smaller the covering factor is, the larger the opening is and the more NLRgas is exposed to radiation from the central source. As shown in Section 5, this is a somewhatsimplistic approach because the NLR gas does not necessarily fill the entire cone and becauseabsorption by dusty interclump material close to the edges of the torus cannot be neglected.Moreover, the intensity of the narrow emission lines relative to the bolometric luminosity, LAGN,increases with decreasing source luminosity in a way that seems completely unrelated to thecovering factor of the torus.
3. TORUS OBSERVATIONS
The large number of successful IR space missions of the past 20 years, the ongoing successful X-raymissions, and the significant improvements in ground-based interferometry have revolutionizedthe study of AGN tori. They provide huge data sets that can be used to obtain reliable IR SEDs,allow multiwavelength studies of many thousands of AGNs, and enable researchers to proberegions near the BH that are 1 pc in size. This section describes these developments and theirapplication to individual AGNs. The related redshift and luminosity dependences are discussedin Section 7.
3.1. The Inner Torus Boundary: Dust Reverberation Mapping
The variable luminosity of the central source results in time-dependent heating and ionization ofthe surrounding gas and dust that can be used to obtain valuable information about the geometryand physical conditions of these regions. Reverberation mapping (RM) has been used for years tomap the distribution of the line-emitting gas, mostly Hβ, in the BLR (line RM; see Kaspi et al.2000, Bentz et al. 2013, and references therein). Other experiments measured the time-dependentdust emission in the NIR, mainly in the K-band, in response to the variable continuum (dust RM;see, e.g., Glass 1992, Suganuma et al. 2006, Kishimoto et al. 2007, Koshida et al. 2014, PozoNunez et al. 2014). The K-band wavelength, approximately 2.2 μm, is close to the peak emissivityof the hottest dust and the experiments provide information about the inner torus boundary(Section 1.2).
The main result of dust RM experiments, now carried out successfully in approximately 20 low-to medium-luminosity AGNs, is a tight correlation of the form R2.2 μm � 0.4(L46)1/2 pc (Koshidaet al. 2014), where L46 = LAGN/1046 erg s−1, and I converted the measured V-band luminosityto LAGN assuming LAGN � 8λLλ(5,500) A. Thus, to a good approximation, R2.2 μm = 〈Rsub,C〉(Equation 1). Note, however, that different values for the dust sublimation radius have been usedin the literature (e.g., Koshida et al. 2014), which led to suggestions that the measured V-Ktime lag is two to three times smaller than the time lag expected from sublimation temperatureconsiderations. The comparison of the Hβ and K-band RM results is shown in Figure 4. Themeasured K-band time lag is three to four times longer than the Hβ time lag, a result that isexpected given what we know about gas and emissivity distributions in the BLR (Netzer 2013).
RM experiments are not without difficulties. The dust transfer function (i.e., the dust emissionin response to a delta-function central source light curve) must be complicated and differs substan-tially from a simple thin or thick shell. For example, it depends on the torus and disk inclination,the dimming of disk radiation toward its equatorial plane, and the occultation of some parts ofthe torus (Kawaguchi & Mori 2010, 2011; Pozo Nunez et al. 2014). Nevertheless, the agreement
www.annualreviews.org • AGN Unification 381
Ann
u. R
ev. A
stro
n. A
stro
phys
. 201
5.53
:365
-408
. Dow
nloa
ded
from
ww
w.a
nnua
lrev
iew
s.or
g A
cces
s pr
ovid
ed b
y U
nive
rsid
ade
de S
ao P
aulo
(U
SP)
on 0
6/21
/18.
For
per
sona
l use
onl
y.
AA53CH10-Netzer ARI 16 July 2015 12:38
0.010
0.100
1.000
10.000
100.000
1041 1042 1043 1044 1045 10460.001
Mid-IR interferometry
Dust reverberation
+ near-IR interferometry
BLR reverberation (Hβ)Pure graphite sublimation radius
νLν (0.51 μm) (erg sec–1)
Radi
us (p
c)
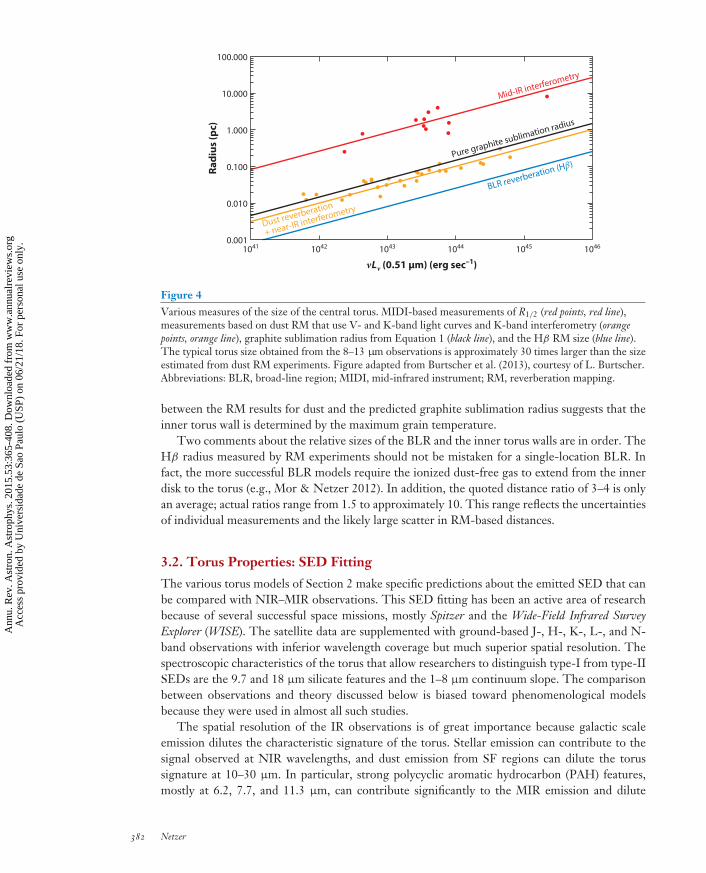
Figure 4Various measures of the size of the central torus. MIDI-based measurements of R1/2 (red points, red line),measurements based on dust RM that use V- and K-band light curves and K-band interferometry (orangepoints, orange line), graphite sublimation radius from Equation 1 (black line), and the Hβ RM size (blue line).The typical torus size obtained from the 8–13 μm observations is approximately 30 times larger than the sizeestimated from dust RM experiments. Figure adapted from Burtscher et al. (2013), courtesy of L. Burtscher.Abbreviations: BLR, broad-line region; MIDI, mid-infrared instrument; RM, reverberation mapping.
between the RM results for dust and the predicted graphite sublimation radius suggests that theinner torus wall is determined by the maximum grain temperature.
Two comments about the relative sizes of the BLR and the inner torus walls are in order. TheHβ radius measured by RM experiments should not be mistaken for a single-location BLR. Infact, the more successful BLR models require the ionized dust-free gas to extend from the innerdisk to the torus (e.g., Mor & Netzer 2012). In addition, the quoted distance ratio of 3–4 is onlyan average; actual ratios range from 1.5 to approximately 10. This range reflects the uncertaintiesof individual measurements and the likely large scatter in RM-based distances.
3.2. Torus Properties: SED Fitting
The various torus models of Section 2 make specific predictions about the emitted SED that canbe compared with NIR–MIR observations. This SED fitting has been an active area of researchbecause of several successful space missions, mostly Spitzer and the Wide-Field Infrared SurveyExplorer (WISE). The satellite data are supplemented with ground-based J-, H-, K-, L-, and N-band observations with inferior wavelength coverage but much superior spatial resolution. Thespectroscopic characteristics of the torus that allow researchers to distinguish type-I from type-IISEDs are the 9.7 and 18 μm silicate features and the 1–8 μm continuum slope. The comparisonbetween observations and theory discussed below is biased toward phenomenological modelsbecause they were used in almost all such studies.
The spatial resolution of the IR observations is of great importance because galactic scaleemission dilutes the characteristic signature of the torus. Stellar emission can contribute to thesignal observed at NIR wavelengths, and dust emission from SF regions can dilute the torussignature at 10–30 μm. In particular, strong polycyclic aromatic hydrocarbon (PAH) features,mostly at 6.2, 7.7, and 11.3 μm, can contribute significantly to the MIR emission and dilute
382 Netzer
Ann
u. R
ev. A
stro
n. A
stro
phys
. 201
5.53
:365
-408
. Dow
nloa
ded
from
ww
w.a
nnua
lrev
iew
s.or
g A
cces
s pr
ovid
ed b
y U
nive
rsid
ade
de S
ao P
aulo
(U
SP)
on 0
6/21
/18.
For
per
sona
l use
onl
y.

AA53CH10-Netzer ARI 16 July 2015 12:38
broad-band photometric observations. In addition, dust emission from the NLR can contributesignificantly to the 10–30 μm continuum (Schweitzer et al. 2008, Mor et al. 2009, Mor & Netzer2012). Because of this, small-aperture spectroscopic observations are preferred. Unfortunately, theSpitzer spectroscopic apertures are several arcseconds in size and include significant contributionfrom the host galaxy in low-luminosity AGNs (see Buchanan et al. 2006 for a large collection ofsuch contributions). Alonso-Herrero et al. (2011) and Lira et al. (2013) compare in great detaillarge- and small-aperture spectroscopic observations.
Ramos Almeida et al. (2011, 2014) provide high spatial resolution (approximately 35 pc), de-tailed observations of a very small number of objects. The results are similar to results in otherstudies by this group and claim to be clean because they avoid galaxies with known dust lanesthat affect the SED shape and the depth of the 9.7 μm feature. The 1.5–19 μm SEDs obtained inthose studies indicate a considerably different slope for the two types of AGNs. For type-I AGNs,λLλ ∝ λ0.7, and for type-II AGNs, λLλ ∝ λ1.6, with a rather large scatter in both slopes. However,Lira et al. (2013) used a much larger sample of type-II sources and their work disagrees with someof the results of Ramos Almeida and colleagues. Lira et al. show a very large range of slopes,including some that are similar to and even flatter than the type-I slopes found by Ramos Almeidaet al. (2014). It seems that there is no canonical NIR–MIR slope for low-luminosity type-II AGNs.
Most attempts to derive torus parameters, such as the number of clumps along a certain di-rection and clump optical depths, give inconclusive results. Lira et al. (2013) compared in detailthe rather different clumpy torus models of Nenkova et al. (2008b) and Stalevski et al. (2012) andobtained statistically satisfactory fits for both. One parameter of the fit is the inclination angle,but unfortunately no correlation between the angles was found by applying the two models. Liraet al. (2013) also found that SED fitting of approximately half of their type-II sources requires anadditional very hot dust component, with a dust temperature of approximately 2,000 K, to explainthe flux observed in the NIR band. None of clumpy models used in this work included such hotdust. It seems that the NIR–MIR spectra of all types of AGNs do not contain enough spectralfeatures to distinguish one object from the next, or one clumpy torus model from another. Inother words, torus models contain enough free parameters to fit almost any observed SED.
There are several examples of SED fitting of luminous, type-I AGNs (Schweitzer et al. 2008,Mor et al. 2009, Assef et al. 2013, Lusso et al. 2013, Roseboom et al. 2013). Schweitzer et al. (2008)demonstrated that successful SED fitting of large-aperture observations requires, in addition to thestandard torus model, very hot, T > 1,500 K, emission from the torus and warm dust emission fromthe NLR. This approach was later used by Mor & Netzer (2012), who combined the Nenkova et al.(2008b) clumpy torus model with pure graphite grains and a dusty NLR. The hot dust componentis not an integral part of the Nenkova et al. (2008b) models and its treatment is rather simple. Aftersubtracting the host SF contribution, they fitted Spitzer spectra combined with NIR photometryand obtained satisfactory fits, similar to those shown in Figure 5, for more than 100 medium- andhigh-luminosity AGNs. The composite SED of this sample (red line in Figure 3) indicates a veryflat, slope zero (in λLλ) 2–25 μm continuum and a turndown at longer wavelengths. The exactdependence of a long wavelength is sensitive to the assumed SF contribution. Indeed, a paralleleffort by Mullaney et al. (2011), who used a smaller sample of AGNs of both types, suggesteda decline that starts at a longer wavelength of 30–40 μm. As shown above (Figure 3), a simplecombination of a few large clumps can fit such observations almost as well as the sophisticatedclumpy models can.
The Mor & Netzer (2012) SED fittings were used to constrain the various parameters of theclumpy torus model of Nenkova et al. (2008b). The results show a well-defined inner radius, anill-defined outer radius, and a broad distribution of cloud properties. Many of these properties are
www.annualreviews.org • AGN Unification 383
Ann
u. R
ev. A
stro
n. A
stro
phys
. 201
5.53
:365
-408
. Dow
nloa
ded
from
ww
w.a
nnua
lrev
iew
s.or
g A
cces
s pr
ovid
ed b
y U
nive
rsid
ade
de S
ao P
aulo
(U
SP)
on 0
6/21
/18.
For
per
sona
l use
onl
y.

AA53CH10-Netzer ARI 16 July 2015 12:38
5 10 15 20 25
1044
1045
Wavelength (μm)5 10 15 20 25 30
Wavelength (μm)
Torus
Hotdust
NLR
Observed
Observed
NLRHot dust
Torus
a b
c
λLλ (
erg
sec–1
)
log νL
ν (er
g se
c–1)
λLλ (
erg
sec–1
)
1043
1044
Observed−SFcontributionObserved−SFcontribution
47.0
46.5
46.0
45.5
45.0
44.5
44.05 10 15
Restframe wavelength (μm)
Mean quasar
Mean radio galaxy
Figure 5(a,b) Observed ( gray) and SF-contribution-subtracted (dot-dashed line) SEDs of two type-I AGNs. Thediagrams show the three components used in the fit: hot pure graphite dust, a clumpy torus model withISM-type dust, and dust emission from the NLR. The thick black curve is the sum of the three components.Adapted from Mor & Netzer (2012) with permission. (c) Composite type-I (quasars) and type-II (radiogalaxies) SEDs of z ∼ 1.2 steep spectrum radio-loud AGNs, illustrating the large spectral differencesbetween the two groups. Reprinted from Honig et al. (2011) with permission. Abbreviations: ISM,interstellar medium; NLR, narrow-line region; SED, spectral energy distribution; SF, star forming.
similar to those found by Lira et al. (2013) when fitting their own type-II objects. The fittings alsoallow researchers to compare how the three major components contribute to the total dust emis-sion. For the luminosity median of the population, L(hot torus dust):L(warm torus dust):L(NLRdust) ≈ 40:40:20. The relative NIR and MIR luminosities in the Roseboom et al. (2013) sample,which does not consider the NLR contribution, are similar and somewhat luminosity dependent.
384 Netzer
Ann
u. R
ev. A
stro
n. A
stro
phys
. 201
5.53
:365
-408
. Dow
nloa
ded
from
ww
w.a
nnua
lrev
iew
s.or
g A
cces
s pr
ovid
ed b
y U
nive
rsid
ade
de S
ao P
aulo
(U
SP)
on 0
6/21
/18.
For
per
sona
l use
onl
y.

AA53CH10-Netzer ARI 16 July 2015 12:38
The fits also provide an estimate of the luminosity-dependent size of the NLR:
RNLR � 460[
LAGN
1046 erg s−1
]0.67
pc. (6)
This dimension is more than two orders of magnitude larger than the silicate sublimationradius and is in agreement with the inner part of the NLR derived from direct imaging andphotoionization models. It corresponds to a mean grain temperature of approximately 160 Kwith a peak emission at approximately 18 μm.
An additional detailed study of the NIR–MIR SED of z ∼ 1.2 luminous radio-loud AGNscovers the rest-frame wavelength of 1–17 μm (Honig et al. 2011). The sample includes 3CRRsources originally described by Haas et al. (2008) and Leipski et al. (2010) that are similar in theirIR-optical-UV properties to radio-quiet AGNs. Despite its small size (20 objects), the sample ismost suitable for the comparison of type-I and type-II sources because it is chosen on the basisof the extended radio emission, which is expected to be radiated isotropically. Although the meanradio luminosity of the two groups is almost identical, the NIR–MIR spectrum is different (seeFigure 5). The type-I SEDs (called quasars in the figure) are flat in λLλ and similar to the Mor& Netzer (2012) composite. The type-II SEDs (called radio galaxies) rise steeply from 1 to 7 μmand are similar to some of the type-II SEDs discussed above.
In summary, the typical NIR–MIR SEDs of type-I and type-II AGNs are rather different.Most but not all type-I AGNs show significant hot dust emission. Type-II AGNs show a muchlarger diversity in which some objects are similar to type-I AGNs and others show a steep declinefrom long to short wavelengths. Clumpy torus models provide adequate fits to many observedSEDs but seem to be degenerate with respect to their basic parameters. Because of this, modelswith different geometry, dust distribution, and even inclination can produce equally good fits tothe same data. The inner region of the torus, which contains pure graphite dust, is required bythe observations but is missing from today’s models. Given all this, it is not yet clear that currentphenomenological models resemble, well, real AGN tori.
3.3. Anisotropy and Covering Factor
As explained in Section 2.3.2, dust emission from optically thick tori is characterized by awavelength-dependent anisotropy. Several of the torus models described in Section 2 are opticallythick throughout most of the 1–20 μm wavelength range, and SED differences between type-Iand type-II sources can be used to derive the anisotropy. According to Honig et al. (2011), theanisotropy is the cause of the different SEDs shown in Figure 5c. In this particular case, if thetype-II inclination angle is 75◦ and the type-I inclination angle is 39◦, the column density neededto produce this anisotropy corresponds to AV ∼ 150 mag. Even at such a large column, theoptical depth is small and the emission is isotropic at λ ≥ 30 μm.
A direct way to estimate the anisotropy is to measure the dust optical depth by searching forbroad Paschen and Brackett lines in the spectrum of type-II sources. The total number of objectsstudied in this way is small (see Lutz et al. 2002 and references therein) and the typical detectionrate is only approximately 30%. The most useful results were obtained for type-II AGNs showingbroad Balmer lines in polarized light, indicating a hidden BLR. The handful of broad Brα linesreported by Lutz et al. (2002) indicate that τ (4.05 μm) ∼ 3 mag., corresponding to columndensities of the order of 1023 cm−2, which are consistent with the columns derived from X-rayobservations of the same sources. For several objects in this sample, with polarized broad emissionlines but no direct broad-line detection at 4.05 μm, the obscuration must be larger. As shown inSection 4, such a good agreement is not typical of many AGNs.
www.annualreviews.org • AGN Unification 385
Ann
u. R
ev. A
stro
n. A
stro
phys
. 201
5.53
:365
-408
. Dow
nloa
ded
from
ww
w.a
nnua
lrev
iew
s.or
g A
cces
s pr
ovid
ed b
y U
nive
rsid
ade
de S
ao P
aulo
(U
SP)
on 0
6/21
/18.
For
per
sona
l use
onl
y.

AA53CH10-Netzer ARI 16 July 2015 12:38
The large NIR optical depths deduced from the Brα observations should not be confused withthe observations of many type-Ii AGNs showing weak broad Hα lines and basically no broad Hβ
lines, indicating a few magnitudes of visual extinction. Such objects are common, estimated tocompose 10–20% of all low-redshift AGNs (e.g., Lawrence & Elvis 1982, Antonucci 1993, Elvis2012; see Section 1). They are thought to be reddened by galactic scale dust, although in somecases the source is probably seen through a small-column-density part of the torus. Reddening ofhigh-luminosity high-redshift AGNs is also a common phenomenon (e.g., Glikman et al. 2004,Lacy et al. 2007). Such objects are found in IR and radio surveys, and their weak, occasionallyundetected optical emission suggests a large range of dust extinction, from that typical of manylocal type-Ii sources to much higher. The fraction of such objects in the general population mustbe high but is not accurately known.
Anisotropy influences covering factor estimates on the basis of the measured Ldust/LAGN (Equa-tion 5). The estimation of the mean and the distribution of fC requires an additional correctionthat takes into account that a given LAGN is associated with a range of covering factors. In partic-ular, a large fC increases the probability of classifying a source as type-II and the opposite is truefor type-I sources (Equation 4).
Covering factors for a large number of type-I AGNs have been obtained by using the Ldust/LAGN
method (Maiolino et al. 2007, Treister et al. 2008, Mor & Trakhtenbrot 2011, Mor & Netzer2012, Lusso et al. 2013, Roseboom et al. 2013). The quality of the SED fits in such studies rangesfrom poor to very good, where spectroscopy-based fits provide more reliable measurements.Not all studies include the anisotropy correction term, which results in overestimation of fC . Allstudies show a broad distribution of fC for a given luminosity, with a type-I population meanof 0.3–0.6. There are indications that the mean covering factor decreases with increasing sourceluminosity, but this result depends on the method used to estimate LAGN, which varies considerablybetween studies. Some of the studies attempted to separate hot (NIR) from warm (MIR) dust(Mor & Trakhtenbrot 2011, Mor & Netzer 2012, Roseboom et al. 2013). They showed that thehot-dust covering factor varies over a larger range, with some sources missing this componentaltogether (hot-dust-poor AGNs; see Mor & Trakhtenbrot 2011). The fraction of such sourcesamong luminous AGNs is approximately 15%. In general fC (hot dust) ≈ fC (warm dust), butthe separation of the two is model dependent. A big disadvantage of this method as applied toIR-selected samples is the bias against low-covering-factor sources.
The covering factor of the torus can be obtained directly from modeling the observed X-raycontinuum (see Section 1). Ueda et al. (2007) and Brightman & Ueda (2012) demonstrated this bycarefully comparing the scattered and transmitted X-ray flux of a large number of type-II AGNs.The authors claimed to measure scattered radiation, which is as low as 1–2%, and thus identifyburied active BHs that are completely surrounded by geometrically thick tori with fC � 1. Theirwork suggests that some 20% of high-redshift sources in several deep X-ray fields are completelyburied AGNs.
An additional way to estimate fC is based on the observed intensity of the narrow Fe Kα line(Section 1.2). Studies of large X-ray samples show that EW(Kα) decreases with increasing X-ray luminosity, roughly like L−0.15
AGN , but not with redshift (the X-ray effect; see, e.g., Iwasawa &Taniguchi 1993, Chaudhary et al. 2010, Ricci et al. 2013). EW(Kα) depends on the combinationof the torus column density, covering factor, and metallicity (Ikeda et al. 2009, Yaqoob et al.2010, Brightman & Nandra 2011a, Ricci et al. 2013). The advantage of this method is that theselection of sources by their X-ray flux is independent of the measured quantity, EW(Kα). Possiblecomplications are extra emission from Kα produced in broad-line clouds and the fact that EW(Kα)also depends on column density. Moreover, the measured LOS X-ray column and the mean columndensity of the torus are not necessarily the same (see, e.g., Brightman & Ueda 2012).
386 Netzer
Ann
u. R
ev. A
stro
n. A
stro
phys
. 201
5.53
:365
-408
. Dow
nloa
ded
from
ww
w.a
nnua
lrev
iew
s.or
g A
cces
s pr
ovid
ed b
y U
nive
rsid
ade
de S
ao P
aulo
(U
SP)
on 0
6/21
/18.
For
per
sona
l use
onl
y.
AA53CH10-Netzer ARI 16 July 2015 12:38
Finally, a complementary approach to finding a population mean covering factor is to measurethe LOS-obscuring column and associate small columns with type-I sources and large columnswith type-II sources. The mean fC is then obtained from the Ntype-II/Ntype-I ratio, where N is thenumber of objects. This method is discussed in Section 7.
Weedman et al. (2012) examined the covering factor of the most luminous AGNs; theycompared the WISE (rest-frame 7.8 μm) and SDSS (rest-frame wavelength of 1,350 A) lu-minosities of the most MIR-luminous type-I AGNs at redshifts of 1.5–5. The study assumedLdust/L(7.8 μm) � 3 and found extremely high values of Ldust, 1046.9−47.3 erg s−1, and fC > 1 formany sources. The problem with this and several other studies is the neglect of known selectioneffects and necessary correction factors, such as the anisotropy correction term of Equation 5and the possible anisotropy of the accretion disk radiation. Moreover, these objects are probablyunique among type-I AGNs in terms of their covering factor because they were selected to be themost IR luminous. The agreement between the luminosity distributions at 7.8 μm and 1,350 Ais indeed poor. Finally, a large fraction of the sources may be reddened because of the large dustcovering factor, a possibility acknowledged by the authors. Taken together, it seems that the meancovering factor of the torus for the most luminous type-I AGNs is approximately 0.5.
An important way to evaluate the combined effect of anisotropy and covering factor is tocompare the X-ray and MIR luminosities, L(MIR)/L(2–10 keV). The comparison made at 6 andapproximately 12 μm shows an almost identical mean ratio for the two AGN types, over fourorders of magnitude in luminosity, with a typical scatter of approximately 0.3 dex (Lutz et al.2004, Gandhi 2009, Levenson et al. 2009, Honig et al. 2010, Asmus et al. 2011, Brightman &Nandra 2011b, Gonzalez-Martın et al. 2013, Merloni et al. 2014). This is a somewhat surprisingresult given the covering factor and anisotropy discussed above. Naive expectations suggest on theone hand that the larger covering factor of type-II sources would increase the ratio L(MIR)/L(2–10 keV) relative to that of type-I sources. On the other hand, anisotropy of the MIR emission wouldtend to decrease this ratio in type-II AGNs typically seen at higher inclination angles. Emissionby NLR dust will affect large-aperture observations and will contribute equally to the two types.This cannot be a significant source of confusion at 6 μm, where the NLR dust contribution issmall, or when using small-aperture observations that exclude most of the NLR emission. Is itpossible that all these effects conspire to smear out the differences between type-I and type-IIAGNs? There were several attempts to blame the method used to estimate L(2–10 keV) for theunexpected constant ratio of L(MIR)/L(2–10 keV) (Brightman & Nandra 2011b, LaMassa et al.2011, Mayo & Lawrence 2013) and to obtain absorption-corrected X-ray luminosities that takeinto account more complex clumpy tori, including partial covering in some directions. However,it is difficult to determine how all this can explain the above luminosity ratio.
3.4. Imaging Interferometry
The most important development regarding AGN unification is perhaps the significant improve-ments in long baseline interferometry and the ability to resolve the central structure on a mil-liarcsecond scale. The most significant results were obtained by three instruments. The first isthe mid-infrared instrument (MIDI) from the European Southern Observatory (ESO). This in-terferometer operates in an atmospheric window of 8–13 μm, with projected baselines rangingfrom approximately 30 to 130 m (e.g., Jaffe et al. 2004, Kishimoto et al. 2011b, Burtscher et al.2013, Honig et al. 2013). This instrument provided the largest sample. The second instrumentis the Keck K-band interferometer (KI) (see Swain et al. 2003, Pott et al. 2010, Kishimoto et al.2011a), with a projected baseline of 85 m. The third instrument is the ESO Astronomical Multi-BEam combineR (AMBER) (Weigelt et al. 2012). Interferometric measurements allow measures
www.annualreviews.org • AGN Unification 387
Ann
u. R
ev. A
stro
n. A
stro
phys
. 201
5.53
:365
-408
. Dow
nloa
ded
from
ww
w.a
nnua
lrev
iew
s.or
g A
cces
s pr
ovid
ed b
y U
nive
rsid
ade
de S
ao P
aulo
(U
SP)
on 0
6/21
/18.
For
per
sona
l use
onl
y.

AA53CH10-Netzer ARI 16 July 2015 12:38
and models of the size and shape of the IR-emitting components on a spatial scale of less than1 pc. The attainable resolution depends on the flux distribution in the source, the wavelengthand baseline of the experiment, the redshift, and the source coordinates (which determine thecoverage of the uv-plane). The results are often quoted in units of R1/2, which is the wavelength-dependent radius containing half of the emitted flux. The latest results from MIDI, summarizedin Burtscher et al. (2013) and illustrated in Figure 4, include 23 sources with 8–13 μm dimensionsof 1–100 pc. The KI and AMBER samples are smaller but provide valuable information aboutshorter wavelengths and hotter dust.
The large scatter in the measured R1/2 at MIR wavelengths is different from the tight corre-lation between size and luminosity indicated by dust RM that probes regions closer to the innertorus boundary. Part of this must be related to the fact that in many cases, there are two distinctcomponents in the resolved N-band interferometry. Translating this to a specific size is obviouslymodel dependent and subjected to large uncertainties. All this indicates a rather complex rela-tionship between radius and dust temperature in the torus. Another surprise is the similar size oftype-I and type-II objects of the same luminosity (simple tori predict that type-II tori will looklarger). Furthermore, the measured K-band R1/2 is larger, by 0.2–0.4 dex, than the K-band sizemeasured by RM (Kishimoto et al. 2011a). This is likely related to the different definitions of thetwo radii, as R1/2 is a flux-weighted radius and Rin (or Rsub) is a response-weighted radius.
In a small number of well-observed nearby sources, the interferometry allows researchersto obtain model images that reveal the rough structure, elongation, and inclination of thecentral dusty structure. As of 2014, we have this information for four sources: NGC 1068(type-II), Circinus (type-II), NGC 424 (type-I), and NGC 3783 (type-I). Of the four, the spatialinformation obtained for the Circinus galaxy, a type-II AGN with a graphite sublimation radiusof approximately 0.01 pc, is perhaps the best. The emissivity maps of this source, in three MIRbands, were modeled by Tristram et al. (2014) and their combination is shown in Figure 6.The figure also shows the boundaries of the ionization cone based on HST imaging of the[O III] λ5007 line. The map shows two distinct components. The first is a thin (axial ratio of1:6 or less), approximately 1 pc disk-like structure, emitting approximately 20% of the MIRflux, with an orientation that agrees with the orientation of the smaller (0.1–0.4 pc) warpedmaser disk observed in this source (Greenhill et al. 2003). The second is a much larger andthicker elongated structure, roughly perpendicular to the first component. This ellipse-shapedcomponent, elongated roughly in the polar direction, emits approximately 80% of the 8–13 μmflux with a clear wavelength gradient reflecting the dust temperatures in the various parts. Noneof these features is in agreement with the shape and orientation of a simple central torus.
An exciting result is obtained by combining MIDI (N-band) and AMBER (K-band) measure-ments of the type-I AGN NGC 3783. The combined model image indicates different elongationsof the K- and N-band isophotes. The K-band model image (which is still somewhat uncertain)likely elongates in a direction parallel to the expected plane of the torus. The N-band modelimage is of much larger dimensions and is elongated almost perpendicular to the K-band modelimage, along the expected polar axis. Honig et al. (2013) interpreted this geometry as a combi-nation of an inner small torus with very hot dust and a dusty polar outflow that, because of itsdistance, contains cooler dust. This interpretation is somewhat similar to that of the Circinusmodel mentioned above (for which K-band information is not available). Earlier ground-basedadaptive optics–assisted observations pointed out polar emission in a different source (NGC 1068;see Bock et al. 2000).
Although complicated radiative transfer effects may result in the unusual model images pre-sented here (see Schartmann et al. 2005), the interferometric results for Circinus and NGC 3783,
388 Netzer
Ann
u. R
ev. A
stro
n. A
stro
phys
. 201
5.53
:365
-408
. Dow
nloa
ded
from
ww
w.a
nnua
lrev
iew
s.or
g A
cces
s pr
ovid
ed b
y U
nive
rsid
ade
de S
ao P
aulo
(U
SP)
on 0
6/21
/18.
For
per
sona
l use
onl
y.

AA53CH10-Netzer ARI 16 July 2015 12:38
100
50
0
Off
set δ
DEC
(mas
)
Offset δRA (mas)
E
N
1 pc
–50
–100
–100 –50 0 50 100
Figure 6A MIDI-based model image of the Circinus galaxy showing the location of the maser disk (red-green-blueline); central thin MIR-emitting structure (white); and a larger, thick, elongated structure, with colorsmarking central wavelengths: red, 13 μm; green, 10.5 μm, and blue, 8 μm. The thick red-green-blueelongated structure emits approximately 80% of the MIR radiation. Its orientation is different from theexpected orientation of a standard torus. The boundaries of the ionization cone (only one side cone in thissource) are shown as dashed blue lines (adapted from Tristram et al. 2014, courtesy of K. Tristram).Abbreviations: MIDI, mid-infrared instrument; MIR, mid-infrared.
and indications for similar structures in two other sources, suggest a possible change of paradigm.A central, equatorial, small-covering-factor torus may still be needed to explain the hot dust emis-sion, but much of the cooler, approximately 300 K dust may well reside in an additional componentthat has different geometry, size, and optical depth, and perhaps different dynamics (i.e., a windcomponent). A realistic model for this new structure must combine several different elementsand take into account that the hotter inner torus must also emit some of the observed MIR flux(e.g., 20% in the case of Circinus). Such a model should also answer several outstanding questionsabout the clear pass to the ionization cone, indicated by strong unreddened narrow lines if theflow is optically thick or by the lack of silicate emission in the Circinus spectrum if it is opticallythin. It must also dismiss covering factor estimates that apply only to simple axisymmetric tori. Inparticular, the assumption of fC (total) = fC (hot dust) + fC (warm dust) may not work in this typeof geometry. Finally, several hydrodynamic models suggest dusty polar outflows (Wada 2012),which may partly explain the observations.
www.annualreviews.org • AGN Unification 389
Ann
u. R
ev. A
stro
n. A
stro
phys
. 201
5.53
:365
-408
. Dow
nloa
ded
from
ww
w.a
nnua
lrev
iew
s.or
g A
cces
s pr
ovid
ed b
y U
nive
rsid
ade
de S
ao P
aulo
(U
SP)
on 0
6/21
/18.
For
per
sona
l use
onl
y.

AA53CH10-Netzer ARI 16 July 2015 12:38
4. ADDITIONAL AND ALTERNATIVE OBSCURERS
4.1. Galactic Scale Obscuration
Galaxy-scale obscuration is common in many AGNs, and numerous individual cases studied byHST and ground-based observations have been documented since the 1980s (e.g., Lawrence &Elvis 1982, Antonucci 1993, Malkan et al. 1998, Prieto et al. 2014). Well-known examples aresome of the objects detected by optical spectroscopy and classified here as type-Ii AGNs. In severalpast publications they were called narrow-line X-ray galaxies (NLXGs). Some of the objects showkiloparsec-scale dust lanes, others might be affected by dust in the torus. The fraction of type-IiAGNs might have been underestimated because many real type-II AGNs (Merloni et al. 2014),especially those for which spectroscopic observations were of low quality, may belong to thisgroup. As argued in Section 7, this group is a major source of uncertainty when estimating therelative fractions of AGNs that are type-I and type-II.
Galactic scale obscuration is more common in low-luminosity type-II AGNs. High spatialresolution observations of such objects reveal kiloparsec-scale dusty filaments that seem to beconnected to much smaller dusty features close to the nucleus. This finding led Prieto et al.(2014) and others to propose that a central torus is not required for AGN unification at lowluminosity. Large-scale LOS absorption has also been found in several Compton-thick AGNsstudied with Spitzer (Goulding et al. 2012). In this sample, AGNs in face-on galaxies show littlesilicate 9.7 μm absorption, as predicted by clumpy torus models, and AGNs in nearly edge-ongalaxies, or in mergers, show much stronger silicate absorption, indicating dust in the galaxy.This finding adds to previous similar results obtained for Compton-thin type-II AGNs (Deoet al. 2007, 2009). In some cases, galactic extinction is so large that it can completely obscure thecentral AGN at optical wavelengths (Goulding & Alexander 2009). The connection, if any, tothe heavily reddened AGNs mentioned above is not yet clear.
Supplementing the detailed investigation of individual sources are lower spatial resolutionstudies of many thousands of AGNs such as that by Lagos et al. (2011). This study finds that spiraland elliptical type-I hosts are strongly skewed toward face-on inclinations, whereas type-II hostsare skewed toward edge-on inclinations. The study also shows that galactic dust absorption byitself cannot explain the absence of broad emission lines in type-II sources. The inclination of thehost galaxy strengthens the idea that the angular momentum of the material that feeds the BHretains a memory of its origin in the galaxy; i.e., statistically speaking, galaxy disks, central tori,and inner accretion disks, are generally aligned. This issue, which was investigated in numerouspapers, remains unresolved. For example, Kinney et al. (2000) used information from radio jetposition angles and claimed to find no correlation between jet direction (i.e., orientation of theinner accretion disk) and the disk of the host galaxy.
4.2. X-Ray Obscuration by Gas in the BLR
The simple idea of a single torus-like obscurer suffers from various limitations, especially wherevery large column densities are concerned. For example, the observed optical reddening is muchsmaller than the value obtained by translating the measured X-ray column to foreground extinc-tion, assuming galactic dust-to-gas ratio (e.g., Maiolino et al. 2001, Risaliti et al. 2002, Gouldinget al. 2012). In addition, some X-ray variations indicate large changes in the obscuring columnon short timescales (a few days or less), which is not consistent with the idea that the obscuringmaterial is outside the sublimation radius. This inconsistency raises the possibility that obscurationby dust-free gas inside the BLR affects X-ray absorption and hence AGN classification.
390 Netzer
Ann
u. R
ev. A
stro
n. A
stro
phys
. 201
5.53
:365
-408
. Dow
nloa
ded
from
ww
w.a
nnua
lrev
iew
s.or
g A
cces
s pr
ovid
ed b
y U
nive
rsid
ade
de S
ao P
aulo
(U
SP)
on 0
6/21
/18.
For
per
sona
l use
onl
y.

AA53CH10-Netzer ARI 16 July 2015 12:38
The typical dimensions of BLR clouds are estimated to be 1013−14 cm and their typical columndensity is of the order of 1023−24 cm−2. This is roughly the size of the central X-ray source in low-to intermediate-luminosity AGNs (a few Rg). For an X-ray continuum source approximately 1014
cm across, and a cloud velocity of the order of 3,000 km s−1, the occultation time is of the orderof 4 days. Can such clouds occult the central source, giving the impression of a variable X-raysource? Recent observations and modeling suggest that this is indeed the case for almost everyobject for which the observations are of a long-enough duration to discover such eclipses.
Detailed studies of a small number of type-I and type-II AGNs provide evidence for eclipsesby large-column-density blobs (Risaliti et al. 2007, 2011). In the best-studied case, NGC 1365,the X-ray source underwent a total eclipse in less than 48 h and then emerged within the sametime (Risaliti et al. 2007). Detailed modeling of this and similar events by Maiolino et al. (2010)provided information about the likely location, velocity, and size of the occulting gas, all of whichwere consistent with being part of the BLR and inside the sublimation radius. Maiolino et al. (2010)speculated that the occulting clouds might have developed cometary tails, which are manifestedas a gradual decrease in the column density as clouds emerged from the eclipse. Different time-dependent X-ray absorption events from inside the sublimation radius are described in Turner &Miller (2009).
More studies, though not as detailed, include a larger number of AGNs and occultation events.The work of Markowitz et al. (2014) is based on long-term monitoring of approximately a dozenAGNs of both types. These objects were monitored continuously by the Rossi X-ray Timing Explorerand the total duration is of the order of 10 years. Given the known BH mass in these sources, one cancalculate the expected crossing time of dusty and dust-free blobs of certain properties at differentlocations. The results suggest that many of the clumps are indeed inside the sublimation radius,with properties consistent with those of BLR clouds. Other blobs are larger and move slower, withlocations consistent with being inside the dusty torus. In several of the cases the clump location,assuming Keplerian orbits, seems to be close to the maximum allowable dimension of such tori.Markowitz et al. (2014) also presented an analysis of the nonvariable X-ray-absorbing columnsand claimed they conflict with the predicted dimensions, column density, and number of clumpsin clumpy torus models. An additional study by Torricelli-Ciamponi et al. (2014) includes moresources but shorter-duration monitoring, sensitive to events that last a few days at most. It presentsnumerous events associated with changes to hardness ratio of the X-ray continuum, all consistentwith being caused by transiting blobs inside the BLR. The observations are not detailed enoughto allow a robust determination of the column density of the absorbers.
The X-ray observations beautifully illustrate the connection between dust-free and dustyclumps in one general region that contains the BLR closer to the central BH and the torusfarther away from the central BH. The earlier apparent disagreement between optical reddeningand X-ray column density disappears when accounting for the combination of inner dust-freeand outer dusty absorbers. The observations also help explain the nature of some of the largestobscuring columns found in AGNs.
4.3. Tilted Disks
Is an axisymmetric torus-like structure the only type of central obscurer that can explain the vari-ous aspects of AGN unification? Can other structures help resolve several known disagreementsbetween simple torus models and observations? An interesting scenario is based on the idea that acentral disk can replace the torus (Lawrence & Elvis 2010). This ad hoc phenomenological modelposits that the angular momentum of the external inflowing gas is initially misaligned with theaxis of the central accretion disk. The misalignment is kept down to small distances, of the order
www.annualreviews.org • AGN Unification 391
Ann
u. R
ev. A
stro
n. A
stro
phys
. 201
5.53
:365
-408
. Dow
nloa
ded
from
ww
w.a
nnua
lrev
iew
s.or
g A
cces
s pr
ovid
ed b
y U
nive
rsid
ade
de S
ao P
aulo
(U
SP)
on 0
6/21
/18.
For
per
sona
l use
onl
y.

AA53CH10-Netzer ARI 16 July 2015 12:38
of 1 pc, and the inflow takes the form of an inclined, large, dusty, geometrically thin disk, whichmay also be warped (see Caproni et al. 2006 for general mechanisms resulting in warped disks).The large disk presents a wide solid angle to the inner disk and part of the UV-optical radiation isabsorbed and reemitted in the IR. Lawrence & Elvis (2010) used this simple geometry to predictthe distribution of the covering factor, which was later studied by Roseboom et al. (2013), whoused WISE data of a large type-I sample. There seems to be reasonable agreement between themodel and observations, but the predicted distribution is similar to a normal distribution, whichis also expected in other scenarios.
The main virtue of the tilted disk scenario is the assumed misalignment between differentaccretion episodes onto the BH. Misalignment is expected in accretion events for which thefinal stage takes place in a region that is two to three orders of magnitude smaller than theregion where the flow originates. Unfortunately, the exact geometry is not consistent with realistichydrodynamic simulations, the location of the sublimation surface has not been calculated andcompared with RM results, and there is no comparison with IR interferometry, IR SED, andhigh-quality polarization measurements.
5. IONIZATION CONES
An axisymmetric central obscurer with a central opening results in an anisotropic two-sided con-ical shaped ionizing radiation pattern (bicone). Early observations (Pogge 1988, Tadhunter &Tsvetanov 1989, Mulchaey et al. 1996) identified bicones in a number of nearby systems and usedthem to deduce the torus inclination angles. Studies of the archetype source, NGC 1068, are themost detailed and the most detailed mapping utilized the strong [O III] λ5007 line (the [O III] bi-cone). More recent studies (like Fischer et al. 2013) include larger samples, more detailed imagingin the light of more emission lines, and additional kinematic information. The mapped emissionlines now include low-ionization species such as [O I], intermediate-ionization ions such as [O III]and [O IV], and very high-ionization ions such as [Si VI]. High-resolution images obtained by theChandra X-ray Observatory (Chandra) allow researchers to map such bicones in individual X-raylines such as [O VII].
The most detailed observations of today are based on HST imaging, HST long-slit spec-troscopy, and ground-based integral field unit (IFU) studies (e.g., Muller-Sanchez et al. 2011,Fischer et al. 2013, Riffel et al. 2013, and references therein). More than 50 sources have beenmapped in detail; of those, we have reliable kinematic information for more than 20. The high-est redshift is approximately 0.05. The observations are detailed enough to allow photoionizationmodeling of the gas in different parts of the NLR, including, in rare cases, following the metallicitygradient across the source (e.g., Dopita et al. 2014).
The ability to distinguish low- from high-ionization regions across a spatially resolved NLRprovides evidence for ionization outside the nominal [O III] bicone. Several well-studied casesprovide evidence that the ionizing radiation in the parts producing the strongest low-ionizationlines is filtered by clumpy, ionized absorbers located tens of parsecs or less from the nucleus,consistent with the torus dimension. HST imaging of NGC 4151 shows that the [O III] λ5007/[OII] λ3727 line ratio is lower near the edges of the bicone than at its axis (Kraemer et al. 2008).Such filtering was suspected in earlier works, but information about the location of the filteringmaterial was lacking (Alexander et al. 2000).
Line radiation from ionization cones can help to improve the estimate of the bolometricluminosity of type-II AGNs for which the nonstellar continuum is not directly observed. Inparticular, the [O III] λ5007 line is a good indicator of luminosity because the line is strong andnot affected much by stellar absorption (Heckman & Best 2014). Nevertheless, this method is
392 Netzer
Ann
u. R
ev. A
stro
n. A
stro
phys
. 201
5.53
:365
-408
. Dow
nloa
ded
from
ww
w.a
nnua
lrev
iew
s.or
g A
cces
s pr
ovid
ed b
y U
nive
rsid
ade
de S
ao P
aulo
(U
SP)
on 0
6/21
/18.
For
per
sona
l use
onl
y.

AA53CH10-Netzer ARI 16 July 2015 12:38
not without difficulties. The line is not a good indicator of luminosity in low-ionization AGNssuch as LINERs (Netzer 2009), and it is now known that the ratio L([O III] λ5007)/LAGN ischanging with LAGN (Stern & Laor 2012). Line reddening is an additional uncertainty. Reddeningby dust outside the NLR depends on the source geometry and torus inclination to the LOS and istherefore different for type-I and type-II sources (line attenuation by dust inside the NLR cloudsdoes not depend on these factors). Indeed, observations show that emission patterns are moreisotropic in some lines than in others, which leads researchers to suggest that [O IV] λ25.9 μmis the best indicator of luminosity because MIR reddening is much lower (Diamond-Stanic et al.2009, Weaver et al. 2010, Kraemer et al. 2011, Dicken et al. 2014). In fact, I([O III] λ5007)/I([OIV] λ25.9 μm) is typically lower by a factor of approximately 2 in type-II sources probably becauseof inclination-dependent reddening. Such a situation will occur naturally if the dust causing theextinction is just outside the [O III] bicone and the bicone axis is closer to the plane of the sky.
Soft X-ray mapping of several NLRs supplemented by Chandra and XMM-Newton high-resolution spectroscopy indicate X-ray line emission, mostly O VII 570 eV, that generally overlapswith the [O III] bicone (Ogle et al. 2000, Sako et al. 2000, Kinkhabwala et al. 2002, Bianchi et al.2006, Wang et al. 2011a). A spectacular example, showing X-ray emission up to approximately7 kpc, in Mrk 573, is given in Paggi et al. (2012). The LOS attenuation of X-ray lines depends onlyon column density and metallicity, not on the dust content of the gas. Therefore, observations ofX-ray lines provide an additional method to measure this column. Kraemer et al. (2011) analyzedthe O VII 570 eV/[O IV] λ25.9 μm line ratio in a sample of approximately 15 sources and claimedan attenuation of the X-ray line by a column density that is consistent with the derived amount ofreddening, assuming an ISM dust/gas ratio. Although not direct evidence, this is consistent withthe idea of a dusty ionized gas outside and farther away from the [O III] bicone. X-ray emission isalso detected in regions perpendicular to the optical bicone. This flux was interpreted as leakagethrough a clumpy, relatively low-column-density absorber, which may be the torus. Kreimeyer& Veilleux (2013) used optical line ratios to compare the flux emerging from the opening of thecone with the flux leaking through the torus. According to this work, the leakage amounts to30–50% of the radiation emitted by the central source. This fraction is high and confirmation inother sources is required.
The kinematic studies provide information about the motion of the line-emitting gas inside thecones (e.g., Muller-Sanchez et al. 2011, Fischer et al. 2014). Fischer et al. (2013) presented multi-slit observations of 17 AGNs, 12 of which are type-II AGNs, with clear signatures of biconicaloutflows. The velocity maps allow fits to simple kinematic models, which are detailed enough toinfer the inclination of the NLR to the LOS. In general, the angle of inclination is larger in type-IIAGNs, consistent with the view that these sources are seen edge-on. There is no correlation inthis small sample between the NLR inclination angle and the orientation of the disks of the hostgalaxy (see both supporting and contradicting results in sections above; this issue is not yet settled).
Kinematic modeling of ionization cones by Fischer et al. (2013) provides new invaluable infor-mation about ionization cones. They reveal a unique pattern of gas outflow v ∝ r out to a certainradius, approximately 630L1/2
46 pc, and slowing down to zero beyond this radius. The fitted modelsare good enough to constrain the bicone inclination to the LOS and, in some cases, its openingangle. Another interesting finding is a strong increase of X-ray column density with increasingangular distance from the bicone axis, regardless of whether the column is neutral (type-II AGNs)or ionized (type-I AGNs). For type-I sources, in which the X-ray-absorbing gas is highly ionized (awarm absorber), the study suggests a connection between the inner walls of the torus and the originof the X-ray ionized material. The study also suggests a correlation between MIR color and polarangle (see Section 3). For a handful of type-I sources, there is a hint for increasing FWHM(Hβ)with polar angle. If verified in larger samples, it would indicate a rotational component for the
www.annualreviews.org • AGN Unification 393
Ann
u. R
ev. A
stro
n. A
stro
phys
. 201
5.53
:365
-408
. Dow
nloa
ded
from
ww
w.a
nnua
lrev
iew
s.or
g A
cces
s pr
ovid
ed b
y U
nive
rsid
ade
de S
ao P
aulo
(U
SP)
on 0
6/21
/18.
For
per
sona
l use
onl
y.

AA53CH10-Netzer ARI 16 July 2015 12:38
Mrk 34 F502N
Mrk 34: 0'' offset
Mrk 34: 0'' offset
1''
N
E
NN
EE
1,000
Velo
city
(km
s–1
)Ve
loci
ty(k
m s
–1)
FWH
M(k
m s
–1)
Flux
500
0
–500
–1,000
1,000
1,500
500
0100
10–1
10–2
10–3
10–4
500
0
–500
–1,000
–1,000
–2 –1 0
Offset (arcsecs) NWSE
1 2
–2 –1 0
Offset (arcsec) NWSE
1 2
a b
d c
Figure 7Kinematic mapping of the type-II source Mrk 34 showing (a) slit positions, (b,c) velocity, flux, and FWHMof [O III] λ5007 in different positions, and (d ) the resulting bicone geometry. (b,c) The green and blue pointsrepresent data obtained with the G430L and G430M gratings, respectively. Reprinted from Fischer et al.(2013) with permission. Abbreviation: FWHM, full width at half maximum.
BLR gas. Unfortunately, the results cannot be applied to the entire population partly because onlyone in three sources had data good enough to be modeled in this way, and partly because in someof the sources the model is based on a single-slit observation. One good case is shown in Figure 7.
Muller-Sanchez et al. (2011) support some but not all the findings by Fischer et al. (2013).Their work provides imaging and kinematics of the coronal line region, the innermost part of theNLR where the strongest lines are of very high ionization, e.g., [Si VI] λ1.96 μm with ionizationpotential of 167 eV. In this region, the gas is probably dust-free. The study of seven sourcesshows complex dynamics of the gas, including a rotating disk and an outflow bicone. There areagreements and disagreements between the two studies. This is illustrated in the case of NGC3783, a well-known type-I source with a large column of LOS ionized gas and interferometricdata suggesting dusty polar outflow (see Section 3). Fischer et al. (2013) modeled this source usingHST imaging and a single-slit position. They found a small inclination of 15◦ to the LOS, as in atype-I AGN. The IFU measurements of Muller-Sanchez et al. (2011) resulted in a kinematic map
394 Netzer
Ann
u. R
ev. A
stro
n. A
stro
phys
. 201
5.53
:365
-408
. Dow
nloa
ded
from
ww
w.a
nnua
lrev
iew
s.or
g A
cces
s pr
ovid
ed b
y U
nive
rsid
ade
de S
ao P
aulo
(U
SP)
on 0
6/21
/18.
For
per
sona
l use
onl
y.

AA53CH10-Netzer ARI 16 July 2015 12:38
based on [Si VI] λ1.96 μm and other coronal lines in a region close to the base of the ionizationcone. They found a large inclination, close to edge-on view, with the cone opening cutting intothe plane of the host galaxy. If correct, then the broad emission lines are seen through the (leaky?)torus.
In conclusion, the study of ionization cones provides valuable information about the centralobscurer in AGNs. The detailed mapping in the light of numerous lines confirms the generalbicone shape and shows well-defined borders between ionized and neutral gas. It also revealsthe kinematics of the gas and the overall inclination to the LOS. The inferred models are moreconcrete and better justified experimentally than the rather vague information about the torusprovided by fitting NIR–MIR SEDs.
6. THE TORUS-GALAXY CONNECTION
General scenarios linking BH feeding and SF activity have been described in numerous papersand reviewed recently in this journal by Heckman & Best (2014). These scenarios concern globalgalaxy properties and apply to SF activity in the central kiloparsec and beyond. They do notaddress the more direct connection between the two types of activity much closer to the centralBH. What is known about the central 10–100 pc of nearby AGNs? What are the stellar population,the atomic and molecular gas content, and the SF activity in this region? Is there evidence for alarge central disk and is it connected to the torus?
Detailed observations of the central regions in nearby AGNs shed light on some of thesequestions. Adaptive optics–assisted observations, as in Davies et al. (2007), can probe regions10–30 pc in size. As of 2014, approximately 15 sources have been observed at this resolution.Esquej et al. (2014) used seeing-limited N-band spectroscopy in 29 sources and probed a regionapproximately 65 pc in size. The aim is to investigate SF near the nucleus using the 11.3 μm PAHemission feature. About 45% of the objects in the sample present this feature and stacking thespectra of the remaining sources suggests its presence in many other objects. Several other worksuse seeing-limited optical observations, with a typical spatial resolution of 100–300 pc (e.g., Riffelet al. 2010, 2011). Important questions regarding the conditions in a region slightly larger thanthe size of the torus, or the sphere of influence of the central BH, are related to the age of thestellar population and the SF rate (SFR). As explained below, there is no consensus on these issues.
Standard indicators of SF are PAH features, optical absorption features, and hydrogen re-combination lines. The recombination lines are the best direct indicators for ongoing SF (i.e., thepresence of O-type stars). According to Davies et al. (2007, 2014), the equivalent widths of the BRγ
lines in the 15 AGNs they studied practically rule out ongoing SF and indicate post SF populations.Esquej et al. (2014) claim to detect SF activity based on the detection of PAH emission features.This apparent contradiction can be understood by noting that PAH emission is not necessarilyrelated to the presence of O-type stars. In fact, there are indications that PAH emission is moresensitive to B-type stars than to O-type stars, i.e., to an environment that formed stars in the past100 Myr or so (Peeters et al. 2004, Dıaz-Santos et al. 2010). Moreover, the calibration of LPAH
versus LSF used by Esquej et al. (2014) to derive the SFR is based on work by Diamond-Stanic& Rieke (2012) and Rieke et al. (2009), who used templates of SF galaxies. This calibration usesSFRs and PAH luminosities obtained through large apertures that occasionally include the entiregalaxy, and is equivalent to integrating approximately 100 Myr of SF history.
Returning to AGNs, the observed PAH emission close to the center is consistent with the ideathat the presently observed BH accretion episode is a few Myr old and that BH accretion mighthave started after the lives of all the O-type stars ended. In fact, the onset of AGN activity mighthave terminated all SF in the immediate vicinity of the BH, which is usually categorized as AGN
www.annualreviews.org • AGN Unification 395
Ann
u. R
ev. A
stro
n. A
stro
phys
. 201
5.53
:365
-408
. Dow
nloa
ded
from
ww
w.a
nnua
lrev
iew
s.or
g A
cces
s pr
ovid
ed b
y U
nive
rsid
ade
de S
ao P
aulo
(U
SP)
on 0
6/21
/18.
For
per
sona
l use
onl
y.

AA53CH10-Netzer ARI 16 July 2015 12:38
feedback (Krips et al. 2011, Davies et al. 2012, Hailey-Dunsheath et al. 2012). Additional supportfor the post-SF environment, and occasionally an even older stellar population close to the centralBH, is obtained from other studies of the 100–300 pc central region (Riffel et al. 2010, 2011;Storchi-Bergmann et al. 2012; Schnorr-Muller et al. 2014).
Some observations have sufficient spatial and spectral resolution to derive the mass and age ofthe stars in the inner 50 pc. In the few cases for which this was done (e.g., Davies et al. 2007), thevelocity field is dominated by random motion typical of a spherical system and the stellar mass is ofthe order of 108 M�. This mass is an order of magnitude larger than the mass of the central BH inquestion. These observations set the stage for the stellar wind model of Schartmann et al. (2010)discussed in Section 2. The idea of BH feeding by stellar wind material has also been explored inconnection with LINERs (Heckman & Best 2014 and references therein). The argument in thiscase is not based on spatially resolved observations but rather on the extremely low LAGN/LEdd inLINERs. It is not at all clear whether the two independent scenarios have anything in common.
Studies of molecular gas in the vicinity of the torus do not yet have the required spatial resolutionto resolve the torus, or even its close surroundings, and hence are given low priority in this review.The upcoming Atacama Large Millimeter Array observations will no doubt change this situation(see Maiolino 2008 for a review). High concentrations of molecular gas on scales of approximately100 pc are seen in many AGNs with column densities large enough to confuse the picture of puretorus absorption. There are clear indications of outflows possibly associated with the direction ofthe bicone, but no indication of inflow. Some of these studies are detailed in Hicks et al. (2009),Combes et al. (2013), Aalto et al. (2015), and Garcıa-Burillo et al. (2014), in which references toolder observations can be found.
None of the above observations and theoretical considerations can be applied, by simple scaling,to higher-BH-mass, more luminous AGNs. First, present-day observations do not have the spatialresolution needed to investigate regions of this size in such objects. Second, feeding 108−9 M�BHs in high-ionization AGNs by stellar winds would require a much larger stellar cluster andmay involve different conditions. Direct mass inflow from the host likely plays the central rolein such cases. Finally, we note recent results from Merloni et al. (2014) that compared the BHaccretion rate and torus properties with total stellar mass and the SFR of the host galaxy. Theyindicate that the kiloparsec-scale stars and gas do not seem to have a direct causal connection withthe BH and its immediate vicinity. A similar lack of correlation at low redshifts is shown in Kosset al. (2011).
7. UNIFICATION OR EVOLUTION?
7.1. Luminosity and Redshift Dependencies
As explained above, two categories of methods are used to estimate fC . The first category includesall methods for measuring the covering factor of individual objects (see Section 3): the Ldust/LAGN
method, the EW(Kα) method, and the method based on the scattered X-ray continuum. TheLdust/LAGN method results in the largest number of measured fC . The second category includesmethods that apply to the mean covering factor of the population. This is obtained by classifyinga source as either a type-I or a type-II AGN and using the resulting Ntype-II,L/Ntype-I,L ratio as anestimate of the mean value of fC . One such method measures the X-ray-absorbing column anddetermines the AGN type relative to a fiducial absorbing column that separates the groups (e.g.,Ueda et al. 2003, Gilli et al. 2007, Hasinger 2008, Brightman & Ueda 2012, Malizia et al. 2012).Another method counts the number of broad- and narrow-emission-line AGNs in optical andIR-selected samples. Ideally, all methods should agree but this is not the case (e.g., Lawrence &
396 Netzer
Ann
u. R
ev. A
stro
n. A
stro
phys
. 201
5.53
:365
-408
. Dow
nloa
ded
from
ww
w.a
nnua
lrev
iew
s.or
g A
cces
s pr
ovid
ed b
y U
nive
rsid
ade
de S
ao P
aulo
(U
SP)
on 0
6/21
/18.
For
per
sona
l use
onl
y.

AA53CH10-Netzer ARI 16 July 2015 12:38
Elvis 2010; Lusso et al. 2013, 2014; Mayo & Lawrence 2013). Mixed results are due to poorlyunderstood physics of the torus, various selection effects, uncertainties in estimating LAGN, andintrinsic reddening, among others. For example, the Ldust/LAGN method is based on dust emissionfrom the torus and has little to do with BLR properties. However, X-ray absorption by gas in theBLR can increase the total measured X-ray column, thus decreasing Ldust because the ionizingradiation absorbed by the dust-free gas never interacts with the dusty torus. Here I focus on thelarge-sample approach, in particular on X-ray based studies.
The hard X-ray (E > 2 keV) spectrum of most AGNs can be described by a simple power law,N ph ∝ E−� , where Nph is the number of emitted photons per unit energy and time. A remarkablefeature is the small scatter in the power-law slope, �2−10 keV = 1.8 ± 0.2. This allows us to estimatethe obscuring column density even in poor X-ray observations, provided we are looking througha single absorber. All that is required is a measure of the hardness ratio, e.g., F(0.5–2 keV)/F(2–10 keV), and the redshift. The resulting accuracy in the measurement of the column is quiteremarkable (∼0.3 dex), with even higher accuracy in some cases of high photon flux that allowbetter modeling of the intrinsic continuum. The hydrogen column densities derived in this wayrange from thin (approximately 1021 cm−2) to Compton thick (>1.25 × 1024 cm−2). Some of theresults obtained thus far are hampered by selection effects. In particular, type-II sources are morelikely to drop below the flux limit of the samples because of the increased absorption. This drop isless noticeable, but still present, in samples selected by their high energy flux (Malizia et al. 2012).The hardness ratio method can fail, sometimes dramatically, if the absorption is due to two ormore LOS components, such as a combination of BLR clouds and a dusty torus gas (Section 4.2).
Merloni et al. (2014) provide a detailed study of X-ray obscuration. Their work is based onobservations of the 2◦ XMM-COSMOS field and includes 1,310 sources of all types selected onthe basis of their absorption-corrected 2–10 keV luminosity in the redshift range of 0.3–3.5. Therest-frame 2–10 keV flux limit is 2 × 10⁻¹⁵ erg s−1 cm−2. The study supersedes earlier work ofthis type (e.g., Ueda et al. 2003, Gilli et al. 2007, Hasinger 2008, Malizia et al. 2012) that useddata from other fields and instruments. It supplements a comprehensive study of type-I sourcesin the same field by Lusso et al. (2013). The spectral properties of the sources are described inBrusa et al. (2010) and Mainieri et al. (2011). The complete redshift information is based onspectroscopy and photometry and is of crucial importance because it allows researchers to use asimple K-correction and thus circumvent the well-known bias of flux-limited samples that tend topick up more obscured sources at higher redshifts. A potential complication is a large number ofCompton-thick sources that are unaccounted for. The number of these sources is still uncertainand depends on the survey, energy range used, and the spectroscopic analysis. It is generallyestimated to be approximately 20% at low redshifts (Burlon et al. 2011) and approximately 40%at high redshifts (e.g., Brightman & Ueda 2012). In the COSMOS sample, which is not verydeep, the numbers are smaller. There are also issues regarding the best way to correct the X-rayluminosity for absorption, in particular the simplistic way based only on hardness ratio with itswell-known limitations.
An independent method that verifies the estimated numbers of obscured and unobscured AGNsis based on modeling the spectrum of the cosmic X-ray background (e.g., Comastri et al. 1995,Ueda et al. 2003). I do not go into the details of this method, which was reviewed and discussedin numerous papers (e.g., Gilli et al. 2007).
Can type-I and type-II sources classified by their optical properties be distinguished, unambigu-ously, by their X-ray-obscuring column? The answer is definitely no, although type-II sourcesare on average more obscured. Merloni et al. (2014) introduced a dividing column density ofN H � 1021.5 cm−2 to separate the two types. They found that approximately 30% of opticallyclassified type-I sources have obscuring columns larger than this value and that approximately
www.annualreviews.org • AGN Unification 397
Ann
u. R
ev. A
stro
n. A
stro
phys
. 201
5.53
:365
-408
. Dow
nloa
ded
from
ww
w.a
nnua
lrev
iew
s.or
g A
cces
s pr
ovid
ed b
y U
nive
rsid
ade
de S
ao P
aulo
(U
SP)
on 0
6/21
/18.
For
per
sona
l use
onl
y.

AA53CH10-Netzer ARI 16 July 2015 12:38
30% of optically classified type-II sources have obscuring columns smaller than this value. In fact,many, perhaps most, of the objects in these two groups may have little to do with obscuration bythe torus. The sources in the latter group are the real type-II AGNs discussed above, and at leastsome of the objects in the first group are type-I AGNs with an X-ray source occulted by gas inthe BLR or outflowing ionized gas in the opening of the torus. These two subgroups were notfully appreciated by the old unification scheme but are now known to influence the Ntype-I/Ntype-II
statistics.Many of the real type-II AGNs in the local Universe are of very low luminosity and LAGN/LEdd
(Brightman & Nandra 2011b, Marinucci et al. 2012). Type-II AGNs in the XMM-COSMOSsample, at a redshift of approximately 0.3, are more luminous and can be considered intermediate-luminosity AGNs. An important clue to the nature of these sources is the presence or absence of acentral obscurer. This can be tested by examining the L(MIR)/L(2–10 keV) relationship discussedin Section 3. The real type-II objects in the Merloni et al. (2014) sample do not differ from othertype-II AGNs in this respect. There is also direct evidence from Spitzer spectroscopy that theMIR SEDs of these sources are similar (but not identical) to the SEDs of type-II sources showinghidden broad emission lines (Tommasin et al. 2010). Many real type-II AGNs do not have enoughhigh-density gas to result in a detectable BLR, but have central tori. This raises an interestingquestion about the relationship between the central source luminosity, the inner dimension ofthe torus, and the presence or absence of broad-emission-line gas. This question is discussed inSection 7.2.
Returning to the type-I sources with X-ray absorption, we note that for a Galactic dust-to-gasratio, the above dividing column corresponds to AV ∼ 1.7 mag. If the obscurer is part of the dustytorus, then the intrinsic optical-UV spectrum of 30% of all type-I objects is expected to be heavilyreddened. This is definitely not the case. As noted above, the obscuring gas may be part of theBLR, in which case it is dust-free. Alternatively, the absorbing gas is highly ionized, outflowingdust-free material (warm absorber, which is common in AGNs) (Turner & Miller 2009). Thelocation of this gas may be well outside the BLR, including in the opening of the torus.
Figure 8 shows the fraction of obscured AGNs defined as a function of L(2–10 keV) bytwo different methods. Optical classification of AGNs shows a steep decrease in the fraction ofobscured AGNs as a function of source luminosity, and X-ray classification shows a flat and weakerdependence on luminosity. Clearly, the large number of real type-II AGNs at low luminosity isthe main reason for the difference between the two methods. This finding suggests a new, perhapsmore intuitive definition of AGN types based only on the presence or absence of a central LOSobscurer. According to this classification, real type-II AGNs belong in the class of type-I AGNs(unobscured AGNs). In this case, the relative fraction of the two groups up to a redshift of about1.5 is approximately 1:1 according to both the X-ray and optical methods.
The sample by Merloni et al. (2014) does not include low-redshift, very low-luminosity AGNs.A few notes about this end of the distribution are in order. First, the IR-selected sample ofBrightman & Nandra (2011b) shows that the ratio Ntype-II/Ntype-I peaks at approximately L(2–10 keV) ∼ 1042 erg s−1 and drops to lower values below this luminosity. Second, the discrepanciesillustrated in Figure 8, including those that are based on the measurements of individual coveringfactors (which are, occasionally, in poor agreement among themselves), are present in various otherstudies. A major discrepancy is, again, the confusion between host galaxy and torus obscuration,which is related to the large group of type-Ii sources.
What is the redshift evolution of obscured and unobscured AGNs? Observationally, this ischallenging because of the small number of observed sources at high redshifts. Earlier works suchas Hasinger (2008) claim the fraction of obscured sources increases with increasing redshift. Thisclaim was questioned by Gilli et al. (2010) on grounds of a lack of an adequate K-correction.
398 Netzer
Ann
u. R
ev. A
stro
n. A
stro
phys
. 201
5.53
:365
-408
. Dow
nloa
ded
from
ww
w.a
nnua
lrev
iew
s.or
g A
cces
s pr
ovid
ed b
y U
nive
rsid
ade
de S
ao P
aulo
(U
SP)
on 0
6/21
/18.
For
per
sona
l use
onl
y.

AA53CH10-Netzer ARI 16 July 2015 12:38
20
40
60
80
100
043.0 43.5 44.0
log LX (erg s–1)44.5 45.0
Obs
cure
d A
GN
frac
tion
(%)
Optical classification X-ray classification
43.0 43.5
0.3 < z < 0.80.8 < z < 1.11.1 < z < 1.51.5 < z < 2.12.1 < z < 3.5
44.0
log LX (erg s–1)44.5 45.0
a b
Figure 8The fraction of obscured and unobscured AGNs at various redshifts and L(2–10 keV). (a) Fractions obtainedby optical classification. (b) Fractions obtained by a classification based on column densities derived fromX-ray observations with a dividing column between the groups of 1021.5 cm−2. Based on data from Merloniet al. (2014), courtesy of A. Merloni.
The study by Merloni et al. (2014), which is perhaps the most complete (a statement likely to bechallenged by some X-ray astronomers), regarding low- and intermediate-luminosity sources isinconclusive. The results for the highest-luminosity AGNs are more significant, with indicationsfor an increase in the fraction of obscured sources, with redshift amounting to a factor of approx-imately 2 between redshifts of 1 and 3. This finding is supported by several studies of AGNs inthe Chandra Deep Field South (Brightman & Ueda 2012, Vito et al. 2013).
7.2. Receding and Approaching Tori and Disappearing BLRs
There have been several attempts to explain the dependence of the covering factor on sourceluminosity on the basis of the torus geometry. The idea of a receding torus, first suggested byLawrence (1991), involves a simple torus whose height, h, is independent of the inner radius Rin.Because Rin ∝ L1/2
AGN, the covering factor is predicted to be proportional to L−1/2AGN. This ad hoc
model makes no attempt to justify the constant height torus. It also does not explain the decreasingcovering factors deduced from counting X-ray AGNs with different obscuring columns.
Extensive studies based on large samples of AGNs, some of which have already been men-tioned, have tested the idea of a receding torus. None of these studies reproduced, accurately,the predicted dependence of fC on LAGN. There were several suggestions to modify the origi-nal idea. For example, Simpson (2005) measured the fraction of type-I sources by using [O III]λ5007 luminosities in SDSS AGNs and constructing luminosity functions for the two types ofAGNs. The author explained that the differences between the two luminosity functions were dueto changes in the covering factor of the torus with luminosity and were claimed to be removed ifh ∝ L0.23
AGN. Unfortunately, the work does not account for the conversion between L([O III] λ5007)and LAGN, which is luminosity dependent (Stern & Laor 2012), a fact that was not known at thetime. Ricci et al. (2013) used the observed EW(Kα) to suggest a somewhat different dependence.
www.annualreviews.org • AGN Unification 399
Ann
u. R
ev. A
stro
n. A
stro
phys
. 201
5.53
:365
-408
. Dow
nloa
ded
from
ww
w.a
nnua
lrev
iew
s.or
g A
cces
s pr
ovid
ed b
y U
nive
rsid
ade
de S
ao P
aulo
(U
SP)
on 0
6/21
/18.
For
per
sona
l use
onl
y.
AA53CH10-Netzer ARI 16 July 2015 12:38
These and other attempts are highly simplified and should not be viewed as more than simpleanalytic functions fitted to the observations. The increased inner radius with luminosity is indeeda solid and confirmed prediction of all torus models. However, other parameters, such as fC andh, are not well defined and there is no simple theoretical reason to prefer a certain geometry overothers. Finally, there are many observations showing that Ldust/LAGN is similar in very luminousAGNs and in sources that are 3–4 orders of magnitude less luminous. Such a luminosity differencecorresponds to a factor ∼100 in the distance between the torus inner walls and the BH, yet thetorus geometry does not seem to be affected by much.
Researchers have used the idea of a luminosity-dependent sublimation radius to argue thatbelow a certain LAGN, the torus is likely to change its properties, even disappear. This idea deservesthe name approaching tori. Several of its aspects were described in Laor (2003), Elitzur & Shlosman(2006), and Elitzur & Ho (2009). Laor (2003) suggested the sublimation radius as the outerboundary of the BLR be combined with the observed relationship between BH mass and LAGN.This gives an estimate of the minimal broad-line velocity (taken here as the full width at halfmaximum, FWHM, of the broad Hβ line), which is the Keplerian velocity at Rin. Using currentRM results one finds
FWHM(H β ) � 1,700M 1/28 L−1/4
46 km s−1, (7)
where, again, L46 = LAGN/1046 erg s−1 and M 8 = M B H /108 M�. For M 8 = 1 and L46 < 10−4,FWHM(Hβ) > 17,000 km s−1, a line width that is practically undetectable in low-luminosityAGNs whose continuum near the Hβ line is dominated by stellar light. Additional considerationsshow that the line width may be related to LAGN/LEdd rather than LAGN. Laor (2003) furtherspeculated that there is a natural limit to the maximum allowable velocity in the BLR and thatclouds in this region close to the BH not only become undetectable but may not survive. Low-luminosity objects that appear to have only narrow high-ionization lines will be classified as realtype-II AGNs and objects with low-ionization lines will be classified as type-II LINERs. Thisclassification results in the increasing fraction of (apparent) type-II AGNs at low luminosities.The argument does not affect the covering factor of the torus. It applies mostly to extremelylow-luminosity AGNs in the local Universe but not to the real type-II AGNs in the Merloni et al.(2014) sample where LAGN > 1043 erg s−1.
Disappearing BLRs have been discussed by Nicastro (2000), who suggested that gas outflowfrom the surface of the disk, outside the region dominated by radiation pressure, can lead todisappearing BLRs at very low LAGN/LEdd. Elitzur & Ho (2009) followed the ideas developedin Elitzur & Shlosman (2006) and considered the clumpy dust-free BLR and the clumpy dustytorus as one entity made of clouds lifted along magnetic field lines from the surface of the disk. Alimiting radial column density of approximately 1022 cm−2 was assumed to be a requirement forproducing observable broad emission lines from the clumps. The work shows that at a low massaccretion rate, corresponding to LAGN ∼ 1040, BLR clouds and large dusty clumps no longer exist.This luminosity, which varies with the BH mass and the corresponding LAGN/LEdd, is in the rightballpark for many LINERs but is several orders of magnitude smaller than the typical luminosityof many real type-II AGNs (Brightman & Nandra 2011b, Marinucci et al. 2012, Merloni et al.2014). Despite the discrepancy, the general idea can perhaps be extended to include more luminoussources with no detectable broad emission lines.
7.3. Mergers, Evolution, and Unification
Detailed morphological studies reveal that about 80% of host galaxies of AGNs, up to a redshiftof approximately 2, do not show signs of interaction (e.g., Cisternas et al. 2011, Schawinski et al.
400 Netzer
Ann
u. R
ev. A
stro
n. A
stro
phys
. 201
5.53
:365
-408
. Dow
nloa
ded
from
ww
w.a
nnua
lrev
iew
s.or
g A
cces
s pr
ovid
ed b
y U
nive
rsid
ade
de S
ao P
aulo
(U
SP)
on 0
6/21
/18.
For
per
sona
l use
onl
y.

AA53CH10-Netzer ARI 16 July 2015 12:38
2012). Such studies depend on the signal-to-noise ratio, spatial resolution, and most importantlyredshift. They should be interpreted as strong evidence against major mergers and perhaps asweak evidence for the final stages of a minor merger where the mass ratio of the two hosts islarge. The finding, which contradicts earlier claims about the association of most AGN activitywith galaxy mergers, is evidence for the importance of secular processes in transporting cold gasfrom the disk to the vicinity of the BH. These studies show also that a large fraction of the mostluminous AGNs at high redshifts are associated with mergers. Indeed, merger-induced nuclearactivity is likely to be more common at high redshifts, when the density of the Universe was higherand much of the cold gas was not yet converted to stars. Can simple unification based on relativelysimple shaped tori, and well-ordered motion of cold gas, be applied to the complex geometry ofsuch mergers? How early in the history of a merger-triggered AGN can such an ordered centralstructure form? Can merger-driven AGNs be classified like the secularly evolving systems if theirBLR is obscured by galactic scale dust (e.g., Imanishi et al. 2010)? What are the implications tothe NIR–MIR SEDs of such systems?
Major mergers of gas-rich systems in the early Universe have been suggested to result inpowerful dusty SF systems (dust-obscured galaxies, DOGs) surrounding a buried AGN whosepower increases with time (see Narayanan et al. 2010 and references therein). As the power of theAGN increases, the surrounding gas is blown away and an unobscured AGN is revealed. The mostluminous AGNs during the era of peak AGN activity, at z = 2–3 AGNs, have been suggestedto be this type of object. In this case the geometry of the obscuring dust must be different fromthe geometry of simple tori assumed in nonmerging galaxies. Unfortunately, numerical mergersimulations do not yet have sufficient resolution to model the geometry of such structures andhigh-resolution imaging is limited to nearby systems (see, however, Schawinski et al. 2012). Thus,SED observations and model fitting are the best tools to investigate these scenarios, particularlyin objects for which both optical and IR information are available (e.g., SDSS and WISE; seeWeedman et al. 2012, Vardanyan et al. 2014).
An empirical way to study such scenarios is to examine objects with very large Ldust/LAGN ratiosand check whether this is caused by UV luminosity, which is unusually low (UV extinction in aDOG), or MIR luminosity, which is unusually high (large covering factor and a clear LOS to thecenter). Vardanyan et al. (2014) suggest that the latter is correct and show that the objects withthe smallest Ldust/LAGN ratio are those with the largest L(UV). Such studies show no evidence ofthe DOG-related scenario for z = 2–3 AGNs [see, however, Glikman et al. (2012) for evidenceto the contrary].
There are more detailed studies of merging systems at low and intermediate redshifts, especiallyultraluminous infrared galaxies (ULIRGs) hosting active BHs. A low-redshift sample of this type isthe QUEST (Quasar/ULIRG Evolutionary Study) sample (see Veilleux et al. 2006, 2009a,b, andreferences therein). Some of the sources in the QUEST sample contain low-luminosity AGNs,including LINERs, and are clearly SF-dominated systems. Other sources contain high-luminosityAGNs, mostly Palomar-Green quasars. HST imaging of QUEST sources indicate that AGN typedepends on the evolutionary stage of the host, and the BH activity is triggered most likely by themerger. In particular, there is evidence that a merger progresses from type-II at the earlier stagesto type-I near its final stage. Type-I AGNs become more common among fully coalesced mergerremnants with ellipse-like hosts (Veilleux et al. 2006). They also become more common withincreasing Ldust. This may or may not be related to the general trend of decreasing obscurationwith increasing L(2–10 keV) discussed for nonmerging systems. Many of the QUEST sourceshave been observed, spectroscopically, by Spitzer. Comparisons of QUEST sources with sourcesthat show no indication of mergers (Mor et al. 2009, Mor & Netzer 2012) show similar SEDs anda similar trend of decreasing covering factor with increasing LAGN.
www.annualreviews.org • AGN Unification 401
Ann
u. R
ev. A
stro
n. A
stro
phys
. 201
5.53
:365
-408
. Dow
nloa
ded
from
ww
w.a
nnua
lrev
iew
s.or
g A
cces
s pr
ovid
ed b
y U
nive
rsid
ade
de S
ao P
aulo
(U
SP)
on 0
6/21
/18.
For
per
sona
l use
onl
y.

AA53CH10-Netzer ARI 16 July 2015 12:38
Can major mergers at high redshifts produce galactic scale obscuration that results in torus-likeSED and absorption? Can heating by the AGN result in cold (30–50 K) dust emission that mimicsSF regions? There are no clear observational answers to these questions, but recent calculationsby Schneider et al. (2014) give some clues.
A complex geometry that can give rise to both MIR and FIR (far-infrared) emission is a toruswithin a torus or an obscurer within an obscurer. In this scenario, a large-covering-factor obscurer,just outside the dust sublimation radius, results in intense NIR–MIR emission. This obscurer isclumpy and has a simple axisymmetric geometry. Part of the AGN radiation escapes through itsionization cones and part of it leaks through the clumps. A much larger obscurer, with an undefinedgeometry that does not block the central dust-free cone, is present at a distance of a few kiloparsecs.The covering factor of the inner obscurer is fC (in) and the covering factor of the outer obscurer fC
(out). It is easy to think of several scenarios that result in different relative L(FIR)/L(MIR)/LAGN
ratios, depending on how much radiation from the central source leaks through the small obscurernear the center. Some of the NIR–MIR radiation of the central obscurer might be absorbed bythe farther dust if its optical depth is large enough. A certain variant of this complex geometry wasmodeled by Schneider et al. (2014), who found that such a geometry, with fC (in) in the range of0.5–0.7, gives a reasonable fit to the observed SED of a specific z = 6.4 AGNs. In that particularmodel, approximately half of the FIR luminosity is AGN related and half is SF related.
An obvious observational test would be to obtain polarimetry maps of such systems, since thisis a most effective way to check whether the distribution of the position angles is centrosymmetric(i.e., scattering from a central point) (see Kishimoto 1999).
In summary, it is hard to imagine that major mergers, especially in the early Universe, can leadto the highly ordered geometry, and the torus-like structure, suggested to explain the observationsof lower-luminosity, secularly evolving systems. Detailed SED studies of high-redshift mergerscan help resolve this issue.
SUMMARY: PRESENT AND FUTURE UNIFICATION
The unification scheme presented in this review is different from and similar to the schemepresented in the late 1980s, which had three fundamental pillars: orientation, covering factor, andluminosity. The field is driven by courageous attempts to construct simple models for complexsituations, and attempts to understand several selection effects typical of large samples. The mostimportant developments of the last decade or so are summarized as follows.
1. Most AGN tori are probably axisymmetric and clumpy. Unfortunately, today’s phenomeno-logical clumpy torus models leave much to be desired and their parameters are hard to con-strain. Hydrodynamic calculations that follow the inflow of gas from the galaxy are morepromising. AGN tori naturally produce a clumpy thick central structure and demonstratethe importance of SN explosions and radiation pressure feedback by the central AGN. Thesimulations do not yet include all relevant processes and are generally limited to AGNs withsmall BHs.
2. Disk wind models of different types seem to explain several fundamental properties of thecentral obscurer, such as the formation of dust-free and dusty clumps at roughly the desiredlocations. So far, there is no clear preference for magnetic or radiation-pressure-drivenwinds, and for all models, forming and maintaining large-column-density clumps remainsproblematic.
3. The central issues of the covering factor and anisotropy of the torus are not yet fullyunderstood. The general trend of decreasing fC with increasing LAGN is seen in some butnot all studies and its details are not well understood. There are substantial disagreements
402 Netzer
Ann
u. R
ev. A
stro
n. A
stro
phys
. 201
5.53
:365
-408
. Dow
nloa
ded
from
ww
w.a
nnua
lrev
iew
s.or
g A
cces
s pr
ovid
ed b
y U
nive
rsid
ade
de S
ao P
aulo
(U
SP)
on 0
6/21
/18.
For
per
sona
l use
onl
y.
AA53CH10-Netzer ARI 16 July 2015 12:38
between the various methods used to study this relationship, such as the methods based onthe Ldust/LAGN ratio, on EW(Kα), or on dividing the population into groups on the basis ofX-ray-absorbing columns. The suggestion of a receding torus is the only theoretical ideadriving this field. However, the idea is neither physically sound nor well understood.
4. The mapping of central ionization cones and IR interferometry have led to major develop-ments in this field. Bicone observations provide the most reliable way to define the torusboundaries and link the emission-line properties to the kinematic properties of the NLRgas. Long-baseline interferometry is the wave of the future. It has already provided globalintriguing results, such as an unexpected run of dust temperature, with radius and modelimages that indicate deviations from a simple torus-shaped obscurer. The IR interferom-etry also stresses the need to reconsider the role of MIR-emitting polar outflows. Phaseinformation in the future will likely provide real images of central AGN tori.
5. Part of the confusion in the present unification scheme results from the presence of severalsubgroups that may not belong in it in the first place. In particular, real type-II AGNs,which are not really understood, confuse several issues such as the fraction of obscured andunobscured low-luminosity AGNs. Another group that shows an assortment of propertiesis type-Ii AGNs. Some type-Ii AGNs are heavily extinguished by dust in the host galaxy;others are type-I AGNs caught during a time of minimum AGN activity.
6. Unification does not seem to stand the test of BH evolution. In particular, merging systemslikely behave in a way different from that of AGNs in secularly evolving hosts. On the basisof today’s observations, there is no reason to believe that accreting BHs in major mergers,or merger remnants, partake in the simple, old unification scheme.
Returning to the central theme of unification, it is clear that the old scheme requires severalmajor revisions. More important revisions include the recognition that there is a large range ofcovering factors for a given luminosity, the realization that X-ray absorption can be caused bytwo or possibly more components, and the identification of several subgroups of AGNs that donot belong in this scheme in the first place. A revised scheme would require better methods toisolate and remove cases in which obscuration has nothing to do with the nucleus, and improvedX-ray techniques to clarify the importance of X-ray absorption by dust-free gas. Perhaps the mostcrucial aspect, which is observationally challenging, is the separation of torus absorption from thepresence of broad emission lines. Putting the absorption of the nonstellar continuum in the centerof the scheme and minimizing the use of broad emission lines as a major characteristics are goodways to proceed.
DISCLOSURE STATEMENT
The author is not aware of any affiliations, memberships, funding, or financial holdings that mightbe perceived as affecting the objectivity of this review.
ACKNOWLEDGMENTS
This review benefitted from comments and suggestions by colleagues and friends who shared withme their broad knowledge and deep understanding of this field. Special thanks go to Ski Antonucci,Murray Brightman, Leonard Burtscher, Mike Crenshaw, Ric Davies, Michael Dopita, MosheElitzur, Martin Elvis, Jacopo Fritz, Josefa Masegosa Gallego, Sebastian Honig, Steven Kraemer,Ari Laor, Andy Lawrence, Dieter Lutz, Vincenzo Mainieri, Roberto Maiolino, Andrea Merloni,Richard Mushotzky, Cristina Ramos-Almeida, Guido Risaliti, David Rosario, Mara Salvato, Marc
www.annualreviews.org • AGN Unification 403
Ann
u. R
ev. A
stro
n. A
stro
phys
. 201
5.53
:365
-408
. Dow
nloa
ded
from
ww
w.a
nnua
lrev
iew
s.or
g A
cces
s pr
ovid
ed b
y U
nive
rsid
ade
de S
ao P
aulo
(U
SP)
on 0
6/21
/18.
For
per
sona
l use
onl
y.

AA53CH10-Netzer ARI 16 July 2015 12:38
Schartmann, Allan Schnorr Muller, Marko Stalevski, Clive Tadhunter, Konrad Tristram, JaneTurner, Sylvain Veilleux, Keiichi Wada, and Belinda Wilkes.
LITERATURE CITED
Aalto S, Garcia-Burillo S, Muller S, et al. 2015. Astron. Astrophys. 574:A85Alexander T, Lutz D, Sturm E, et al. 2000. Ap. J. 536:710–17Alig C, Schartmann M, Burkert A, Dolag K. 2013. Ap. J. 771:119Alonso-Herrero A, Ramos Almeida C, Mason R, et al. 2011. Ap. J. 736:82Antonucci R. 1993. Annu. Rev. Astron. Astrophys. 31:473–521Antonucci RRJ, Miller JS. 1985. Ap. J. 297:621–32Asmus D, Gandhi P, Smette A, Honig SF, Duschl WJ. 2011. Astron. Astrophys. 536:A36Assef RJ, Stern D, Kochanek CS, et al. 2013. Ap. J. 772:26Baldwin JA, Phillips MM, Terlevich R. 1981. Publ. Astron. Soc. Pac. 93:5–19Barvainis R. 1987. Ap. J. 320:537Beckert T, Duschl WJ. 2004. Astron. Astrophys. 426:445–54Bentz MC, Denney KD, Grier CJ, et al. 2013. Ap. J. 767:149Bianchi S, Bonilla NF, Guainazzi M, Matt G, Ponti G. 2009. Astron. Astrophys. 501:915Bianchi S, Guainazzi M, Chiaberge M. 2006. Astron. Astrophys. 448:499–511Blandford RD, Netzer H, Woltjer L, Courvoisier TJL, Mayor M, eds. 1990. Active Galactic Nuclei. Heidelberg,
Ger.: Springer-VerlagBock JJ, Neugebauer G, Matthews K, et al. 2000. Astron. J. 120:2904–19Bottorff MC, Korista KT, Shlosman I. 2000. Ap. J. 537:134–51Brightman M, Nandra K. 2011a. MNRAS 413:1206–35Brightman M, Nandra K. 2011b. MNRAS 414:3084–104Brightman M, Ueda Y. 2012. MNRAS 423:702–17Brusa M, Civano F, Comastri A, et al. 2010. Ap. J. 716:348–69Buchanan CL, Gallimore JF, O’Dea CP, et al. 2006. Astron. J. 132:401–19Burlon D, Ajello M, Greiner J, et al. 2011. Ap. J. 728:58Burtscher L, Meisenheimer K, Tristram KRW, et al. 2013. Astron. Astrophys. 558:A149Caproni A, Livio M, Abraham Z, Mosquera Cuesta HJ. 2006. Ap. J. 653:112–26Chaudhary P, Brusa M, Hasinger G, Merloni A, Comastri A. 2010. Astron. Astrophys. 518:A58Cid Fernandes R, Stasinska G, Mateus A, Vale Asari N. 2011. MNRAS 413:1687–99Cisternas M, Jahnke K, Bongiorno A, et al. 2011. Ap. J. Lett. 741:L11Collin S, Zahn JP. 1999. Astron. Astrophys. 344:433–49Collin S, Zahn JP. 2008. Astron. Astrophys. 477:419–35Comastri A, Setti G, Zamorani G, Hasinger G. 1995. Astron. Astrophys. 296:1Combes F, Garcıa-Burillo S, Casasola V, et al. 2013. Astron. Astrophys. 558:A124Czerny B, Hryniewicz K. 2011. Astron. Astrophys. 525:L8Davies R, Mark D, Sternberg A. 2012. Astron. Astrophys. 537:A133Davies RI, Maciejewski W, Hicks EKS, et al. 2014. Ap. J. 792:101Davies RI, Muller-Sanchez F, Genzel R, et al. 2007. Ap. J. 671:1388–412Deo RP, Crenshaw DM, Kraemer SB, et al. 2007. Ap. J. 671:124–35Deo RP, Richards GT, Crenshaw DM, Kraemer SB. 2009. Ap. J. 705:14–31Diamond-Stanic AM, Rieke GH. 2012. Ap. J. 746:168Diamond-Stanic AM, Rieke GH, Rigby JR. 2009. Ap. J. 698:623–31Dıaz-Santos T, Alonso-Herrero A, Colina L, et al. 2010. Ap. J. 711:328–49Dicken D, Tadhunter C, Morganti R, et al. 2014. Ap. J. 788:98Dopita MA, Scharwachter J, Shastri P, et al. 2014. Astron. Astrophys. 566:A41Dullemond CP, van Bemmel IM. 2005. Astron. Astrophys. 436:47–56Duschl WJ, Britsch M. 2006. Ap. J. Lett. 653:L89–92Efstathiou A, Rowan-Robinson M. 1995. MNRAS 273:649–61
404 Netzer
Ann
u. R
ev. A
stro
n. A
stro
phys
. 201
5.53
:365
-408
. Dow
nloa
ded
from
ww
w.a
nnua
lrev
iew
s.or
g A
cces
s pr
ovid
ed b
y U
nive
rsid
ade
de S
ao P
aulo
(U
SP)
on 0
6/21
/18.
For
per
sona
l use
onl
y.
AA53CH10-Netzer ARI 16 July 2015 12:38
Elitzur M. 2012. Ap. J. Lett. 747:L33Elitzur M, Ho LC. 2009. Ap. J. Lett. 701:L91–94Elitzur M, Shlosman I. 2006. Ap. J. Lett. 648:L101–4Elvis M. 2012. J. Phys. Conf. Ser. 372:012032Emmering RT, Blandford RD, Shlosman I. 1992. Ap. J. 385:460–77Esquej P, Alonso-Herrero A, Gonzalez-Martın O, et al. 2014. Ap. J. 780:86Feltre A, Hatziminaoglou E, Fritz J, Franceschini A. 2012. MNRAS 426:120–27Fischer TC, Crenshaw DM, Kraemer SB, Schmitt HR. 2013. Ap. J. Suppl. 209:1Fischer TC, Crenshaw DM, Kraemer SB, Schmitt HR, Turner TJ. 2014. Ap. J. 785:25Fritz J, Franceschini A, Hatziminaoglou E. 2006. MNRAS 366:767–86Gandhi P, Horst H, Smette A, et al. 2009. Astron. Astrophys. 502:457Garcıa-Burillo S, Combes F, Usero A, et al. 2014. Astron. Astrophys. 567:A125Gilli R, Comastri A, Hasinger G. 2007. Astron. Astrophys. 463:79–96Gilli R, Comastri A, Vignali C, Ranalli P, Iwasawa K. 2010. In X-ray Astronomy 2009; Present Status, Multi-
Wavelength Approach and Future Perspectives, ed. A Comastri, L Angelini, M Cappi. AIP Conf. Proc.1248:359–64. Melville, NY: AIP
Glass IS. 1992. MNRAS 256:P23–27Glikman E, Gregg MD, Lacy M, et al. 2004. Ap. J. 607:60–75Glikman E, Urrutia T, Lacy M, et al. 2012. Ap. J. 757:51Gonzalez-Martın O, Rodrıguez-Espinosa JM, Dıaz-Santos T, et al. 2013. Astron. Astrophys. 553:A35Goulding AD, Alexander DM. 2009. MNRAS 398:1165–93Goulding AD, Alexander DM, Bauer FE, et al. 2012. Ap. J. 755:5Granato GL, Danese L, Franceschini A. 1997. Ap. J. 486:147–59Greenhill LJ, Booth RS, Ellingsen SP, et al. 2003. Ap. J. 590:162–73Haas M, Willner SP, Heymann F, et al. 2008. Ap. J. 688:122–27Hailey-Dunsheath S, Sturm E, Fischer J, et al. 2012. Ap. J. 755:57Hasinger G. 2008. Astron. Astrophys. 490:905–22Heckman T, Best P. 2014. Annu. Rev. Astron. Astrophys. 52:589Hernandez-Garcıa L, Gonzalez-Martın O, Marquez I, Masegosa J. 2013. Astron. Astrophys. 556:A47Hicks EKS, Davies RI, Malkan MA, et al. 2009. Ap. J. 696:448–70Ho LC. 2008. Annu. Rev. Astron. Astrophys. 46:475–539Honig SF, Beckert T. 2007. MNRAS 380:1172–76Honig SF, Kishimoto M, Gandhi P, et al. 2010. Astron. Astrophys. 515:A23Honig SF, Kishimoto M, Tristram KRW, et al. 2013. Ap. J. 771:87Honig SF, Leipski C, Antonucci R, Haas M. 2011. Ap. J. 736:26Ikeda S, Awaki H, Terashima Y. 2009. Ap. J. 692:608–17Imanishi M, Maiolino R, Nakagawa T. 2010. Ap. J. 709:801–15Iwasawa K, Taniguchi Y. 1993. Ap. J. Lett. 413:L15–18Jaffe W, Meisenheimer K, Rottgering HJA, et al. 2004. Nature 429:47–49Kartje JF, Konigl A. 1996. Vistas Astron. 40:133–37Kaspi S, Smith PS, Netzer H, et al. 2000. Ap. J. 533:631–49Kauffmann G, Heckman TM, Tremonti C, et al. 2003. MNRAS 346:1055–77Kawaguchi T, Mori M. 2010. Ap. J. Lett. 724:L183Kawaguchi T, Mori M. 2011. Ap. J. 737:105Kewley LJ, Groves B, Kauffmann G, Heckman T. 2006. MNRAS 372:961–76Kinkhabwala A, Sako M, Behar E, et al. 2002. Ap. J. 575:732–46Kinney AL, Schmitt HR, Clarke CJ, et al. 2000. Ap. J. 537:152–77Kishimoto M. 1999. Ap. J. 518:676–92Kishimoto M, Honig SF, Antonucci R, et al. 2011a. Astron. Astrophys. 527:A121Kishimoto M, Honig SF, Antonucci R, et al. 2011b. Astron. Astrophys. 536:A78Kishimoto M, Honig SF, Beckert T, Weigelt G. 2007. Astron. Astrophys. 476:713–21Konigl A, Kartje JF. 1994. Ap. J. 434:446–67Koshida S, Minezaki T, Yoshii Y, et al. 2014. Ap. J. 788:159
www.annualreviews.org • AGN Unification 405
Ann
u. R
ev. A
stro
n. A
stro
phys
. 201
5.53
:365
-408
. Dow
nloa
ded
from
ww
w.a
nnua
lrev
iew
s.or
g A
cces
s pr
ovid
ed b
y U
nive
rsid
ade
de S
ao P
aulo
(U
SP)
on 0
6/21
/18.
For
per
sona
l use
onl
y.

AA53CH10-Netzer ARI 16 July 2015 12:38
Koss M, Mushotzky R, Veilleux S, et al. 2011. Ap. J. 739:57Kraemer SB, Schmitt HR, Crenshaw DM. 2008. Ap. J. 679:1128–43Kraemer SB, Schmitt HR, Crenshaw DM, et al. 2011. Ap. J. 727:130Kreimeyer K, Veilleux S. 2013. Ap. J. Lett. 772:L11Krips M, Martın S, Eckart A, et al. 2011. Ap. J. 736:37Krolik JH. 1998. Active Galactic Nuclei: From the Central Black Hole to the Galactic Environment. Princeton, NJ:
Princeton Univ. PressKrolik JH. 2007. Ap. J. 661:52–59Krolik JH, Begelman MC. 1988. Ap. J. 329:702Lacy M, Petric AO, Sajina A, et al. 2007. Astron. J. 133:186–205Lagos CDP, Padilla ND, Strauss MA, Cora SA, Hao L. 2011. MNRAS 414:2148–62LaMassa SM, Heckman TM, Ptak A, et al. 2011. Ap. J. 729:52Laor A. 2003. Ap. J. 590:86–94Laor A, Netzer H. 1989. MNRAS 238:897–916Lawrence A. 1991. R. Astron. Soc. 252:586–92Lawrence A, Elvis M. 1982. Ap. J. 256:410–26Lawrence A, Elvis M. 2010. Ap. J. 714:561–70Leipski C, Haas M, Willner SP, et al. 2010. Ap. J. 717:766–75Levenson NA, Radomski JT, Packham C, et al. 2009. Ap. J. 703:390–98Lira P, Videla L, Wu Y, et al. 2013. Ap. J. 764:159Lusso E, Hennawi JF, Comastri A, et al. 2013. Ap. J. 777:86Lusso E, Hennawi JF, Comastri A, et al. 2014. Ap. J. 784:176Lutz D, Maiolino R, Moorwood AFM, et al. 2002. Astron. Astrophys. 396:439–48Lutz D, Maiolino R, Spoon HWW, Moorwood AFM. 2004. Astron. Astrophys. 418:465–73Mainieri V, Bongiorno A, Merloni A, et al. 2011. Astron. Astrophys. 535:A80Maiolino R. 2008. New Astron. Rev. 52:339–57Maiolino R, Marconi A, Salvati M, et al. 2001. Astron. Astrophys. 365:28–36Maiolino R, Risaliti G, Salvati M, et al. 2010. Astron. Astrophys. 517:A47Maiolino R, Shemmer O, Imanishi M, et al. 2007. Astron. Astrophys. 468:979–92Malizia A, Bassani L, Bazzano A, et al. 2012. MNRAS 426:1750–66Malkan MA, Gorjian V, Tam R. 1998. Ap. J. Suppl. 117:25–88Maoz D. 2007. MNRAS 377:1696–710Marinucci A, Bianchi S, Nicastro F, Matt G, Goulding AD. 2012. Ap. J. 748:130Markowitz AG, Krumpe M, Nikutta R. 2014. MNRAS 439:1403–58Mayo JH, Lawrence A. 2013. MNRAS 434:1593–98Merloni A, Bongiorno A, Brusa M, et al. 2014. MNRAS 437:3550–67Merloni A, Heinz S. 2013. In Planets, Stars and Stellar Systems, ed. TD Oswalt, WC Keel, 6:503–66. Dordrecht,
Neth.: SpringerMeusinger H, Balafkan N. 2014. Astron. Astrophys. 568:A114Mor R, Netzer H. 2012. MNRAS 420:526–41Mor R, Netzer H, Elitzur M. 2009. Ap. J. 705:298–313Mor R, Trakhtenbrot B. 2011. Ap. J. Lett. 737:L36Mulchaey JS, Wilson AS, Tsvetanov Z. 1996. Ap. J. 467:197Mullaney JR, Alexander DM, Goulding AD, Hickox RC. 2011. MNRAS 414:1082–110Muller-Sanchez F, Prieto MA, Hicks EKS, et al. 2011. Ap. J. 739:69Narayan R. 2005. Ap. Space Sci. 300:177Narayanan D, Dey A, Hayward CC, et al. 2010. MNRAS 407:1701–20Nenkova M, Sirocky MM, Ivezic V, Elitzur M. 2008a. Ap. J. 685:147–59Nenkova M, Sirocky MM, Nikutta R, Ivezic V, Elitzur M. 2008b. Ap. J. 685:160–80Netzer H. 1993. Ap. J. 411:594–601Netzer H. 2009. MNRAS 399:1907–20Netzer H. 2013. The Physics and Evolution of Active Galactic Nuclei. Cambridge, UK: Cambridge Univ. PressNetzer H, Laor A. 1993. Ap. J. Lett. 404:L51–54
406 Netzer
Ann
u. R
ev. A
stro
n. A
stro
phys
. 201
5.53
:365
-408
. Dow
nloa
ded
from
ww
w.a
nnua
lrev
iew
s.or
g A
cces
s pr
ovid
ed b
y U
nive
rsid
ade
de S
ao P
aulo
(U
SP)
on 0
6/21
/18.
For
per
sona
l use
onl
y.

AA53CH10-Netzer ARI 16 July 2015 12:38
Netzer H, Trakhtenbrot B. 2014. MNRAS 438:672–79Nicastro F. 2000. Ap. J. Lett. 530:L65–68Ogle PM, Marshall HL, Lee JC, Canizares CR. 2000. Ap. J. Lett. 545:L81–84Osterbrock DE, Ferland GJ. 2006. Astrophysics of Gaseous Nebulae and Active Galactic Nuclei. Sausalito, CA:
Univ. Sci. Books. 2nd ed.Paggi A, Wang J, Fabbiano G, Elvis M, Karovska M. 2012. Ap. J. 756:39Panessa F, Bassani L. 2002. Astron. Astrophys. 394:435–42Peeters E, Spoon HWW, Tielens AGGM. 2004. Ap. J. 613:986–1003Peterson BM. 1997. An Introduction to Active Galactic Nuclei. Cambridge, UK: Cambridge Univ. PressPier EA, Krolik JH. 1992. Ap. J. 401:99Pogge RW. 1988. Ap. J. 328:519–22Pott JU, Malkan MA, Elitzur M, et al. 2010. Ap. J. 715:736–42Pozo Nunez F, Haas M, Chini R, et al. 2014. Astron. Astrophys. 561:L8Prieto MA, Mezcua M, Fernandez-Ontiveros JA, Schartmann M. 2014. MNRAS 442:2145–64Ramos Almeida C, Alonso-Herrero A, Levenson NA, et al. 2014. MNRAS 439:3847–59Ramos Almeida C, Levenson NA, Alonso-Herrero A, et al. 2011. Ap. J. 731:92Reyes R, Zakamska NL, Strauss MA, et al. 2008. Astron. J. 136:2373–90Ricci C, Paltani S, Awaki H, et al. 2013. Astron. Astrophys. 553:A29Rieke GH, Alonso-Herrero A, Weiner BJ, et al. 2009. Ap. J. 692:556–73Riffel R, Riffel RA, Ferrari F, Storchi-Bergmann T. 2011. MNRAS 416:493–500Riffel RA, Storchi-Bergmann T, Riffel R, Pastoriza MG. 2010. Ap. J. 713:469–74Riffel RA, Storchi-Bergmann T, Winge C. 2013. MNRAS 430:2249–61Risaliti G, Elvis M, Fabbiano G, et al. 2007. Ap. J. Lett. 659:L111–14Risaliti G, Elvis M, Nicastro F. 2002. Ap. J. 571:234–46Risaliti G, Nardini E, Salvati M, et al. 2011. MNRAS 410:1027–35Robson IEI. 1996. Active Galactic Nuclei. New York: WileyRosario DJ, Santini P, Lutz D, et al. 2013. Ap. J. 771:63Rosario DJ, Santini P, Lutz D, et al. 2012. Astron. Astrophys. 545:A45Roseboom IG, Lawrence A, Elvis M, et al. 2013. MNRAS 429:1494–501Sako M, Kahn SM, Paerels F, Liedahl DA. 2000. Ap. J. Lett. 543:L115–18Schartmann M, Burkert A, Krause M, et al. 2010. MNRAS 403:1801–11Schartmann M, Meisenheimer K, Camenzind M, et al. 2008. Astron. Astrophys. 482:67–80Schartmann M, Meisenheimer K, Camenzind M, Wolf S, Henning T. 2005. Astron. Astrophys. 437:861–81Schawinski K, Simmons BD, Urry CM, Treister E, Glikman E. 2012. MNRAS 425:L61–65Schneider R, Bianchi S, Valiante R, Risaliti G, Salvadori S. 2014. arXiv:1402.2279Schnorr-Muller A, Storchi-Bergmann T, Nagar NM, et al. 2014. MNRAS 437:1708–24Schweitzer M, Groves B, Netzer H, et al. 2008. Ap. J. 679:101–17Shemmer O, Trakhtenbrot B, Anderson SF, et al. 2010. Ap. J. Lett. 722:L152–56Shi Y, Rieke GH, Smith P, et al. 2010. Ap. J. 714:115–29Simpson C. 2005. MNRAS 360:565–72Stalevski M, Fritz J, Baes M, Nakos T, Popovic LC. 2012. MNRAS 420:2756–72Stern D, Eisenhardt P, Gorjian V, et al. 2005. Ap. J. 631:163–68Stern J, Laor A. 2012. MNRAS 426:2703–18Storchi-Bergmann T, Riffel RA, Riffel R, et al. 2012. Ap. J. 755:87Suganuma M, Yoshii Y, Kobayashi Y, et al. 2006. Ap. J. 639:46–63Swain M, Vasisht G, Akeson R, et al. 2003. Ap. J. Lett. 596:L163–66Tadhunter C. 2008. New Astron. Rev. 52:227–39Tadhunter C, Tsvetanov Z. 1989. Nature 341:422–24Tommasin S, Spinoglio L, Malkan MA, Fazio G. 2010. Ap. J. 709:1257–83Torricelli-Ciamponi G, Pietrini P, Risaliti G, Salvati M. 2014. MNRAS 442:2116–30Tran HD. 2003. Ap. J. 583:632–48Treister E, Krolik JH, Dullemond C. 2008. Ap. J. 679:140–48Tristram KRW, Burtscher L, Jaffe W, et al. 2014. Astron. Astrophys. 563:A82
www.annualreviews.org • AGN Unification 407
Ann
u. R
ev. A
stro
n. A
stro
phys
. 201
5.53
:365
-408
. Dow
nloa
ded
from
ww
w.a
nnua
lrev
iew
s.or
g A
cces
s pr
ovid
ed b
y U
nive
rsid
ade
de S
ao P
aulo
(U
SP)
on 0
6/21
/18.
For
per
sona
l use
onl
y.

AA53CH10-Netzer ARI 16 July 2015 12:38
Trump JR, Impey CD, Taniguchi Y, et al. 2009. Ap. J. 706:797–809Turner TJ, Miller L. 2009. Astron. Astrophys. Rev. 17:47–104Ueda Y, Akiyama M, Ohta K, Miyaji T. 2003. Ap. J. 598:886–908Ueda Y, Eguchi S, Terashima Y, et al. 2007. Ap. J. Lett. 664:L79–82Urry CM, Padovani P. 1995. Publ. Astron. Soc. Pac. 107:803Urry M. 2003. In Active Galactic Nuclei: From Central Engine to Host Galaxy, ed. S Collin, F Combes, I Shlosman.
ASP Conf. Ser. 290:3. San Francisco: ASPVardanyan V, Weedman D, Sargsyan L. 2014. Ap. J. 790:88Veilleux S, Kim DC, Peng CY, et al. 2006. Ap. J. 643:707–23Veilleux S, Kim DC, Rupke DSN, et al. 2009a. Ap. J. 701:587–606Veilleux S, Osterbrock DE. 1987. Ap. J. Suppl. 63:295–310Veilleux S, Rupke DSN, Kim DC, et al. 2009b. Ap. J. Suppl. Ser. 182:628–66Vito F, Vignali C, Gilli R, et al. 2013. MNRAS 428:354–69Vollmer B, Beckert T, Davies RI. 2008. Astron. Astrophys. 491:441–53Wada K. 2012. Ap. J. 758:66Wada K, Papadopoulos PP, Spaans M. 2009. Ap. J. 702:63–74Wang J, Fabbiano G, Elvis M, et al. 2011a. Ap. J. 742:23Wang JM, Ge JQ, Hu C, et al. 2011b. Ap. J. 739:3Wang JM, Qiu J, Du P, Ho LC. 2014. Ap. J. 797:65Wang JM, Yan CS, Gao HQ, et al. 2010. Ap. J. Lett. 719:L148–52Weaver KA, Melendez M, Mushotzky RF, et al. 2010. Ap. J. 716:1151–65Weedman D, Sargsyan L, Lebouteiller V, Houck J, Barry D. 2012. Ap. J. 761:184Weigelt G, Hofmann KH, Kishimoto M, et al. 2012. Astron. Astrophys. 541:L9Yaqoob T, Murphy KD, Miller L, Turner TJ. 2010. MNRAS 401:411–17
408 Netzer
Ann
u. R
ev. A
stro
n. A
stro
phys
. 201
5.53
:365
-408
. Dow
nloa
ded
from
ww
w.a
nnua
lrev
iew
s.or
g A
cces
s pr
ovid
ed b
y U
nive
rsid
ade
de S
ao P
aulo
(U
SP)
on 0
6/21
/18.
For
per
sona
l use
onl
y.

AA53-FrontMatter ARI 27 July 2015 8:50
Annual Review ofAstronomy andAstrophysics
Volume 53, 2015 Contents
Exploring the UniverseMaarten Schmidt � � � � � � � � � � � � � � � � � � � � � � � � � � � � � � � � � � � � � � � � � � � � � � � � � � � � � � � � � � � � � � � � � � � � � � � � � � � � � � � 1
Hypervelocity StarsWarren R. Brown � � � � � � � � � � � � � � � � � � � � � � � � � � � � � � � � � � � � � � � � � � � � � � � � � � � � � � � � � � � � � � � � � � � � � � � � � � � � �15
Physical Models of Galaxy Formation in a Cosmological FrameworkRachel S. Somerville and Romeel Dave � � � � � � � � � � � � � � � � � � � � � � � � � � � � � � � � � � � � � � � � � � � � � � � � � � � � � �51
Powerful Outflows and Feedback from Active Galactic NucleiAndrew King and Ken Pounds � � � � � � � � � � � � � � � � � � � � � � � � � � � � � � � � � � � � � � � � � � � � � � � � � � � � � � � � � � � � � � 115
Visible/Infrared Imaging Spectroscopy and Energy-ResolvingDetectorsFrank Eisenhauer and Walfried Raab � � � � � � � � � � � � � � � � � � � � � � � � � � � � � � � � � � � � � � � � � � � � � � � � � � � � � 155
The Nine Lives of Cosmic Rays in GalaxiesIsabelle A. Grenier, John H. Black, and Andrew W. Strong � � � � � � � � � � � � � � � � � � � � � � � � � � � � � 199
Ideas for Citizen Science in AstronomyPhilip J. Marshall, Chris J. Lintott, and Leigh N. Fletcher � � � � � � � � � � � � � � � � � � � � � � � � � � � � � � 247
On the Cool Side: Modeling the Atmospheres of Brown Dwarfsand Giant PlanetsM.S. Marley and T.D. Robinson � � � � � � � � � � � � � � � � � � � � � � � � � � � � � � � � � � � � � � � � � � � � � � � � � � � � � � � � � � � 279
Grid-Based Hydrodynamics in Astrophysical Fluid FlowsRomain Teyssier � � � � � � � � � � � � � � � � � � � � � � � � � � � � � � � � � � � � � � � � � � � � � � � � � � � � � � � � � � � � � � � � � � � � � � � � � � � � � 325
Revisiting the Unified Model of Active Galactic NucleiHagai Netzer � � � � � � � � � � � � � � � � � � � � � � � � � � � � � � � � � � � � � � � � � � � � � � � � � � � � � � � � � � � � � � � � � � � � � � � � � � � � � � � � 365
The Occurrence and Architecture of Exoplanetary SystemsJoshua N. Winn and Daniel C. Fabrycky � � � � � � � � � � � � � � � � � � � � � � � � � � � � � � � � � � � � � � � � � � � � � � � � � � 409
viii
Ann
u. R
ev. A
stro
n. A
stro
phys
. 201
5.53
:365
-408
. Dow
nloa
ded
from
ww
w.a
nnua
lrev
iew
s.or
g A
cces
s pr
ovid
ed b
y U
nive
rsid
ade
de S
ao P
aulo
(U
SP)
on 0
6/21
/18.
For
per
sona
l use
onl
y.

AA53-FrontMatter ARI 27 July 2015 8:50
Faltering Steps Into the Galaxy: The Boundary Regionsof the HeliosphereG.P. Zank � � � � � � � � � � � � � � � � � � � � � � � � � � � � � � � � � � � � � � � � � � � � � � � � � � � � � � � � � � � � � � � � � � � � � � � � � � � � � � � � � � � � 449
Interstellar Dust Grain AlignmentB-G Andersson, A. Lazarian, and John E. Vaillancourt � � � � � � � � � � � � � � � � � � � � � � � � � � � � � � � � � � 501
Observations of the Icy UniverseA.C. Adwin Boogert, Perry A. Gerakines, and Douglas C.B. Whittet � � � � � � � � � � � � � � � � � � � 541
Molecular Clouds in the Milky WayMark Heyer and T.M. Dame � � � � � � � � � � � � � � � � � � � � � � � � � � � � � � � � � � � � � � � � � � � � � � � � � � � � � � � � � � � � � � 583
Near-Field Cosmology with Extremely Metal-Poor StarsAnna Frebel and John E. Norris � � � � � � � � � � � � � � � � � � � � � � � � � � � � � � � � � � � � � � � � � � � � � � � � � � � � � � � � � � � 631
Indexes
Cumulative Index of Contributing Authors, Volumes 42–53 � � � � � � � � � � � � � � � � � � � � � � � � � � � 689
Cumulative Index of Article Titles, Volumes 42–53 � � � � � � � � � � � � � � � � � � � � � � � � � � � � � � � � � � � � � 692
Errata
An online log of corrections to Annual Review of Astronomy and Astrophysics articlesmay be found at http://www.annualreviews.org/errata/astro
Contents ix
Ann
u. R
ev. A
stro
n. A
stro
phys
. 201
5.53
:365
-408
. Dow
nloa
ded
from
ww
w.a
nnua
lrev
iew
s.or
g A
cces
s pr
ovid
ed b
y U
nive
rsid
ade
de S
ao P
aulo
(U
SP)
on 0
6/21
/18.
For
per
sona
l use
onl
y.