revisiting the price of gold and exchange rates with
TRANSCRIPT
International Journal of Development and Sustainability
ISSN: 2186-8662 – www.isdsnet.com/ijds
Volume 6 Number 3 (2017): Pages 130-148
ISDS Article ID: IJDS17061602
Revisiting the price of gold and exchange rates with quantile regression model
Ke Chen*, Meng Wang, Yi Pan
School of Finance and Statistics, Hunan University, Changsha, Hunan, China, 410082
Abstract
This paper provides a new perspective on the link between the price of gold and exchange rates, using weekly data
from 1995 to 2016. Initially, we classify currencies as strong (RMB) or weak (RUB), by comparing them with a
reference currency (USD or GBP). We find that there is no co-integration relationship between the price of gold in a
certain currency and the currency’s relation to any other exchange rate. Additionally, a negative relationship exists
between the price of gold for currencies and the exchange rates of weak currencies. However, a positive relationship
exists between gold and the exchange rate of a strong currency. Therefore, the negative relationship between the
price of gold and exchange rate depends on the currency’s strength. The results of this study are different from those
obtained in previous studies in this area. Furthermore, robustness tests support the results above.
Keywords: Price of Gold; Exchange Rates; Correlation; Quantile Regression; Robust Test
* Corresponding author. E-mail address: [email protected]
Published by ISDS LLC, Japan | Copyright © 2017 by the Author(s) | This is an open access article distributed under the
Creative Commons Attribution License, which permits unrestricted use, distribution, and reproduction in any medium,
provided the original work is properly cited.
Cite this article as: Chen, K., Wang, M. and Pan, Y. (2017), “Revisiting the price of gold and exchange rates with quantile
regression model”, International Journal of Development and Sustainability, Vol. 6 No. 3, pp. 130-148.
International Journal of Development and Sustainability Vol.6 No.3 (2017): 130-148
ISDS www.isdsnet.com 131
1. Introduction
Whether as a commodity or as a financial asset, the strengthened gold price in combination with the
depreciation of some currencies, such as the US dollar (USD) and the UK pound (GBP), has attracted the
attention of investors, risk managers, and the financial media.
Some studies have examined the role of gold as a hedge or safe haven asset against currency depreciation.
For instance, Beckers and Soenen (1984) verify the gold and USD inverse relationship empirically, providing
evidence on gold’s hedging benefits for US and non-US investors. Sjasstad and Scacciavillani (1996) find that
floating exchange rates among major currencies have been a major source of price instability in the global
gold market since the dissolution of the Bretton Woods International monetary system. While Sjasstad
(2008) confirms that, as the world gold market seemed to be dominated by the USD bloc, appreciations or
depreciations of the USD would have strong effects on the price of gold in other currencies. Capie et al.,
(2005) confirm the positive relationship between USD depreciation and the price of gold, making gold an
effective hedge against the USD. Additionally, many scholars find a positive dependence between gold and
USD depreciation against a wide set of currencies (Joy, 2011; Rebored, 2013; Reboredo and Rivera-Castro,
2014; Beckmann et al., 2015).
Different from existing literature, Pukthuanthong and Roll (2011) find that the price of gold can be
associated with any currency depreciation, such as the USD price of gold can be related to USD depreciation
and the euro (EUR) (GBP, JPY) price of gold can also be related to EUR (GBP, JPY) depreciation. However,
Chen et al., (2014) explain gold price fluctuations from the perspective of the role of central banks worldwide.
Except for the hedge and safe haven roles of exchange rates, gold also has been widely acknowledged as a
“safe haven” and “store of value” for central bankers and investors (Baur and Lucey, 2010; Baur and
McDermott, 2010), especially in periods of financial and political turmoil. Additionally, gold also has been
widely regarded as one of the most important precious metals (Blose and Shieh, 1995; Bialkowski et al.,
2015) and a standard underlying the international monetary and/or exchange rate system (Capie et al.,
2005; Govett and Govett, 1982; Ming et al., 2016, among others).
In this paper, we study the structural correlation between gold price and exchange rates, given the
fluctuation of gold prices in recent years, see Figure 1. There is a net increase in the price of gold over the last
twenty years, which diverges across countries because of different exchange rate appreciations. Two aspects
are obvious here. First, the Renminbi (RMB) appreciated the most over these twenty years relative to other
currencies; thus, the RMB price of gold has the lowest overall increase. On the other hand, the Russian ruble
(RUR) depreciated the most relative to the other currencies. Second, gold price changes are highly correlated
across countries and display significant volatility.
Although the gold price in these four currencies increases during this period, except on rare occasions, all
the exchange rates do not depreciate. Taking the RMB exchange rate as an example, it appreciates
continuously over the twenty years, except for some short periods. For the purpose of understanding the
RMB appreciation, we summarize the 2005 Chinese exchange rate reform. In short, China reformed the
exchange rate regime by moving to a managed floating exchange rate based on market supply and demand,

International Journal of Development and Sustainability Vol.6 No.3 (2017): 130-148
132 ISDS www.isdsnet.com
with reference to a basket of currencies. As a consequence, the RMB began to appreciate after many years.
Therefore, compared with the USD and the GBP, we regard RMB as a strong currency. However, the RMB gold
price did increase 2.5 times compared with 1995. This is different from existing literature. Actually, the RMB
is not the only currency that exhibits such an evolution. The Indian rupee (INR) has experienced an increase
during these twenty years as well 1.Conversely, the RUR has depreciated significantly over the past twenty
years, especially during the RUR crisis in 1998. Accordingly, we view RUR as a weak currency in this paper.
However, we may reasonably choose USD and GBP as a reference currency.
Figure 1. Gold price from 1995–2016. (Note: November 17, 1995 is the base
period. The RUR price of gold is in accordance with the right axis, while the others
with the left axis.)
Consequently, we study the relationship between gold price and the exchange rates of different currencies.
Our research contributes to the literature on the dynamics between the gold price and exchange rates in two
aspects. First, there is no long-run stable relationship among gold prices and bilateral exchange rates in the
sample period. Second, on classifying the currencies into strong currency (RMB), weak currency (RUR), and
reference currency (USD or GBP), a negative relationship exists between the price of gold in some currency
and the exchange rate of a weak currency. However, a positive relationship exists between gold price and the
exchange rate of a strong currency. Therefore, the negative relationship between the price of gold and
exchange rate is decided by currency strength. This point is different from conventional wisdom.

International Journal of Development and Sustainability Vol.6 No.3 (2017): 130-148
ISDS www.isdsnet.com 133
The organization of this paper is as follows. Section 1 describes the study’s purpose and previous research
on the relationship between the price of gold and exchange rates. Section 2 briefly discusses the research
methodology. Section 3 outlines the data and results. Section 4 presents the robust analysis. Finally, the last
section provides a discussion and conclusion.
2. Methodology
We employ both the ordinary least squares (OLS) model and quantile regression (QR) model to explore the
relationship between the price of gold and exchange rates in this paper. However, we only concentrate on
correlation between the two variables and ignore other details. Moreover, the OLS model only identifies the
average effects on exchange rates, that is, how gold prices impact average exchange rates. Fortunately, the QR
model, introduced by Koenker and Basset (1978), provides a robust and distributional view of gold prices on
exchange rates; for example, how would the USD price of gold affect the exchange rate of GBP to USD when
USD prices of gold are at different quantile levels. Here, we set a simple univariate model
0 1ij jy x (2.1)
where jx is the gold price valued in currency j,while
ijy 2 is the exchange rate of currency j per currency i.
0 and 1 are intercept and regression coefficient, respectively, is the residual term.
If 1 is positive and significant, then the gold price valued in currency j increases, and currency j
depreciates against currency i on average. However, if 1 is negative and significant,then the gold price
valued in currency j increases, and currency j appreciates against currency i on average.
In other words, we determine how would a one percent change of the gold price affect the exchange rates
on average. This addresses our “average” concern, but we are also interested in the effects on the right tail of
the exchange rate distribution. For example, it is important how would a one unit change of gold price affect
the exchange rates when the exchange rate is already high. The QR model is a tool for addressing this.
Corresponding to equation (2.1), the QR model could be written as:
1
=
iy x f
x
(2.2)
wherei
f is the distribution function of i , is the quantile of exchange rates conditional on gold price.
Therefore, as long as 0 , 1
if captures the heterogeneous effects of gold price on exchange rates. By
varying over the range of 0,1 , we obtain a distributional view of gold price effects on exchange rates. We
use the expression to indicate that depends upon the choice of , which is the quantile of
conditional distribution of gold prices. To obtain quantile estimates, we select a value for and then
minimize the following expression

International Journal of Development and Sustainability Vol.6 No.3 (2017): 130-148
134 ISDS www.isdsnet.com
ˆ arg min 1i i i i
i i i i
y x y x
y x y x
(2.3)
In other words, is derived as a line ( =y x ), such that percent of observations lie on or
below the line (the first sum), while 1 percent of observations lie above the line (the second sum). Note
that we can choose freely in the range 0,1 .
3. Data and results
We empirically investigate the relationship between gold prices against exchange rates using weekly data
from November 17, 1995 to April 8, 2016. Data for gold prices—measured in currency per ounce—are
collected from the World Gold Council (WGC). All exchange rate data are downloaded from DataStream, a
division of Thomson Financial.
Table 1 provides the preliminary statistics of the gold price for four currencies and the exchange rates
between the four currencies. As shown in Panel A of Table 1, the average gold prices of the four currencies
are 744.4, 458.5, 5191.6, and 23783.6 per troy ounce, respectively. The skewness and kurtosis indicate that
these price series are not normally distributed, but right-skewed. Panel B reports the descriptive statistics of
the exchange rates between the four currencies. Take the exchange rate USDGBP for example, the exchange
rate of GBP to one USD, where a rise implies an appreciation of the USD or a devaluation of the GBP.
Table 1. Descriptive statistics
Panel A: The gold price in four currencies
Mean Median Maximum Minimum Std. Dev. Skewness Kurtosis Jarque-Bera Probability
USD 744.4 551.7 1875.3 253.8 474.3 0.6522 2.0118 118.8 0.0000
GBP 458.5 309.6 1164.5 157.2 304.4 0.7292 2.0119 137.7 0.0000
RMB 5191.6 4432.2 11969.0 2100.8 2751.3 0.5946 2.0423 103.5 0.0000
RUR 23783.6 15262.5 94159.6 1676.1 21109.1 1.0541 3.3010 201.2 0.0000
Panel B: The exchange rate between four currencies
USDGBP 0.6133 0.6207 0.7322 0.4782 0.0546 -0.4957 2.6525 49.0 0.0000
USDRUR 28.1377 28.8160 83.5913 4.5370 12.9832 0.8406 6.1136 555.6 0.0000
USDRMB 7.5033 8.0616 8.3333 6.0488 0.8731 -0.4423 1.4209 145.4 0.0000
GBPUSD 1.6444 1.6112 2.0911 1.3658 0.1559 0.8687 3.0645 134.1 0.0000
GBPRUR 45.8555 48.3771 119.6024 7.0346 19.7177 0.3174 5.0848 210.7 0.0000

International Journal of Development and Sustainability Vol.6 No.3 (2017): 130-148
ISDS www.isdsnet.com 135
GBPRMB 12.3559 12.7438 16.0467 9.0691 1.9524 -0.0393 1.6888 76.6 0.0000
RMBUSD 0.1352 0.1240 0.1653 0.1200 0.0167 0.5320 1.5581 142.5 0.0000
RMBGBP 0.0831 0.0785 0.1103 0.0623 0.0135 0.3425 1.7022 95.6 0.0000
RMBRUR 3.9248 3.5386 12.5300 0.5457 2.1400 1.2282 5.9203 646.2 0.0000
RURUSD 0.0537 0.0347 0.2204 0.0120 0.0514 2.1078 5.7344 1120.4 0.0000
RURGBP 0.0330 0.0207 0.1422 0.0084 0.0324 2.1740 6.1062 1267.1 0.0000
RURRMB 0. 4218 0.2830 1.8320 0.0800 0. 4378 2.0832 5.6704 1086.7 0.0000
Table 2 displays the descriptive statistics for gold returns (i.e., first difference of the natural logarithm),
and shows that normality is rejected for each series, since the kurtosis of each series is larger than 3, which
means that the distribution is leptokurtic, or fat-tailed. Consequently, we select the QR model to study the
structural correlation between gold price and exchange rates. As shown in Table 2, the average of gold return
in RMB is the lowest, while that in RUR is the highest among the four currencies, which might be explained by
the appreciation of the RMB against the other three currencies and the depreciation of RUR against all
currencies.
Table2. Descriptive statistics of gold returns
Mean Median Maximum Minimum Std. dev. Skewness Kurtosis Jarque-Bera p-Value
USD 0.0011 0.0013 0.1469 -0.1379 0.0244 -0.1189 6.9522 694.9730 0
GBP 0.0012 0.0008 0.1311 -0.1516 0.0236 0.1416 7.7995 1024.7650 0
RMB 0.0009 0.0011 0.1455 -0.1382 0.0243 -0.1208 6.9809 705.15840 0
RUR 0.0364 0.0019 0.6316 -0.6566 0.0436 0.6685 102.7692 441368.50 0
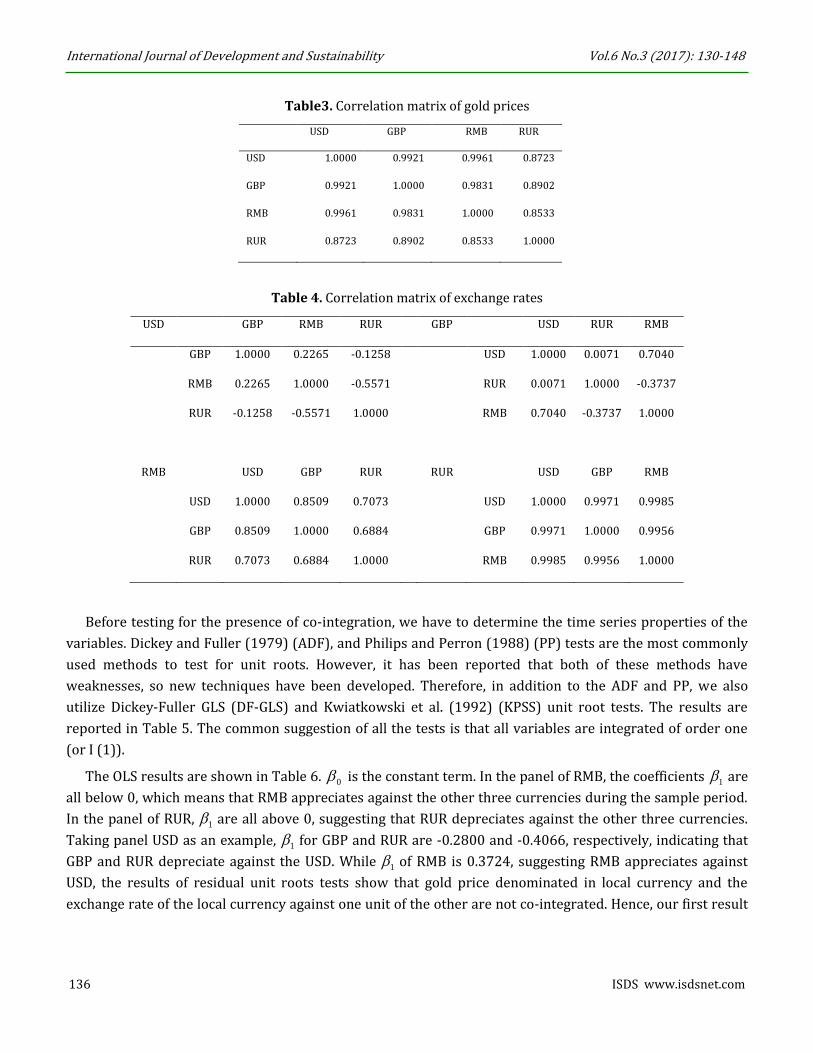
The strength of cross-country correlations in gold prices is verified for the entire sample in Table 3, which
uses weekly logarithmic prices relative to gold. Every correlation exceeds 0.85 and two are above 0.99. The
gold price in RUR has the lowest correlation with other currencies (below 0.90).
The correlations between the exchange rates are reported in Table 4. As shown in Table 4, the exchange
rate USDRUR has a negative correlation with USDGBP and USDRMB, reflecting that, when the USD
appreciates against the RUR, the USD depreciates against the GBP and RMB. The exchange rate GBPRUR has a
negative correlation with GBPRMB, expressing that, when RUR depreciates against GBP, RMB appreciates
against the GBP. RMBUSD, RMBGBP, and RMBRUR exhibit a positive correlation, indicating that RMB
appreciates against all other three currencies. RURUSD, RURGBP, and RURRMB are positively related,
reflecting that RUR depreciates against the other three currencies.
International Journal of Development and Sustainability Vol.6 No.3 (2017): 130-148
136 ISDS www.isdsnet.com
Table3. Correlation matrix of gold prices
USD GBP RMB RUR
USD 1.0000 0.9921 0.9961 0.8723
GBP 0.9921 1.0000 0.9831 0.8902
RMB 0.9961 0.9831 1.0000 0.8533
RUR 0.8723 0.8902 0.8533 1.0000
Table 4. Correlation matrix of exchange rates
USD GBP RMB RUR GBP USD RUR RMB
GBP 1.0000 0.2265 -0.1258 USD 1.0000 0.0071 0.7040
RMB 0.2265 1.0000 -0.5571 RUR 0.0071 1.0000 -0.3737
RUR -0.1258 -0.5571 1.0000 RMB 0.7040 -0.3737 1.0000
RMB USD GBP RUR RUR USD GBP RMB
USD 1.0000 0.8509 0.7073 USD 1.0000 0.9971 0.9985
GBP 0.8509 1.0000 0.6884 GBP 0.9971 1.0000 0.9956
RUR 0.7073 0.6884 1.0000 RMB 0.9985 0.9956 1.0000
Before testing for the presence of co-integration, we have to determine the time series properties of the
variables. Dickey and Fuller (1979) (ADF), and Philips and Perron (1988) (PP) tests are the most commonly
used methods to test for unit roots. However, it has been reported that both of these methods have
weaknesses, so new techniques have been developed. Therefore, in addition to the ADF and PP, we also
utilize Dickey-Fuller GLS (DF-GLS) and Kwiatkowski et al. (1992) (KPSS) unit root tests. The results are
reported in Table 5. The common suggestion of all the tests is that all variables are integrated of order one
(or I (1)).
The OLS results are shown in Table 6. 0 is the constant term. In the panel of RMB, the coefficients 1 are
all below 0, which means that RMB appreciates against the other three currencies during the sample period.
In the panel of RUR, 1 are all above 0, suggesting that RUR depreciates against the other three currencies.
Taking panel USD as an example, 1 for GBP and RUR are -0.2800 and -0.4066, respectively, indicating that
GBP and RUR depreciate against the USD. While 1 of RMB is 0.3724, suggesting RMB appreciates against
USD, the results of residual unit roots tests show that gold price denominated in local currency and the
exchange rate of the local currency against one unit of the other are not co-integrated. Hence, our first result

International Journal of Development and Sustainability Vol.6 No.3 (2017): 130-148
ISDS www.isdsnet.com 137
is that (at least for the sample period under observation) there is no stable long-run relationship among gold
prices and bilateral exchange rates.
Table 5. Unit root test of variables
Panel A: The unit root test of gold prices
Levels First differences
ADF DF-GLS PP KPSS ADF DF-GLS PP KPSS
USD -0.6331 0.1368 -0.5054 3.5648*** -33.37*** -32.69*** -33.71*** 0.2007
GBP -0.2413 0.5627 -0.1913 3.4717*** -32.97*** -31.03*** -33.00*** 0.2270
RMB -0.7579 -0.0882 -0.6045 3.5417*** -33.55*** -32.58*** -33.98*** 0.1692
RUR 1.1664 2.3677 0.7864 3.7044*** -22.80*** -22.57*** -37.81*** 0.2557
Panel B” The unit root test of exchange rates
USDGBP -2.0584 -1.9153 -1.9473 0.4326 -33.68*** -3.60*** -33.72*** 0.1170
USDRUR -0.7463 0.9148 -0.1249 2.2956*** -10.03*** -10.01*** -33.75*** 0.1841
USDRMB 0.2114 2.6639 -0.0102 3.7905*** -36.98*** -36.88*** -37.30*** 0.4943**
GBPUSD -1.9212 -1.7656 -1.8812 0.4632** -33.02*** -3.97*** -33.02*** 0.1210
GBPRUR -1.3590 0.5477 -0.7353 2.4619*** -10.33*** -10.34*** -35.26*** 0.1219
GBPRMB -0.7071 -0.4994 -0.6895 2.1131*** -32.11*** -3.62*** -32.11*** 0.1772
RMBUSD 0.1041 1.9448 -0.0821 3.7413*** -35.46*** -35.35*** -35.90*** 0.4319*
RMBGBP -0.5716 -0.2169 -0.4943 2.4616*** -25.32*** -3.71*** -33.02*** 0.1698
RMBRUR 0.8016 2.2619 0.5399 2.8706*** -10.32*** -10.25*** -34.40*** 0.2305
RURUSD -3.2381** 0.4917 -3.7470*** 1.9523*** -6.8093*** -3.8041*** -26.57*** 0.7067**
RURGBP -3.4342** 0.5371 -4.0442*** 1.9716*** -7.0602*** -2.043 -26.64*** 0.7914***
RURRMB -3.2359** 0.5059 -3.8529*** 2.1253*** -6.7066*** -3.8946*** -28.10*** 0.7583***

International Journal of Development and Sustainability Vol.6 No.3 (2017): 130-148
138 ISDS www.isdsnet.com
Table 6. OLS results for 1995–2016
We investigate the distributional effects for each individual factor. The estimation is obtained using
weekly data from November 1995 to January 2016, with quantiles set at {0.05, 0.1,0.25, 0.5, 0.75, 0.9, 0.95}.
Table 7 shows that all factors are significant and the QR estimates are different from the OLS ones for most
factors, indicating that distributional effects provide a more comprehensive picture than the “average” OLS
effects.
Panel A of Table 7 shows that the gold price of USD has a significant effect on the exchange rates GBPUSD,
RMBUSD, and RURUSD. The increase of gold price of USD leads to the depreciation of USD to RMB, while
leading to the appreciation of USD to RUR. Interestingly, it results in the depreciation of USD to GBP at a low
0 1 Unit roots of residuals
Coefficient Std. error Coefficient Std. error ADF DF-GLS PP KPSS
Panel A: Relationship between USD gold prices against exchange rates
GBPUSD 16652.5*** 88.659 -0.2800*** 0.1005 -1.9894 -1.7648 * -1.9374 0.5030**
RMBUSD 1103.7*** 3.000 0.3336*** 0.0034 -2.4884 -2.0907** -2.3585 0.4609 *
RURUSD 839.9*** 27.211 -0.4066*** 0.0308 -3.3425** 0.4284 -3.5439*** 0.9144***
Panel B: Relationship between GBP gold prices against exchange rates
USDGBP 5977.6*** 29.737 0.3382*** 0.0540 -2.1846 -1.8867 * -2.0727 0.5833**
RMBGBP 659.8*** 4.106 0.3724*** 0.0075 -2.2148 -2.1877** -2.0442 0.4594 *
RURGBP 500.7*** 16.853 -0.3721*** 0.0306 -3.7259*** 0.4265 -3.8500*** 1.0112***
Panel C: Relationship between RMB gold prices against exchange rates
USDRMB 90405.6*** 205.636 -2.9610*** 0.0350 -2.4474 -1.8773 * -2.2979 0.5588**
GBPRMB 148824.2*** 930.613 -4.8666*** 0.1584 -1.9067 -1.8971 * -1.7979 0.4966**
RURRMB 7667.9*** 260.5111 -0.6645*** 0.0443 -3.4226** 0.4316 -3.6787*** 0.9071***
Panel D: Relationship between RUR gold prices against exchange rates
USDRUR 166381.1*** 3707.033 4.8351*** 0.1166 -1.7440 0.0391 -1.5751 0.4894**
GBPRUR 291015.0*** 5981.808 7.0444*** 0.1881 -1.8038 -0.0548 -1.8985 0.5997**
RMBRUR 17762.3*** 448.654 0.9034*** 0.0141 -1.6850 -0.3478 -1.7739 0.4255 *
Notes:***, **,and * denote significance at the 1%, 5%, and 10% levels, respectively.

International Journal of Development and Sustainability Vol.6 No.3 (2017): 130-148
ISDS www.isdsnet.com 139
quantile of the exchange rate, and to the appreciation of USD to GBP at a high quantile of the exchange rate.
However, we may only conclude that the increasing gold price merely leads to appreciation of USD to GBP, on
average, compared to OLS. Moreover, we can find that the impact between the USD gold price and the
exchange rate RMBUSD is monotonously increasing due to the continuous appreciation of RMB over recent
years. Additionally, the relation is stable for the USD gold price and the exchange rate RURUSD. However, the
coefficients are steep when the quantile is above 0.75 because of the ruble crisis in 1998.
Table 7. Quantile regression results for 1995–2016
0.05 0.1 0.25 0.5 0.75 0.9 0.95
Panel A: Relationship between USD gold prices against exchange rates
GBPUSD 0.4424*** 0.6139*** 0.1661* -0.2822*** -1.2240*** -1.7994** 0.9305
(0.1043) (0.0661) (0.0900) (0.0562) (0.1489) (0.7021) (1.2582)
RMBUSD 0.2787*** 0.2842*** 0.2965*** 0.3017*** 0.3992*** 0.4393*** 0.4477***
(0.0031) (0.0032) (0.0022) (0.0054) (0.0053) (0.0045) (0.0040)
RURUSD -0.1895*** -0.1653*** -0.0475*** -0.0340*** -0.1008*** -1.0353*** -1.1505***
(0.0090) (0.0119) (0.0058) (0.0026) (0.0191) (0.0220) (0.0296)
Panel B: Relationship between GBP gold prices against exchange rates
USDGBP 1.5320*** 1.2592*** 0.7962*** 0.2390*** 0.0626 -0.3592*** -0.1700*
(0.0842) (0.0761) (0.0639) (0.0348) (0.0586) (0.0551) (0.0930)
RMBGBP 0.4142*** 0.4121*** 0.3861*** 0.3386*** 0.4148*** 0.3672*** 0.3738***
(0.0114) (0.0100) (0.0090) (0.0084) (0.0122) (0.0096) (0.0087)
RURGBP -0.1668*** -0.1450*** -0.0519*** -0.0290*** -0.0662*** -0.9904*** -1.1921***
(0.0085) (0.0095) (0.0107) (0.0048) (0.0071) (0.0242) (0.0599)
Panel C: Relationship between RMB gold prices against exchange rates
USDRMB -4.0680*** -3.9552*** -3.5646*** -2.6315*** -2.6757*** -2.5823*** -2.4990***
(0.0449) (0.0494) (0.0565) (0.0336) (0.0251) (0.0328) (0.0514)
GBPRMB -4.6286*** -4.4462*** -4.8030*** -4.5756*** -5.6705*** -6.1263*** -5.0086**
(0.1462) (0.1550) (0.3358) (0.1032) (0.3722) (0.8715) (2.0796)
RURRMB -0.3356*** -0.3122*** -0.1752*** -0.1339*** -0. 2057*** -1.5534*** -1.7199***
International Journal of Development and Sustainability Vol.6 No.3 (2017): 130-148
140 ISDS www.isdsnet.com
(0.0118) (0.0152) (0.0090) (0.0046) (0.0179) (0.0352) (0.0489)
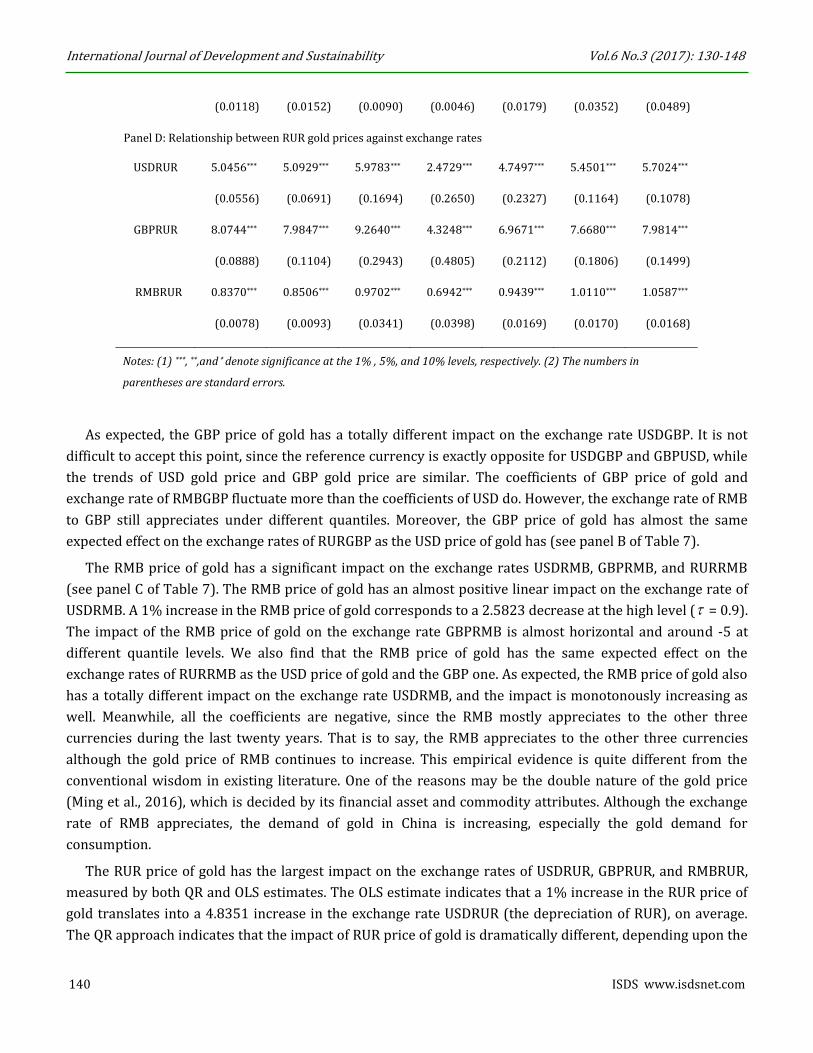
Panel D: Relationship between RUR gold prices against exchange rates
USDRUR 5.0456*** 5.0929*** 5.9783*** 2.4729*** 4.7497*** 5.4501*** 5.7024***
(0.0556) (0.0691) (0.1694) (0.2650) (0.2327) (0.1164) (0.1078)
GBPRUR 8.0744*** 7.9847*** 9.2640*** 4.3248*** 6.9671*** 7.6680*** 7.9814***
(0.0888) (0.1104) (0.2943) (0.4805) (0.2112) (0.1806) (0.1499)
RMBRUR 0.8370*** 0.8506*** 0.9702*** 0.6942*** 0.9439*** 1.0110*** 1.0587***
(0.0078) (0.0093) (0.0341) (0.0398) (0.0169) (0.0170) (0.0168)
Notes: (1) ***, **,and * denote significance at the 1% , 5%, and 10% levels, respectively. (2) The numbers in
parentheses are standard errors.
As expected, the GBP price of gold has a totally different impact on the exchange rate USDGBP. It is not
difficult to accept this point, since the reference currency is exactly opposite for USDGBP and GBPUSD, while
the trends of USD gold price and GBP gold price are similar. The coefficients of GBP price of gold and
exchange rate of RMBGBP fluctuate more than the coefficients of USD do. However, the exchange rate of RMB
to GBP still appreciates under different quantiles. Moreover, the GBP price of gold has almost the same
expected effect on the exchange rates of RURGBP as the USD price of gold has (see panel B of Table 7).
The RMB price of gold has a significant impact on the exchange rates USDRMB, GBPRMB, and RURRMB
(see panel C of Table 7). The RMB price of gold has an almost positive linear impact on the exchange rate of
USDRMB. A 1% increase in the RMB price of gold corresponds to a 2.5823 decrease at the high level ( = 0.9).
The impact of the RMB price of gold on the exchange rate GBPRMB is almost horizontal and around -5 at
different quantile levels. We also find that the RMB price of gold has the same expected effect on the
exchange rates of RURRMB as the USD price of gold and the GBP one. As expected, the RMB price of gold also
has a totally different impact on the exchange rate USDRMB, and the impact is monotonously increasing as
well. Meanwhile, all the coefficients are negative, since the RMB mostly appreciates to the other three
currencies during the last twenty years. That is to say, the RMB appreciates to the other three currencies
although the gold price of RMB continues to increase. This empirical evidence is quite different from the
conventional wisdom in existing literature. One of the reasons may be the double nature of the gold price
(Ming et al., 2016), which is decided by its financial asset and commodity attributes. Although the exchange
rate of RMB appreciates, the demand of gold in China is increasing, especially the gold demand for
consumption.
The RUR price of gold has the largest impact on the exchange rates of USDRUR, GBPRUR, and RMBRUR,
measured by both QR and OLS estimates. The OLS estimate indicates that a 1% increase in the RUR price of
gold translates into a 4.8351 increase in the exchange rate USDRUR (the depreciation of RUR), on average.
The QR approach indicates that the impact of RUR price of gold is dramatically different, depending upon the

International Journal of Development and Sustainability Vol.6 No.3 (2017): 130-148
ISDS www.isdsnet.com 141
exchange rates of USDRUR, GBPRUR, and RMBRUR. At median RUR price of gold levels, a 1% increase in the
RUR price of gold causes the exchange rate of USDRUR to increase by 2.5%. However, at low or high gold
price levels ( = 0.2 or = 0.9), a 1% increase in the RUR price of gold will result in a 5.4% increase in the
exchange rate USDRUR. The average effect delivered by OLS is indeed the “average” of quantile effects, and
fails to capture this detail (see panel D of Table 7). Interestingly, compared with the positive coefficients in
panel C, all figures are negative in panel D. In other words, the increase of gold price leads to the depreciation
of RUR to other currencies.
4. Sub-Period Results
To gain further insight on the relationship between gold price and exchange rate, we split the original sample
period into two equal time periods, November 17, 1995 to December 20, 2005 and January 6, 2006 to April 8,
2016.
On July 21, 2005, China began the RMB exchange rate formation mechanism reform. As a result, the RMB
exchange rate is no longer pegged to the USD. The People's Bank of China (PBOC) announced that RMB would
switch to a managed floating regime “with reference to a basket of currencies,” allowing a movement of up to
±.3% in bilateral exchange rates within any given day (later widened to ±.5%). As such, we divide the sample
period into two parts: before July 21, 2005 and afterwards. By making the same empirical analysis on the two
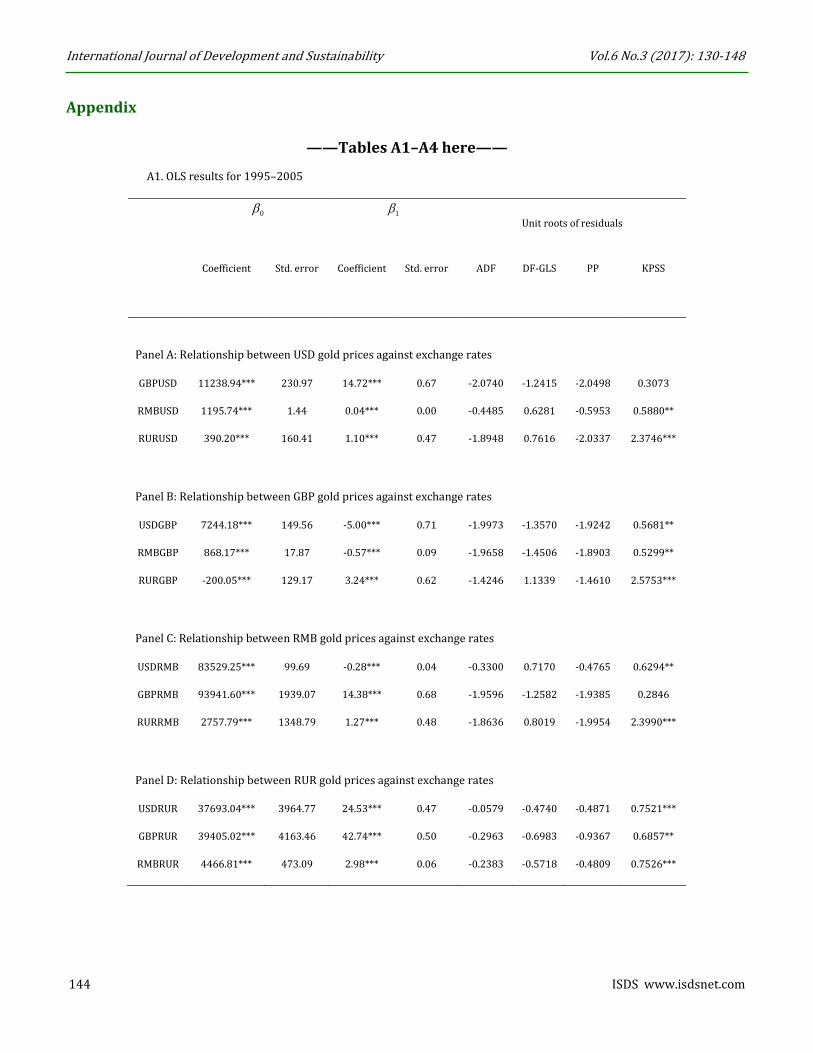
time periods respectively, we find that: from 1995 to 2006, in the RMB panel of the OLS regression results,
1 of USDRMB is below zero, 1 of GBPRMB and RURRMB are above zero, which means the RMB appreciates
against the USD, while it depreciates against the GBP and RUR during the sample period (see panel C, A1).
From 2006–2016, in the panel of RMB, 1 are all below zero, suggesting that RMB appreciates against the
other three currencies during the sample period (see A2).
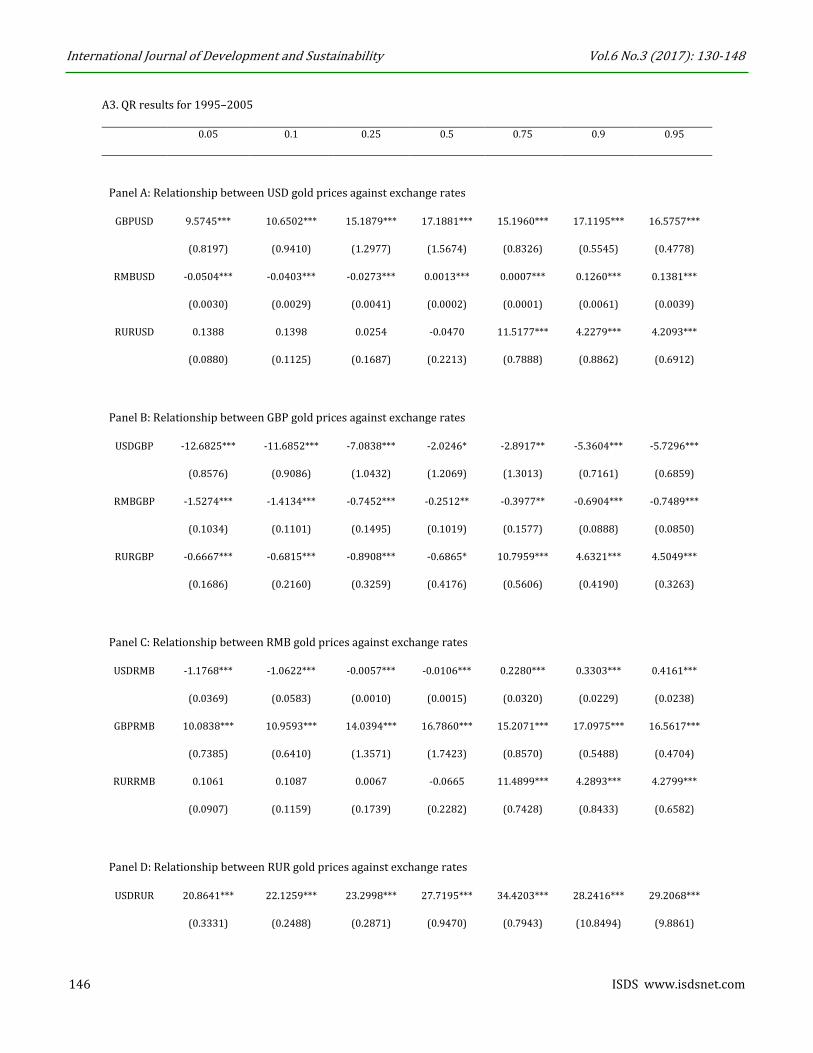
From the QR results, we can capture a more detailed relationship between the RMB price of gold and
exchange rates before and after 2016. During 1995–2005, the effect of GBP gold prices on RURGBP is below
zero at the low and median level, while it increased dramatically (above 0) at the high level (see panel B, A3).
The RMB price of gold does not have a significant impact on the exchange rates of USDRMB. QR shows that
the effect of RMB price of gold on USDRMB is below zero around the low and median level, while above zero
at the high quantile (see panel C, A3). This suggests that the RMB appreciates against the USD when the RMB
gold prices are low, while it depreciates against the USD when the RMB gold prices are at a high level. The
RMB price of gold has a significant impact on the exchange rates of GBPRMB, and the GBPRMB exchange
rates increase with the gold price of RMB. The gold price effect on RURRMB is close to zero around the low
and median level, while it increases dramatically at the high level.
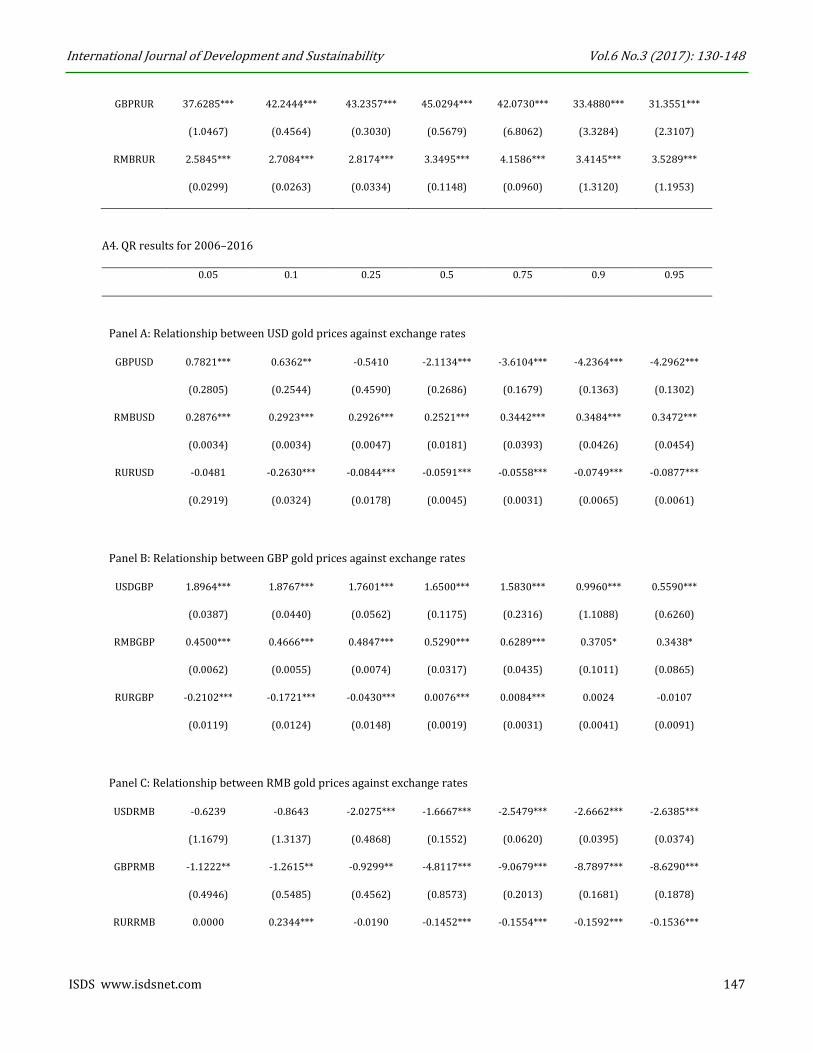
Generally, from 2006 to 2016, the QR results show that the relationship between the RMB price of gold
and exchange rates is more significant. The regression results of the relationship between RMB gold prices
against exchange rates are all below 0, which is consistent with the QR results in panel C of Table 7. The
USDRMB exchange rates decrease with the gold price of RMB at all quantile levels, which suggests that RMB
appreciates against the USD continuously during the sample period. The gold price effect on GBPRMB is close

International Journal of Development and Sustainability Vol.6 No.3 (2017): 130-148
142 ISDS www.isdsnet.com
to -1 at a low quantile level, while it decreases sharply at median and high quantile levels. The impact of the
RMB gold price on RURRMB exchange rates is almost horizontal and around -0.1 at different quantile levels
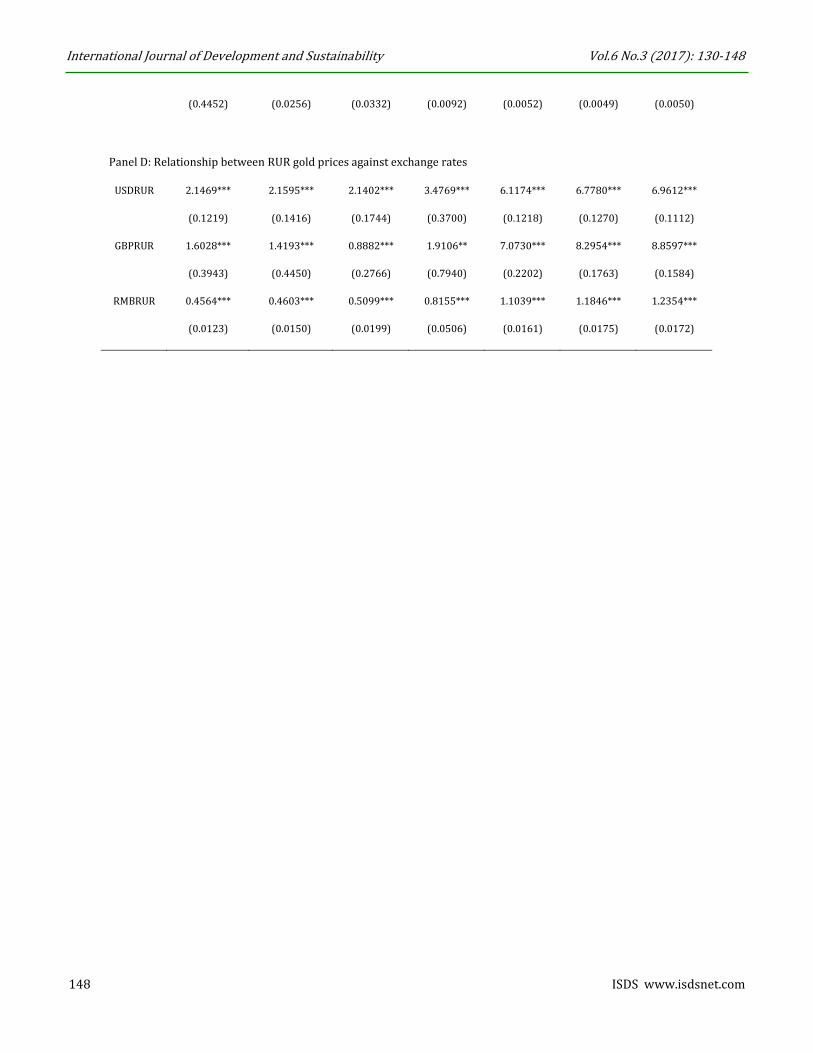
(see panel C, A4). From panel D, A4 we can see that the QR results are all above 0, which is consistent with
the QR results of panel D, Table 7, suggesting that RUR depreciates against the other three currencies
continuously during the sample period.
The empirical results can be explained by the real economic background. The 2005 RMB exchange rate
reform is the result of internal and external appreciation pressures. As a result, the RMB exchange rate
appreciated over the next 10 years. Therefore, the empirical results after 2006 are more significant due to
the appreciation of the RMB exchange rate and the increase in volatility.
Due to space considerations, we do not provide a detailed description of the above process in this paper.
However, the entire empirical analytical process can be found in the Appendix.
5. Conclusions
Numerous previous studies have noted that gold prices in USD are correlated with weaknesses in USD
relative to other currencies. Pukthuanthong and Roll (2011) point out that the same phenomenon occurs for
other currencies and, probably, for all freely convertible currencies. That is, a rise of the price of gold in a
currency (Dollar, Euro, Pound, Yen) is associated with depreciation in the currency (Dollar, Euro,
Pound,Yen)’s value, not just for USD, but also for other currencies (Euro, Pound, Yen).
However, our research results show that. (1) At least for the sample period under observation, there is no
stable long-run relationship among gold prices and bilateral exchange rates. (2) By classifying the currencies
into strong (RMB), weak (RUR), and anchor (USD or GBP) currencies, a negative relationship is indeed found
between the price of gold in some currencies and the exchange rate of a weak currency such as RUR and INR.
However, a positive relationship is found between gold price and the exchange rate of a strong currency.
1. We also test the relationship between INR gold price and its exchange rate with other currencies
and the results are also significant.
2. Since the gold price is, typically, at least four orders of magnitude greater than the exchange rate,
we amplify the exchange rate by multiplying it by 10,000 both in OLS and QR. Accordingly, the
significance of regression is not changed by doing so.
References
Baur, D.G. and Lucey, B.M. (2010), “Is old a hedge or a safe haven? An analysis of stocks, bonds and gold”,
Financial Review, Vol. 45 No. 2, pp. 217–229.
Baur, D.G. and Mcdermott, T.K. (2010), “Is gold a safe haven? International evidence”, Journal of Banking &
Finance, Vol. 34 No. 8, pp. 1886-1898.

International Journal of Development and Sustainability Vol.6 No.3 (2017): 130-148
ISDS www.isdsnet.com 143
Beckers, S. and Soenen, L. (1984), “Gold: More attractive to non-U.S. than to U.S. Investors?”, Journal of
Business Finance & Accounting, Vol. 11 No. 1, pp. 107–112.
Beckmann, J., Czudaj, R. and Pilbeam, K. (2015), “Causality and volatility patterns between gold prices and
exchange rates”, North American Journal of Economics & Finance, Vol. 34, pp. 292-300.
Bialkowski, J., Bohl, M.T., Stephan, P.M. and Wisniewski, T.P. (2015), “The gold price in times of crisis”,
International Review of Financial Analysis, Vol. 41, pp. 329–339.
Blose, L.E. and Shieh, J.C. (1995), “The impact of gold price on the value of gold mining stock”, Review of
Financial Economics, Vol. 4 No. 2, pp. 125–139.
Capie, F., Mills, T.C. and Wood, G. (2005), “Gold as a hedge against the USD”, Journal of International Financial
Markets, Institutions and Money, Vol. 15 No. 4, pp. 343–352.
Chen K.H., Lee, J.M. and You, C.H. (2014), “Who upholds the surging gold price? The role of the central bank
worldwide”, Applied Economics, Vol. 46 No. 22, pp. 2557–2575.
Dickey, D.A. and Fuller, W.A. (1979), “Distribution of the estimators for autoregressive time series with a unit
root”, Journal of the American Statistical Society, Vol. 74 No. 366, pp. 427–431.
Govett, M.H. and Govett, G.J.S. (1982), “Gold demand and supply”, Resources Policy, Vol. 8 No. 2, pp. 84–96.
Joy, M. (2011), “Gold and the USD: hedge or haven?”, Finance Research Letters, Vol. 8 No. 3, pp. 120–131.
Koenker, R. and Bassett, G. (1978), “Regression quantiles”, Econometrica, Vol. 46 No. 1, pp. 33–55.
Kwiatkowski, D., Phillips, P.C.B., Schmidt, P. and Shin, Y. (1992), “Testing the null hypothesis of stationary
against the alternative of a unit root”, Journal of Econometrics, Vol. 54 No. 1–3, pp. 159–178.
Ming, L., Yang, S.G. and Cheng, C. (2016), “The double nature of the price of gold—A quantitative analysis
based on ensemble empirical model decomposition”, Resources Policy, Vol. 47 No. 1, pp. 125–131.
Phillips, P.C.B. and Perron, P. (1988), “Testing for a unit root in time series regressions”, Biometrika, Vol. 75
No. 2, pp. 335–346.
Pukthuanthong, K. and Roll, R. (2011), “Gold and the USD (and the Euro, GBP, and Yen)”, Journal of Banking &
Finance, Vol.35 No. 8, pp. 2070–2083.
Reboredo, J.C. (2013), “Is gold a safe haven or a hedge for the U.S. Dollar? Implications for Risk Management”,
Journal of Banking and Finance, Vol.37 No. 8, pp. 2665–2676.
Reboredo, J.C. and Rivera-Castro, M. (2014), “Wavelet-based evidence of the impact of oil prices on stock
returns”, International Review of Economics and Finance, Vol. 29 No. 1, pp. 145–176.
Sjaastad, L.A. (2008), “The price of gold and the exchange rates: once again”, Resources Policy, Vol. 33 No. 2,
pp. 118–124.
Sjaastad, L.A. and Scacciavillani, F. (1996), “The price of gold and the exchange rate”, Journal of International
Money and Finance, Vol. 15 No. 6, pp. 879–897.
International Journal of Development and Sustainability Vol.6 No.3 (2017): 130-148
144 ISDS www.isdsnet.com
Appendix
——Tables A1–A4 here——
A1. OLS results for 1995–2005
0
1
Unit roots of residuals
Coefficient Std. error Coefficient Std. error ADF DF-GLS PP KPSS
Panel A: Relationship between USD gold prices against exchange rates
GBPUSD 11238.94*** 230.97 14.72*** 0.67 -2.0740 -1.2415 -2.0498 0.3073
RMBUSD 1195.74*** 1.44 0.04*** 0.00 -0.4485 0.6281 -0.5953 0.5880**
RURUSD 390.20*** 160.41 1.10*** 0.47 -1.8948 0.7616 -2.0337 2.3746***
Panel B: Relationship between GBP gold prices against exchange rates
USDGBP 7244.18*** 149.56 -5.00*** 0.71 -1.9973 -1.3570 -1.9242 0.5681**
RMBGBP 868.17*** 17.87 -0.57*** 0.09 -1.9658 -1.4506 -1.8903 0.5299**
RURGBP -200.05*** 129.17 3.24*** 0.62 -1.4246 1.1339 -1.4610 2.5753***
Panel C: Relationship between RMB gold prices against exchange rates
USDRMB 83529.25*** 99.69 -0.28*** 0.04 -0.3300 0.7170 -0.4765 0.6294**
GBPRMB 93941.60*** 1939.07 14.38*** 0.68 -1.9596 -1.2582 -1.9385 0.2846
RURRMB 2757.79*** 1348.79 1.27*** 0.48 -1.8636 0.8019 -1.9954 2.3990***
Panel D: Relationship between RUR gold prices against exchange rates
USDRUR 37693.04*** 3964.77 24.53*** 0.47 -0.0579 -0.4740 -0.4871 0.7521***
GBPRUR 39405.02*** 4163.46 42.74*** 0.50 -0.2963 -0.6983 -0.9367 0.6857**
RMBRUR 4466.81*** 473.09 2.98*** 0.06 -0.2383 -0.5718 -0.4809 0.7526***

International Journal of Development and Sustainability Vol.6 No.3 (2017): 130-148
ISDS www.isdsnet.com 145
A2. The OLS results for 2006–2016
0
1
Unit roots of residuals
Coefficient Std. error Coefficient Std. error ADF DF-GLS PP KPSS
Panel A: Relationship between USD gold prices against exchange rates
GBPUSD 20167.84*** 210.39 -3.05*** 0.18 -1.9915 -1.8486* -1.9645 0.4759**
RMBUSD 1161.64*** 10.39 0.29*** 0.01 -1.8080 -0.9597 -1.7813 1.2098***
RURUSD 388.82*** 10.43 -0.06*** 0.01 0.4153 0.2606 -0.0911 1.4354***
Panel B: Relationship between GBP gold prices against exchange rates
USDGBP 4849.87*** 54.94 1.71*** 0.07 -2.1853 -1.9591** -2.0709 0.2861
RMBGBP 563.19*** 10.21 0.49*** 0.01 -1.9524 -1.9040* -1.7852 0.7865***
RURGBP 197.03*** 4.76 -0.01** 0.01 -0.2533 -0.2309 -0.2132 1.3713***
Panel C: Relationship between RMB gold prices against exchange rates
USDRMB 85004.15*** 707.59 -2.33*** 0.09 -1.8310 -0.6257 -1.7990 1.4251***
GBPRMB 170906.80*** 2678.08 -7.65*** 0.34 -1.7488 -1.5777 -1.6151 1.1724***
RURRMB 3214.18*** 99.93 -0.14*** 0.01 -0.0053 0.3703 -0.0536 1.7700***
Panel D: Relationship between RUR gold prices against exchange rates
USDRUR 119789.90*** 6817.15 5.58*** 0.15 -1.4215 -0.9457 -1.5149 0.6056**
GBPRUR 293522.80*** 11157.75 6.67*** 0.25 -1.2594 -0.8738 -1.4768 0.6624**
RMBRUR 11562.25*** 946.81 1.01*** 0.02 -1.6552 -1.2520 -1.7367 0.5598**
International Journal of Development and Sustainability Vol.6 No.3 (2017): 130-148
146 ISDS www.isdsnet.com
A3. QR results for 1995–2005
0.05 0.1 0.25 0.5 0.75 0.9 0.95
Panel A: Relationship between USD gold prices against exchange rates
GBPUSD 9.5745*** 10.6502*** 15.1879*** 17.1881*** 15.1960*** 17.1195*** 16.5757***
(0.8197) (0.9410) (1.2977) (1.5674) (0.8326) (0.5545) (0.4778)
RMBUSD -0.0504*** -0.0403*** -0.0273*** 0.0013*** 0.0007*** 0.1260*** 0.1381***
(0.0030) (0.0029) (0.0041) (0.0002) (0.0001) (0.0061) (0.0039)
RURUSD 0.1388 0.1398 0.0254 -0.0470 11.5177*** 4.2279*** 4.2093***
(0.0880) (0.1125) (0.1687) (0.2213) (0.7888) (0.8862) (0.6912)
Panel B: Relationship between GBP gold prices against exchange rates
USDGBP -12.6825*** -11.6852*** -7.0838*** -2.0246* -2.8917** -5.3604*** -5.7296***
(0.8576) (0.9086) (1.0432) (1.2069) (1.3013) (0.7161) (0.6859)
RMBGBP -1.5274*** -1.4134*** -0.7452*** -0.2512** -0.3977** -0.6904*** -0.7489***
(0.1034) (0.1101) (0.1495) (0.1019) (0.1577) (0.0888) (0.0850)
RURGBP -0.6667*** -0.6815*** -0.8908*** -0.6865* 10.7959*** 4.6321*** 4.5049***
(0.1686) (0.2160) (0.3259) (0.4176) (0.5606) (0.4190) (0.3263)
Panel C: Relationship between RMB gold prices against exchange rates
USDRMB -1.1768*** -1.0622*** -0.0057*** -0.0106*** 0.2280*** 0.3303*** 0.4161***
(0.0369) (0.0583) (0.0010) (0.0015) (0.0320) (0.0229) (0.0238)
GBPRMB 10.0838*** 10.9593*** 14.0394*** 16.7860*** 15.2071*** 17.0975*** 16.5617***
(0.7385) (0.6410) (1.3571) (1.7423) (0.8570) (0.5488) (0.4704)
RURRMB 0.1061 0.1087 0.0067 -0.0665 11.4899*** 4.2893*** 4.2799***
(0.0907) (0.1159) (0.1739) (0.2282) (0.7428) (0.8433) (0.6582)
Panel D: Relationship between RUR gold prices against exchange rates
USDRUR 20.8641*** 22.1259*** 23.2998*** 27.7195*** 34.4203*** 28.2416*** 29.2068***
(0.3331) (0.2488) (0.2871) (0.9470) (0.7943) (10.8494) (9.8861)
International Journal of Development and Sustainability Vol.6 No.3 (2017): 130-148
ISDS www.isdsnet.com 147
GBPRUR 37.6285*** 42.2444*** 43.2357*** 45.0294*** 42.0730*** 33.4880*** 31.3551***
(1.0467) (0.4564) (0.3030) (0.5679) (6.8062) (3.3284) (2.3107)
RMBRUR 2.5845*** 2.7084*** 2.8174*** 3.3495*** 4.1586*** 3.4145*** 3.5289***
(0.0299) (0.0263) (0.0334) (0.1148) (0.0960) (1.3120) (1.1953)
A4. QR results for 2006–2016
0.05 0.1 0.25 0.5 0.75 0.9 0.95
Panel A: Relationship between USD gold prices against exchange rates
GBPUSD 0.7821*** 0.6362** -0.5410 -2.1134*** -3.6104*** -4.2364*** -4.2962***
(0.2805) (0.2544) (0.4590) (0.2686) (0.1679) (0.1363) (0.1302)
RMBUSD 0.2876*** 0.2923*** 0.2926*** 0.2521*** 0.3442*** 0.3484*** 0.3472***
(0.0034) (0.0034) (0.0047) (0.0181) (0.0393) (0.0426) (0.0454)
RURUSD -0.0481 -0.2630*** -0.0844*** -0.0591*** -0.0558*** -0.0749*** -0.0877***
(0.2919) (0.0324) (0.0178) (0.0045) (0.0031) (0.0065) (0.0061)
Panel B: Relationship between GBP gold prices against exchange rates
USDGBP 1.8964*** 1.8767*** 1.7601*** 1.6500*** 1.5830*** 0.9960*** 0.5590***
(0.0387) (0.0440) (0.0562) (0.1175) (0.2316) (1.1088) (0.6260)
RMBGBP 0.4500*** 0.4666*** 0.4847*** 0.5290*** 0.6289*** 0.3705* 0.3438*
(0.0062) (0.0055) (0.0074) (0.0317) (0.0435) (0.1011) (0.0865)
RURGBP -0.2102*** -0.1721*** -0.0430*** 0.0076*** 0.0084*** 0.0024 -0.0107
(0.0119) (0.0124) (0.0148) (0.0019) (0.0031) (0.0041) (0.0091)
Panel C: Relationship between RMB gold prices against exchange rates
USDRMB -0.6239 -0.8643 -2.0275*** -1.6667*** -2.5479*** -2.6662*** -2.6385***
(1.1679) (1.3137) (0.4868) (0.1552) (0.0620) (0.0395) (0.0374)
GBPRMB -1.1222** -1.2615** -0.9299** -4.8117*** -9.0679*** -8.7897*** -8.6290***
(0.4946) (0.5485) (0.4562) (0.8573) (0.2013) (0.1681) (0.1878)
RURRMB 0.0000 0.2344*** -0.0190 -0.1452*** -0.1554*** -0.1592*** -0.1536***
International Journal of Development and Sustainability Vol.6 No.3 (2017): 130-148
148 ISDS www.isdsnet.com
(0.4452) (0.0256) (0.0332) (0.0092) (0.0052) (0.0049) (0.0050)
Panel D: Relationship between RUR gold prices against exchange rates
USDRUR 2.1469*** 2.1595*** 2.1402*** 3.4769*** 6.1174*** 6.7780*** 6.9612***
(0.1219) (0.1416) (0.1744) (0.3700) (0.1218) (0.1270) (0.1112)
GBPRUR 1.6028*** 1.4193*** 0.8882*** 1.9106** 7.0730*** 8.2954*** 8.8597***
(0.3943) (0.4450) (0.2766) (0.7940) (0.2202) (0.1763) (0.1584)
RMBRUR 0.4564*** 0.4603*** 0.5099*** 0.8155*** 1.1039*** 1.1846*** 1.2354***
(0.0123) (0.0150) (0.0199) (0.0506) (0.0161) (0.0175) (0.0172)