revised sve performance test report state …conjunction with the revised sve performance test...
TRANSCRIPT
Colder Associates Inc.305 Fellowship Road, Suite 200Mt. (aural, NJ USA 08064
REVISEDSVE PERFORMANCE TEST REPORTSTATE COLLEGE, PENNSYLVANIA
Prepared For
Ruetgcrs-Ncasc Corporation201 Struble Road
State College, PA 16801
Prepared by:
Colder Associates305 Fellowship Road, Suite 200
Mt. Laurel, NJ 08054
CDCO
DISTRIBUTION: «=>CO4 Copies - US Environmental Protection Agency . ^2 Copies - Pennsylvania Department Environmental Protection2 Copies • Ruetgers-Nease Corporation2 Copies - Colder Associates Inc.
November 1997 Project No.: 963-6333
OFFICES IN AUSTRAUA, CANADA, GERMANY, HUNGARY, ITALY. SWEDEN, UNITED KINGDOM, UNITED STATES

Ruetgers-NeaseCorporation" A subsidiary of RutgersAG
I ;201 Strubie Road. State College. PA 16801 Phone: 814-238-2424 • Fax: 814-238-1567
November 6, 1997
VIA FEDEX
Frank Klanchar (3HW22) Douglas OverdorffEPA Remedial Project Manager Department Project CoordinatorUnited States Environmental PA Department of EnvironmentalProtection Agency, Region III Protection, North Central Region841 Chestnut Building 208 W. Third StreetPhiladelphia, PA 19107 Williamsport, PA 17701
RE: Centre County Kepone Site, State College,Focused Feasibility Study and Revised Soil Vapor ExtractionTest Report
Dear Frank and Doug:
Section VI, Paragraph 13 of the Consent Decree and the Record ofDecision (ROD) for Operable Unit No. 1 (OU-1) provide Ruetgers-Nease Corporation (RNC) the opportunity to prepare and submit aFocused Feasibility Study (FFS) regarding the OU-1 remedy for soil(excavation) . Colder Associates Inc. (Colder) has prepared the FFSand the Revised Soil Vapor Extraction (SVE) Performance Test Reporton behalf of RNC for the Centre County Kepone Site in StateCollege, Pennsylvania. This FFS provides a detailed, analysis of anAlternative Soil Remedy (enhanced SVE with limited excavation) anda comparative analysis of the two remedies with regard to the NCPcriteria.
The Revised SVE Performance Report has been updated to provideadditional data collected during the long-term performance test andresponse to Agency comments as detailed in the July 8, 1996 commentletter. Also, additional soil data collected during the 1997 Pre-Design Investigation are included. The FFS should be reviewed inconjunction with the Revised SVE Performance Test Report..
This, letter is to request EPA to review and approve the combinedsoil remedy (SVE with limited excavation) as an alternative to theROD soil remedy (excavation) . RNC also proposes a meeting withinthe next few weeks to go over the FFS with you and your technical
AR309308

RNC
staff. Please do not hesitate to contact me at (814) 231-9200 toarrange a meeting or if you have any questions regarding thesedocuments.
Very truly yours,
Rainer F. DomalskiProject Coordinator
Attachmentscc: H. Greenberg
F. Gheorghiu (Colder)
AR309309

November 1997 -i- 963-6333
TABLE OF CONTENTS
Cover Letter
Table of Contents i
Executive Summary E-l
SECTION PAGE
1.0 INTRODUCTION....,...................
2.0 SITE SETTING,.................,..........»..........................,...,.,........................................,.......22.1 Site Name and Location..........................................,.................;........................... 22.2 Site Description.................................................................................................... 22.3 Site Geology and Hydrogeology ..,.,.,„.,.,.....,..».....„,.,...,..,..,.....,............. 32.4 Subsurface Soil Characterization ......,.,,...,,.,,..,.,.,.....,.,......,„........,.......... 42.5 Remedial Technology Description,......„,.,,..,.....,..,.,.„......,..,...„*...........,.. 52.6 Treatment Process and Scale..,.,..,,.....,.....,,,.,......,.,.....,..,.......,..............,.. 5
3.0 SVE PERFORMANCE TEST APPROACH,,..,....,,,.,,,,,.,,,,...,,....,..,....,..,...., 63.1 Initial SVE Performance Test.,,,,,,.,,,,,,,,,,,.,,,,,..,,,...,.,,,,....,,... 63.2 Short-Term SVE Performance Test .„,,,.,.„.,,,.„„,,„,„..„.,,„„,,,„.„.,,„„ 6
L / 3.2.1 Field Activities,..,,,,,.,.,.,,,.,,,.,,,,,..,.,»,..,,,,,..,,,.,,,,,,.,,.63.2.2 Sample Collection and Analysis .,.,,,,,.,.,,.,,...,,..,,.,,,,...,,,.,...,,.8
3.3 I ng-TeimSVETest.,..,,.,,.,....,,,.,,,.,.,;,,,.,,.,,,,,,,,,,,,.,,..,,,..,,.3.3.1 Field Activities.,,,,.,,,,,,..,,,,,,,»,,,,,,,,,,,.,,,,,.,.,,,.,...,,,83.3.2 Sample Collection and Analysis ..,,....,,,,,,,.,,,..,,,,,,,,,,,,.,.,,.,9
3.4 Quality Assurance/Quality Control ,,,,,,,.,,,,,,,,»,,,..,,,,,,.,.,,,,,,,,,,9
4.0 RESULTS AND DISCUSSION,,,,.....,.,,,,,,,,.,,,,,,.,,,,,,,,,,,,,,,,,.,.,, 114.1 Data Analysis and Interpretation,,,,.,.,.,,,,,,,,....,,,,,.,,,,,,,,,,,...,, 11
4.1.1 Short-Term SVE Performance Test ,,„„.,..,.,.,,..,,„„,,„.,..„,... 114.1.2 Long-Term SVE Performance Test.,..,,,.....,..,,....,,,,,-....,,,.:.....,.. 124.1.3 Conceptual SVE Design.,,.....,,,,.,,,..,,,,,.....,,,,.,,,,,..,,,..... 13
4.1.3.1 Introduction.,..,,.,,..,.,,,,,.....,,.....,...,...,,,..,.,,...,... . 134.1.3.2 Model Description.,...,,.,....,.,,....,,,,,,,..,,,,...,.,.,,.... 134.1-.3.3 Model Calibration,..,..,....,,,,,,,....,.,.,...,,,,......,,,....., 154.1.3.4 Conceptual SVE System ....„,,„......,..,„„,...,„„,...,„.,......., 174.1.3.5 Conclusions ....,.,.„....„,,,,,..,„,.;......,„.,».,„,,..,,,.....,. 194.1.3.6 Estimation of Cleanup Time .„.,...„.»;..„„.....,,,...„...,...„,. 20
4.2 Recommendations .,....,...„,..„.....„,...,.....„..,„,„..,„.....,„„,.„..,.....„.„, 22
5.0 REFERENCES .,,,,..,.,,,,,.,,,,,..,»,,,,..,»,,,»,,...,,.,.....,,,,»,..,...,...,.,,.24
Colder Associates AR 30 93 10

November 1997 - ii - 963-6333
TABLE OF CONTENTS (Cont'd)
LIST OF TABLES
Table 2*1 Soil Concentrations from Tank Farm AreaTable 3-1 TO-14 Data from Short-Term Performance TestTable 3-2 Mass Removal Rates at Extraction Well E-2 (Fractured Well) (Using Laboratory
VOC Data - Long-Term Test)Table 3-3 Mass Removal Rates at Extraction Well E-3 (Unfractured Well) (Using
Laboratory VOC Data - Long-Term Test)Table 3*4 Mass Removal Rates at Extraction Well BR-2 (Using Laboratory VOC Data
Long-Term Test)Table 3-5 Mass Removal Rates at Extraction Well E-2 (Short-Term Test Only)Table 3-6 Mass Removal Rates at Extraction Well E-3 (Short-Term Test Only)Table 3-7 Mass Removal Rates at Extraction Well BR-1 (Short-Term Test Only)Table 3-8 Mass Removal Rates at Extraction Well BR-2 (Short-Term Test Only)Table 3-9 TO- 14 Data from Long-Term Performance TestTable 4-1 Calibrated Model ParametersTable 4-2 Calibrated Model Extraction Air FlowsTable 4-3 Extraction Air Flows: Scenarios 1 to 4
LIST OF FIGURES
Figure 2-1 Site Location PlanFigure 2-2 Study AreaFigure 2-3 Interpreted Thickness of Overburden
Figure 3-1 SVE Performance Test Layout
Figure 4- 1 . Model Domain: State College Tank Farm AreaFigure 4-2 Model GridFigure 4-3 Schematic Cross Section of AIR3D Model LayersFigure 4-4 Tank Farm SVE Performance Test Calibrated ModelFigure 4-5 Tank Farm SVE System: Scenario 1Figure 4-6 Tank Farm SVE System: Scenario 2Figure 4-7 Tank Farm SVE System: Scenario 3Figure 4-8 Tank Farm SVE System: Scenario 4Figure 4-9 Tank Farm SVE System: Intermediate Design
Colder Associates A R 3 0 9 3 I t

November 1997 - iii - 963-6333
TABLE OF CONTENTS (Cont'd)
LIST OF APPENDICES
Appendix A Borehole and Well Installation LogsAppendix B Standard Operating ProceduresAppendix C PDI Analytical DataAppendix D SVE Model Hydrogeologic Properties MapsAppendix E Calibrated Model Pressure Contour Maps for Layers 3,4, 5,6, and 7Appendix F Soil Contaminant Mass CalculationsAppendix G Response to Agency Comments Letter dated July 8,1996
Colder Associates A R 3 0 9 3 I 2

November 1997 E-l 963-6333
EXECUTIVE SUMMARY
' ' . " ' ' ' ' ' ' . . .The Center County Kepone Site (Site) located in State College, Pennsylvania includes anoperating chemical manufacturing facility currently owned by Ructgers-Ncase Corporation(RNC). The RI/FS for the Site was completed in 1994. On April 24, 1997, the United StatesEnvironmental Protection Agency (USEPA) issued a Record of Decision (ROD) for the Sitedated April 21, 1995. The RI/FS determined that the Site posed no unacceptable risk based oncurrent use and the only unacceptable future risk was to potential future on-site residents,principally from groundwater exposure to volatile organic compounds (VOCs). The RODtherefore selected a remedy that includes the following elements on the RNC property to addressgroundwater and potential sources of contamination that could impact groundwater:
• Groundwater extraction and treatment, including both a source control component andmeans to prevent migration of contaminated groundwater off the RNC property; and,
• • Soil and sediment excavation, where possible, to remove VOCs which could impactgroundwater quality.
The ROD also clearly indicates that disruptions to plant operations shall be limited and that the^-^ facility remained operational.
Soil Vapor Extraction (SVE) was considered by the USEPA as an alternative to excavation andwas considered likely to be effective but potentially infeasible due to the low permeability of thesoils, perched water conditions and physical constraints of an operating manufacturing plant.USEPA therefore selected the excavation alternative, acknowledging that this alternative will notbe feasible at some locations and stating that "a pilot study should be performed to provide datato support the design of an SVE well system".
In response to the ROD, RNC undertook a program of .fall-scale field testing in late 1995,including an initial performance test followed by a 5 week (short-term) performance test. Along-term performance test was then initiated in January 1996 and completed on August 1,1996.While the long-term test was still ongoing, an original submission of this report (ColderAssociates, 1996) was submitted to the USEPA and the Pennsylvania Department ofEnvironmental Protection (PADEP, with USEPA. jointly referred to as the Agencies) on April 5,1996. .The Agencies formally commented on that report in a letter dated July 8, 1996. TOsRevised SVE Performance Test Report has been prepared to address the July 8, 1996 Agency
Colder Associates A R 3 0 9 3 I 3

November 1997 E-2 963-6333
comments and updates the report with the results from the long-term test. A Response toAgency Comments Document has been prepared and is provided in Appendix G of this Report. v jIn addition, results from the Pre-Design Investigation (PDI) soil sampling and analyses from theTank Farm Area have also been considered and are included in Appendix C.
In summary, the pilot test results demonstrated that SVE enhanced via hydraulic fracturing is aneffective means to withdraw large quantities of VOCs from the subsurface soil and will haveminimal impacts to plant operations. Technical concerns resulting from the low permeability ofthe subsurface soil and perched water conditions were resolved. Overall, the SVE technologyhas been proven to be a feasible and implementable technology for the site capable ofimplementing the overall remedial objectives, i.e., protection of groundwater within a relativelyshort period of time.
The following sections of this Executive Summary include a brief synopsis of the site conditions,the test program and the principal results achieved. The performance data has also been used tocalibrate a three-dimensional numerical airflow model for the site. Using the calibrated model, apreliminary conceptual design for an SVE system in the areas of concern on the RNC propertywas developed to illustrate the implementability of an SVE system in low permeability soils at , jthe Site. Finally, using the mass removal results from the long-term test, new subsurface soilquality data from the PDI, and a revised SVE design, an estimate of cleanup times for the TankFarm area was performed.
ConditionsThe Site is directly underlain by rock formations of the Loysburg Group and Bellefonte Group,both of which have been repeated as the result of a thrust fault which bisects the Site. Overlyingthe bedrock is a layer of residual soils and man-made fill. The residual soils are typically gray toreddish-brown silty clays Oikely from the Hagerstown-Opequam-Hublesburg Association) thatare the result of in-place weathering of the bedrock. Sand lenses have been observed in theclays. Fill materials generally are variable soils (from clays to gravels) that have been placed atthe Site for grading/construction and may include reworked residual soil. The interpretedthickness of overburden in the Tank Farm Area generally ranges between 10 and 20 feet Insome areas, soil/rock permeability is too low for the soil to completely drain and infiltrationrecharge is sufficient to create local perched (partially saturated) groundwater zones in the soiloverburden. Based upon soil descriptions, the depth of partial saturation associated with perchedconditions is inferred to range from approximately 5 feet to 15 feet below ground surface.
Colder Associates ' A R 3 0 9 3 I

November 1997 E-3 963-6333
Proceduret j An initial (24 hour) performance test was conducted in August 1995 using a single well in the
Tank Farm area and six monitoring points to assess potential airflows, vacuum heads, and radiiof influence. Based upon the results of this test a full-scale performance test was designed, alsoin the Tank Farm area, including the following features:
• 2 SVE Wells screened in overburden soils;
• 2 SVE Wells screened in shallow (unsaturated) bedrock; and,
• 16 monitoring points screened at various levels within the overburden and shallowbedrock.
Sand filled horizontal fractures were also installed from one of the overburden SVE wells using ahydraulic fracturing technique. The fracturing was monitored and controlled using state-of-the-art real-time resistivity and surface tilt-meter tracking of fracture propagation in the subsurface.Two fractures were installed at depths of approximately 12.5 feet and 14 feet bgs and propagatedapproximately 10 feet to 12 feet laterally from the well. Surface movements associated with thefracture installation were negligible and no disruption to plant operations occurred.
O • .A full-scale performance test of the system was undertaken for a 5 week period betweenNovember 20 and December 27, 1995. The following performance parameters were monitoredduring the test:
• Airflow rates;
• Vacuum heads in wells and monitoring points; and, •
• VOC .concentrations in extracted soil gas, by both field instruments and laboratory TO*14 analyses.
During the short-term performance test it was noted that water was present in the fracturedextraction well such that the fractures were submerged and unable to properly contribute toremoval of VOCs. Following completion of the test, the system was shutdown andmodifications were made to winterize the system and to provide a means to remove the perchedwater in the zone being treated by the pilot SVE well. The system was then placed back inoperation in January 1996 and was run continuously thereafter as a long-term performance test
v^y through July 1996. The following general conclusions from the performance test may be drawn:
Colder Associates A R 3 0 9 3 I 5

November 1997 E-4 963-6333
During the short-term test, the unfractured well (E-3) removed approximately 37 lb.(1.23 lb./day) of VOCs and the fractured well (E-2) removed approximately 46 lb. (1.53IbVday) of VOCs at well head vacuums of around 10 inches of mercury;
In the subsequent long-term test, following control of perched water in the fracturesystem, the rate of removal from the fractured well increased to 4.2 IbVday at the samewell wellhead vacuum, compared to the increase to 1.85 IbVday for the unfractured well;and
The radii of influence for the unfractured and fractured wells, based on monitoring pointmeasurements of induced vacuum, were approximately 15 feet and 40 feet, respectively.
A three-dimensional numerical model of subsurface airflow was constructed using the computercode AIR3D numerical model (Version 1.3, Joss & Baehr, 1995). The numerical model wascalibrated to the results of the short-term performance test and matched the field observations ofair flow to within 1 percent. The calibrated value of air permeability (4xlO"'° cm1) for theresidual soil was somewhat lower than published values for similar materials (Edwards & Jones,1994) and the radii of influence were also underestimated in relation to the field measurements.As a result conservative predictions are expected from the calibrated model, i.e., the model willtend to underestimate the performance of SVE.
Based on an extensive program of SVE performance testing and associated numerical modeling,the following conclusions may be drawn:
• SVE is a feasible and implementable remedy at the Site;
• Where necessary, hydraulic fracturing is effective in reducing the number of wellsrequired in low permeability soils. Fracturing can be monitored and controlled usingstate-of-the-art real-time resistivity and tilt-meter measurements such that 'adverseeffects on the plant operations can be avoided;
• Use of the natural "underdrain" provided by the unsaturated bedrock and the inducedundcrdrain provided by horizontal soil fractures further assists in overcoming potentialproblems associated with low permeability soils;
• The effects of perched water conditions, while present, can be mitigated by vacuumremoval, especially in the case of fractured wells; and
• Reasonable and implementable SVE wellfields could achieve cleanup in a relativelyshort period of time with minimal disruption to plant operations.
D:\PROJECTS\M3-«33\SVE\97FINAL\EXECSUM.DOC
Goldar Associates A R 3 0 9 3 I 6

November 1997 -1- 933-6333
1.0 INTRODUCTION
Colder Associates Inc. (Colder Associates) was retained by Ruetgers-Nease Corporation (RNC)to implement a pilot-scale fracture enhanced soil vapor extraction (SVE) performance test at theCentre County Kepone Site (Site), located in State College, Pennsylvania. The Tank Farm Areaat the facility was the focus of this testing effort RNC retained RE. Wright of Middletown,Pennsylvania to install, initially operate, and maintain the SVE system for the duration of the testSVE testing was conducted in three phases including an initial performance test, a short-termperformance test, and a long-term performance test.
The following sections provide the Site Setting (Section 2) and the SVE Performance TestApproach (Section 3). Section 4 provides Results and Discussion on the performance testing andassociated numerical modeling followed by References.
Colder Associates A R 3 0 9 3 I 7

November 1997 -2- 933-6333
2.0 SITE SETTING
2.1 Site Name and Location X-X
RNC owns and operates a chemical manufacturing plant in State College, Pennsylvania (Site).The plant on this Site has operated since 1958 when it was built and opened by Nease ChemicalCompany, Inc. (Nease), then the owner of the property on which the plant is located. As a resultof an acquisition in December 1977, RNC has operated the plant since then.
On September 8, 1983, the facility was placed on the Comprehensive Environmental Response,Compensation, and Liability Act (CERCLA) National Priorities List (NPL). Pursuant toCERCLA, as amended by the Superfund Amendments and Reauthorization Act of 1986 (SARA),Ruetgers-Nease and the United States Environmental Protection Agency (USEPA) entered intoan Administrative Order by Consent (AOC, EPA Docket No. IU-88-22-DC) on November 7,1988. The AOC stipulated that a Remedial Investigation (RI) and Feasibility Study (FS) beperformed at the Ruetgers-Nease facility (the Site) and specific off-Site areas (the Study Area).The Site and the Study Area together constitute the CERCLA Site evaluated in the RI/FS. TheRI Report (SMC, 1992, Golder Associates, 1993) and FS Report (Golder Associates, 1994)present more details on the regulatory setting for the Site, The RI was conditionally approved by ^**~SUSEPA on April 17, 1993 and the FS was conditionally approved on September 27, 1994. OnApril 24,1995, USEPA issued a Record of Decision (ROD) for the Site dated April 21,1995.
2.2 Site Description
The Site is located in College Township, Centre County, Pennsylvania, approximately two andone-quarter miles northeast of the Borough of State College. The Site occupies an area ofapproximately 32.2 acres and includes RNC's active manufacturing facility. The RNCmanufacturing facility is located on Route 26 and Struble Road about 3,000 feet north of theintersection of State Routes 322 and 26 (Figure 2-1). The SVE performance test study area islocated in the Tank Farm Area, which is southwest of Struble Road and Building #1 and adjacentto the Conrail tracks, as shown on Figure 2-2.
The topography of the Site (shown on Figure 2-1) is relatively gently sloping terrain located onthe northwest flank of Nittany Mountain. Ground surface elevations in the area range fromapproximately 1,090 feet above mean sea level (ft.MSL) near the railroad tracks to 1,120 ft.MSLin the southeastern portion of the Site. Surface water at the Site flows as runoff to a retention
Golder Associates A R 3 0 9 3 I 8

November 1997 -3- 933-6333
basin before being discharged to the on-site Fresh Water Drainage Ditch (FWDD), whichultimately discharges to Spring Creek.
The regional climate is temperate and wet, with precipitation occurring throughout the year.Average monthly temperatures range from a minimum of 24.7 degrees Fahrenheit (e F) inJanuary to a maximum of 71.6° F in July, with a mean annual temperature of 48.8° F. In 1996,monthly precipitation for the area ranged from 2.0 inches in February to 1 1 inches in September,with a yearly total of 59.3 inches.
In the immediate vicinity of the Site, the land use is predominantly industrial, commercial, andresidential. Residential dwellings are located along the southeast border of the Site.Commercial establishments are located along State Route 26 which is heavily traveled and runsadjacent to the Site. According to the Centre County Regional Planning Commission, the 1990population in College Township was 7,620, with a projected population of 8,400 by 1995. Localpublic water supply is provided throughout the surrounding area by the Lemont Water Company(SMC, 2992).
Soil associations in the vicinity of the Site are the Hagerstown-Opequon-Hublesburg Associationand the Murril-Clarksburg Association. In the immediate Site area, Murrill gravelly loams, andurban land soils are present. Subsurface soils in the vicinity of the production area consistmostly of fill material, clays, and silts (SMC, 1 992).
23 Site Geology and Hydrogeology
Characterization and subsequent subsurface remediation of a Site requires development of anunderstanding of the geologic and hydrogeologic systems controlling contaminant fete andtransport. The scope of the Site characterization described herein is primarily limited to theSite's uppermost zone .the associated local geologic and hydrogeologic controls. Additionalregional and local geologic and hydrogeologic settings are described in the RI Report (SMC,1992 and Colder Associates, 1993). .
The Site (Figure 2-1) is located in the Nittany Valley between Spring Creek and NittanyMountain. This area is directly underlain by rock formations of the Loysburg Group and
i Bellefonte Group, both of which have been repeated as the result of a thrust fault which bisectsthe Site (Colder Associates, 1994), Overlying the bedrock is a layer of residual soils and man-
Colder Associates A R 3 0 9 3 I 9
v_ </

November 1997 -4- 933-6333
made fill. The residual soils are typically gray to reddish brown silty clays (likely from theHagerstown-Opequam-Hublesburg Association) that are the result of in-place weathering of thebedrock. Sand lenses have been observed in the clay. Fill materials generally are variable soils(from clays to gravels) that have been placed at the Site for grading/construction and mayinclude reworked residual soil. The interpreted thickness of overburden in the Tank Farm Areagenerally ranges between 10 and 20 feet as shown on Figure 2-3.
The man-made fills and in-situ residual soils are generally dry to an approximate depth of 5 feetbelow ground surface (bgs) where perched water zones can be encountered. The truegroundwater table of phreatic surface in this area of the Site is about 25 feet bgs. Below theresidual soil* the bedrock is unsaturated and acts as a drain for precipitation, which percolatesdown from the ground surface to the bedrock. Where the bedrock is fractured or modified bydissolution, drainage is relatively rapid; however, where intact and unweathered bedrock isencountered, some lateral movement of the groundwater may occur along the soil/rock interface.This lateral movement occurs until a discontinuity (fracture, bedding plane parting, or solutioncavity) in the bedrock is intercepted, and the interface zone is then drained. However, in someareas, the soil/rock permeability is too low for the soil to completely drain and infiltrationrecharge is sufficient to create local saturated (perched) groundwater zones in the soiloverburden. Based upon soil boring logs (Appendix A) and soil descriptions, the depth of partialsaturation associated with perched conditions is inferred to range from approximately 5 feet bgsto 15 feet bgs.
2.4 Subsurface Soil Characterization
Based upon the data obtained during the RI and FS, the USEPA has determined that remediationof subsurface soils is needed at the Site in three areas: the Tank Farm Area, the Former DrumStaging Area and the Designated Outdoor Storage Area all of which are part of the operatingmanufacturing plant; Data collected during the RI indicates that these areas have significantcontamination from Volatile Organic Compounds (VOCs). The predominant VOCs detected inthese areas are aromatic hydrocarbons and chlorinated aliphatic compounds. The USEPA hasdetermined that removal of VOCs from the overburden soils in these three areas is necessary tobe protective of groundwater. Direct contact exposure to these soils does not represent anunacceptable risk based on current or reasonably anticipated future Site use scenarios. Table 2-1summarizes VOC data collected during the RI from boreholes located in the vicinity of the TankFarm Area. Additional soil data collected during the SVE performance tests are also
Colder Associates A R 3 0 9 3 2 0

November 1997 -5- 933-6333
summarized on Table 2-1. Appendix C presents data collected from the Tank Farm Area as part\^J of the Pre-Design Investigation (PDI) in April 1997.
2.5 Remedial Technology Description
The ROD for the Site specifies that the VOC contaminants in the soil should be removed throughexcavation so as to be protective of groundwater. The purpose of the present study is todetermine if SVE is a viable alternative to excavation, particularly when hydraulic fracturing isused to enhance the permeability of the overburden soils and when it could be implemented withonly limited disruption to plant operations. RNC has therefore undertaken a series ofperformance tests to gather actual field data to examine the effectiveness of this technique. TheTank Farm Area, which is the most highly contaminated, was selected as the focus of thesestudies; however, it is anticipated that this technique would also be applicable to the other lesscontaminated areas of the Site designated in the ROD.
2:6 Treatment Process and Scale
RNC has undertaken a phased approach for performance testing to assess the effectiveness ofI / SVE at this Site. In August 1995, an initial 24-hour single well performance test was performed
to assess whether this remediation technology was potentially applicable for the site-specificconditions and to determine key design parameters. The initial performance test is discussedfurther in Section 3.1. In November 1995, a short-term (5-week) performance test was initiatedusing multiple wells. Comparative data were gathered in this test for both fractured andunfractured soil conditions. The short-term performance test is discussed further in Section 3.2.At the end of January 1996, following enhancement to the system, RNC initiated a long-termperformance test, which concluded on August 1,1996 after 188 days of operation. The purposeof this test was to gather additional data on a continuing basis to demonstrate the long-termperformance of SVE. The long-term performance test is further discussed in Section 3.3.
Colder Associates A R 3 0 9 3 2 1

November 1997 -6- 933-6333
3.0 SVE PERFORMANCE TEST APPROACH
As noted in Section 1.3.1, a phased approach was used to conduct SVE performance testing atthe Site. The initial performance test was conducted over a two-day period in August 1995. Theshort-term performance test was conducted over a five-week period in November and December1995 and the long-term performance test was initiated in January 1996 was ongoing when theSVE Performance Test report was originally submitted to the Agencies on April 5, 1996.Subsequent to the April 5, 1996 submission, the long-term test was completed on August 1, 1996.The data provided in Tables 3-2 through 3-4 of revised report includes all long-term test data.
3.1 Initial SVE Performance Test
Colder Associates performed an initial SVE performance test in August 1995. Six piezometers(P-l through P-6) and one extraction well (E-l) were installed in the Tank Farm Area (Figure 3-1). Soil samples were collected from each of these boreholes and submitted to Centre AnalyticalLaboratories, Inc. (CAL) to determine VOC constituents and concentrations. These data aresummarized on Table 2-1. Pneumatic air flow testing was conducted and the results were usedto perform preliminary air flow modeling to assess the viability of SVE as a remedial alternativefor the Site. The results of this initial performance test were used to develop the approach for theshort-term performance test that was conducted in November and December 1995.
3.2 Short-Term SVE Performance Test
3.2.1 Held Activities
In preparation for the short-term SVE test, RNC contracted Colder Associates and their specialistsubsidiary Colder Applied Technologies, Inc. (GAT) to install extraction wells, monitoring probes,and sand filled horizontal hydraulic fractures in one extraction well. The locations of the SVEperformance test and these additional borings are shown in Figure 3*1. The ficldwork began onNovember 9, 1995. GAT conducted hydraulic fracturing at one extraction well located in theoverburden (well E-2). Two horizontal fractures, approximately 1 inch to 2 inches thick and 10 feetto 18 feet in diameter, were induced at approximately 12.5 feet bgs and 14feetbgs. Fractures wereinitiated using the patented "Fractool" system and filled with sand carried in a temporary viscous,propping fluid made of naturally occurring and biodegradable guar gum. The propping fluid isbased upon standard oil industry technology and contains a cross-linker which temporarilyproduces a highly viscous fracturing fluid which subsequently reverts to the viscosity of waterallowing the fluid to be removed leaving a sand filled fracture. In addition, ten (10) monitoring
Colder Associate* A R 3 Q 9 3 2 2

November 1997 -7- 933-6333
probes (M-l through M-10) were located around the fractured well (see Figure 3-1). FracturingV ; was carefully controlled through the use of two methods (tilt meters and active resistivity) to ensure
that the fractures were properly placed and did not disrupt utilities or encounter any obstructionsbelow the ground surface. Tilt meters are used to precisely measure the small amounts of groundheave, which occur during fracturing. The tilt of the ground, as well as flow and volume of theinjection fluid, are carefully monitored and real time calculations are performed to determine thegeometry and placement of the fracture. The active resistivity technique involves inducing anelectric current in the fracture fluid (100 Hz AC) and monitoring the induced voltage at the groundsurface. Through constant monitoring and real time calculations, the placement of the fracture canbe monitored and controlled. Both of these techniques were used in placing the fractures in well E-2 and the active resistivity technique was found to be the most effective in monitoring the fracturessince very little ground heave was detected. This is believed to be due to some compression of thefill material present above the overburden soils. The fracturing technique and associatedmonitoring technology arc described by Baker and Frere (1995), and Baker and Hocking (1995).
An additional (unfracturcd) overburden extraction well (£-3) and two additional bedrock extractionwells (BR-1 and BR-2) were also installed using hollow stem auger and/or air rotary drilling
\^ techniques. Wells BR-1 and BR-2 were screened approximately 10 feet into the bedrock as shownon the monitoring well installation field logs (Appendix A). Soil samples were collected fromboreholes BR-1 and BR-2 during drilling and submitted to CAL for analysis of VOCs. These dataare summarized on Table 2-1. Figure 3-1 shows the location of the extraction wells and monitoringpoints. Well drilling services were provided by Eichelbergers, Inc. of Mechanicsburg,Pennsylvania .under contract to Colder Associates.
RNC contracted R.E. Wright of Middletown, Pennsylvania to, install the SVE system. The systemwas installed during the week of November 13,1995 and began operation on November 20,1995.The system ran continuously with the exception of a 24-hour period on December 15, 1995. R.E.Wright performed initial startup operation and.maintenance and instructed RNC personnel in theoperation of the system. R.E. Wright operated the system for the first 3 days and visited the Siteonce every 5 to 7 days, thereafter. RNC made daily measurements from the system with theexception of those days R.E. Wright personnel visited the Site.
Colder Associates AR3 09323

November 1997 -8- 933-6333
3.2.2 Sample Collection and Analysis
Field performance measurements (flow, vacuum and VOC readings) were provided in tabular formto Colder Associates by R.E. Wright. The procedures used for collecting field measurements areprovided in Appendix B. Colder Associates used the data on these tables to calculate estimatedmass removal for each of the extraction wells over the course of the performance test. Air samplesfor TO-14 analysis were collected from E-2 and E-3 on November 15,1995 prior to start-up of thesystem and subsequently at specific time intervals from November 20, 1995 through December 4,1995. The procedures for collecting these samples are provided in Appendix B. These sampleswere submitted to CAL and the results of the analysis were provided in a report to RNC. Table 3-1provides a summary of the TO-14 results for SVE wells E-2 and E-3. These data clearly show anorder of magnitude increase in the concentration of VOC in the extracted vapors from the fracturedwell E-2 as the test progressed, indicating increasing performance with time. Golder Associatesalso used the laboratory VOC data to calculate estimated mass removal for each of the extractionwells over the course of the performance test. Tables 3-2, 3-3 and 3-4 show the flow, vacuum andlaboratory VOC data collected at various times during the short-term five week (37 day) test (aswell as for the long-term, 147 day test) for wells E-2, E-3 and BR-2, respectively. Tables 3-5, 3-6,3-7 and 3-8 show the flow, vacuum and field VOC readings collected at various times during the
short-term five-week test for E-2, E-3, BR-1 and BR-2, respectively.
33 Long-Term SVE Test
33.1 Field Activities
Based upon the data collected during the short-term SVE performance test, it was determined thatinstalling and operating a long-term SVE system in the Tank Farm Area would be beneficial inproviding additional data to demonstrate the effectiveness of SVE. Therefore, RNC commissionedR.E. Wright to build an improved header and treatment system to be contained in an insulatedbuilding. The system was installed in late January 1996 and began operation on January 26,1996.During the long-term, test, RNC personnel undertook daily field measurements. R.E. Wrightpersonnel visited the Site once a month to monitor operation and make any necessary adjustmentsto the system.
The new treatment system was housed in an insulated building adjacent to the Tank Farm area. Thesystem had a centrifugal condensate pump capable of removing solids. The system was alsoequipped with larger manifolds and two 1500 pounds (lb.). GAC units that result in lower back
Golder Associates AR30932U

November 1997 -9- 933-6333
pressure on the system. The system was completely heat-traced and had a fluid discharge line withdirect plumbing from the fluid knockout box to the existing on-Site treatment plant.
3.3.2 Sample Collection and Analysis
Initial start-up measurements, together with field measurements collected during operation of thelong-term SVE system for the month of February were available at the time of writing the SVEreport originally submitted to the Agencies on April 5, 1996. Data from air samples Submitted toCAL for VOC analysis using Method TO-14 are summarized in Table 3-9. These data togetherwith the field measurements have been used to determine mass removal rates. Data from the long-term test are presented in Tables 3-2 through 3-4 for wells E-2, E-3, and BR-2 respectively.Subsequent to the April 5, 1996 submission, the long-term test was completed and the dataprovided in Tables 3-2 through 3-4 of this revised report includes all long-term test data.
3.4 Quality Assurance/Quality Control
CAL used SW846 method 8260 for the analysis of VOCs in soil and method TO-14 for theanalysis of VOCs in air. All appropriate QA/QC procedures were used in the analysis of thesesamples.
Soil samples were collected during the initial performance test and the short-term performancetest. A field duplicate sample was collected from borehole P-5. The data indicates that the soilsin this area are somewhat heterogeneous. The same constituents were detected in both theprimary and field duplicate samples, however, the concentrations in the primary samples wereapproximately 30% to 40% higher than the concentrations in the field duplicate sample. Thistype of inhomogeneity is not uncommon in soil samples such as those collected from the TankFarm Area. The laboratory (CAL) performed matrix spike/matrix spike duplicate (MS/MSD)analysis on the soil samples collected from both the initial performance test and the short-termperformance test. Review of the results show that all QC criteria were achieved indicatingacceptable, analytical precision and accuracy and that VOCs were not detected in the methodblanks.
For the air samples analyzed by TO-14, Laboratory Control Samples were analyzed in duplicate.Additionally, a surrogate was used in the analysis of the samples. Review of the QC data shows
V y that all criteria were met indicating acceptable precision and accuracy for these analyses.
Colder Associates A R 3 0 9 3 Z 5

November 1997 -10- 933-6333
Additionally, the laboratory analyzed method blank samples for each batch of samples received.VOCs were not detected in any of the method blanks.
Overall, the QC samples collected during this study have shown that acceptable precision andaccuracy have been achieved in order to meet the objectives of the performance testing.
During the PDI, Golder Associates collected depth discrete samples in the Tank Farm Area tofurther characterize the subsurface soils in this area. The work was performed in accordancewith the Revised Remedial Design Work Plan (Golder Associates, 1997). These samples wereanalyzed for VOCs by CAL using method SW846 8260. Data summary tables for theseanalytical results are presented in Appendix C.
Colder Associate* AR 3 09326

November 1997 -11- 933-6333
4.0 RESULTS AND DISCUSSION
4.1 Data Analysis and Interpretation
The data collected during the SVE performance testing has been interpreted and utilized in twoways.
• Firstly, flow, vacuum and VOC concentrations were tabulated and graphed and massremoval rates were calculated (Tables 3-2 through 3-8). Sections 4.1.1 and 4.1.2describe this data analysis and interpretation .for the short-term and long-termperformance tests.
• Secondly, a numerical airflow model was developed and calibrated using theperformance test data. The model was then used to prepare a conceptual SVE system
1 design (see Section 4.1.3). This report does not present a final design of the system,however the conceptual design indicates the potential effectiveness and practicality of alull scale SVE remediation system at the Site.
4.1.1 Short-Term SVE Performance Test
Review of the data from the short-term SVE test showed that the mass of VOCs removed by, , extraction well E-2 was less than optimal given that the soils in this area of the site show higher
contamination (Table 2-1) and that this well was fractured to increase soil permeability. Inreviewing the field notes and the conditions encountered it was determined that E-2 contained waterat the bottom of the well for the duration of the test so that the fractures were submerged due to thepartially saturated condition of the overburden soils and the fact that the fractures acted as a conduitfor the perched water. The partially saturated condition of the overburden soils is attributable to theadverse weather conditions encountered during the test (snow and rain) and the build up of water inOverburden Sump No. 2. R.E. Wright personnel subsequently installed a sucker tube to remove thewater from the extraction well under vacuum but for the duration of the test, it would appear thatthe fractures were saturated. Therefore, E-2 never truly functioned as a fractured SVE extractionwell and as a result, the short-term test could not evaluate its true potential in this area of the Site.However, this indicates that induced horizontal permeable fractures will act as underdrains for lowpermeability overburden soils. This will allow recovery of contaminants in perched water leachedfrom the soil prior to any potential impact on groundwater quality. In addition, the bedrock wellswill play a similar role in removing contaminants leaching from overburden soils. Consequently,the SVE system will remove both perched water within the overburden and its associated VOCs aswell as VOCs from the subsurface soil matrix.
Colder Associates A R 3 Q 9 3 2 7

November 1997 -12- 933-6333
Review of Tables 3-2 through 3-8 shows that the removal mass for the system ranges between 51tt>ymo. (1.7 lb./day) in E-2 to 102 lb./mo. (3.42 lb./day) in E-3 based upon calculations performedusing the field VOC readings. Based upon the calculations performed using the total VOClaboratory concentrations reported by CAL, well E-2 removes approximately 37 lb./mo. (1.23lb./day) while E-3 removes approximately 27 lb./mo. (0.9 Ib./day). It is expected that E-2 wouldremove a greater mass of VOCs once the fractures have been dewatered due to the greater porosityof the fractured material. For the bedrock wells, BR-1 and BR-2, removal mass rates ranged from47 lb./mo. to 38 lb./mo., respectively.
Based upon the data from the five week test, it has been demonstrated that although the SVEsystem operated under the "worst case" scenario (adverse weather conditions, freezing pumps andvalves, low vacuums and flows) it was capable of removing significant quantities of VOCs fromoverburden soils. Therefore, RNC and Golder Associates considered that operation of the SVEsystem under better conditions together with certain enhancements/augmentation would improve
the system and offer an effective way of dealing with VOC contaminated soils. In particular it wasrecommended that any further SVE operation should allow for removal of perched water.
4.1.2 Long-Term SVE Performance Test
Tables 3-2 through 3-4 present the data from the long-term test (as well as the data from theshort-term test) using laboratory VOC data. Review of Table 3-2 for the fractured well E-2shows that mass removal has increased significantly since the short-term test was conducted.This increase in mass removal can be attributed to improvements made to the SVE system aswell as implementation of the perched water removal that dewatered the fractures. This tableindicates that over the course of the long-term test, the mass removed by the single fractured\SVE well (E-2) was approximately 617 Ib. Review of Table 3-3 for the unfractured well E-3shows that mass removal has also increased since the short-term test was conducted. Over thecourse of the long-term test, the mass removed by the unfractured SVE well (E-3) isapproximately 272 Ib.
Data presented in Tables 3-2 through 3-4, indicate the following:
• The SVE system is successfully removing VOCs from the soils in the Tank Farm area asshown by the elevated concentrations of VOCs detected in the laboratory analyzed airsamples;
Golder Associates A R 3 0 9 3 2 8

November 1997 -13- 933-6333
• Dewatering of the fractures in extraction well E-2 has improved the removal of VOCsfrom the fractured soil, which substantially exceeds the removal rate for the unfracturedweIlE-3;
• Well E-2 operates as originally expected; and,
• As shown in Table 3-4, substantial quantities of VOCs are also being removed from thebedrock well BR-2 (approximately 27 lb./mo.).
4.1.3 Conceptual SVE Design
4.13.1 Introduction
An SVE numerical model was developed for the Site using the performance test data forcalibration purposes. The calibrated model was then used to evaluate SVE as a remedialmeasure for the removal of VOCs at the Site. This modeling exercise was performed to illustratethe implementability and flexibility of an SVE system for the Site. This exercise was notconducted to offer a proposed or preferred system final design.
Section 4.1.3.2 presents a description of the computer code AIR3D, numerical model set-up,modeling assumptions, model parameters and boundary conditions. Section 4,1.3.3 describes themodel calibration process (using the short-term SVE field testing data) and calibrated modelresults. Section 4.1.3.4 presents a conceptual SVE System for the Tank Farm Area and thenumerical results from AIR3D simulations and Section 4.1.3.5 provides data interpretation andconclusions.
4.13.2 Model Description
AIRS D DescriptionThe Three-Dimensional Model of Air Flow in the Unsaturated Zone numerical program, AJR3D,was used to calculate the air flow rates, radii of influence and well head pressure values for acalibration and 4 different SVE scenarios. AHUD (Version 1.3, Joss & Baehr, April 1995)simulates movement of air in the vadose zone using the MODFLOW (McDonald and Harbaugh,1988) algorithms. While MODFLOW was designed to simulate groundwatcr flow systems, it ispossible to transform the variables in the groundwatcr flow equation to represent air flow.AIR3D was designed to incorporate pre- and post-processing modules with the MODFLOWmodel, providing an efficient and reliable system for designing vapor extraction systems.
Colder Associates AR309329

November 1997 -14- 933-6333
AIR3D was developed by Joss and Baehr (1995) under joint funding by United States GeologicalSurvey and the American Petroleum Institute. The development, function, and operation ofAIR3D and its component pre- and post-processors, as well as AIR3D model testing andcomparisons to analytical solutions are documented by Joss and Baehr (1995).
Air Flow Model Set-UpAs shown on Figure 4-1, a rectangular area of approximately 283 feet by 187 feet (l.l acres),centered about the former tank saddles and the area of existing SVE field testing was chosen forthe AIR3D vapor phase extraction modeling. The model grid consisted of 188 columns, 98 rowsand 7 layers, as shown on Figure 4-2. The central portion of the grid was equally spaced 1 footby 1 foot cells, with increasing spacing towards the edges of the model domain. All theextraction wells in the model are within the portion of the grid comprised of 1 foot spacings.Appendix D includes the air flow model set-up figures that show the distribution of the inputparameters in the modeling grid area. A brief outline of the air flow model set-up is presented inthe following paragraphs.
Figure 4-3 shows the model layer set-up in schematic cross section, for cover, soils and bedrockin the area of existing SVE wells BR-1, BR-2, E-2 and E-3. Layer 1 of the model was either a 4inch cover of open ground, asphalt or concrete. The spatial distribution of Layer 1 layer covertypes, with respective permeability values, is provided on Figure D-l. Layer 2 was a uniform,2.9 foot thick layer of fill material of approximate sandy-silt composition. Layer 3 was auniform, 8.1 foot thick layer of native, overburden material of silty-clay composition. Wherepresent, (see Figure D-2) layer 4 included a 2-inch thick sand-filled hydrofracture. Layer 5consists of the lowest overburden layer which is 1.5 foot thick native soil/overburden materialconsisting mostly of silt and clay. Where present, Layer 6 included another 2-inch thick sand-filled hydrofracture. The bottom layer of the model (Layer 7, Figure 4-3) was the unsaturatedzone of the bedrock present underneath the Site. A thickness of 4 feet for layer 7 was establishedusing the depths to groundwater data available for the Site.
The most important parameters necessary for AIR3D modeling are the layer thicknesses, theassociated permeability and porosity. The thickness established for each layer was calculated asan average from the borehole logs for wells PI to P6, El to £3, and BR-1 and BR-2. Porositiesof 0.30 and 0.35 were assigned to the fill-overburden materials and the bedrock, respectively.Permeabilities for the various media were initialized in the range from IxlO'7 cm2 to IxlO"12 cm2.
Colder Associates f lR309330

November 1997 -15- 933-6333
The final calibrated permeability maps for each layer are provided and discussed on Figures D-lI i to D-3 in Appendix D. .
The existing SVE wells BR-1, BR-2, E-2 and E-3 were set as constant pressure boundaries intothe model and used to calibrate the model to the field conditions occurring during theperformance test. Wells BR-1 and BR-2 are bedrock wells screened only in layer 7. Well E-3 isa fully penetrating overburden well screened in layers 3, 4, 5, and 6. Well E-2 is a partiallypenetrating overburden well screened in layers 3, 4 and 5. It is believed that at the time ofperformance testing, at least the lower hydrofracture of well E-2 (model layer 6) was saturated.Therefore, well E-2 was considered not to be screened in this layer, as the layer was fullysaturated. Since all wells were connected to a common header system, all wells were assigned aconstant well head vacuum of 0.35 atmospheres (atm) (about 11.9 feet of equivalent negativewater head, or 10.4 inches Hg). This was the average well vacuum for the four SVE wells, aspresented on Tables 3-2 and 3-3.
4.1.33 Model Calibration
, The model was calibrated by comparing model simulations to the results from the short-term (5^—^ week) SVE performance test conducted during November-December, 1995. This was
accomplished by holding the well head vacuums constant while adjusting the permeabilities forthe various site media from their initial values until an acceptable match between field andmodel extraction air flows were achieved. A criterion of +/- 10% between model and field airflow values (at standard temperature and pressure [STP]) was used for verification of model airflows. In addition, the approximate radius of influence, as defined by the 0.95 atm pressurecontour (approximately 1.7 feet of equivalent water drawdown), was used to fine-tune thepermeabilities once the appropriate air flows had been established.
Model radii of influence (as seen on Figure 4-4) for the calibrated model where about 11 feet forthe unfractured well and 19 feet for the hydrbfractured well, as compared to field values of 15feet to 40 feet. Due to the fairly coarse air monitoring layout and the uncertainty of air flowpathways, a finer calibration is not possible at this time. Table 4*1 provides the modelparameters for permeability, porosity and well head pressures used in developing the final"calibrated model".
Colder Associates A R 3 0 9 33 I

November 1997 -16- 933-6333
The model and performance test extraction air flows are compared in Table 4-2. For individualwells, model extraction rates are within 10% of the average performance test value. For the totalsystem of four SVE wells, the total model flow rate of 6.77 cubic feet per minute (scfin) iswithin 1.1% of the average performance test value. As shown by layers in Table 4-2, thedifferent air flow rates for the hydro fractured well (E-2) and the non-fractured well (E-3),calibrated by adjusting both the magnitude and ratio of permeability between the sand-filledhydrofracture and the native soil in overburden, was a key in establishing calibratedpermeabilities. In terms of magnitude, the final calibrated permeability value for the sand-filledhydrofracture was 1.2x10"°* cm2. In comparison, for example, during field venting testsconducted in alluvial sands, Edwards (1996) found a 6-test average permeability value of 8.2x10"'cm2. For the silty-clay, native soils in overburden, the calibrated permeability was 3.9x10"'° cm2.From experimental field testing in Iowa "soil-over-till" type horizons, Edwards and Jones (1994)determined permeabilities ranging from IxlO"05 cm2 for the uppermost soil (brown-black loam)to 3xlO"08 cm2 for the lower till material. The calibrated vertical permeabilities were typicallytwo times the horizontal permeabilities. This applied to all layers of the model. This greatervertical permeability has been reported by others (Edwards and Jones, 1994). Based on thesedata, it appears that the calibrated model permeability for sands is in good agreement withpublished data, whereas for the silty-clay native soil (Layer 3), the model permeability may below. It should be expected therefore, that model predictions for air flows from an SVE systembased on this calibrated model, would be conservative in terms of extraction of soil vapor fromthe native soil, possibly underestimating the air flows that might be sustained in the field.
Figures E-l through E-5 (Appendix E) provides the steady-state pressure contours and air flow
rates for the various model layers of the calibrated model. The closed pressure contours areshown around the extraction well pairs BR-l/E-2 and BR-2/E-3. As seen on these figures,depressurization has developed about paired wells BR-l/E-2 and BR-2/E-3* whose air flow rateshave been calibrated to field conditions. The maximum pressure drawdown is 0.35 atm. at thewell head (fixed boundary condition), with pressure drawdown radically decreasing withdistance from the extraction wells. Typically, the 0.20 atm vacuum (i.e., 0.80 atm well headpressure) lies at no greater distance from the extraction well than 1 foot. This general distance-pressure relationship was also shown by Edwards & Jones (1994) under similar groundconditions.
Golder Associates AR 309332

November 1997 -17- 933-63331 -—- - . . . .
In summary, based on the results of the calibrated SVE model for four wells located at the TankFarm area, extraction air flow rates measured during the performance testing (ranging from 1.4scftn to 1.8 scfm) can be sustained on a long-term basis. The model used overburden wellsscreened in predominantly 10"to cm3 permeability native soil and bedrock wells in 10"°* cm2
limestone. As shown in Table 4-2, the introduction of a single 2-inch thick hydrofracture of 10"01
cm3 sand can increase well extraction air flow rates by about 28%.
4.13.4 Conceptual SVE System
Having calibrated the model, the following categories of conceptual SVE designs (increasing incomplexity) were evaluated using computer simulations:
• Scenario 1: An additional 23 overburden wells added to the calibrated model (see FigureD-4 for model layout of these wells);
• Scenario 2: An additional 9 bedrock wells added to Scenario 1;
• Scenario 3: Asphalt capping added to of Scenario 2 in the areas of the site currentlyhaving open ground cover; and,
I J • Scenario 4: Addition of 3100 ft1 of 2-inch thick, sand-filled hydrofractures to layer 4 of^"^ the Scenario 3 model option.
The following scenario descriptions provide an assessment of the potential implementability andflexibility of an SVE system for the Site and are not intended as a proposed or preferred finaldesign. For the purpose of these simulations, all wells (bedrock and overburden) were operatedat a constant vacuum of 10.4 in-Hg (i.e. well head pressure ~ 0.65 atm), using the sameparameters as developed in the calibration run.
Scenario 1Figure 4-5 presents the results of a computer run that simulates a SVE system comprised of atotal of 25 overburden wells screened in layers 3, 4, 5 and 6, and 2 wells screened in bedrock.Only well E-2 was set with a sand-filled hydrofracture (layer 4) in its screened section (as for thecalibrated run). The additional overburden wells were placed in three rows of 8 wells each.Figure D-4 shows the location of the 25 overburden wells used in Scenarios 1 through 4. Asshown in Figure 4-5, the zone of depressurization has grown considerably from the performance
, test case, as the radii of influence begin to overlap one another. The zone of depressurization at^—^ or below 0.95 atm. (1.69 feet of equivalent water drawdown) is approximately 13,000 ft2 in area.
Colder Associates AR309333

November 1997 -18- 933-6333
Results from the simulation are provided in Table 4-3. As seen in Table 4-3, the total air flowrate for this SVE system can be conservatively estimated to be about 38 standard cubic feet perminute (scfm).
Scenario 2Figure 4-6 presents the results of a computer run that simulates a SVE system comprised of atotal of 25 overburden wells and 11 bedrock wells. As with Scenario 1, only well E-2 was setwith a sand-filled hydrofracture (layer 4) in its screened section. Therefore, the significant newelement to this scenario is the incorporation of a "wider-drain" system of bedrock wells. Figure
D-4 shows the location of the 11 model bedrock wells used in Scenarios 2 through 4.
As shown in Figure 4-6, the zone of depressurization at or below 0.95 atm. is approximately15,000 ft2 in area, a slight increase from Scenario 1. However, the important feature of thissystem is how the presence of bedrock wells (each operating at about 1.6 scfm in model layer 7)can substantially increase the area of depressurization at or below the 0.90 atm. and 0.85 atm.pressure contour elevations in layer 4 of the model.
As seen in Table 4-3, the total air flow rate for this 36 well system can be conservativelyexpected to be about 51 scfm. Overall the Scenario 2 SVE system is more likely to producestronger inward gradients under the Tank Farm area (i.e. capture zone) than a system consistingonly of overburden wells operating at comparable extraction air flow rates.
ScenariosFigure 4-7 presents the results of a computer run that simulates a SVE system comprised of atotal of 25 overburden wells and 11 bedrock wells (similar to Scenario 2), together with cappingof the open ground in the Tank Farm area. The "asphalt" capping (model layer 1) covered theexisting open area located between the former tank saddles to the west of Building 2, and therailroad spur further to the'west, an area of approximately 2000 ft2. .
As shown in Figure 4-7, the zone of depressurization continues to deepen as the radii of
influence increases for wells under the area of new capping. This increase in radius of influencedue to the presence of an impermeable cap is well documented in pneumatic testing theory andapplication (e.g. Joss and Baehr, 1995). Though the zones of depressurization at or below 0.95
Colder Associates A R 3 0 9 3 3 U

November 1997 -19- 933-6333
atm. and 0.90 atm. pressure contour elevations is approximately the same as for Scenario 2, the{j zone of depressurization at or below 0.85 atm. pressure has shown a moderate increase.
As seen in Table 4-3, the total air flow rate for this 36 well system can be conservativelyexpected to be about 48 scfm. This slight decrease in air flow rate is due to the impermeable capdecreasing the vertical flux of air into the model domain in the area of new capping.
Scenario 4 .Figure 4-8 presents the results of a computer run that simulates a SVE system comprised of atotal of 25 overburden wells and 11 bedrock wells (Scenario 2) with additional capping (Scenario3) along with the emplacement of about 3,100 ft1 of 2-inch thick sand-filled hydrofractures, arelatively small surface- area compared to the approximately 30,000 ft1 of area of Tank Farmlying within the capture zone of the SVE system. These lenses (approximately 200 ft2 in area)could be introduced in the field as 16 hydrofractures constructed during SVE well drilling.Figure D-5 of Appendix D shows the spatial distribution of these sand-filled hydrofractures atthe existing hydrofractured well.
V_X As was shown on Figures 4-4 to 4-7, the zone of depressurization has grown and deepenedthrough the addition of the various elements incorporated into the system. As seen on Figure4-8, with the addition of 16 hydrofractures, the zone of depressurization at or below 0.85 atm hascoalesced considerably in comparison to Figure 4-7. The total air flow rate for this 36 wellsystem can be conservatively expected to be about 52 scfm, or about 1.46 scfhi/well. This 8%increase in total system flow (a 14% increase in overburden air flows) from that of Scenario 3 ismoderate in terms of flow volume, but the strong effect on the development of the 0.85 atmpressure zone is significant.
4.133 Conclusions
Using a four-well model of the short-term performance test, a calibrated model was constructedand verified prior to its use in developing conceptual SVE designs. The critical issues that havebeen identified during this process are as follows:
• Non-hydrofractured, fully penetrating overburden wells (like SVE well E-3) shouldsustain a minimum steady-state extraction air flow rate of 1.4 scfm, as shown during the
. performance test and during model calibration. However, a native soil permeability ofV_^x 3.9xlO'10 cm3 was assessed for simulation of wells E-2 and E-3. This permeability is less
Colder Associates AR309335

November 1997 -20- 933-6333
than indicated by field observations and in other published studies, and thereforepossibly offers conservative estimates of extraction air flow rates;
Fracturing of single overburden wells to provide a lens of sand-filled hydrofracture witha permeability of 1x10'°" cnr can increase extraction air flow rates by 28% (field) to48% (model);
Bedrock wells act as effective "underdrains" for the overall SVE system, broadening thezone of depressurization at the 0.85 atm. pressure contour elevation while increasingtotal system extraction air flow rates by 33%;
Additional capping of currently open ground can increase the radii of influence for wellsunder the cap with only a slight (4.5%) decrease in extraction air flow rate (and henceslight decrease in contaminant mass extraction). Such a measure further deepens theoverall zone of depressurization and ensures greater certainty of contaminant capture.Additionally, this measure will reduce water infiltration through overburden soilsminimizing leaching of contaminants into groundwater; and,
At the scale of 1 acre (Tank Farm area), the incorporation of 16, 2-inch thick, 200 ft2
sand-filled hydrofracture s (0.1% by volume) in a 10 foot thick native soil overburden,significantly deepens the overall zone of depressurization at the 0.85 atm. pressureelevation, while extracting an additional 14% of total system air flow from wellsscreened in the overburden material. In addition, the sand-filled hydrofractures will actas "underdrains" for any contaminants leaching from overburden soils.
4.13.6 Estimation of Cleanup Time
Based on results from SVE modeling and field measurements of VOC concentrations in soil andvapor, soil clean up times can be estimated for a specified volume of soil at the Tank Farm Area.The methodology to determine cleanup times included:
• Estimate the area contained within a preliminary design soil vapor extraction systemcapture zone for the Tank Farm area;
• Calculate the mass of Total VOCs contained within the area of envisioned Tank FarmSVE extraction; and,
• Using field measured mass extraction rates, estimate a cleanup time for the area.
Based on the results of the preliminary modeling (Sections 4.1.3.4 and 4.1.3.5), a first-cut
refinement for a potential SVE system for the Tank Farm area was developed. This preliminarydesign is not intended to represent a proposed or preferred design, but serves to again illustratethat SVE can be effectively implemented at the Tank Farm area. Figure 4-9 shows the area ofinfluence for a 17 well system (12 overburden wells and 5 bedrock wells). The air flow
Golder Associates A R 3 Q 9 3 3 6
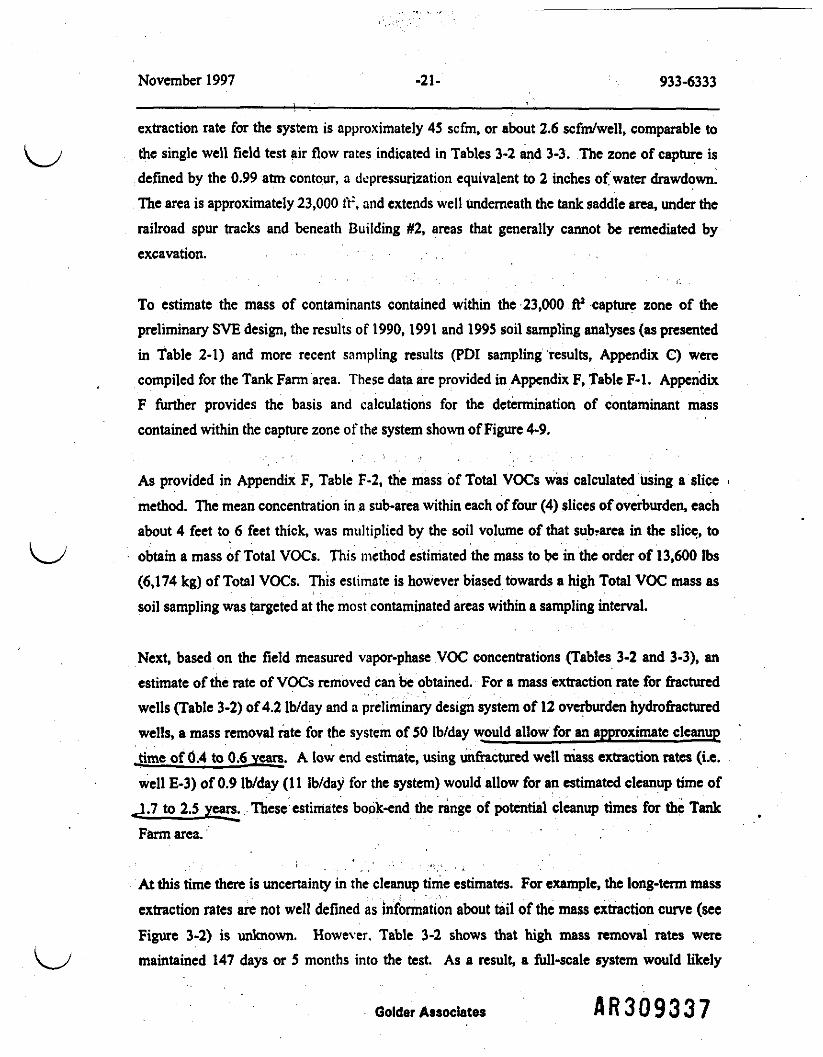
November 1997 -21- 933-6333
extraction rate for the system is approximately 45 scfm, or about 2.6 scfm/well, comparable toj the single well field test air flow rates indicated in Tables 3-2 and 3-3. The zone of capture is
defined by the 0.99 atm contour, a dcpressurization equivalent to 2 inches of water drawdown.The area is approximately 23,000 fr, and extends well Underneath the tank saddle area, under therailroad spur tracks and beneath Building #2, areas that generally cannot be remediated byexcavation. .
To estimate the mass of contaminants contained within the 23,000 ft2 capture zone of thepreliminary SVE design, the results of 1990, 1991 and 1995 soil sampling analyses (as presentedin "fable 2-1) and more recent sampling results (PDI sampling results, Appendix G) werecompiled for the Tank Farm area. These data are provided in Appendix F, Table F-l. AppendixF further provides the basis and calculations for the determination of contaminant masscontained within the capture zone of the system shown of Figure 4*9,
As provided in Appendix F, Table F-2, the mass of Total VOCs was calculated using a slicemethod. The mean concentration in a sub-area within each of four (4) slices of overburden, eachabout 4 feet to 6 feet thick* was multiplied by the soil volume of that subrarea in the slice, to
\ _ J obtain a mass of Total VOCs. This method estimated the mass to be in the order of 13,600 Ibs(6,174 kg) of Total VOCs. This estimate is however biased towards a high Total VOC mass assoil sampling was targeted at the most contaminated areas within a sampling interval.
Next, based on the field measured vapor-phase VOC concentrations (Tables 3-2 and 3-3), anestimate of the rate of VOCs removed can be obtained. For a mass extraction rate for fracturedwells (Table 3-2) of 4.2 Ib/day and a preliminary design system of 12 overburden hydrofracturedwells, a mass removal rate for the system of 50 Ib/day would allow for an approximate cleanup
Jime of 0.4 to 0.6 years. A low end estimate, using unfractured well mass extraction rates (i.e.well E-3) of 0.9 Ib/day (11 Ib/day for the system) would allow for an estimated cleanup time of
^1.7 to 2.5 years. TTiese estimates book-end the range of potential cleanup times for the TankFarm area. ' .
At this time there is uncertainty in the cleanup time estimates. For example, the long-term massextraction rates are not well defined as information about tail of the mass extraction curve (seeFigure 3-2) is unknown. However. Table 3-2 shows that high mass removal rates were
\^_y maintained 147 days or 5 months into the test. As a result, a full-scale system would likely
Colder Associates AR309337

November 1997 -22- 933-6333
exhibit a similar extraction rate for a similar amount of time, or longer. Importantly, thedemonstrated flexibility of an SVE system (wells can be placed in areas of higher soilconcentration, vacuum pressures can be increased, or decreased, more hydrofractures at differentdepths can be placed in each borehole) can address uncertainties associated with predictingcleanup times. In all, SVE at the Tank Farm area can be implemented with only limiteddisruption to plant operations, can effectively remediate VOCs, can treat a much greater area andmass of VOC than excavation, and can accomplish the remediation in a relatively short timeframe (conservatively less than three years).
4.2 Recommendations
It is recommended that SVE be utilized in place of excavation for the following principlereasons:
• A larger area/volume of soil may be treated by SVE since it is possible to install wellsclose to existing buildings and at other locations inaccessible for excavation on theactive manufacturing facil i ty. The overall protection of human health and theenvironment, i.e., protection of groundwater, is therefore enhanced;
• Unsaturated bedrock may be effectively treated by SVE. Based on the results obtainedin this study, the "soil" vapor extracted from an unsaturated bedrock well containedsignificant VOC contamination which would not be addressed by excavation and couldimpact groundwater. Bedrock SVE in conjunction with the planned bedrockgroundwater extraction is expected to be the most effective means of addressinggroundwater contamination issues at the Site;
• SVE minimizes the volume of waste and substantially reduces the short-termimplementation risks to workers and off-Site receptors associated with excavation andoff-Site transportation of VOC contaminated soil;
• SVE and treatment of the off-gas provides a higher degree of treatment than excavatedsoil dispersed of at a landfill and therefore better satisfies the USEPA's strategypreference for treatment.
• SVE is considerably more cost-effective than excavation and off-Site disposal and willprovide enhanced protection of human health and the environment, consequently, SVE isthe preferred cost-effective remedy;
• Based upon the new information generated in this study and as summarized in the tablebelow, SVE is preferred to excavation when evaluated in accordance with the remedyselection criteria established in the National Contingency Plan (NCP):
Colder Associates A R 3 Q 9 3 3 8

November 1997 •23- 933-6333
CriterionOverall protection
ARARs complianceLong-term effectiveness
Reduction of Toxicity,Mobility & Volume
Short-term effectiveness
ImplementabilityCost
ExcavationAdequate
None availableNot effective in some areas
Not effective in some areas
Much greater short-term risks,possibly shorter implementationtime may cause shutdown of plantoperationsNot implementable in some areasHiyher cost
SVEImproved (greater volumeremoved)None availableEffective over larger area, wouldremove greater quantities ofVOCsEffective over larger area,greater reduction of toxicity andvolumeReduced short-term risk, modestimplementation time, limitedimpacts to site operations
Implementable over larger areaLower cost
Assuming that SVE is adopted in place of excavation, it is recommended that a performancestandard be developed which is consistent with the remedial action objectives of "mitigatingleaching of VOCs from subsurface soil so as to be protective of ground-water, " A mass removalrate standard based on asymptotic performance is therefore recommended to ensure maximummass removal from soil and unsaturatcd bedrock to protect groundwater. Such a standard willallow for straightforward monitoring, particularly in the less accessible portions of the Site. Theperformance standards should also require some cycled operation in the latter stages of treatmentso as to maximize the mass removal consistent with the remedial action objectives.
COLDER ASSOCIATES
oddH.Refe,Ph.D.,P.E.Senior Environmental Engineer
Florin Ghetirghiu, P.O. ,Project Director and Principal
0:\PROJECTS\9«-6333\SVE\97FINAL\TXTREV;DOC
Golder Associates AR309339

November 1997 -24- 933-6333
5.0 REFERENCES
Baker, J.E. & Frere J.M. Use of Soil Fracturing to Enhance Soil Vapor Extraction: A CaseStudy, presented at Emerging Technologies in Hazardous Waste Management VII, AmericanChemical Society, Atlanta GA, September 17-20, 1995.
Baker, J.E., P.E., Hocking, G. Ph.D. Soil Fracturing for In-Situ Remediation and FractureEnhanced Bioventing, presented at the Eight International Institute on Gas TechnologySymposium on Gas, Oil and Environmental Biotechnology, Colorado Springs Co., December 11-13, 1995.
Edwards, K.B. Venting Test Analysis Using Jacob's Method, Jl. Environmental Engineering,vol. 122, no. 3, 1996.
Edwards, K.B. and L.V. Jones. Air Permeability from Pneumatic Tests in Oxidized Till, Jl.Environmental Engineering, vol. 120, no. 2, 1994.
Golder Associates Inc., 1995. Initial Performance SVE Test, October 1995.
Golder Associates Inc., 1993. Rucigers-Nease Chemical Company, Inc., Final RemediationInvestigation Report Revisions. October 1993.
Golder Associates Inc., 1994. Ruetgers-Nease Chemical Corporation, Feasibility Study Report,October 1993, revised July 1994.
Golder Associates, Inc., 1995. SVE Performance Test Report, April 1995.
Golder Associates Inc., 1997. Revised Remedial Design Work Plan, April 1997.
Joss, C.J. and Baehr, A.L., 1995. Documentation of AIR3D, an Adaptation of the Ground-Water-Flow Code MODFLOW to Simulate Three-Dimensional Air Flow in the UnsaturatedZone, U.S. Geological Survey Open-File Report 94-533.
McDonald, M.G. and Harbaugh. AAV., 1988. A Modular Three-Dimensional Ground-WaterFlow Model, U.S. Geological Survey Open-File Report 83-875. -
SMC Environmental Services Group, 1992. Ruetgers-Nease Chemical Company Inc., FinalRemedial Investigation Report, December 1992.
USEPA, 1989. Guide for Conducting Treatability Studies Under CERCLA, Interim FinalGuidance, EPA/540/2-89/058, December 1989.
USEPA, 1991. Guide for Conducting Treatability Studies Under CERCLA: Soil VaporExtraction, Interim Guidance, EPA/540/2-91/019A, September 1991.
Golder Associates A R 3 Q 9 3 ^ 0

TABLE 2-1SOIL CONCENTRATIONS PROM TANK FARM AREA
RNC FACILITY, STATE COLLEGE. PA
963O33
SmptolO SS-6(R1) tM*Cotoct*d Jw-01
Parametertan l OictanrMltMM
1.1.2-TifcWwMttwMTliCMMMttWM 3
TrtracMorattMMVinyl cMorid*tam-1.3-Dfehlorof>rop«MBMZMWTotoM
CMOnbMIZMM
ClnyBOTZ0IW
fl P^AyMfMft
»OCytaM
Chtonferm- 5AMBMM2-Butanon***ftMtytaMcNMidt" 8Cartxm DiwMktaTaHatiyJiolunnn-PropyttMnzMM2-cMonrtotoww1.3,5-TrinMthytMnzMM1.3,4-TrinMttiytMnzM*4-cMaratohJHwtaaprapyl IMTIZMM1.1 2-T«mchloaMlhafM 6
ToMVOCB 22
>BaA(RI) 8B3«(RI) SB3-C(RI)0*MK> 0^0 D^O
280 580 1900
280340 1000 22000
6100
02012000 28000 760000
8901500 5200 2700007500 23000 1300000
930 2300280 1600 2900
2600 5800 13000
510 12000
25040 65290 2302290
SB4-A(RI) SB4-B(RI) S84-C(RI) SB5-A(RI) S85-B(RI) BR-1 BR-2Dtc-90 DM-M OK-90 Dec-90 D*c-90 16-Nov-«5 14-Now4»5
37
• 68 78914 7117
24015 21
680 220 6 104
62 69 241300 310 9 41
30 230003
4900 610 340 30 5470 34 24 7
63 6 11 26 32 7
810142447357130
63
7191 1288 374 928 322 158 24936
P-2 P-3 P-1 E-1 P-« P-4 P-5 P-5 *4iOI-Aug-05 OI-AuQ-05 31-JuM>5 31-Jul45 02-Aug-9$ OI-Aug-BS OI-Aug-95 OI-Aug-BS
•
1170 2070 690 2870 3410 267000 1630001810 1190 26200 77600 40400
23000 158000 13900 45000 384 S6900 223000 123000
23100 34400 71400 56800 300 3670 29300 2130045400 73900 191000 101000 273 14200 51200 3280017900 39600 97700 24600 149 6730 13000 7740
539784 134
S910 1260 49400 6730 2180000 1350000
116480 310940 345674 280860 1770 117840 2841100 1738240
Al unto mn ugftg™ mfeta pracMt In Msocttted Hank*Btank tfwoM indnte ttwl HMlyte VMS (•xdudM S64-B, SB4 . SB5-A. SB5-B, BR-1, BR-2, P-fi Md MM Md dupicM* for P-5 •> UMM pointe
do ml s0om to tw.rvpraMnUlivt ol sol concanMkm* in ttw anm}
9-1863 6333 AR3093k l

1997 c c9634333
TABLE 3-1TO-14 DATA FROM SHORT-TERM PERFORMANCE TEST
MONITORING POINT E-2RNC FACILITY, STATE COLLEGE, PA
Sample IDDate Collected
Parametertrans-1,2-Dtehloroethenecte-1 ,2-iDicMoroelheneTrichtoroetneneTetrachtoroelheneBenzeneTolueneEttiyfcenzenem^>-Xyteneso-XyfeneMetfiytene cnkxfcto
Total VOCs
E-215-NOV-95
62.00033,00027.50031.00099.500176.200
0117,000
00
546,200
E-2 (2HR)20-Nov-OS
53.50024.600107.50036.100
0142.200198.00062.25033.00046,300
701,450
E-2 (4HR)20-NOV-95
16.30017.52528.50033.750
0208.000103.750135.00054,750
0
597.575
E-2 (8 HR)2Q-NOV-95
00
33.50056.25071,500192.250295.00028.50086.500
0
763.500
E-2 (24 HR)21-NOV-95
14.70043.30044,50054.00077,250202,000285,00080.50016,800
0
818,050
E-2(2OY)22-Mov-95
027.50014.82550.600
0287,500146.80048,20065.000
0
640.425
E-2 (7DY)27-NOV-95
0110.50086.250192.750120.000.53.000327.500183.000172.000
0
1.245.000
E-2 (14DY)04-Dec-95
2,4400
6.30024.900
070.70077,25045.25029.250
0
256,090
E-2 (21DY)11 -Dec-95
084.80089,200132.7508,270
580.000229.000121.750117.0006.030
1.368.800
E-2(28DY)18-Dec-95
041.000290.000332,500161,000
1.072,0001,602,000607,500285.000
0
4.391,000
E-2(37DY)27-Dec-95
042.050115.125149.30059.450945.15074.880259,300114.800
0
1.760.055
Note:al units are ppbv
COO
CO
ro
G:\F^OJECTS\963-6333\SVB97FINAL\To14data.xte -2 GoktorAtsodite* 1of3

November 1W7 963-8333
TABLE 3-1 .TO-14 DATA FROM SHORT-TERM PERFORMANCE TEST
MONITORING POINT E-3RNC FACILITY, STATE COLLEGE, PA
SamptoK)Dal*CoUftcted
Parametertrans-1 .2-Dfchloroetneneti»-1.2-OichloroeiheneTricWoroetheneTetrachtoroetheneBenzeneTolueneEftyfcenzenerajt-Xyteneso-XyteneMethytene chloride
Total VOCa
E-3IftJJnuJKIII'MUV 99
0a
133,20000
1.530.000392.000462.0001.146.000
0
3.665,200
E-3(2HR)SlkUtfMtJll*V IVUV 99
00
188.50000
422.500582.600
1.660.000796,000
0
3.851,600
E-3(4HR)20-Nov-ftS
00
140.50000
1.357.000277,000817.500365.000
0
2.957,000
E-3(6HR)3AJimt_ACmWnW^I9
5871.730
160.2502,1603.090
2.307.000422.500780,000356,000
0
4.035.317
E-3(24HR)21-Nov-ftS
00
109,50000
485.000422,500760.000356,000
0
2.155,000
E-3 (20 Y)22-Nov-ftS
00
80^500
87,500262.500221.000105,25033.500
0
790.000
E-3(7DY)27-Nov-ft5
00
122.00000
612.000500.000139.000720,000
0
2.093.000
E-3 (14DY)fU-O*eJk4V^^£QW^V9
00
271.00000
520,000257.00029,00027,500
0
1.104.500
E-3 (21 OY)4iJl*r*Jk4• l'WI#MV9
000
137.00024,700
0535.000277,500104.750900.000
0
1.978.950
E-3 (28 DY)1ftJVM>JMiv^/ov-n
00
59.25000
159.500125.75031,75021.700
0
397.950
E-3 (37 DY)2T.n*o-a«At -VVC-V3
00
77.60000
738,000615.000247.00091,000
0
1.768.600
Note:aluntearappbv
CO
CO•(=-CJ
t c 2of3

November 1997c. c
963-6333
TABLE 3-1TO-14 DATA FROM SHORT-TERM PERFORMANCE TEST
MONITORING POINT P-3RNC FACILITY. STATE COLLEGE, PA
Sample. IDDate Collected
Parametertrans-U-DCEcte-U-OCETCEPCEBenzeneTolueneEttiyfbenzenemj>-Xyteneso-XytenaMeCC
Total VOCs
P-315-Nov-W
14.45025.500325.000395.00032,000
633.800120.000367,000755.000
0
2.667.750
P-3(2HR)20-Nov-M
00
166,000356.00014.550
775.000292.000725.000610.000
0
2.960,550
P-3 (4HR)20-NOV-95
00
95.000335.000
0645.000163,000392.000500.000
0
2.130,000
P-3 (8HR)20-Hov-»5
00
139.00071,500
0645,000342,000293.000463.000
0
1.953.500
P-3(24HR)21-NOV-95
00
147.000375.000
0935.000365.000465.000492.000
0
2.779,000
P-3 (2DY)22-NOV-95
00
17.50000
222^5042,00017,475103.000
0
402,225
P-3 (TOY)27-NOV-95
00
158.000327.00053.000
827.000530.000
1.008.0001,062,000
0
3.965.000
P-3 (14DY)04-Oec-95
00
130,000475.000
0627,000457.000
1.220.000475.000
0
3.384.000
P-3 (21 DY)11-Dec-95
00
79.300446.000
0567.000412.5001.488,000972.000
0
3.964.800
P-3 (28 DY)18-O«c-95
0000
17.6250
1.725.000455.000
000
2,197.625
P-3 (840 HR)27-Oec-*5
00
128.000233.000
0755.000197,000720.000410.000
0
2.443.000
Notes:aflunttsppbv
30COOtoCO•IT4T-
G:\PROJECTSW63-8333\SVB97FINALVTo14datajds\P-3 GoUer AseocMM 3of3

Nov»mb«M997 9634333
TABLE 3-2MASS REMOVAL RATES AT EXTRACTION WELL E-2 (FRACTURED WELL)
(USING LABORATORY VOC DATA • LONG TERM TEST)RNC FACILITY. STATE COLLEGE, PA
Well E-2 (Fracturad Wall)
:CwtMniratlQn*(lnppfnv)ilttmMl.8,6.*id504 towtwHnuttdConcentration (H ppmv)«lu houn H torn Mmpto Mbcttd « Wo toon.VKuum dm Ihxn 1/31JM to not Mm mpwttd. TIM dm torn M«tup(l/WM)hMbMnuMd in tiptoe*.
260
100 160ftwiMnl ThM (Otyi)
Time
(Hr)
Tim*
(Day*)
Vacuum(Wall)(in Ho)
Flow(Vacuum)
(cfm)
Flow(STP)(cfm)
Cone.(VOC)(ppmv)
Cone.(VOC)(mart.)
Mass Removal(Instant)(mg/mln)
Mass Removal(Cumulatlva)
(g)
Mass Removal(Cumulatlva)
(Ib)
SHORT TERM TEST1.02.03.75.08.012.024.048.0168.0336.0504.0672.0868.0
0.0420.0830.1530.2080.333
O.S1.02.0
- 7.014.021.028.037.0
13.713.013.013.012.311.29.312.214.513.513.04.58.0
3.32.62.62.23.32.64.42.21.12.25.72.12.9
1.81.51.51.21.91.73.01.30.61.23.21.82.2
0.0701.5597.60.0
763.50.0
818.1640.41245.0258.11368.84391.01760.1
0.02.82.40.03.10.03.32.65.01.05.517.67.0
0.0118.6101.10.0
168.50.0
281.794.579.935.0496.3878.9429.4
0.07.117.217.247.647.6250.4386.5962.11315.16317.315176.820741.6
0.000.020.040.040.100.100.550.852.122.6913.9033.3945.63
LONG-TERM TEST0.0
312.0480.0672.01512.02160.03000.03528.0
0.013.020.028.063.090.0125.0147.0
10.510.810.811.310.310.510.310.5
2.12.90.03.24.75.16.45.3
1.41.90.02.03.03.34.23.5
805.4940.7857.5844.12665.23797.74862.14473.5
3.23.83.43.410.715.219.417.9
123.2200.20.0
191.6920.51421.12325.71756.2
0.03747.53747.55954.652347.7107601.2224616.3280453.5
0.08.28.213.1115.2236.7494.6617.0
160 200 ISO
AR3093I+5

Novtmbcr 1997 9634333
TABLE 3-3MASS REMOVAL RATES AT EXTRACTION WELL E-3 {UNFRACTURED WELL)
(USING LABORATORY VOC DATA - LONG TERM TEST)RNC FACILITY, STATE COLLEGE, PA
Wall E-3 (Unfractuntd Wall)
Tlma
(Hr)
Time
(Days)
Vacuum(Wall)(InHg)
Flow(Vacuum)
(cfm)
Flow(STP)(cfm)
Cone.(VOC)(ppmv)
Cone.(VOC)(mo/L)
Mass Removal(Instant)(mg/mln)
Mass Removal(Cumulative)
(0)
Mass Removal(Cumulative)
(Ib)
SHORT-TERM TEST1.02.03.75.08.012.024.048.0168.0336.0504.0672.0888.0
0.0420,0830.1530.2080.3330.51.02.07.014.021.028.037.0
10.29.89.59.59.09.56.29.010.512.811.04.57.5
2.22.61.81.71.72.22.21.11.71.15.70.91.9
1.51.81.21.11.21.51.70.8 •1.10.63.60.81.4
0.03665.22957.0
0.04035.3
0.02155.0790.02093.01104.51979.0398.01768.6
0.014.711.80.016.10.08.63.26.44.47.91.67.1
0.0737.0402.30.0
527.30.0
425.768.8253.978.7602.335.6279.2
0.044.284.584.5179.4179.4486.0565.12413.13206.811293.711652.615271.2
0.00.10.20.20.40.41.11.3
/ 5.37.124.825.633.6
LONG-TERM TEST0.0
312.0480.0672.01512.02160.03000.03528.0
0.013.020.028.063.090.0125.0147.0
10.210.210.610.99.710.09.79.7
2.91.30.01.61.92.11.31.6
1.90.90.01.01.31.40.91.1
3345.37307.05779.57751.52495.69385.03927.61290.2
13.429.223.131.010.037,515.75.2
734.2714.60.0
698.6355.31472.1393.8159.0
0.013377.313377.323729.241638.498373.0118722.6123759.8
0.029.429.452.291.6
217.5261.2272.3
NoU:Conc«ntrMon«{lnppniv)«llmMl,S.I.MdKMConcwWMon (In ppmv)«tw houn k torn umpM coMctad « MO houn.
700.0
100 1MlUnival TkM (Oayi)
200
M.O ———————————————————————————————14.0
f 12.01.10.0
l »I «I"
UB
A ~^^/y~~ ——0 W 100 ISO 200 290
MMMnl TkM (Myi)
ztt634333\>vt\97flnal\Sv«hardjd«\tibl«3-3 QoMtr AuaetetM
A R 3 0 9 3 U 6

November 1987 963-6333
TABLIMMASS REMOVAL RATES AT EXTRACTION WELL BJtt(USING LABORATORY VOC DATA-LONG TERM TEST)
RNC FACILITY, STATE COLLCOE. PA
Time
«Hr)
Time
tDave)
Vacuum<W»H)(InHg)
Well BR-2 (Bedrock WeH)
Flow(Vacuum)
(efmt
Flow(STP)(cfm»
Cone.(VOC)(ppmvl
Cone.(VOC)(mnl)
SHORT-TERM TEST1.02.03.75.06.012.024.048.0166.0336.0604.0672.0668.0
0.0312.0460.0672.01512.02160.03000.03526.0
00000112714212637
0.013.020.028.063.090.0125.0147.0
12.011.011.311.011.011.08.011.012.013.011.04,67.6
10.410.S10.811.010.08.99.49.8
3.3222.2222.23.3t.1224A3.34.60.94.2
8.13.60.0424.7423.63.6
2.01.41.41.4M2.10.81.42.61.92.90.63.1
LO3.32,30.02.63.1282.52.4
190.0120.010.06.0
120.0400.0200.0700.04500.0650.0317.01209.01800.0
MO-TERM TE,2806.0•54.41525.82348.31919.732240.0
1058.7
0.760.480.040.020.481.600.802.8018.002201.274.84750
IT11.223.626.109.397.661.290.004.23
Masa Removal(Inatant)(mil/mint
Mass Removal(Cumulative)
(a)
Masa Removal(Cumulative}
(ft)
42.518.91.60.918.994.516.3110.31343.2116.3103.5108.2627.0
1055.4252.60.0
699.76737101.60.0
290.3
2.63.73.63.97430.0432
202.09673.211045.112086.713179.421305.9
0.04726.64728.812789.046717.350668.650668.859665.8
0.00.00.00.00.00.10.10.421.7 .24.326.629.046.9
0.010.410.428.1102.8111.5111.5131.7
Nctt: Concentrations (In ppmv) at timea 1,5,8. and 504 houra eatimeted- Concentration (In ppmv) at 868 hours Is from sample collected at 840 hours.
Vacuum oat* from 1/31/96 has not been reported. Thadala from startup (1/26/96) has been used in tt* place.Concentration! for days 0 through 37 and 197 are from fleU measurements. Samples (or laboratory analysts not collected.
.g. 300.0
SO 100 150 200 250Removal Time (Daya)
100 200 300Removal Time (Days)
3£11-01
1,0
* .1*.
*\ ——— ——— t t \ 8
1 1 1 ———— \ —— ——SO 100 150 200 2 0
Removal Time (Days)
r\963-6333\ava\971toaJ\Svehardjd*«ala3'4 Oolder Associates
UR3093U71 or i

November 1997 063-6333
TABLE 3-5RNC FACILITY, STATE COLLEGE, PA
Masa Removal Rataa at Extraction Well E-2 SHORT-TgRM TEST ONLY(USING FIELD DATA)
Wall E-2
Time
(Hr)
1.02.03.75.06.012.024.048.0168.0336.0504.0672.0888.0
Tlmo
(Dayi)
00000112714212837
Vacuum(Well)(In HQ)
13.713.013.013.012.311.29.312.214.513.513.04.56.0
Flow(Vacuum)
(cfm)
3.32.62.62.23.32.64.42.21.12.25.72.12.9
Flow(STP)(cfm)
1.81.51.51.21.91.73.01.30.61.23.21.82.2
Cone.(VOC)(ppmv)
1000.01000.01000.0500.01000.01000.01000.04390.02500.0850.0103.0
5500.04210.0
Cone.(VOC)(mo/L)
4.04.04.02.04.04.04.017.610.03.40.422.016.8
Mass Removal(Instant)(mg/mln)
202.6169.1169.170.5220.7187.1344.3647.9160.5116.237.3
1100.91027.1
Mass Removal(Cumulative)
(g)12.222.339.244.984.6129.5377.41310.42466.23637.94014.315111.428422.7
Mass Removal(Cumulative)
(Ib)
0.00.00.10.10.20.30.82.95.48.08.833.262.5
Not*: Concentrations (In ppmv) ar* from RE WrtgM fltld nMdlngs.
10 13 20 29Ramowl Tkns (Days)
30 35 40
18 20 25Removal Tkm (Days)
10 16 20 25Removal Time (Day*)
30 35 40
11/5/9715:43
0 elder Associate*AR3093U8
PageloM

November 1897 963-6333
TABLE 3-6 .RNC FACILITY, STATE COLLEGE, PA
Mass Removal Rates at Extraction Well E.a SHORT-TERM TEST QMI V(USING FIELD DATA)
Wall E-3
Timo
(Hr)
1.02.03.75.08.012.024.0
.48.0168.0336.0504.0672.0888.0
Time
(Dayt)
00000112714212837
Vacuum(Well)(in Hg)
10.29.89.59.59.09.56.29.010.512.811.04.57.5
Flow(Vacuum)
(cfm)
2.22.61.81.71.72.22.21.11.71.15.70.91.9
Flow(STP)(cfm)
1.51.81.21.11.21.51.70.81.10.63.60.81.4
Cone.(VOC)(ppmv)
1000.01000.01000.0500.01000.01000.01000.0
22000.010000.06500.01962.016000.09100.0
Cone.(VOC)(mfl/L)
4.04.04.02.04.04.04.088.040.026.07.8
64.036.4
Mass Removal(Instant)(mg/min)
164.2201.1136.163.6130.7170.1197.61916.61213.1463.4795.41431.91436.6
Mass Removal(Cumulative)
(0)
9.921.935.640.664.2105.0247.23007.111741.016412.124429.738863.657481.9
Mass Removal(Cumulative)
(Ib)
0.00.00.10.10.10.20.56.625.836.153.785.5126.5
Nott: Concentrlllons (In ppmv) iff from RE WrigW field readings.
25000
140.0
0.010 18 20 35
Rwnovil Tana (Dayt)
10 15 20 25 30Kamoval Tim (Days)
35 40 15 20 26 30Kamoval Tim* (Days)
11/5/8715:42
Oolder Associate*
A R 3 0 9 3 U 9Page 1 of 1

November 1907 BQ34333
TABLE 3-7RNC FACILITY, STATE COLLEGE, PA
Mass Rftmpyal flates at Extraetfpp Well BR-1 SHORT-TERM TESJ QN|,Y_(USING FIELD DATA)
W«ll BR-1
Time
(Hr)
1.02.03.75.08.012.024.048.0168.0336.0504.0672.0888.0
Time
(Days)
00000112714212837
Vacuum(Well)(In Hg)
12.512.012.011.511.510.59.011.514.512.711.05.07.2
Flow(Vacuum)
(cfm)
0.61.82.21.82.20.61.10.21.73.25.61.99.8
Flow(STP)(cfm)
0.31.11.31.11.40.40.80.10.91.83.51.57.4
Cone.(VOC)(ppmv)
10.00.00.00.00.00.00.014.4
700.0110.059.0
1600.02070.0
Cone.(VOC)(mart.)
0.00.00.00.00.00.00.00.12.80.40.26.48.3
Mass Removal(Instant)(mo'min)
0.40.00.00.00.00.00.00.2
67.422.923.6280.81735.9
Mass Removal(Cumulative)
(g)
0.00.00.00.00.00.00.00.3
485.8717.1954.83784.626282.3
Mass Removal(Cumulative)
(Ib)
0.00.00.00.00.00.00.00.01.11.62.18.3
57.8
15 20 25 30ftomoval Tknt (Days)
10 15 20 25 30Removal ThM (Days)
10 15 20 25 30Itomoval Tin* (D*ya)
11/5/97 15:42
QoMer AwoclatM
A R 3 0 9 3 5 0Page 1 of 1

November 1987 963-6333
TABLE 3-8RNC FACILITY, STATE COLLEGE, PA
Mass Removal Rataa at Extraction Well BR-2 SHORT-TERM TEST ONLY(USING FIELD DATA)
W0II BR-2
Tim*
(Hr)
1.02.03.75.0e.o12.024.048.0168.0336.0504.0672.0888.0
Tim*
(Day»)
00000112714212837
Vacuum(Well)(in Hg)
12.011.011.311.011.011.06.011.012.013.011.04.57.8
Flow(Vacuum)
(cfm)
3.32.22.22.22.23.31.12.24.43.34.60.94.2
Flow(STP)(cfm)
2.01.41.41.41.42.10.81,42.61.92.90.83.1
Cone.(VOC)(ppmv)
190.0120.010.06.0 ^
120.0400.0200.0700.04500.0550.0317.01209.01800.0
Cone.(VOC)(ma/L)
0.80.50.00.00.51.80.82.818.02.21.34.87.2
Mast Removal(Instant)(mgmiln)
42.518.91.60.918.994.518.3
110.31343.2116.3103.5108.2627.0
Mass Removal(Cumulative)
(0)
2.63.73.83.97.3
30.043.2202.09873.211045.112088.713179.421305.9
Mass Removal(Cumulative)
(Ib)
0.00.00.00.00.00.10.10.4
21.724.326.6 .29.046.9
8000
BO.O
11 20 «R«M«val ThM (Dayt)
» W
Naaiaval TMia (Day*)
11/5/9715:41
OoUtrAuoditM
f lR30935lPageloM

No/^ 1997 c 963-6333
TABLE 3-9TO-14 DATA FROM LONG-TERM PERFORMANCE TEST
MONITORING POINT E-2RNC FACILITY, STATE COLLEGE, PA
Date Collected
ParameterTrichtoroetheneTetracNoroethenetrans-l -DteWoroetheiwcis-1 .2-DfcrUoroetneneBenzeneTolueneEthytoenzeneChlorobenzenem&p-Xyteneso-Xytene4-Chlorotoluene2-CtitorotolueneChloroform1,2-DJchtorobenzeneTrichkxometnaneTotal VOCs
31 -Jan-96Q 5 days
5400089500
000
320000128000
0150000562507600
0000
805350
08-Feb-96Q 13 days
8520083000
03180044750285000149000
0186500655009950
0000
940700
15-Feb-96ff 20 days
104000105000
0. 26000
48000170000170000
017200062500
00000
857500
23-Feb-96ff 28 days
68000335001035012000 .
0317500104000
024400054750
00000
844100
29-Mar-96<g> 63 days
15000097500
000
962500322500
0562500460000110175
0000
2665175
2S4pr-96® 90 days
681250165000
0180001350002050000245000
0387500108750
00
720000
3797700
30-May-96 .@ 125 days
2460002490000
0810061000
1460000234500
026000091800
00
53600
53244862084
21-Jun-96Q 147 days
99900323500
0427507540
223000257000
03275000240250
00.0
45250
4473465
COCD1OCJcn
Notes:Al units are ppbv
g:\pfd(ects\963-633\sve\97finaI\To14rev.x)s\E-2 GoMerAstodatm 1of5

November 1997 963-6333
TABLE 3-9TO-14 DATA FROM LONG-TERM PERFORMANCE TEST
MONITORING POINT E-3RNC FACILITY, STATE COLLEGE, PA
Date Collected
ParameterTrichtoroetheneTetracMoroethenetrans-1 ,2-Dichtoroethenecis-1 ,2-DichloroetheneBenzeneTolueneEthytoenzeneChtorobenzenem&p-Xyteneso-Xytene4-Chtorotoluene2-CMorotoluene
Total VOCs
31-Jan-96@ 5 days
14150044000
000
1327500602500
072250045500052250
0
3345250
08-Feb-96fy 13 days
920000212750
077500
026590001550000
01782500
0105250
0
7307000
15-Feb-96tgf 20 days
214250166750
000
18250001040000
01720000690000123500
0
5779500
23-Feb-96@ 28 days
8400097250
000
28500001390000
02625000600000105250
0
7751500
29-Mar-96@ 63 days
8225000
1757524200
1040000425000
0625000144250137500
0
2495775
25-Apr-96Q 90 days
968750675000
000
27430001981000
01712500128100023750
0
9385000
30-May-96Q 125 days
290000000
322502112500505000
058750037250027800
0
3927550
21-Jun-96<Q 147 rifws
9800024400
02580011300511300203000
014700022200047400
0
1290200
coCDV0CJcnca
Notes:AH units are ppbv
J63-633\sve\97final\To14rev.xls\E-3 iociates C 2 0(5

No/ 1997 C C 963-6333
20CO
COCJ1
TABLE 3-9TO-14 DATA FROM LONG-TERM PERFORMANCE TEST
MONITORING POINT BR-1RNC FACILITY, STATE COLLEGE, PA .
Notes:Al units are ppbv
Date Collected
ParameterTrichtoroetheneTetrachkxoethenetrans-1 ,2-Dtehtoroetheneos-l -OtehtoroetheneBenzeneTolueneEthyfbenzeneChkxobenzenemAp-Xyteneso-Xytene4-Chlorotolueoe
TotalVOCs
31 -Jan-96@ 5 days
160500427500
000
29500097000
014700039250
0
1166250
08-Feb-96@ 13 days
58200272000
0117750
016475039500
010200025700
0
779900
15-Feb-96@ 20 days
0174500
00
3770018000041500
01092502880094000
665750
23-Feb-96@ 28 days
NSNSNSNSNSNSNSNSNSNSNS
NS
29-Mar-96@ 63 days
NSNSNSNSNSNSNSNSNSNSNS
NS
25-Apf-96@ 90 days
NSNSNSNSNSNSNSNSNSNSNS
NS
g:\projects\963-633Vive\97ftnaI\To14rev.x(s\BR-1 Gokter Associates 3of5

November 1997 963-6333
TABLE 3-9TO-14 DATA FROM LONG-TERM PERFORMANCE TEST
MONITORING POINT BR-2RNC FACILITY, STATE COLLEGE, PA
Date Collected 31 -Jan-96 OB-Feb-96 15-Feb-96 23-Feb-96 29-Mar-96 25-Apr46 30-May-96 21-Jun-96© 5 days @ 13 days @ 20 days @ 28 days @ 63 days @ 90 days @ 125 days @ 147 days
ParameterTrichkwoetheneTetrachlofoethenetrans-1 ,2-Dtchtoroethenecis-1 ,2-DfcNoroetheneBenzeneTolueneEthylbenzeneChlorobenzenem&p-Xyleneso-Xytene4-CWorotoJuene
17400097500
000
1267000745000
0277500245000
0
0236700
000
140700332500
058500186000
0
7100043750
000
550000169500
0557500134000
0
150000134250
000
1345000350000
086000165750117250
6250042250
01937542120802500337500
043250010300078000
3200023800
000
10600054500
058000392508800
NSNSNSNSNSNSNSNSNSNSNS
11500049500
08430013200
44400079700
014300010300027000
Total VOCs 2806000 954400 1525750 2348250 1919745 322350 NA 1058700
CJCDtOCJcnen
Notes:AN units are pptov
63-6333\sve\976naI\Tol4revjds\BR-2 .oclates C 4 of 5

,997 c c 963-6333
enen
TABLE 3-9TO-14 DATA FROM LONG-TERM PERFORMANCE TEST
MONITORING POINT P-3RNC FACILITY, STATE COLLEGE, PA
Data Collected
ParameterTrichtoroetheneTetrachkHoethenetrans-1.2-Dichloroethenecis-1 -DtchtoroetheneBenzeneTolueneEthytbenzeneChtorobenzenem&p-Xyteneso-Xytene2-Cnlorototuene4-Chtorotoluene1,4-Dfchkxobenzene
Total VOCs
6 5 days
NSNSNSNSNSNSNSNSNSNSNSNSNS
NS
08-Feb-9€6 13 days
NSNSNSNSNSNSNSNSNSNSNSNSNS
NS
15-Feb-96@ 20 days
NSNSNSNSNSNSNSNSNSNSNSNSNS
NS
23-Feb-96@ 28 days
150000145000
000
42750001115000
01977000485000
041250
0
8188250
29-Mar-96@ 63 days
47000177000
000
1022500392000
0617500327500
015725052000
2792750
25-Apr-96@ 90 days
968750675000
000
27430001981000
01712500128100023750
00
9385000
3Q-May-96@ 125 days
25250087250
00
39500592000100250
010600021500
000
1199000
21-Jun-96@ 147 days
13400063900
03390
18100484000204000
0110000170000
000
1187390
roCOCD
Notes:AB units are ppbv
g:\proJect5\963^333\sve\97ftiaI\To14rev.xls\P-3 Colder Associates 5of5

November 1997 963-6333
TABLE 4-1CALIBRATED MODEL PARAMETERSRNC FACILITY, STATE COLLEGE, PA
Permeability (Horizontal)
Open ground k - 3.0 x 10"1 cm2 Layer IAsphalt k« I.Ox 10'" cm2 Layer 1Concrete k - 1.0 x 10'12 cm2 Layer 1Fill (sandy - silt) k'- 3.0 x 104 cm2 Layer 2Overburden (silty - clay) k - 3.9 x 10'10 cm2 Layer 3 & 5Sand filled fracture k - 1.2 x 10'' cm2 Layer 4 & 6Unsaturated bedrock k * 1.8 x 10** cm2 Layer 7
* Vertical permeabilities for all layers approximately two times respective horizontalpermeabilities (see text for discussion).
Porosity
Fill, overburden, sand fracs » 0.30Limestone bedrock • 0.35
Well Head PressureBR-1 ££ ££ BR-2
Model 0.65 0.65 0.65 0.65Field 0.64 0.61 0.69 0.65
All pressures in atmosphere (atm)Field » mean value for well pressure as obtained from Tables 3-4 - 3-7 (eqt: Well Head
Pressure «* 1 atm (SIP) - well vacuum, 1 atm « 29.92 in Hg).
i:\projects\963-6333\sve\97fmal\tab4-t.doc
Golder Associates AR309357

November 1997 963-6333
TABLE 4-2CALIBRATED MODEL EXTRACTION AIR FLOWS
RNC FACILITY, STATE COLLEGE, PA
ModelLaver
34567
Model Total
Field Total 1.7
Extraction Air Flow Rate (cftn)Ed
1.8 1.4
0000
1.801.80
0.920.720.3100
1.95
0.920.02
. 0.180.19JL.1.31
0000
LZl1.71
1.8
Notes: All flow rates in cubic feet per minute (cfin)Field = Mean value for air flow (DSTP) as obtained from Tables 3-4 - 3-7
G:\PROJECTS\963-6333\SVE\97FINAL\TAB4-2.DOC
Colder AssociatesAR309358

November 1997 963-6333
TABLE 4-3EXTRACTION AIR FLOWS: SCENARIOS 1 TO 4
RNC FACILITY, STATE COLLEGE, PA
Model
Calibrated
Scenario 1
Scenario 2
Scenario 3
Scenario 4
No. ofOverburden
Wells2
25
25
25
25
No. ofBedrockWells
2
2
11
11
11
Capping
No
No
No
. Yes
Yes
Hydro-fractures*
200ft2
200ft2
200ft2
200ft2
3,100 ft2
Total
V M6.8 2.6
38.3 14.5
51.0 19.3
48.8 18.5
52.6 19.9
OverburdenWells
V M3.2 1.2
35.3 13.3
33.4 12.6
31.9 12.1
36.3 13.7
BedrockWells
V M3.6 1.4
3.0 1.2
17.6 6.7
16.9 6.4
16.3 6.2
Notes:
* Sand-filled hydrofractures all 2 inches thickness.V • Extraction air flow rate in cubic feet per minute (cfm)M = Extraction mass flow rate in grams per second (g/s)
G:\PROJECTS\963-6333\SVE\97FINAL\TAB4-3.DOC
Golder AssociatesHR309359

AR30936Q
IMK 823-6112 AS 9KMMW/15/96PA17-310
07
SITE LOCATION PLAN
Golder A«srtriatp« [RUETGERS-NCASE 2-1

LAB SUPPLYSTORAGE **SHEDS
feet
AR30936
"»-• 923-6112wue
AS SHOWN04/05/96PA17-282
07
Colder Associates
STUDY AREA
InouAt_________________2-2

TANK FARM / BLNUMNQ *1 AREA
•J095
DESIGNATED OUTDOORSTORAGE AR
FORMERSTAGING
DRUM
LEGEND
•"*^,*<f>\\*r£^
*"£#&>*\\
f \%q
.- > CQ,
MW-11DenSTMC MONITORWC «EU
Rl PHASE I AND II
• SOL SORING ("SB") LOCATION(LOCATIONS APPROIOUATE)
PRE-DESIGN INVESTIGATIONA SOL BORING LOCATION
SVE PILOT TESTP-6 PIEZOMETER/MONITORING WELL
BEDROCK EXTRACTION WELL
OVERBURDEN EXTRACTION WELL
MTCRPRCTCD OVERBURDEN TMOCNCSSCONTOUR
APPROXMA1E AREA OF BEDROCKOUTCROP
NOTES1.) OVCRBURDEN THICKNESS CALCULATED FROM GEOLOOC
LOSS OF EXISTING SITE yOMTORING WELLS. PDIBORINGS. OUTCROPS AT THE SITE AND THE PDJGCOLOOCAL MVESHGATKM.
2.) THKXNESS CONTOURS HAVE BEEN MTERPOLATEDBETWEEN BOREHOLES. ACTUAL SITE CONDITIONS HAYVARY. CONTOUR MTERVAL IS 5 FEET.
1} OVERBURDEN AS OEFMED HCLUOES MAN-UAOE FLLAND E»STMG RESUUAL SOILS
AR309362
925-6112
100escole
100
NOV o a mifeet
AS SHOWN
11/05/97PA17-366
OS
Golder Associates
INTERPRETED OVERBURDENTHICKNt
RUETG£RS-»4EASE Ct> 2-3

oM-7
M-3O
MW-22S
p_j p_. FORMER TANK FARM
M-2O»*-»
SB-4
A88"8
LEQEND_J4W-2)S
-k P-€Y"
AS8-5
UOMTORMG HELL
SOL VAPOR MOMTOttHG WEU/KZOUCIERAPPRONHA1E)
U— 1"
SOLBORMO(LOCATION APPROMUATC)SOL VAPOR EXTRACTION VCLLOJOCATKM APPROXMAIE)
VAPOR EXTRACTION WELL
PROBE
feat
AR309363
ifc 923-6112 AS SHOWNos/25/*6
~ PA17-30905
o l £
SVE PERFORMANCE
RUETGERS-NEASE co» 3-1

AR30936U
023-6112
LEGEND
-M——K——*— FEMCE
, - UOMTORMG HELL
• - SW VELLW OVERBURDEN
- - S« WUM BEDROCK
NOTESL) RESULTS OBTAMED FROM MR3D® SMAAHON&
KR90N U4 APRL IMS.
NOV 0 o I3S724 0 24
approximate scat* fe*t
AS SHOWN03/2S/M
• PA17-25407
MODEL DOMAINSTATE COLLEGE
TANK FA'RNC/STATE COLU. 4-1

LEGEND
-*——K——K— FENCE
•$• UQMTCRNGMCU.
^ SVE WELL IN OVERBURDEN
-- SVE KU M BEDROCK
NOTES1.) RESULTS OBTMCD FROM ARJD* SMULATK3NS:
VER30N 1.13. APRIL 1999.
approximate seal* feat
AR309365
*»»»: 823-6112~» WUE
««« -pt/L*"* fc.
*«* AS SHOWN•** 03/12/K« H» PA17-3O5MMn>£ 07
Golder Associates
MODEL GRID
RNC/STME COLLEGE/PA j"** 4-2

1u.
\A* CI
UJ
ft.32
•01
'i.
W 8o z13 3
— 9,»»- = « =e*l otl M *^ CM
MOV 0 6 1997
011 **
923-6112
DWDTKTV
NOT TO SCAl£OATEt 11-05-07«"" PA17-367
SCHEMATIC CROSS SECTIONOF AIR3D MODEL LAYERS
Gidder Associates RUETGERS-NEASE CORPORATION 4-3

CINPUT PARAMETERS
AJR30GRID
mcs
CRND(cm')
-Oflj»i<r
ASPLT(cm*)
10 -'
CONC(cm1)
n~n
nu(cmZ)
3,10——
SOIL(cm1)
I*-1"
FRAC(emZ)
.**
BORK(cm')
IO-"1
PBH-2(atm)
OL«S
PEW-J(aim)
0-6S
PEW-2(atm)
0.6$
PBR-1(aim)
O.65
RESULTSTOTAL
ALL LAYERS
V 1 M(ctm) l(o /see)
*f
LEGEND
-K——X——X— FENCE
-ty- MONITORING WELL
-$- SVE WELL IN OVERBURDEN
-Kj- SVE WELL IN BEDROCK
CONTOURS OF ABSOLUTE PRESSURE
065 - 070 Mm
^H D.ra - a 73 aim
I I 0.7S - 08
0.00 - O.BS aim
O.BS - 0.90 aim
ft«0 - O.M atm
NOTESI } RESJLIS OBIMNED n«]H AJUJD* 5MULA1KMS: VCftSXM Hi.
Z } MKSSUK CMIOUHS IMCD4 HMM lAIOt 4
RESULTSI.J MOMOUM. CXIRACtMH <UIES
BR-I - 1-M elmBR-2 - I 71 dnEW-! =• 1-tS ctm
0 u24 _ 0 _ 24
approximate scale feet
flR309367
923-6112WME
AS SHOWN
03/25/96PA17-3O6
Colder Associates
TANK FARM SVEPERFORMANCE TESTCALIBRATE
RNC/STATE COLL\ 4-4

INPUT PARAMETERS
AKJOCRO
M4SVI
hCRND(cm^J
wi-J
ASPLT(cm*)
^——— J
COMC(«"2>
»-*
nu(cmZ)
J.10°*
SOL(cm^)
3.9.-11
FRAC(crn )
lW«
BORK(en.2)
»-"
PBR-2(otm)
O.6S
PE*-3(atm)
O.S5
Pew-2(aim)
a«s
PBR-I(atm)
0.69
RESULTS
ALL
V(elm)
Ml
J^YtRS
(g/tc)
14.5
OVERJ
V(elm)
J5.J
WROtN
H(g/Hic)
13.J
BEOi
V(e«m>
10
ROCK
(9/tcJ
LEGEND
-*——X——K— FENCE
-($»- MONITORING WELL
- - SVE WELL IN OVERBURDEN
- - SVE WELL IN BEDROCK
COMTOUR8 OF ABSOLUTE PRESSURE
0*9 - an otin
a aou>eo<r»o
090 - O.SS Mm
NOTESi.) HEUTS OBMKD mat «UD* SHUAINMS: vuoo. i.
a.) 29 OKDBUBDEH MOS. 2 BEDROCK KU&
i) ncssuHE cmiowH MKEM HKW UIER *
NOV 0 ti 193724 _0 24
approximate scale feet
923-6112WME
AS SHOWN03/25/96PA17-297
07
Colder Associates
TANK FARM SVE SYSTEMSCENARIO
RNC/STATE COLLEGE/. h5

•*VT PARAMETERS
AIR30GRID
IMSV2
CRNO(cm2)
-as1«IO
ASPLT(cm'}
W-1
CONC<cm*>
•o-11
FILL(em2)
imtO**
SOI.(cm1)
i..-1"
FSAC(cm»)
..z.-08
BOfiK(cm*)
,0-°"
PBK-^(otm)
O6i
Pt*-3(aim)
oes
pt*-^(otm)
061
PHK-t(aim)
0.69
RESULTS
ALL L
V(efm)
510
AYERS
(<jA«>193
OVtRE
V(Cfal)
334
JUfiOEN
tg/>«)n «
seraV
(efm)
17 •
?OCK
(g/lc)
67
AS SHOWN
03/25/96PAI7-29B
Golder Associates
LEGEND
X——*— FENCE
-& MONITORING WELL
- SVE WELL IN OVERBURDEN
SVE WELL IN BEDROCK
CONTOURS OF ABSOLUTE PRESSURE
0.65 - 0 70 atm
n O.TS - o.ao MR
0 SO - O.BS nln
O.BS - 0.90 Mm
Q.SQ - O.9S obn
COO»CDCOcc
NOTES1.) RESULTS OBTAMD FROM HKx SWULAHOWS; MCHSMM I IJ.
M>ML IM6.
Z.) SCEHAMO 2:
a) K OlCRBUMKH 1CUS, Z BCMOOl HELLS (SC£NAWO 1)
b.) « MOUKMAL BCOMOCX ICU.S
3.) PBCSa*E CONIOUftS IAKEN fftOM LM1ER 4
24
opproitimate scole feet
TANK FARM SVE SYSTEMSCENARIO 2
RNC/STATE COLLEGE/PA 4«6

HPUT PARAMETERS
AIR30GRD
RHSV3
kGRND(cm*>
fcld"
kASPLT(cm'}
10*"
kCONC(cm*>
,o-"
kFILL
(on2)
*HO°"
hSOL
(cm*)
wo"
kFRAC(cm*)
-00falO
hBOfiK(cm1)
Hf™
PBR-2(otm)
0.iS
PEW-3(gtm)
O.SS
PEW-2(aim)
0.65
PBR-I(atm)
O.6S
RESULTS
AU L
V(c(m)
BI.9
AVERS
M(9/««)
»9
OWRt
V(cfm)
«ft*
JURDEN
C9/^)
26. 1
8EOI
V(elm)
12.7
ROCK
toA<)4.eJ
LEGEND
-*——K——X— FENCE
-fy MONITORING WELL
- SVE WELL IN OVERBURDEN
-K SVE WELL IN BEDROCK
CONTOURS OF ABSOLUTE PRESSURE
^H 005 - 0.70 otm
Or»COo\oCOcc.
0.90 - 094 abn
NOTES).) MESULIS OSIWtfD FROM
M>m. i*9i5MUlAnOM& WRSOH I ij.
o.) K OtCRBUMieH ICliS, 2 BEDROCK HCUS (SOMMMO 1)
i . •.) * jtoanoNM. KOKXX «tu.sc ) naaoHM. KSfttM.1 ctrmti
J.) MtESSUflE CONIOUftS WHEN ntCK lAlfR *.
NOV 0 6 1997
24 0 24
approximate scale feet
923-6H2-WME
AS SHOWN03/25/96PAI7-299
Galder Associates
TANK FARM SVE SYSTEMSCENARIO 3
RNC/STATE COLLEGE/

MPUT PARAMETERS
AIR 30GRID
IM5V4
CftNO(cm^)
«o"
ASPLT(cm7)
.0-"
CONC(cm7)
,o-1?
FILL(cm7)
-OB•lulu
SOIL(cm7)
X9.-W
FR*C(cm7)
I.*"
BOflK(cm7)
,0-M
PBR-2(atm)
a 65
PFW-3(atm)
o.*s
pFW-?(aim)
0.65
PHR-1(atm)
O.65
RESULTS
ALL L
V(cfm)
52.6
AYERS
(9/lc)
19.9
OVERt
V(elm)
Jil
iURDEN
(a/lc)
137
BEDI
V(elm)
16]
ROCK
(9/tc)
4 2
LEGEND
-*——M——X— FENCE
- MONITORING WELL
- - SVE MCa IN OVERBURDEN
- J- SVE WELL IN BEDROCK
CONTOURS OF ABSOLUTE PRESSURE
^9 O6S - OTO otm
DO70 - O7S abn
0 75 - O 80 atm
0-80 - 08S uln
on - 0.90 aim
0 90 - O 95 mm
r-coer»
NOTESi ) RESU.IS oe»MCD FMM *Rjd SMJLAIKM& WMSMM in
•PHI 1995.
1) SOKMHO 4
a.) 23 O*JWURMH 4EU.S. 2 BEDROCK MELLS (SCCNAMO 1)
b ) 9 MOmOMI. KDMXX BtlLS (SCCNMMO 2).
c.) ADCktlOHM ASPHALt CAFVMC (SCEHAMO J)
4) MXXTKXMl WOO FT1 SANO-nu£0 fRACTLHCS
j) P«SSU« COHIOUftt IAKEN FHOU 1»£R 4.
HOV 0 6 199724 0 24
approximate scale feet
923-6112 AS SHOWN
03/1 ?/96PAI7-J03
GoMer Associates
TANK FARM SVE SYSTEMSCENARIO 4
RNC/S1ATE COLLEGE/PA 4-8

CONTOURS OP ABSOLUTE PRESSURE
D *• (4- EQUMMSIT MIDI MUMKM)
*• (ar OUNMBIT m
NOTESL) KSULK OmMO fMM
D nrat coaon OF u (HBWMo nu& SMMOCX KUI.
M noMK cmmwts MON FMM LAHOI 4.
CMr-co
SU;/ (i G 1337
0 241
MPUT PARAMETERS
*uk k k
COHCh
»5$iV"
— «
BR-2(obn) SB EW-2
(«*»)BR-1
RESULTS
MLl
(dn.)
AIERS
^«•* «U£
^ ———— W^ ———
•«* 10/16/97«"^= PA17-J53MMMfi 04
Qoldcf Associates
I =^*m~——aapproximate scale feet
TANK FARM SVE SYSTEMINTERMED1ATF DESIGN
RNC/STATE COLLEG. _) """4-9

%;? !'iW '-';iSi~tnira!!i!j' Btst;tJ's;;,---',;:;..^
AR3Q9373

MONITORING .WELL INSTALLATION LOJGL/PA
lUhMB. tj.lQgMrJ Drilling Method_Weather -.&>>/ovP__ Drilling CompanyT«mp .3<? * F Drfll ftlfl 5C'^-
TVJC.
C.
Wen No.__£JGround Bev. __Cottar Bw. ___fitartud V/ -'OO
Water
rL/M
MATERIALS INVENTORYA India JO i« yv
Casing Typi SCil Mfr PUf. Screen TypeJoint Type FLUSH- Tri^FAn Slot Size_
.in.dla. .(.I. BantentoSMl OJtPS
fUr si. AT^ ktstafiation Method _.^.0/0 /MOd ______ Bto Park Qty. IJ5 f.6S
Grout QuantityGrout Type SI
Ctntralizers.Mud Type
PiATypa tMOC'f XO-
Installation Method
Elm./ Depth .Soil/Rock Description
CWKXINO 9UMACEon*
s rrt
fOOT51 A
Installation Notes
COEU.F#AC.
- 1
- a
. u
- u
I/Q
•17
- f l
TOAT I^.S FT
ALT.OF 5 PPi*\ /A'
Si .-5 FT Ftltf-TT. ?'&
7, AT
Fft>.eToot.rtf>i « t(n /.Ot,
kfsffino-i!««?
W*ll Development NotesfX*. 5AHD @ U^
F(?AC SAKS ^ Ha 'w
_ S
rtrp
FIELD LOG Colder Associates Inc.

Goldor AssociatesField Boring Log
OfPTH
OtFTK
OfPTH
NO.OI*T
OIPTN
TIMI W
HOLt Jfi,. _ JOB MO
•OIL DMH.L lfl-3_ OA M«f). -
3*>-k)ta. MOJCCT «NC / *TATP COttftfi. \JfrtrJ
— Off ^ 1 *•"" *6 *PWl .n.,,,/*'?^ **"» ""**LJSc
Oft*UN<
OMH.klN<
aHILL •
i u^Ytin? Alfl Cf-TAtJV
1 OOurANV« KrMii
WT. SAMPLIM MAHtJ
WT. CAtlNO HAMUI
SAUPLC TV«« AMMI
•«. ««V«O»«N e eo**w HOTBf. M»MO« t«M*U U CAM IB HPft. »»te»f« UHPU O. Cur oaHC. MK*CO«C or cunt «*•t_T. tterrifl TUM r rwf PM1,O. THW*MUlO.O*tH M*4 HUMWNff PMU. TmmmulB. m>QM «. , BMwtt H
u unu M
It. IV.OCPTH
. 1
j- 3
L I
: lo;
1
'
!.
_
™
_
-•
'-
™
OCICPll^TION
F"IL(-
Sn-TV CLXY
W.OWJ
-
-
-j
IT i^UPl CL P »>*/" e O *fr, ' V* rl t **^ I_J t K P^ t lt_iJ
UrtMl .......«.,u'" .n.r1" mmetm
VIATION*MMM
MOTtUD
MB
•AMPLtt
NO.
1 *
nssin
*"5%TT
^
• o
U ****•t M.T•IT utrt
m nue«Wl MMVfl ilVf CWM IMttHf «*K4MMI** nuaw
£
-
-
-
-
-
-
-
_
-
-
SAUPLC
FS / PA .a«— -« f - 3•M*>T 1 _ or —— / ——
IN£_! — . tuHPACC ttiv. _^ — __._' BHErrn&"*r* ^AV^AJ
N K «Ti«»»o , ]jf ;^fl / HM5TO
L OIICHIPTION -HANOI OP PftOPOKTION"!••«•• • !••» -MiB' II lv«•vmr t- •*% -••*• MM«
MHIMM <M« B4 «M1M*f W UtMMtMOM U 4 If tart 4 MBkMtMlTCOHMCt W W)M MH Hi HOlOtMOM *" WM *r** tr t w««Mm
MWf • MMI1 T«J»lr»
OCICHIPTtON ANO tOHlNO NOTtS
ij\ ^rt.f? r«*- crn^te breu>n^ I'L*rvial
">/ (^LA^/ M -s .4V\ - V»(ccU•l.n, •4-htcvr.btiA ( tJ ft ).^
i vl
Pur<-V4r/
tsesf fJf ^o^v-nW -(n.:i i M-IP & Ptj4K ' rvV" If, |l
F.'f t> /CST ^^-V^an £ fi -T-Kn*c lc<<Ji"7
L. "Sseen (^*i^H i^»,-*i / !/• *(J i -%,4K rrflL-^i r,4
W/OUJPI' ^<-j>-rtiff.i
.
•
.
t •
!I
i
ii
FIELD LOG Golder Associates A R 3 0 9 3 7 5

MONITORING WELL INSTALLATION LOGfuin«p 13. tSCHf/ DrillingWeatfter &M&*-3 Drilllno Company
-A 1 j3 tf7^ (?V
Well No..Ground 6Collar BeSfcrtedJ:
£"-3 ShMt /
Water Depth.
MATERIALS INVENTORYWell CasingCuing TyptJoint Type -
tn.dia.M6
if in.dla. 5 ' If Bantenita Sail CH 'PSScreen Typt _SlotStoi O.OIO
Installation Malttod
Grout Quantity _ S SAL^_______Gram TyM 57a tEffTortrTE /95^ rEE^fT Drininj Mud Type
TypeInstallation Method
•3
E- f
7
$
LOGToft £-3 Toe.
3>EPTH OF FILC ^
AND TWC 2l
L06 OF ER-AFot LITMCX.C&Y.
S FT TLv*
5 —
;o,
M >£'£
DIA
s/0 t
•12
Wall Development Notes
FIELD UOQ 1 Colder Associates Inc.

Goldor AssociatesField Boring Log
-J.
jo« MO Qa^ta* IN** X-i
Hilt. OCLAVtO
.OfFTMOfPTH •Oil OfULt
DIMM MOCK CO«I_£L WIATMCM
MO.OI*T.*A.O.UO.IA..C_ TEMP. __————————— .
Ot^TN Wt. ——————————— Htt«. MOO. *"*• WT.
TIM< WU
HITHOO .COUPANT II.IV.
HAUHCN
WT. OAllNtt
•AMFLI TYMi14. MMHWMnJC* C*WMI«M*U• «. •MTtOMH04. M»«0» fcuMU
AMHCVUTION8 • OH 0«iC«IPTIOM -HANOI OP PHO»ONTlON
KonunM•c•.1.to.T*. T —— -it- ~T~-M*. «M*HW«m
«C*«. euve» euvnr FMf
HOT MOtTlJOHI« MM• M.T
MmiMM KU •• MMMt «t MHumlWON U 4M W>1 4 WUMU«OMM«T «* MM MM M HOtOf
UttMtounu
jLgy.OC^TH
•^s•15
•17
•|«
'/1
'.10
OCtCNI^TION
SlLTY CtAV
•LOWS.
*
•AUf LI*
&£A.
0-°
70
teo
V/Ao
o*
.'£
OCCCMIPTIOH AND COMINQ NOTIS
G roue(
T7fen^i
S a m e "fa Lab
" "i
/NJH>1" * 4e<d«.pftef «£_ Sample
*-J »-.HV L
FIELD LOG Colder Associates A R 3 0 9 3 7 7

MONITORING WELL INSTALLATION LOGJnh Nft to*!, - Utt. Profit fl */C / ^>Tr ^rti/ JF&ff f* /f>A
6A Imp k. lOFM ' nrllllng Method Alft QcfTAQ^
Wiather ? l«u£>/ Drilling Comnanv EiCM Ei. P£l?eeC«: Xtf r .T«mp £P»P nrtlRin &*llfAft4*1 DrillM- C. ttftftMMAkl
WeBNoGroundCollar EStarted
B/VlFkw.
11*30 IIn« /
ShMt \ i\i I
Wat« Death
naf«/Tinw
11,195 Cnmptetad /fc '00 /f'l?&50*I« TIMI / OATt
| . MATERIALS INVENTORY
Well CasingCasing TypeJoint Type _Grout QuantftGrout Tyw£
3. to.db. n.S- if w.iS*H MO ^\JC Sera
ri O<H - TrtfteAti sot
Screen«nTypeSbe
J3L
jMACMiV^ki.«a. 5
SLirrSLf. Ben
InsS
y ^O flALLoW^ CmtralbMv MO^C Rlt.
^•RFfJieNiTF /*r5l CfWPMr Drill ngMudTyp» "NlA m^
onita!illationrPackrPidcifladon
Unthnri Pi ? A V (<r ^
ON. 7^ »«rTypii Motif JJO t "iAWD
bUthnrf &(6AUn"V
Eitv./Oeptft
-
•lo
- ii
-Ik H>
Sc1 Mi 4 ^^
* 4 6*
. 30
Soil /Rock Dwcription ^ ^ •Hlllll>lil=lln7 ^ ^ ^ l
•
WOUND SURFACI
Oi'f^(iiJ^OFf*(( £C£ Eo^'i*/6 Lot
Fbfc Bff-i poiL iT«< ei o 6 v )
BEOiLotK,
/A'' ->t*X ' '
i A^CO. /^^
V /^ >''*'/*/ VEHD or Grf^//^
'
(U
tii»oiO
. -
n?
|/
/
'y
^
'$,^«^
•t''//
'4.V,fy'%
is -«v
,"*—
^/
<?X-/.,/
^^x2
*
• "*•
;
^v
^^
. .
••
t flp» /
T
%%42*A
fy
//
'/
.';'
•
»T^
1\THfi
^
x*sy''/,^'/
^
^
i-cx;
^^^/k^^
X
"1C"»",1p— • Wi
x .:ACSC
ilMfr
e^ '
~~iC'
i*— Cf.
6L
nfrtM.AL
•frvC
.1 f.
a.- IN) EA
¥#
IA t
?f£.S/Vfr
-»/ tCAS*
*-,/or
re c
• <r
otic.1? *>t
sortA C
1 4l/f(W
**
£
iip
r
*A^i^K
&«>—\P
Installation Notes?ifl£FHotE AU^i?£fC> "TT?15. S FT &65 WITHtj '/^ _ IN/CM Tf^ USA
Jko6y^5 u>rrHbe.A,t*>>J Aw^i1*- /xfcu T^A srp^-/CA^.«/£. ^PouTEh ;N"PJ At E T?>Ft300e*Lp OPfD TO jr.l FTP,f,<^ LJ.TM ^- Itif «T>'\ D6"->K MotE.MAiviitlFi?. MX1* v>t& f
UiH'Lt "hQlLLtrtZ.
A^i2o< Afi PPMIW bCtLLFlZ' 'S.i"Rtti^OCk. Tfiri S&FT7ft Act titMf M AuMrtFJioM iSfi T(i A3.<A WO ^Lf.ft Tf, Al.l FfW*£ . Cflh/T/rJuo"SSPt iT" • SPeOA/ 5/***iWwttfJ OuC£Po«iBCA/
Well Development Notes
.
•
•
•'
* '
.
.'
Tl 5
AR30
9378
*
FIELD LOG Gotder Associates Inc.

Golder AssociatesField Boring Log
•HMT ,——I——.
•UflPACC ILIV.
DATUM ____
•TAHTIO
COMfLfTIO H'-^O >nTlste<
SAMFLI TV Mi**. MMfMMUMJC*. CHMXtAfU•A *MV«OMN
»».•e.1.0. tH««HIXU.O*«*M. TmrrTri.ilfinT"W4.
AMMfVUTION* • OIL OftCMIPTION -HANOI Of PNOPOftTfON• »% -MM- it m
MTOMMUMl
MOf MQTTkMt*M
•*!•0 CMO* *fct•IT M.T*
"** 'KMMCNTI«. . «M«tiU* UVtMIBu Mm>
«tfv.OIFTH
y
t
7
«
-9
-;o
-n
II
rt
Jt
17
-ro
OIICMIPTtON
SILTV CLAV
ItOW
*
i CPr~ -
•AVPLI occcmrnoN AND •OKINQ NOTIS
Q? r*vf (
.L/ AV
/>/•,.„, , .. ^ - -1.- •-- ,-
ofa«c.^ -.sroujrt•hken
ffifa ^Ln -u -f-fN < _.
*!.
e s
FIELD LOG Golder Associates A R 3 0 9 3 7 9

MONITORING WELL INSTALLATION LOG.w.ini.9g3-&ll0- Project
Weather
STATf -f A/* rs / WeH No..GnxmdE
Drilling Company ^NC, Collar Bev.Sttrtod_4i
MATERIALS INVENTORYWefl Casing a *Casing Type _jSCJL—^Joint Type FLUSH
If
Grout Quantity ISOGrout Type 52i
•3 hufa
Screen Type MAftHtNE C.uTsiotSlM Q.ftio ivcriCmtralizers_
,l.f. Bentonfte Seal.Installation Method
N fl N t
Drilling Mud Type N/A
ratirPackQM ^75 ififf.
PiATyM Nft f .ucflif
£Iev./0«pth Soll/floek Description WELL SKETCH
0-16-M
o. <
Installation NotesIO-INCH t»uw
.V FTSET CAS.IN& AT
1*
Ib
It
It
I?
W
iu
.fbi
"ic&Oock:
Foe ^ -tNClTo Jt.o fT
i?F>b/wc.IN
^p£?fi*AA
OK.DM
X
NO.ft 1
Watt D«v«topment NotesINC'-30
E f f t
FIELD LOG Colder Associates Inc. AR309380

I8E60EHU
s>.K-^^^^ tJx^mMM jML^rji,<K WML M,fMI"! •»;*• **f~""v*" *™» <Jj, *ip- * ii j*£y •' ;--p •--*; •'-'J iK I I ^^ *! '* ' Wr? 'i ' *^*i" if?^?*'*!'
^ ;jf, ii Pi|ls^ ife^ ^f l{-!i%ii g5?il J|»^5 fl ^
':• r rlKt Ltlegij| jF'!Spjgig^%i!aj t ^'•^j; ;*;.« |jfyi?f. ii.; ^J i ( *Af ^_jh^T*^-^^<jjt^^si "^f|Jp£^ .&$:'BK^Jr i"^••* ^w; ;g*g yaaSfeM ^R^?CT;IHyS .pt S j>fe?! ;|p:jS^gP fi" i :J?"'

GENERAL PROCEDURE FOR CONDUCTING AIR SAMPLING
General Procedure
Air samples are collected using laboratory-prepared and evacuated Summa air sampling canisters.Summa canister is connected to a sealed well bore and air from the well bore is collected into thecanister for laboratory analyses.
Preparation
1. Pre-label Summa gas sampling canisters.
2. Calibrate vacuum gauge.
3. Complete pre-sample collection information on chain-of-custody forms.
Field
1. Connect vacuum gauge to vacuum monitoring port on wellhead cap, turn off vacuum to well atwellhead valve located on the vacuum line, and allow vacuum in well to go to zero.
2. Attach new tygon tubing to canister connector via a compression fining, remove galvanizedsteel plug, and immediately insert other end of tygon tubing into well bore through acompression fitting on wellhead cap.
"" 3. Pull tubing at canister and wellhead seals to check tightness.
4. Remove cap, pull sampling pin on Summa canister, and turn canister to fully open.
5. Fill Summa until vacuum noise of air entry stops, wait 30 seconds more to ensure completefilling of canister, then turn Summa valve back to closed and reinsert locking pin.
' 6. Remove sampling hose connector from compression fittings on canister and wellhead, replacecap on Sununa canister, and plug in wellhead.
7. Turn on vacuum to wellhead and ensure vacuum increases again to presampling vacuum.
8. Disconnect vacuum gauge from wellhead and close vacuum monitoring port.
9. Note sampling time on sampling table, and complete chain-of-custody form and sample label.
10. Submit samples directly to laboratory for processing and analyses.
&R309382

GENERAL PROCEDURE FOR DETERMINING VACUUMEXTRACTION SYSTEM (VES) AIR FLOW RATES
General Procedure
Air velocity in VES piping is determined with a Dwyer pitot tube-type flow sensor and magnehelicgauge. Differential pressures within the pipe due to air flow are measured and converted tostandard cubic feet per minute (scfhi) of air flow based on pipe diameter, temperature, andpressure.
Preparation
1 . Zero magnehelic gauge. Gauges are factory calibrated. Magnehelic gauge with sensitivity of0.0 to 0.5 inches of water column (WC) is used to measure air flows in the range of 0.0 scfhito 35.5 scfin. Gauges with sensitivity of 0.0 to 1.0 inches WC are used to measure air flows inthe range of 0.0 scfhi to 50.0 scfin,
2. Properly install monitoring port per manufacturer's direction. Monitoring ports consist ofcompression fitting having inside diameter just large enough to insert pitot tube into VES pipe.
Field
1. Check system vacuum to ensure design vacuum level is being induced. Record.
2. With vacuum on, remove cap from compression fitting monitoring port and insert pitot tubeinto pipe.
3. Check for proper alignment and full insertion of pitot tube in pipe and tighten compressionfitting. Check for leaks.
4. Read magnehelic gauge and record onto field data sheet. Measure and record temperature.
5. Compare WC reading to conversion chart for proper size pipe and temperature.
AR309383

Centre Analytical Laboratories, Inc.3048 Research Drive State College, PA 16801
Facsimile: (814)231-1253
STANDARD OPERATING PROCEDURES
CHAPTER 11: LABORATORY INSTRUMENTSEFFECTIVE DATE: 25 September 1995SECTION 12: Air Analysis using a Tekmar AutoCan Autosampler/Concentratior
APPROVAL: /I——/ // "—— DATE:
1.0 URPOSE
1.1 This Standard Operating Procedure (SOP) describes the procedurefor air analysis using a Tekmar AutoCan Autosampler/Concentrator.
2.0 SCOPE
2.1 Sample collection is performed in a 6L Summa canister. Analysis isperformed using a Tekmar Autocan for concentration/desorption ofthe air sample and detection is performed on an HP 5890/5970 GasChormatograph / Mass Selective Detector (GC/MSD).
2.2 This SOP closely follows EPA Method TO-14
3.0 APPARATUS
3.1 Tekmar AutoCan Autosampler/Concentrator equipped with a 16position autosampler and Internal LN2 concentrator.
3.3 HP 5890 Gas Chromatograph.
3.4 HP 5970 Mass Selective Detector.
4.0 REAGENTS AND SOLUTIONS
4.1 TO-14 Calibration Mix 1 (Supelco) - 100 ppb.
4.2 Toluene-d8 (Supelco) - neat.
A R 3 0 9 3 8 U

4.3 4-Bromofluorobenzene (Supelco) 50 ng/ug in Methanol.
5.0 PROCEDURE
5.1 Prior to shipment to client, 6 L Summa canisters are prepared byhooking the canister to a vacuum pump and applying a vacuum of 0.05mm Hg.
5.2 The client will then take the canister which is under vacuum and openthe sampling value whereby the sample will rush into the canister. This isconsidered a "grab" sample. The canister is then sent back to thelaboratory for analysis.
5.3 Once at the laboratory, the canister is assigned a lab id and the clientname, sampling date, and canister number is recorded.
5.4 The canister is then pressurized to 20 psig. A dilution factor iscalculated and applied to the sample according to the following equation:
DF = Ya where Ya = absolute pressure (psia) after repressurizationX a X a = absolute pressure (psia) before repressurization v >
5.5 A 1 L aliquot of the sample is withdrawn from the repressurizedcanister via a mass flow controller on the Tekmar Autocan. The sampleis then cyrofocused on a glass bead trap cooled with LN2 (liquidnitrogen) to-160 deg C.
5.6 The trap is quickly heated to 200 deg C and desorbed onto a GC/MSfor analysis
5.7 Tuning - A BFB tune is performed every 24 hr by injecting 1 ul of 50ng/ul BFB solution. The following tuning criteria must be met.
AR309385
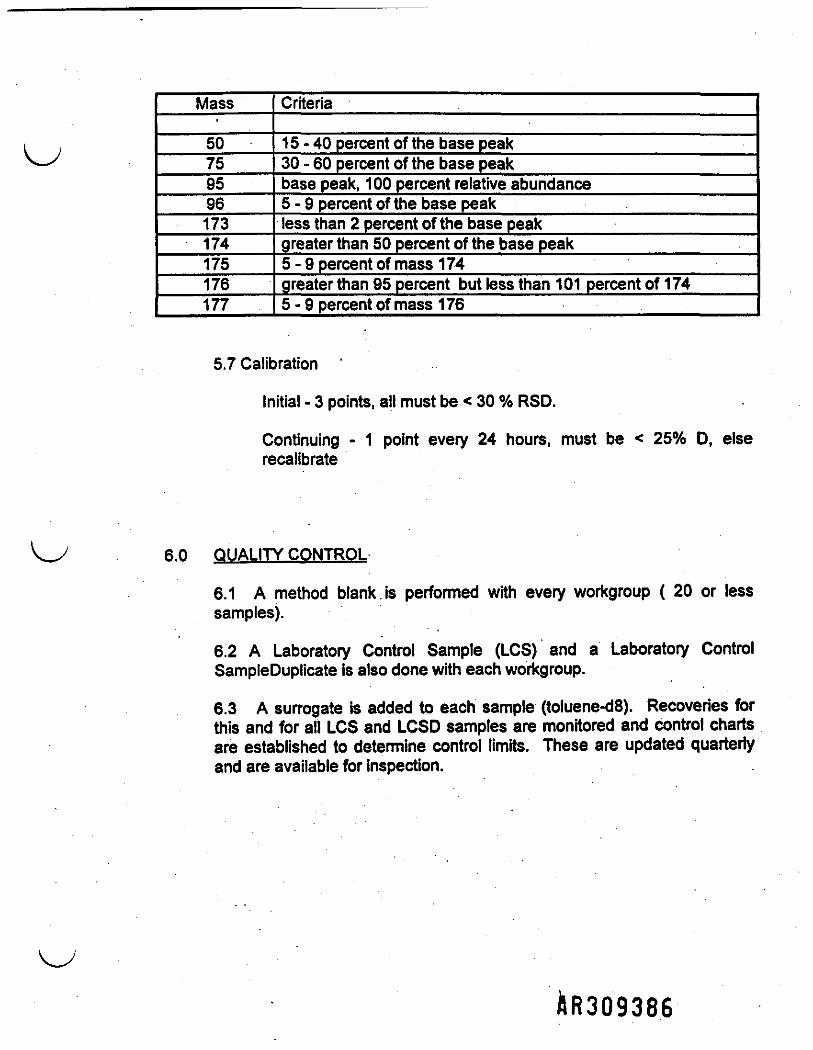
Mass•
50759596173174175176177
Criteria
15 - 40j>ercent of the base peak30 - 60 percent of the base peakbase peak, 100 percent relative abundance5-9 percent of the base peakless than 2 percent of the base peakgreater than 50 percent of the base peak5-9 percent of mass 174greater than 95 percent but less than 101 percent of 1745 - 9 percent of mass 176
5.7 Calibration
Initial - 3 points, alt must be < 30 % RSD.
Continuing - 1 point every 24 hours, must be < 25% D, elserecalibrate
6.0 QUALITY CONTROL
6.1 A method blank is performed with every workgroup ( 20 or lesssamples).
6.2 A Laboratory Control Sample (LCS) and a Laboratory ControlSampleDuplicate is also done with each workgroup.
6.3 A surrogate is added to each sample (toluene-d8). Recoveries forthis and for all LCS and LCSD samples are monitored and control chartsare established to determine control limits. These are updated quarterlyand are available for inspection.
A R 3 0 9 3 8 6

UDC4CO
iif
^ft

cSeptember 1997
Matrix: Soil
ANALYTICAL CHEMISTRY RESULTSVolatile Organic Compounds
Centre Cowtty Kepone Site - Pre-Design InvestigationState College, Pennsylvania
933-6333
.^*3JCOCDtoCOGOGO
ParameterDfcMcroolfluororneOianeCMorameOuneVinyl ChlorideBromomethaneChtoroetharwTricMorcAuoromeOumAcetoneCarbon Disuffide1.1-DkttoreettMneMethytona CMondaTraM-1£4)icnloroefhene1,1-OkMofDafiane_ _ — . - - •• __Z,Z*L*bi •*• v|fl u|MI NJ
ds-1 -DicMoroettieraBrornochloromrthaneCMoraforrn2-Butamnel.l.l-TrtcMoroeeianaCarbon TrtrachlorideI.l-DichloroprepaneBanzena1.2-OtchtotoelhaneTrichtoroethenf1 -ttchtoropropaneDtoromomethanaBromodteMoromelhane< Mrthyt-2-Peotanoned«-1,3-DicNoH)prt)pen0Toluenefrare-1 >DUiMupropene1,1,2-TricMortwfliane , .1 -Dibfomorthan»2-HexanoneTatracMoraetherM1,3-0*chtoropropane
Sample PointTF010304
Lab 10: L14599-8Date Sampled: 4/3007Percent Solids 80.42 %SQL
~ 12. 12
1212121212
2
6666666126666612«6
Result121212121212494
66«6666661261966612«6
Qua!UUUUUU
JUBUUUUUUJUUUUuuuuuuu
uuuuuu
OF
1111 ;
1111111111
11
Sample PointTF010607
Lab ID: L14599-11Date Sampled: 4/30/97Percent Solids 79.26 %SQL131313131313136666666661366866666613666661366
Result131313131313886B6666661368666666613696661366
Qua)UUUUUuJuuBUuuuuuuuuuuuuuuuuu
uuuuuu
DF11111111111111
11
11
Sample PointTF020708
Lab ID: L14545-13Date Sampled: 4/24/97Percent Solids 62.57 %SQL6161616161616130303030303030303061303030303030303030613030303030613030
Result6161
. 618161
23030303030303030303061303030303015303030
. 6130110303030613030
Qua!UUuuuu
uuu
• uuuuuuuuuuuuJDuuuuuDuuuuuu
DF5555555555S555555555555555SS5555555
Sample PointTF021112
Lab ID: L 14545- 11Date Sampled: 4/24/97Percent Solids 83.48 %SQL150015001500150015001VMI W
1500750750750750750750750750750150075075075075075075075075075015007507507507507501500750750
Result1500150015001500150015001500750750120075075075075075031015007507507507507503207507507501500750
2100075075075015002900750
Qua!uuuuuuuuuBUuuUUJUuuuuuJuuuuu
uuuu
41
OF125125125125125125125125125125125125125125125125125125125125125125125125125125125125125125125125125125125
Al unto ar» pg*aDF indicates to Dilution Factor.SQL Mfcates tfw Sample Quantitafion UnitThe Qua! column Indicates ttw qualifier applied to the result by Ihe laboratory or the data vaBdator.Reler to Qualifier
ACCESStocmbflrapafflCal VOC TF Report

September 1997
Matrix: Soil
ANALYTICAL CHEMISTRY RESULTSVolatile Organic Compounds
Centre County Kepone Site - Pre-Destgn InvestigationState College. Pennsylvania
933-6333
^^'— o
COCDto
ParameterDibromocNoromelhaneCNorobenzana1 . 1.U-TetrachlonwVtane
. EBiyKwnzenalOp-Xytaneo-XyteneStyraneBromoformbopropyfeenzeneBrofnobenzene1 .1 .2.2-Tetrachtoroethane1 3-TricNoropropanen-Propytbenzane2-CWorototuene4-Chtoratoluena1 ,3.5-Trimettiybenzenetert-Butytwnzene1.2.4-TrimettiytMnzenesec-SutybenzeneIsopTopvtokiene1.3-Dfchtorobenzene1,4-Oichlofobenzene1.2-Oicntorobanzanan-ButytMiueneI Oibremo-3-chlofopropanet .2.4-TricNofobenzeneHexachtorabutadNmeNaphthalene1,2,3-TricNorabanzene
Sample PointTF010304
Lab ID: L145994Date Sampled: 4/30/97Percent Solids 80.42 %SQL
aaeeaaeaeaae6a6eeeaaaaeea -12121212
Resulteaa94134aae646aeeee3a
1212
MS12 '
Qualuuu
juuuuJuuuuuuJuuuuuuuuuBu
DF*1111111111111111111111111111
Sample PointTF010607
Lab ID: L14599-11Date Sampled: 4730/97Percent Solids 79.26 %SQL
86aaa6ae6e6e6e66ee6e6aa6a13131313
Resultea86926ae621eeaee6e66aee6a13131313
QualUUuu
juuuu
uuuuuuuuuuuuuuuuuu
DF1111111111111111111
Sample PointTF020708
Lab ID: L 1454 5- 13Date Sampled: 4/24/97Percent Solids 82.57 %SQL3030303030303030303030303030303030303030303030303081616181
Result Qual30173014079018030303030303030303030303030303015
670303061816161
UJDUO00UUUUUUUUUUUUUUUJDDUUUUUU
DF55555555555555555555555555555
Sample PointTF021112
Lab ID: L1 4545-11Date Sampled: 4/24/97Percent Solids 83.48 %SQL7507507507507507507507507507507507507507507507507507507507507507507507507501500150015001500
Result7501400750
4400015000032000750750290750520750750750750280750750750750750750
10000-7507501500150011001500
Qualu
u
UUJuJuuuuJuuuuuu
uuuuJBu
DF125T25125125125125125125125125125125125125125125125125125125125125125125125125125125125
COGOto
ACCk^
NoU»:Al units are pgftg.DF mdfcafcn tie Caution Factor.SQL hidtcrteitie Sample Quanttaton Unit
Qual column indicates the qualifier applied to the result by the laborafc>v or the data vahtah
..mlritrapMtCri VOC TF Rtport10/UB7 8:49:47 AM
^ to qua»ercWn*on sheet
vtder Associates C

c cSeptember 1997
Matrix: 808
ANALYTICAL CHEMISTRY RESULTSVolatile Organic Compounds
Centre County Kepone Site - Pre-Oesign InvestigationState Coflege. Pennsylvania
933-6333
- - ,
.
(•BumZDCOO
COtoO
ParameterDJcMowHuofomethaneCntorometttaneVinyl ChlorideBromomettianaCNoroefiantTrichtorofluoronwthaneAoBtoneCaibon Dnuffidt1.1-OichtoioelnemMetiytone CNorid*Tran*-1,2-Oichtoroe*iemf.l-OtoMonetwneZ^UJlUH^WfJ.
BremochtorometnanaCNofOtonn2-8utanona1,1.1-TricntofoaOMneCarbon TetrachtorideM-OttitofopropeneBenzeneU-OicNoroethaneTrkMoraeflwna
DftromomdhaneBronndiditoremeVtan*
cte-1 ,3-OichloroprapenaTokwneIrans-l ,3-OichtoraDnipane1.1.2-Trichtoroethane .1.2-Oibromoetiana2-HexanoneTetracntofoeVwne4 * •^•-•-•.*— * — — — -^^
Sample PointTF021415
Lab ID: L 14545-1 4Date Sampled: 4/24/97Percent Solids 76.84 %SQL6565656595
653333333333333333336533333333
.33333333336533333333336533•**
ResuR" 65
65656565
190033333333333333333365333333333320
33336533223333336533**
Qualuuuuuu0uuuuuuuuuuuuuuuJOuuuuuJDuuuuuII
DFS5SSs5Sss55555555555S5555SS555
, 5555c
Sample PointTF030304
Lab ID: L 14566-7Date Sampled: 4/28/97Percent Solids 82.48 %SQL
121212121212126666
12
6661266666126
' A
Result1212121212125676613666666106666666661266666126K
QualUUUUJUuLJUBUUUuuuJuuuuuuuuu
• uuuuuuuuII
DF111
11
11
Sample PointTF030708
Lab ID: U 4566-8Date Sampled: 4/28/97Percent Solids 82.26 %SQL6161616161616130303030303030303061303030303030
30306130303030306130<vt
Result61616161616127013303930303030303030303030303037
30306130
120003030306150VI
QualUUuUJuuLJUBJUUUUU .UJUUUuuJuuuuuJuuuuII
DF5S5S5555555555.55555555555555555555c
Sample PointTF030708D
Lab ID: L14566-16Date Sampled: 4/28/97Percent Solids 82.77 %SQL606060606060603030303030
' 3030
3060303030303030
3030
30303030306030tn
Result60606060606012030301930303030303060303030303030"VIOV
30» .
302400
3030306042VI
QualUUU"uuuL
UJuJBUuuuuuuuuuuuUJuuuuuJuuuuII
DFs5Ss5555555555555555555555SSS555S5X
M units are uBfeg.OF MfcatesVia Mutton Factor. .SQL indicate* fw Sample OuenWalion UnitThe Qual ooMim Mfcatn 9* quaNffer appied to tfw rasuK 6y •» laboratory wttedaUvaklate. Re*w to quatfwdeftn*oo sheet
Colder Associate*

September 1997
Matrix: Soil
ANALYTICAL CHEMISTRY RESULTSVolatile Organic Compounds
Centre County Kepone Site - Pre-Design InvestigationState College, Pennsylvania
933-6333
x»3OCOO
CJ• r*
ParameterDibromocMoromathanaChtofotoeraene1 .1 .1 ,2-TefcachtoroethaneEthyfeenzanen\p-Xyten*o-XytoneStyianaBromofonnbopnpyttMnzanaBromobanzene1,1 .U-TetracNoroethafM1,2>TricMoroprapanen-PrapytMnzene2-CMoretokjene4-Chtorotohjane1 ,3,6-TnmelhyMMnzeneeNt-Butytienzane1 ,4-TrimaBiylbanzanese&Butyfjenzaneleoprapyaoluene1.3-OicMorabenzena1.4*DichlQrabenzene1 -OicMombanzanen-Buh banzana1J-O*romo-3-chtoropropan«1.2.4-TricNorebenzeneHaxachtorobutadienaNaphthalene1.2>TricNarobenzaM
Sample PointTF021415
Lab ID: L 14545- 14Date Sampled: 4/24/97Percent SoW* 76.84 %SQL3333333333333333333333333333333333333333333333333365656565
Result33333332200633333333319333333333333333333333314333350656565
QualuuuJOD0UUuuJOuuuuuuuuuuuJOuuJOuuu
DFs5555555555S5555S555555555555
Sample PointTF030304
Lab ID: L14566-7Date Sampled: 4/28/97Percent Solids 82.48 %SQL
666666666666666
. 666666666612121212
Result666482666666666666666666612121212
Qua!UUUJ
Juuuu
uuuuuuuuuuuuuUJuuUJUJ
OF1111111111
Sample PointTF030708
Lab ID: L14566-8Date Sampled: 4/28/97Percent Solids 82.26 %SQL3030303030303030303030303030303030303030303030303061616161
Result303030
130006500014000
303065301303022303026303330303030»303061616161
Qua!UUUJJJUU
UJUJuuJu
uuuuuuuuuUJUJ
DF55555555555555555655565SSS
' sss
Sample PointTF030708D
Lab ID: L14566-16Date Sampled: 4/26/97Percent Solids 82.77 %SQL3030303030303030303030303030303030303040303030303060606060
Result303030
25001500029003030483066301630301530233030303030303060606060
Qua)UUu
, JJJUU
uJuJuuJuJuuuuuuuuuuu
DF555555555555555555555S5S55559
«cV^
Notes:Al units are pg/k0.DF MfcatM the Daubon Factor.SQL Mfcatfts tta Sample Quanttation Limit
QualcduOTiWicalBii* gnawer api*ed to Iheiw^
.MbHnportCd VOC TF ftaport V.-jlder Associates C Pa0*4oft»

cSeptember 1997
Matrix; SoH
ANALYTICAL CHEMISTRY RESULTSVolatile Organic Compounds
Centre County Kepone Site • Pre-Design InvestigationState Cotege, Pennsylvania
933-6333
^*zaCOCD1OCOu>ro
ParameteracNofodataofomrthaneChtoremethaneVfnyl ChlorideBromomethaneChkNoethaneThcntorofluororneVianaAcetoneCarton DisuMde1.1-OfcNofDatieneMethytene CNorideTrans-l £-Oichtoreethene1.1-OfchhiioeBiane2 -Dfchtoreprepaneds-t -OichbFMBwneBromochtoromethaneCMorofenn2-Butanone1.1.1-TricMoroHhaneCarton Tekachtoride1.1-OfchtorepnpeneBenzene1.2-OtaNofoetianeTrfchtoroethene1£-DfcMoropropmObromometianeBrontodicnloromettane4 Methyt-2-Penlanoned$-1,3-OicMoiopropeneToluenefevi*-1,3-f>cnloropfDpenel.U-Trkttoroetfiane1.2-D*romoeth«ne2-HexanoneTetrachtoroeftene1.3-Otehtoropropane
Sample PointTF031011
Lab ID: L 14566-9Date Sampled: 4126/97Percent Solids 82.01 %SQL6181616161616130303030303030303061303030303030303030613030303030613030
Result616161616161ISO1330373030303030306130303030301603030306130
30003030306112030
Qua!uuuUJuuLJUBUUuuuuuuuuuu
uuuuujuuuuu
DFS5555555555555555S555555555555S5555
Sample PointTF031920
Lab ID: L14566-10Date Sampled: 4/28/97Percent Solids 77.64 %SQL
6464646464646432323232323232323264323232323232323232643232323232643232
Result64646464646412032322132323232323264323232323206032323264 '32
86003232326445032
Qua!UUUUuuLUJuJBUUUUuuuuuuuu
uuuuuJuuuuu
DF555555555555555555555555555555555S5
Sample PointTF040304
Lab ID: L 14599-2Date Sampled: 4/30/97Percent Solids 63.34 %SQL1500150015001500150015001500750750750750750750750750750150075075075075075075075075075015007507507507507501500750750
Result Qua!15001500150015001500150018007507507507507507507507507501500750750750750750
170007507507501500750
85000007507507501500
590000750
UUUuuu
uuuuuuuuuuuuuuu
u .uuuu
uuuu
u
DF125125125125125125125125125125125125125125125125125125125125125125125125125125125125125125125125125125125
Sample PointTF040708
Lab ID: L1 4599-5Date Sampled: 4/30/97Percent Sofids 84.04 %SQL1500150015001500150015001500740740740740740740740740740150074074074074074074074074074015007407407407407401500740740
Result150015001500150015001500150074074074074074074074074074015007407407407407409907407407401500740
4700007407407401500
41000740
Qua) DFuUUUUUUUUuuuuuuuuuuuuu
uuuuu
uuuuu
12512512512512512512512512512512$125125125125125125125125125125125125125125125125125125125125125125125125
Notes:Al unit* era ug&g. .OF VKfcatestw Mutton FactorSQL MteatBS tw Sampto Quwimation LimiLThe Owl cdumn Indfcatei the quaffier applied to the msuM by the lattx^oryalhedatavaMator.
ACCESStoC-mbHraportlCriVOC TF Report10/1/97 8 4949AM Odder Associates

September 1997
Matrix: Soil
ANALYTICAL CHEMISTRY RESULTSVolatile Organic Compounds
Centre County Kepone Site * Pre-Oesign InvestigationState College, Pennsylvania
933-6333
t»=0CO
u>CO• r*
Parameter(MNDmocNoromelhaneCMorobenzene1 .1,1 ,2-TetrachtoroethaneEthyfcenzsnemj>-Xyleneo-XyteneStynmeBtomofennbopropytoenzenaBromobenzenal.1^2*Tatachtoreethana1 ,2.3-TricMoraprepanen-Propyfeenzena2-Chton**Miw4-Chtoratoluene1 ,3,5-TrimethytMnzenetert-autyfcenzene1.2.4-Trinettiyfcemene•ec-ButytbenzenetoopfopyNoluena1.3-DtcMorobanzena1.4-OkMorabanzana1,2-DfchtorobanzeMn-Butyfeanzene1 4Nxonio-3-chloraprQpane1,2.4-TrichkMobanzenehexachtorobutadianeNaphttiatona1 .2.3-TrictHoiubenzana
Sample PointTF031011
Lab ID: L1 4566-9Date Sampled: 4/28/97Percent Solids 82.01 %SQL3030303030303030303030
3030303030303030303030303O
61616161
Result303030
20004400260030305130
2700303030302630203030303030303061616161
Qua!uuuJJJuuuJuuuuJuJuuuuuuUJuuUJUJ
DF55555S5555555555S555555555S55
Sample PointTF031920
Lab ID: L14566-10Date Sampled: 4/28/97Percent Solids 77.64 %SQL32323232323232323232323232323232323232323232323232
64646464
Result323232
1600120002400
32326032
16003232323231322332323232323232
64646464
Qua!UUU
Uu
u
uuuuJuJuuuuuuuuuuu
DF5S5S55555555555S5S55S55555555
Sample PointTF040304
Lab ID: L 14599-2Date Sampled: 4/30/97Percent Solids 83.34 %SQL750750750750750750750750750750750
7507507507507507507507507507507507507SD
1500150015001500
Result750.750750
5100002800000350000
75075070007503700
1500750750 .260075012007507507507507507507501500150015001500
Qua!UUU
UU
u
u
uu
u
uuuuuuuuuuu
DF125125125125125125125125125125125125125125125125125125125125125125125125125125125125125
Sample PointTF040708
Lab ID: L 14599-5Date Sampled: 4/30/97Percent Solids 84.04 %SQL740740740740740740740740740740740
7407407407407407407407407407407407407401500150015001500
Result740740740
160000640000170000
7407405000740
39000740110074074012007407407407407407407407407401500150015001500
Qua!UU
.U
UU
U
U
uu
uuuuuuuuuuuuu
DF12512512512512512512512512512512544£125125125125125125125125125125125125125125125125125125
CO
ACCk^
Notes:Al units are pg/kg.DF indicates (he Mutton Factor..SQL tadfcatM ttw Sample Quanfctafcon Limit
Qual column mdteatos the quaMer applied to the result by the laboratory or the daUvalklalor r to qualifier (Mntton sheet
.f*11rapartlC4 VOC IF R*partV_ider Associates c

c c cSeptember 1997
Matrix: Sort
ANALYTICAL CHEMISTRY RESULTSVolatile Organic Compounds
Centre County Kepone Site - Pie-Design InvestigationState College. Pennsylvania
933-6333
x»roCOotoCOU3«e-
ParameterDfchtoroMuoiomelhaneChtofomethwwViiyfCNori*8remomelh«neCMoroetaneTnchtoraOuoranw«HneAcetoneCarbon ObuMe1.1-DfcMoroetheneMelhyteneCNonaeTrans-1.24f(MotaettieneU4Nct*me0Mn»
' 2 -Ochtoroprepanetit-t£-OfcMoroe«teMBfornocMoremetieneCMofofemi "~" •2 Putonooe1.1.1-TikifcroetuneCarbon Tetrachtorio*1.1-OichtoraprepeneBenzeneI DfchtomeihaneTricMoraetttene1.2-OfcftompropaneMmmomttMneBfomocMcMarameViene< MeftyM-Pemenone •d*-1>OkttaropropeneTolueneb«n»-1,3-0icriloroprepene1.1.2-TikJftjroeBiane1.2-OfrDmoettiene2-HexanoneTeVacnloroetienel.S-Otahtoropropant
Sample PointTF041112
Lab ID: L 14599-1 3Date Sampled: 4/30V97Percent Solids 78.07 %SQL13131313131313
13
13
1
ResuR13131313131360a100
8aaa -013a000
a5O0a130540aa133a
QualUUUUuuJDUBUUUouuuuuuuujuUuuu
uu
; u
uJu
DF
1
Sample PointTF041516
Lab ID: L 14599-7Date Sampled: 4/30/97Percent Solids 82.96 %SQL
12121212121212 .
12
1280
a' o
0
12a0
ResuR | Qual1212121212124
0
fl1200
a600
ae0
1204O0
a12ae
uuuuuujuuBUUuuuuuuuuuuuuuuu ,uJuuuuuu
DF11111111111111111111
Sample PointTF050203
Lab ID: L14566-11Date Sampled: 4/28/97Percent Solids 78.51 %SQL160016001600100016001600160080080080080080080080080080010008m80080080080080060080080010008008008008008001000800800
ResuR16001600160010001600160021008008008008008008008008008001000800800BOO8808001000BOO8008001600800
1700000600800
.8001600800800
QualUUUUuuJuu11
• uuuuuuuuUJUJJ
UJJUJUJUJUJUJ
UJUJUJuuu
1 <*125125125125125**MCTZD
T25125**1C7291251251251251254*kC72972572572572512512512512512512512512512512S125125125125125725
Sample PointTF050708
Lab ID: L14566-12Date Sampled: 4/28/97Percent Solids 79.43 %SQL0363630303630331313131313131313163313131313131313131033131313131033131
Result036363036303
17003131203f3131313131523131313131
13003131310331
03003131316341031
| QualUUuuuuLUJuJBUUuuuuJuuuuu
uuuuuJuuuu
u
DF55555555555t555555S55555555555S5555
Al units are ugftg.DF indfcates tie Dilution Factor.SQL Mteato* I* Sample Quantftaftan Un*.The Oual column Mfcate* Bw qualifier appled to the rest* by ttw t^wr^torycirtiea^tavaid^or.
10n/97 ft 49:51 AM GoMer Associate* Paga 7 rt 18

September 1997
Matrix: Soil
ANALYTICAL CHEMISTRY RESULTSVolatile Organic Compounds
Centre County Kepone Site • Pre-Oesign InvestigationState College, Pennsylvania
933-6333
• ^^^
zoCOOU3
ParameterDibramocMofomMhanaCMorebanzane •>1.1 .1 TeBacNoroatianeEtiyfeenzenemj>-Xytanao-XytanaStymn*BrofflotonnIsoprepyfeenzaneBremobenzeneU.ZJ-Tetrachlororthan*1.2.3-TricMoropropaoan-PrapylMnzane2-ChtoroMuerw4-Chtoiotoluene1.3.5-Titmethytwnzenfttert-Butytjenzene1 .4-TmnathyttwnzeneMc-BulyttMnzanebopropyftoluene1.3-OfcMoiobanzene1.4-OfeMombenzenetZ-OJcMorabenzanen-autyJbenzene1 -OibnMno-9<hloropFOpane1 .7 4-TrtrW?™*1^ **T*"
NapNhatom1£3-TrtcMorobenzene
Sample PointTFQ41112
Lab ID: L 14599- 13Oat* Sampled: 4/30/97Percent Solids 78.07 %SQL
6
e6
13131313
Result
6130
66•66e13131313
Qua!UuUJu
uuuu
uuuuuuuuuuuuuuuuuu
OF111111
11
Sample PointTF041516
Lab ID: L 14599-7Date Sampled: 4/30/97Percent Solids 82.96 %SQL
6
66
12121212
Result66e66666668266
12121212
Qua)UUUUUUuuuu
uuuuuuuuuuuuuuuuuu
OF11
11
Sample PointTF050203
Lab ID: L14566-11Date Sampled: 4/28/97Percent SoUds 78.51 %SQL800600aoo800aoo800800800800800800800800800aoo800aooaooaooaoo800800aooaooaoo1600160016001600
Result600aooBOO
3000000120000003700000
800800
76000aoo800800
23000060800
75000800
15000aooaooaooaooaooaooaoo1600160016001600
Qua!UUU
UU
Uuu
uJu
uuuuuuuuuuu
DF125125125125125125125125125125125f9<1*9
12512512512512512512512512512512512512549*1JafO
125125125
Sample PointTF050708
Lab ID: L14566-12Date Sampled: 4/28/97Percent Solids 79.43 %SQL | Result3131313131313131313131313131313131313131313131313163636363
313131
17000770
17000313134031
230031110313114031923131313131313163636363
QualuUUJJJUu
u
u
uu
u
uuuuuuuuuuu
DF55555555555555555555555555555
CO10cn
ACC\
Notes:AB units ar* pg/kQ.OF Indicates the Wuton Factor.SQL tofcate to Sample Ouanttatkm Lin*
Qual cotumn frftcatn to quanta applied to «w rasuK by Bn tabwato^ or the date vaWator -*»r to qualifier definition sheet
ibltapaWri VOC TF Report c

c c cSeptember 1997
Matrix: Sol
ANALYTICAL CHEMISTRY RESULTSVolatile Organic Compounds
Centre County Kepone Site - Pro-Design InvestigationState College. Pennsylvania
933-6333
^^31CJCDCDCOVOO*
ParameterDfcttoroMuoranwtttaneCNorormttiBMVinyl CWorideBrafnonwthaneCMoraetianeTrichlOfoBuoronieaiamAcetoneCarbon DtouffideM-Dichkwoetiem•• i ij j ~ ^*~*~ — *-*-Mmyiane uxnoeTran*-1.2-QfeMQfoe1heM1.1-Ofchtoroefran*2>0ichtorapiopane
BremochiOfoinMnMeCMontonn2-ButanoM1.1.1-TricNoraethaneCarbon TetracNorideU-DfcntofopropeneBenzene1.2-Oichtoroethan«Tricntoroetwne1,2-OfchtoropropaneDtoomomelhanaBromodkrtoromrtharit< Mettiyi-Z-PertanoiMtis-1 .34NcntoroprepaneToluenetrans-I.S-Ofchloropropene1,1 -TrichtoroeBiane1£-Otoromoefiane2-HexanoneTetracMoroMhene1,3-Oichtoropropane
Sample PointTFQ51112
Lab ID: L14566-13Date Sampled: 4/28/97Percent Solids 65.12 %SQL777777777777773838383838
38
387738383838
.36363838367738363638
773638
Result7777777777771003938213838
38
367738363838389636383677
"381303638
.772038
Qua!UUUUUUI4UJBUUUUUUUUUUUU
UUUUU
UUUUJU
DFS5S555555555555S55555S555555555S555
Sample PointTF052021
Lab ID: L 14566-1 4Date Sampled: 4/28/97Percent Solids 54.53 %SQL
181010
1810
1818
18
16999991899
Result1610181810
183440914699139989999914999169219491059
Qua)UU
DF11
U 1UJUULJUBJUU
UUJUUUUU
UUUUU
UJUUJU
11111111111111111111111111111111
Sample PointTF060304
Lab ID: L 14599- 12Date Sampled: 4/30/97Percent Solids 76.81 %SQL13131313131313
1
1
Result131313131313
22
13
6120e861361186613736
Qua!UUUUUUJUUBUUU
UUUUUUUU
UUUUU
UUUU
U
DF
1111
Sample PointTF060708
Lab ID: L 14599-4Date Sampled: 4/30/97Percent Solids 78.52 %SQL13131313131313
1
Result131313S1313766126663661366668168861362066613206
QualUUUJBUUJUUBUUUJUUUUUUUU '
UUUUU
UUUU
U
DF111
11
Al unit* are pgfcg.DF Mfcatn tht Mutton FactorSQL Mfcatn Vw Sample QuanBation UmitThe Qua! column Mfcate* fie ouaMer apptod to the muR by tw labora^ or the date vafctotor. Refer to quaWw
100 Itfl 0:49:52 AM Golder Anoclates Pa0e9oH8

September 1997
Matrix: Soil
ANALYTICAL CHEMISTRY RESULTSVolatile Organic Compounds
Centre County Kepone Site - Pie-Design InvestigationState College. Pennsylvania
933-6333
^^^*soCOCDvoGO
ParameterDibromochtonNnethaneChtorobenzene1.1.U-TetrachtofoelhanaEtiytbenzenem^Xyleneo-XyleneSlyreneBfotnofonnUopiopyRMnzeneBfomooenzene1 .1 Aa-TeHacntoroethane1A3-TricMonprapanen-Propytjenzene2-CWoroWuene4-CWoroto»uene1 .3.5-TrimettiyiJenzenetert-Butyfeenzene1A4-Trimefcytoenzene•ec-fiulylbanzenetaopropyHokiane1,3-Oichtorooenzenel.4-0icrtorebenzene1.2-DichlQrobenzanen-autyttwnzene1£4*bfomo-3-cNoroprepine1 ,2,4-TfKMorobenzeneHexacNorobuladianeNaphthalenelAS-TrkMorooenzene
Sample PointTF051112
Lab ID: L14566-13Dale Sampled: 4/28/97Percent Solids 65.12 %SQL
38383838 '38383836383838383836383838383838383838383877777777
Result363638820260006038366038
1300383838368438413838363838383877777777
Qua!UUU
UU
U
UUUU
U
UUUUUUUUUUU
OFs5555555555595555555555555555
Sample PointTF052021
Lab ID: L1 4566- 14Date Sampled: 4/28/97Percent Solids 54.53 %SQL
9
18181818
Result93934140379999
190
18181818
QualUJU
UUUU
UUJUUUUUUUUUUUJUUUJUJ
OFf11111
11111111
Sample PointTF060304
Lab ID: L 14599- 12Date Sampled: 4/30/97Percent Solids 76.81 %SQL
666666666666669666.666866613131313
Result6666566666
2906666666666666613131313
QualUUUUJUUUUU
UUUUUUUUUUUUUUUUUU
OFf1111111111111111111111111111
Sample PointTF060708
Lab ID: L14599-4Date Sampled: 4/30/97Percent Solids 78.52 %SQL
666666666666666666666666613131313
Result66661226666
1606666666666666613131313
QualUUUU
JUUUU
UUUUUUUUUUUUUUUUUU
OF1111111111
1111111111111
U>
ACCV,.
Notes:Al unite art po/kg.DF Indicates the Mutton Factor.SQL indicates the Sample Qtianttation limit
Qual colunm Micate* tie qualifier applied to the result by (he laboratory «the data vabdakx -' to qualto
.*1taf>anCd VOC TF ftaportIflMMT •-M-S3 Alt X^ ssociates c P*gt 10«M6

c c cSeptember 1997
Matrix: Sol
ANALYTICAL CHEMISTRY RESULTSVolatile Organic Compounds
Centre County Kepone Sfte - Pro-Design InvestigationState College! Pennsylvania
933-6333
^Bl
=0COCD
COU>GO
ParameterDfcNorodrfluoremettMneChtorometfaneVkiyt ChlorideBromometfianeChkmethaneTricrtorofluoromethaneAcetoneCarbon Disuffide1.l4fcNoioeflwneMMiytane CMoridej ^ f j **"»*•*"•
2 t-OtcNoroprapane4M£4***metheneBromocNoromefHneCMorofom2-Bulanone1.1.1-TrichtorwtfianeCarbon TetracNorkto1.1-OtoMoropropeneBenzene1,2-DfcMoroethaneTrichtomethene1 -DkMoroprapaneDfcromometianeBfomoolchlofomelnana4 -MclhyM-Pentaoonedt-1.3-DichloropropeneToluenelrans'1 ,3-Ochloropropene1.1.2-Trichtoroethane1.2-Ofcromoethane2-HexanonaTetrachloroethene1,M)tehlofopropane
Sample PointTF061011
Lab ID: L14599-9Date Sampled: 4/30/97Percent SoWs 76.58 %SQL
131313
13131313
-
3
1
1
ResuR13131313131310 .aa14
aa3aa13aaaaa9eee13a20aaa137a
QualuuuuuuJuuBUuuJuuuuuuuu
uuuuu
uuuu
u
DF111111111111111111111111111111,11111
Sample PointTF070304
Lab ID: L 14524-4Date Sampled: 4/23/97Percent Solids 75.98 %SQL
131313131313137777777771377777777713777771377
Result131313131313137721777777137777777771374777137 .7
QualuuuuuuuuuBUu
uuuuuuuuuuuuuuuJuuuuuu
DF
1
Sample PointTF080304
Lab ID: L 14 599-6Date Sampled: 4/30/97Percent Solids 80.36 %SQL12121212121212
a12
12aeaae12ae
Result12121212121241aa8
"• aeeaea7aeeaaeeea12aaeee12ae
QualUUuuuu
uuBuuuuuuJuuuuuuuuuuu
uuuuuu
DF11111111111111111111111111111111111
Sample PointTF080506
Lab ID: L 14599-1 4Date Sampled: 4/30/97Percent Solids 72.96 %SQL141414141414147777777771477777777714777771477
Result Qual DF14141414141429a71577777714777777777147157771477
UUUUuu
uBUuuuuuuuuuuuuuu.uuu
uuuuuu
1111t1111
Notts:Al units are ugfta.DF indicates tie Dilution Factor.SQL indicates tie Sample QuanSaSon Umt,The Qual cokimn MfcatM (he qualifier appted to trie resuH by th« latorrtoiv or the data vaMaW Rete to quaWtodrtnrttoo sheet
10/1/978:49:54 AM Gokter Associate*

September 1997
Matrix: Soft
ANALYTICAL CHEMISTRY RESULTSVolatile Organic Compounds
Centre County Kepone Site - Pre-Design InvestigationState College, Pennsylvania
933-6333
'
t^ •5*^DCOCD
CO
lO
ParameterDibromocMorametianeChlorobenzenel.l.l -TetracHoraettianeElhytbenzenemj)-Xy*anao-XyHneStyranaBvomotonnIsopropylbenzaneBromobBnans1,1.2,2-TatracttQroethane1.2,3-TfKMoropropaMn-Propytoenzana2-CMofDtoiuene4-CNoratoluena1 .3,5-Trime*hyfcenzen*lert-Butytoeraane1 .4-TrtmelnyftianzanattO-ButytMnzanebopropyttokMTw1.3-OfcNorabenzene1,4-DfcNorobenzanal -OicMorabenzeneitButybanzana1 3_nitii • iui_3_iiiliunair— — ™
1,2,4-TrtchtorotoanMn*HexacMorabutadtaneNapMhalanelAJ-Trichtoroljanzene
Sample PointTF061011
Lab ID: L 14599-9Date Sampled: 4/30/97Percent Solids 76.58 %SQL
aft6ft6000e6686ft666
13131313
Result68ft8102ft666
3006ft66ft6ft6ft8ft6661313'1313
QualuUUU
JuuuU
UUuUUUUuuuuuuuuuuu
OF11111111111111 .111111111111111
Sample PointTF070304
Lab ID: L 14524-4Date Sampled: 4/23/97Percent Solids 75.96 %SQL Result
777777777777777777777777713131313
777747777757777777777777713131313
QualuUUUJUUUUuJuuuuuuuuuuuuuuuuuu
OF11111111111111111111111111111
Sample PointTF080304
Lab ID: L 14599-6 'Date Sampled: 4/30/97Percent Solids 80.36 %SQL
ftft6ft6ft6866ft6ft6066ft66ft668812121212
Result66864666664666666066ft6ft6812121212
QualUUUUJUUuuuJuuuuuuuuuuuuuuuuuu
OF.1111111111111111111111
Sample PointTF080506
Lab ID: L1 4599-14Date Sampled: 4/30/97Percent Solids 72.96 %SQL | Result
777777777777777777777777714141414
777767777757777777777777714141414
Qual | OFUUUUJuuuuuJuuuuuuuuuuuuuuuuuu
111111111111111111
111111
ACCEs^
Ai units are ug/kg.Of ndfcatet he Daution Factor.SQL Mfcattt the Sample Quanttaaon Limit
Tual column toftcates Via (natter applied to the resuN by (he laboratory or the <WavaWator^^ to
.ftltaportCM VOC TF ftaport c P«()« 12 Of 18

c cSeptember 1997
Matrix: Soil
ANALYTICAL CHEMISTRY RESULTSVolatile Organic Compounds
Centre County Kepone Site - Pre-Design InvestigationState Coftege, Pennsylvania
933-6333
jarZDCOO
-P- 'OO
ParameterDiCfitorooinuoronieUianeCMoroniQtnaneVinyl ChlorideBromomeVianeChtoroeVianeTricntorafluomrnethaneAcetoneCarbon ENsuffideM-DichloroetieneMHhytone CMorideTrant-U-Okttoroethene1.1-OicMoroeBMne2 -CMcntoropropane
BromocNorornrthaneChterofann2-Butanonel.l.lTricntoroeffoneCarbon Tetrxrtoride1.1-DkttoropropeneBenzene1 -OichtofotfhaneTrichtoroetttene1,2-DicHoropropaneOfcromomeftane_ V tl ' — -BVulWRIJlKkmillULMW
ci»-1,3-0tehloropropeneToluenetanM,3-Ofchtoropropenei TrtcNoroeftane1£4Mbmrnoethane2-H0xanoneTetrachtoroetone1,3-OWitoropropane
Sample PointTF090304
Lab ID: L 14524-5Date Sampled: 4/23/97Percent Solids 83.5 %SQL12121212.121212
e12
12
12
ResuR12121212121254
4
23
12*266612B6
QualUuuuuu
JuBUuuuuu
uuuuuuuuuuuJuuuuuu
DF
111111111111111111111111111111
Sampte PointTF090708
Lab ID: L 14524-3Date Sampled: 4/23/97Percent Solids 75.18 %SQL
13131313131313777777777137777777771377777137 -7
Result13131313131340672077777713777r777 •7713737771377
Qualuuuuuu
JuBuuUUuu.» 'uuuuuuuuuuuJuuuuuu
DF
1
Sample PointTF091112
Lab ID: L 14524- 11Date Sampled: 4/23/97Percent Solids 73.39 %SQL1414'1414141414777777777147777777771477777 "1477
Result14141414141442777777777109777777771477777147 .7
QualUUuuuuB0UJB
: uUUUUuJBUuuuuuuuuuuuuuuuu
DF
111111111111111111
Sample PointTF091112D
Lab ID: L 14524- 18Date Sampled: 4/23/97Percent Solids 75.07 %SQL131313131313137777777771377777777713777771377
Result131313131313477767777771077777777713777771377
QualUU
•UUUUBUUJBUUUuuuJuuuuuuuuuuuuuuuuuu
DF
111111111111
Notes:Al unto are ugftg.
, OF indicatostfM Notion Factor.' .SQL indicates 0ie Sampte Ouantitafion UnitThe Qua! column Mfcatos tie qualifier appfied to the result by the Moratoiy or twditivalidator. Refer to qualifier alefMtkmineet
10*1/978:40:56 Ml

September 1997
Matrix: Soil
AKALYTICAL CHEMISTRY RESULTSVolatile Organic Compounds
Centre County Kepone Site - Pre-Design InvestigationState College. Pennsylvania
933-6333
•gp •zoCOCD03•*-"
ParameterOibromocMoramelhaneChtorobenzene1.1 ,1 -TetracMonathane
' Ethytbenzenam.p-Xyteneo-XyteneStyiBnaBromofonnIsopropytMnzeneBrornobenzene1,1 2-TetracWoroeBwne1.2.3-TrfcWoropropanen-Pfupyfcenzena2-Chtoratoluena4-ChlorolohMne1 .3.5-Trimelhybenzenetoft-Butytoanzene1 .2.4-Trimefryfcanzane•ac-Butytoanzane(Mprepyttoluene1.3-Oicnlorobanzana1.4-Ofehtorobenzene1.2-DcMorobenzanen-Butyttianzana1,2-D*romo-3<htoropropane1 .2.4-TrtcNorobaiueneHexacMorobutadlenaNaphthalene1 ,2,3-Trtchlorobenzene
Sample PomtTF090304
Lab ID: L14524-5Date Sampled: 4/23/97Percent Solids 83.5 %SQL
6e6
666666t6•ft
, ae6ftft12121212
Result6ee4123ft0
a0
30aBeeeae0
0a60a12121212
QualUuuj
juuuuJuuuuuuuuuuuuuuuuuu
DF11111111111111111111111111111
Sample PointTF090708
Lab ID: L 14524-3Date Sampled: 4/23/97Percent Solids 75.18 %SQL
777777777777777777777777713131313
Result777123777771177777
,77777777713131313
QualUUU
JUuuuu
uuuuuuuuuuuuuuuuuu
DF1
11111111
11
Sample PointTF091112
Lab ID: L14524-11Date Sampled: 4/23/97Percent Solids 73.39 %SQL
777777777777777777777777714141414
Result777747777777777777777777714141414
QualUUUujuuuuuuuuuuuuuuuuuuuuuuuu
DF111
1111
Sample PointTF091112D
Lab ID: LI 4524- 18Date Sampled: 4/23/97Percent Solids 75.07 %SQL
777777777777777777777777713131313
Result7773213777777777777777777713131313
QualUUUJ
JUUUUUUUUUUUUuuuuuuuuuuu
DF
1111111111111111111111
AC&v^
Note*:Afl units are pg/kQ.DF indicates the Mutton Factor.SQL indicates tw Sample Quanttation Urn*.
Qual cc^ntn Micates the quaMer appied to ttw result by the laborat
-mbltaportCal VOC IF Rapwt c Page 14 of 16

c c cSeptember 1997
Matrix: Soil
ANALYTICAL CHEMISTRY RESULTSVolatile Organic Compounds
Centre County Kepone Site - Pre-Design InvestigationState College. Pennsylvania
933-6333
-
^B -
3D^^*r
COCD
4^O^^v
ParameterDiehtonxHloorometfianeChtorometfianfVinyl ChlorideBromomettianeChtoroethaneTikJ*ofofluoroinethaneAcetoneCarton DisuMe1.1-DtoNaroeBMneMoBiyfane QitorktoTran*-1J-Oichtoroe1henel.l-Otchtoreetfiane2 -CMchtorepropane
BromocMommrthaneCMoroform2-Butanone1.1.1-TricNofoettianeCartMnTetracntoridei ,1-OichtoioprapeneBenzene1,2-OichtoreethaneTrichtoroethene1.2-DfchbrapropaneDftrontomeftane
44jtelhy^2 Pertanoneds-LS-OichtonprapeneToluene(rans-1,3-Dichtoropn)peM1.1,2-Trichtoroethane1,2-Pbromoelhane2-HexanoneTetrachtoroethene1,3-OicWoiopcopane
Sample PointTF091415
Lab ID: L 14524-1 6Date Sampled: 4/23/97Percent Solids 71.14 %SQL
1414141414141477777 .777714777777777147.77771477
ResuR141414141414167767777771477777777714777771477
Qua)uuuuuuBUUJBUuuuuuuuuuuuuuuuuuuuiruuuu
DFt111i11111ff
1111111111111111111111
Sample PointTF100304
Lab ID: L14611-5Date Sampled: 5/1/97Percent Solids 78.32 %SQL646464646464643232323232323232320432323232323232
32643232323232643232
Result64
6464646449015322232323212323264323232323215032
3265325303232326517032
QualUUUUJuuD
JNUBJUUUJJUuuuuuuu
uUJuuu
uuuu
u
DF555S55S55555555555555S55S5555555555
Sample PointTF100708
Lab ID: L14611-6Date Sampled: 5/1/97Percent Solids 75.24 %SQL33003300330033003300330033001700170017001700170017001700170017003300170017001700170017001700170017001700330017001700170017001700330017001700
ResuR330033003300330033003300900017001700170017001700170017001700170033001700170017001700170069001700170017003300
- 1700790001700170017003300140001700
QualUuuuuuJuuuuuuuuuuuuuuu
uuuuu
uu
:uuu
DF250250250250250250250250250250250250250<ucnZOO
250250250250250250250250250250•*£/!2SO250250250250250250250250250
Sample PointTF100708D
Lab ID: L14611-9Date Sampled: 5/1/97Percent Solids 74.75 %SQL33003300330033003300330033001700170017001700170017001700170017003300170017001700170017001700170017001700330017001700170017001700330017001700
ResuR33003300330033003300330012000170017001700170017001700170017001700330017001700170017001700500017001700170093001700
2400001700170017003300210001700
QualUuuuuuJuuuuuuuuuuuuuuu
uuuuu
uuuu
u
DF250250250250250250250250250250250250250250250250250250250250250250250250
250250250250250250250250250250
"-*---noni; ,
At unto am pgftg. . , •DF Indicates the Mutton Factor.SQL htiales the SamptoOu»n«Mbn Unit. ;The Qual column fndfcates tfte qualifier apptod to tha mm by the laboratory or lh« data vaWakx. Re*er to quafcftsrdefin*oo sheet
ACCESStK.H*1tapcirnCatvOC TF Report1ff1>97a«57AM Colder Associates

September 1997
Matrix: Soil
ANALYTICAL CHEMISTRY RESULTSVolatile Organic Compounds
Centre County Kepone Site - Pre-Destgn InvestigationState College, Pennsylvania
933-6333
•r
SOCOou>•p-o
ParameterDJbromochloiDfnethaneChtorobenzene1.1 .1 -TetracMofoethaneEthyfeenzan*nxp-XylanefrXytaneStyraneBfomofonnbopropyfeenzeneBramobenzeneI.l -Tetrachtofoethane1 ,3-TricMorapropanen-PropyttMnzena2-CNorotoluene4-clriorotoJuBne1 .3.5-Trimethylbenzenetart-Bulyi»nzene1 ,2.4-TmnelhytMnzenastc-ButyKMnzenetaopropyttoluena1.3-Oichtofobenzene1,4-DfcMorobanzene1,2-Dfchbrobenzeneo-ButytMnz«nal -Obronto-S-cttoropropane1 .2.4-TrichtorobenzeneHexachtorabuladianaNaphthalem1.2.3-Trichtorobanzene
Sample PointTF091415
Lab ID: L 14524- 16Date Sampled: 4/23/97Percent Solids 71.14 %SQL
777777777777777777777777714141414
Result777777777797777777777777714a1414
Qua!uuuuuuuuuuB .uuuuuuuuuuuuu
. uuJBuu
DF11111111111111111111111111111
Sampte PointTF100304
Lab ID: L14611-5Date Sampled: 5/1/97Percent Solids 78.32 %SQL3232323232323232323232323232323232323232323232323264646464
Result Qua!323232
270150033032321732
170003232150323232323232323232323264366464
UUU
uuJu
uu
uuuuuuuuuuUJUJJ
UJUJ
DF55555555555555555555555555555
Sample PointTE1 00706
Lab ID: L 146 11 -6Date Sampled: 5/1/97Percent Solids 75.24 %SQL17001700170017001700170017001700170017001700170017001700170017001700170017001700170017001700170017003300330033003300
Result170017001700
40000140000240001700170017001700
730000170017006600170017001700170017001700170017001700170017003300330033003300
Qua!UUU
uuuu
uu
uuuuuuuuuuuuuuu
DF250250250250250250250250250250250250250250250250250250250250250250250250250250250250250
Sample PointTF100708D
Lab ID: LI 461 1-9Date Sampled: 5/1/97Percent Solids 74.75 %SQL17001700170017001700170017001700170017001700170017001700170017001700170017001700170017001700170017003300330033003300
Result170017001700
57000190000330001700170017001700
560000170017008300170017001700170017001700170017001700170017003300330033003300
Qua) OFuu
.u
uuJu
uu
uuuuuuuuuuuuuuu
250250250250250250250250250250250250250250250250250250250250250250250250250250250250250
CJ
ACCfc^ *
Not**:Al units are pg/kg.DF indicates the CMubon Factor..SQL indicate* the Sampto QuanMation Urn*
Qual column indicates the quaMer applied to the feu* by *w laboratory or the data
MbltnfMfttC* VOC TF Report
to quarter definition sheet
Associates c

c cSeptember 1997
Matrix: SoH
ANALYTICAL CHEMISTRY RESULTSVolatile Organic Compounds
Centre County Kepone Site - Pre-Oesign InvestigationState College, Pennsylvania
933-6333
&zoCO
VD4TOjr-
ParameterDkttorodMuoromethaneCMotomethaneWiylCMorktoBromomethaneCNoroethaneTricMorofluoromethaneAcetoneCarbon DtsurRdeIj-DJcMoroeVMfwMolhylens CMwideTrans-l -Otcntoroelhenef.l-Ochtoroelhane2>OichtoroprepBneds-l -OfcMoroetheneBiomocMoromelhaneChtoroform2-Butanone1 ,1,1-TrJcNoroetianeCarton Tettachtoride1,1-OJchtoropiopeneBenzene -1.2-OichtoroetfMneTrichtoroeVwne1,2-DicNorepreoaneDfcremometianeBfornodkMoromethane4 Mdhyt-2-Portanui*cifl ,3-OichtofOprapeneToluenetrans-1 ,3-Ofchtoropropene1.1 -TricNoroetaoel -Oibromoethane2-HexanoneTetnKtrioroethene1,3-Otahloropropane
Sample PointTF101Q11
Lab ID: L 146 11 -7Date Sampled: 5/1/97Percent Solids 72.64 %SQL6969696969696*34343434343434343469343434343434343434693434343434693434
ResuR696969696969
630034343434343428343411034343434
190343434693419034934693434
Qua!UUUUUUJ
UJUUUUUJUUJUUUUU
UUUUUBUJUUUU
DFS5SS5SSSSSS555SS5555S5S5SS555555555
Sample PointTF1 10203
Lab ID: L 1454 5- 10Date Sampled: 4/24/97Percent Solids 85.98 %SQL Result12121212121212 .66666
2
12666661266
12121212121212
12
6612 '666661266
Qual DFU < 1UUUUUUUUUUUUUUUUUUUUUUUUUUUUUUUUUU
11
11
Sample PointTF110508
Lab ID: L 14545-8Date Sampled: 4/24/97Percent Solids 76.2 %SQL
13131313131313666
1366
136666613Q6
Result13170131313133366206666661366666
19006661361064613656
QualU
UuUu
uu
uuuuuuuuuuuuJuuuuu
uJuu
u
DF1111111T11111111
1111
1
Sample Point
Lab ID:Date Sampled:Percent Solids %SQL Result Qual j DF
Al units are pg/kg.DF indicates Vw Dilution Factor.SQL MfcatetBw Sample QuanWation Un*The Qual column Mfcate* t»e quaffier applied to the rest* by tie laborafc^ or the data vaWator. Refer to qoaWw definition sheet
ACCESSta.mb11rapaflCtf VOC TF RapM

September 1997
Matrix: Soil
ANALYTICAL CHEMISTRY RESULTSVolatile Organic Compound*
Centre County Kepone Site - Pre-Design InvestigationState Cotege, Pennsylvania
933-6333
*""
J^3DCOOl*O•4^
ParameterttbromocntoromethaneChtorabenzene1 .1 .1 l-TetrachtooettieneEthyftenzenemj>-Xyleneo-XytoneStyreneBfomofonnboprepytoenzeneBromobenzene1 ,1 £2-Tetmchlaree0iaM1 >Trichlorapropanen-Propytoenzene2-CMorotoluene4-CNorotolueM1,3.5-TrimethylMnzenetert-Butyfeenzene1,2,4-Trimethytjenzenesec-Butyfeenzenetsopropytotuene1,3-Oichlorabenzene1,4-OKhtorobenzene1 -Oichtorabenzanen-Butylbenzene1 "1 rhBlllllllll T 1 IJ-U JUJ JLUJLJL
1 .2.4-TfichtorobenzeneHexacMorobubKlienaNaphthalene1 ,2,3-Trichlorobenzene
Sample PointTF101011
Lab ID: L 1461 1-7Date Sampled: 5/1/97Percent Solids 72.64 %SQL343434343434343434343434343434343434343434
3434
69696969
Result343434656902203434IS34
12000343416034343434343434
18343426696969
QualUUU
UUJNU
UU
UUUUUUUUJNUUJUUU
OFS5555555555555555555555555555
Sample PointTF1 10203
Lab ID: L 1454 5- 10Date Sampled: 4/24/97Percent Solids 85.98 %SQL
666666666666666666666666612121212
Result666666666646666666
12121212
Qua)UUUUUUUUUUJBUUUUUUUUUUUUUUUUUU
OF
11111
Sample PointTF1 10506
Lab ID: LI 4545-8Date Sampled: 4/24/97Percent Solids 78.2 %SQL
666666666666666666
13131313
Result66631246666
250066
1106666
613131313
QualUUUJ
JUUUUJUU
UUUUUUUUUUUUUUU
OF
111111111111111111
Sample Point
Lab ID:Date Sampled:Percent Solids %SQL Result Qual DF
Ocn
ACCV
Notes:Al units are MOAV-DF «*cate» the Deutton Facto.SQLhx»c«»MtheSamp*«QuantrtatonLim<t
Qual column indicates Ihe qualifier applied to the cesutt by the laboratory or the data
.MbltafMNftCal VOC TF RtportIOW97 »4*S» AM Associate* c

September 1997
Matrix: Sol
cANALYTICAL CHEMISTRY RESULTS
Mirex and KeponeCentre County Kepone Site - Pre-Design Investigation
State College. Pennsylvania
C963-6333
'
ParameterMirexKepone
Sample PointTF010304
Lab ID: L14599-8Date Sampled: 4/30/97Percent SoWs 80 %SQL242864
Resuft242
, 664
dualUDUD
DF2020
Lab ID:Date SiPercentSQL23.684.2
Sample PointTF010607
L14599-11ipted: 4/30/97tofidsRemit
79Qua!
7.359.59
JOJD
OF22
Sample PointTF020708
LablO: L14545-13Date Sampled: 4/24/97Percent Solids 83SQL E Result I Qual I11.641.4
11.41.47
DF11
Sample PointTF021112
Lab ID: L14545-11Date Sampled: 4/24/97Percent Solids 83SQL I Result I Qual I11.440.7
7.3240.7
DF11
AR units am M9*9-DF Mkatw the Diutton Factor.SQL indicate* the Sample QumMtfon LimitThe Qual tioMm Meat** the quvMtar •pftiad to •» md by Ihe lateratory or m« data vaidator.Raler to quaffierdefinibon sheet.
COCD10
ACCESStac.mb1%iparflM KTFItaport GoMer Associate*

September 1997
Matrix: Soil
ANALYTICAL CHEMISTRY RESULTSMirex and Kepone
Centre County Kepone Site - Pre-Oesign InvestigationState College, Pennsylvania
963-6333
Sample PointTF021415
Lab 10: L14545-14Date Sampled: 4/24/97Percent Solids 77 %SQL13
46.3
Result13
6.53
QualUJ
DF11
Sample PointTF030304
Lab ID: L14566-7Date Sampled: 4/28/91n.————* f-r.j- atPercent SolidsSQL | Result
82
Sample PointTF030708
Lab 10: L14566-8Date Sampled: 4/28/97
| Parameter| Mirexj Kepone
Notes:Al mitt* are ug/kg.DF indicates the Mutton Factor.SQL indicates the Sample QoanWaton UnitThe Qua! column fndicalM tie quaHfter applied to (he result by the laboratory w the data vaUator. Refer to «ial«erdefinitk)n sheet
Lab ID: L14566-16waw OT..VOT. •*.*.«.». Date Sampled: 4/28/97
rwuvniouM <K % Percent Solids 82 % Percent Solids 83 3SQL | Result [ Qual DF SQL | Result j Qual DF SQL Result Qual DF44.8 j 4.25 JD 4 11.7 5.83 J 1 11.4 3.72 . J | 1160 633 D 4 41.6 136 1 40.7 228 1
Sample PointTF030708D
Lab ID: L145G
ZXJCOo
ACCESSV^ KTFItaRart*n» HXI *-** "JO AU Associates C Pago 2 (X 9

c c cSeptember 1997
Matrix: Soil
ANALYTICAL CHEMISTRY RESULTSMirex and Kepone
Centre County Kepone Site - Pre-Design InvestigationState College, Pennsylvania
963-6333
ParameterMirexKepone
Sample PointTF031011
Lab ID: L14566-9Date Sampled: 4/28/97Percent SolidsSQL11.2160
ResuR
420
82dual
JD
%DF14
Sample PointTF031920
Lab ID: L14566-10Date Sampled: 4/28/97Percent Solids 78SQL j Result Qua!12.2 j 1.93 J433 1669 D
DF1
10
Sample PointTF040304
Lab ID: L14599-2Date Sampled: 4/30/97Percent SolidsSQL115410
Resuft7.452290
83QualJDD
OF1010
Sample PointTF040708
Lab ID: L14599-5Date Sampled: 4/30/97Percent SolidsSQL [ Result240854
2405970
84Qua!UDD
DF2020
Al unite are ugftg.DF todfcafes tfw Dilution Factor.SQL incftcates tie Sampte Quanttation LIT*ThaQual column todkatesthaojialifttapc*Bd to Vwresut byte
3DCOCDID-P-OCO
ACCESStoc.mb1V«porflM KTF Rapcrt Gokter Associates P«gt3of9

September 1997
Matrix: Soil
ANALYTICAL CHEMISTRY RESULTSMirax and Kepone
Centre County Kepone Site - Pre-Design InvestigationState College. Pennsylvania
963-6333
Sample PointTF041112
Lab ID: L14599-13Data Sampled: 4/30/97Percent SoWs 76 %SQL11.7418
Result11.71356
Qua!UD
DF1
10
Sample PointTF041516
Lab ID: L 14599-7Date Sampled: 4/30/97Percent Solids 83 %SQL12
42.7
Result3.3579.5
Qua!J
DF11
Sample PointTFQ50203
Lab ID: L 14666- 11Date Sampled: 4/28/97Percent Solids 79 %SQL121430
Result24.5122
QualJDJD
DF1010
Lab ID:DateS.PercentSQL49.2175
Sample PointTF050708
L14566-12pled: 4/28/97
ParameterMirex
[ Kepone
Notes:Al units are tigAta.DF Indicates the Mutton Factor.SQL indicate* the Sample Quanttatton UnitTfce Qual column indicates the quHKer applied to the result by the toboratocy or trw data vaUtotor Refer to qualifier definition sheet
Result49.2450
79QualUDD
DF44
COCDUD-r-o
ACCESS*. lorflM KTFItaport1«11ST N-U 3D All
L C

c c cSeptember 1997
Matrix: Soil
ParameterMirexKepone
Sample PointTF051112
Lab ID: L14566-13Date Sampled: 4/28/97Percent SolidsSQL16
57.1
Result16
43.5
65Qual
UJ
DF11
ANALYTICAL CHEMISTRY RESULTSMirex and Kepone
Centre County Kepone Site - Pre-Design InvestigationState College. Pennsylvania
Lab ID:Date Sampled:Percent SoKds
963-6333
SQL17.662.9
Result17.662.9
Point32114566-14
4/28/9755 %
QualUU
DF11
Sample PointTF060304
Lab ID: L14599-12Date Sampled:Percent SolidsSQL25
44.6
Result2284.88
4/30/9777 %
Qual0J
DF
2.1
Lab ID:DateSPercenSQL12845.6
Sample PointTF06070B
L14599-4pled: 4/30/97
Result91445.6
79Qual
DU
DF101
Notes:Al units are pg/kg.DF indicate* the Mutton Factor.SQL Jrxiuitu the Sample Qtuntitation LimitThe Qual column todteates to qualifier applied to the rest* by the laboratory or 6w data vaidator. Refer to qualify o finWon sheet
roCOo
CD
ACCCSSWc mt>1V«port*l Colder Associates

September 1997
Matrix: Soil
ParameterMirexKepone
Sample PointTF061011
Lab ID. L14599-9Date Sampled: 4/30/97Percent SolidsSQL12243.4
Result128143.4
77Qual
DU
DF101
ANALYTICAL CHEMISTRY RESULTSMirex and Kepone
Centre County Kepone Site - Pre-Design InvestigationState Cottege, Pennsylvania
Lab ID:Date Sampled:Percent Solids
963-6333
SQL252696
Result252896
Point304.14524-4
4/23/9776 %
QualUDUD
DF2020
Sample PointTF080304
Lab ID: L 14599-6Date Sampled: 4/30/97Percent Solids 80 %SQL11.942.5
Result11.94.87
QualUJ
DF11
Sample PointTF080506
Lab ID: L 14599-1 4Date Sampled: 4/30/97Percent Solids 73 %SQL12.644.8
Result11.244.8
QualJU
DF11
Al units are upykg.DF indicates the Nutton Factor.SQL indicates the Sample Quanttaoon UnitThe Qua! column indicates the quaWar applied to the result by the labocatotyor the data vafetotor.Reto to qualifief definition sheet
COo
ACCESS\i jfMrtlM KTFItafMMIonian 8-4*31 MI GoV.. Associate* c

Septermwrc c
1997
Matrix: Soil
ParameterMirexKepone
Sample PointTF090304
Lab ID: L14524-5Date Sampled: 4/23/97Percent SofidsSQL I Result11.541.1
7.0241.1
64Qua)
JU
DF11
ANALYTICAL CHEMISTRY RESULTSMfrex and Kepone
Centre County Kepone Site - Pre-Design InvestigationState College, Pennsylvania
Lab ID:Date Sampled:Percent SolidsSQL j Result
963-6333
13.247
13.247
Pointros.14524-3
4/23/9775 %
Qua)UU
DF11
Sample PontTF091112
Lab ID: L 14524- 11Date Sampled: 4/23/97Percent Solids 73 %SQL14.250.6
Result6.1150.6
Qua!JU
DF11
Lab ID:DateSPercentSQL12.544.7
Sample PointTF091112D
L14524-18ipted: 4/23/97JolkJsResuM7.7144.7
75Qual
JU
DF11
Al units are ugflcg.DF indicates the Diufen Factor.SQL jhdcates the Sample QuanttaOon Urn*Tne Qua! column indfcates to qualifier appfed to the result by the laboratory or Ihe data vafafator Refer to quafcfierdefinrtton sheet
30COCD
ro
ACCESS\*cmb1V*porflM KTF Report1W1J97 B:4fr31 AM
Colder Associates

September 1997
Matrix: Soil
ParameterMirexKepone
Sample PointTF091415
Lab ID: L14524-16Date Sampled: 4/23/97Percent SolidsSQL14
49.8
Resut11.34.39
71Qua!
JJ
DF11
ANALYTICAL CHEMISTRY RESULTSMirex and Kepone
Centra County Kepone Site - Pre-Design InvestigationState College, Pennsylvania
963-6333
Sample PointTF100304
Lab ID: L14611-5Date Sampled: 5/1/97Percent SolidsSQL256910
Result1140910
78Qua!
DUD
DF2020
Lab ID:Date Sampled:Percent SolidsSQL266948
Result680948
Pointros.14611-6
5/1/9775 %
QualD
UD
DF2020
Sample PointTF100708D
Lab ID: L 146 11 -9Date Sampled: 5/1/97Percent Solids 75 %SQL266952
Result745952
QualD
UD
DF2020
Al unite araDF Indicate* toe Dilution Factor.SQL indicate* tie Sample QuanWatton Untt.The Qua! column inchoates fte quaWwr applied to lie result by the laboiatonr or ite data vaMator. Refer to «ialite definition sheet
COCD
ACCESS^ .mpotflM KTFftaport C Pago 04 •

c c1997
Matrix: Soil
ANALYTICAL CHEMISTRY RESULTSMirex and Kepone
Centre County Kepone Site - Pn*Oesign InvestigationState College. Pennsylvania
963-6333
ParameterMirexKepone
ar
Sample PointTF101011
LabtD: L 146 11 -7bate Sampled: 5/1/97Percent SoWs 73 %SQL13.849.1
ResuK31.549.1
Qua)
U
DF11
Lab ID:DaleS.PercentSQL11.842.2
Sample PointTF110203
U4545-10ipfed: 4/24/97iolkJsResult11.842.2
86QualUU
DF
11
Sample PointTF1.10506
Lab ID: L14545-8Date Sampled: 4/24/97Percent SolidsSQL12.745.3
Result5.3445.3
78Qual
JU
DF11
Sample Point
Lab ID:Date Sampled:Percent SolidsSQL I Result I Qual DF
NotnzAl unto are pgftg.DF imfcates the Dilution Factor.SQL indicates fwSamp4eQu«rtitatonLJrr*The Owl column Indicates »* quaHBw appRad to tw rest* by the latoraWyof trw data vafcdato-Refer to quaWw<Jrfnrtionsh«t
GOCDto
ACCESStoC-mbltaporMI K TF Report1(W«7 8:40:32 Ml GokJer Associate PagtSol*

r
u

LEGEND
AR309U
*» •»-• 923-4112 AS SHOW04/05/06PA17-285
07
Golfer Associates
K - AclO~°*cni2 (opm
K - 1x10 on (ooncraU)
K - Ixttf " on2 (<MpMt)
BEMOCK SVC MIL
SVC «U. M OVERBURDEM
EXIS1MG
V337
approximate seal* feat
LAYER t PERMEABHJTYFOR CALIBRATED MODEL
RNC/STATE COU£G ) \ D-1

DLEGEND
AR309M7
923-8112 AS SHOWN04/05/WPA17-288
07
Golder Associates
K - i9»l610an2 (Ml)
K - t.2xtO°*cm2 (md-flM hyfrofroc)
BEDROCK SVE VEIL
SVC WELL W OVERBURDEN
POSIMtG KLL
NOV 0 6 199724=^^=^^"»
approximate seal*
243
feet
LAYER 4 PERMEABILITYFOR CALIBRATED MODEL
RNC/STATC COLLEGE/PA ["" D-g

fc-
LEGEND
K - 3.9xl<fcm2 (M!)
K - 1MO on2 (Mnd-flM
•1J- BEDROCK S« «a
•^- S« Wit M OWRBURDEH
•<$)- EMS1MG WEU
• HOV 0 6 1997
z * _ ^ o _ ^ ^ 2 ^approximate scale feet
AR309MJ ^
»•*= 923-6112<*•* we««« Tlh^»« =K,
««= AS SHOWN•«* 04/OS/W« "« PA17-290M«*>1& 07
GfilckT AfiMM*iatw
LAYER 6 PERMEABILITYFOR CAUBRAT^H. MODEL
RNC/STATE CCUfifc.^/ ~D-3

LEQEND
AR309U9
923-6112 AS SHOWN04/OS/WPAI7-3O7
07
G<dder Associates
9UULATED OVERBURDEN HELL
EMULATED BEDROCK HELL
24
MOV 0 ti
0 24
approximate seals feet
SCENARIOS 3 AND 4SVE WELL LOCATION PLAN
RNC/STATC COUE(^/PA D-4

LEGEND
' —10 2K - 3.9x10 cm (gol)
K - 1 JMOa"an2 (wnd-fltod hydrofroe)
BEDROCK SVEVEU
SVE VCLL M OVERBURDEN
DOS1WG VEIL
NOV 0 6 e^'
24 0 24
approximate scale feet
)*• •« 823-6112»wr. ^yg
°*** Tlfrt—
"*"* +^
«**= AS SHOWN•** 04/05/96«"« PA17-308BIIMIU 07
Golder Associates
LAYER 4 PERMEABUTFOR SCENARIO 4
RNC/STATE COLU J*
r MAP
""""D-5

Cno

MPUT PARAMETERS
AIRS)GRC
RNCS
GRND(cm*)
fcM)0"
ASPLT(cm*)
«.-"
CONC(cm')
,o-"
fi.L(em*)
wo—
Ti-L(cm')
J*-"
FRAC(em2)
..«-"
BDRK(cm*)
10-*
E«-2(otm)
069
EW-3(aim)
O6S
PEW-2(gtm)
OW
E«-l(aim)
aes
RESULTSTOIAL
ALL LAYERS
V 1 M(elm) |(- '-
6.B
LEGEND
-K——K——*— FENCE
-<Jj- MONITORING WELL
- - SVE WU IN OVERBURDEN
-& SVE VCLL IN BEDROCK
CONTOURS OF ABSOLUTE PRESSURE
•• 065 - 0 W oun
a0.70 - 0.75 aim
075 - Ottaun
OBO - O8S gtm
0.90 - 0-83 oun
CM
Orr>or
NOTES
RESULTSi.) WOIUOUM. EimACiKM RAIES
W-l - 1 80 dmBR-] - 1 7t dmEW-1 » 1 » elmEH- 3 . Ml dm
24KOV 0 G V337
0 24
approximate scale feet
923-6112
Hi'-'t /
AS SHOW*04/05/96PA17-292
"• SUBimt
Associates
CALIBRATEDLAYER 3
PRESSURE Cr ^3URS
RNC/STATE

O
LEGEND
-X——X——X— FENCE
- MONITORING WELL
- SVE WELL IN OVERBURDEN
4} SVE WELL IN BEDROCK
COHTOUB3 OF ABSOLUTE PRESSURE
^B O 65 - 0 TO otm
D » CM
COoc
0.85 - 0.90 aim
090 - 0« otm
NOTESI.) MSULR OeiMHED FROM
MXH. IMSSMULA1NN& «CRSON 1 II
RESULTSi.) MOMUM. E< mACno* MAIES
BR-t - IX> chiBH-2 - 1 II ftnfW-2 - I-SS elmEW-1 • 1J1 «*"
MPUT PARAMETERS
AIR JOGRID
mn
kGfiNP(tm1)
3.10°"
k»SWT(cm?)
10""
kconr(em'}
,o-"
KFNI
(cm'}
-00JnlO
k«_i
(cm')
J*-1"
kFRAC(cm^J
..H-"
k8DRK(cm'}
.o-"1
PBR-2(otm)
0*J
PEW-3(aim}
06i
PEW-2(aim)
oes
P8R-1(aim)
oes
RESULTSTO
ALL L
(ctai)
6 a
!ALAttRS
(9/tc)
ze
«MEAS SHOVWJ
04/05/96P*l 7-293
Colder Associates
approximate scale feet
CALIBRATED MODELLAYER 4
PRESSURE CONTOURSRNC/STATE COLLEGE/PA E-2

X —— X — - *— FENCE
MONITORING ¥CLL
SVE WELL IN OVERBURDEN
SVE HELL IN BEDROCK
CONTOURS OF ABSOLUTE PRESSURE
) RESULTS oarMWD rnoi MRJO* SMULADQNS: tcftsKM 1.11.KPML IMS.
1) MnUiML EXOUCMN IU1ES_ BR-1 - 1.80 elm
W-I - ICW-2 - I.*S (*•
l.]l din
NOV **"0 24
WPUT PARAMETERS
Wfi30CRC
mcs
CRND(cm*)
-OB*.iiT^
ASPLT(cm )
w""
CONC(ctn )
10-"
FILL(an2)
J*10°*
ILL(cm2)
i9E-'°
fRAC(cmZ)
,.a-M
BOAK(cm')
.0-"
PBR-2(otm)
o.es
PEW-3(aim)
0«
PEW-2(otm)
asi
PBR-1(otm)
a 65
RESULTSTOTAL
ALL LAYERS
V 1 M(ctm)k"'-^)
66
approximate scale feet
923-6112WUC
AS SHOWN
04/05/96PA17-294
Colder Associates
CALIBRATED MODELLAYER 5
PRESSURE Cr
RNC/STATE COLLEC E-3

INPUT PARAMETERS
A1R3OGRID
mcs
CRND(tm*)
JntO°"
ASPII(cm')
,0'"
CONCtern')
.0-"
FILL
tern1)
3rtO*
TILL(cm*)
3*-'U
FRAC(cm")
..a-0"
kBDRK(cm')
to""
PBR-Z(atm)
0.63
PEW-3(otm)
0.65
P£*-3(atm)
OGS
PBR-1(aim)
0*5
RESULTSTO
AU LV
(cfm)
6.0
IALA>tRS
M(fl/^c)
ZG
LEGEND
-*——*——»— FENCE
-<&- MONITORING WELL
-&• SVE WELL IN OVERBURDEN
-fe SVE NELL IN BEDROCK
CONTOURS OF ABSOLUTE PRESSURE
^H 0.65 - O.TO aim
^^H O.TO - OL7S dim
1 I 0.75 - O.00 aim
^9 080 - O85 aim
^H 0 85 - 0 90 aim
^H osw - 0-»s mm
NOTES_________________1.) RESLL1S OBIiUNEO FMOU MtlfP SUULATKMS: VOKKm I 1
RESULTS________________i.) MMOUM. cinucnoN RAIES
BH-1 - I .*) <HmBR-2 - 1 71 dmlm-2 - I *S **•E»-3 - 1.11 dm
inCM-*atoCOcc
24 0 24
approximate scale feet
923-6)12
WUEAS SHOWN
04/05/96CALIBRATED MODEL
LAYER 6PRESSURE CONTOURS
Colder Associates RNC/STATE COLLEGE/PA E-4

INPUT PARAMETERS
AK3OGRID
RHCS
kGRND(em^)
«o"
kASPLI(emS)
,o-lt
kCONC(en,')
,0-'
k(TLL
(cm2)
wo*
kHU
(cm')
3.*-10
kFRAC(an*)
1**
kBORK(cn.2)
,0-™
PBfi-Z(atm)
O6S
PEW-3(atm)
oes
PF.W-2(aim)
0-65
PBH-1(aim)
O.S5
RESULTSro
ALL L
V(etm>
6.B
IALAVERS
(«Ae)
LEGEND
-X——X——X— FENCE
•ty MONITORING WELL
^ SVE WELL IN OVERBURDEN
Xj SVE WELL IN BEDROCK
CONTOURS OF ABSOLUTE PRESSURE
a an - aw mm
040 - OK mm
o.ts - aso «m
090 - 0*5 abn
CM_*cnCDCO0=
NOTES1.) ffSULK OBTMNCD FMMtea*. i»»j
9HUAnOH& tCMSlOM 1.1].
RESULTSI.) MNVDUM. EIIIUCnON RAIES
W-l - 1 JO dmBR-2 • 1.71 dmEW-I - 1.95 dm«-, . in dm NQV 0 jj
24 0 24
approximate scale feet
923-6112WHE
if*.
AS SHOWN04/05/96PA17-296
Gaidar Associates
CALIBRATED MODELLAYER 7
RNC/STATE COLLEGE. E-5

..y.
<
.. .J
- j
"ft"--"-1—^-—-*..

November 1997Table F-1
Data Set used for VOC Mass Calculation
963-6333
Sample ID
TF010304TF010607TF020708TF021112TF021415TF030304 •TF030708TF031011TF031920TF040304TF040708TF041112TF041516TF050203TF050708TF051112TF052021SB-3ASB-3bSB-3CSB-4aSB-4bSB-4cSB-5aSB-5bP-1P-2P-3P-4P-5P-6E-1BR-1BR-2
EASTING
1952111195211119520961952096195209619520711952071195207119520711952094195209419520941952094195211619521161952116195211619522021952202195220219521621952162195216219520881952088195212119521191952103195209719520841952141195210919520861952136
NORTHING
239791.7239791.7239813.6239813.6239813.6239829.2239829.2239829.2239829.2239857.7239857.7239857.7239857.7239890.7239890.7239890.7239890.7239983.5239983.5239983.5239888.5239888.5239888.5239813.8239813.8239881.5239854.6239852.3239843.1239821.4239845.1239860.9239801.5239883.2
Depth of Sample[ft. bgs]3.56.57,511.514.53.57.510.519.53.57.511.515.52.57.511.520.512.35161912.168
2.2516.65.484.54.99.55.27.257.157.35
Total VOCConcentration
[us/kg]2215823672665902320175
1040001527728085128460001727000220110
2066103711210062935742594065290239229071911288374928322
34567411648031094011784028411001779
•280860158
• 24936
z:\projects\963-6333\sve\97flnal\Tbl-f1.xls\ Colder AssociatesAR309i»28
Page 1 of 1

November 1997 Table F-2Total VOC Mass Within SVE Capture Zone
963-6333
Total VOC Mass Calculation • Depth Interval: 0 ft to 6 ft Below Ground Surface (bgs)Isoconcentration
AreaIA6IA5IA4IA3IA2IA1
Sub-Total
AiIff]
4,7656,9183,0275.043
655468
h[ft]
666666
VI[ft']
28.59041.50818.16230.2583.9302,928
[mj]810
1.17551485711163
Pfkg/m*]
1.9001,9001.9001,9001,9001,900
Msoll[kg]1,538,2082.233.226
977.1571.627.950
211.443157.533
CI[kg/kg]5.0E-075.0E-065.0E-055.0E-045.0E-031.6E-02
20.896 125,376 3.550 6.745.517
MeP<g]
7.69E-011.12E+014.89E+018.14E+021.06E+032.84E+03
4,768
Total VOC Mass Calculation • Depth Interval: 6 ft to 10 ft bgs
Total VOC Mass Calculation - Depth Interval: 10 ft to 14 ft bgs
Total VOC Mass Calculation - Depth Interval: Lower than 14 ft bgs.
IsoconcentrationArea
IA6IA5IA4IA3IA2IA1
Sub-Total
Ai[ft*]
7,8342,7292,2977,068
468500
h[ft]
444444
VI[ft*]
31.33610,9169.186
28,2721.8722,000
(ml6873092608015357
PIkg/m8]
1.9001.9001.9001,9001,9001,900
Msollfkg]1.685.949
587.306494.336
1.521.099100,718107,605
a[kg/kg]5.0E-075.0E-065.0E-055.0E-041.7E-032.8E-03
Me[kg]
8.43E-012.94E+002.47E+017.61 E+021.74E+023.06E+02
20,896 83.584 2.367 4,497,011 1,269
IsoconcentrationArea
IA6IA5IA5IA4IA3Bedrock 1Bedrock 2
Sub-Total
AI[ft*]
1,2376.9151.8562.755
6161,5805,737
20,896
h[ft]
4444400
VI[ft*]
4.94827.6607.424
11.0203.264
00
54,316
[ml1407832103129200
1.538
P[kg/m']
.900
.900
.900
.900
.900,900,900
Msoil[kg]
266,2141.486.172
399.428592.901175,611
•• •
2.922.326
a[kg/kg]5.0E-075.0E-065.0E-065.0E-052.7E-04O.OE+00O.OE+00
MC[kg]1.33E-017.44E+002.006*002.96E+014.68E+01O.OOE+00O.OOE+00
86
IsoconcentrationArea
IA6IA5IA4Bedrock 1Bedrock 2
Sub-Total
AII*1]
6.4401.7782.3182,6197,741
h[ft]
42800
VIIff]
25.7603.556
18,54400
[ml729101525
00
PIkg/m']
1.9001,9001.9001,9001,900
Msoil[kg]1,385,947
191,321997.710
••
Ci[kg/kg]5.0E-075.0E-065.0E-05O.OE+00O.OE+00
Me[kg]6.93E-019.57E-014.99E+01O.OOE+00O.OOE+00
20,896 47.860 1.355 2.574,978 52
Total 311,136 8,810 16,739,832 6,174
g:\projects\963-6333\SVEYTbl-f2.xls Colder Associates A R 3 0 9 t » 2 9

November 1997 963-6333Table F-3
Total VOC Mass Within Excavation ZoneTotal VOC Mass Calculation • Depth Interval: 0 ft to 6 ft Below Ground Surface (bg»)
Sub-Total
Isoconcentratlon Area
IA6IA5IA4IA3IA2IA1
VI[ft"J
1534066649883
1715439302928
[ml434.38168.70279.86485.75111.2982.91
P[kg/m3]
190019001900190019001900
MSOIIIkg]
825,327358,539531,728922,925211,443157.533
Cf[kg/kg]5.0E-075.0E-065.0E-055.0E-045.0E-031.8E-02
55,899 1,583 3,007.495
Me
Peg]4.13E-011.79E+002.66 E +014.61 E+021.06E+032.64E+03
4.363
Total VOC Mass Calculation • Depth Interval: 6 ft to 10 n bgs
Sub-Total
Total VOC Mass Calculation • Depth Interval: 10 ft to 14 ft bfls
Sub-Total
Total VOC Mass Calculation - Depth Interval: 14 ft to 20 ft bgs.
Sub-Total
Isoconcentratlon Area
IA6IA5IA4IA3IA2IA1
VImi
016443553
1674218722000
[ml0.00
46.55100.81474.08
53.0156.63
P[kg/m3]
190019001900190019001900
Msoil[kg]
1
88.451191,160900,758100,71.8107,605
Cl[kg/Kg]5.0E-075.0E-065.0E-055.0E-041.7E-032.8E-03
MePeg]
O.OOE+004.42E-019.56E+004.50E+021.74E+023.06E+02
25,811 731 1,388,691 940
I soconcen (ration Area
IA6IA5IA4IA3IA2IA1 |
VI(ft0)
222067396208
000
[ml62.66
190.83175.79
0.000.000.00
PIkg/m3]
1900.19001900190019001900
Msoll[kg]
119,441362,574334,005
-V
-
Cl[kg/kg]5.0E-075.0E-065.0E-052.7E-04
O.OE+00O.OE+00
Me[kg]
5.97E-021.81E+001.67E+01O.OOE+00O.OOE+00O.OOE+00
15,167 429 816,019 19
I socon centra lion Area
IA6IA5IA4IA31A2IA1 J ______
VI[ftl
494315251123
000
[ml139.9743.1631.800.000.000.00
P[kg/m3!
190019001900190019001900
Msoil[kg]
265,94582,04960,420
---
Cl .[kg/kg]5.0E-075.0E-065.0E-055.0E-045.0E-031.8E-02
Me[kg]1.33E-014.10E-013.02E+00O.OOE+00O.OOE+00O.OOE+00
0 7591 214.95 408,413 4
Total 104.468 2,956 8,620,619 5,345
O:\prefectB\9e3-6333\sve\S7flnanTbM3.xls Golder AssociatesAR309 t *30
Page 1 of 1

ILEGEND
SB-3
E-8R-2.
Rl PHASE I MO H SQL BORINC LOCATION(LOCATIONS APPROXIMATE)
PO SOL BOONG LOCATION
SUE PIEZOMETER MONITORMC NEU.
SVE OVERBUMXM EXTRACTION HELL
S« BEOROCK EXTRACTION MELL
AREA OF SUE REMEDIATION
NOTES1.) THE SAMPLE LOCATIONS NEAR BUILOMC ft WTH
EXCEEDENCES MLL NOT UNDERGO EXCAVATION DUE TOTHE PROXMTY OF THE BUUMNCS. TANKS. OVCRHEAOeOUPUENT AND OMCOMC OPERATIONS ACTHITIES. THESEAREAS CAN BE TREATED BY SUE..
2.) BOUNDARIES AND AREAS ARE APPROXMATE AND Wi.BE FURTHER DEFMED DURING THE REMEDIAL DCSWN AMDREMEDIAL ACTKM.
REFERENCES1.) TOPOCRAPMC FEATURES TAKEN FROM OK3TAL FUS
TITLED "BASE" DATED O6/OV*7 AND *15t012Or DATED06/09A7 SUPPLIED BY MTTANY CeoSOENCES. MC.
2.) LOCATION OF PROPERTY LINE. MONITORMG HELLS ANDPOI SOL BORMGS TAKEN FROM CMQTAL FILE TITLED•SPC* DATED 06/02/97 SUPPLED BY SKETLANOEHONEERINC * ASSOCIATES. MC.
1) LOCATION OF • PHASE I AND • SOL BORWCS TAKENFROM OCTAL FIE -PA17-169" DATED 10/14/WPREPARED BY COLDER ASSOCIATES INC.
NOV0689?20escale
203
feet
AR309U3
DWAS SHOWN1I/D7/B7PA17-372
07
•kdder Associates
ISOCONCENTRATION MASS AREASEXCAVATION LAYER 0 TO 6 FTTANK FAHM/BULD > AREAS
RUETGERS-HEASC F-1

o o
LEGENDSB-3-
tr-iu
E-3
BR-*
ft PHASE I AND II SQL BORMC LOCA1KW(LOCATIONS APPROXIMATE)
POI SOL BORING LOCATION
SVE'PGOMETER MOMTORMC HELL
SVE OVERBURDEN EXTRACTION WELL
SVE BEDROCK EXTRACTION NELL
AREA OF SVE REMEDIATION
NOTES1.) THE SAMPLE LOCATIONS NEAR BUUMNG f\ WTH
EXCEEOENCES HULL NOT UNDERGO EXCAVATION DUE TOTHE PROXIMITY OF THE BUILDINGS. TANKS. OVERHEADEQUPMENT AND ONGOMG OPERATIONS ACTIVITIES. THESEAREAS CAN BE TREATED BY SVE.
2.) BDUNDARCS AND AREAS ARE APPROXIMATE AND MLLBE FURTHER OEFHED DURING THE REMEDIAL DESIGN ANDREMEDIAL ACTION.
REFERENCES1.) TDPOGRAPHC FEATURES TAKEN FROM (MQTAL FILES
TITLED •BASE" DATED 06/D5/B7 AND 'l51012Or DATED06/09/97 SUPPLIED BY MTTANY CEOSOENCES. MC.
2.) LOCATION Of PROPERTY LINE, MOMtORMC NELLS ANDPDI SOIL BOftMCS TAKEN FROM DKITAL FILE TITLED•SPC" DATED 08/02/B7 SUPPUED BY SNEETLANOENGMEERMC * ASSOCIATES. MC.
3.) LOCATMN OF Rl PHASE f A*W • SCC BORMGS TAKENFROM ttOTAL RLE "PA17-169* DATED 10/14/93PREPARED BY COLDER ASSOCIATES INC.
AR309U32
"« 963-6U3 AS SHOWN
11/07/97
PA17-37307
Goider Associates
ISOCONCENTRATION MASS AREASEXCAVATION LAYER 0 TO 10 FTTANK FARM/BUUNNQ «1 AREAS
RUETGERS^EASE CORPORATION F"2

I
LEGENDSB-3
**
BR-2,
RJ PHASE I AND n 500. BORING LOCATION(LOCATIONS APPROXIMATE)
PCX SOIL BORING LOCATION
S\€ PIEZOMETER UQNJTORMG «ELL
SVE OieRBUROEN EXTRACTION WELL
AC BEDROCK EXTRACTION KLL
AREA OT SVt REMEDIATION
NOTES1.) THE SAMPLE LOCATIONS NEAR BtMDMG fl MtH
EXCCEOENCES «U. HOT UNDERGO EXCAVATION DUE TOTHE PROXHITY OF THE BULDWCS. TANKS. OVERHEADEQUIPMENT AND ONGOING OPERATIONS ACTMDES THESEAREAS CAN BE TREATED BY SVE.
2.) BOUNDARIES AND AREAS ARE APPROXMATE AND WU.BE FURTHER DEFINED DURING THE REMEDIAL DESIGN ANDREMEDIAL ACTION.
REFERENCES1.) TOPOGRAPHK: FEATURES TAKEN FROM DIGITAL HLES
TITLED "BASE" DATED 06/DS/B7 AND 151O12O7" DATED06/DB/47 SUPPUEO BY MTTANY GEOSQENCES. MC.
2.) LOCATION OF PROPERTY UNE. MOWTORMG WELLS ANDPOI SOL BORWGS TAKEN FROM DIGITAL RLE TITLED*SPC" DATED 06/02/97 SUPPUEO BY SMEETLANDENGMEERWC * ASSOCIATES, MC
3.) LOCATKM OF W PHASE I AND II SOL BORINGS TAKENFROM OtfTAL FU VA17-169' DATED TO/I4/M
, PREPARED BY COLDER ASSOCIATES INC.
flR309U3
>•" 963-UJ3DVD
AS SHOW11/07/97
•M •« PA17-37407
ISOCONCENTRATION MASS AREASEXCAVATION LAYRMP TO 14 FT
TANK FARM/BIT Vl AREA
RUETGERS-NEASE F-3

o
LEGEND
W-2.
Rl PHASE I AND H SOU. BORMG LOCATION(LOCATIONS APPROXIMATE)
PDI SON. BORMG LOCATION
SVE PIEZOMETER HOMTORWG WELL
SVE OVERBURDEN EXTRACTION WELL
SVE BEDROCK EXTRACTION WELL
AREA OF SVE REMEDIATION
NOTES1.) THE SAMPLE LOCATIONS NEAR BUUNNG fl WTH
EXCEEOENCES WLL NOT UNDERGO EXCAVATION DUE TOTHE PROXIUTY OF THE BUILDINGS, TANKS. OVERHEADCOmPUENT AND ONGOING OPERATIONS ACTIVITIES. THESEAREAS CAN BE TREATED BY SVE.
2.) BOUNDARIES AND AREAS ARE APPROXMA1E AND MLLBE FURTHER DEFINED DURING THE REMEDIAL DESIGN AMDREMEDIAL ACTION.
REFERENCES1.) TOPOCRAPMC FEATURES TAKEN FROM OCTAL FILES
TITLED "BASE* DATED 06/05/97 AND '15101207* DATED06/00/97 SUPPLIED BY WTTANY GEOSOENCES. MC.
2.) LOCATION OF PROPERTY UNE. MOMTORMC NELLS ANDPDI SOIL BORMGS TAKEN FROM DIGITAL FILE TITLED•SPC* DATED 06/D2/97 SUPPLIED BY SWEETLANOENCMEERINC It ASSOaATES. fftC
1) LOCATION OF R PHASE I AM) H SOU. BORMGS TAKENFROM 00TAL FILE *PA17-W DATED 10/14/93PREPARED BY COLDER ASSOCIATES INC
feet
AR309l*3li
363-6333 AS SHOW11/07/97PA17-373
07
Gaider Associates
ISOCONCENTRATION MASS AREASEXCAVATION AT LAYER 14 TO 20 FT
TANK FARM/BUUMNQ -1 AREA
RUETGERS-NEASE CORPORATION I F~4

LEGENDSB-3
•
1F-11-&
•
BR-2.
NOTES
JU PHASE I AND • SQL BORING LOCATION(LOCATIONS APPROXIMATE)
TO SOL BORING LOCATKM
SVE PCZOVeTER MONITORING NELL
SVE OVERBURDEN EXTRACTION NELL
SVE BEDROCK EXTRACTION 1KU
APPROXMATE AREA OF SVE REMEDIATION
1.) THE SAMPLE LOCATIONS NEAR BUILDING fl NTHEXCEEOEMCES WLL NOT UNDERGO EXCAVATION DUE TOTHE PROXMTV OF THE BULOMCS. TANKS. OVERHEADEQUPUENT AND ONGOMC OPERATIONS ACDVJTCS. THESEAREAS CAN BE TREATED BY 5VC
2.) BOUNDARIES AND AREAS ARC APPROXMATE AND WLLBE FURTHER OEFHEO OURMC THE REUEDML OESKN ANDREMEDIAL ACTION.
REFERENCES1.) TOPOGRAPHC FEATURES TAKEN FROM OK3TAL FILES
TITLED •BASE' DATED OS/DS/K AND isioixir DATEDOB/D9/B7 SUPPLIED BY MTTANY GEOSQENCES. MC.
2.) LOCATKM OF PROPERTY LME. MOMTORWG NELLS ANDPOI SOL BORINGS TAKEN FROM DKlTAL FILE TITLED•SPC" DATED 06/02/97 SUPPLED 8V SHCETLAWENOMEERWC Jt ASSOCIATES. MC.
3.) LOCATION OF n PHASE I AND • SOL BORINGS TAKENFROM DKaTAL RLE fAI 7-169* DATED 10/14/83PREPARED BY COLDER ASSOCIATES MC
NOVOfi
20escale
20afeet
«»: 963-6333DUD
AS SHOW*11/07/97PA17-376
07
Bolder Associates
AREA OF SVE INFLUENCEISOCONCENTRATION MASS
AREAS IN 0 TO "FT LAYERTANK FARM/BUT A«1 AREAS
RUETCERS-NEASE COK

LEGEND
Rt PHASE I AND fl SON. BORING LOCATION(LOCATIONS APPROXIMATE)
POI SOL BORMG LOCATION
SVCfCZOUETER MGMTORMC VCLL
£-3
8R-2
sve OVERBURDEN EXTRACTIOH WLL
SVE BEDROCK EXTRACTION vat
APPROXMATE AREA OF SVE REMEDIATION
NOTES1.) THE SAMPLE LOCATIOHS NEAR BULDMG fl MTH
EXCEEDENCES Mil MOT UNOERCO EXCAVATION DUE TOTHE PROXMTY Of THE BUUJNNCS. TANKS. OVERHEADEQUPUENT AND ONCONC OPERATIONS ACTIVITIES. THESEAREAS CAN BE TREATED BY SVE.
2.) BOUNOARCS AND AREAS ARE APPROXIMATE AND WLLBE FURTHER DEFINED DURING THE REMEDIAL OCSKM ANDREMEDIAL ACTION.
REFERENCES___________________1.) TOPOCRAPHC FEATUKS TAKEN FROM OtGtTAL FLES
TITLED •BASE* DATED osAe/97 AND •»ioi2or DATED06/09/97 SUPPUEO BY MTTANY GEOSOENCES. MC.
3.) LOCATION OF M PHASE I AND II SOL BORINGS TAKENFROM DK3TAL RLE -pAtT-ISfl- DATED 10/14/93PREPARED BY COLDER ASSOCIATES INC.
flR309l*36
-• "« 963-6333MK DUO
OMMt 1 ]V« '
•vn (^TtJLi
«** AS SHOWN
•»* 11/07/97«•" PA1 7-377• ••MO 07
Golder Associates
AREA OF SVE INFLUENCE(SOCONCENTRA1TON MASS
AREAS IN 0 TO 10 FT LAYERTANK FARM/BUUNNQ "1 AREAS
RUETGERS-NEASE CORPORATION | F'6

LEGEND
"-vTF-U.
Rl PHASE I AW H SON. BORMC LOCAHON(LOCATIONS APPROXUA1E)
POt SOL BORMC LOCATION "
SW PCZOUCTER UQNITQRMG WEL1 ,
SVE OKRaUROEN EXTRACTION «QX
SVE BEDROCK EXTRACTION WELL
APPROXHATE AREA OF SVE REWEDUT10N
NOTES1.) THE SAMPLE LOCATIONS NEAR SWLOWG fl WTH
EXCEEDENCES MLL NOT UNDERGO EXCAVATION DUE TOTHE PROXMTY OF THE BUILOMCS. TANKS. OVERHEADEQUPUENT AND ONGOMC OPERATIONS ACRMTIES. THESEAREAS CAM BE TREATED BY SK.
Z) BOUNOARCS AW AREAS ARE APPROXIMATE AW MILBE FURTHER OEFMEQ DUfONG THE REMEDIAL DESIGN ANDREMEDIAL ACTION.
REFERENCES1.) TOPOGRAPHC FEATURES TAKEN FROM DISTAL FILES
TITLED 'BASE' DATED 06/05/97 AND *1S101207* DATEDOB/M/97 SUPPLIED BY MTTAMY GEOSQENCES. MC.
2.) LOCATION OF PROPERTY UNE. MOMTORMG 1CLLS AWPOt SOL BORMGS TAKEN FROM DIGITAL FILE TITLED•SPCrOATED 06/02/9? SUPPUEO BY SHEETLANOENGMEERWC * ASSOCIATES. MC.
3.) LOCATION OF M PHASE I AND fl SOL BORINCS TAKEN -FROM DIGITAL FIE "PAI7-169- DATED 10/14/UPREPARED BY COLDER ASSOCIATES MC.
20e•cole
20afeet
AR309437
983-6331DVD
AS SHOWN11/07/97PAI7-378
07
Colder Associates
AREA OF SVE INFLUENCEISOCONCENTRATION MASS
AREAS IN 10 TO ^T LAYERTANK FARM/BUl 11 AREAS
RUETGERS-NEASE

LEGEND
E-3,
8R-2.
n PHASE I AW II SOIL BORING LOCATION(LOCATIONS APPROXIMATE)
POt SOR. BORING LOCATION
SVC PIEZOMETER UOMTORMG WELL
SW OVERBURDEN EXTRACTKM WELL
S* BEDROCK EXTRACTION WELL
APPROXMATE AREA OF 5VE REMEDIATION
NOTES1.) THE SAMPLE LOCATIONS NEAR BULDMG ffl WITH
EXCEEDENCES WILL NOT UNDERGO EXCAVATION DUE TOTHE PROXIMITY OF THE BULDWCS. TANKS. OVERHEADEQUPMENT AND ONCOMG OPERATIONS ACTIVITIES. THESEAREAS CAN BE TREATED BY SVE,
2.) BOUNDARIES AND AREAS ARE APPROXMATE AND WLLBE FURTHER OEF1NEO DURING THE REMEDIAL DESIGN ANDREMEDIAL ACTON.
REFERENCES1.) TOPOGRAPHC FEATURES TAKEN FROM OCTAL FUS
TITLED 'BASE* DATED 06/D5A7 AND 1510120r DATED06/09/97 SUPPLIED BY MTTANY GEOSOENCES, MC.
2.) LOCATON OF PROPERTY LME. MOMTORMG WELLS ANDPO) SOL BORINGS TAKEN FROM DIGITAL FILE TITLED'SPf DATED 06/02/97 SUPPUEO BY SWEETLANDENQNEDBNG * ASSOCIATES, WC.
1) LOCATION OF • PHASE 1 AND N SON. KMNCS TAKENFROM DIGITAL Fl£ 'PA17-I69' DATED 10/14/UPREPARED BY COLDER ASSOCIATES MC
20escole
0 6 J997o 20
_3feei
AR309U38
963-6U3 AS SHOWN11/07/97PA17-37»
Goider Assodates
AREA OF SVE INFLUENCEISCCONCENTRATION MASS
AREAS M 14 TO 20 FT LAYERTANK FARM/BUILOfNQ «1 AREAS
RUETGERS-NEASE CORPORATION F~8

AR309li39

November 1997 G-l 963-6333
Comment No. I
The effectiveness of an SVE system should be based on reaching achievement of RemedialAction Objectives (RAOs) contained in the ROD. Currently, there appears to be inadequateinformation to determine the total amount of VOC contamination present in the Tank FarmArea. Therefore, establishing a total VOC removal volume is inappropriate. Similarly, it•will also be necessary to determine the remaining levels of VOCs present in the soil profileafter SVE has been conducted. A detailed soil boring program should be conducted tovalidate the effectiveness of the SVE system. * A mass removal rate performance standardbased on asymptotic performance only measures the technological performance of the SVEequipment and may not necessarily meet the RAOs for the Site.
Response to Comment No. 1
The RAOs for on-site soil presented in the ROD are:
1 . Mitigate leaching of contaminants of concern from subsurface soil so as to beprotective of groundwater; and,
2. Protect environmental receptors.
As per Section 10.3 of the ROD, excavation of soil is to occur and continue until the soilremaining in place meets soil clean-up levels that are protective of groundwater (Table 9).As demonstrated in the FS discussed in RNC's comments on the Proposed Remedial ActionPlan (PRAP) dated November 30, 1994 and February 24, 1995, and as stated in the RODthere are limitations in the usefulness of excavation at this Site. It has been recognized bythe USEPA that excavation is not feasible in areas where there is restricted access (i.e., areasbetween buildings where there is insufficient room to maneuver or too close to structuralfoundations. Furthermore, excavation is unable to remediate contamination in unsaturatedbedrock which represents a source of VOC contamination to groundwater.
Based on the present data, it is estimated that there are approximately 18,600 cu. yds of TankFarm area soil which contain levels of contamination which could leach to groundwater.Excavation of 6,000 cu. yds of soil (per the ROD) represents only 32% of this total. Incontrast, SVE could treat close to 100% of the soil in the areas designated by the USEPA,including those with restricted access plus treat contamination in the unsaturated bedrock. Itshould be noted that the most highly contaminated areas (around soil borings SB-2 and SB-3) are areas which are not accessible for excavation. SVE with fracturing will thereforebetter satisfy the RAO of mitigating impacts to groundwater from subsurface soilcontamination than excavation would. In addition, since a comprehensive groundwaterremedy will be implemented, the soil remedy should be viewed as a means of sourceremoval to enhance the efficiency of the groundwater source control system. In addition,and as discussed in the Focused Feasibility Study Report, the SVE system will include theconstruction and operation and maintenance of a low permeability cover system pavement aswell as surface water routing which will significantly reduce the potential for purification toinfiltrate through subsurface soils in the areas of concern.
The number of samples collected in the Tank Farm/Building #1 area was deemed adequatefor the purpose of the Remedial Investigation (RI). Subsequent to performing the RI, RNCremoved some of the tanks in the Tank Farm area. During the Initial Performance Test andthe Short-Term Performance Test, additional soil samples were collected to further
Colder Associates

November 1997 G-2 963-6333
characterize the subsurface soil samples for the purpose of the pre-design investigation asdescribed below. ^ J
Comment No. 2
One concern with the report is the overall lack of depth discrete VOC data for subsurfacesoils in the Tank Farm Area. The SVE modeling appears to use accurate values for soilcharacteristics such as permeability but assumes that the contamination is uniformlydistributed throughout the vertical axis. • If SVE is to be pursued as a remedial technology inthe Tank Farm Area, additional borings should be advanced to delineate the vertical extentof VOC contamination before and after SVE operation. It would be beneficial for thisinformation to be presented in cross sections.
Response to Comment No. 2
As noted above, additional soil data has been collected during the PDI. During the RI, depthdiscrete sampling was performed in the Tank Farm/Building #1 area. Subsequent to the RI,RNC removed some of the tanks in the Tank Farm, This allowed access to the Tank Farmfor performance testing of SVE technology. During the Initial Performance Test and theShort-Term Performance Test, samples were collected from the boreholes during drilling andinstallation. Each 2-foot interval of borehole was screened for VOCs using aphotoionization detector (PID). The interval having the highest PID reading from eachborehole was chosen for .laboratory analysis. These data, along with the RI data, and therecent April 199? soil sampling conducted (and reported on in the PDI report) were used to ,calculate an average concentration of VOC contamination. In April 1997, depth discrete soil V_/samples were collected from 66 borings in accordance with the Remedial Design Work Plan,dated April 1997. Depth discrete samples were collected at levels 0-4 ft. bgs, 4-8 ft. bgs, 8-12 ft. bgs and 12 ft. bgs to refusal. Samples were analyzed for VOCs, mirex and kepone.The average VOC concentration of sub-areas of the SVE capture zone was used to calculatethe mass of contaminants present throughout the Tank Farm area. This approach presents aconservative overestimation of contamination present in the Tank Farm area.
Comment No. 3 . '
The report should also describe the criteria used to determine the locations of the fourextraction wells used in this study and indicate whether comparable depth discrete VOCcontamination was present at each well location. Although the VOC concentrations in soilpresented for BR-2 are greater than BR-1, the vertical extent of contamination in these areasthroughout the soil profile is unclear. .
Response to Comment No. 3
Depth discrete VOC sampling was not performed to determine location of the extractionwells used in this study. The entire Tank Farm area was considered contaminated asdescribed above. The locations of the four extraction wells were based upon achieving asensible relative geometry to assess system performance.
Qolder Associate* A R 3 0 9 k k

November 1997 G-3 963-6333
Comment No. 4
No model validation information is available. The model was calibrated using data from theshort-term test, and-the calibrated model was used to establish conditions for and predict theresults of the long-term test. The predicted conditions should be analyzed as a function ofthe actual conditions for the long-term test.
Response to Comment No. 4
As opposed to groundwater modeling, SVE modeling does not usually have a validationstep. Typically, in groundwater modeling, the model is first calibrated to the existinggroundwater conditions (generally accomplished by matching groundwater contourelevations across a spatial domain) in an effort to reproduce the ambient groundwater flowfield. Then, the model is validated by, for example, simulating a pumping test andcomparing the results of the model simulation against the field data from the pumping test.However, in SVE modeling, it is impractical to first calibrate the model to the existingambient air flow field or field pressures because the pressures are all atmospheric and thesubsurface air is generally at rest. Instead, the SVE model is calibrated to a dynamic testsuch that SVE simulation results (well head vacuums, pressure contours, extraction rates)can be matched against the field test results.
The computation accuracy of AIR3D has been well validated against analytical solutions inthe literature (Airiest - A Computer Program to Simulate Two Dimensional AxisymmetricAir Flow in the Unsaturated Zone, Joss and Baehr, November 1992).
Comment No. 5
The calibrated model parameters should be explained and discussed further in the text. Thereference, assumptions, or rationale for selecting 2x as the factor between horizontal andvertical permeability should be provided. In addition, the note should explain whether thisstarred value applies to all permeabilities or just one particular layer. Also the reportshould clarify whether the term "overburden" is the same as "residual soil" or "in-situsoil". Consistent terminology should be used throughout the report.
Response to Comment No. 5
Additional text has been added to further explain the calibrated parameter values. Inparticular, as noted-in Table 4-1, the vertical permeability for each layer is approximatelytwice that for the horizontal permeability for that layer. This applies to all layers of themodel. Justification for this 2:1 ratio of vertical to horizontal is found both in 1) literature(e.g. Edwards and Jones, 1994, and Beckett and Huntley, 1994) where the former found testsoils to be anisotropic with best fit model parameters of kH « 3.9 x 10"07 cm2 and kv * 1.4 x10"06 cm2, and 2) the later finding that significant vertical leakage occurs ("the rule, ratherthan the exception") even at sites with new concrete and asphalt covers. For State College,geologic logging indicates the presence of vertical fracturing in the overburden sediments,features leading to vertical leakage.
Finally, the report has been modified to identify that all non-consolidated materials'that lieabove bedrock are classified as being overburden, native soils (making up the lower portions
Colder Associates A R 3 0 9 ^ l f 2

November 1997 G-4 963-6333
of overburden) are classified as "native" or "residual" soils and those non-native soils(making up the upper portion of overburden materials) are classified as "fill" or "fill soils".
Comment No. 6
The short-term performance test concluded that fracturing of overburden wells can increaseextraction airflow rates by 28% field to 48% (model). The field measurements of air flowrates (28%) are most likely more representative to actual site conditions that the model'spredicted flow rates (48%). Therefore, unless additional justification is provided from thelong-term test, the report should consider 28% to be expected increase in air flow ratesbecause ofhydrofracturing at the Site.
Response to Comment No. 6
Based on the recent data from the continuing SVE field test at St. College, an increase in airflow rate for the hydrofractured SVE well E-2 has since 02/23/96 (last data provided inreport, Revision #0) increased from 3.22 cfin at 11.3 Inches of mercury vacuum to 4.65 cfm,5.09 cfm, 6.44 cfm and 5.34 cfrn at vacuums of 10.3 inches of Hg to 10.5 inches of Hg.These numbers (not previously available to USEPA) support the estimation of higherextraction flow volumes as predicted with the SVE model.
Comment No. 7
No performance test data is presented for any of the SVE tests discussed in the report. Thesedata are critical and should include conditions in the extraction wells as well as responses inthe monitoring points/piezometers. These data are important to facilitate an evaluation ofsystem performance.
Response to Comment No. 7
Perfonnance test data from the Initial Performance Test can be found in the report of thesame name prepared by Colder Associates dated October 1995. Since completion of thelong-term test in June, 1997, additional performance test data has been incorporated .into theRevision #1 SVE Performance Test Report.
Comment No. 8
The report does not explain why the extraction wells are only screened in the bottom 5 feet ofthe overburden when the overburden thickness ranges from 10 to 20 feet. The report shouldhave explained the selection and advantages of this construction rather than screening thewells throughout a larger interval in the overburden.
Response to Comment No. 8
As reported on page 15, all SVE "model" wells screened in the overburden materials werescreened from 3 feet below ground surface to the top of bedrock (i.e. screened in Layers3,4,5 and 6). The thickness for each layer was established as an average from the boreholelogs for wells PI to P6f El to E3 and BR-1 and BR-2. The total screened length for SVE
Qolder Associates

November 1997 G-5 963-6333
model wells was approximately 9.9 feet. Mis-interpretation of these screen lengths mayhave arisen from the Schematic Cross Section of AIR3D Mode! Layers (Figure 4.3) whichsuggests shorter screen lengths.
Comment No. 9
The report provides no cost or data assumptions that SVE is considerably more cost-effectivethan excavation and off-site disposal. The cost evaluation should include all AOCsincluding the former drum staging area and designated outdoor storage area.
Response to Comment No. 9
•The SVE Performance Test Report was prepared using the guidance documents Guide forConducting Treatabilitv Studies Under CERCLA. Interim Final Guidance, EPA/540/2-89/058, dated December 1989, and Guide for Conducting Treatabilitv Studies UnderCERCLA: Soil Vapor Extraction. Interim Guidance, EPA/540/2-91/019A, dated September1991.
RNC is providing the USEPA with a comparison of costs for SVE versus soil excavation inthe Focused Feasibility Study Report. The costs for excavation will be revised to include theprovisions of the ROD as well as the need for thermal treatment of a portion of the soilexcavated based on the new subsurface soil data.
Comment No, 10
There are some discrepancies and inconsistencies in the report. For example, the reportstates on page 16 that "wells BR-1 and BR-2 are bedrock wells screened only in layer 7."Previously, the report indicated that a thickness of 4 feet was assumed for layer 7; however,the logs in Appendix A indicate that the wells were advanced about S to 11 feet into bedrock.These discrepancies and inconsistencies should be corrected in the report and, ofappropriate, in the modeling.
Response to Comment No. 10
All SVE model bedrock wells were fully screened through Layer 7, which was set at 4 feet,as described in the text and on Figure 4.3. Additional text has been added to the reportclarifying that the 4-foot of Layer 7 representing bedrock is just that thickness ofunsaturatedbedrock available for active SVE. Saturated bedrock is not available for SVE, and as suchwas not included in the thickness of Layer 7.
0:\PROJECTS\»634336\SVEV97FINALVCOMMENTS.DOC
Golder Associates