revised soil phosphorus test ratings (rsptr), critical .... chandrakala3, et al.pdf · revised soil...
TRANSCRIPT
Int.J.Curr.Microbiol.App.Sci (2017) 6(11): 295-309
295
Original Research Article https://doi.org/10.20546/ijcmas.2017.611.034
Revised Soil Phosphorus Test Ratings (RSPTR),
Critical Limits (CL) and Phosphorous Recommendation for Maize
M. Chandrakala1*
, C.A. Srinivasamurthy2, Sanjeev Kumar
3,
S. Bhaskar4, V.R.R. Parama
5 and D.V. Naveen
6
1National Bureau of Soil Survey and Land Use Planning, Regional Centre, Hebbal,
Bangalore-560 024, Karnataka, India 2Director of Research, Central Agricultural University, Imphal, Manipur, India
3National Dairy Research Institute, Karnal Haryana 132001
4ADG, NRM Division, New Delhi, India
5Dept. Soil Science and Agricultural Chemistry, UAS, Bangalore-560 065, Karnataka, India
6Deptartment of Soil Science and Agricultural Chemistry, Sericulture College,
Chintamani, Karnataka, India *Corresponding author
A B S T R A C T
Introduction
Phosphorus, the basic raw material rock
phosphate available in the country is 10 per
cent of the total requirement and therefore
depends on imports, which is being increased
for the balance of remaining 90 per cent. In
the world, there will be a rapid decline in rock
phosphate availability by 2030 onwards.
Indian fertilizer industry is self-sufficient in
meeting the requirement of N, but in case of
P. The rating chart for soil test data used by
the soil testing laboratories have been
generated 50 years ago on a very limited data
for fertilizer recommendation which is based
on few pot culture correlation experiments
and the results of a few field trials conducted
at IARI (Muhr et al., 1965). In majority of the
soil testing laboratories of rainfed areas, the
interpretation of the soil test results are done
based on the critical nutrient concept
proposed by Cate and Nelson (1965).
The soil test ratings of low, medium and high
fertility classes for nutrients are currently
International Journal of Current Microbiology and Applied Sciences ISSN: 2319-7706 Volume 6 Number 11 (2017) pp. 295-309 Journal homepage: http://www.ijcmas.com
The current soil test phosphorous ratings of low, medium and high fertility
classes and critical limits were revised by studying the response of maize in
24 soils of varied initial P fertility, treated with graded levels of P. The
revised SPTR were <15.50, 15.51-28.00, 28.10-48.50 and >48.50 kg P2O5
ha-1
, VL: L: M: H, respectively. CL for soil was 17.0 kg P2O5 ha-1
and 0.12
per cent for plant. Maize yield can be maximized by recommending
phosphorous @ 150, 125, 100 and 75 percent of the recommended dose in
the respective soils of VL: L: M: H fertility ratings.
K e y w o r d s
Soil available
phosphorus ratings, Revalidation, Critical
limits, Maize.
Accepted:
04 September 2017
Available Online: 10 November 2017
Article Info

Int.J.Curr.Microbiol.App.Sci (2017) 6(11): 295-309
296
adopted by the soil testing laboratories need a
fresh look as significant responses to applied
nutrients have been recorded in soils with
high fertility status in many crops. In alluvial
soils of U.P. on soils classified as high in
available P, 60 kg P2O5 ha-1
increased the
wheat yield by 653 kg ha-1
or 10.9 kg grain
per kg P2O5. Even at the current high price of
P2O5, this underscores the need to revise soil
fertility limits (Tiwari, 2002).
Critical limit is the level below which
economic responses are possible to applied
phosphates. Knowing the initial soil test value
and response of crop to applied level of
nutrient, will be possible to work out the
amount of fertilizer phosphorus needed to
buildup the soil phosphate to a given critical
limit. If the initial soil phosphorus level is
high, then maintenance application will be
enough (Anonymous, 2012).
A pot experiment was conducted using maize
(Zea mays L. is one of the important cereals
cultivated in India and it ranks fourth after
rice, wheat and sorghum) as a test crop grown
on soils of different P fertility applied with
graded levels of P with the objective is to
revalidate the soil available phosphorus test
ratings and critical limits for soil and maize
plant.
Materials and Methods
Experiment was conducted on 2012 at ZARS,
GKVK, UAS, Bangalore. Surface (0-30 cm)
soils were collected in bulk from different
locations of Eastern Dry Zone of Karnataka
viz., GKVK, Bangalore rural and
Doddaballapura. Soils were subjected to
processing followed by analysis for available
nutrients using standard procedures (Piper,
1966) and tentatively categorized as Very
Low, Low, Medium and High classes if the
available soil phosphorus <15, 16-30, 31-45
and 46-60 kg ha-1
, respectively.
Initial soil available phosphorus content
(Table 1) based, six different locations or
soils from each very low, low, medium and
high category were selected separately.
Totally, 648 individual polythenes filled ten
kg soil for three replications from all the four
P fertility status. Treatments were nine graded
levels of P with and without NK&FYM viz.,
T1: Absolute control; T2: Rec. N&K only (no
P); T3: Rec. N&K only + Rec. FYM; T4:
Package of practice (NPK+FYM); T5: 100 %
Rec. N, P &K (no FYM); T6: 75 % Rec. P +
rec. dose of N&K (no FYM); T7: 75 % Rec. P
+ Rec. dose of N&K only + Rec. FYM; T8:
125 % Rec. P + Rec. dose of N&K (no FYM);
T9: 125 % Rec. P + Rec. dose of N&K + Rec.
FYM. Maize (Variety: Nithya shree -NAH
2049) was grown in pots imposed with P as
per the treatments and RDF @ 100-50-25 kg
N-P2O5-K2O ha-1
and Recommended dose of
FYM @ 7.5 t ha-1
during summer in CRD
technique.
RDFYM was mixed with soil in the pot five
days prior to sowing. Recommended dose of
N through urea and K as muriate of potash
and graded levels of phosphorus through
single super phosphate were given as basal.
After sowing maize in each pot keeping the
soil moisture at field capacity followed by
two plants were maintained after a week after
thinning. Weed management, plant protection
measures and a regular irrigation were taken
up as per the package of practices. Plants
were harvested separately from each pot at 60
days after sowing and dry matter weight was
recorded followed by subjected to total P
content estimation using standard procedure5
to know the uptake of P. Soils samples were
analyzed for available P content using
standard procedure.
Data were analyzed using ANOVA (One-
Way) of Fisher’s method of analysis and
variance technique at 5 % probability level of
significance. Correlation coefficient (r) were
Int.J.Curr.Microbiol.App.Sci (2017) 6(11): 295-309
297
calculated and tested for their significance
(Panse and Sukhatme, 1985). Plotting the
initial soil available phosphorus in different
phosphorus fertility levels on X-axis and
relative yield on the Y-axis in a graphical
method critical limits were identified. A
transparent overlay with a vertical line and an
intersecting horizontal line was drawn so as to
maximize the number of points in the first and
third quadrants and minimum number of
points in the second and fourth quadrants.
The initial soil test phosphorus corresponding
to the relative yield was marked in such a way
that, below which response to applied P
would be maximum and was taken as critical
value for phosphorus (Cate and Nelson, 1965)
both in soil and plant. Revalidation of Soil
Phosphorus Test ratings (SPTR) in to very
low, low, medium and high were categorized
by ploting of relative per cent yield at harvest
of maize on Y- axis and the initial available
phosphorus content on X-axis by adopting
continuous calibration curve method (Cope
and Rouse, 1973)
Results and Discussion
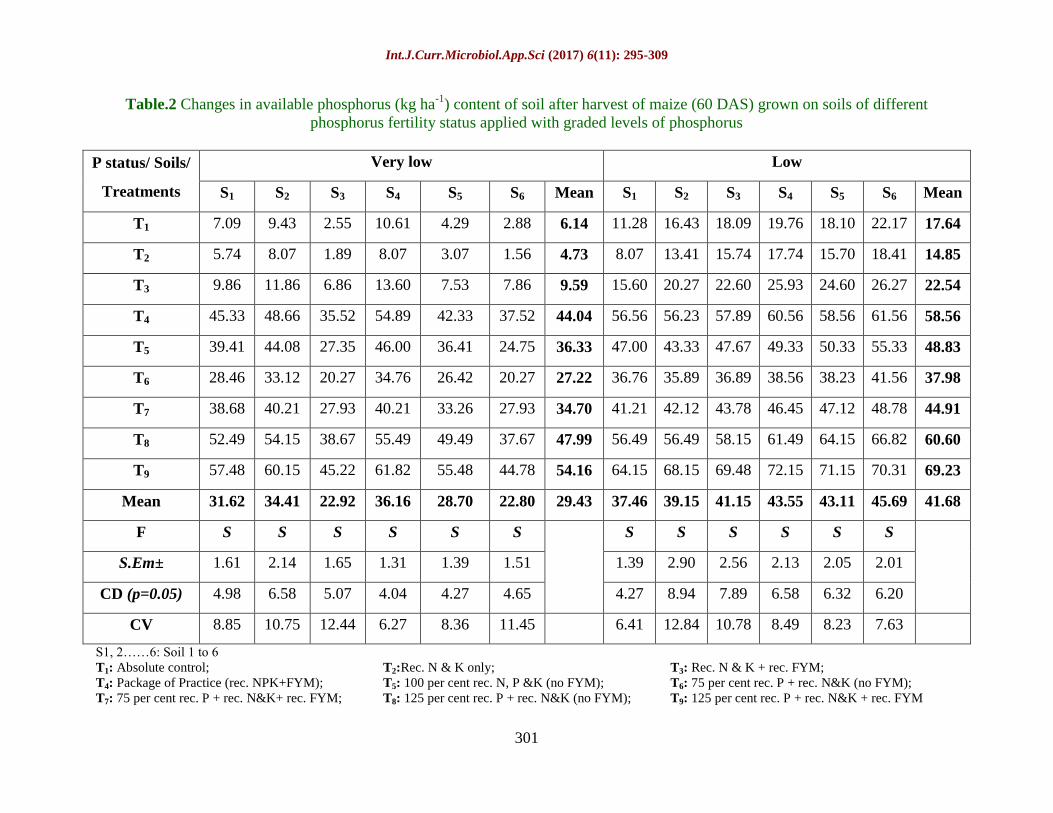
Soil phosphorus content after harvest of
maize
Irrespective of soil P fertility and levels of P
addition, application of FYM increased the
available phosphorus content of the soil
(Table 2). Treatments with graded levels of P
and rec. N&K along with manures recorded
significantly higher available P content which
may be due to beneficial effect of manure as it
provided the congenial environment for better
microbial activity and released the nutrients
and also keeps them in soil solution. Absolute
control pot recorded lower nutrient values as
compared to initial could be due to utilization
of native soil nutrients. Venkatesh et al.,
(2002) observed increased available P status
with increased rate of P application.
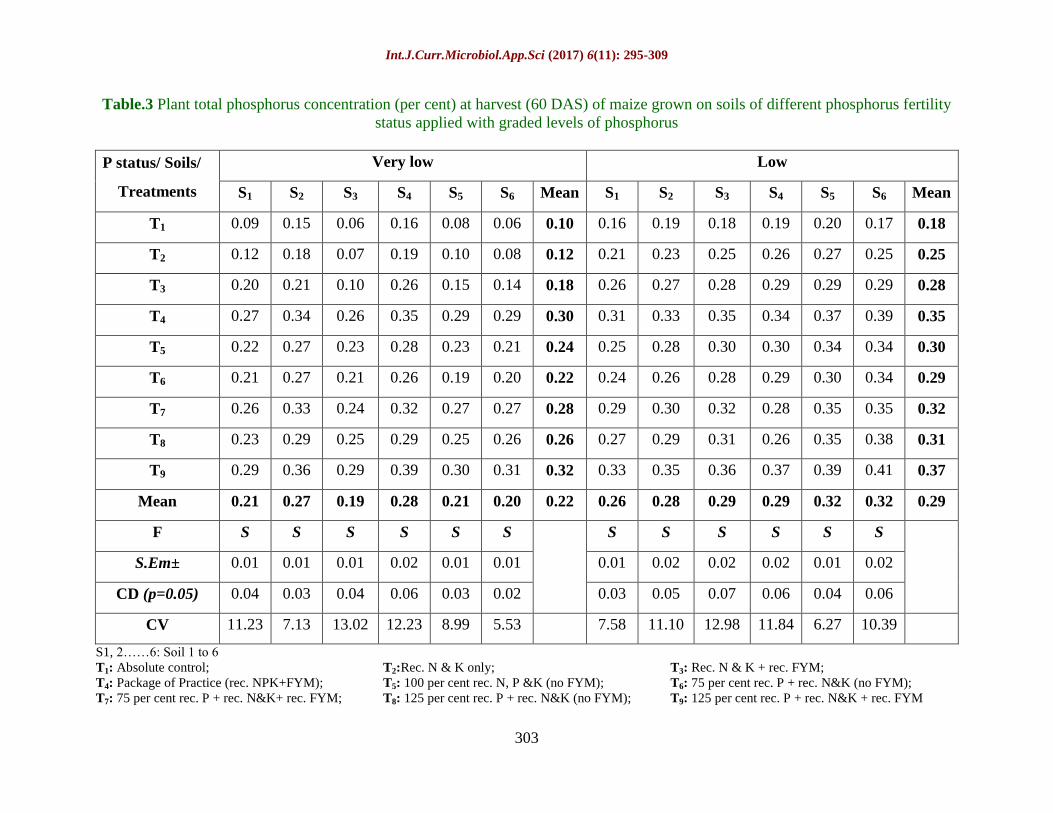
Dry matter yield, shoot P concentration
and uptake of P by maize
Soils of different P fertility levels applied
with graded levels of phosphorus noticed
significant difference in dry matter yield,
phosphorus concentration in plant (Table 3)
and uptake (Table 4) which were increased
with the increase in initial soil P fertility
along with graded levels of P application.
Application of 125% rec. P + rec. N&K + rec.
FYM noticed higher yield, P contents and
uptake. This may be due to higher amount of
available P, which helped in better root
growth lead to increased photosynthetic rate
there by enhanced the P uptake resulted in
higher dry matter yield. Concentration of P in
plant was slightly decreased in soils of high P
fertility applied with graded levels of P due to
lower response of crop to applied P. which
might be due to fixation of P with Fe and Ca,
reduced the movement and availability of P in
soil. And also due to negative interaction
between P and Zn, might have restricted the
translocation and uptake of P by the plant.
Relative yield and P uptake increased as the
available P status changed from very low to
low, low to medium and medium to high.
However, total P uptake response was higher
in very low and low P soils than in medium
and high P soils. Similar results were reported
by Ghosh and Singh (2002). Addition of N
and K only, but not P recorded increased dry
matter yield with increase in initial soil P
highlighted the role of P nutrition, its effect
pronounced more on P uptake rather than on
dry matter. Lower the dose, lower was the
yield recorded, which emphasize the
importance of supplying adequate level of P
for higher yields through organic manures
along with inorganic fertilizers. Similar effect
of interaction between soils and phosphorus
on dry matter yield and P uptake observed by
Laxminarayana (2007). Majumdhar et al.,
(2007) noticed increased phosphorus uptake
Int.J.Curr.Microbiol.App.Sci (2017) 6(11): 295-309
298
with P alone or with FYM over control and
maximum uptake due to SSP @ 60 kg P2O5
ha-1
whereas Arya and singh (2001) observed
higher dry matter accumulation with
phosphorus @ 39.6 kg ha-1
in maize.
Phosphorous @ 125 per cent of recommended
dose along with N and K recorded
significantly higher dry matter yield
compared to 75 and 100 per cent of RDP.
FYM given with 75, 100 and 125 per cent
RDP along with N and K increased the dry
matter yield over no FYM which might be
ascribed to the adequate availability of
nutrients and this facilitated greater
accumulation of photosynthates in the shoots.
Tariq Aziz et al., 2010 noticed better shoot
growth, phosphorus and potassium content
due to application of organic manures.
Similarly, the relative yield and shoot P
uptake by sunflower increased at all P doses
with increase in initial P status from low to
high (Muralidharudu et al., 2003)
Critical limits of soil and plant phosphorus
for maize and revalidation of P fertility
ratings
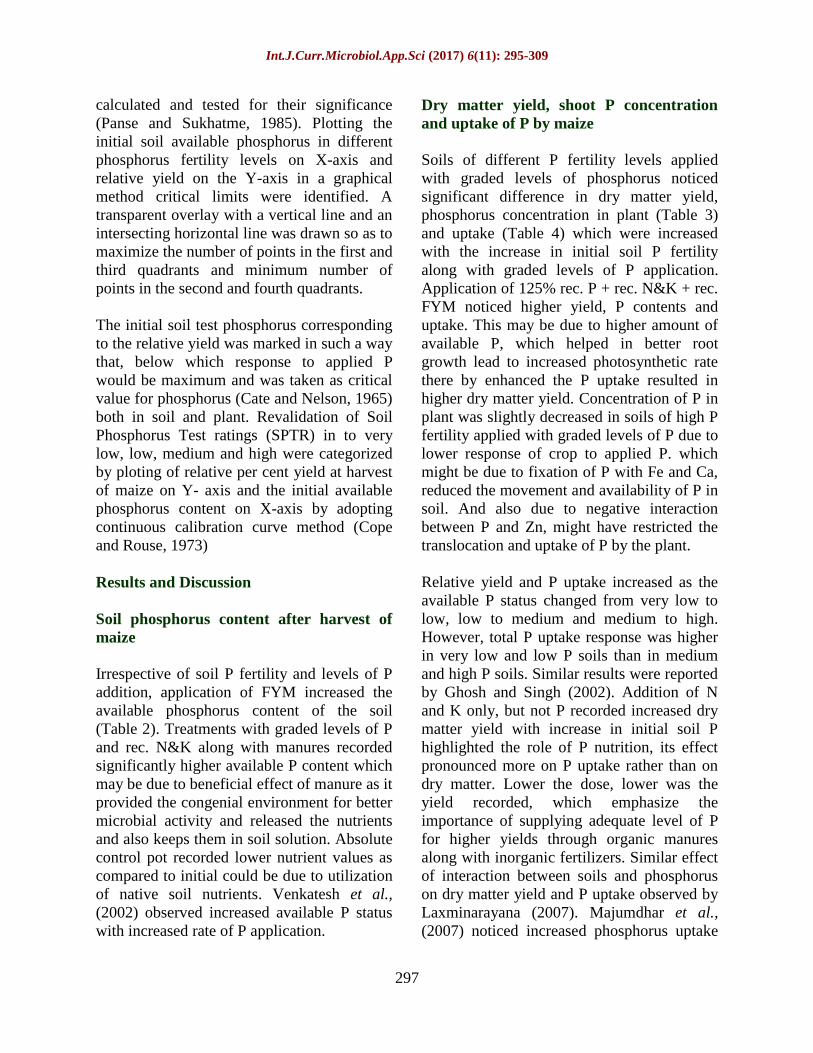
Percentage of yields obtained on the
unfertilized control soil relative to the
maximum yield achieved on the phosphorus
fertilized soil. Relative per cent yield was
plotted against available soil P as shown in
Figures 1 to 3 represent critical limit of
available soil phosphorus, maize shoot
phosphorus content and revalidation of
available soil phosphorus fertility ratings,
respectively.
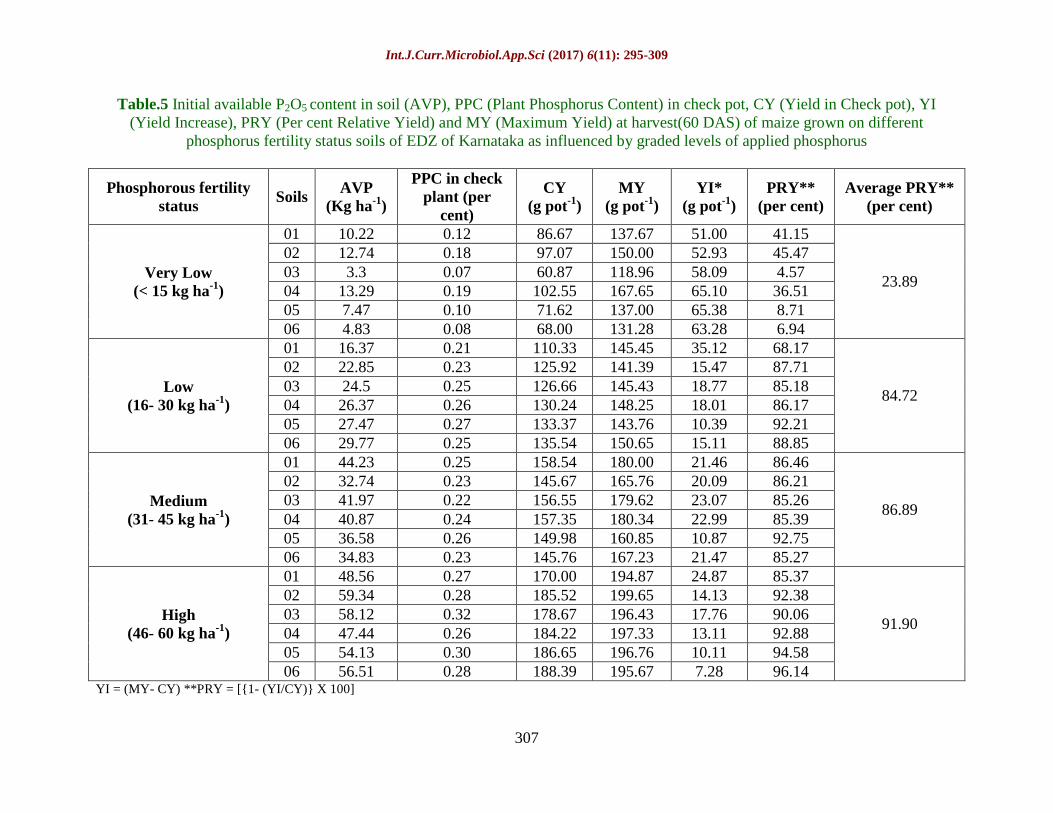
Initial soil available phosphorus as well as
graded levels of phosphorus influenced maize
greatly the yield in check pots and maximum
yield, respectively (Table 5). However, yield
in check pot increased as the available
phosphorus increased (range: 60.87 to 188.39
g pot-1
) and also yields were maximum at
higher rate of phosphorus doses (range:
118.96 to 199.65 g pot-1
). Yield increase is the
difference between maximum yields in treated
pot to yield in check pot showed decreasing
trend as the initial available phosphorus
content increased (range: 7.28 to 65.38 g pot-
1). Relative per cent yield (range: 4.57 to
96.14 per cent) was a dependent variable on
yield increase which was higher at lower
values of yield increase and vice-versa.
Average relative yield per cent was lower in
very low P fertility soil (23.89) and higher in
high P fertility soils (91.90). Phosphorus
content in check pot ranged 0.07 to 0.32 per
cent and it showed increasing trend of
increase in concentration with increase in
available phosphorus content of soil.
Fig.1 Critical limit of available soil phosphorus for maize
17.00
Int.J.Curr.Microbiol.App.Sci (2017) 6(11): 295-309
299
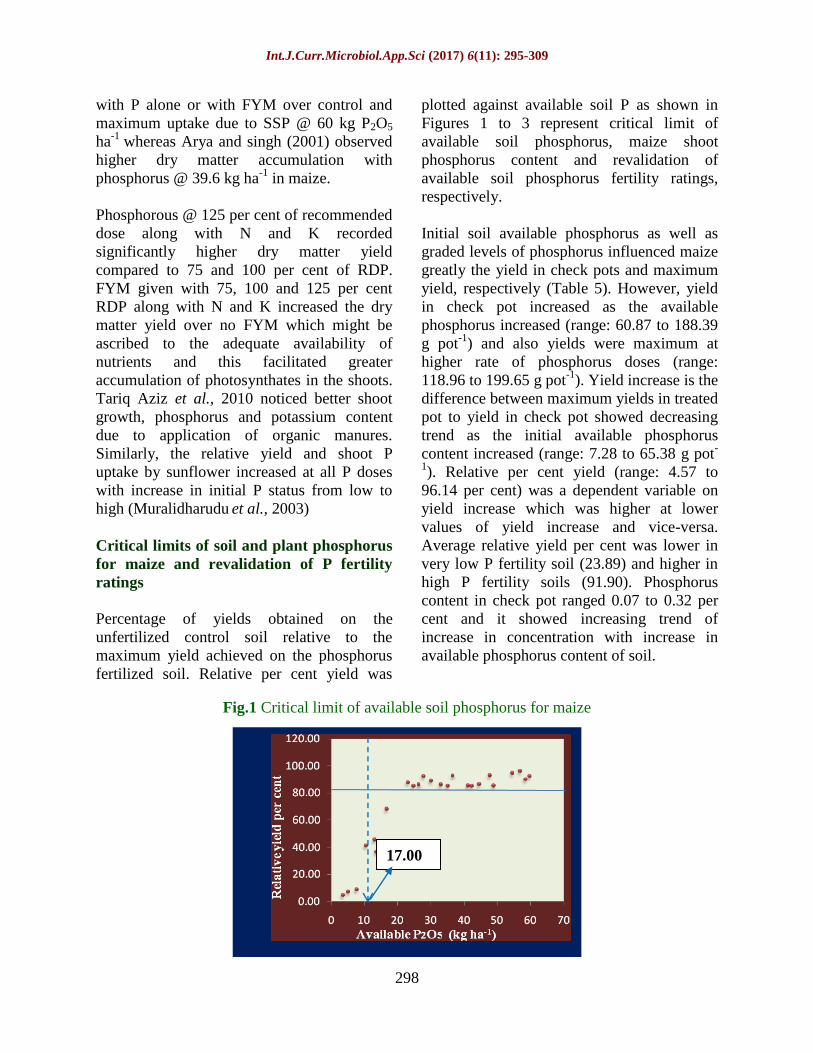
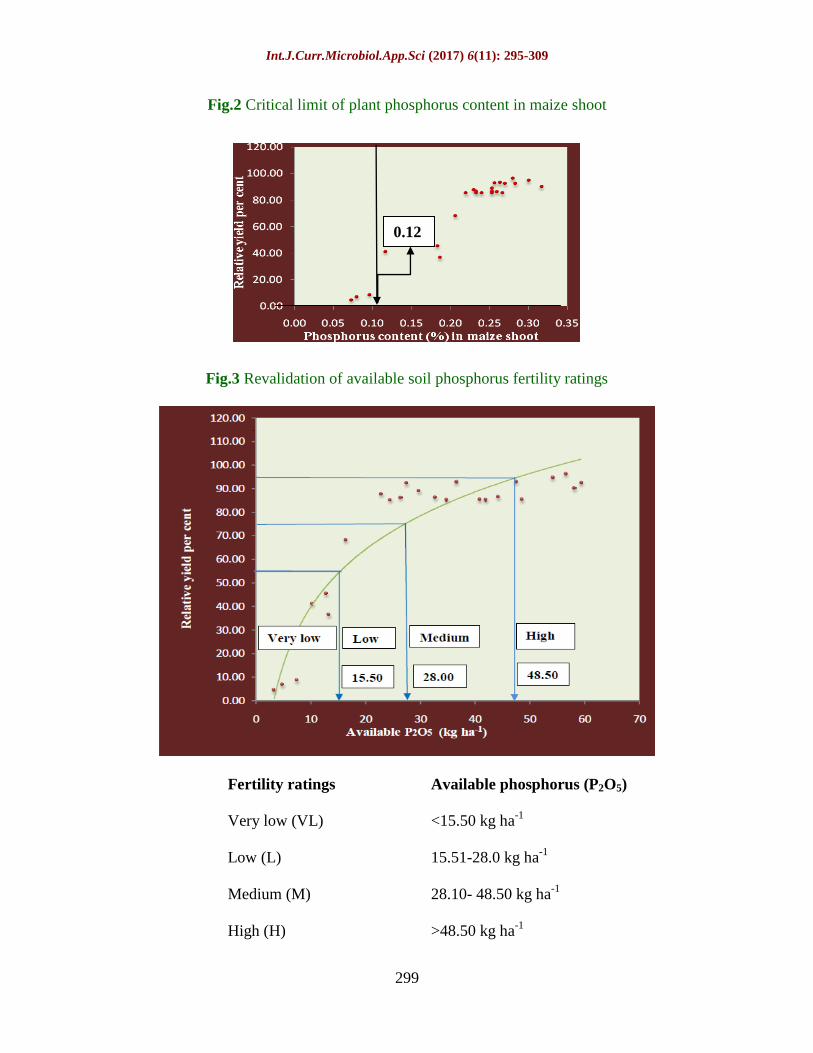
Fig.2 Critical limit of plant phosphorus content in maize shoot
Fig.3 Revalidation of available soil phosphorus fertility ratings
Fertility ratings Available phosphorus (P2O5)
Very low (VL) <15.50 kg ha-1
Low (L) 15.51-28.0 kg ha-1
Medium (M) 28.10- 48.50 kg ha-1
High (H) >48.50 kg ha-1
0.12

Int.J.Curr.Microbiol.App.Sci (2017) 6(11): 295-309
300
Table.1 Initial properties of the soils used in pot culture experiment
Sl. No. pH
(1:2.5)
EC
(dS m-1
)
Organic
Carbon (%)
Available
N (kg ha-1
)
Available
P2O5 (kg ha-1
)
Available K2O
(kg ha-1
)
DTPA-Fe
(mg kg-1
)
DTPA-Zn
(mg kg-1
)
Very low phosphorus (< 15 kg P2O5 ha-1
)
Location 1 5.61 0.21 0.38 210.12 10.22 291.16 49.74 1.86
Location 2 6.03 0.23 0.36 232.06 12.74 116.76 68.76 1.72
Location 3 5.32 0.25 0.35 222.66 3.30 240.0 52.32 1.91
Location 4 6.66 0.26 0.41 179.56 13.29 273.6 70.82 1.15
Location 5 5.82 0.29 0.32 219.52 7.47 285.60 70.04 2.32
Location 6 5.99 0.28 0.37 203.84 4.83 172.0 59.34 2.08
Low phosphorus (16-30 kg P2O5 ha-1
)
Location 7 5.15 0.22 0.58 200.14 16.37 145.55 68.82 1.66
Location 8 6.16 0.23 0.43 231.09 22.85 215.59 53.64 1.47
Location 9 6.27 0.26 0.44 228.67 24.5 191.12 48.14 1.33
Location 10 6.14 0.16 0.52 189.58 26.37 110.77 48.36 1.56
Location 11 5.52 0.11 0.59 209.12 27.47 163.89 67.94 1.37
Location 12 5.47 0.26 0.36 203.84 29.77 240.0 68.26 1.66
Medium phosphorus (31-45 kg P2O5 ha-1
)
Location 13 5.32 0.15 0.42 196.5 44.23 221.65 63.30 2.07
Location 14 5.88 0.23 0.37 251.0 32.74 315.69 69.26 2.21
Location 15 6.53 0.25 0.54 238.77 41.97 391.13 50.22 1.14
Location 16 6.20 0.12 0.60 280.88 40.87 410.77 50.44 1.43
Location 17 6.11 0.27 0.51 109.16 36.58 363.89 55.26 1.42
Location 18 6.70 0.24 0.49 303.84 34.83 247.43 48.20 1.29
High phosphorus (46-60 kg P2O5 ha-1
)
Location 19 5.31 0.18 0.48 211.19 48.56 145.05 66.34 1.82
Location 20 5.83 0.16 0.38 151.88 59.34 385.66 64.44 2.30
Location 21 6.52 0.29 0.29 238.84 58.12 191.13 48.32 1.47
Location 22 5.60 0.19 0.47 290.85 47.44 310.0 71.06 1.60
Location 23 6.12 0.27 0.52 169.16 54.13 163.77 52.04 2.42
Location 24 5.82 0.23 0.38 323.14 56.51 200.05 63.34 1.98
Int.J.Curr.Microbiol.App.Sci (2017) 6(11): 295-309
301
Table.2 Changes in available phosphorus (kg ha-1
) content of soil after harvest of maize (60 DAS) grown on soils of different
phosphorus fertility status applied with graded levels of phosphorus
P status/ Soils/
Treatments
Very low Low
S1 S2 S3 S4 S5 S6 Mean S1 S2 S3 S4 S5 S6 Mean
T1 7.09 9.43 2.55 10.61 4.29 2.88 6.14 11.28 16.43 18.09 19.76 18.10 22.17 17.64
T2 5.74 8.07 1.89 8.07 3.07 1.56 4.73 8.07 13.41 15.74 17.74 15.70 18.41 14.85
T3 9.86 11.86 6.86 13.60 7.53 7.86 9.59 15.60 20.27 22.60 25.93 24.60 26.27 22.54
T4 45.33 48.66 35.52 54.89 42.33 37.52 44.04 56.56 56.23 57.89 60.56 58.56 61.56 58.56
T5 39.41 44.08 27.35 46.00 36.41 24.75 36.33 47.00 43.33 47.67 49.33 50.33 55.33 48.83
T6 28.46 33.12 20.27 34.76 26.42 20.27 27.22 36.76 35.89 36.89 38.56 38.23 41.56 37.98
T7 38.68 40.21 27.93 40.21 33.26 27.93 34.70 41.21 42.12 43.78 46.45 47.12 48.78 44.91
T8 52.49 54.15 38.67 55.49 49.49 37.67 47.99 56.49 56.49 58.15 61.49 64.15 66.82 60.60
T9 57.48 60.15 45.22 61.82 55.48 44.78 54.16 64.15 68.15 69.48 72.15 71.15 70.31 69.23
Mean 31.62 34.41 22.92 36.16 28.70 22.80 29.43 37.46 39.15 41.15 43.55 43.11 45.69 41.68
F S S S S S S
S S S S S S
S.Em± 1.61 2.14 1.65 1.31 1.39 1.51 1.39 2.90 2.56 2.13 2.05 2.01
CD (p=0.05) 4.98 6.58 5.07 4.04 4.27 4.65 4.27 8.94 7.89 6.58 6.32 6.20
CV 8.85 10.75 12.44 6.27 8.36 11.45 6.41 12.84 10.78 8.49 8.23 7.63
S1, 2……6: Soil 1 to 6
T1: Absolute control; T2:Rec. N & K only; T3: Rec. N & K + rec. FYM;
T4: Package of Practice (rec. NPK+FYM); T5: 100 per cent rec. N, P &K (no FYM); T6: 75 per cent rec. P + rec. N&K (no FYM);
T7: 75 per cent rec. P + rec. N&K+ rec. FYM; T8: 125 per cent rec. P + rec. N&K (no FYM); T9: 125 per cent rec. P + rec. N&K + rec. FYM

Int.J.Curr.Microbiol.App.Sci (2017) 6(11): 295-309
302
Table.2 cont…
P status/Soils/
Treatments
Medium High
S1 S2 S3 S4 S5 S6 Mean S1 S2 S3 S4 S5 S6 Mean
T1 38.17 25.06 35.83 33.09 28.76 27.43 31.39 42.50 51.17 52.83 40.83 47.17 48.83 47.22
T2 34.41 23.07 31.90 29.90 25.07 24.04 28.07 41.41 49.40 50.42 37.87 46.41 44.42 44.98
T3 44.27 29.34 34.17 33.50 32.67 29.34 33.88 49.60 56.27 57.60 43.60 52.60 50.93 51.77
T4 77.56 68.67 72.52 74.19 70.67 69.30 72.15 83.56 90.89 93.23 82.89 92.56 90.89 89.00
T5 69.33 62.43 64.98 63.31 63.76 63.24 64.51 77.33 81.67 83.67 76.52 83.67 81.33 80.70
T6 55.89 51.23 51.68 49.68 54.23 52.56 52.54 62.89 69.89 71.23 63.89 76.23 76.89 70.17
T7 64.64 59.64 63.40 60.28 62.97 63.97 62.49 70.31 74.97 75.97 70.47 82.64 81.31 75.94
T8 82.82 73.82 75.28 73.61 77.49 76.15 76.53 77.49 76.82 77.49 75.89 79.15 76.15 77.17
T9 88.64 81.01 87.16 90.00 80.19 81.85 84.81 88.19 86.85 88.85 86.65 89.52 86.19 87.71
Mean 61.75 52.70 57.43 56.40 55.09 54.21 56.26 65.92 70.88 72.36 64.29 72.22 70.77 69.41
F S S S S S S
S S S S S S
S.Em± 2.44 2.39 3.98 4.22 2.68 3.07 2.75 4.06 3.80 2.64 3.62 3.37
CD (p=0.05) 7.53 7.36 12.27 13.02 8.24 9.45 8.47 12.52 11.70 8.14 11.16 10.40
CV 6.86 7.85 12.01 12.97 8.41 9.80 7.22 9.93 9.09 7.12 8.68 8.26
S1, 2……6: Soil 1 to 6
T1: Absolute control; T2:Rec. N & K only; T3: Rec. N & K + rec. FYM;
T4: Package of Practice (rec. NPK+FYM); T5: 100 per cent rec. N, P &K (no FYM); T6: 75 per cent rec. P + rec. N&K (no FYM);
T7: 75 per cent rec. P + rec. N&K+ rec. FYM; T8: 125 per cent rec. P + rec. N&K (no FYM); T9: 125 per cent rec. P + rec. N&K + rec. FYM
Int.J.Curr.Microbiol.App.Sci (2017) 6(11): 295-309
303
Table.3 Plant total phosphorus concentration (per cent) at harvest (60 DAS) of maize grown on soils of different phosphorus fertility
status applied with graded levels of phosphorus
P status/ Soils/
Treatments
Very low Low
S1 S2 S3 S4 S5 S6 Mean S1 S2 S3 S4 S5 S6 Mean
T1 0.09 0.15 0.06 0.16 0.08 0.06 0.10 0.16 0.19 0.18 0.19 0.20 0.17 0.18
T2 0.12 0.18 0.07 0.19 0.10 0.08 0.12 0.21 0.23 0.25 0.26 0.27 0.25 0.25
T3 0.20 0.21 0.10 0.26 0.15 0.14 0.18 0.26 0.27 0.28 0.29 0.29 0.29 0.28
T4 0.27 0.34 0.26 0.35 0.29 0.29 0.30 0.31 0.33 0.35 0.34 0.37 0.39 0.35
T5 0.22 0.27 0.23 0.28 0.23 0.21 0.24 0.25 0.28 0.30 0.30 0.34 0.34 0.30
T6 0.21 0.27 0.21 0.26 0.19 0.20 0.22 0.24 0.26 0.28 0.29 0.30 0.34 0.29
T7 0.26 0.33 0.24 0.32 0.27 0.27 0.28 0.29 0.30 0.32 0.28 0.35 0.35 0.32
T8 0.23 0.29 0.25 0.29 0.25 0.26 0.26 0.27 0.29 0.31 0.26 0.35 0.38 0.31
T9 0.29 0.36 0.29 0.39 0.30 0.31 0.32 0.33 0.35 0.36 0.37 0.39 0.41 0.37
Mean 0.21 0.27 0.19 0.28 0.21 0.20 0.22 0.26 0.28 0.29 0.29 0.32 0.32 0.29
F S S S S S S
S S S S S S
S.Em± 0.01 0.01 0.01 0.02 0.01 0.01 0.01 0.02 0.02 0.02 0.01 0.02
CD (p=0.05) 0.04 0.03 0.04 0.06 0.03 0.02 0.03 0.05 0.07 0.06 0.04 0.06
CV 11.23 7.13 13.02 12.23 8.99 5.53 7.58 11.10 12.98 11.84 6.27 10.39
S1, 2……6: Soil 1 to 6
T1: Absolute control; T2:Rec. N & K only; T3: Rec. N & K + rec. FYM;
T4: Package of Practice (rec. NPK+FYM); T5: 100 per cent rec. N, P &K (no FYM); T6: 75 per cent rec. P + rec. N&K (no FYM);
T7: 75 per cent rec. P + rec. N&K+ rec. FYM; T8: 125 per cent rec. P + rec. N&K (no FYM); T9: 125 per cent rec. P + rec. N&K + rec. FYM

Int.J.Curr.Microbiol.App.Sci (2017) 6(11): 295-309
304
Table.3 cont...
P status/Soils/
Treatments
Medium High
S1 S2 S3 S4 S5 S6 Mean S1 S2 S3 S4 S5 S6 Mean
T1 0.21 0.20 0.20 0.21 0.22 0.20 0.21 0.25 0.26 0.28 0.24 0.26 0.26 0.26
T2 0.25 0.23 0.22 0.24 0.26 0.23 0.24 0.27 0.28 0.32 0.26 0.30 0.28 0.29
T3 0.28 0.25 0.25 0.25 0.27 0.25 0.26 0.30 0.32 0.34 0.28 0.33 0.34 0.32
T4 0.39 0.39 0.38 0.37 0.36 0.35 0.37 0.34 0.36 0.40 0.37 0.36 0.38 0.37
T5 0.36 0.34 0.35 0.34 0.35 0.34 0.35 0.33 0.34 0.33 0.29 0.35 0.35 0.33
T6 0.35 0.31 0.33 0.34 0.34 0.33 0.33 0.34 0.33 0.34 0.31 0.32 0.34 0.33
T7 0.39 0.37 0.35 0.36 0.38 0.34 0.37 0.34 0.37 0.40 0.39 0.36 0.39 0.38
T8 0.38 0.33 0.34 0.36 0.36 0.35 0.35 0.35 0.31 0.34 0.31 0.35 0.35 0.34
T9 0.40 0.41 0.39 0.38 0.40 0.39 0.40 0.37 0.35 0.37 0.38 0.38 0.39 0.37
Mean 0.35 0.34 0.33 0.34 0.35 0.33 0.34 0.32 0.33 0.35 0.31 0.33 0.34 0.33
F S S S S S S
S S S S S S
S.Em± 0.02 0.02 0.02 0.02 0.01 0.02 0.02 0.02 0.02 0.02 0.02 0.01
CD (p=0.05) 0.07 0.05 0.06 0.05 0.05 0.06 0.06 0.05 0.07 0.06 0.05 0.05
CV 12.93 9.72 11.40 10.71 9.03 12.45 10.13 8.46 11.54 10.46 9.02 7.67
S1, 2……6: Soil 1 to 6
T1: Absolute control; T2:Rec. N & K only; T3: Rec. N & K + rec. FYM;
T4: Package of Practice (rec. NPK+FYM); T5: 100 per cent rec. N, P &K (no FYM); T6: 75 per cent rec. P + rec. N&K (no FYM);
T7: 75 per cent rec. P + rec. N&K+ rec. FYM; T8: 125 per cent rec. P + rec. N&K (no FYM); T9: 125 per cent rec. P + rec. N&K + rec. FYM

Int.J.Curr.Microbiol.App.Sci (2017) 6(11): 295-309
305
Table.4 Uptake of phosphorus (g pot-1
) at harvest (60 DAS) of maize grown on soils of different phosphorus fertility status applied
with graded levels of phosphorus
P status/ Soils/
Treatments
Very low Low
S1 S2 S3 S4 S5 S6 Mean S1 S2 S3 S4 S5 S6 Mean
T1 0.05 0.09 0.02 0.13 0.03 0.02 0.06 0.13 0.18 0.18 0.19 0.23 0.20 0.19
T2 0.10 0.18 0.04 0.19 0.07 0.05 0.11 0.23 0.29 0.32 0.34 0.36 0.34 0.31
T3 0.20 0.24 0.09 0.32 0.15 0.12 0.19 0.35 0.37 0.40 0.39 0.41 0.42 0.39
T4 0.39 0.54 0.43 0.61 0.53 0.43 0.49 0.46 0.48 0.53 0.52 0.54 0.62 0.53
T5 0.27 0.37 0.27 0.45 0.30 0.25 0.32 0.35 0.39 0.44 0.44 0.48 0.50 0.43
T6 0.25 0.36 0.22 0.40 0.24 0.23 0.28 0.32 0.35 0.41 0.42 0.42 0.50 0.41
T7 0.36 0.50 0.38 0.53 0.47 0.37 0.44 0.41 0.44 0.47 0.42 0.50 0.56 0.47
T8 0.32 0.43 0.30 0.49 0.34 0.34 0.37 0.39 0.40 0.44 0.39 0.50 0.57 0.45
T9 0.49 0.61 0.48 0.69 0.58 0.49 0.56 0.49 0.53 0.54 0.59 0.56 0.65 0.56
Mean 0.27 0.37 0.25 0.42 0.30 0.26 0.31 0.35 0.38 0.41 0.41 0.44 0.49 0.41
F S S S S S S
S S S S S S
S.Em± 0.02 0.02 0.02 0.03 0.02 0.01 0.03 0.02 0.03 0.03 0.02 0.03
CD (p=0.05) 0.06 0.08 0.05 0.08 0.06 0.03 0.08 0.07 0.09 0.09 0.06 0.11
CV 13.17 11.71 10.86 11.16 11.72 6.72 12.73 9.59 12.75 12.51 8.08 12.48
S1, 2……6: Soil 1 to 6
T1: Absolute control; T2:Rec. N & K only; T3: Rec. N & K + rec. FYM;
T4: Package of Practice (rec. NPK+FYM); T5: 100 per cent rec. N, P &K (no FYM); T6: 75 per cent rec. P + rec. N&K (no FYM);
T7: 75 per cent rec. P + rec. N&K+ rec. FYM; T8: 125 per cent rec. P + rec. N&K (no FYM); T9: 125 per cent rec. P + rec. N&K + rec. FYM

Int.J.Curr.Microbiol.App.Sci (2017) 6(11): 295-309
306
Table.4 cont...
P status/Soils/
Treatments
Medium High
S1 S2 S3 S4 S5 S6 Mean S1 S2 S3 S4 S5 S6 Mean
T1 0.26 0.22 0.24 0.21 0.23 0.21 0.23 0.29 0.32 0.33 0.27 0.32 0.32 0.31
T2 0.39 0.33 0.34 0.38 0.38 0.34 0.36 0.45 0.52 0.57 0.48 0.56 0.53 0.52
T3 0.50 0.39 0.45 0.46 0.42 0.40 0.44 0.57 0.63 0.66 0.54 0.63 0.65 0.61
T4 0.69 0.66 0.71 0.66 0.57 0.59 0.65 0.67 0.72 0.80 0.74 0.71 0.74 0.73
T5 0.59 0.56 0.62 0.61 0.55 0.57 0.58 0.64 0.67 0.65 0.57 0.69 0.68 0.65
T6 0.56 0.51 0.57 0.61 0.53 0.54 0.55 0.66 0.66 0.66 0.60 0.63 0.67 0.65
T7 0.67 0.61 0.63 0.64 0.60 0.57 0.62 0.66 0.74 0.79 0.78 0.72 0.76 0.74
T8 0.68 0.54 0.62 0.64 0.58 0.59 0.61 0.68 0.60 0.66 0.62 0.68 0.68 0.65
T9 0.74 0.69 0.73 0.70 0.65 0.66 0.70 0.72 0.69 0.73 0.73 0.72 0.72 0.72
Mean 0.57 0.50 0.54 0.55 0.50 0.50 0.53 0.59 0.62 0.65 0.59 0.63 0.64 0.62
F S S S S S S
S S S S S S
S.Em± 0.04 0.03 0.03 0.03 0.03 0.02 0.04 0.03 0.04 0.04 0.03 0.04
CD (p=0.05) 0.11 0.09 0.09 0.08 0.08 0.06 0.13 0.10 0.12 0.13 0.11 0.11
CV 12.72 11.56 11.36 9.79 10.83 7.52 11.92 9.26 10.36 12.14 9.62 9.54
S1, 2……6: Soil 1 to 6
T1: Absolute control; T2:Rec. N & K only; T3: Rec. N & K + rec. FYM;
T4: Package of Practice (rec. NPK+FYM); T5: 100 per cent rec. N, P &K (no FYM); T6: 75 per cent rec. P + rec. N&K (no FYM);
T7: 75 per cent rec. P + rec. N&K+ rec. FYM; T8: 125 per cent rec. P + rec. N&K (no FYM); T9: 125 per cent rec. P + rec. N&K + rec. FYM
Int.J.Curr.Microbiol.App.Sci (2017) 6(11): 295-309
307
Table.5 Initial available P2O5 content in soil (AVP), PPC (Plant Phosphorus Content) in check pot, CY (Yield in Check pot), YI
(Yield Increase), PRY (Per cent Relative Yield) and MY (Maximum Yield) at harvest(60 DAS) of maize grown on different
phosphorus fertility status soils of EDZ of Karnataka as influenced by graded levels of applied phosphorus
Phosphorous fertility
status Soils
AVP
(Kg ha-1
)
PPC in check
plant (per
cent)
CY
(g pot-1
)
MY
(g pot-1
)
YI*
(g pot-1
)
PRY**
(per cent)
Average PRY**
(per cent)
Very Low
(< 15 kg ha-1
)
01 10.22 0.12 86.67 137.67 51.00 41.15
23.89
02 12.74 0.18 97.07 150.00 52.93 45.47
03 3.3 0.07 60.87 118.96 58.09 4.57
04 13.29 0.19 102.55 167.65 65.10 36.51
05 7.47 0.10 71.62 137.00 65.38 8.71
06 4.83 0.08 68.00 131.28 63.28 6.94
Low
(16- 30 kg ha-1
)
01 16.37 0.21 110.33 145.45 35.12 68.17
84.72
02 22.85 0.23 125.92 141.39 15.47 87.71
03 24.5 0.25 126.66 145.43 18.77 85.18
04 26.37 0.26 130.24 148.25 18.01 86.17
05 27.47 0.27 133.37 143.76 10.39 92.21
06 29.77 0.25 135.54 150.65 15.11 88.85
Medium
(31- 45 kg ha-1
)
01 44.23 0.25 158.54 180.00 21.46 86.46
86.89
02 32.74 0.23 145.67 165.76 20.09 86.21
03 41.97 0.22 156.55 179.62 23.07 85.26
04 40.87 0.24 157.35 180.34 22.99 85.39
05 36.58 0.26 149.98 160.85 10.87 92.75
06 34.83 0.23 145.76 167.23 21.47 85.27
High
(46- 60 kg ha-1
)
01 48.56 0.27 170.00 194.87 24.87 85.37
91.90
02 59.34 0.28 185.52 199.65 14.13 92.38
03 58.12 0.32 178.67 196.43 17.76 90.06
04 47.44 0.26 184.22 197.33 13.11 92.88
05 54.13 0.30 186.65 196.76 10.11 94.58
06 56.51 0.28 188.39 195.67 7.28 96.14 YI = (MY- CY) **PRY = [{1- (YI/CY)} X 100]

Int.J.Curr.Microbiol.App.Sci (2017) 6(11): 295-309
308
Initial available phosphorus (AVP) and plant
phosphorus content in check plant (PPC),
yield in check plant (CY), maximum yield
(MY), and per cent relative yield (PRY) were
correlated positively significant (0.857**,
0.980**, 0.927** and 0.813**, respectively).
However, yield increase (YI) was negatively
correlated significantly with AVP, PPC, CY,
MY and PRY (-0.794**, -0.887**, -0.854**,
-0.564** and -0.960**, respectively).
Similarly, PRY correlated with PPC, CY and
MY positively and significantly (0.944**,
0.888** and 0.651**, respectively).
The critical limits found were 17.0 kg P2O5
ha-1
for available soil phosphorus (Fig. 1) and
0.12 per cent (Fig. 2) for maize shoot
phosphorus content. The relationship between
relative per cent yield with available P initial
and total phosphorus in maize shoot showed
positive and maximum R2 value was noticed
for plant phosphorus (R2=0.89). Wortmann et
al., (2009) reported similar results.
The revalidation of P fertility ratings based on
the per cent relative yield (PRY = [{1-
(YI/CY)} X 100]) for soils of different P
fertility levels in EDZ of Karnataka was done
using continuous calibration curve method
(Fig. 3). PRY below 55 per cent was
considered as very low in available
phosphorus, 55 to 75 per cent was considered
as low, 75 to 95 per cent was considered as
medium and above 95 per cent was
categorized as high in available phosphorus
fertility ratings, the corresponding available
phosphorus limits were as follows:
Dhillon et al., (1987) reported the rating
limits for available P were <10.10, 10.10 –
21.10 and >21.10 kg ha-1
for low, medium
and high category respectively.
Thus, based on the response of maize in soils
of varied initial P fertility applied with graded
levels of phosphorous and also based on
revised phosphorous fertility ratings, the
recommended dose of phosphorous at the rate
of 150 per cent in Very low (VL), 125 per
cent in Low (L), 100 per cent in Medium (M)
and 75 per cent in High (H) phosphorous
fertility ratings is the best management
practices in soils of Eastern Dry zone of
Karnataka as it reduces buildup of
phosphorous there by sustains soil nutrient
balance apart from cost effective.
The critical limit for available soil phosphorus
(P2O5) was 17.0 kg ha-1
below which response
to applied P would be maximum. The revised
four SPTR viz., VL: L: M: H i.e., < 15.50;
15.51-28.0; 28.10- 48.50; >48.50 kg P2O5 ha-1
provide the basis for planning soil based P
fertilizer recommendation at the rate of @
150, 125, 100 and 75 percent of the
recommended dose in the soils of respective P
fertility ratings for precision agriculture.
Acknowledgement
I would like to thank chairman and members
of advisory committee, staff’s of Dept. of
SS&AC, UAS, Bangalore, NBSS&LUP and
ICAR and my beloved family members and
friends. Thankful to ICAR, New Delhi for
granting SRF and RKVY, Govt. of Karnataka
for providing financial assistance for
conducting research.
References
Anonymous, (2012) How much of
phosphorus need to be applied for
crops. ICRISAT, www.experts123.com.
Arya, K. C. and Singh, S. N. (2001)
Productivity of maize as influenced by
different levels of, zinc and irrigation.
Indian J. Agric. Sci. 71(1): 57-59.
Cate, R. B. and Nelson, L. A. (1965) Tech.
Bull. Int. Soil Testing Serr., 1, North
Carolina, USA.

Int.J.Curr.Microbiol.App.Sci (2017) 6(11): 295-309
309
Cope, J. T. and Rouse, R. D. (1973)
Interpretation of soil test results. In Soil
Testing and Plant Analysis, Walsh,
L.M., Beaten, J. D. (Eds), Soil Science
Society of America, Madison, WI, pp:
35 - 54.
Dhillon, N. S., Vig, A. C., Milap chand, Bhan
singh and Dey, G. (1987) Critical level
of phosphorous in soils of Punjab and
response of pearl millet to applied
phosphate. J. Indian Soc. Soil Sci. 35:
238-43.
Ghosh, B. N. and Singh, R. D. (2002)
Suitability of soil test methods for
available phosphorous and its critical
levels for maize in acid soils of
Uttaranchal hills. J. Indian Soc. Soil Sci.
50(1): 132-134.
Laxminarayana, K. (2007) Distribution of
inorganic P fractions and critical limits
of available P in rice soils of Mizoram.
J. Indian Soc. Soil Sci. 55(4): 481-487.
Majumdhar, B., Venkatesh, M. S., Kailash
kumar and Patiram, (2007) Effect of
rock phosphate, superphosphate and
their mixtures with FYM on soybean
and soil-P pools in a Typic Hapludalf of
Meghalaya. J. Indian Soc. Soil Sci.
55(2): 167-174.
Muhr, G. R., Datta, N. P.,
Sankarasubramoney, H., Laley, V. K.
and Donahae, R. L. (1965) Soil testing
in India. Second edition, USAID
Mission to India, New Delhi. pp: 52-
56.
Muralidharudu, Y., Murthy, I. Y. L. N.,
Reddy, K.P. C., Reddy, B. N. and
Chandranath, H. T. (2003) Response of
sunflower (Helianthus annuus L.) to
phosphorus application in Vertisols.
HELIA, UDC 633.854.78:631.416.2,
26(39): 147-154.
Panse, V. G. and Sukhatme, P. V. (1985)
Statistical methods for agricultural
worker. Publication and information
division, ICAR, New Delhi.
Piper, C. S. (1966) Soil and Plant Analysis,
Hans Publishers, Bombay. p. 368.
Tariq aziz, Sami ullah, Abdul sattar,
Muhammad Nasim, M., Farooq and
Mujtaba khan, M. (2010) Nutrient
availability and maize (Zea mays L.)
growth in soil amended with organic
manures. Int. J. Agric. Biol. 12: 621–
624.
Tiwari, K. N. (2002) Fertilizer
recommendations: need a fresh look.
Research Education, Fertilizer
knowledge, p: 4.
Venkatesh, M. S., Majumdar, B., Kailash
kumar and Patiram, (2002) Effect of
phosphorous, FYM and lime on yield, P
uptake by maize and forms of soil
acidity in Typic hapludalf of
Meghalaya. J. Indian Soc. Soil Sci.
50(3): 254-258.
Wortmann, C. S., Dobermann, A. R.,
Ferguson, R. B., Hergert, G. W.,
Shapiro, C. A., Tarkalson, D. D. and
Walters, D. T. (2009) High-Yielding
Corn Response to Applied Phosphorus,
Potassium, and Sulfur in Nebraska.
Agron. J. 101(3): 546-555.
How to cite this article:
Chandrakala, M., C.A. Srinivasamurthy, Sanjeev Kumar, S. Bhaskar, V.R.R. Parama and
Naveen, D.V. 2017. Revised Soil Phosphorus Test Ratings (RSPTR), Critical Limits (CL) and
Phosphorous Recommendation for Maize. Int.J.Curr.Microbiol.App.Sci. 6(11): 295-309.
doi: https://doi.org/10.20546/ijcmas.2017.611.034