revised gcse and equivalent results in england, 2016 … · 1 revised gcse and equivalent results...
TRANSCRIPT

1
Revised GCSE and equivalent
results in England, 2016 to 2017
SFR01/2018, 25 January 2018
Information about new reformed GCSEs in 2017
In 2017, pupils sat reformed GCSEs in English language, English literature and maths for the first time, graded
on a 9 to 1 scale. New GCSEs in other subjects are being phased in for first teaching from September 2016 to
2018. To ensure all pupils benefit from the reformed qualifications, only the new GCSEs will be included in
secondary school performance measures as they are introduced for each subject (for example, only reformed
GCSEs in English and maths will be included in 2017 measures1).
The average Attainment 8 score per pupil has decreased in comparison to 2016 but this change is as expected when compared to 2016 data with the 2017 point score scale applied
In comparison to 2016, the average Attainment 8 score
per pupil has decreased by 3.9 points for all schools to
44.6 and by 3.6 points for state-funded schools to 46.3
in 2017. These decreases are as expected following
changes to the 2017 point scores assigned to grades
because of the introduction of 9 to 1 GCSEs in
performance tables.
The published shadow data, where 2016 results were
mapped onto the 2017 point score scale2, produced an
average Attainment 8 score of 43.6 for all schools and
44.6 for state-funded schools. The 2017 scores are
stable in comparison to this shadow data3.
365 schools are below the floor standard in 2017, and 271 meet the coasting definition
365 schools are below the secondary school floor
standard (see section 8 for definition, the floor
standard for 2017 is the same as 2016). This
represents 12% of state-funded mainstream schools.
In 2016, 282 (9.3%) of schools were below the floor
standard.
271 schools (9.6% of eligible schools) meet the
coasting definition (see section 9). 169 schools are
both below the floor and meet the coasting definition.
1 For further information on GCSE reform, including grade/points changes and secondary accountability measures:
https://www.gov.uk/government/publications/progress-8-school-performance-measure 2 2016 shadow data took pupil results from 2016 and directly matched them to the points that they would have been allocated, if the same pupil took exactly the same subjects and achieved the same marks in 2017. For further information, see the ‘Key stage 4 shadow measures’ ad-hoc release here: https://www.gov.uk/government/uploads/system/uploads/attachment_data/file/604312/KS4_shadow_measures_FINAL.pdf 3 When comparing 2017 revised data and 2016 shadow data, it is important to consider the differences in the points allocated to 9-1 GCSEs which were
absent in the shadow data, for example the highest points awarded in the shadow data in English and maths were 8.5, whereas from 2017 it is possible for pupils to achieve a grade 9 in the new reformed English and maths qualifications.

2
The gap between disadvantaged pupils and others continues to narrow
The gap between disadvantaged pupils and
others, measured using the gap index, decreased
in five of the last six years, narrowing by 10.0%
overall since 2011 and 3.2% since 2016. The
average position of disadvantaged pupils
compared to others is closer together than it was
last year.
The effect of the introduction of reformed English
and maths GCSEs on the comparability of this
measure has been considered and is estimated to
be small.
EBacc entry and achievement have both decreased
The proportion of pupils entering the EBacc
has decreased by 1.5 percentage points
since 2016. In 2017, 38.2% of pupils in state-
funded schools entered the EBacc and
21.3% achieved the EBacc by gaining
grades 5 or above in English and maths
GCSEs and grades C or above in
unreformed qualifications that count towards
the remaining EBacc subject areas.
However, 23.7% of pupils achieved the
EBacc by gaining grades 4 or above in
English and maths GCSEs and grades C or
above in unreformed subject areas. This
figure is most comparable to 2016 data,
because the bottom of a grade 4 in reformed GCSEs maps onto the bottom of a grade C in unreformed
GCSEs. Comparison of the grade 4 or above figure to the 2016 revised data shows a decrease in EBacc
achievement of 1 percentage point.
Percentage achieving the threshold of a grade 4 or above in English and maths is stable compared to equivalent 2016 data
The proportion of pupils achieving the headline
measure of grades 5 or above in English and maths
is 39.6% for all schools and 42.6% for state-funded
schools. This figure does not have a comparator in
previous years.
In 2017, 59.1% of pupils in all schools and 63.9% of
pupils in state-funded schools achieved grade 4 or
above in English and maths. This figure is
comparable to 2016 data because the bottom of a
grade 4 in reformed GCSEs maps onto the bottom
of a grade C of unreformed GCSEs. Comparison of
these figures to equivalent 2016 data shows that
attainment in this measure is stable, with an

3
increase of 0.9 percentage points across state-funded schools.
Contact: Email: [email protected] Press office: 020 7783 8300 Public enquiries: 0370 000 2288
Contents
1. Headline measures from 2017 ....................................................................... 5
2. Attainment in the headline measures ............................................................. 6
3. Attainment 8 and Progress 8 ........................................................................ 11
4. Attainment in English and maths ………....................................................... 13
5. The English Baccalaureate ...........................................................................14
6. Subject analysis ........................................................................................... 18
7. Attainment by pupil characteristics …........................................................... 22
8. Floor standards……………………………………………………………………35
9. Coasting schools ………………………………………………………………….36
10. Attainment by school type ............................................................................ 38
11. Attainment by admissions basis ................................................................... 44
12. Attainment by religious character ................................................................. 45
13. Attainment by local authority ........................................................................ 46
14. Accompanying tables ................................................................................... 48
15. Further information is available .................................................................... 50
16. National Statistics ......................................................................................... 51
17. Technical information ................................................................................... 52
18. Get in touch .................................................................................................. 53

4
About this release
This SFR provides revised GCSE and equivalent results of pupils at the end of key stage 4 in England. Figures are
provided at national, regional and local authority level for the 2016-17 academic year. School level results for the headline
measures are published in the revised school performance tables.
This release provides an update to the provisional figures released in October 2017 in SFR57/2017. Amendments made
during the schools checking exercise in September are included in this release, as are the majority of late results and
reviews of marking received after the cut-off date for the provisional release in October.
This release also provides breakdowns by pupil characteristics and information on schools below the floor and those
meeting the coasting definition, which was not included in the provisional update in October 2017.
Users should be cautious when comparing headline measures between 2017 and 2016. In 2017, Attainment 8 scores
were calculated using slightly different point score scales in comparison to 2016, in order to minimise change following
the introduction of grade 9 to 1 reformed GCSEs. This means that Attainment 8 scores are likely to look different in 2017,
as a result of changes to the methodology. Where possible, for further context, 2017 Attainment 8 scores have been
compared to 2016 shadow data, which mapped 2017 point scores onto 2016 results.
As explained below in the headline measures section, the threshold for the English and maths and EBacc attainment
headline measures has risen in 2017 to include a grade 5 or above in English and maths, following the introduction of
grade 9 to 1 reformed GCSEs in these subjects. In this release, pupils must achieve grades 5 or above for English and
maths to achieve these threshold attainment measures. Additional measures are published alongside this where the
threshold is set to achievement of grade 4 or above in English and maths in order to allow for comparisons to 2016.
Since 2013, Universal Credit (UC) has been gradually rolling out nationwide replacing a number of income-related
benefits, some of which provided families with entitlement to free school meals. Key stage 4 performance measures use
pupils’ disadvantaged status at the end of key stage 4, therefore, the impact of Universal Credit on disadvantage
measures is currently limited given the gradual roll out, but may increase in future years. A consultation which invited
views on proposed approach to the eligibility for free school meals and the early year’s pupil premium under Universal
Credit was closed in January 2018, the response will be published later this year.
In this publication
The following tables are included in the release:
• National tables (Excel .xls) • National characteristics tables (Excel .xls)
• Local authority tables (Excel .xls) • Local authority characteristics tables (Excel .xls)
• Subject tables (Excel .xls) • Subject time series table (Excel .xls)
• Alternative provision tables (Excel .xls) • Pupil residency and school location tables (Excel .xls)
The accompanying quality and methodology information document provides information on the data sources, their
coverage and quality and explains the methodology used in producing the data.
Feedback
We are changing how our releases look and welcome feedback on any aspect of this document at

5
1. 2017 Headline measures Attainment 8
Attainment 8 measures the average achievement of pupils in up to 8 qualifications including English (double weighted if
both language and literature are taken), maths (double weighted), three further qualifications that count in the English
Baccalaureate (EBacc) and three further qualifications that can be GCSE qualifications (including EBacc subjects) or any
other non-GCSE qualifications on the DfE approved list.
Progress 8
Progress 8 aims to capture the progress a pupil makes from the end of key stage 2 to the end of key stage 4. It compares
pupils’ achievement – their Attainment 8 score – with the average Attainment 8 score of all pupils nationally who had a
similar starting point (or ‘prior attainment’), calculated using assessment results from the end of primary school. Progress
8 is a relative measure, therefore the national average Progress 8 score for mainstream schools is very close to zero.
When including pupils at special schools the national average is not zero as Progress 8 scores for special schools are
calculated using Attainment 8 estimates based on pupils in mainstream schools. More information on Attainment 8 and
Progress 8 can be found here.
Attainment in English and maths (grades 5 or above)
From 2017, this measure looks at the percentage of pupils achieving a grade 5 or above in both English and maths.
Pupils can achieve the English component of this with a grade 5 or above in English language or literature. There is no
requirement to sit both exams.
The English Baccalaureate (EBacc) entry and achievement
The EBacc was first introduced into the performance tables in 2009/10. It allows people to see how many pupils reach the
attainment threshold in core academic subjects at key stage 4. The EBacc is made up of English, maths, science, a
language, and history or geography. To count in the EBacc, qualifications must be on the English Baccalaureate list of
qualifications.
In 2017, the headline EBacc achievement measure includes pupils who take exams in both English language and English
literature, and achieve a grade 5 or above in at least one of these qualifications. Pupils must also achieve a grade 5 or
above in mathematics and a grade C or above in the remaining subject areas.
Percentage of students staying in education or going into employment after key stage 4 (pupil destinations)
This measure is published here as part of a release including post key stage 4 and 16 to 18 destinations.
Additional measures
For transparency and to allow comparison to 2016, the threshold attainment measures are also published at grade 4 or
above, as additional measures. These additional measures are:
Attainment in English and maths (grades 4 or above)
From 2017, this measure looks at the percentage of pupils achieving grade 4 or above in both English and maths. Pupils
can achieve the English component of this with a grade 4 or above in English language or literature. There is no
requirement to sit both exams.
English Baccalaureate (EBacc) achievement
This measure includes pupils who take exams in both English language and English literature, and achieve a grade 4 or
above in at least one of these qualifications. Pupils also need to achieve a grade 4 or above in maths and a grade C or
above in the remaining subject areas.

6
2. Attainment in the headline measures (Tables 1a & 1d) When comparing 2017 headline measures to the equivalent revised data from 2016, it is important to note the
changes in methodology underpinning the 2017 data. These changes are explained in the ‘About this release’
section above and expanded upon in following sections on specific headline measures.
The tables below show decreases across the headline measures in 2017 compared to 2016 revised data.
However, these decreases are due to a number of methodological changes, including the move to a new point
score scale for 2017 Attainment 8 scores, the introduction of reformed GCSEs in English and maths graded
on the 9 to 1 scale and changes to the attainment threshold for the EBacc and the English and maths
measure.
For Attainment 8, 2016 shadow data is shown alongside the 2016 revised results; this data is more comparable to 2017. For the threshold attainment measures, the equivalent measure using grade 4 or above as a threshold for English and maths are given in the table, to aid comparability with 2016 data. The bottom of a C grade in unreformed GCSEs is mapped onto the bottom of a grade 4 in reformed GCSEs. Table 1: Attainment in the 2017 headline measures
England, all schools, 2016-2017
Average Attainment 8 score per pupil
The methodology for this measure has changed from 2016 to 2017 Attainment 8 score
2016 revised 48.5
2016 results matched to 2017 point scores (shadow data) 43.6
2017 revised 44.6
Percentage achieving the threshold in English and maths
The methodology for this measure has changed from 2016 to 2017
Percentage achieving threshold in English and maths
2016 revised 59.3%
2017 revised (9-5 grades in English and
maths) 39.6%
(9-4 grades in English and maths) 59.1%
Percentage entering the EBacc
This measure is calculated using the same methodology as 2016
Percentage entering the EBacc
2016 revised 36.8%
2017 revised 35.0%
Percentage achieving the EBacc
The methodology for this measure has changed from 2016 to 2017
Percentage achieving the EBacc
2016 revised 23.1%
2017 revised (9-5 grades in English and maths and A*-C in unreformed subjects) 19.7%
(9-4 grades in English and maths and A*-C in unreformed subjects) 21.9%

7
Table 2: Attainment in the 2017 headline measures England, state-funded schools, 2016-2017
Average Attainment 8 score per pupil
The methodology for this measure has changed from 2016 to 2017 Attainment 8 score
2016 revised 49.9
2016 results matched to 2017 point scores (shadow data) 44.6
2017 revised 46.3
Percentage achieving the threshold in English and maths
The methodology for this measure has changed from 2016 to 2017
Percentage achieving threshold in English and maths
2016 revised 63.0%
2017 revised (9-5 grades in English and
maths) 42.6%
(9-4 grades in English and maths) 63.9%
Percentage entering the EBacc
This measure is calculated using the same methodology as 2016
Percentage entering the EBacc
2016 revised 39.7%
2017 revised 38.2%
Percentage achieving the EBacc
The methodology for this measure has changed from 2016 to 2017
Percentage achieving the EBacc
2016 revised 24.7%
2017 revised (9-5 grades in English and maths and A*-C in unreformed subjects) 21.3%
(9-4 grades in English and maths and A*-C in unreformed subjects) 23.7%
Source: key stage 4 attainment data
The measures covered in this release include qualifications that count towards the secondary
performance tables4. Schools that offer unapproved qualifications, such as unregulated international
GCSEs, will not have these qualifications counted in the performance tables, and pupils’ achievements
in these qualifications are therefore not reflected in this release. This release is therefore representative
of the performance of schools and pupils in qualifications which count in the performance tables, and
not of all qualifications taken by pupils. The difference between the figures for all schools and state-
funded schools is predominantly due to the impact of unregulated international GCSEs taken more
commonly in independent schools.
In 2017, over 30,000 pupils at the end of key stage 4 were entered for either unreformed English or
maths GCSEs, despite these qualifications not counting in 2017 performance tables. These pupils were
not entered for the reformed GCSEs (graded on a 9 to 1 scale) in the same subject, which will have had
4 A list of qualifications that count in the performance tables each year up to 2019 can be found at https://www.gov.uk/government/publications/2018-performance-tables-discount-codes

8
an impact on Attainment 8, Progress 8, the EBacc entry measure and the attainment in English and
maths measures. This is likely to have happened as a result of pupils taking these qualifications in 2016
before they reached the end of key stage 4. In addition, pupils have still entered unregulated
international GCSEs and regulated international GCSEs (that counted in 2016 but no longer count in
2017) which will account for some of the remaining difference between the 2016 and 2017 outcomes.
The decrease in the proportion of pupils entering the EBacc is largely driven by a decrease in pupils
entering the languages pillar, and whilst there has been an increase in pupils with low prior attainment
entering the EBacc, there has been a decrease in pupils with higher prior attainment entering the
EBacc. This is covered in more detail in section 5.
Figures for all schools typically change more than those for state-funded schools between the
provisional and revised releases, due to the impact of results for independent schools and FE colleges
with 14-16 provision. The level of change between provisional and revised data is higher for
independent schools and FE colleges with 14-16 provision as, under the current process, independent
schools and FE colleges with 14-16 provision do not check their cohort figures until September,
whereas state funded schools do this in June.
The change between provisional and revised results in 2017 was slightly smaller than the equivalent
change in 2016 for EBacc measures, and the same for English and maths achievement (at grades 4 or
above) to the change seen last year (at grades C or above), as shown in table 3. There was a slightly
larger change in average Attainment 8 score.
Possible reasons for this might include an increased number of amendments during the September
checking exercise as schools continue to adapt to the new accountability system. There was also an
increase in the number of GCSE grades challenged and grades changed in 2017, mainly in the
reformed English and English literature GCSEs5. These changes could have affected Attainment 8,
more than the other headline measures, if the grade changes, as a result of reviews, were across the
range of grades and not just the grade 3 and 4 boundary. The 2017 point score scale change could also
have impacted Attainment 8, as the difference in points in 2017 means that higher grades attract more
points in comparison to 2016. Reviews of marking between provisional and revised data at higher grade
boundaries would therefore have increased Attainment 8 scores more than an equivalent change in
2016.
These changes are not substantially different to previous years and many of the patterns originally
reported in the provisional release still stand.
5 See Reviews of marking and moderation for GCSE and A Level: summer 2017 exam series, Ofqual
9
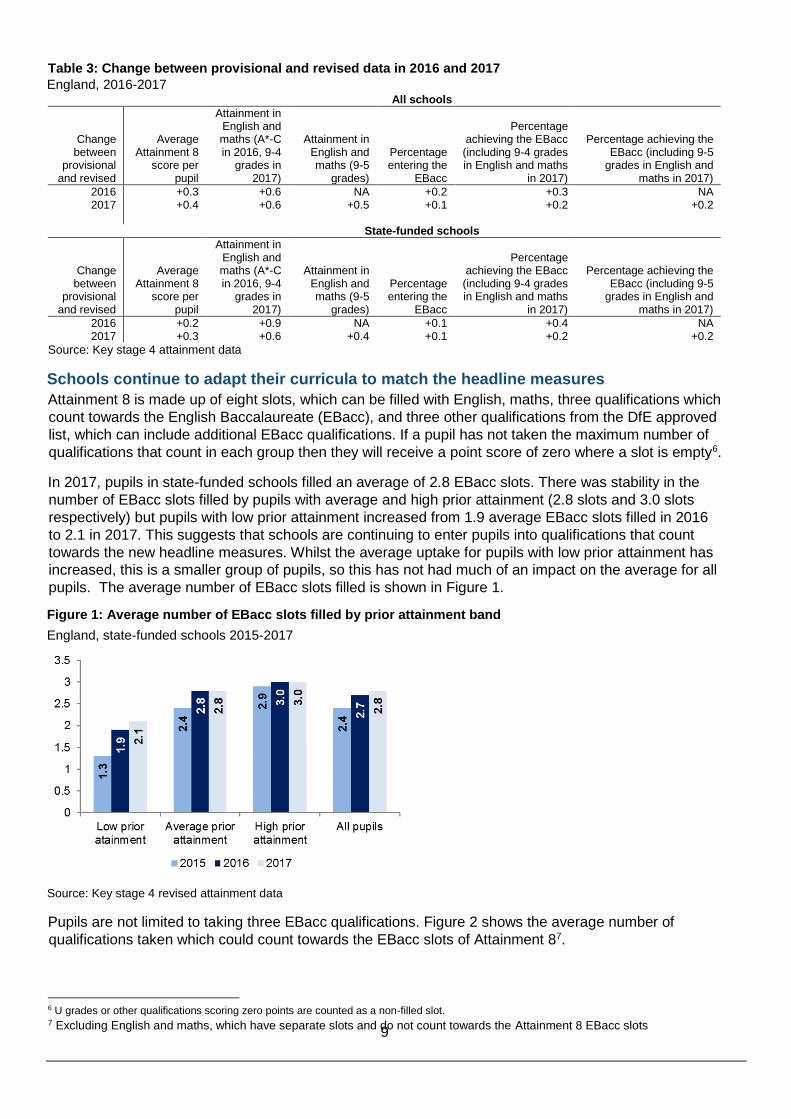
Table 3: Change between provisional and revised data in 2016 and 2017
England, 2016-2017 All schools
Change between
provisional and revised
Average Attainment 8
score per pupil
Attainment in English and maths (A*-C in 2016, 9-4
grades in 2017)
Attainment in English and maths (9-5
grades)
Percentage entering the
EBacc
Percentage achieving the EBacc (including 9-4 grades in English and maths
in 2017)
Percentage achieving the EBacc (including 9-5
grades in English and maths in 2017)
2016 +0.3 +0.6 NA +0.2 +0.3 NA 2017 +0.4 +0.6 +0.5 +0.1 +0.2 +0.2
State-funded schools
Change between
provisional and revised
Average Attainment 8
score per pupil
Attainment in English and maths (A*-C in 2016, 9-4
grades in 2017)
Attainment in English and maths (9-5
grades)
Percentage entering the
EBacc
Percentage achieving the EBacc (including 9-4 grades in English and maths
in 2017)
Percentage achieving the EBacc (including 9-5
grades in English and maths in 2017)
2016 +0.2 +0.9 NA +0.1 +0.4 NA 2017 +0.3 +0.6 +0.4 +0.1 +0.2 +0.2
Source: Key stage 4 attainment data
Schools continue to adapt their curricula to match the headline measures
Attainment 8 is made up of eight slots, which can be filled with English, maths, three qualifications which
count towards the English Baccalaureate (EBacc), and three other qualifications from the DfE approved
list, which can include additional EBacc qualifications. If a pupil has not taken the maximum number of
qualifications that count in each group then they will receive a point score of zero where a slot is empty6.
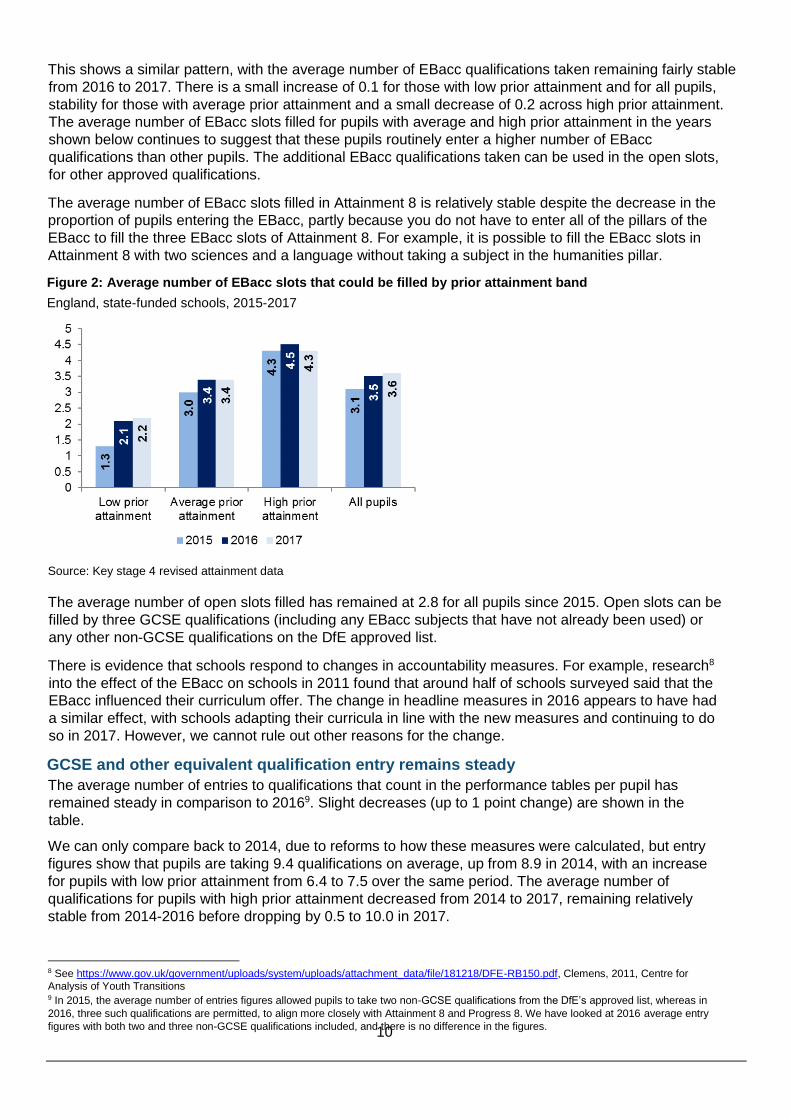
In 2017, pupils in state-funded schools filled an average of 2.8 EBacc slots. There was stability in the
number of EBacc slots filled by pupils with average and high prior attainment (2.8 slots and 3.0 slots
respectively) but pupils with low prior attainment increased from 1.9 average EBacc slots filled in 2016
to 2.1 in 2017. This suggests that schools are continuing to enter pupils into qualifications that count
towards the new headline measures. Whilst the average uptake for pupils with low prior attainment has
increased, this is a smaller group of pupils, so this has not had much of an impact on the average for all
pupils. The average number of EBacc slots filled is shown in Figure 1.
Figure 1: Average number of EBacc slots filled by prior attainment band
England, state-funded schools 2015-2017
Source: Key stage 4 revised attainment data
Pupils are not limited to taking three EBacc qualifications. Figure 2 shows the average number of
qualifications taken which could count towards the EBacc slots of Attainment 87.
6 U grades or other qualifications scoring zero points are counted as a non-filled slot. 7 Excluding English and maths, which have separate slots and do not count towards the Attainment 8 EBacc slots
10
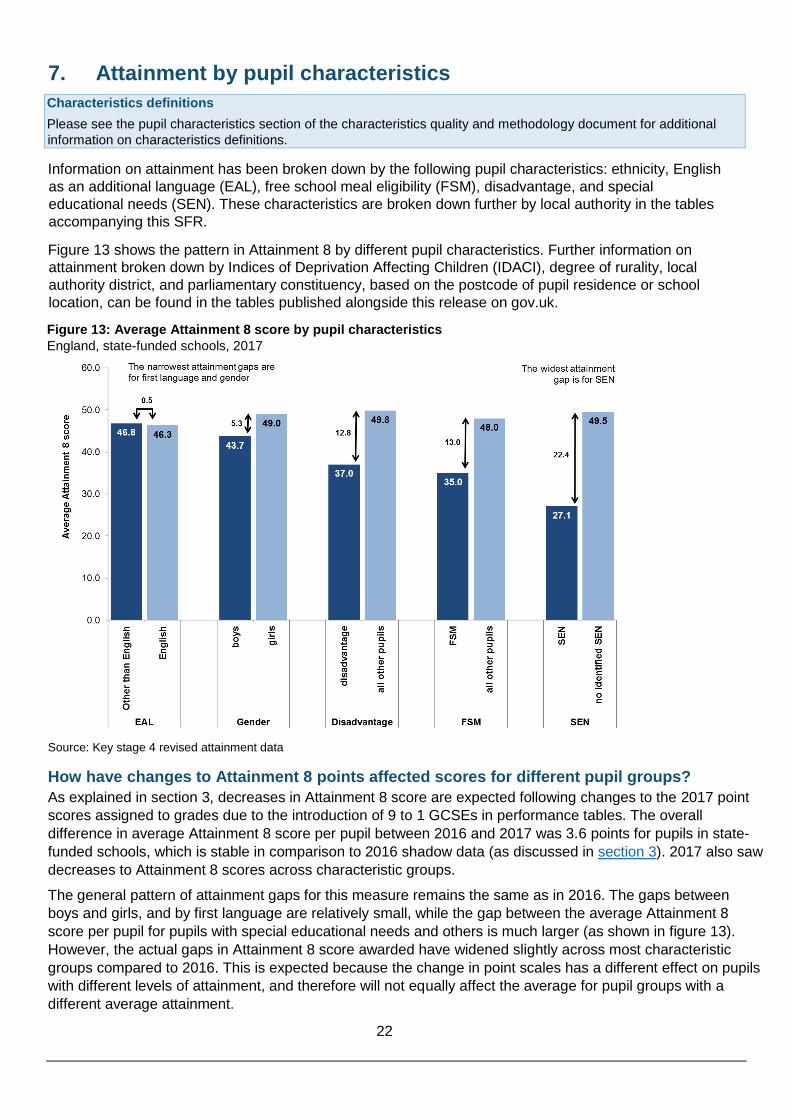
This shows a similar pattern, with the average number of EBacc qualifications taken remaining fairly stable
from 2016 to 2017. There is a small increase of 0.1 for those with low prior attainment and for all pupils,
stability for those with average prior attainment and a small decrease of 0.2 across high prior attainment.
The average number of EBacc slots filled for pupils with average and high prior attainment in the years
shown below continues to suggest that these pupils routinely enter a higher number of EBacc
qualifications than other pupils. The additional EBacc qualifications taken can be used in the open slots,
for other approved qualifications.
The average number of EBacc slots filled in Attainment 8 is relatively stable despite the decrease in the
proportion of pupils entering the EBacc, partly because you do not have to enter all of the pillars of the
EBacc to fill the three EBacc slots of Attainment 8. For example, it is possible to fill the EBacc slots in
Attainment 8 with two sciences and a language without taking a subject in the humanities pillar.
Figure 2: Average number of EBacc slots that could be filled by prior attainment band
England, state-funded schools, 2015-2017
Source: Key stage 4 revised attainment data
The average number of open slots filled has remained at 2.8 for all pupils since 2015. Open slots can be
filled by three GCSE qualifications (including any EBacc subjects that have not already been used) or
any other non-GCSE qualifications on the DfE approved list.
There is evidence that schools respond to changes in accountability measures. For example, research8
into the effect of the EBacc on schools in 2011 found that around half of schools surveyed said that the
EBacc influenced their curriculum offer. The change in headline measures in 2016 appears to have had
a similar effect, with schools adapting their curricula in line with the new measures and continuing to do
so in 2017. However, we cannot rule out other reasons for the change.
GCSE and other equivalent qualification entry remains steady
The average number of entries to qualifications that count in the performance tables per pupil has
remained steady in comparison to 20169. Slight decreases (up to 1 point change) are shown in the
table.
We can only compare back to 2014, due to reforms to how these measures were calculated, but entry
figures show that pupils are taking 9.4 qualifications on average, up from 8.9 in 2014, with an increase
for pupils with low prior attainment from 6.4 to 7.5 over the same period. The average number of
qualifications for pupils with high prior attainment decreased from 2014 to 2017, remaining relatively
stable from 2014-2016 before dropping by 0.5 to 10.0 in 2017.
8 See https://www.gov.uk/government/uploads/system/uploads/attachment_data/file/181218/DFE-RB150.pdf, Clemens, 2011, Centre for
Analysis of Youth Transitions 9 In 2015, the average number of entries figures allowed pupils to take two non-GCSE qualifications from the DfE’s approved list, whereas in
2016, three such qualifications are permitted, to align more closely with Attainment 8 and Progress 8. We have looked at 2016 average entry
figures with both two and three non-GCSE qualifications included, and there is no difference in the figures.

11
Figure 3: Average number of entries in all qualifications and GCSEs, by prior attainment band
England, state-funded schools, 2017
Source: Key stage 4 revised attainment data
The percentage of GCSEs entered by the cohort has increased in 2017. GCSEs10 made up 81% of all
entries for pupils with low prior attainment in 2014, increasing to 89% in 2017. This is a 2 percentage
point increase from 2016. There was a smaller increase for pupils with average prior attainment, from
90% in 2014 to 92% in 2017. The percentage of GCSEs entered by pupils with high prior attainment
has remained steady at 94%. The percentage of GCSEs entered by the whole cohort increased by one
percentage point, from 91% in 2014 to 92% in 2017.
3. Attainment 8 and Progress 8 (Table 1d and 2a) Attainment 8
In comparison to 2016, the average Attainment 8 score per pupil has decreased by 3.9 points for all
schools to 44.6 and by 3.6 points for state-funded schools to 46.3 in 2017. However, these decreases are
as expected given the move to the new point scores following the introduction of reformed GCSEs (graded
on the 9-1 scale) in performance tables. Compared to shadow data, where 2016 results were mapped
onto the 2017 point score scale11, the average Attainment 8 score per pupil for 2017 is stable. The 2016
shadow data provides a more accurate comparison, than the 2016 revised scores, as the 2016 revised
data was based on a different point score scale to the 2017 revised data.
The maximum Attainment 8 score for a pupil taking only GCSE qualifications is 87.5 in 2017 (80 in 2016).
A pupil who achieves two grade 9s in the English and maths slots and six A* grades across the EBacc
and open slots in qualifying subjects, would have a point score of 87.
When comparing 2017 to 2016 shadow data, it is important to consider that the highest grade awarded in
the shadow data for English and maths was 8.5, whereas in 2017 it was possible for pupils to achieve a
grade 9 in reformed English and maths qualifications.
Figure 4 shows that the average score per pupil has increased slightly or remained stable across all
elements of Attainment 8 compared to 2016 shadow data.
Figure 4: Average score per pupil in each element of Attainment 8
England, 2017
10 Includes full course GCSEs, double award GCSEs, AS levels, Cambridge International Certificates and Edexcel Level1/2 Certificates. 11 2016 shadow data takes pupils results from 2016 and directly matches them to the points that they would have been allocated, if the same pupil took exactly the same subjects and achieved the same marks in 2017. For further information, see the ‘Key stage 4 shadow measures’ ad-hoc release here: https://www.gov.uk/government/uploads/system/uploads/attachment_data/file/604312/KS4_shadow_measures_FINAL.pdf

12
Source: Key stage 4 revised attainment data

13
Progress 8
Progress 8 is a relative measure, which means that the overall national score remains the same
between years12. We will look further at patterns in Progress 8 in the sections on school type,
admissions basis and gender, as Progress 8 is more relevant where we can compare between groups.
From 2017 onwards, reading and maths test results only are used in calculating key stage 2 prior
attainment fine levels for use in Progress 813. 2017 is the second year in which Progress 8 scores have
been published for all state-funded schools. The distribution of Progress 8 scores by school is shown
below. Progress 8 scores for mainstream schools14 at school level run from -2.5 to 1.8, with
approximately 99% of schools’ scores between -1.6 and +1.0 in 2017.
Figure 5: Distribution of Progress 8 scores England, state-funded mainstream schools7, 2017
A Progress 8 score of
above 0 means a
school is making
above average
progress.
Source: Key stage 4 revised attainment data
4. Percentage of pupils achieving a grade 5 or above in English and
maths (Table 1a)
The new headline attainment measure requires pupils to achieve a grade 5 or above in either English language or
literature (with no requirement to take both) and to achieve a grade 5 or above in EBacc maths. For transparency and
to allow comparison to 2016 figures, the percentage of pupils achieving grade 4 or above in English and maths is also
shown.
Attainment in English and maths at grade 5 or above is 39.6% in all schools and 42.6% in state-funded
schools. To compare to 2016, it is best to use attainment in English and maths at grade 4 or above, as the
bottom of a C grade in unreformed English and maths qualifications maps onto the bottom of a grade 4 of
reformed GCSEs in these subjects. As shown in Table 4, attainment at this threshold is stable for 2017, with
an increase of 0.9 percentage points across state-funded schools.
12 The Progress 8 measure should not be compared year on year, however, at school level it may be useful to compare a school’s percentile rank based
on Progress 8. For example, knowing a school had a Progress 8 score of -0.2 in 2016 and a score of -0.2 in 2017 tells you how the school did
compared to national average in those years but not whether their performance improved across years. However, knowing that they were in the 86th
percentile in 2016 and in the 70th percentile in 2017 tells you they have improved over time compared to other schools. Percentile ranks should still be
comparable despite possible changes in the distribution of Progress 8 scores and are a good starting point for understanding performance on this
measure over time. 13 For 2016 and for 2015 for schools opting in early to Progress 8, overall English (a combination of reading and writing) and maths key stage 2 test
results were used to calculate prior attainment. In 2017, a new methodology was implemented using just the reading element alongside maths scores.
This resulted in a larger proportion of pupils with higher key stage 2 prior attainment scores. This change to reading in 2017 is because since 2012
primary schools have used a form of teacher assessment in writing at key stage 2 that does not map easily to test scores. 14 Excludes further education colleges with 14-16 provision

14
Table 4: Attainment in English and maths (grades 5 or above) England, 2016-2017 Year Measure All schools State-funded
schools Comment
2017 revised % achieving
grade 5 or
above
39.6% 42.6% The headline threshold measure has changed in
2017, to set a higher standard for schools. As the
threshold is now higher, these figures should not
be compared to the English and maths attainment
figures for 2016.
Source: Key stage 4 revised attainment data
Table 5: Attainment in English and maths (grades 4 or above)
England, 2016-2017 Year Measure All schools State-funded
schools Comment
2017 revised % achieving
grade 4 or
above
59.1% 63.9% The results are stable compared to 2016 using
this measure, because the bottom of a grade 4 in
reformed GCSEs maps onto the bottom of a
grade C of unreformed GCSEs in these subjects. 2016 revised - 59.3% 63.0%
Source: Key stage 4 revised attainment data
5. The English Baccalaureate (Table 1b) The proportion of pupils entering and achieving the EBacc has decreased, with 38.2% of pupils in state-
funded schools entering the EBacc in 2017 and 21.3% achieving the EBacc by gaining a grade 5 or
above in English and maths GCSEs and grades A* to C in unreformed qualifications in the other EBacc
subject areas.
In 2017, 23.7% of pupils achieved the EBacc by gaining a grade 4 or above in English and maths
GCSEs, this figure is the most comparable to 2016 data. Comparison of these two figures shows a
smaller decrease of 1 percentage point.
Changes in methodology and patterns of entry for specific EBacc pillars may be responsible for the
decrease in EBacc entry, as explained in the sections below. Across the elements that make up the
EBacc, entries to EBacc English are down slightly while entries to EBacc maths remain fairly stable,
entries to EBacc languages decreased and entries to EBacc Science and humanities are up in
comparison to 2017.
EBacc entry
In 2017, 35.0% of pupils in all schools and 38.2% of pupils in state-funded schools entered the EBacc, a
decrease of 1.8 and 1.5 percentage points respectively compared to 2016.
The difference between the figures for all schools and state-funded schools is related to the impact of
unregulated international GCSEs commonly taken in independent schools. This lowers the 2017 result
for all schools, as it has since 2013. Some independent schools choose to enter qualifications which do
not count towards the performance tables, particularly for English and maths. These schools will
therefore have scores of 0% for some measures in the performance tables, for example EBacc entry
and achievement, which has an effect on the national figures. However, it is worth noting that there are
many other reasons why a school may have a score of 0% in threshold measures.
In 2017, EBacc entry figures are also likely to have been impacted by over 30,000 pupils continuing to be
entered solely for unreformed English and maths GCSEs, despite these qualifications not counting in
performance tables this year. However, further analysis suggests that a reduction in entries to the language
element far outweighs the impact of pupils taking unreformed qualifications, as less than 200 pupils missed
entering the EBacc because they were entered for the unreformed English or mathematics qualifications or
qualifications in these subjects that no longer count in performance tables such as international GCSEs.

15
Figure 6: Percentage of pupils entering the EBacc England, 2010-2017
Source: Key stage 4 attainment data
There was another large increase in the percentage of pupils entering four components15 of the EBacc
from 37.5% in 2016 to 43.8% in 2017, with corresponding falls in pupils taking two or three components,
down to 2.5% and 12.1% respectively, as shown in figure 7.
Figure 7: Percentage of pupils with entries into different numbers of EBacc components
England, state-funded schools, 2010-2017
Source: Key stage 4 attainment data
Of those pupils who entered four out of the five EBacc components, the majority (80.4%) were
missing the languages component in 2017, up from 77.8% in 2016. The humanities component was
the second highest missing component, with 17.3% who entered four components not entering
humanities in 2017, down from 18.7% in 2016.
15 There are five components that make up the English Baccalaureate: English, maths, science, a language, and history or
geography

16
The percentage of pupils who did not enter any EBacc components has remained stable, at between
1.9% and 2.4% between 2010 and 2017. The majority of pupils who did not enter any EBacc
components have low prior attainment at key stage 2 (80.0% in 2017).
EBacc achievement
The new headline EBacc achievement measure requires pupils on the English language and English literature
pathway to enter both language and literature, and achieve a grade 5 or above in either qualification. Pupils must also
achieve a grade 5 or above in EBacc maths and a grade C or above in the science, humanities and language pillars
of the EBacc. For transparency and to allow comparison to 2017 figures, the percentage of pupils achieving the
EBacc with a grade 4 or above in English and maths and a grade C or above in unreformed subjects is also shown.
In 2017, 19.7% of pupils in all schools and 21.3% of pupils in state-funded schools achieved the EBacc
achievement headline measure (grade 5 or above in English and maths and grade C or above in legacy
subjects), a decrease of 3.4 percentage points compared to 2016.
The tables below provide commentary and compare EBacc achievement at grade 4 or above
in English and maths and grade C or above in unreformed subjects to 2016 results.
Table 6: EBacc achievement (grades 5 or above in English and maths)
England, 2016-2017 Year Measure All schools State-funded
schools Comment
2017 revised % achieving
grade 5 or
above in
English and
maths and A*-C
in unreformed
subjects
19.7% 21.3% The headline threshold measure has changed for
the English and maths elements of the EBacc in
2017 to establish grade 5 as a new headline
measure, in order to raise standards for schools.
As the threshold is now higher, these figures
should not be compared to the EBacc
achievement figures for 2016.
Source: Key stage 4 revised attainment data
Table 7: EBacc achievement (grades 4 or above in English and maths)
England, 2016-2017 Year Measure All schools State-funded
schools Comment
2017 revised % achieving
grade 4 or
above in
English and
maths and
A*-C in
unreformed
subjects
21.9% 23.7% When comparing to 2016, this measure should be
used as the bottom of a grade 4 in reformed
GCSEs maps onto the bottom of a grade C in
unreformed GCSEs in English and maths.
Comparison shows a drop in EBacc achievement,
with decreases of 1.2 and 1.0 percentage points
respectively.
2016 revised - 23.1% 24.7%
Source: Key stage 4 revised attainment data

17
EBacc by prior attainment
The overall EBacc entry rate in state-funded mainstream schools has decreased from 40.3% in 2016 to
38.9% in 2017 (a drop of 1.4 percentage points). EBacc entry rates have also decreased for pupils with
average and high prior attainment, as shown in Figure 8. Entry rates continue to rise for pupils with low
prior attainment, with 9.0% entering the EBacc in 2017 compared to 8.3% in 2016.
Figure 8: EBacc entry rates by prior attainment band England, state-funded mainstream schools, 2016-2017
Source: Key stage 4 revised attainment data
In 2017, 55.9% of pupils that entered the EBacc in state-funded mainstream schools achieved the
EBacc, gaining grades 5 or above in English and maths elements and grades C and above across
unreformed subjects in remaining elements, as shown in Figure 9. The proportion of pupils achieving
the EBacc by gaining grades 4 and above in the English and maths pillars and grades C and above
across unreformed subjects in the remaining pillars was 62.2%, which is stable in comparison to 2016.
Using the new headline threshold measure which includes achievement of a grade 5 or above in
English and maths, the EBacc achievement rate for low prior attainment is 5.9%, 26.1% for average
prior attainment and 73.5% for high prior attainment. For those who achieved the EBacc with grades 4
or above in English and maths GCSEs, the EBacc pass rate decreased from 2016 for pupils with
average and high prior attainment (by 6.7 and 4.5 percentage points respectively). The EBacc pass rate
remained stable for low prior attainment pupils at 10.5%
Figure 9: EBacc achievement rates for pupils who entered the EBacc, by prior attainment band
England, state-funded mainstream schools, 2016-2017
Source: Key stage 4 revised attainment data

18
6. Subject analysis (Tables 1b, 1c & 1d)
EBacc English
To pass the English element of the headline EBacc attainment measure, pupils must achieve a grade 5 or above in
either English language or English literature GCSEs (or A*-C grades in approved AS levels), with entries into both
The percentage of pupils with entries to EBacc English has decreased slightly in comparison with 2016,
from 96.5% to 95.7%. The entry rate remains high and this is due to the fact that it is compulsory for
pupils to study English at key stage 4 in state-funded schools, and the vast majority of pupils enter
English qualifications that count in the performance tables.
Table 8: EBacc English achievement England, state-funded schools, 2016-2017 Year Achieving
EBacc English
2016 revised 74.8%
2017 revised
(grade 5 or above)
60.5%
2017 revised (grade
4 or above)
75.5%
Source: Key stage 4 revised attainment data
Achievement of EBacc English at grade 5 or above is 60.5% in 2017. Achievement of EBacc English at
grade 4 or above is 75.5%, which is similar to the percentage of pupils who achieved grades C or above
in EBacc English in 2016 (74.8%)
EBacc maths
To pass the maths element of the headline EBacc attainment measure, pupils must achieve a grade 5 or above in
maths GCSE or A*-C in approved AS levels
The percentage of pupils with entries to EBacc maths has remained stable in state-funded schools in
2017, with entries for 97.3% of pupils in state-funded schools. This stability and high entry rate is due to
the fact that it is compulsory for pupils to study maths at key stage 4 in state-funded schools, and the
vast majority of pupils enter maths qualifications that count in the performance tables.
Achievement of EBacc maths at grade 5 or above is 48.6% in 2017. Achievement of EBacc maths at
grade 4 or above is 69.2% which is similar to the percentage of pupils who achieved grades C or above
in EBacc maths in 2016 (68.6%)
Table 9: EBacc maths achievement England, state-funded schools, 2016-2017
Source: Key stage 4 revised attainment data
Year Achieving EBacc maths
2016 revised 68.6%
2017 revised
(grade 5 or above)
48.6%
2017 revised (grade
4 or above)
69.2%

19
EBacc science
It is compulsory for state-funded schools to teach science at key stage 4. For EBacc science, a pupil must enter:
– three individual sciences (three out of biology, chemistry, physics, and computer science);or
– core and additional science16; or
– double science
The proportion of pupils entering EBacc science increased to 91.3% in state-funded schools in 2017, an
increase of 4.5 percentage points compared to equivalent revised data in 2016. This is driven by a
continued increase in pupils entering the core and additional pathway, with 65.7% of the cohort entering
this combination in 2017, up from 62.3% in 2016. There has also been a smaller increase in pupils
entering the triple science pathway (25.1% in 2017, up from 23.9% in 2016).
As in 2016, the increase in pupils entering the core and additional pathway continues to be driven by a
movement away from science BTECs (which no longer count in performance tables in 2017) to core
and additional science by pupils with lower prior attainment.
In the figure below, where the darkest blue line for 2017 is higher than the equivalent line for 2016, this
means that a greater proportion of pupils in that prior attainment group entered the subject. The
increase is less noticeable from 2016 to 2017 compared to 2015 to 2016, however it does show
continued growth in entries by pupils with low prior attainment.
The lines decrease for the higher prior attainment end of the distribution, as pupils with higher prior
attainment are more likely to take individual sciences, rather than core and additional science or
BTECs.
Figure 10: Proportion of pupils in each prior attainment band who entered core science (EBacc), additional
science (EBacc) or core science BTEC (non-EBacc)
England, state-funded schools, 2015-2017
16 Core and additional science, together with further additional science, cover the same breadth of curriculum as biology, chemistry
and physics GCSEs

20
Source: Key stage 4 revised attainment data
Achievement of EBacc science is reported as a percentage of pupils who entered the subject. A pupil achieves EBacc science with:
– A* to C in at least two of biology, chemistry, physics and computer science, having entered at least three;
or
– A* to C in both core and additional science; or
– A*A* to CC in double science
The trend seen in 2016, of a decrease in EBacc Science attainment, continues into 2017, although on a
smaller scale, with 62.2% of those entering EBacc science achieving A*-C grades, compared to 63.8%
in 2016 (the decrease from 2015 to 2016 was wider, at 5.3 percentage points from 69.1% in 2015).
Due to changes in the point score scale from 2016 to 2017, comparisons of attainment for each prior
attainment band between these years are not valid. However, overall attainment is likely to continue to
be impacted by the increased number of pupils with low prior attainment entering EBacc science in
2017.
EBacc humanities
The EBacc humanities subjects are geography and history: pupils must achieve A*-C in one of these qualifications to
achieve the EBacc humanities pillar.
The proportion of pupils entering EBacc humanities continues to increase in 2017, to 76.8% in state-
funded schools in 2017, an increase of 3.1 percentage points compared to equivalent revised data in
2016. This continues to be driven by an increase in entries by pupils with low prior attainment for history
and geography, although on a smaller scale than in 2016, as shown in the charts below. The proportion
of pupils with lower prior attainment, who entered EBacc humanities qualifications, is higher in 2017
than 2015 and 2016. In history, the increase in entries from pupils with low prior attainment is slightly
counterbalanced by a small decrease in the high prior attainers taking this subject.
Figure 11: Proportion of pupils in each prior attainment band who entered history and
geography England, state-funded schools, 2015-2017
Source: Key stage 4 revised attainment data
Attainment has fallen slightly, to 62.9% in 2017, from 63.9% in the equivalent 2016 data. As in 2016,
this continues to be driven by the increase in entries by pupils with low prior attainment and could also
be effected by the decrease in entries by pupils with high prior attainment.
Entries into both geography and history in state-funded schools remains stable at 9.8% in 2017.

21
EBacc languages
To achieve the languages component of the EBacc, pupils must achieve A*-C in any language qualification on the
EBacc approved list.
Entries to EBacc languages decreased in 2017 to 47.4%, a fall of 1.6 percentage points from 49.0% in
equivalent 2016 data. The decrease occurred more for pupils with higher prior attainment, with a very
small increase for pupils with low prior attainment, as shown in Figure 12 below. This decrease in
entries for pupils with high prior attainment between 2016 and 2017, is greater than the drop between
2015 and 2016.
Figure 12: Proportion of pupils in each prior attainment band who entered EBacc languages
England, state-funded schools, 2015-2017
Source: Key stage 4 revised attainment data
The proportion of pupils entering more than one EBacc language qualification is stable, at 4.2% in 2017
and 4.4% in 2016. In 2017, 70.4% of those entering an EBacc language achieved a grade C or above
which is stable compared to 70.0% in 2016.
Art and design subjects
For the purposes of these figures, arts subjects include applied art and design, art and design, drama, media/film/TV, music, dance and performing arts. The figures include GCSEs, level 1/2 certificates, and AS levels.
The percentage of pupils entering at least one arts subject decreased in 2017, by 1.5 percentage points
compared to equivalent data in 2016 to 46.5% of pupils in state-funded schools.
Table 10: Percentage of pupils entered for at least one arts subject England, 2010-2017
2010
final 2011
final 2012
final 2013
final 2014
final 2015
final 2016
revised 2016
final
2017
revised
Pupils entered for at
least one arts subject 47.2% 45.8% 44.7% 44.8% 48.3% 49.6% 48.0% 48.0% 46.5%
Source: Key stage 4 attainment data
22
7. Attainment by pupil characteristics
Characteristics definitions
Please see the pupil characteristics section of the characteristics quality and methodology document for additional
information on characteristics definitions.
Information on attainment has been broken down by the following pupil characteristics: ethnicity, English
as an additional language (EAL), free school meal eligibility (FSM), disadvantage, and special
educational needs (SEN). These characteristics are broken down further by local authority in the tables
accompanying this SFR.
Figure 13 shows the pattern in Attainment 8 by different pupil characteristics. Further information on
attainment broken down by Indices of Deprivation Affecting Children (IDACI), degree of rurality, local
authority district, and parliamentary constituency, based on the postcode of pupil residence or school
location, can be found in the tables published alongside this release on gov.uk.
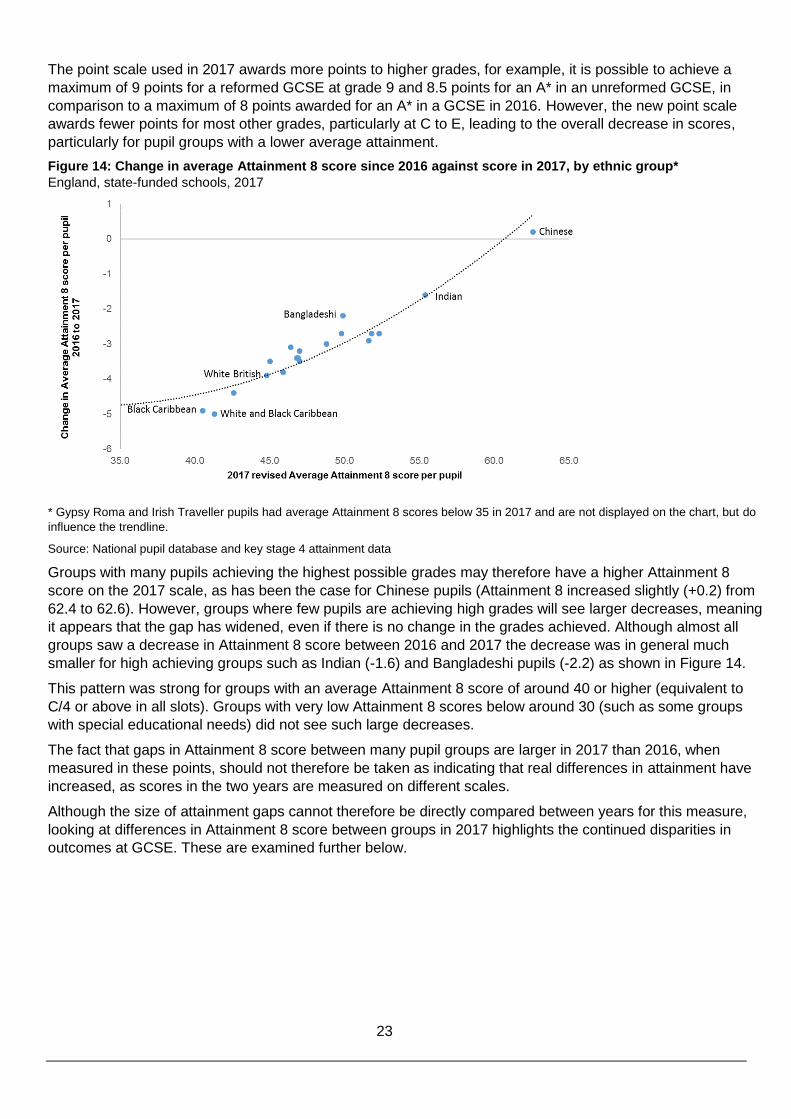
Figure 13: Average Attainment 8 score by pupil characteristics England, state-funded schools, 2017
Source: Key stage 4 revised attainment data
How have changes to Attainment 8 points affected scores for different pupil groups?
As explained in section 3, decreases in Attainment 8 score are expected following changes to the 2017 point
scores assigned to grades due to the introduction of 9 to 1 GCSEs in performance tables. The overall
difference in average Attainment 8 score per pupil between 2016 and 2017 was 3.6 points for pupils in state-
funded schools, which is stable in comparison to 2016 shadow data (as discussed in section 3). 2017 also saw
decreases to Attainment 8 scores across characteristic groups.
The general pattern of attainment gaps for this measure remains the same as in 2016. The gaps between
boys and girls, and by first language are relatively small, while the gap between the average Attainment 8
score per pupil for pupils with special educational needs and others is much larger (as shown in figure 13).
However, the actual gaps in Attainment 8 score awarded have widened slightly across most characteristic
groups compared to 2016. This is expected because the change in point scales has a different effect on pupils
with different levels of attainment, and therefore will not equally affect the average for pupil groups with a
different average attainment.
23
The point scale used in 2017 awards more points to higher grades, for example, it is possible to achieve a
maximum of 9 points for a reformed GCSE at grade 9 and 8.5 points for an A* in an unreformed GCSE, in
comparison to a maximum of 8 points awarded for an A* in a GCSE in 2016. However, the new point scale
awards fewer points for most other grades, particularly at C to E, leading to the overall decrease in scores,
particularly for pupil groups with a lower average attainment.
Figure 14: Change in average Attainment 8 score since 2016 against score in 2017, by ethnic group* England, state-funded schools, 2017
* Gypsy Roma and Irish Traveller pupils had average Attainment 8 scores below 35 in 2017 and are not displayed on the chart, but do
influence the trendline.
Source: National pupil database and key stage 4 attainment data
Groups with many pupils achieving the highest possible grades may therefore have a higher Attainment 8
score on the 2017 scale, as has been the case for Chinese pupils (Attainment 8 increased slightly (+0.2) from
62.4 to 62.6). However, groups where few pupils are achieving high grades will see larger decreases, meaning
it appears that the gap has widened, even if there is no change in the grades achieved. Although almost all
groups saw a decrease in Attainment 8 score between 2016 and 2017 the decrease was in general much
smaller for high achieving groups such as Indian (-1.6) and Bangladeshi pupils (-2.2) as shown in Figure 14.
This pattern was strong for groups with an average Attainment 8 score of around 40 or higher (equivalent to
C/4 or above in all slots). Groups with very low Attainment 8 scores below around 30 (such as some groups
with special educational needs) did not see such large decreases.
The fact that gaps in Attainment 8 score between many pupil groups are larger in 2017 than 2016, when
measured in these points, should not therefore be taken as indicating that real differences in attainment have
increased, as scores in the two years are measured on different scales.
Although the size of attainment gaps cannot therefore be directly compared between years for this measure,
looking at differences in Attainment 8 score between groups in 2017 highlights the continued disparities in
outcomes at GCSE. These are examined further below.

24
Disadvantage: Gap Index
Official Statistic The gap index has moved out of experimental statistics status (as reported in SFR 01/2016) and into official statistics
status. ‘Calculating the index’ summarises how the measure is produced; and more details of the methodology and
consultation were published in SFR 40/2014.
Disadvantage Pupils are defined as disadvantaged if they are known to have been eligible for free school meals in the past six
years (from year 6 to year 11), if they are recorded as having been looked after for at least one day or if they are
recorded as having been adopted from care.
In 2017, 27.2% of pupils at the end of key stage 4 were disadvantaged, 0.5 percentage points lower than 2016
(27.7%).
Attainment is lower for disadvantaged pupils compared to all other pupils across all headline measures
in 2017, as seen in previous years. Due to the new headline measures introduced in 2016, and changes
to comparability as a result of reformed GCSEs and point scales in 2017, it is recommended that the
gap index is used to look at the difference in attainment between disadvantaged and other pupils over
time.
Calculating the Index Pupils are ordered by average grade in English and maths GCSEs.
The average rank of disadvantaged pupils was 0.37, meaning the average pupil was just over a third of the way up
the distribution, while that of other pupils was 0.55, more than halfway up the distribution (see Figure 16).
The disadvantaged pupils’ attainment gap index multiplies the difference between these by 20:
(0.54979-0.36676) x 20 = 3.66
The gap is measured on a scale of 0 to 10 (or minus 10 if disadvantaged pupils achieved higher)
The gap between disadvantaged pupils and others, measured using the gap index, decreased in five of
the last six years, narrowing by 10.0% overall since 2011 and 3.2% in the latest year. The average
position of disadvantaged pupils in the distribution compared to others is closer together than it was last
year.
Figure 15: Trend in the disadvantaged pupils’ attainment gap index England, state-funded schools, 2011-2017
Source: National pupil database and key stage 4 attainment data
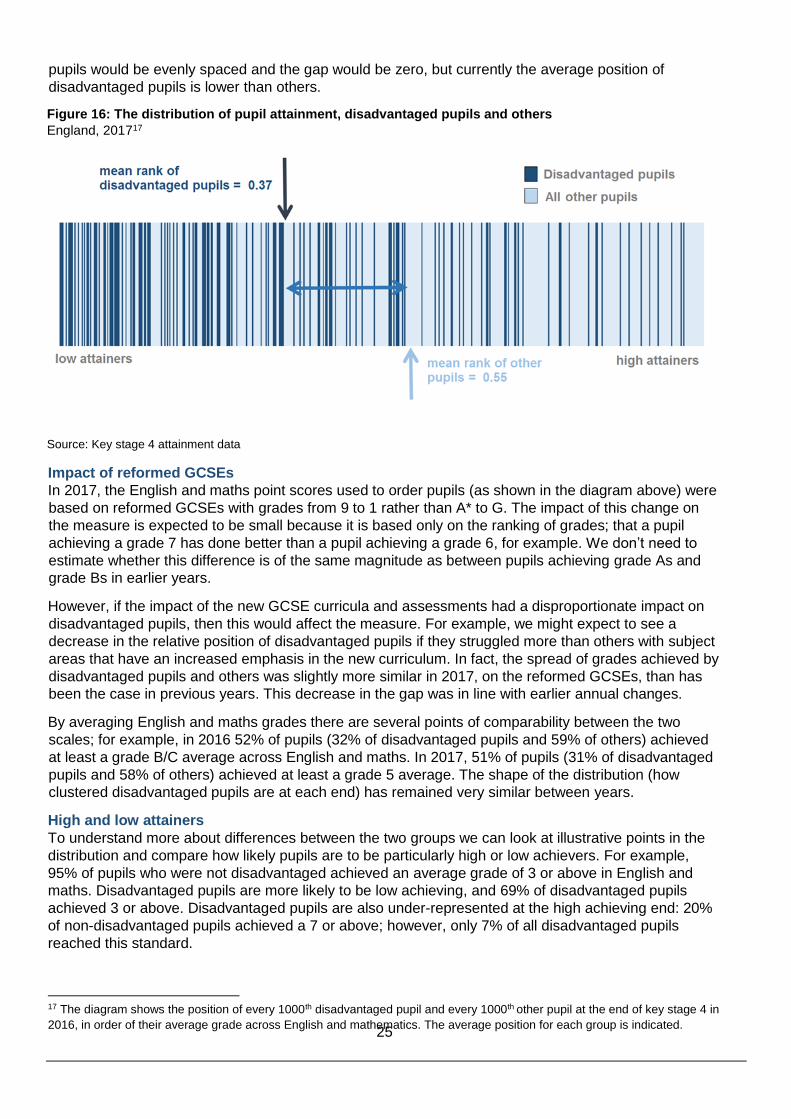
Figure 16 shows the distribution of pupils’ results in English and maths GCSEs in 2017, from lowest
attainment on the left to the highest attainment on the right. Dark blue lines represent disadvantaged
pupils, while light blue lines represent others. Although there were some disadvantaged pupils among
the highest attainers, they were more likely to be clustered at the lower attaining end. The gap index
measures the distance between the average position of disadvantaged and other pupils in the
distribution (shown by arrows); if disadvantage were not associated with differences in attainment,
25
pupils would be evenly spaced and the gap would be zero, but currently the average position of
disadvantaged pupils is lower than others.
Figure 16: The distribution of pupil attainment, disadvantaged pupils and others
England, 201717
Source: Key stage 4 attainment data
Impact of reformed GCSEs
In 2017, the English and maths point scores used to order pupils (as shown in the diagram above) were
based on reformed GCSEs with grades from 9 to 1 rather than A* to G. The impact of this change on
the measure is expected to be small because it is based only on the ranking of grades; that a pupil
achieving a grade 7 has done better than a pupil achieving a grade 6, for example. We don’t need to
estimate whether this difference is of the same magnitude as between pupils achieving grade As and
grade Bs in earlier years.
However, if the impact of the new GCSE curricula and assessments had a disproportionate impact on
disadvantaged pupils, then this would affect the measure. For example, we might expect to see a
decrease in the relative position of disadvantaged pupils if they struggled more than others with subject
areas that have an increased emphasis in the new curriculum. In fact, the spread of grades achieved by
disadvantaged pupils and others was slightly more similar in 2017, on the reformed GCSEs, than has
been the case in previous years. This decrease in the gap was in line with earlier annual changes.
By averaging English and maths grades there are several points of comparability between the two
scales; for example, in 2016 52% of pupils (32% of disadvantaged pupils and 59% of others) achieved
at least a grade B/C average across English and maths. In 2017, 51% of pupils (31% of disadvantaged
pupils and 58% of others) achieved at least a grade 5 average. The shape of the distribution (how
clustered disadvantaged pupils are at each end) has remained very similar between years.
High and low attainers
To understand more about differences between the two groups we can look at illustrative points in the
distribution and compare how likely pupils are to be particularly high or low achievers. For example,
95% of pupils who were not disadvantaged achieved an average grade of 3 or above in English and
maths. Disadvantaged pupils are more likely to be low achieving, and 69% of disadvantaged pupils
achieved 3 or above. Disadvantaged pupils are also under-represented at the high achieving end: 20%
of non-disadvantaged pupils achieved a 7 or above; however, only 7% of all disadvantaged pupils
reached this standard.
17 The diagram shows the position of every 1000th disadvantaged pupil and every 1000th other pupil at the end of key stage 4 in
2016, in order of their average grade across English and mathematics. The average position for each group is indicated.
26
Further breakdowns of average English and maths grades by disadvantaged and all other pupils can be
found in table CH4b of the accompanying data tables.
Disadvantage: headline measures
This section is included for transparency, however it is recommended that the gap index (see page 23)
is used in preference to comparing raw attainment scores for disadvantaged and other pupils to analyse
the difference in attainment. The gap index is more resilient to changes to assessment and therefore
offers greater comparability between years.
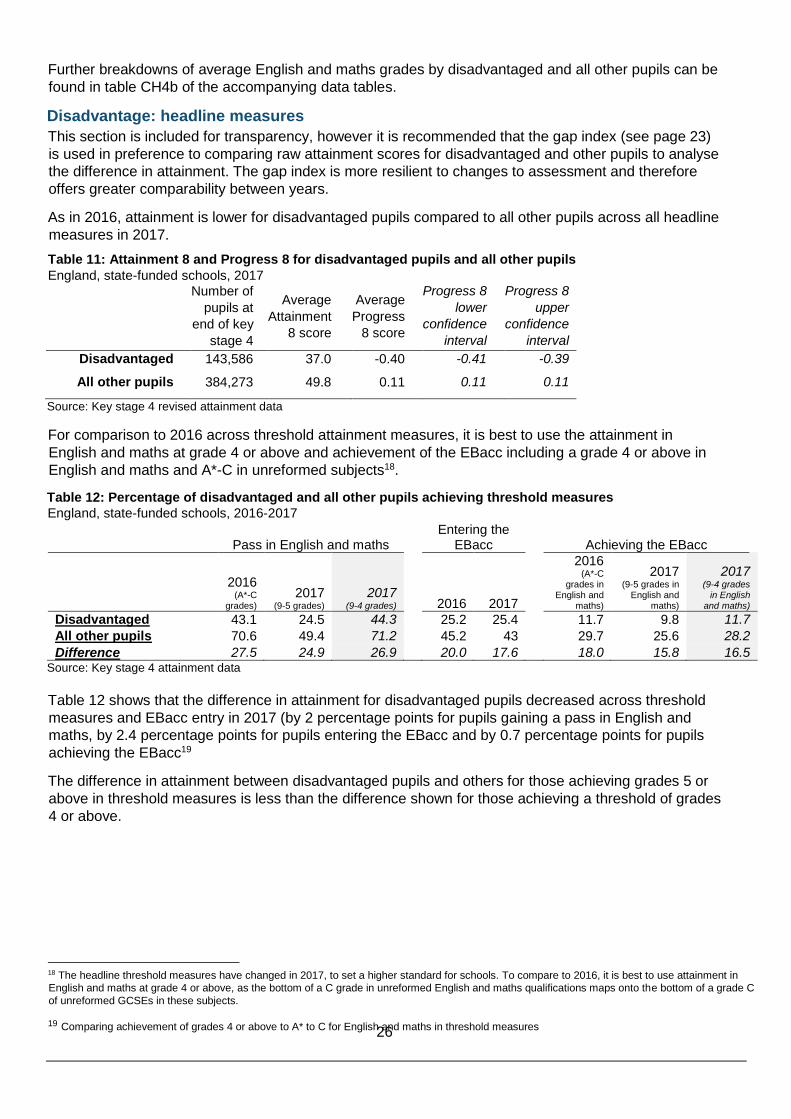
As in 2016, attainment is lower for disadvantaged pupils compared to all other pupils across all headline
measures in 2017.
Table 11: Attainment 8 and Progress 8 for disadvantaged pupils and all other pupils
England, state-funded schools, 2017
Number of
pupils at
end of key
stage 4
Average Attainment
8 score
Average Progress
8 score
Progress 8
lower
confidence
interval
Progress 8
upper
confidence
interval
Disadvantaged 143,586 37.0 -0.40 -0.41 -0.39
All other pupils 384,273 49.8 0.11 0.11 0.11
Source: Key stage 4 revised attainment data
For comparison to 2016 across threshold attainment measures, it is best to use the attainment in
English and maths at grade 4 or above and achievement of the EBacc including a grade 4 or above in
English and maths and A*-C in unreformed subjects18.
Table 12: Percentage of disadvantaged and all other pupils achieving threshold measures
England, state-funded schools, 2016-2017
Pass in English and maths
Entering the EBacc Achieving the EBacc
2016
(A*-C grades)
2017 (9-5 grades)
2017 (9-4 grades) 2016 2017
2016 (A*-C
grades in English and
maths)
2017 (9-5 grades in
English and maths)
2017 (9-4 grades
in English and maths)
Disadvantaged 43.1 24.5 44.3 25.2 25.4 11.7 9.8 11.7
All other pupils 70.6 49.4 71.2 45.2 43 29.7 25.6 28.2
Difference 27.5 24.9 26.9 20.0 17.6 18.0 15.8 16.5 Source: Key stage 4 attainment data
Table 12 shows that the difference in attainment for disadvantaged pupils decreased across threshold
measures and EBacc entry in 2017 (by 2 percentage points for pupils gaining a pass in English and
maths, by 2.4 percentage points for pupils entering the EBacc and by 0.7 percentage points for pupils
achieving the EBacc19
The difference in attainment between disadvantaged pupils and others for those achieving grades 5 or
above in threshold measures is less than the difference shown for those achieving a threshold of grades
4 or above.
18 The headline threshold measures have changed in 2017, to set a higher standard for schools. To compare to 2016, it is best to use attainment in
English and maths at grade 4 or above, as the bottom of a C grade in unreformed English and maths qualifications maps onto the bottom of a grade C
of unreformed GCSEs in these subjects.
19 Comparing achievement of grades 4 or above to A* to C for English and maths in threshold measures
27
Free school meals
Where a pupil's family have claimed eligibility for free school meals in the School Census, they are defined as
eligible for free school meals (FSM). Parents are able to claim free schools meals if they receive a qualifying
benefit20.
Free school meals does not relate to pupils who actually received free school meals but those who are eligible to
receive free school meals. In 2017, 13.1% of pupils at the end of key stage 4 were eligible for free school meals,
compared to 13.4% in 2016.
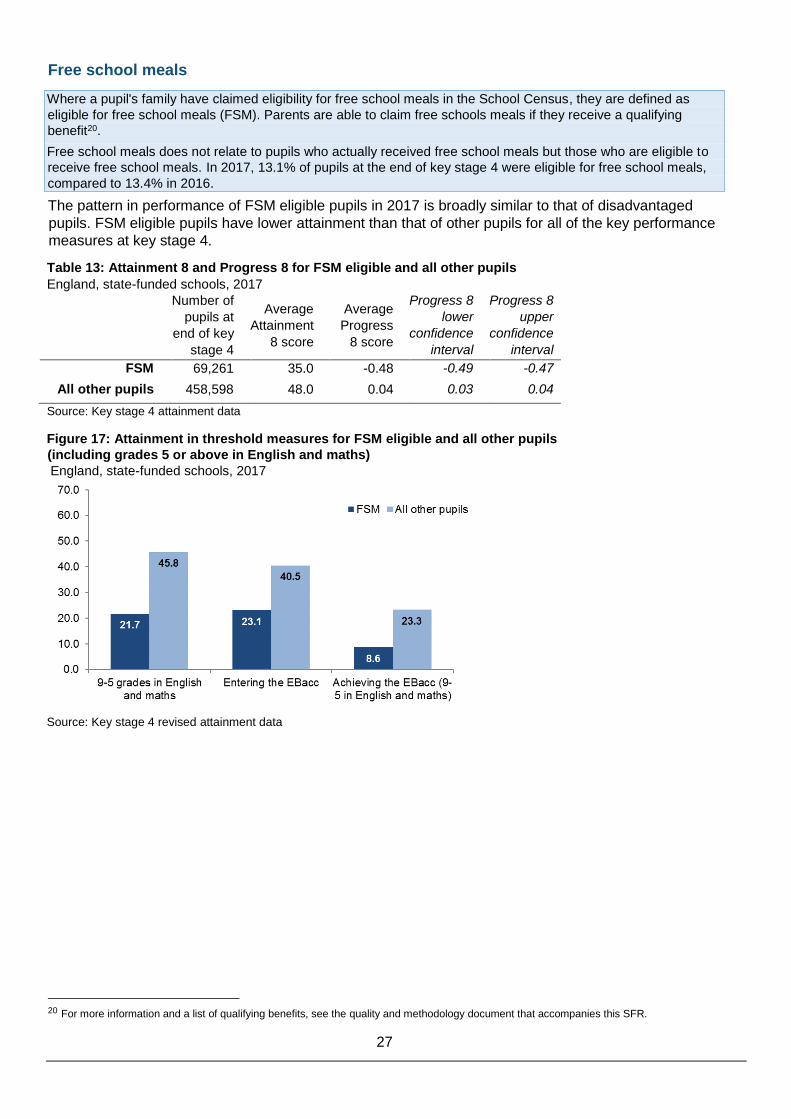
The pattern in performance of FSM eligible pupils in 2017 is broadly similar to that of disadvantaged
pupils. FSM eligible pupils have lower attainment than that of other pupils for all of the key performance
measures at key stage 4.
Table 13: Attainment 8 and Progress 8 for FSM eligible and all other pupils England, state-funded schools, 2017
Number of
pupils at
end of key
stage 4
Average Attainment
8 score
Average Progress
8 score
Progress 8
lower
confidence
interval
Progress 8
upper
confidence
interval
FSM 69,261 35.0 -0.48 -0.49 -0.47
All other pupils 458,598 48.0 0.04 0.03 0.04
Source: Key stage 4 attainment data
Figure 17: Attainment in threshold measures for FSM eligible and all other pupils
(including grades 5 or above in English and maths)
England, state-funded schools, 2017
Source: Key stage 4 revised attainment data
20 For more information and a list of qualifying benefits, see the quality and methodology document that accompanies this SFR.

28
Figure 18: Attainment in threshold measures for FSM eligible and all other pupils
(including grades 4 or above in English and maths)
England, state-funded schools, 2016-2017
Figure 18 shows that the difference in attainment for FSM eligible and all other pupils increased across
threshold measures and EBacc entry in 2017 (by 0.5 percentage points for pupils gaining a pass in
English and maths by 2.0 percentage points for pupils entering the EBacc and by 1.2 percentage points
for pupils achieving the EBacc21. The difference in attainment for those achieving grades 5 or above in
threshold measures is less than the difference shown for those achieving a threshold of grades 4 or
above.
English as a first language
“First Language” is the language to which a child was initially exposed during early development and continues to be exposed to in the home or in the community. It does not mean that pupils are necessarily fluent in a language other than English or cannot speak English.
15.9% of pupils at the end of key stage 422 had a first language other than English in 2017. This is 0.8 percentage
points higher than 2016 (15.1%)
As in 2016, the average Attainment 8 score of those with English as an additional language is broadly
similar to those with English as a first language, but their average Progress 8 score is higher, as shown
in table 14.
Table 14: Attainment 8 and Progress 8 by first language England, state-funded schools, 2017
Number of
pupils at end
of key stage
4
Average Attainment
8 score
Average Progress
8 score
Progress 8
lower
confidence
interval
Progress 8
upper
confidence
interval
English 442,222 46.3 -0.11 -0.11 -0.11
Other than English 83,905 46.8 0.50 0.49 0.51
Source: Key stage 4 revised attainment data
21 Comparing achievement of grades 4 or above to A* to C for English and maths in threshold measures 22 Excluding pupils whose first language is unclassified

29
Figure 19: Attainment in threshold measures by first language
(including grades 5 or above in English and maths)
England, state-funded schools, 2017
Source: Key stage 4 revised attainment data
Figure 20: Attainment in threshold measures by first language
(including grades 4 or above in English and maths)
England, state-funded schools, 2016-2017
Source: Key stage 4 attainment data
As in 2016, achievement of pupils with English as an additional language is lower than pupils with
English as a first language for the pass in English and maths measure, however this is no longer driven
by lower attainment in English as in 2016 (the difference has decreased by 3.4 percentage points from
4.5 to 1.1 percentage points difference). The attainment difference between the two groups in English
and maths is now broadly similar (at 1.1 points and 1.5 points respectively). Entry and achievement of
the EBacc, however, remains higher for pupils with English as an additional language, as shown in
Figure 20.
Analysis shows that for pupils who entered four out of five of the EBacc pillars, the language pillar was
the most likely not to be entered. Figure 21 shows that pupils with English as an additional language
have much higher rates of entry and achievement in the language component of the EBacc, compared
to pupils whose first language is English. They have a slightly lower entry rate to the science and
humanities pillars. Higher entry and achievement rates in the language pillar for pupils with English as
an additional language contributes to their higher overall rates of EBacc entry and achievement.

30
Figure 21: Percentage of pupils entering and achieving the EBacc pillars by first language
England, state-funded schools, 2017
*’achievement’ in these elements classed as grades 4 or above as this is most comparable with 2016.
**as a percentage of those entering Source: Key stage 4 attainment data
Special Educational Needs (SEN)
The SEN variable indicates whether a pupil has learning difficulties or disabilities that make it harder for them to
learn than most children of the same age. Pupils with special educational needs include those with SEN support,
with statements of SEN or an education, health and care (EHC) plan. More information on these is given in the
quality and methodology document.
14.1% of pupils at the end of key stage 4 had a special educational need in 2017, 0.5 percentage points lower than
2016 (14.6%).
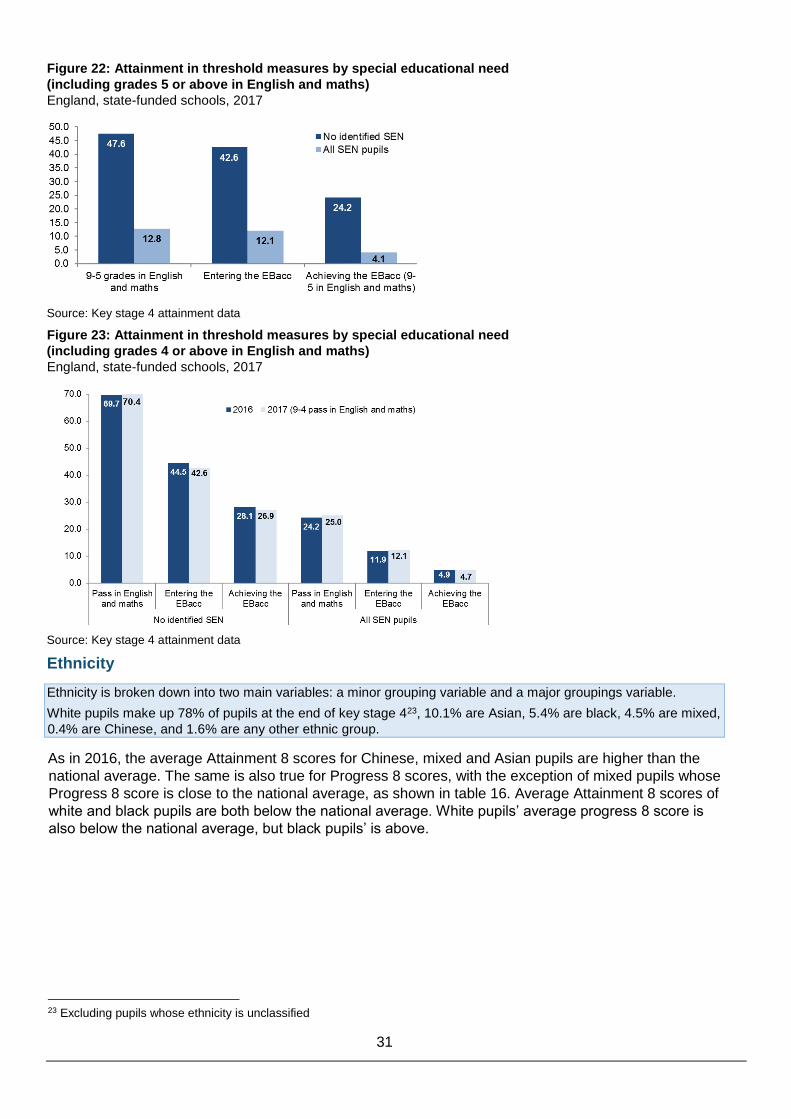
The attainment gap between pupils with SEN compared to pupils with no identified SEN remains the
largest gap of all characteristics groups: pupils with SEN perform significantly worse than pupils with no
identified SEN across all headline measures of attainment, as shown in Table 15, Figure 22 and 23.
The average Attainment 8 score per pupil with SEN was 27.1, compared to 49.5 for pupils with no
identified SEN.
Pupils with a statement of SEN or EHC plan had lower attainment and progress scores than those with
SEN support, with average Attainment 8 scores of 13.9 and 31.9 respectively, and average Progress 8
scores of -1.04 (+/-0.02) and -0.43 (+/-0.01) respectively.
Table 15: Attainment 8 and Progress 8 by special educational need England, state-funded schools, 2017
Number of
pupils at end
of key stage
4
Average Attainment
8 score
Average Progress
8 score
Progress 8
lower
confidence
interval
Progress 8
upper
confidence
interval
No identified SEN 452,215 49.5 0.07 0.06 0.07
All SEN pupils 74,420 27.1 -0.59 -0.60 -0.58
Source: Key stage 4 revised attainment data
31
Figure 22: Attainment in threshold measures by special educational need
(including grades 5 or above in English and maths)
England, state-funded schools, 2017
Source: Key stage 4 attainment data
Figure 23: Attainment in threshold measures by special educational need
(including grades 4 or above in English and maths)
England, state-funded schools, 2017
Source: Key stage 4 attainment data
Ethnicity
Ethnicity is broken down into two main variables: a minor grouping variable and a major groupings variable.
White pupils make up 78% of pupils at the end of key stage 423, 10.1% are Asian, 5.4% are black, 4.5% are mixed,
0.4% are Chinese, and 1.6% are any other ethnic group.
As in 2016, the average Attainment 8 scores for Chinese, mixed and Asian pupils are higher than the
national average. The same is also true for Progress 8 scores, with the exception of mixed pupils whose
Progress 8 score is close to the national average, as shown in table 16. Average Attainment 8 scores of
white and black pupils are both below the national average. White pupils’ average progress 8 score is
also below the national average, but black pupils’ is above.
23 Excluding pupils whose ethnicity is unclassified

32
Table 16: Attainment 8 and Progress 8 by major ethnic group England, state-funded schools, 2017
Number of
pupils at end
of key stage
4
Average Attainment
8 score
Average Progress
8 score
Progress 8
lower
confidence
interval
Progress 8
upper
confidence
interval
Chinese 2,073 62.6 0.93 0.87 0.99
Asian 52,787 49.8 0.47 0.46 0.48
Mixed 23,483 47.0 -0.02 -0.04 0.00
White 406,342 45.9 -0.11 -0.12 -0.11
Black 27,922 44.8 0.16 0.15 0.18
All pupils 527,859 46.3 -0.03 -0.03 -0.03 Source: Key stage 4 attainment data
The pattern in attainment for threshold measures remains broadly similar to 2016: attainment of
Chinese and Asian pupils continue to be above the national average for a pass in English and maths,
and entry and achievement of the EBacc. Attainment of pupils within the mixed ethnic group also
remained above the national average for EBacc entry and achievement, and these pupils were
slightly below the national average for grades 4 or above in English and maths in 2017. However,
mixed pupils were also slightly above the national average for grades 5 or above in English and
maths in 2017.
Attainment of white and black pupils remains below the national average for a pass in English and
maths and EBacc achievement, as shown in figure 24 and figure 25. White pupils are also below the
average for EBacc entry, but black pupils are above by 4.8 percentage points in 2017 in comparison
to 3.3 percentage points in 2016.. However, this increase is driven by a decrease in EBacc entry
nationally, rather than an increase in the number of black pupils entering the EBacc.
Figure 24: Attainment in threshold measures by major ethnic group
(including grades 5 or above in English and maths)
England, state-funded schools, 2017

33
Figure 25: Attainment in threshold measures by major ethnic group
(including grades 4 or above in English and maths)
England, state-funded schools, 2017
Source: Key stage 4 attainment data
Pupil attainment by ethnicity is more varied when figures are broken down further by ethnic group, FSM
eligibility and gender.
White pupils eligible for FSM are the lowest attaining major ethnic group in all main indicators of
attainment at the end of key stage 4 in 2017, including an average Attainment 8 score 14.0 points below
the national average. The gap increases to 17.1 points when only white British FSM boys are
considered. Figure 26 shows average Attainment 8 scores by minor ethnic group, FSM eligibility and
gender for selected groups.
Figure 26: Average Attainment 8 score for FSM eligible pupils from selected minor ethnic groups, by
gender
England, state-funded schools, 2017
Source: Key stage 4 attainment data

34
Gender
As in previous years, girls continue to do better than boys in all headline measures.
Table 17: Attainment 8 and Progress 8 by gender England, state-funded schools, 2017
Average Attainment
8 score
Average Progress
8 score
Progress 8
lower
confidence
interval
Progress 8
upper
confidence
interval
Boys 43.7 -0.24 -0.24 -0.23
Girls 49.0 0.18 0.18 0.19
Source: Key stage 4 revised attainment data
Figure 27: Performance in threshold measures by gender England, state-funded schools, 2017
Source: Key stage 4 revised attainment data

35
8. Floor standards
The 2017 floor standard is the same as in 2016. A school is below the floor if:
1. its Progress 8 score is below -0.5; and
2. the upper band of the 95% confidence interval is below zero
Schools are also excluded from the floor standards where:
• there are fewer than six pupils in the year 11 cohort, or included in the Progress 8 measure; or
• fewer than 50% of pupils have key stage 2 assessments that can be used as prior attainment in the
calculation of Progress 8
365 schools are below the 2017 secondary floor standard. This is 12% of state-funded mainstream
schools included in the calculation. In 2016, 9.3% of schools were below the floor standard.
Closed schools, including those which closed during the 2016/17 academic year and re-opened as a
different type of school (for example, a sponsored academy) are excluded from the floor standards.
There were 89 closed schools in 2017 that would otherwise have been included in the floor standard,
and 39 of these would have been below the floor.
The breakdown of schools below the floor by region is shown in figure 28 below. There is considerable
variation in the percentage of schools below the floor standard in different regions. London has the
lowest proportion of schools below the floor, with 6.9%, and North East the highest, with 20.9%.
Figure 28: Percentage of schools below the floor by region England, state-funded schools assessed against the floor standard, 2017
Source: Key stage 4 attainment data
A number of factors have contributed to the increase in the number of schools below the floor standard.
Changes to the point scores allocated to grades in unreformed GCSEs to reflect the introduction of new
GCSEs graded 9 to 1 in English and maths is the main reason for the increase. The changes mean the range
of possible Attainment 8 scores has increased and there is more spread in Progress 8 scores.
Changes in the way prior attainment is calculated is also a factor. Key stage 2 fine level was previously an
average of reading, writing and maths test results. The key stage 2 writing test was abolished in 2012 and so
prior attainment for these pupils (who reached the end of key stage 4 in 2017) is now based on reading and
maths test outcomes only. This has resulted in more pupils allocated to higher prior attainment groups,
increasing the variation in Progress 8 scores for these groups.
Finally, a small number of schools fall below the threshold because their pupils sat GCSEs or certificates in
English or maths that no longer count towards the measures.

36
9. Coasting schools
The Education and Adoption Act 2016 (the Act) allowed the Secretary of State to identify and support coasting
schools for the first time. The Department consulted on a coasting definition in autumn 2015 and the Act received
Royal Assent in March 2016. On 20 October 2016, the Secretary of State laid draft regulations in Parliament
setting out the Department’s proposed definition of a coasting school . These were formally approved by
Parliament in December 2016 and came into force on 11 January 2017. This is the second year that the coasting
definition has been published.
A school will fall within the coasting definition if data shows that over time, it has not supported its pupils to fulfil
their potential. A secondary school will meet the coasting definition if:
1. In 2015, fewer than 60% of pupils achieved 5+ A* to C grades including English and maths, and the
school has less than the national median percentage of pupils who achieved expected progress in English and in
mathematics24; and
2. In 2016 and 2017, the school has a Progress 8 score below -0.25 and the upper band of the 95%
confidence interval is below zero
Schools will be excluded from the coasting definition if one of the following applies in at least one of the three
years:
• the number of eligible pupils is fewer than 11 in 2015, or fewer than 6 in 2016 and 2017;
• the school does not have published results against all relevant performance measures;
• fewer than 50% of pupils have tests or assessments that can be used as prior attainment in the calculations of
progress measures; or
• the school closed within the academic year and did not re-open as a converter academy
271 schools met the coasting definition in the 2017 revised data. This is 9.6% of state-funded
mainstream schools included in the calculation. This number has decreased since 2016, where 319
schools (11.3%) met the coasting definition.
• 9 schools which previously met the definition based on provisional results no longer meet the
definition on revised results (including two closed schools25)
• 5 schools previously not meeting the coasting definition on provisional results now fall within the
definition based on revised data
As with the floor standard, more schools were identified under coasting criteria based on 2017
performance than in 2016, due to changes in the distribution of Progress 8 scores. However, to be
considered coasting, schools have to meet the definition in three consecutive years. Of the schools
identified in both 2015 and 2016, fewer met the definition for a third year in 2017 (and so are considered
coasting this year) than had met the 2014 definition, which formed part of the assessment last year.
169 of the 271 schools meeting the coasting definition in 2017 were also below the floor standard. The
breakdown of schools meeting the coasting definition by region is shown in figure 29 below. There is
considerable variation in the percentage of schools meeting the coasting definition in different regions.
London has the lowest proportion of schools meeting the definition, with 3.7%, and the North East the
highest, with 16.9%.
24 Schools that chose to opt in to Progress 8 early must also have a 2015 Progress 8 score below -0.25 to meet the coasting definition 25 Both schools closed after 12th September 2016

37
Figure 29: Percentage of schools meeting the coasting definition by region
England, eligible state-funded schools, 2017
Source: Key stage 4 revised attainment data
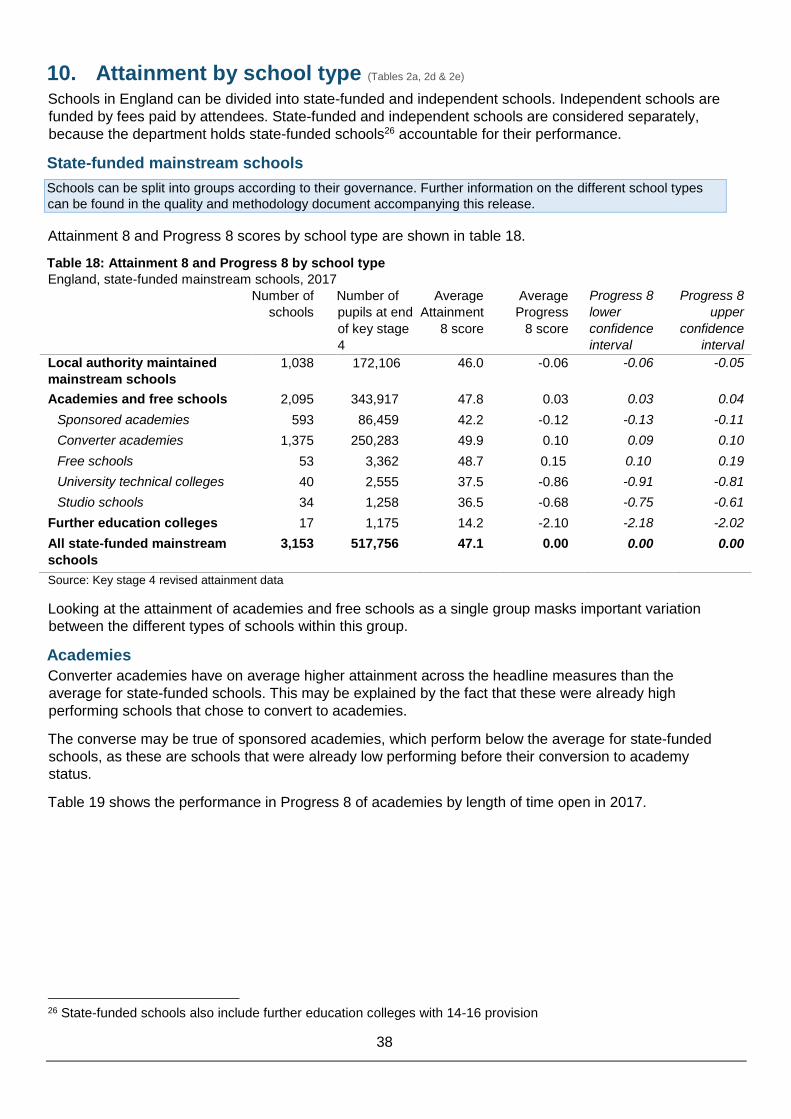
38
10. Attainment by school type (Tables 2a, 2d & 2e) Schools in England can be divided into state-funded and independent schools. Independent schools are
funded by fees paid by attendees. State-funded and independent schools are considered separately,
because the department holds state-funded schools26 accountable for their performance.
State-funded mainstream schools
Schools can be split into groups according to their governance. Further information on the different school types
can be found in the quality and methodology document accompanying this release.
Attainment 8 and Progress 8 scores by school type are shown in table 18.
Table 18: Attainment 8 and Progress 8 by school type England, state-funded mainstream schools, 2017
Number of
schools Number of
pupils at end
of key stage
4
Average Attainment
8 score
Average Progress
8 score
Progress 8
lower
confidence
interval
Progress 8
upper
confidence
interval
Local authority maintained
mainstream schools 1,038 172,106 46.0 -0.06 -0.06 -0.05
Academies and free schools 2,095 343,917 47.8 0.03 0.03 0.04
Sponsored academies 593 86,459 42.2 -0.12 -0.13 -0.11
Converter academies 1,375 250,283 49.9 0.10 0.09 0.10
Free schools 53 3,362 48.7 0.15 0.10 0.19
University technical colleges 40 2,555 37.5 -0.86 -0.91 -0.81
Studio schools 34 1,258 36.5 -0.68 -0.75 -0.61
Further education colleges 17 1,175 14.2 -2.10 -2.18 -2.02
All state-funded mainstream
schools 3,153 517,756 47.1 0.00 0.00 0.00
Source: Key stage 4 revised attainment data
Looking at the attainment of academies and free schools as a single group masks important variation
between the different types of schools within this group.
Academies
Converter academies have on average higher attainment across the headline measures than the
average for state-funded schools. This may be explained by the fact that these were already high
performing schools that chose to convert to academies.
The converse may be true of sponsored academies, which perform below the average for state-funded
schools, as these are schools that were already low performing before their conversion to academy
status.
Table 19 shows the performance in Progress 8 of academies by length of time open in 2017.
26 State-funded schools also include further education colleges with 14-16 provision

39
Table 19: Progress 8 scores in academies and LA maintained schools by length of time open
England, 2017
Number of
schools with
results
Average Progress
8 score
Progress 8
lower
confidence
interval
Progress 8
upper
confidence
interval
Sponsored academies
Open for 1 academic year
41
-0.25
-0.28
-0.22
Open for 2 academic years 56 -0.30 -0.33 -0.27
Open for 3 academic years 58 -0.11 -0.14 -0.09
Open for 4 academic years 78 -0.10 -0.13 -0.08
Open for 5 academic years 60 -0.15 -0.18 -0.12
Open for 6 academic years 47 -0.20 -0.23 -0.17
Open for 7 or more academic years
253
-0.05
-0.07
-0.04
All sponsored academies
593
-0.12
-0.13
-0.11
Converter academies
Open for 1 academic year
57
0.06
0.03
0.08
Open for 2 academic years 47 0.01 -0.01 0.04
Open for 3 academic years 67 0.05 0.03 0.07
Open for 4 academic years 155 0.04 0.03 0.06
Open for 5 academic years 371 0.05 0.05 0.06
Open for 6 academic years 651 0.14 0.13 0.15
Open for 7 or more academic years
27
0.28
0.24
0.31
All converter academies
1,375
0.10
0.09
0.10
All local authority maintained schools 1,038 -0.06 -0.06 -0.05
Source: key stage 4 revised attainment data
Free schools, UTCs and studio schools
The numbers of free schools, UTCs and studio schools with year 11 pupils are too small to allow robust
conclusions to be drawn about their performance at the end of key stage 427, or compare between
years.
Pupils typically start UTCs and studio schools at the start of key stage 4 (year 10) rather than at the end
of key stage 2 as is the case for most secondary schools. At the end of key stage 4, pupils will have
typically attended in these schools for two out of the five years since the end of key stage 2. Progress 8
measures a pupil’s academic progress during key stages 3 and 4. This should be taken into account
when comparing their results with those for schools that start educating their pupils from the beginning
of key stage 3.
Further education colleges
Since September 2013, general further education colleges and sixth-form colleges have been able to
directly enrol 14- to 16-year-olds. The number of FE colleges offering 14-16 provision with year 11
pupils is too small to allow robust conclusions to be drawn about their performance28.
Pupils typically start further education colleges with 14-16 provision at the start of key stage 4 (year 10)
rather than at the end of key stage 2 as is the case for most secondary schools. At the end of key stage
4, pupils will have typically attended in these schools for two out of the five years since the end of key
27 There are 54 free schools, 40 university technical colleges (UTCs) and 34 studio schools with results in 2017 28 There are 18 further education colleges with 14-16 provision with results in 2017

40
stage 2. Progress 8 measures a pupil’s academic progress during key stages 3 and 4. This should be
taken into account when comparing their results with those for schools that start educating their pupils
from the beginning of key stage 3.
Change in performance by school type over time in academies
For information on the issues associated with comparing academy performance over time, please see
the quality and methodology document. In order to compare performance of academies over time, the
measures selected to compare them need to be comparable. Therefore in 2017 we have used: the
percentage of pupils achieving a grade 4 (2017) or C (2016) or above in English and maths, the
percentage of pupils entering the EBacc and the percentage of pupils achieving the EBacc with a grade
4 or C or above in each of the subject areas counted in the EBacc.
Table 20 shows increases in attainment of grade C (2016) or 4 (2017) and above in English
and maths in both sponsored academies and converter academies between 2016 and 2017,
with a rise of 0.9 percentage points for sponsored academies (to 53.9%) and a rise of 0.8
percentage points for converter academies (to 70.6%). Over the same period, attainment in
local authority maintained mainstream schools increased from 62.4% to 63.2% (an increase
of 0.8 percentage points).
Table 20: Percentage of pupils achieving grade 4 or C or above in English and maths in
academies and local authority maintained schools by length of time open
England, 2016-2017
Number of schools with
results
% achieving grade 4/C or above in English and
Maths
2015/16 2016/17
Sponsored academies
Open for one academic year 41 50.7 51.4
Open for two academic years 56 53.5 54.6
Open for three academic years 58 52.6 54.5
Open for four academic years 78 49.3 53.7
Open for five academic years 60 50.6 49.7
Open for six academic years 47 52.5 51.5
Open for seven or more academic years 253 54.8 55.3
All sponsored academies 593 53.0 53.9
Converter academies
Open for one academic year 57 63.6 64.7
Open for two academic years 47 65.5 66.3
Open for three academic years 67 66.1 66.5
Open for four academic years 155 64.0 65.9
Open for five academic years 371 68.0 68.8
Open for six academic years 651 72.9 73.6
Open for seven or more academic years 27 77.3 77.2
All converter academies 1,375 69.8 70.6
All local authority maintained schools 1,038 62.4 63.2
Source: Key stage 4 revised attainment data

41
1. Includes academies and LA maintained schools that were open before 12 September 2016.
2. Includes entries and achievements by these pupils in previous academic years.
3. For this table one academic year is between 12 September 2015 and 11 September 2016.
4. The ‘All sponsored academies’ and ‘All converter academies’ figures include data for all schools which were academies on 12
September 2015 irrespective of their type in previous years.
5. Figures for 'Number of schools' are based on those with results in 2016/17.
6. Shaded cells contain information for the predecessor school for sponsored academies and for the school prior to conversion for
converter academies.
Table 21 shows that entry into the EBacc has decreased in sponsored academies, converter academies
and local authority maintained schools. For sponsored academies, EBacc entry has decreased by 0.3
percentage points to 29.8% between 2016 and 2017, with some variation in this trend by length of time
opened. Over the same time period, EBacc entry decreased by 1.8 percentage points in converter
academies to 44.0% with only converter academies that have been open for 7 or more academic years
showing an increase. In local authority maintained schools, EBacc entry decreased by 2 percentage
points between 2016 and 2017.
Table 21: Percentage of pupils entering the EBacc in academies and local authority maintained
schools by length of time open
England, 2016-2017
Number of schools with
results
% entered for all components of the
English Baccalaureate
2015/16 2016/17
Sponsored academies
Open for one academic year 41 28.0 26.9
Open for two academic years 56 28.8 27.3
Open for three academic years 58 27.9 29.9
Open for four academic years 78 27.4 27.2
Open for five academic years 60 25.0 26.4
Open for six academic years 47 32.7 30.5
Open for seven or more academic years 253 32.3 31.9
All sponsored academies 593 30.1 29.8
Converter academies Open for one academic year 57 39.1 38.4
Open for two academic years 47 39.8 39.9
Open for three academic years 67 41.3 41.0
Open for four academic years 155 43.4 42.0
Open for five academic years 371 41.6 38.9
Open for six academic years 651 49.9 47.8
Open for seven or more academic years 27 51.2 52.5
All converter academies 1,375 45.8 44.0
All local authority maintained schools 1,038 38.7 36.7
Source: Key stage 4 revised attainment data

42
1. Includes academies and LA maintained schools that were open before 12 September 2016.
2. Includes entries and achievements by these pupils in previous academic years.
3. For this table one academic year is between 12 September 2015 and 11 September 2016.
4. The ‘All sponsored academies’ and ‘All converter academies’ figures include data for all schools which were
academies on 12 September 2015 irrespective of their type in previous years.
5. Figures for 'Number of schools' are based on those with results in 2016/17. 6. Shaded cells contain information for the predecessor school for sponsored academies and for the school prior to
conversion for converter academies.
Table 22 shows decreases in the percentage of pupils achieving the EBacc at grade 4 or C or above in
both sponsored academies and converter academies between 2016 and 2017, with a slight drop in
attainment of 0.1 percentage points for sponsored academies and a drop of 1.4 percentage points for
converter academies (to 14.6% and 29.2%, respectively). Over the same period, the percentage of
pupils achieving the EBacc at grade 4 or C or above in LA maintained mainstream schools decreased
from 23.3% in 2016 to 22.3% in 2017, a drop by 1.1 percentage points.
Table 22: Percentage of pupils achieving the EBacc in academies and local authority maintained schools
by length of time open England, 2016-2017
Number of schools with
results
% achieving grade 4/C or above in all components
of the English Baccalaureate
2015/16 2016/17
Sponsored academies
Open for one academic year 41 13.6 12.9
Open for two academic years 56 13.9 13.0
Open for three academic years 58 14.5 15.2
Open for four academic years 78 12.1 12.3
Open for five academic years 60 12.5 12.5
Open for six academic years 47 14.7 13.7
Open for seven or more academic years 253 16.2 16.1
All sponsored academies 593 14.7 14.6
Converter academies Open for one academic year 57 25.1 23.2
Open for two academic years 47 24.6 24.3
Open for three academic years 67 26.0 24.9
Open for four academic years 155 26.4 25.4
Open for five academic years 371 27.3 25.4
Open for six academic years 651 34.3 32.9
Open for seven or more academic years 27 37.8 38.7
All converter academies 1,375 30.5 29.2
All local authority maintained schools 1,038 23.3 22.3

43
Source: Key stage 4 revised revised attainment data
1. Includes academies and LA maintained schools that were open before 12 September 2016.
2. Includes entries and achievements by these pupils in previous academic years.
3. For this table one academic year is between 12 September 2015 and 11 September 2016.
4. The ‘All sponsored academies’ and ‘All converter academies’ figures include data for all schools which were
academies on 12 September 2015 irrespective of their type in previous years.
5. Figures for 'Number of schools' are based on those with results in 2016/17. 6. Shaded cells contain information for the predecessor school for sponsored academies and for the school prior to
conversion for converter academies.
Table 23 shows results for pupils in academies and local authority maintained schools that were open in both
2016 and 2017. The same group of schools is compared with no changes to the composition of the groups. In
both years, pupils in converter academies were more likely to achieve passes in English and maths than those
in local authority maintained schools, while pupils in sponsored academies were less likely to achieve this.
This was also true across all pupil groups presented in the tables, except Chinese pupils who did slightly
better in sponsored academies than local authority maintained schools in 2016. Patterns in attainment of
pupils with different characteristics were similar across school types and years.
In all school types slightly more pupils achieved a pass in English and maths measures (at a grade 4 or above)
in 2017 than did so last year (at a grade C or above) with the highest increase overall in sponsored academies
(0.9 percentage points compared to 0.8 percentage points in other school types). However, in sponsored
academies the percentage of pupils eligible for free school meals achieving a pass at 4 or C in English and
maths only increased by 0.6 percentage points, compared to 0.8 percentage points in converter academies.
Pupils with SEN in sponsored academies also saw a smaller increase (0.5 percentage points) compared to
other school types (1.2 percentage points in local authority maintained schools and 1.0 percentage points in
converter academies).
Table 23: Percentage of pupils achieving grade C (2016) or 4 (2017) and above in English and maths by school
type and pupil characteristics
England, 2016-2017
Mainstream sponsored
academies with results in 2016
and 2017
Mainstream converter
academies with results in 2016
and 2017
LA maintained mainstream schools with
results in 2016 and 2017
All state-funded mainstream schools with
results in 2016 and 2017
2015/16 2016/17 2015/16 2016/17 2015/16 2016/17 2015/16 2016/17
All pupils 53.0 53.9 69.8 70.6 62.4 63.2 64.3 65.1
Pupils eligible for free school meals (FSM) 37.5 38.1 44.7 46.0 41.7 42.9 41.5 42.7
All other pupils 57.1 57.8 72.4 73.1 65.8 66.5 67.6 68.3
Asian 58.9 61.9 74.6 75.7 64.9 66.3 68.2 69.8
Black 58.1 56.6 64.4 65.8 58.4 59.2 60.4 61.0
Chinese 80.7 75.1 86.3 89.5 79.7 81.6 83.6 85.1
Mixed 54.7 55.5 69.9 70.9 59.8 61.5 63.7 64.7
White 51.6 52.3 69.5 70.2 62.5 63.1 64.1 64.9
Any other ethnic group 56.2 57.3 66.5 68.1 62.7 64.0 62.6 64.2
Unclassified 49.9 51.1 67.3 66.5 62.4 61.1 54.4 53.9
No identified SEN 58.8 59.4 74.8 75.4 68.0 68.5 69.8 70.4
All SEN pupils 21.3 21.8 32.4 33.4 25.4 26.6 27.7 28.7
SEN support 22.1 22.8 34.4 35.2 26.6 27.9 29.1 30.2 SEN with a statement or EHC plan 16.4 15.2 22.1 23.8 18.7 19.0 19.8 20.7
Source: Key stage 4 revised attainment data

44
1. In 2017, pupils sat reformed GCSEs in English language, English literature and mathematics for the first time, graded on a 9-1 scale.
The bottom of a grade 4 in reformed GCSEs maps onto the bottom of a grade C in unreformed GCSEs. As a result, we can compare
2016 and 2017 in this table based on attainment in English and maths.
2. State-funded mainstream schools include academies and free schools but exclude state-funded special schools, independent
schools, independent special schools, non-maintained special schools, hospital schools, special academies and pupil referral units.
3. Each year, the number of state-funded schools in England remains relatively stable. However the number of schools within an
individual school type group can vary, most commonly due to local authority maintained schools closing to become academies.
Because of this, it is not appropriate to make comparisons of the results published in statistical releases across successive years.
4. Only includes schools with results for both 2016 and 2017. In all cases, the school type relates to the 2017 school type. Results for
2016 refer to the results schools of a given type in 2017 obtained in 2016, with results of predecessor schools used where applicable in
2016.
11. Attainment by admissions basis (Tables 2b & 4b)
Admissions basis
Prior to 2016, admissions basis was taken from Get information about schools29 (previously known as ‘Edubase’)
which was self-declared by each school and not necessarily a true reflection of a school's admission policy. From
2016, we moved to an alternative classification and provided this alongside the older definition. In 2017, admissions
basis uses the alternative classification established in 2016. Results using the old definition are available as part of the
download data published on the school performance tables website30.
The new definition is a more accurate reflection of the current admissions basis of a school. This groups schools into
selective schools, non-selective schools in highly selective areas and all other non-selective schools. The selective
group covers the same schools as in the previous grouping. Non-selective schools in highly selective areas cover all
schools in local authorities where 25% or more of state-funded secondary places are in state-funded selective
schools31.The other non-selective schools group includes schools in local authorities with some selection, as well as
those with no selection.
To give us feedback regarding this change, please contact [email protected].
Table 24: Attainment 8 and Progress 8 by admissions basis England, state-funded mainstream schools, 2017
Number of
schools Number of
pupils at end
of key stage
4
Average Attainment
8 score
Average Progress
8 score
Progress 8
lower
confidence
interval
Progress 8
upper
confidence
interval
Selective schools 163 22,715 69.3 0.45 0.44 0.47
Non-selective schools in highly
selective areas 215 33,611 42.1 -0.14 -0.15 -0.13
Other non-selective schools 2,758 460,255 46.5 -0.01 -0.01 0.00
All state-funded mainstream
schools 3,153 517,756 47.1 0.00 0.00 0.00
Source: Key stage 4 revised attainment data
Of the three groups, selective schools achieve the highest results, with an average Attainment 8 score
of 69.3, and Progress 8 score of 0.45, which is a statistically significantly above the national average.
Non-selective schools in highly selective areas have the lowest attainment of the three groups, with an
average Attainment 8 score of 42.1, and a Progress 8 core of -0.14, which is statistically significantly
below the national average.
All other non-selective schools, which 89% of pupils in state-funded mainstream schools attend, and
which therefore contribute the most to the national average, have an average Attainment 8 score of
46.5, and Progress 8 score in line with the national average.
29 https://get-information-schools.service.gov.uk/ 30 ‘ADMPOL’ variable in 2016-2017 revised KS4 data download file here: https://www.compare-school-
performance.service.gov.uk/download-data 31 These local authorities are Bexley, Buckinghamshire, Kent, Lincolnshire, Medway, Poole, Slough, Southend-on-Sea, Sutton, Torbay, Trafford and Wirral.
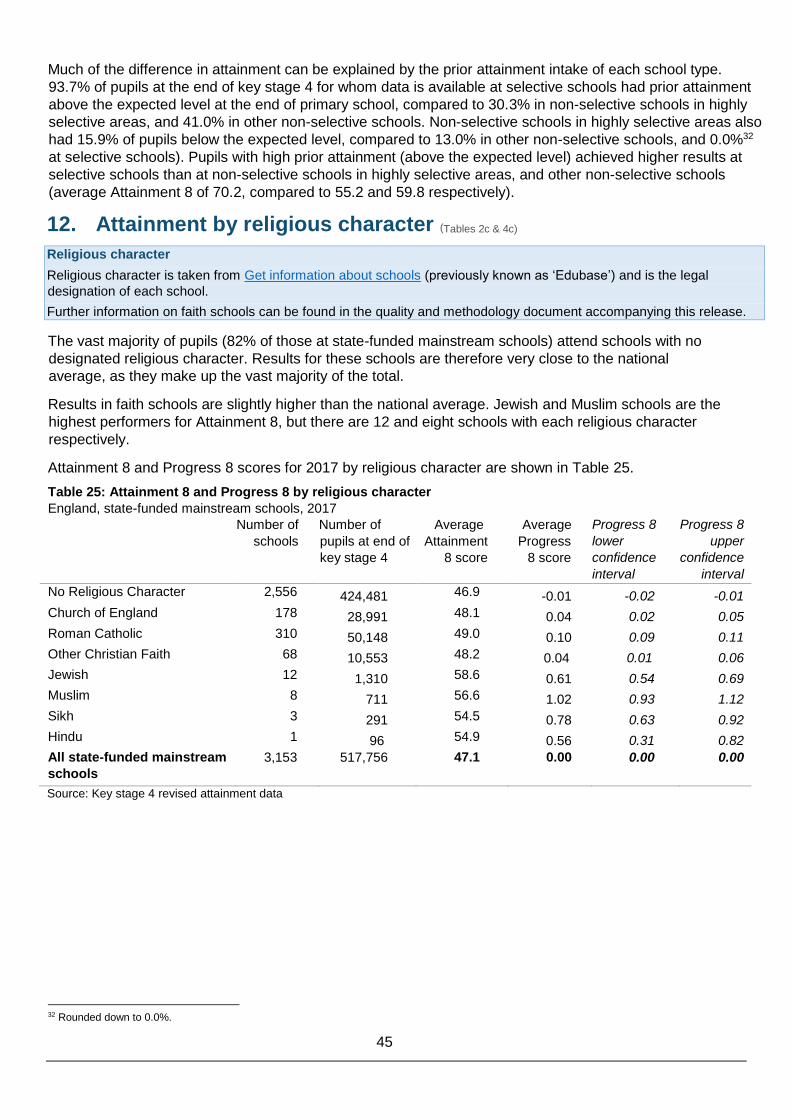
45
Much of the difference in attainment can be explained by the prior attainment intake of each school type.
93.7% of pupils at the end of key stage 4 for whom data is available at selective schools had prior attainment
above the expected level at the end of primary school, compared to 30.3% in non-selective schools in highly
selective areas, and 41.0% in other non-selective schools. Non-selective schools in highly selective areas also
had 15.9% of pupils below the expected level, compared to 13.0% in other non-selective schools, and 0.0%32
at selective schools). Pupils with high prior attainment (above the expected level) achieved higher results at
selective schools than at non-selective schools in highly selective areas, and other non-selective schools
(average Attainment 8 of 70.2, compared to 55.2 and 59.8 respectively).
12. Attainment by religious character (Tables 2c & 4c)
Religious character
Religious character is taken from Get information about schools (previously known as ‘Edubase’) and is the legal
designation of each school.
Further information on faith schools can be found in the quality and methodology document accompanying this release.
The vast majority of pupils (82% of those at state-funded mainstream schools) attend schools with no
designated religious character. Results for these schools are therefore very close to the national
average, as they make up the vast majority of the total.
Results in faith schools are slightly higher than the national average. Jewish and Muslim schools are the
highest performers for Attainment 8, but there are 12 and eight schools with each religious character
respectively.
Attainment 8 and Progress 8 scores for 2017 by religious character are shown in Table 25.
Table 25: Attainment 8 and Progress 8 by religious character England, state-funded mainstream schools, 2017
Number of
schools Number of
pupils at end of
key stage 4
Average Attainment
8 score
Average Progress
8 score
Progress 8
lower
confidence
interval
Progress 8
upper
confidence
interval
No Religious Character 2,556 424,481 46.9 -0.01 -0.02 -0.01
Church of England 178 28,991 48.1 0.04 0.02 0.05
Roman Catholic 310 50,148 49.0 0.10 0.09 0.11
Other Christian Faith 68 10,553 48.2 0.04 0.01 0.06
Jewish 12 1,310 58.6 0.61 0.54 0.69
Muslim 8 711 56.6 1.02 0.93 1.12
Sikh 3 291 54.5 0.78 0.63 0.92
Hindu 1 96 54.9 0.56 0.31 0.82
All state-funded mainstream
schools 3,153 517,756 47.1 0.00 0.00 0.00
Source: Key stage 4 revised attainment data
32 Rounded down to 0.0%.

46
13. Attainment by local authority (Tables LA1) As shown in table 26, revised performance by local authority varies considerably across headline
measures.
Table 26: Minimum and maximum local authority performance in headline measures
England, state-funded schools, 2017
Minimum Maximum Range
Average Attainment 8 score per
pupil 37.6 56.2 18.6 points
% achieving 9-5 grades in English and maths 24.6% 68.4% 43.8 percentage points
% achieving 9-4 grades in English and maths* 47.5% 84.2% 36.7 percentage points
% entering EBacc 19.2% 63.0% 43.8 percentage points
% achieving EBacc (including 9-5 grades in English and
maths and A*-C in unreformed subjects) 7.4% 43.8% 37.6 percentage points
% achieving EBacc (including 9-4 grades in English and
maths and A*-C in unreformed subjects)*
8.8% 46.4% 37.6 percentage points
Source: Key stage 4 revised attainment data
*Not headline measures, but shown to aid comparability to previous years. See section 1: 2017
Headline measures for more information.
**Removed Isles of Scilly as this local authority has only one school recorded.
Figure 30: Average Attainment 8 score per pupil by local authority
England, 2017
Source: Key stage 4 revised attainment data

47
Revised data for average Attainment 8 score per pupil show that the highest performing local authorities
are concentrated in London and the south. The majority of the lowest performing local authorities are
located in the northern and midland regions. This is a similar pattern to recent years when compared
against 2016 Attainment 8 scores.
Figure 31 shows the correlation between the average Attainment 8 score per pupil in 2017 and the
average Attainment 8 score per pupil based on equivalent 2016 data (at local authority level). This gave
a correlation coefficient of 0.96, suggesting that there is a high level of correlation between the scores
for 2016 and 2017. This shows that the majority of areas that were high performing for average
Attainment 8 score per pupil in 2016 remain high performing in 2017, despite the differences seen when
comparing across years using two different point scales. Similarly, the majority of areas which were low
performing in 2016 remain low for average Attainment 8 score per pupil in 2017 at local authority level.
Figure 31: Local authority achievement in Attainment 8 for 2017 compared to Attainment 8
using 2016 shadow data
England, state-funded schools, 2017
Source: Key stage 4 revised attainment data

48
14. Accompanying tables
The following tables are available in Excel format on the department’s statistics website:
National tables
1a Comparison over time in headline measures
1b The English Baccalaureate
1c Entry to specific subject groups
1d Average Attainment 8 scores for pupils at the end of key stage 4
2a GCSE and equivalent entries and achievements of pupils at the end of key stage 4 by type of school and gender
2b GCSE and equivalent entries and achievements of pupils at the end of key stage 4 by school admission basis and gender
2c GCSE and equivalent entries and achievements of pupils at the end of key stage 4 by gender and religious character of school
2d GCSE and equivalent entries and achievements of pupils at the end of key stage 4 in sponsored academies by length of time open
2e GCSE and equivalent entries and achievements of pupils at the end of key stage 4 in converter academies by length of time open
3 Transition matrices in English and mathematics showing attainment at key stage 4 by key stage 2 attainment level
4a Attainment of pupils at the end of key stage 4 by prior attainment band, type of school and gender
4b Attainment of pupils at the end of key stage 4 by prior attainment band, school admission basis and gender
4c Attainment of pupils at the end of key stage 4 by prior attainment band, gender and religious character
5a Number of schools showing the percentage of pupils at the end of key stage 4 achieving the English Baccalaureate by type of school
5b Number of schools showing the percentage of pupils at the end of key stage 4 achieving the English Baccalaureate by admission basis
5c Number of schools showing the percentage of pupils at the end of key stage 4 achieving the English Baccalaureate by religious character of the school
6 Number of schools achieving the floor standard
7 Number of school meeting the coasting definition
National characteristics tables
Summary GCSE and equivalent entries and
achievements of pupils at the end of key stage 4 by pupil
characteristics
CH1 GCSE and equivalent entries and achievements of
pupils at the end of key stage 4 by pupil characteristics
CH2a GCSE and equivalent entries and achievements of
pupils at the end of key stage 4 by ethnicity, free school
meal eligibility and gender
CH2b GCSE and equivalent entries and achievements of
pupils at the end of key stage 4 by SEN provision, free
school meal eligibility and gender
CH2c GCSE and equivalent entries and achievements of
pupils at the end of key stage 4 by SEN provision,
ethnicity and gender
CH3a GCSE and equivalent entries and achievements of
pupils at the end of key stage 4 by type of school, pupil
characteristics, and gender
CH3b GCSE and equivalent entries and achievements of
pupils at the end of key stage 4 by school admission
basis, pupil characteristics, and gender
CH3c GCSE and equivalent entries and achievements of
pupils at the end of key stage 4 by religious character of
school, pupil characteristics, and gender
CH4a Time series of the disadvantaged pupils attainment
gap index at key stage 4 (Official statistics)
CH4b(1) Average English and mathematics GCSE grade
breakdown of pupils eligible for the pupil premium and
others (9-1 GCSEs in English and maths) (Official
statistics)
CH4b(2) Average English and mathematics GCSE grade
breakdown of pupils eligible for the pupil premium and
others (Official statistics)
Local authority and regional tables
LA1 GCSE and equivalent entries and achievements of
pupils at the end of key stage 4 by gender for each local
authority and region
LA2 Average Attainment 8 scores for each local authority and region
LA3 The English Baccalaureate by local authority and region
LA4 Attainment 8 scores and components by local authority and region
LA5 Progress 8 scores and components by local authority and region
LA6 Number of schools below the floor standard for each local authority and region
LA7 Number of schools classified as coasting for each local authority and region.
LA8 GCSE and equivalent entries and achievements of pupils at the end of key stage 4 by ethnicity for each local authority and region

49
LA9 GCSE and equivalent entries and achievements of pupils at the end of key stage 4 by English as a first language for each local authority and region
LA10 GCSE and equivalent entries and achievements of pupils at the end of key stage 4 by free school meal eligibility for each local authority and region
LA11 GCSE and equivalent entries and achievements of pupils at the end of key stage 4 by disadvantage for each local authority and region
LA12 GCSE and equivalent entries and achievements of pupils at the end of key stage 4 by SEN provision for each local authority and region
Subject tables
S1 GCSE and equivalents entries and achievements in selected subjects of pupils at the end of key stage 4 in all schools
S2 GCSE and equivalents entries and achievements in selected subjects of pupils at the end of key stage 4 in state-funded schools
S3 GCSE results of pupils at the end of key stage 4 in all schools, by subject and grade
S4 Entries and achievements in AS levels and Free Standing Mathematics Qualifications of pupils at the end of key stage 4 in all schools, by subject
S5 Vocational qualification entries and achievements in selected subjects of pupils at the end of key stage 4 in all schools
S6 Non-discounted examination entries in English Baccalaureate and non-English-Baccalaureate subjects of pupils at the end of key stage 4
S7 GCSE entries in selected subjects of pupils at the end of key stage 4 by school type (percentage)
S8 GCSE entries in selected subjects of pupils at the end of key stage 4 by school admission basis of state-funded mainstream schools
S9 GCSE entries in selected subjects of pupils at the end of key stage 4 by school religious character of state-funded mainstream schools
Subject time series table
Time series of GCSE results of pupils at the end of key stage 4 in all schools, by subject, grade and gender

50
When reviewing the tables, please note that:
We preserve confidentiality The Code of Practice for Official Statistics requires us to take
reasonable steps to ensure that our published or disseminated statistics
protect confidentiality.
We suppress some figures Values of 1 or 2, or a percentage based on 1 or 2 pupils who
achieved; or 0, 1 or 2 pupils who did not achieve a particular level are
suppressed in circumstances where non-suppression would lead to
disclosure of pupils. Some additional figures have been suppressed to
prevent the possibility of a suppressed figure being revealed.
This suppression is consistent with our Statistical policy statement on
confidentiality.
We adopt symbols to help
identify suppression Symbols are used in the tables as follows:
0 zero
. Not available
x Publication of that figure would be
disclosive
We round figures Percentages in this SFR are given to one decimal place.
Coverage of the data The statistics in this release cover the data collated for the 2017
secondary school performance tables. The performance tables and this
release report results based on pupils at the end of key stage 4, who are
typically aged 15 at the start of the academic year.
The coverage of the local authority (LA) and regional statistics is state-
funded schools only in England. This includes city technology colleges
and academies but excludes hospital schools, pupil referral units and
alternative provision.
15. Further information is available
School level figures School level data is published in the performance tables.
Previously published figures Revised SFR01/2016: Revised GCSE and equivalent results in England:
2015 to 2016
key stage 4 statistical releases for previous years
51
Attainment for other key
stages
Data on other key stages can be found at the following links:
Early years foundation stage profile
Key stage 1
Key stage 2
16-19 attainment
School performance tables
Destination measures Figures for young people who went into education, employment or training destinations the year after they completed key stage 4 or key stage 5 can be found at the following link:
Destinations of key stage 4 and key stage 5 pupils
Attainment in Wales,
Scotland and Northern
Ireland
Information on educational attainment for secondary schools in Wales is
available from the Welsh Government website.
Information on educational attainment for secondary schools in Scotland is
available from the Scottish Government website.
Information on educational attainment for secondary schools in Northern
Ireland is available from the Department for Education Northern Ireland
(DENI) website.
Information published by
Ofqual
Ofqual follows the principle that if the cohort of students taking a subject is
similar to previous years, then the proportions of students at each grade will
be similar. A key piece of evidence in determining if the cohort is the same
is prior attainment at key stage 2 for GCSE qualifications. Background on
the methodology and history of setting and maintaining exam standards can
be found on GOV.UK – Setting GCSE and A level grade standards.
Ofqual have also published information on variability in GCSEs for schools
and colleges which is available on GOV.UK – Variability in GCSE results in
schools, 2015 to 2017.
16. National Statistics The United Kingdom Statistics Authority has designated these statistics as National Statistics, in
accordance with the Statistics and Registration Service Act 2007 and signifying compliance with the
Code of Practice for Official Statistics.
Designation can be broadly interpreted to mean that the statistics:
• meet identified user needs;
• are well explained and readily accessible;
• are produced according to sound methods, and
• are managed impartially and objectively in the public interest.
Once statistics have been designated as National Statistics it is a statutory requirement that the Code of
Practice shall continue to be observed.
The Department has a set of statistical policies in line with the Code of Practice for Official Statistics.
52
17. Technical information A quality and methodology information document accompanies this release. This provides further
information on the data sources, their coverage and quality and explains the methodology used in
producing the data, including how it is validated and processed.
18. Get in touch Media enquiries
Press Office News Desk, Department for Education, Sanctuary Buildings, Great Smith Street, London
SW1P 3BT.
Tel: 020 7783 8300
Other enquiries/feedback
Kathryn Kenney, Education Data Division, Department for Education, Bishopsgate House, Feethams,
Darlington, DL1 5QE.
Tel: 01325 340620 Email: [email protected]
We are changing how our releases look
From 2018, we are planning to change the way we present data in our publication. Our intention is to highlight
key performance figures in the main text and data presentation. More detailed breakdown of information, such
as local authority by gender and lower geographies, will be presented as underlying data in a downloadable
and accessible format. We would welcome your feedback on these proposed changes at

© Crown copyright 2018
This publication (not including logos) is licensed under the terms of the
Open Government Licence v3.0 except where otherwise stated. Where
we have identified any third party copyright information you will need to
obtain permission from the copyright holders concerned.
To view this licence:
visit www.nationalarchives.gov.uk/doc/open-government-licence/version/3 email
[email protected] write to Information Policy Team, The National Archives,
Kew, London, TW9 4DU
About this publication:
Enquiries: Kathryn Kenney, Education Data Division, Department for Education, Bishopsgate
House, Darlington, Feethams, DL1 5QE.
Tel: 01325 340620 Email: [email protected] download
https://www.gov.uk/government/collections/statistics-gcses-key-stage-4
Reference: SFR01/2018
Follow us on Twitter: Like us on Facebook:
@educationgovuk facebook.com/educationgovuk