revised draft environmental impact report for the wal-mart ... · pdf filerevised draft...
TRANSCRIPT

REVISED DRAFT
ENVIRONMENTAL IMPACT REPORT
FOR THE
WAL-MART PARCEL MAP AND EXPANSION PROJECT
(PM 03-17; 2044 FOREST AVENUE)
STATE CLEARINGHOUSE #2004012077
APRIL 2009
Prepared by:
CITY OF CHICO
Planning Services Department
411 Main Street
Chico, CA 95928
Consultant:


REVISED DRAFT ENVIRONMENTAL IMPACT REPORT
FOR THE WAL-MART PARCEL MAP AND EXPANSION PROJECT
(PM 03-17; 2044 FOREST AVENUE)
Prepared by:
CITY OF CHICO Planning Services Division
411 Main Street Chico, CA 95928
Consultant:
PMC 140 Independence Circle, Suite C
Chico, CA 95973 530-894-3469
Fax: 530-894-6459 www.pacificmunicipal.com
APRIL 2009


TABLE OF CONTENTS
City of Chico Wal-Mart Expansion
April 2009 Revised Draft Environmental Impact Report
i
1.0 INTRODUCTION
1.1 Purpose of the Revised EIR .............................................................................................1.0-1
1.2 Background ......................................................................................................................1.0-2
1.3 Type of EIR .........................................................................................................................1.0-2
1.4 Intended Uses of the Revised EIR..................................................................................1.0-2
1.5 Scope and Organization of the EIR..............................................................................1.0-3
1.6 Effects Found Not To Be Significant ..............................................................................1.0-5
1.7 Environmental Review Process......................................................................................1.0-6
1.8 Terminology of Impacts ..................................................................................................1.0-8
2.0 ENVIRONMENTAL SETTING, IMPACTS AND MITIGATION MEASURES
2.0 Introduction to the Environmental Impact Analysis ..................................................2.0-1
2.1 Climate Change ..............................................................................................................2.1-1
2.2 Energy Conservation .......................................................................................................2.2-1
2.3 Traffic and Circulation.....................................................................................................2.3-1
3.0 REPORT PREPARERS
3.1 Report Preparers ..............................................................................................................3.0-1
LIST OF TABLES
Table 2.1-1 Wal-Mart Building: Existing and Expansion Emissions .................................................... 2.1-10 Table 2.1-2 Vehicle CO2 Emissions Under Proposed Project ........................................................... 2.1-10 Table 2.1-3 Total Project CO2 Emissions ............................................................................................... 2.1-11
Table 2.2-1 PG&E Planning Area Electricity Consumption and Forecasts ...................................... 2.2-4
Table 2.2-2 PG&E Planning Area Natural Gas Consumption and Forecasts.................................. 2.2-5
Table 2.2-3 Project Electricity and Gas Consumption......................................................................... 2.2-9
Table 2.3-1 Existing Conditions: Intersection Levels-Of-Service ......................................................... 2.3-7
Table 2.3-2 Existing Conditions: SR 99 Mainline Levels-of-Service ................................................... 2.3-10
Table 2.3-3 Existing Conditions: SR 99 Ramp Junction Levels-Of-Service ...................................... 2.3-17
Table 2.3-4 City of Chico General Plan - Transportation-Related Policy Summary..................... 2.3-19
Table 2.3-5 Level of Service (LOS) Criteria for Roadways................................................................. 2.3-20
Table 2.3-6 Level of Service (LOS) Criteria For Intersections............................................................. 2.3-21
Table 2.3-7 Target Level of Service (LOS) for Caltrans Facilities ...................................................... 2.3-24
Table 2.3-8 Project Trip Generation ...................................................................................................... 2.3-28
Table 2.3-8 Project Trip Generation (cont.) ......................................................................................... 2.3-30
Table 2.3-9 Proposed, Assumed, and Approved Projects................................................................ 2.3-43
Table 2.3-10 Short Term No Project Conditions: Intersection Levels-Of-Service.......................... 2.3-47
Table 2.3-11 Short Term No Project Conditions: SR 99 Mainline Levels-of-Service ....................... 2.3-53
Table 2.3-12 Short Term No Project Conditions: SR 99 Ramp Junction Levels-of-Service........... 2.3-54
Table 2.3-13 Short Term Plus Project Intersection Levels-Of-Service ............................................... 2.3-57
Table 2.3-14 Short Term Plus Project Conditions: SR 99 Mainline Levels-of-Service...................... 2.3-62
Table 2.3-15 Short Term Plus Project Conditions: SR 99 Ramp Junction Levels-of-Service ......... 2.3-63
Table 2.3-16 Short Term Plus Project and No Project Comparisons: SR 99 Ramp
Junction Levels-of-Service ...................................................................................................................... 2.3-63
Table 2.3-17 Short Term Plus Project and No Project Comparisons: East 20th
Street/ Chico Mall Access Intersection................................................................................................ 2.3-67
Table 2.3-18 Cumulative No Project Conditions Intersection Levels-Of-Service.......................... 2.3-75

TABLE OF CONTENTS
Wal-Mart Expansion City of Chico
Revised Draft Environmental Impact Report April 2009
ii
Table 2.3-19 Cumulative No Project Conditions: SR 99 Mainline Levels-of-Service..................... 2.3-81
Table 2.3-20 Cumulative No Project Conditions: SR 99 Ramp Junction Levels-of-Service......... 2.3-82
Table 2.3-21 Cumulative No Project Conditions: SR 99 Weaving Levels-of-Service .................... 2.3-85
Table 2.3-22 Cumulative Plus Project Conditions Intersection Levels-Of-Service ........................ 2.3-86
Table 2.3-23 Cumulative Plus Project Conditions: SR 99 Mainline Levels-of-Service ................... 2.3-87
Table 2.3-24 Cumulative Plus Project Conditions: SR 99 Ramp Junction Levels-of-Service ....... 2.3-93
Table 2.3-25 Cumulative Conditions Ramp Junctions Significant Impact Criteria...................... 2.3-94
Table 2.3-26 Cumulative Plus Project Conditions: SR 99 Weaving Levels-of-Service .................. 2.3-95
Table 2.3-27 Cumulative Conditions Weaving Junctions Significant Impact Criteria ................ 2.3-95
Table 2.3-28 Cumulative Conditions Queuing Analysis .................................................................... 2.3-96
Table 2.3-29 Cumulative Plus Project Conditions: East 20th Street/Chico Mall
Access Intersection.................................................................................................................................. 2.3-97
Table 2.3-30 Cumulative Plus Project Conditions: East 20th Street/Chico Mall
Access Intersection.................................................................................................................................. 2.3-98
LIST OF FIGURES
Figure 2.3-1 – Site Plan ............................................................................................................................... 2.3-3
Figure 2.3-2 – Existing Lane Geometrics and Control ........................................................................ 2.3-11
Figure 2.3-3 – Existing Peak Hour Traffic Volumes ............................................................................... 2.3-13
Figure 2.3-4 – Existing Freeway Mainline & Ramp Volumes.............................................................. 2.3-15
Figure 2.3-5A – “Wal-Mart” Trip Distribution ......................................................................................... 2.3-33
Figure 2.3-5B – “Fast Food Restaurant/Gas Station” Trip Distribution ............................................. 2.3-35
Figure 2.3-6 – Project Only Traffic Volumes.......................................................................................... 2.3-37
Figure 2.3-7 Year 2010 Lane Geometrics and Control ...................................................................... 2.3-45
Figure 2.3-8 – Year 2010 No Project Traffic Volumes.......................................................................... 2.3-49
Figure 2.3-9 – Year 2010 No Project Freeway Mainline and Ramp Volumes................................ 2.3-51
Figure 2.3-10 – Year 2010 Plus Project Traffic Volumes ...................................................................... 2.3-59
Figure 2.3-11 – Year 2010 Plus Project Freeway Mainline and Ramp Volumes ............................ 2.3-65
Figure 2.3-12 – Year 2020 Geometrics and Control ........................................................................... 2.3-77
Figure 2.3-13 – Year 2020 No Project Traffic Volumes........................................................................ 2.3-79
Figure 2.3-14 – Year 2020 No Project Freeway Mainline and Ramp Volumes.............................. 2.3-83
Figure 2.3-15 – Year 2020 Plus Project Traffic Volumes ...................................................................... 2.3-89
Figure 2.3-16– Year 2020 Plus Project Freeway Mainline and Ramp Volumes ............................. 2.3-91

1.0 INTRODUCTION


1.0 INTRODUCTION
City of Chico Wal-Mart Expansion
April 2009 Revised Draft Environmental Impact Report
1.0-1
This section summarizes the purpose of the Environmental Impact Report (EIR); describes the type
of EIR; describes the intended uses of the EIR in compliance with the CEQA Guidelines section
15124(d); describes the scope and organization of the EIR, identifies the environmental effects
that were dismissed from further consideration in the Initial Study; describes the environmental
review process that has been undertaken and is anticipated to be undertaken, identifies a
contact person, and describes the terminology of the impact analysis.
1.1 PURPOSE OF THE REVISED EIR
The City of Chico, acting as the Lead Agency, has prepared this Revised Draft EIR to provide the
public and responsible and trustee agencies with information about the potential environmental
effects of the proposed Wal-Mart Parcel Map and Expansion Project. The Wal-Mart Parcel Map
and Expansion Project Draft EIR published in December 2006 and the Final EIR was published in
January 2008. The Wal-Mart Expansion EIR has not yet been certified by the City. Since the time
of the publication dates, new significant information has become known to the City regarding
the transportation and circulation system of the City. The relationship between the proposed
project’s impacts to surrounding roadways and the ability for these impacts to be reduced by
the payment of the City’s Nexus fees was not completely correct as some of the roadways and
intersections originally thought to be covered in the Nexus Study were not. As a result, a revision
of the traffic study was necessary, which consequently resulted in a need for a revision of
Section 4.2 Traffic and Circulation of the Draft EIR. This revision is presented in Section 2.3 of this
Revised Draft EIR.
In addition, since the publication of the Draft EIR and Final EIR, the concern for global warming
and climate change has been brought to the forefront of public awareness. At the present time,
CEQA does not specifically require a greenhouse gas analysis for all projects in the State of
California. However, CEQA Guidelines Section 21083.05 does require that the Governor’s Office
of Planning and Research “prepare, develop, and transmit to the Resources Agency guidelines
for the mitigation of greenhouse gas emissions …”. Currently, the consensus is that it appears to
be just a matter of time before some level of greenhouse gas analysis will be required of projects
subject to environmental review. As a result of these and other factors, an analysis of the
proposed project’s climate change impacts as well as energy use is included in this Revised
Draft EIR.
Several key ideas regarding the purpose of the EIR are provided in the CEQA Guidelines Section
15121(a), which states that an EIR is an informational document for the decision-makers and the
general public that discusses the significant environmental effects of a project, identifies possible
ways to minimize the significant effects, and describes reasonable alternatives to the project
that both meet the basic objectives of the applicant and serve to reduce or eliminate any
significant environmental effects of the project. Public agencies with discretionary authority are
required to consider the information in the EIR regarding the environmental effects of the
project, along with any other relevant information when making decisions on the project. Thus,
the focus of the EIR is to provide information regarding the environmental consequences of
implementation of the project and ways to lessen the environmental effects.
The City of Chico serves as the Lead Agency, (meaning the City has the primary discretionary
authority regarding the project) and has prepared this Revised Draft EIR to provide information
about the potential environmental effects of the proposed project. The information in this EIR is
required to be considered by the city, along with the other considerations that inform their
decision (planning, economic, social), in determining whether to approve the Tentative Parcel
Map for the Wal-Mart Expansion project.

1.0 INTRODUCTION
Wal-Mart Expansion City of Chico
Revised Draft Environmental Impact Report April 2009
1.0-2
1.2 BACKGROUND
The existing Wal-Mart store located in the southern portion of the City of Chico opened for
business in 1994. Presently, Wal-Mart is proposing to expand its existing store into a Wal-Mart
Supercenter on a vacant portion of its property. However, Wal-Mart’s property consists of two
parcels and in their current configuration the store expansion would be located across a
property line, which is not allowed by the City of Chico. Thus, Wal-Mart filed an application to
the City of Chico for a Tentative Parcel Map that would reconfigure the lot lines of the existing
parcels (a 10.36-acre and a 16.75-acre parcel) to create a 24.69-acre parcel and a 2.42-acre
parcel. The existing Wal-Mart and the planned expansion would be located entirely on the
24.69-acre parcel. The 2.42-acre parcel will remain undeveloped now but Wal-Mart has
indicated that a gas station and restaurant are planned in the future.
The Draft Environmental Impact Report (DEIR) evaluated the potential environmental effects of
the project known as the Wal-Mart Parcel Map and Expansion Project, PM 03-17; 2044 Forest
Avenue (Wal-Mart Expansion), pursuant to the California Environmental Quality Act (CEQA). For
purposes of evaluating the full development potential of the entire 27.11-acre project site, this
EIR assumes the development of the store expansion on the 24.69-acre parcel, as well as the
conceptual future development of a 5,000 square foot fast food restaurant with a drive-through
lane and a 12-pump gas station and convenience store on the 2.42-acre parcel. A restaurant
and gas station attract a high number of vehicle trips and represent a reasonable worst-case
development scenario for this site in terms of environmental impact. The Wal-Mart store
expansion is proposed to add 97,556 square feet to the existing 125,889 square foot store, for a
total of 223,445 square feet. Of the total expansion, approximately 55,729 square feet would be
used for grocery sales and a grocery stockroom area, 36,197 square feet and 19,532 square feet
respectively. The remaining square footage would be used for general merchandise sales and
storage. The project would also include construction of local access driveways and connection
to existing infrastructure.
1.3 TYPE OF EIR
CEQA requires that an EIR be re-circulated when significant new information is added to an EIR
after public notice is given of the availability of a draft EIR for public review but before
certification. If the revision is limited to a few chapters or portions of the EIR, only those chapters
or portions must be re-circulated. When an EIR is revised only in part, the lead agency, in this
case the City of Chico, may request that reviewers limit their comments only to the revised
chapters or portions of the EIR. This revised EIR is limited to only a few sections of the EIR in
relation to climate change, energy consumption, and traffic and circulation.
1.4 INTENDED USES OF THE REVISED EIR
The Revised EIR is intended to evaluate the environmental impacts of the expansion of the Wal-
Mart store and potential future development of the remainder of the site to the greatest extent
possible in the areas of traffic and circulation, energy consumption, and global
warming/climate change. This Revised EIR, along with the original EIR, should be used as the
primary environmental documents to evaluate all current and subsequent permitting actions
associated with site development and the expansion project (CEQA Guidelines 15124(d). The
discretionary actions that may be taken by the City of Chico currently include, but are not
limited to, the following:

1.0 INTRODUCTION
City of Chico Wal-Mart Expansion
April 2009 Revised Draft Environmental Impact Report
1.0-3
• Certification of the EIR
• Adoption of the Mitigation Monitoring Program
• Site Design and Architectural Review
• Approval of the Tentative Parcel Map
• Finding of Public Convenience or Necessity (to permit sales of alcohol)
Additional subsequent ministerial and discretionary approvals and other permits that may be
required from the city and other local, regional, state, and federal agencies for which the EIR
may be used are identified below:
• Approval of the Final Map
• Issue Building Permits
• Approval of a Use Permit (would be required in the future for development of a
restaurant if it were to include a drive-through window or for development of a gas
station)
• Service Agreements, Abandonment and Relocation Agreements with local utility
providers
• Water quality permits (Clean Water Act) that may be required include: Construction
Storm Water Activity Permit, Report of Waste Discharge, NPDES Permit
• Section 401 and 404 Permits from the U.S. Army Corps of Engineers and coordination with
the EPA, USFWS, and California Department of Fish and Game for fill of wetlands
• Butte County Air Quality Management District permit for operation of a gas station if one
is proposed in the future
1.5 SCOPE AND ORGANIZATION OF THE EIR
Sections 15122 through 15132 of the CEQA Guidelines identify the content requirements for Draft
and Final EIRs. An EIR must include a description of the environmental setting, an environmental
impact analysis, mitigation measures, alternatives, significant irreversible environmental changes,
growth-inducing impacts, and cumulative impacts. The environmental issues addressed in this
Draft EIR were established through review of the previous environmental documentation
developed for the site, environmental documentation for nearby projects, preparation of an
Initial Study of the project application, responses to the Notice of Preparation (NOP), and
agency consultation. The complete text of the Initial Study, NOP, and responses to the NOP is
contained in Appendix A of the original DEIR. The City of Chico determined based on this
information that the preparation of an EIR was appropriate due to potentially significant
environmental impacts that could be caused by the proposed expansion of the Wal-Mart
project. This Draft EIR evaluates the existing environmental resources in the vicinity of the project
site, analyzes potential impacts on those resources due to the proposed project, and identifies
mitigation measures that could avoid or reduce the magnitude of those impacts.
This Revised Draft EIR is organized in the following manner:

1.0 INTRODUCTION
Wal-Mart Expansion City of Chico
Revised Draft Environmental Impact Report April 2009
1.0-4
SECTION 1.0 – INTRODUCTION
Section 1.0 summarizes the purpose of the Environmental Impact Report (EIR); describes the type
of EIR; describes the intended uses of the EIR in compliance with the CEQA Guidelines Section
15124(d) including the list of agencies, permits, and consultation for which this EIR is anticipated
to be used; describes the scope and organization of the EIR, identifies the environmental effects
that were dismissed from further consideration in the Initial Study; describes the environmental
review process that has been undertaken and is anticipated to be undertaken, identifies a
contact person, describes the terminology of the impact analysis; and provides a summary of
the agencies, organizations and individuals that commented on the Notice of Preparation
(NOP) of the EIR for this project.
SECTION 2.0 - INTRODUCTION TO THE ENVIRONMENTAL IMPACT ANALYSIS
This section describes the format of the environmental issue sections, the level of significance
nomenclature used in this document, the format of the impact analysis and provides a summary
of revisions to the Draft EIR.
SECTIONS 2.1 THROUGH 2.3 – ENVIRONMENTAL SETTING, IMPACTS, AND MITIGATION MEASURES
These sections contain an analysis of environmental topic areas as identified below. Each
subsection contains a description of the existing setting of the project area, identifies project-
related and cumulative impacts, and recommends mitigation measures. The following major
environmental topics are addressed in this section:
2.1 Climate Change
This section of the Revised EIR describes the potential impact the proposed project would have
on climate change. This section discusses greenhouse gas emissions and their effect on the
earth’s existing climate and how the projected change in climate would affect California and
analyzes the project’s greenhouse gas emissions.
2.2 Energy Consumption
This section of the Revised EIR describes the potential energy use of the proposed project
including the consumption of electricity, natural gas, and petroleum, and the project’s energy
conservation measures. Electricity and natural gas consumption occurs in conjunction with a
number of activities including space heating and cooling, lighting, food preparation and
maintenance.
2.3 Traffic and Circulation
This section summarizes the results of a traffic impact study performed by Omni-Means. This
section describes the existing transportation setting including the current AM, PM, and Saturday
peak hour traffic operations at key intersections, freeway ramps, and the affected freeway
mainline. Impacts of the project on existing AM, PM, and Saturday peak hour intersection, ramp
and mainline operations are identified via quantification of the trip generation and trip
distribution associated with the proposed project, assuming identified local and regional
approved/pending projects are in place. The section also evaluates the projected cumulative
(year 2020) peak hour operations. Potential base improvements and project-related mitigation
measures are identified as needed to alleviate unacceptable level of traffic impacts at the

1.0 INTRODUCTION
City of Chico Wal-Mart Expansion
April 2009 Revised Draft Environmental Impact Report
1.0-5
study intersections, ramps and mainline segments under project and cumulative conditions. In
addition, the section assesses impacts to transit, bicycle, and pedestrian facilities.
APPENDICES
This section includes all notices and other procedural documents pertinent to the EIR, as well as
all technical material prepared to support the analysis.
1.6 EFFECTS FOUND NOT TO BE SIGNIFICANT
As discussed in the original Draft EIR, the Initial Study identified several environmental topics
where potentially significant impacts would not be associated with the project. These topics are
determined to have no environmental effect or to have effects that are not significant for the
project and will not be further analyzed in this EIR. The topics that are dismissed from further
analysis and a brief discussion of the reasons why these issues were determined to not to be
significant include:
Aesthetics: The proposed Wal-Mart expansion site does not obstruct scenic views of the
foothills nor is it located along a state scenic highway. The proposed expansion will be
similar in design and massing to the existing building. The plans will be subject to site
design and architectural review like any other commercial project in the City. The City
received one agency comment regarding the project’s aesthetic impact to SR 99.
However, SR 99 is not considered a state scenic highway as it passes through the City of
Chico and therefore does not fall under the CEQA Guidelines Appendix G standards of
significance regarding impacts to state scenic highways. The City did not receive any
public comments regarding aesthetics, light or glare during the public comment period
for the Initial Study or the original Draft EIR.
Geology / Soils: The project site is located in one of the least active seismic regions in
California. A geotechnical report was prepared for the project which the City
implements through its grading ordinance and building permit review, as well as the
requirements of the Regional Water Quality Control Board, which sets forth standards to
control erosion and sedimentation. The City did not receive any agency or public
comments regarding geology and soils during the public comment period for the Initial
Study or the original Draft EIR.
Hazards / Hazardous Materials: Wal-Mart does not utilize any hazardous materials in
significant quantities that pose a threat to the public. The site is not identified on any
hazardous waste or substances sites lists or airport safety zone and is not prone to wild
land fires. The City did not receive any agency or public comments regarding hazards
and hazardous materials during the public comment period for the Initial Study or the
original Draft EIR.
Hydrology / Water Quality: The proposed expansion of the Wal-Mart store will not result in
the discharge of sewage flows above those assumed for site development in the
General Plan. The California Water Service has capacity adequate to serve the
proposed store expansion. The existing City drainage basin southwest of the project site
is sized to accommodate storm water runoff resulting from full development of the
subject parcels. The drainage basin is designed to treat all storm water prior to being
discharged to Comanche Creek. The project will be required to obtain a Construction
Activity Storm Water Permit from the California Regional Water Quality Control Board
(RWQCB) prior to any construction. The subject properties are located outside the 500-

1.0 INTRODUCTION
Wal-Mart Expansion City of Chico
Revised Draft Environmental Impact Report April 2009
1.0-6
year flood plain resulting in a less than significant risk of loss, injury or death involving
flooding. The City did receive comments regarding water quality and stormwater runoff
during the public comment period for the Initial Study or the original Draft EIR. As
discussed above, the project is subject to the permitting regulations of the RWQCB. As
with all projects in the City, adequate drainage facilities must be designed so storm
water runoff from a project site does not exceed pre-construction totals. Comments
regarding water quality and stormwater runoff are addressed in the Final EIR.
Noise: Noise from project construction and operations will be compatible with the
existing noise environment, which is dominated by SR 99 and adjacent commercial and
retail businesses. No noise-sensitive land uses are located in the immediate vicinity of the
site. All loading dock facilities for the proposed project will be located on the west side
of the building, facing SR 99. The City did not receive any agency or public comments
regarding noise impacts during the public comment period for the Initial Study or the
original Draft EIR.
Open Space / Recreation: The project will not generate new residents that could create
demand for new parks or contribute to the overuse of existing parks. The project site is
designated in the General Plan for commercial use and site development will not result in
the conversion of open space lands to other uses. The City did not receive any agency
or public comments regarding open space and recreation during the public comment
period for the Initial Study or the original Draft EIR.
Public Services: Due to the infill nature, limited size of the project and consistency with
the land use designation in the General Plan, the project will not result in the need for
additional fire fighting, police, local schools, parks or maintenance of public facilities
beyond that already anticipated in the General Plan. Additional equipment or
personnel would not be required. The City did not receive any agency or public
comments regarding public services during the public comment period for the Initial
Study or the original Draft EIR.
Utilities: The proposed store expansion on the subject properties will be connected to the
public sewer system and no significant changes in demand for any utilities, including
domestic water, electricity, gas, and telephone service will result from the project.
Available capacity exists at the City’s landfill to accommodate waste generated by the
project. Recycling containers are required for the proposed project to help reduce the
amount of material entering the landfill. The City did not receive any agency or public
comments regarding public utilities during the public comment period for the Initial Study
or the original Draft EIR. The City did receive a comment on energy use. This comment
was addressed in the Final EIR. In addition, the Revised Draft EIR includes an energy
analysis of the proposed project (Section 2.1).
1.7 ENVIRONMENTAL REVIEW PROCESS
The review and certification process for the EIR will involve the following procedural steps:
INITIAL STUDY AND NOTICE OF PREPARATION
In accordance with Section 15082 of the CEQA Guidelines, the City of Chico prepared an Initial
Study and Notice of Preparation (NOP) of an EIR that was released for public review in June
2004. The City of Chico was identified as the lead agency for the proposed project. This notice
was circulated to local, State, and federal agencies, and other interested parties to solicit

1.0 INTRODUCTION
City of Chico Wal-Mart Expansion
April 2009 Revised Draft Environmental Impact Report
1.0-7
comments on the proposed scope of the EIR. The NOP is presented in Appendix A of the original
DEIR. Comments received in response to the NOP were considered during preparation of the
original Draft EIR and are also presented in Appendix A of that document.
REVISED DRAFT EIR
This document constitutes the Revised Draft EIR. The Revised Draft EIR only pertains to the subject
areas of energy consumption, climate change and traffic and circulation and contains a
description of the environmental setting, identification of project impacts and mitigation
measures for impacts found to be significant for the subject areas. For information regarding
other environmental subject areas, the reader is referred to the original Draft EIR and Final EIR.
Upon completion of the Revised Draft EIR, the City of Chico will file a Notice of Recirculation
(NOR) with the State Office of Planning and Research to begin the required 45-day public
review period (Section 21161, California Environmental Quality Act).
PUBLIC NOTICE/PUBLIC REVIEW
Concurrent with the NOR, the City of Chico will provide public notice of the availability of the
Revised Draft EIR for public review, and invite comment from the general public, agencies,
organizations, and other interested parties. The public review and comment period should be
no less than 30 days or longer than 90 days (CEQA Guidelines Section 15105). The review period
in this case will be 45 days. Public comment on the Revised Draft EIR will be accepted in written
form. All written comments or questions regarding the Revised Draft EIR should be addressed to:
Zachary Thomas, Senior Planner
City of Chico
Community Services Department
P.O. Box 3420
411 Main Street
Chico, CA 95927
The City requests that reviewers limit their comments to only the portions of the EIR being re-
circulated. The City is not obligated under CEQA to respond to comments received during the re-
circulation period which relate to portions of the EIR that were not re-circulated.
RESPONSE TO COMMENTS/REVISED FINAL EIR
Following the conclusion of the public review period for the Revised Draft EIR, a Revised Final EIR
will be prepared. The Revised Final EIR will respond to written comments received during the
public review period and to oral comments made at any public hearings regarding the Revised
Draft EIR.
CERTIFICATION OF THE EIR/PROJECT CONSIDERATION
The City of Chico Planning Commission will review and consider the Revised Final EIR as well as
the original Final EIR (collectively the “Final EIR”). If the Planning Commission finds that the EIR is
"adequate and complete", the Commission may certify the EIR at a public hearing. The rule of
adequacy generally holds that the EIR can be certified if: 1) it shows a good faith effort at full
disclosure of environmental information; and 2) provides sufficient analysis to allow decisions to
be made regarding the project in contemplation of its environmental consequences.

1.0 INTRODUCTION
Wal-Mart Expansion City of Chico
Revised Draft Environmental Impact Report April 2009
1.0-8
Upon review and consideration of the EIR, the Planning Commission may take action to
approve, revise, or deny approval of the Tentative Parcel Map and other discretionary actions
listed in Section 1.4 above. A decision to approve the map would be accompanied by written
findings in accordance with CEQA Guidelines Section 15091 and, if applicable, Section 15093. A
Mitigation Monitoring Program, as described below, would also be adopted for mitigation
measures that have been imposed upon the map to reduce or avoid significant effects on the
environment.
MITIGATION MONITORING
CEQA, at California Public Resources Code Section 21081.6(a), requires lead agencies to adopt
a reporting and mitigation monitoring program to describe measures which have been
adopted or made a condition of project approval in order to mitigate or avoid significant
effects on the environment. The specific "reporting or monitoring" program required by CEQA is
not required to be included in the Revised Draft EIR, however it will be presented to the Planning
Commission for adoption. Throughout the EIR, however, mitigation measures have been clearly
identified and presented in language that will facilitate establishment of a monitoring and
reporting program. Any mitigation measures adopted by the City of Chico as conditions for
approval of the project will be included in a Mitigation Monitoring Program to verify compliance.
This Mitigation Monitoring Program will be designed to ensure that these measures are carried
out during project implementation.
1.8 TERMINOLOGY OF IMPACTS
Determining the severity of project impacts is fundamental to achieving the objectives of CEQA.
CEQA Guidelines Section 15091 provides that no public agency shall approve a project for
which an EIR has been certified which identifies one or more significant environmental effects of
the project unless the public agency makes one of the following findings:
• Changes or alterations have been required in, or incorporated into, the project which will
avoid or substantially lessen the significant environmental effects identified in the EIR;
• Such changes or alternations are within the responsibility and jurisdiction of another
public agency and such changes have been adopted by such other agency or can
and should be adopted by such other agency; or
• Specific economic, legal, social, technological or other considerations, including
provision of employment opportunities for highly trained workers, make infeasible the
mitigation measure or project alternative identified in the EIR.
If the EIR identifies any significant unmitigated impacts, CEQA Guidelines Section 15093 requires
decision-makers to adopt a statement of overriding considerations that explains why the
benefits of the project outweigh the adverse environmental consequences identified by the EIR.
The level of significance for each impact examined in this EIR was determined by considering
the predicted magnitude of the impact against “significance criteria.” Significance criteria,
which are identified in each chapter under that title, are a set of criteria used by the lead
agency to determine at what level, or “threshold,” an impact would be considered significant.
Thresholds were developed using the following:

1.0 INTRODUCTION
City of Chico Wal-Mart Expansion
April 2009 Revised Draft Environmental Impact Report
1.0-9
• CEQA Guidelines, Appendix G.
• Goals, policies and standards contained in the City of Chico General Plan, General Plan
EIR, Best Practices Technical Manual, and the Chico Municipal Code.
• Regulatory performance standards of city, regional, State, and federal governmental
agencies.
• Policies and standards of special districts.
• Factual or scientific information generally available or produced by studies.
• Consultation with recognized experts on particular environmental issues.
• Generally accepted planning practices.
Four levels of impact significance are recognized by this EIR:
• Less than significant [LTS] impacts would not cause a substantial change in the
environment or are not disruptive enough to require mitigation, because they fall below
the significance threshold.
• Potentially significant [PS] impacts may cause a significant effect on the environment;
however, additional information is needed regarding the extent of the impact. For
CEQA purposes, a potentially significant impact is treated as if it were a significant
impact.
• Significant [S] impacts would cause a substantial adverse change in the physical
conditions of the environment. Significant impacts are identified by the evaluation of the
project effects using specified significance criteria. Mitigation measures are identified to
reduce project effects to the environment.
• Significant and unavoidable [SU] impacts are significant adverse project impacts that
cannot be avoided or mitigated to a less-than-significant level if the project is
implemented.


2.0 ENVIRONMENTAL SETTING,
IMPACTS AND MITIGATION MEASURES

2.0 INTRODUCTION TO ENVIRONMENTAL
IMPACT ANALYSIS


2.0 INTRODUCTION TO THE ENVIRONMENTAL IMPACT ANALYSIS
City of Chico Wal-Mart Expansion
April 2009 Revised Draft Environmental Impact Report
2.0-1
This section describes the format of the issue sections, the level of significance nomenclature
used in this document, and the format of the impact analysis.
For a complete description of the project characteristics, including assumptions used in the
analysis of the created parcel for which no development application is currently before the City,
and the cumulative projects list, refer to Section 3.0 Project Description of the original DEIR.
2.0.1 FORMAT OF ISSUE SECTIONS
Sections in this chapter describe, for each environmental issue area, 1) the environmental setting
as it relates to the specific issue; 2) the regulatory framework for the issue as applicable to the
project; 3) significance criteria and the methodology used to assess impacts; 4) an evaluation of
project-specific and cumulative impacts and identification of mitigation measures; and 5) a
determination of the level of significance after mitigation measures are implemented. Each
section is organized into five parts: Introduction, Setting, Regulatory Framework, Impacts and
Mitigation Measures, and References.
The Introduction provides a brief summary of the purpose of the section and itemizes the main
areas of analysis included in the section.
The Setting describes the existing conditions pertaining to the environmental issue at the
regional, local and project site levels, as appropriate.
The Regulatory Framework identifies plans, policies, laws and regulations at the federal, state
and local levels that are applicable to the particular issue.
The Impacts and Mitigation Measures begins with a description of the standards of significance
used to evaluate project impacts, followed by a description of the methodology used to assess
impacts. Next are the individual impact statements that relate to the standards of significance.
The analysis of the impact as it relates to the project circumstances, including explanatory text
and a summary of technical data necessary to formulate a conclusion, forms the analysis. For
each impact that is identified as being significant, feasible mitigation is identified followed by a
statement of the level of impact that would remain following application of mitigation. This
impact/analysis/mitigation format is again applied to the analysis of any cumulative impacts to
which the project would contribute.
The References lists the documents, personal communications, and other sources of information
cited or otherwise used in the preparation of the section.
2.0.2 DETERMINING LEVEL OF SIGNIFICANCE
Determining the severity of project impacts is fundamental to achieving the objectives of CEQA.
As stated above, CEQA Guidelines Section 15091 requires that decision-makers shall not
approve a project for which an EIR has been prepared which identifies one or more significant
environmental effects of the project unless changes or alterations have been required which will
avoid or substantially lessen the effects, or other specified findings are made. The level of
significance for each impact examined in this EIR was determined by considering the predicted
magnitude of the impact against a significance threshold, the standards of significance.
Thresholds are identified in each chapter under Significance Criteria using the four levels of
impact significance recognized by this EIR:

2.0 INTRODUCTION TO THE ENVIRONMENTAL IMPACT ANALYSIS
Wal-Mart Expansion City of Chico
Revised Draft Environmental Impact Report April 2009
2.0-2
Less than Significant [LTS], Potentially Significant [PS], Significant [S], and Significant and
Unavoidable [SU].
2.0.3 IMPACT AND MITIGATION FORMAT
The standard format used to present the evaluation of impacts is as follows:
Impact 4.0.1 The impact number identifies the section of the report and the sequential
order of the impact within that section. Following the impact number is the
impact statement, which identifies the potential impact [LTS, PS, S, SU].
The identified impact is then discussed in more detail. At the end of the discussion, a level of
significance is assigned to the impact. If the impact is identified as less than significant, there will
be no further evaluation of the impact. If the impact is identified as potentially significant or
significant, proposed mitigation measures will follow. Significant and unavoidable impacts may
or may not have proposed mitigation measures.
Mitigation Measures
In some cases, following the impact discussion, reference is made to state and federal
regulations and agency policies that would fully or partially mitigate the impact. Also, policies
and programs from applicable local land use plans that partially or fully mitigate the impact
may be cited. These policies and regulations shall be considered as part of the package of
recommended mitigation measures.
Project-specific and cumulative mitigation measures, beyond those contained in other
documents, are described in the format presented below:
MM 2.0.1a Project-specific mitigation is identified that would reduce the impact to the
lowest degree possible. The mitigation number links the mitigation to the
impact; the letter identifies the sequential order of the mitigation for that
impact.
Timing/Implementation: Identifies the timing stage when the mitigation
measure or permit is to be implemented (e.g.,
upon submission of final map, prior to issuance
of building permit).
Enforcement/Monitoring: Identifies the department or agency with the
responsibility for implementing the mitigation
measure.
The discussion concludes by describing how the mitigation measures presented above will
reduce the impact. It then identifies the resulting level of significance of the impact following
mitigation.
2.04 SUMMARY OF REVISIONS
CEQA Guidelines section 15088.5(g) requires that, when re-circulating a revised EIR, it shall
include a summary of the changes made to the previously circulated EIR.

2.0 INTRODUCTION TO THE ENVIRONMENTAL IMPACT ANALYSIS
City of Chico Wal-Mart Expansion
April 2009 Revised Draft Environmental Impact Report
2.0-3
The changes made in this revised draft EIR compared to the DEIR previously circulated include
the following:
• The addition of a new section entitled Energy Consumption
• The addition of a new section entitled Climate Change
• A new section entitled Traffic and Circulation which will replace the section with the
same title that was included in the previously circulated DEIR. The new Traffic and
Circulation section includes updated impact analyses for both short term and
cumulative impacts and corresponding updates to mitigation measures. The time period
used for cumulative impact analysis for specified impacts at intersections has been
changed from 2018 to 2020.


2.1 CLIMATE CHANGE


2.1 CLIMATE CHANGE
City of Chico Wal-Mart Expansion
April 2009 Revised Draft Environmental Impact Report
2.1-1
This section of the Revised EIR describes the potential impact the proposed project would have
on global warming and climate change. This section discusses greenhouse gas emissions and
their effect on the earth’s existing climate, as well as how the projected change in climate
would affect California while also analyzing the project’s greenhouse gas emissions.
2.1 CLIMATE CHANGE
2.1.1 Cumulative Climate Change Setting
Greenhouse Gases and Climate Change
To fully understand global climate change it is important to recognize the naturally occurring
“greenhouse effect” and to define the greenhouse gases that contribute to this phenomenon.
The temperature on Earth is regulated by this “greenhouse effect,” which is so named because
the Earth's atmosphere acts like a greenhouse, warming the planet in much the same way that
an ordinary greenhouse warms the air inside its glass walls. Like glass, the gases in the
atmosphere let in light yet prevent heat from escaping.
Greenhouse gases (GHG) are naturally occurring gases such as water vapor, carbon dioxide
(CO2), methane (CH4) and nitrous oxide (N2O) that absorb heat radiated from the Earth’s
surface. Greenhouse gases -- carbon dioxide, methane, nitrous oxide, and others -- are
transparent to certain wavelengths of the Sun's radiant energy, allowing them to penetrate
deep into the atmosphere or all the way to the Earth's surface (NASA, 2007). Clouds, ice caps,
and particles in the air reflect about 30 percent of this radiation, but oceans and land masses
absorb the rest (70 percent of the radiation received from the Sun) before releasing it back
toward space as infrared radiation. The greenhouse gases and clouds effectively prevent some
of the infrared radiation from escaping; they trap the heat near Earth's surface where it warms
the lower atmosphere. If this natural barrier of atmospheric gases were not present, the heat
would escape into space, and Earth's average global temperatures could be as much as 61
degrees Fahrenheit cooler (NASA, 2007).
In addition to natural sources, human activities are exerting a major and growing influence on
climate by changing the composition of the atmosphere and by modifying the land surface.
Particularly, the increased consumption of fossil fuels (natural gas, coal, gasoline, etc.) has
substantially increased atmospheric levels of greenhouse gases. Measured atmospheric levels of
certain greenhouse gases such as carbon dioxide, methane, and nitrous oxide have risen
substantially in recent decades (Miller, 2000). This increase in atmospheric levels of greenhouse
gases unnaturally enhances the “greenhouse effect” by trapping more infrared radiation as it
rebounds from the Earth’s surface and thus trapping more heat near the Earth’s surface.
According to the U.S. Environmental Protection Agency (EPA), the Earth's average surface
temperature has increased by about 1.2 to 1.4ºF since 1900. The warmest global average
temperatures on record have all occurred within the past 15 years, with the warmest two years
being 1998 and 2005. Eleven of the last 13 years rank among the hottest years on record (since
1850, when reliable worldwide temperature measurements began) (IPCC, 2007). Most of the
warming in recent decades is likely the result of human activities. Other aspects of the climate
are also changing such as rainfall patterns, snow and ice cover, and sea level.
Many complex mechanisms interact within Earth’s energy budget to establish the global
average temperature. For example, a change in ocean temperature would be expected to
lead to changes in the circulation of ocean currents, which, in turn would further alter ocean

2.1 CLIMATE CHANGE
City of Chico Wal-Mart Expansion
April 2009 Revised Draft Environmental Impact Report
2.1-2
temperatures. There is uncertainty about how some factors could affect global climate change
because they have the potential to both enhance and neutralize future climate warming. For
instance aerosols, including particulate matter, reflect sunlight back to space. As particulate
matter attainment designations are met, and fewer emissions of particulate matter occur, the
cooling effect of anthropogenic aerosols would be reduced, and the greenhouse effect would
be further enhanced. Similarly, aerosols act as cloud condensation nuclei, aiding in cloud
formation and increasing cloud lifetime. Clouds can efficiently reflect solar radiation back to
space (see discussion of the cloud effect below). As particulate matter emissions are reduced,
the indirect positive effect of aerosols on clouds would be reduced, potentially further
amplifying the greenhouse effect.
Another mechanism affecting climate is cloud cover. As global temperature rises, the ability of
the air to hold moisture increases, facilitating cloud formation. If an increase in cloud cover
occurs at low or middle altitudes, resulting in clouds with greater liquid water content such as
stratus or cumulus clouds, more radiation would be reflected back to space, resulting in a
negative feedback mechanism, wherein the side effect of more cloud cover resulting from
global warming acts to balance further warming. If clouds form at higher altitudes in the form of
cirrus clouds, however, these clouds actually allow more solar radiation to pass through than
they reflect, and ultimately they act as a GHG themselves. This results in a positive feedback
mechanism in which the side effect of global warming acts to enhance the warming process.
This feedback mechanism, known as the “cloud effect” contributes to uncertainties associated
with projecting future global climate conditions.
Other mechanisms include permafrost and polar and sea ice. As global temperature continues
to rise, CH4 gas currently trapped in permafrost, are released into the atmosphere when areas of
permafrost thaw. Thawing of permafrost attributable to global warming accelerates and
enhances global warming trends. Additionally, as the surface area of polar and sea ice
continues to diminish, the Earth’s albedo, or reflectivity, decreases. More incoming solar
radiation is absorbed by the Earth rather than being reflected back to space, further enhancing
the greenhouse effect. The scientific community is still studying these and other positive and
negative feedback mechanisms to better understand their potential effects on global climate
change.
IMPLICATIONS OF GLOBAL CLIMATE CHANGE
Global Implications
Recognizing the problem of global climate change, the World Meteorological Organization
(WMO) and the United Nations Environment Programme (UNEP) established the
Intergovernmental Panel on Climate Change (IPCC) in 1988. It is open to all members of the
United Nations and WMO. The role of the IPCC is to assess on a comprehensive, objective, open
and transparent basis the scientific, technical and socio-economic information relevant to
understanding the scientific basis of risk of human-induced climate change, its potential impacts
and options for adaptation and mitigation. According to climate models, the IPCC projects that
the Earth’s average surface temperature should rise 1.8 – 6.3 ºF before the year 2100. If the
atmospheric concentration of CO2 doubles from its late 1700’s level of 280 parts per million to 560
parts per million, the most likely rise in temperature would be about 3.6 ºF. This may not seem like
a significant increase, yet even at the lowest projected increase of 1.8 ºF, the Earth would be
warmer than it has been for 10,000 years (Miller, 2000).

2.1 CLIMATE CHANGE
City of Chico Wal-Mart Expansion
April 2009 Revised Draft Environmental Impact Report
2.1-3
The IPCC Fourth Assessment Report’s Working Group I Summary for Policymakers (Report)
synthesizes current scientific understanding of global climate change and projects future
climate change using the most comprehensive set of well-established global climate models.
The Report incorporates findings of the current effects of global climate change. These finding
include:
• The intensity of tropical cyclones (hurricanes) in the North Atlantic has increased over the
past 30 years, which correlates with increases in tropical sea surface temperatures.
• Droughts have become longer and more intense, and have affected larger areas since
the 1970s, especially in the tropics and subtropics.
• Since 1900 the Northern Hemisphere has lost seven percent of the maximum area
covered by seasonally frozen ground.
• Mountain glaciers and snow cover have declined worldwide.
• Satellite data since 1978 show that the extent of Arctic sea ice during the summer has
shrunk by more than 20 percent.
• Since 1961, the world’s oceans have been absorbing more than 80 percent of the heat
added to the climate, causing ocean water to expand and contributing to rising sea
levels. Between 1993 and 2003 ocean expansion was the largest contributor to sea-level
rise.
• Melting glaciers and losses from the Greenland and Antarctic ice sheets have also
contributed to recent sea-level rise.
An enhanced greenhouse effect will generate new patterns of microclimate and will have
significant impacts on the economy, environment, and transportation infrastructure and
operations due to increased temperatures, intensity of storms, sea level rise, and changes in
precipitation. Impacts may include flooding of tunnels, coastal highways, runways, and railways;
buckling of highways and railroad tracks, submersion of dock facilities, and shift in agriculture to
areas that are now cooler. Such prospects will have strategic security as well as transportation
implications.
Climate change affects public health and the environment. Increased smog and emissions,
respiratory disease, reduction in the State’s water supply, extensive coastal damage, and
changes in vegetation and crop patterns have been identified as effects of climate change.
The impacts of climate change are broad-ranging and interact with other market failures and
economic dynamics, giving rise to many complex policy problems. If global greenhouse gas
emissions continue rising on their current trajectory, the costs of climate change could eventually
total 5 - 20 percent of the annual global gross domestic product (GDP) (Caltrans, page 4). The
findings are the latest in a string of reports warning that the rate of carbon dioxide accumulating
in the atmosphere is increasing at an alarming pace.
California Implications
Climate change is a global problem, and GHGs are global pollutants, unlike criteria air
pollutants and TACs, which are pollutants of regional and local concern. Worldwide, California is
the 12th to 16th largest emitter of CO2, and is responsible for approximately two percent of the
world’s CO2 emissions (CEC, 2006a, 2006b). In 2004, California produced 492 million gross metric
tons of carbon dioxide-equivalent (CEC, 2006a).

2.1 CLIMATE CHANGE
City of Chico Wal-Mart Expansion
April 2009 Revised Draft Environmental Impact Report
2.1-4
Increased global average temperature increases ocean temperatures and the Pacific Ocean
strongly influences the climate within California. If the temperature of the ocean warms, it is
anticipated that the winter snow season would be shortened. Snowpack in the Sierra Nevada
provides both water supply (runoff) and storage (within the snowpack before melting), which is
a major source of supply for the state. According to a California Energy Commission (CEC)
report, the snowpack portion of the supply could potentially decline by 70 to 90 percent by the
end of the 21st century (CEC, 2006c). This phenomenon could lead to significant challenges
securing an adequate water supply for a growing state population.
Further, the increased ocean temperature could result in increased moisture flux into the state;
however, since this would likely increasingly come in the form of rain rather than snow in the high
elevations, increased precipitation could lead to increased potential and severity of flood
events, placing more pressure on California’s levee/flood control system. Sea level has risen
approximately seven inches during the last century and, according to the CEC report, it is
predicted to rise an additional 22-35 inches by 2100, depending on the future GHG emissions
levels (CEC 2006c). If this occurs, resultant effects could include increased coastal flooding,
saltwater intrusion and disruption of wetlands (CEC, 2006c). As the existing climate throughout
California changes over times, mass migration of species, or worse, failure of species to migrate
in time to adapt to the perturbations in climate, could also result.
According to the California Environmental Protection Agency, the climate changes for global
warming could affect agriculture, the fishing industry, California’s coastline, forests, and
ecosystems, increase air pollution, and energy production (CalEPA, 2002).
Agriculture
Potential impacts, such as reduced water supply, more severe droughts, more winter floods, and
drier growing seasons will affect California’s agriculture. Many farms, especially in the fruit and
nut business require long-term investments making fast adaptation difficult, and could thus
experience serious losses if decisions continue to be made with no regard to expected climate
changes.
Fishing
Studies found that as a result of changes in ocean conditions, the distribution and abundance of
major fish stocks will change substantially. Impacts to fisheries related to El Nino/ Southern
Oscillation illustrate how climate directly impacts marine fisheries on short term scales. Higher sea
surface temperatures in 1997-1998 during the El Nino had a great impact on market squid,
California’s largest fishery by volume. The California Regional Assessment reports that landings
fell to less than 1,000 metric tons in that season, down from 110,000 tons in the 1996-1997 season.
Other unusual events also occurred such as poor salmon returns, a series of plankton blooms,
and seabird die-offs.
Coastline
With climate changes, recreational facilities and developed coastlines will also be more
vulnerable to hurricanes, storm surges, flooding increases. Increasing population growth in
coastal areas is a reason for further concern, since these areas could be more vulnerable to
climate change impacts. Impacts of expected sea level rise and increased storm surges are
numerous. Beachfront homes and harbors as well as wetlands may flood. Sewage systems may
be overwhelmed by storm runoff and high tides. Coastal airports are vulnerable to flooding (San
Francisco, Oakland and Santa Barbara). Jetties and seawalls may have to be raised and
strengthened to protect harbors which are used for shipping, recreation, and tourism.

2.1 CLIMATE CHANGE
City of Chico Wal-Mart Expansion
April 2009 Revised Draft Environmental Impact Report
2.1-5
Forests
The California Regional Assessment notes that an increase in the number and extent of areas
burned by wildfires in recent years, and modeling results under changing climate conditions
suggest that fires may be hotter, move faster, and be more difficult to contain under future
climate conditions. The factors which contribute to the risk of catastrophic fires (fuel loads, high
temperatures, dry conditions, and wind) are typically present already in summer and fall seasons
in California, but can exist at other times of the year, especially in drought conditions. Public
safety is an issue as more home and tourism developments on coastal hills and mountains and
the foothills and higher elevations in the Sierra Nevada are highly susceptible to catastrophic
wild fires.
Ecosystems
The current distribution, abundance, and vitality of species and habitats are strongly dependent
on climatic (and microclimatic) conditions. Climate change is expected to result in warmer
temperatures year-round, accompanied by substantially wetter winters. Rising sea level will
significantly affect coastal wetlands because they are mostly within a few feet of sea level. As
the sea rises, these wetlands will move inland. The overall acreage of wetlands will be reduced
due to constraints by existing urban development and steeper slopes immediately inland of
existing wetlands. Tidal rivers, estuaries, and relatively flat shoreline habitats will be more subject
to damage by flooding and erosion. More severe storm surges from the ocean, due to higher
sea levels, combined with higher river runoff could significantly increase flood levels by more
than the rise in sea level alone. Erosion of beaches would decrease habitat for beach-
dependent species, such as seals, shorebirds, and endangered species (for example, snowy
plover and least tern). Aquatic habitats are also likely to be significantly affected by climatic
changes. Most fish have limits to how hot or cold the water can be before they must either find
more hospitable temperatures or die. As temperatures warm, many fish will have to retreat to
cooler waters.
Changes in temperature and precipitation patterns would also shift California’s current climate
zones, and thus habitats associated with these zones, northward by approximately 100 - 400
miles, as well as upwards in elevation by 500-1500 feet. Global climate change would alter the
composition, structure and arrangement of the vegetation cover of the state (forest and
wildland). Species distribution would move geographically as the climate changes, with forest
stands, woodlands and grassland species predicted to move northward and higher in elevation.
The entire vegetative community may be affected if non-native invasive species occupy sites
and replace native plants. Outbreaks of insects and diseases could compromise forest health
and the capability of the forest stands reproduce and to store carbon on a landscape basis.
Forest fires are likely to become more frequent and severe if soils become drier. Changes in pest
populations could further increase the stress on forests.
Air Quality
Projected climate changes will impact the quality of California's air, public health, and
environment. Higher temperatures increase the formation of ground level ozone and particulate
matter, making it more difficult to meet the health-based air quality standards for these
pollutants. Ground-level ozone has been shown to aggravate existing respiratory illnesses such as
asthma, reduce lung function, and induce respiratory inflammation. Ambient ozone also
reduces agricultural crop yields and impairs ecosystem health.

2.1 CLIMATE CHANGE
City of Chico Wal-Mart Expansion
April 2009 Revised Draft Environmental Impact Report
2.1-6
The particulate matter of most concern – PM10 – has a diameter smaller than 10 micrometers
and can easily pass into the lung, contributing to the development of lung tissue damage. PM10
has been implicated in exacerbation of cardiovascular disease, asthma, other respiratory
diseases, and associated with increased mortality. Air pollution is also made worse by increases
in natural hydrocarbon emissions and evaporative emissions of fuels and solvents which leads to
higher levels of ozone and PM10 during hot weather. Warmer temperatures that cause increased
use of air conditioners can cause increased air pollutants from power plants and from vehicle
operation. In addition, warming, drying, and increased winds could mean hotter, harder-to-
control wildfires. These wildfires could result in increased levels of fine particulate matter that
could also exceed State and federal standards and harm public health.
Electricity Generation
California's electricity generation is currently relatively efficient when it comes to emissions of
greenhouse gases. The national average for the electricity generation share of total greenhouse
gas emissions is approximately 40 percent, while California electricity accounts for only 16
percent of statewide emissions. This is in part due to California’s significant amount of imported
electricity, mild climate, and lack of energy-intensive industry. Over the past two decades,
California has developed one of the largest and most diverse renewable electricity generation
industries in the world. However, changes in climate of the magnitude predicted by the
Intergovernmental Panel of Climate Change would substantially affect electricity generation
throughout California and the entire Western States grid, particularly for hydroelectric facilities.
Less snowpack would result in lower levels of hydro generation in the summer and fall seasons
due to reduced runoff in those seasons. Additional hydropower may be available during the
winter and the spring. However, on balance hydropower is more useful and valuable within the
grid mix of generation sources when it is available throughout the peak summer and fall seasons.
The Natural gas distribution system may also be damaged because of landslides and fires.
Flooding could also impact pipelines, wells and related petroleum extraction equipment.
Warmer weather would result in an increased demand for electricity for cooling appliances in
homes, and businesses.
2.1.2 REGULATORY FRAMEWORK
STATE
Assembly Bill 1493
In 2002, then-Governor Gray Davis signed Assembly Bill (AB) 1493. AB 1493 requires that the
California Air Resources Board (ARB) develop and adopt, by January 1, 2005, regulations that
achieve “the maximum feasible reduction of greenhouse gases emitted by passenger vehicles
and light-duty truck and other vehicles determined by the ARB to be vehicles whose primary use
is noncommercial personal transportation in the state.”
Executive Order S-3-05
Executive Order S-3-05, which was signed by Governor Schwarzenegger in 2005, proclaims that
California is vulnerable to the impacts of climate change. It declares that increased
temperatures could reduce the Sierra’s snowpack, further exacerbate California’s air quality
problems, and potentially cause a rise in sea levels. To combat those concerns, the Executive
Order established total greenhouse gas emission targets. Specifically, emissions are to be
reduced to the 2000 level by 2010, the 1990 level by 2020, and to 80 percent below the 1990
level by 2050.

2.1 CLIMATE CHANGE
City of Chico Wal-Mart Expansion
April 2009 Revised Draft Environmental Impact Report
2.1-7
The Executive Order directed the Secretary of the California Environmental Protection Agency
(CalEPA) to coordinate a multi-agency effort to reduce greenhouse gas emissions to the target
levels. The Secretary will also submit biannual reports to the governor and state legislature
describing: (1) progress made toward reaching the emission targets; (2) impacts of global
warming on California’s resources; and (3) mitigation and adaptation plans to combat these
impacts. To comply with the Executive Order, the Secretary of the CalEPA created a Climate
Act Team (CAT) made up of members from various state agencies and commission. CAT
released its first report in March 2006. The report proposed to achieve the targets by building on
voluntary actions of California businesses, local government and community actions, as well as
through state incentive and regulatory programs.
Assembly Bill 32, the California Climate Solutions Act of 2006
In September 2006, Governor Arnold Schwarzenegger signed AB 32, the California Climate
Solutions Act of 2006. AB 32 requires that statewide GHG emissions be reduced to 1990 levels by
the year 2020. This reduction will be accomplished through an enforceable statewide cap on
GHG emissions that will be phased in starting in 2012. To effectively implement the cap, AB 32
directs ARB to develop and implement regulations to reduce statewide GHG emissions from
stationary sources. AB 32 specifies that regulations adopted in response to AB 1493 should be
used to address GHG emissions from vehicles. However, AB 32 also includes language stating
that if the AB 1493 regulations cannot be implemented, then ARB should develop new
regulations to control vehicle GHG emissions under the authorization of AB 32.
AB 32 requires that ARB adopt a quantified cap on GHG emissions representing 1990 emissions
levels and disclose how it arrives at the cap; institute a schedule to meet the emissions cap; and
develop tracking, reporting, and enforcement mechanisms to ensure that the state achieves
reductions in GHG emissions necessary to meet the cap. AB 32 also includes guidance to
institute emissions reductions in an economically efficient manner and conditions to ensure that
businesses and consumers are not unfairly affected by the reductions.
Senate Bill 1368
SB 1368 is the companion bill of AB 32 and was signed by Governor Schwarzenegger in
September 2006. SB 1368 requires the California Public Utilities Commission (PUC) to establish a
greenhouse gas emission performance standard for baseload generation from investor owned
utilities by February 1, 2007. The California Energy Commission (CEC) must establish a similar
standard for local publicly owned utilities by June 30, 2007. These standards cannot exceed the
greenhouse gas emission rate from a baseload combined-cycle natural gas fired plant. The
legislation further requires that all electricity provided to California, including imported electricity,
must be generated from plants that meet the standards set by the PUC and CEC.
2.1.3 CUMULATIVE IMPACTS AND MITIGATION MEASURES
STANDARDS OF SIGNIFICANCE
While AB 32 requires ARB to develop thresholds of significance for GHGs, that process has not yet
been completed and no air district in California, including the Butte County Air Quality
Management District, has identified a significance threshold for GHG emissions or a
methodology for analyzing air quality impacts related to greenhouse gas emissions at this time.
The state has identified 1990 emission levels as a goal through adoption of AB 32. To meet this
goal, California would need to generate lower levels of GHG emissions than current levels.
However, no standards have yet been adopted quantifying 1990 emission targets. It is

2.1 CLIMATE CHANGE
City of Chico Wal-Mart Expansion
April 2009 Revised Draft Environmental Impact Report
2.1-8
recognized that for most projects there is no simple metric available to determine if a single
project would help or hinder meeting the AB 32 emission goals. In addition, at this time AB 32
only applies to stationary source emissions. Consumption of fossil fuels in the transportation sector
accounted for over 40 percent of the total GHG emissions in California in 2004. Current
standards for reducing vehicle emissions considered under AB 1493 call for “the maximum
feasible reduction of greenhouse gases emitted by passenger vehicles and light-duty trucks and
other vehicles,” and do not provide a quantified target for GHG emissions reductions for
vehicles.
Emitting CO2 into the atmosphere is not itself an adverse environmental affect. It is the
cumulative increased concentration of CO2 in the atmosphere resulting in global climate
change and the associated consequences of climate change that results in adverse
environmental affects (e.g., sea level rise, loss of snowpack, severe weather events). Although it
is possible to generally estimate a project’s incremental contribution of CO2 into the
atmosphere, it is typically not possible to determine whether or how an individual project’s
relatively small incremental contribution might translate into physical effects on the environment.
Given the complex interactions between various global and regional-scale physical, chemical,
atmospheric, terrestrial, and aquatic systems that result in the physical expressions of global
climate change, it is impossible to discern whether the presence or absence of CO2 emitted by
the project would result in any altered conditions.
Given the challenges associated with determining a project-specific significance criteria for
GHG emissions when the issue must be viewed on a global scale, a quantitative significance
criteria is not proposed for the project. For this analysis, the Standard of Significance will be as
follows:
• A project’s incremental contribution to global climate change will be considered
significant if due to the size or nature of the project it would generate a substantial
increase in GHG emissions that would impede the State’s attainment of AB 32’s goal of
reducing GHG emissions to 1990 levels by the year 2020 when combined with the GHG
emissions of other prior, current, and reasonably foreseeable projects with the State of
California.
METHODOLOGY
GHG emissions associated with the Wal-Mart Expansion project were estimated using CO2
emissions as a proxy for all GHG emissions. This is consistent with the current reporting protocol of
the California Climate Action Registry (CCAR). Calculations of GHG emissions typically focus on
CO2 because it is the most commonly produced GHG in terms of both number of sources and
volume generated, and because it is among the easiest GHGs to measure. However, it is
important to note that other GHGs have a higher global warming potential than CO2. For
example, one pound of methane has an equivalent global warming potential of 21 pounds of
CO2 (California Climate Action Registry 2006).
While there are various methods for determining the potential GHG emissions of a specific
project, at this time there is not an approved ARB method. For the Wal-Mart Expansion project,
two different methods were used, based on the emission source (buildings or vehicles) to
ascertain the potential CO2 emissions at project buildout. Discussed below are the estimated
CO2 emissions for the project buildings and vehicle trips resulting from the project. The
methodology used to determine the CO2 emissions of each of these categories is discussed
within that category analysis.

2.1 CLIMATE CHANGE
City of Chico Wal-Mart Expansion
April 2009 Revised Draft Environmental Impact Report
2.1-9
IMPACTS AND MITIGATION MEASURES
Potential Increase in Long-Term Atmospheric Greenhouse Gas Emissions
Impact 2.1.1 The project, in addition to existing, approved, proposed and reasonably
foreseeable development in the Northern Sacramento Valley Air Basin, may
contribute to an increase in greenhouse gas (GHG) emissions in the Earth’s
atmosphere. Higher concentrations of GHGs have been linked to the
phenomenon of climate change. This could be a cumulatively considerable
impact on the state’s GHG reduction efforts.
Human activities are exerting a major and growing influence on the climate by changing the
composition of the atmosphere through the increased consumption of fossil fuels (natural gas,
coal, gasoline, etc.) for energy production and transportation fuel, which has substantially
increased atmospheric levels of greenhouse gases. The amount of GHG emissions produced
from commercial buildings is related to the amount of energy that is used to operate the
buildings, such as electricity, natural gas, and fuel oil.
Commercial Buildings
The existing Wal-Mart store is 125,889 square feet. The proposed expansion project will add an
additional 97,556 square feet to the existing Wal-Mart store, most of which will be added on the
southern side of the store with some new construction also taking place on the west and east
elevations. The total area of the Wal-Mart store after the expansion would be 223,445 square
feet.
The following parameters were used to calculate the amount of CO2 emitted by the expanded
commercial building of the project area:
• The CO2 emissions for the expanded Wal-Mart building are not CO2-equivalent emissions1
but only CO2 emissions.
• CO2 emissions estimates for project building are based solely on electricity use and no
other energy source. These estimates are weighted according to coal and natural gas-
based electricity generation in California.
• Non-residential building annual energy intensity is based on the year 2002 for the Pacific
Gas and Electric (PG&E) service area as a whole and is estimated to be 12.95 kWh/ft2/yr2
as identified in the PG&E summary table for the California Commercial End-Use Survey
report, available at http://capabilities.itron.com/CeusWeb/Chart.aspx.
• CO2 emissions factors for the uses of the project are based the EPA Power Profiler for
commercial uses available at http://www.epa.gov/cleanenergy/powerprofiler.htm.
1 Carbon dioxide equivalents provide a universal standard of measurement against which the impacts of releasing
different greenhouse gases can be evaluated. Every greenhouse gas has a Global Warming Potential, a measurement
of the impact that a particular gas has on the additional heat/energy which is retained in the Earth's ecosystem through
the addition of this gas to the atmosphere (IETA, http://www.ieta.org/ieta/www/pages/index.php?IdSitePage=123). For
example, CO2 has a Global Warming Potential of 1 while methane (CH4) has a Global Warming Potential of 21.
Therefore, one pound of CH4 would have a carbon dioxide equivalent of 21 pounds.
2 kWh/ft2/yr = kilowatt-hour per square foot per year

2.1 CLIMATE CHANGE
City of Chico Wal-Mart Expansion
April 2009 Revised Draft Environmental Impact Report
2.1-10
Table 2.1-1 illustrates the estimated CO2 emissions for the project under existing and post-
expansion conditions. This calculation does not include vehicle trips for the project. It is
estimated that expansion of the existing Wal-Mart store will result in the production of 2,569,019
lbs/year of CO2. This is an increase of 1,121,633 lbs/year over existing conditions.
TABLE 2.1-1
WAL-MART BUILDING: EXISTING AND EXPANSION EMISSIONS
Condition Area CO2 Emission1
Existing Wal-Mart 125,889 sq. ft. 1,447,386 lbs/yr
Post-Expansion Wal-Mart 223,445 sq. ft. 2,569,019 lbs/yr
Difference 97,556 sq. ft. 1,121,633 lbs/yr
Source: EPA Power Profiler.
Notes: 1) CO2 emissions are passed on the EPA Power Profiler program. The program’s output is based on a monthly 1 kWh average use.
Traffic
Omni-Means transportation engineers provided data that can be used to estimate CO2
emissions from project-generated vehicle trips. According to Omni-Means, the proposed Wal-
Mart Expansion project could potentially result in 4,883 new daily vehicle trips per day (see Table
2.1-2). Assuming a trip rate of seven miles per trip,3 the proposed project would generate an
average of 34,181 vehicle miles traveled (VMT) per day, or approximately 12.5 million VMT
annually. Assuming an emissions factor for future CO2 emissions from vehicles of approximately
366 grams (0.807 pounds) of CO2 per mile (California Air Resources Board, 2002), approximately
5,034 tons (10,068,160 lbs) of CO2 per year could potentially be generated by all new vehicle
trips under the proposed project.
Table 2.1-2 illustrates the vehicle emissions that could potentially result from development
allowed under the proposed project.
TABLE 2.1-2
VEHICLE CO2 EMISSIONS UNDER PROPOSED PROJECT
CO2 Emission (lbs) Source Daily Vehicle Trips Daily Vehicle Miles Traveled
Daily Annually
Post-Expansion Wal-Mart Store
(223,445 square feet of
commercial)
4,883 34,181 27,584 10,068,160
Note that although this future CO2 emissions factor does assume certain reductions in vehicle
emissions due to future vehicle models operating more efficiently, it does not take into account
additional vehicle emission reductions that might take place in response to AB 1493, if mobile
source emission reductions are ultimately implemented through this legislation.
3 Default value used by URBEMIS Version 9.2.4, Environmental Management Software Air Quality monitoring software.
Rimpo and Associates, 2007.

2.1 CLIMATE CHANGE
City of Chico Wal-Mart Expansion
April 2009 Revised Draft Environmental Impact Report
2.1-11
Total CO2 Emissions
Table 2.1-3 illustrates the total amount of CO2 emissions as a result of implementation of the
proposed project. According to the methodologies listed previously for the identification of CO2
emissions, expansion of the existing Wal-Mart store will result in an increase in CO2 emissions of
0.006 million metric tons (MMT) annually. In comparison, the amount of CO2 emitted in California
in 2004 was 334.9 MMT. TABLE 2.1-3
TOTAL PROJECT CO2 EMISSIONS
Source CO2 Emission (lbs/yr) Million Metric Tons (MMT)
Post-Expansion Wal-Mart Store 2,569,019 lbs/yr 0.001 MMT
Vehicles 10,068,160 lbs/yr 0.005 MMT
Total 12,637,179 lbs/yr 0.006 MMT
California 2004 total CO2 Emissions 334.9 MMT
Source: PMC; CEC 2006a Table 6
The analysis methodology used for the emissions estimate assumes that all emissions sources are
new sources and that emissions from these sources are 100 percent additive to existing
conditions. This is a standard approach taken for air quality analyses. In many cases, such an
assumption is appropriate because it is impossible to determine whether emissions sources
associated with a project move from outside the air basin and are in effect new emissions
sources, or whether they are sources that were already in the air basin and just shifted to a new
location. However, because the effects of GHGs are global, a project that merely shifts the
location of a GHG-emitting activity (e.g., where people live, where vehicles drive, or where
companies conduct business) would result in no net change in global GHG emissions levels.
For example, if a substantial portion of California’s population migrated from the South Coast Air
Basin to the North Coast Air Basin, this would likely result in decreased emissions in the South
Coast Air Basin and increased emissions in the North Coast Air Basin, but little change in overall
global GHG emissions. However, if a person moves from one location where the land use
pattern requires substantial vehicle use for day-to-day activities (commuting, shopping, etc.) to
a new development that promotes shorter and fewer vehicle trips, more walking, and overall
less energy usage, then it could be argued that the new development would result in a
potential net reduction in global GHG emissions.
It is impossible to know at this time whether residents in the City of Chico will have longer or
shorter commutes relative to their existing homes; whether they will walk, bike, and use public
transportation more or less than under existing circumstances; and whether their overall driving
habits will result in higher or lower VMT. Much of the vehicle generated CO2 emissions attributed
to the project could simply be from vehicles currently emitting CO2 at an existing location
moving to the project site, and not from new vehicle emissions sources relative to global climate
change. Therefore, the actual CO2 contribution resulting from the proposed project would likely
be much less than the 0.006 million metric tons of CO2 per year calculated above.
According to the project Applicant, several sustainable features will be incorporated into the
expansion of the existing Wal-Mart store resulting in reduced energy consumption and several
aspects of the project are aimed at the increase in efficiency of energy consumption. These
aspects include:

2.1 CLIMATE CHANGE
City of Chico Wal-Mart Expansion
April 2009 Revised Draft Environmental Impact Report
2.1-12
• Daylighting (skylights/dimming): The expansion area will include a daylighting system,
which automatically and continually dims all of the lights as the daylight contribution
increases. This will apply only to the expansion area due to an existing ceiling in the
general merchandise sales area which does not include skylights. According to the
Applicant, Wal-Mart has approximately 2,100 stores with this system in place which is
resulting in an annual savings of approximately 600,627,600 Kilowatt hours (KwH).
• Energy efficient HVAC units: 30 of the 36 existing HVAC units will remain; while 17 new
“super” high efficiency packaged HVAC units will be added with the new expansion.
According to the project Applicant, these new units are rated between 12.1 to 14.3
Energy Efficiency Ration (EER) while the industry standard EER is 9.0.
• Central Energy Management: The store will be equipped with an energy management
system that will be monitored and controlled from the Wal-Mart Home Office in
Bentonville, Arkansas. The system enables its operators to monitor energy usage, analyze
refrigeration temperatures, observe HVAC and lighting performance, and adjust lighting,
temperature, and/or refrigeration set points 24 hours per day, seven days per week.
• Light Sensors: The store will include occupancy sensors in non-sales floor areas. These
sensors detect activity in a room and automatically turn off the light when the space is
unoccupied.
• Food Displays: The store will not use heating elements in the freezer doors to combat
condensation. Instead, a film will be used on the doors. This film will serve the same
purpose yet requires no energy. The food displays will also be equipped with motion
activated LED illumination. The lights will turn off automatically when the areas around
the food displays are unoccupied.
• Water Heating: The store will capture waste heat from the refrigeration equipment to
heat water for the kitchen prep areas of the store. According to the Applicant, this
measure represents energy savings of 165 million British thermal units (BTU’s) per year. The
term "BTU" is used to describe the heat value (energy content) of fuels, and also to
describe the power of heating and cooling systems, such as furnaces, stoves, barbecue
grills, and air conditioners.
• White Roofs: The store will include a “white” membrane roof versus most applications
that are a darker color. This will include replacement of the existing roof. According to
the Applicant, the high solar reflectivity of this membrane results in lowering the “cooling”
load by about 10 percent. The use of roofing materials with a high Solar Reflectance
Index (SRI) reduces heat islands effects (thermal gradient difference between
developed and undeveloped areas) to minimize impact on microclimate and human
and wildlife habitat
• Interior Lighting Retrofit Program: The existing sales floor lighting fixtures were previously
retrofitted in include T-8 fluorescent lamps and electronic ballasts. The expansion plans
have been developed to include the T-8 fluorescent lamps and electronic ballasts in the
expanded areas of the store. All existing fixtures that are not currently T-8 lamps will be
replaced to match the retrofit fixtures. According to the University of Michigan
Occupational Safety and Environmental Health Pollution Prevention Program, the T-8
lamps are rated at 32 watts; while the older T-12 lamps were rated at 40 watts yielding a
20 percent energy savings with the use of T-8 lamps. In addition, the new T-8 lamp
provides a higher quality of illumination than the T-12 lamp it replaces (University of
Michigan, 2008).

2.1 CLIMATE CHANGE
City of Chico Wal-Mart Expansion
April 2009 Revised Draft Environmental Impact Report
2.1-13
• LED Signage Illumination: All internally illuminated building signage will use LED lighting.
This application of LED technology is over 80 percent more energy-efficient than
standard illumination and the lamp life ranges up to six to 10 times longer, which reduces
the need to manufacture and dispose standard illuminated lamps (Underwood, 2007).
• LED Illumination in the Cooler/Freezer Box Doors: Wal-Mart proposes to replace
fluorescent lighting in the cooler/freezer box doors with LED lighting. Such a measure will
aid to keep the boxes cool since the LED lights produce less heat than the fluorescent
tubes. According to the Lighting Research Center at Rensselaer Polytechnic Institute in
Troy, New York, this application of LED technology has the potential to act up to 60
percent more energy-efficient than fluorescent illumination.
• LED Illumination at Jewelry Counter: Wal-Mart proposes to replace fluorescent lighting at
the Jewelry Counter with LED lighting. As mentioned above, LED technology has the
potential to act up to 60 percent more energy-efficient than fluorescent illumination.
• Water Conserving Fixtures: All restroom sinks will include sensor-activated low flow
faucets. According to Consumer Reports, low flow faucets reduce water usage by 30
percent over traditional faucets. Furthermore all restroom urinals will use 0.125 gallons per
flush and toilets will use 1.28 gallons per flush.
• Ozone Friendly Refrigerants: Wal-Mart proposes the use of the R404a refrigerant for the
refrigeration equipment and R410a refrigerant for the store’s air conditioning.
The above actions will assist in the reduction of GHGs. However, at this time, due to the lack of a
threshold of significance, it is not possible to determine at what level of impact the increase in
GHGs would occur as a result of implementation of the proposed project. It is generally
believed that climate changes are occurring and will continue to occur because of the
increase of greenhouse gasses throughout the world. AB 32 requires that statewide GHG
emissions be reduced to 1990 levels by the year 2020. This will require an overall reduction GHGs
emitted in the state. Construction of the proposed project will result in an increase of GHG
emissions. As described above, the primary source of GHG emissions from the project is vehicle
emissions. However, while the traffic study describes the project as resulting in 4,883 “new”
vehicle trips daily to the store, these trips are not necessarily new but more likely re-routed trips
which are currently producing CO2 emissions as these trips are currently traveling to other
sources of retail/grocery uses in the area, during one trip. In addition, the expansion retail store,
such as the proposed project, is not likely to produce an increase in population as would a
residential development. Other than additional trucks to serve the expanded store, additional
vehicles from an increased population is unlikely. In fact, implementation of the proposed
project may result in a decrease in CO2 emissions from vehicles emissions due to the availability
of retail and grocery shopping at one location. As such, the actual increase in vehicle CO2
emissions resulting from project implementation are most likely much less than projected in Table
2.1-2.
California vehicle emissions standards are regulated by the state and federal governments, the
only entities which have jurisdiction over vehicle emissions in California and reduction of these
vehicle emissions by the proposed project is not possible. However, the project does provide a
number of actions to reduce energy use and thereby reduces the store’s demand on energy
and the related GHG emissions.

2.1 CLIMATE CHANGE
City of Chico Wal-Mart Expansion
April 2009 Revised Draft Environmental Impact Report
2.1-14
The proposed project is not considered to be a major emitter of GHGs. The measures listed
above can effectively reduce GHG emissions. As described above, the primary source of GHG
emissions for the project are from vehicle emissions, which already exist in the area. In fact,
actual GHG emission from the expansion of the store represents approximately one-fifth of the
estimated emissions while vehicles make up the remaining four-fifths. As mentioned above,
implementation of the proposed project could theoretically result in a decrease in CO2 emissions
from vehicles emissions due to the availability of retail and grocery shopping at one location,
however it is impossible to know at this time whether residents in the City of Chico will commute
longer or shorter distances as a result of the project.
The project does not have the ability to reduce the GHG emissions from vehicles, only the State
and the federal government have that authority. The project does, however, have the ability to
reduce GHG emissions from the building which it does by the measures listed above. As
previously stated, expansion of the existing Wal-Mart store will result in an increase in CO2
emissions of 0.006 MMT annually. In comparison, the amount of CO2 emitted in California in 2004
was 334.9 MMT. Furthermore, the project includes an array of measures that will reduce GHG
emissions effectively decreasing the impacts of the project to global warming and climate
change as well as energy use. For these reasons, the project will not generate a substantial
increase in GHG emissions that would impede the State’s attainment of AB 32’s goal of reducing
GHG emissions to 1990 levels by the year 2020 when combined with the GHG emissions of other
prior, current, and reasonably foreseeable projects with the State of California. The project
impact to global warming and climate change is considered less than cumulatively significant.
Mitigation Measures
None required.

2.1 CLIMATE CHANGE
City of Chico Wal-Mart Expansion
April 2009 Revised Draft Environmental Impact Report
2.1-15
REFERENCES
California Air Resources Board. 2002. Proposed Methodology to Model Carbon Dioxide Emissions
and Estimate Fuel Economy.
http://www.arb.ca.gov/msei/onroad/downloads/pubs/co2final.pdf. Accessed June 2007.
California Climate Action Registry. 2006 (June). California Climate Action Registry General
Reporting Protocol: Reporting Entity-Wide Greenhouse Gas Emissions. Version 2.1. Los
Angeles, CA. http://www.climateregistry.org/docs/PROTOCOLS/GRP%20V2.1.pdf.
Accessed June 2007.
California Energy Commission. 2006a. Inventory of California Greenhouse Gas Emissions and
Sinks: 1990 to 2004. Publication CEC-600-2006-013-D.
http://www.energy.ca.gov/2006publications/CEC-600-2006-013/CEC-600-2006-013-SF.PDF.
Accessed June 2007.
California Energy Commission. 2006b. Climate Change Portal.
http://www.climatechange.ca.gov. Last update December 22, 2006. Accessed January
2007.
California Energy Commission. 2006c. (July) Our Changing Climate: Assessing the Risks to
California. Publication CEC-500-2006-077.
California Environmental Protection Agency. 2007. FAQS Frequently Asked Questions About
Global Climate Change. Available at:
http://www.climatechange.ca.gov/background/faqs.html
California Department of Transportation (Caltrans). December 2006. Climate Action Program at
Caltrans. Sacramento. CA. Available at
http://www.dot.ca.gov/docs/ClimateReport.pdf
Consumer Reports. 2008. Consumer Reports Website: Low-flow Bathroom Faucets on the Rise.
http://blogs.consumerreports.org/home/2008/05/epa-watersense.html. Accessed
February 02, 2009
Intergovernmental Panel of Climate Change. National Greenhouse Gas Inventories Programme.
http://www.ipcc-nggip.iges.or.jp/. Accessed June 2007.
International Emissions Trading Association. Making Markets Work for the Environment. Available
at: http://www.ieta.org/ieta/www/pages/index.php?IdSitePage=123. Accessed January
30, 2009.
Itron. 2007. California Commercial End User Survey. Available at:
http://capabilities.itron.com/CeusWeb/Chart.aspx#
Lighting Research Center at Rensselaer Polytechnic Institute. Promise and Challenges of LED
Technology for Lighting Applications. Available at:
http://www.lrc.rpi.edu/programs/solidstate/pdf/newdelhi2007.pdf. Accessed January
30, 2009.

2.1 CLIMATE CHANGE
City of Chico Wal-Mart Expansion
April 2009 Revised Draft Environmental Impact Report
2.1-16
National Aeronautical and Space Administration. 2007. NASA Facts Online.
http://www.gsfc.nasa.gov/gsfc/service/gallery/fact_sheets/earthsci/green.htm.
Accessed June 2007.
Miller, Tyler G. 2000. Living In the Environment, 11th Edition. Thomson Learning.
Omno-Means, LTD. 2008. Chico Wal-Mart Store Expansion Traffic Impact Study. Final Report. July
2008
University of Michigan, Occupational Safety and Environmental Health. 2008. Pollution
Prevention Program. Accessed July 23, 2008. Available at
http://www.p2000.umich.edu/energy_conservation/ec9.htm#Benefits
Underwood, Anne. "Mayors Take the Lead." Newsweek 16 April 2007: pgs 68-73.
U.S. Environmental Protection Agency. 2007. Greenhouse Gas Emissions.
http://www.epa.gov/climatechange/emissions/index.html. Accessed June 2007.

2.2 ENERGY CONSERVATION


2.2 ENERGY CONSERVATION
City of Chico Wal-Mart Expansion
April 2009 Revised Draft Environmental Impact Report
2.2-1
This section of the Revised EIR describes the potential energy use of the proposed project
including the consumption of electricity, natural gas and petroleum, as well as the project’s
energy conservation measures. Electricity and natural gas consumption occurs in conjunction
with a number of activities including space heating and cooling, lighting, food preparation and
maintenance.
CEQA requires that an EIR set forth mitigation measures proposed to reduce wasteful, inefficient
and unnecessary consumption of energy (Public Resources Code § 21100(b).) Appendix F to
the CEQA Guidelines was adopted to assist in implementing this requirement and contains a
suggested approach to analyzing energy conservation.
2.2.1 EXISTING SETTING
PROJECT SITE - EXISTING USES
Currently, a portion of the 27.11-acre project site consists of an existing Wal-Mart store
approximately 125,889 square feet in size and which sells general consumer merchandise
including clothing, electronics, hardware, small household appliances, home furnishings, sporting
goods, and a limited amount of food and beverages. The existing store also houses a
pharmacy, optical and automotive services, and a garden center. The parking lot is located in
front of the store and contains 630 parking spaces. Landscaping has been installed in planter
areas along the site perimeter on the western property line behind the store, along the frontages
of Business Lane, Baney Lane and Forest Avenue, and throughout the parking lot in parking lot
islands and peninsula planters. A Class I bicycle path is located on the western and southern
boundaries of the Wal-Mart store and parking lot. This existing bicycle path is a small segment of
a planned Class I bicycle/pedestrian path that will run on the east side of State Route 99 from
Big Chico Creek to Skyway/Norte Dame Boulevard.
PROJECT AREA
The 27.11-acre site is located in south Chico and is bounded on the north by Baney Lane, on the
east by Forest Avenue, on the south by Wittmeier Drive, and Business Lane and State Route 99
are west of the site. The State Route 99/East 20th Street interchange is located approximately
one-quarter mile to the northwest. The project site is located in an area that is predominately
commercial in character. The Chico Mall, The Village Center, and other commercial
establishments are located along East 20th Street. The Wittmeier Auto Center, the recently
completed Butte Community College extension, and Lowe’s are located on Forest Avenue,
south of the project site. State Route 99, a four-lane freeway through Chico, occupies the area
west of the project site. The Chico Crossroads Center and Costco are on the west side of State
Route 99. East of Forest Avenue is several office buildings, behind which is a residential area.
Immediately north of the project site is a Shell gasoline station, vacant commercial land, and the
Oxford Suites motel. The Krispy Kreme (now vacant) and the In-and-Out Burger restaurants are
located on the western boundary of the project site, at the end of Business Lane.
EXISTING ENERGY CONSUMPTION
Energy consumption is analyzed in an EIR because of its relationship to environmental impacts
associated with its production and usage. Such impacts include the depletion of nonrenewable
resources (e.g., oil, natural gas, coal, etc.) and emissions of pollutants during both the
production and consumption phases.

2.2 ENERGY CONSERVATION
City of Chico Wal-Mart Expansion
April 2009 Revised Draft Environmental Impact Report
2.2-2
California
Electricity
In 2005, California used over 272,464 gigawatts of electricity (CEC, 2005).1 California’s electricity
generation system currently generates over 290,000 gigawatt hours of electricity each year,
which is transported over California’s 32,000 miles of transmission lines (Integrated Energy Policy
Report, CEC, 2007). By 2020, electricity consumption in the state is projected to reach almost
330,000 gigawatts (CEC, 2007, Figure 2-2, pg 37). In 2006, this electricity was produced from
power plants fueled by natural gas (41.5%), hydrologic sources (19.0%), coal (15.7%), nuclear
(12.9%), and renewable methods (10.9%). Approximately 78.1 percent of the electricity was
generated within California, with the balance imported from other states, Canada, and Mexico
(CEC, 2006). Overall electricity use in California is projected to grow by 1.25 percent annually
(Integrated Energy Policy Report, CEC, 2007). However, peak demand is growing at a rate of
1.35 percent (850 megawatts) per year (CEC, 2007a, pg 12). This increase in peak demand is the
result of a population that is moving inland to the hotter areas of the state, prompting higher
demand for electricity for air conditioning.
Electricity usage in California for differing land uses varies substantially by the type of uses in a
building, type of construction materials used in a building, and the efficiency of all electricity
consuming devices within a building. The average annual usage of electricity is roughly 6,500
kWhr/residence. The average annual usage of electricity is roughly 13 kWhr/square foot for all
commercial buildings and roughly 18 kWhr/square foot for office/R&D buildings (CEC, 2007).
Electricity supply in California involves a complex grid of power plants and transmission lines
located in the western United States, Canada, and Mexico. Almost 22 percent of the electricity
used in California is imported from 11 other western states as well as Canada and Mexico. The
issue is complicated by market forces that have become prominent since 1998, when a new
regulatory environment commonly referred to as "deregulation" took effect in California. Supply
is further complicated by the fact that the peak demand for electricity is significantly higher than
the off-peak demand. For example, in August 2004, peak electric demand - due in large part to
hot weather - reached a record high of 44,497 megawatts, which is almost double the lowest
demand period.
Natural Gas
In 2004, California consumed about 6,246 million cubic feet of natural gas per day
(approximately 2.3 trillion cubic feet per year). The California natural gas demand for 2008 is
projected to be just slightly more than this (CEC, 2007b, pg 179, Figure 6-9). The largest user of
natural gas is electrical generation, using about half of all natural gas in the state. Natural gas in
2004 was used in the production of electricity (50 percent), in industrial uses (19 percent), in
commercial uses (9 percent), and in residential uses (22 percent) and transportation (1 percent)
(CEC, 2004). Approximately 13 percent of the natural gas produced in 2004 was within
California, with the balance imported via pipeline from other states and Canada (CEC, 2004).
California is at the furthest end of those pipelines, forcing it to compete with other states that are
located closer to generation plants in Canada for supplies.
1 Energy usage is typically quantified using the British Thermal Unit (Btu). As points of reference, the approximate amount of energy contained in a gallon of gasoline, a cubic foot of natural gas, and a kilowatt hour (kWhr) of electricity are
123,000 Btu's, 1,000 Btu's, and 3,400 Btu's, respectively.

2.2 ENERGY CONSERVATION
City of Chico Wal-Mart Expansion
April 2009 Revised Draft Environmental Impact Report
2.2-3
As with electricity, natural gas usage in California for different land uses varies substantially by
the type of uses, type of construction materials, and the efficiency of all gas-consuming devices
in a given building. The average annual usage of natural gas is roughly 45,000 cubic
feet/residence. The average annual usage of natural gas is roughly 37 cubic feet/square foot for
commercial buildings and roughly 29 cubic feet/square foot for office buildings.
According to the California Energy Commission's 2007 Integrated Energy Policy Report, natural
gas has become an increasingly important source of energy since more of the state’s power
plants rely heavily on this fuel. While California’s successful efficiency programs and its reliance
on renewable sources of electricity should slow the demand of natural gas, competition for the
state’s imported supply is increasing. This reliance on imported gas leaves the state vulnerable to
price shocks and supply disruptions.
The annual forecast of North American natural gas production has decreased each year since
2002, a difference of about eight trillion cubic feet a year (CEC, 2007b, pg 173). Pacific Gas and
Electric Company (PG&E) has publicly commented that it believes that western Canadian
natural gas production will be less than predicted while another energy company,
Sempra/SoCalGas believes that several supply basins throughout North America will produce
less than forecasted.
Natural gas is critical in meeting the state’s energy demand. California’s growing population
requires more natural gas for residential heating and cooking, industrial processing and most
importantly, electricity production. Natural gas, like petroleum, has become a global
commodity and California competes not just with other U.S. states for access to less abundant
natural gas supplies, but also with Western Europe and Asia Pacific consumers in a world market
for natural gas. The result is that prices are likely to continue increasing (CEC, 2007b, pg 173).
Peak electricity demand in California is expected to grow at about 1.35 percent each year
through 2017, and will be the sector with the largest natural gas increase over the next decade.
Before 1997, natural gas consumption for electricity averaged 500 billion cubic feet each year
(1,400 million cubic feet per day); however, future demand is anticipated to average 2,500
million cubic feet each day (CEC, 2007).
City of Chico
Electricity
Pacific Gas and Electric (PG&E) provides electrical service within the Chico City limits which
includes the project site. The existing electric facilities in the Chico vicinity include 12- to 69-kV
distribution lines and bulk and distribution substations at various locations throughout the City.
Pacific Gas and Electric
PG&E generates, transmits, and distributes electric power to most of Northern California
including the City of Chico. PG&E serves a population of approximately 15 million customers in
California (Annual Report, pg 15, 2007). The utility is also engaged in electricity generation,
procurement and transmission, and natural gas procurement, transportation and storage. As of
2007, PG&E had approximately 20,050 employees, 160,000 miles of power lines, and a service
area spanning more than 70,000 square miles.
Table 2.2-1 presents comparisons of electricity consumption for selected years, as well as
forecasts of future consumption for 2008, 2013, and 2016.

2.2 ENERGY CONSERVATION
City of Chico Wal-Mart Expansion
April 2009 Revised Draft Environmental Impact Report
2.2-4
TABLE 2.2-1
PG&E PLANNING AREA ELECTRICITY CONSUMPTION AND FORECASTS
Year Consumption (Gigawatt Hours)1
1990 86,803
2000 101,331
2005 101,460
2008 107,929
2013 115,412
2016 119,644
Source: CEC, California Energy Demand 2008-2018, pg 50, Table 9 1. Gigawatt equals one billion watts Note: Historic values are shaded
According to the 2007 Annual Report, PG&E has been making substantial capital investments to
improve capacity of its infrastructure. In 2007, capital investments totaled 2.8 billion dollars. Total
capital investment for the 2008 through 2011 time frame is now expected to be 13.5 billion. For
example, in 2006 PG&E unveiled plans to build a new transmission line along the Fresno-
Bakersfield corridor. Dubbed the Central California Clean Energy Transmission Line, it would
increase power supplies in the region by creating better access to sources of solar, wind, and
geothermal energy.
In 2007, PG&E signed eight new renewable energy contracts, adding over 2,700 gigawatt-hours
of annual supply. These included some of the largest agreements yet for utility-scale
concentrating- solar power, and, more recently, the first agreement to purchase wave energy
generated by the Pacific Ocean.
Natural Gas
Pacific Gas and Electric Company (PG&E) provides natural gas to customers within the City
limits. PG&E offers several rebates and energy efficiency tips for residential and commercial
customers. PG&E provides rebates for residential customers including, but not limited to,
approved household appliances, general household improvements, healing and cooling,
lighting, home electronics, and pools. PG&E also offers energy-saving resources including
education and training information for customers and industry professionals. All construction and
maintenance activities for natural gas facilities are the responsibility of PG&E.
Pacific Gas and Electric
PG&E provides natural gas to most of Northern California. The PG&E natural gas planning area is defined as the combined PG&E and Sacramento Municipal Utility District (SMUD) electric
planning areas. It includes all PG&E retail gas customers and customers of private marketers
using the PG&E natural gas distribution system. Table 2.2-2 presents comparisons of natural gas
consumption for selected years as well as forecasts for 2008 and 2016.
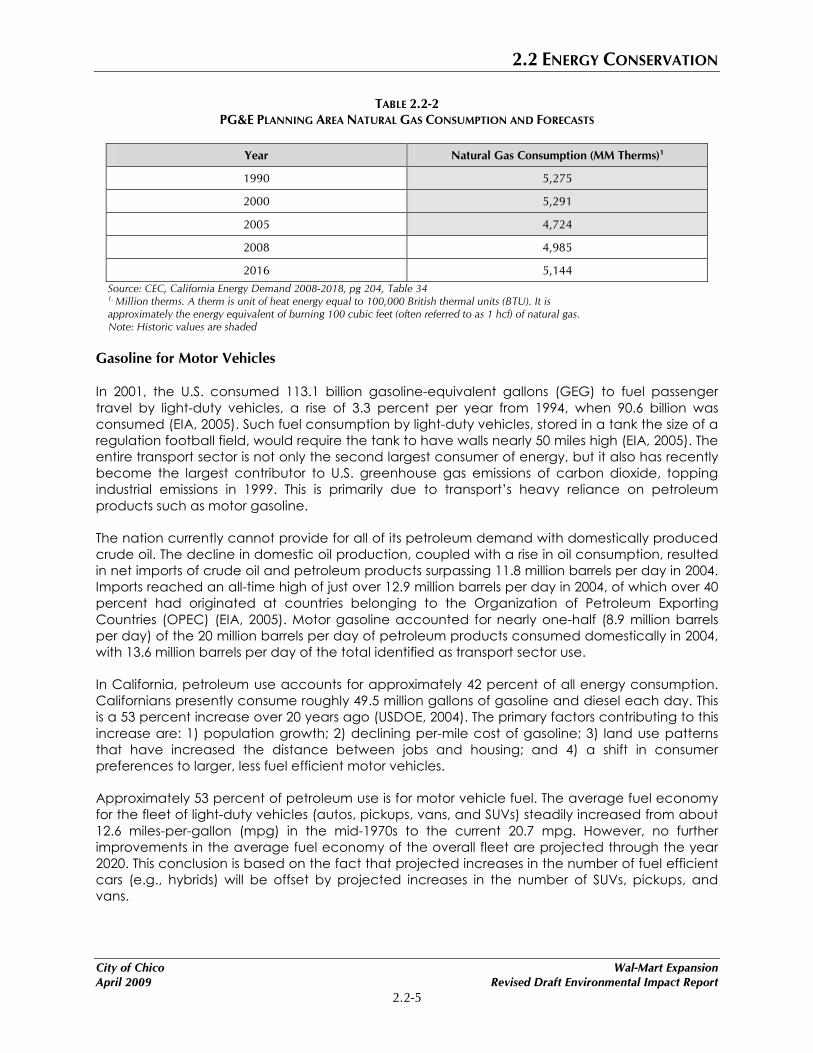
2.2 ENERGY CONSERVATION
City of Chico Wal-Mart Expansion
April 2009 Revised Draft Environmental Impact Report
2.2-5
TABLE 2.2-2
PG&E PLANNING AREA NATURAL GAS CONSUMPTION AND FORECASTS
Year Natural Gas Consumption (MM Therms)1
1990 5,275
2000 5,291
2005 4,724
2008 4,985
2016 5,144
Source: CEC, California Energy Demand 2008-2018, pg 204, Table 34 1. Million therms. A therm is unit of heat energy equal to 100,000 British thermal units (BTU). It is approximately the energy equivalent of burning 100 cubic feet (often referred to as 1 hcf) of natural gas. Note: Historic values are shaded
Gasoline for Motor Vehicles
In 2001, the U.S. consumed 113.1 billion gasoline-equivalent gallons (GEG) to fuel passenger
travel by light-duty vehicles, a rise of 3.3 percent per year from 1994, when 90.6 billion was
consumed (EIA, 2005). Such fuel consumption by light-duty vehicles, stored in a tank the size of a
regulation football field, would require the tank to have walls nearly 50 miles high (EIA, 2005). The
entire transport sector is not only the second largest consumer of energy, but it also has recently
become the largest contributor to U.S. greenhouse gas emissions of carbon dioxide, topping
industrial emissions in 1999. This is primarily due to transport’s heavy reliance on petroleum
products such as motor gasoline.
The nation currently cannot provide for all of its petroleum demand with domestically produced
crude oil. The decline in domestic oil production, coupled with a rise in oil consumption, resulted
in net imports of crude oil and petroleum products surpassing 11.8 million barrels per day in 2004.
Imports reached an all-time high of just over 12.9 million barrels per day in 2004, of which over 40
percent had originated at countries belonging to the Organization of Petroleum Exporting
Countries (OPEC) (EIA, 2005). Motor gasoline accounted for nearly one-half (8.9 million barrels
per day) of the 20 million barrels per day of petroleum products consumed domestically in 2004,
with 13.6 million barrels per day of the total identified as transport sector use.
In California, petroleum use accounts for approximately 42 percent of all energy consumption.
Californians presently consume roughly 49.5 million gallons of gasoline and diesel each day. This
is a 53 percent increase over 20 years ago (USDOE, 2004). The primary factors contributing to this
increase are: 1) population growth; 2) declining per-mile cost of gasoline; 3) land use patterns
that have increased the distance between jobs and housing; and 4) a shift in consumer
preferences to larger, less fuel efficient motor vehicles.
Approximately 53 percent of petroleum use is for motor vehicle fuel. The average fuel economy
for the fleet of light-duty vehicles (autos, pickups, vans, and SUVs) steadily increased from about
12.6 miles-per-gallon (mpg) in the mid-1970s to the current 20.7 mpg. However, no further
improvements in the average fuel economy of the overall fleet are projected through the year
2020. This conclusion is based on the fact that projected increases in the number of fuel efficient
cars (e.g., hybrids) will be offset by projected increases in the number of SUVs, pickups, and
vans.

2.2 ENERGY CONSERVATION
City of Chico Wal-Mart Expansion
April 2009 Revised Draft Environmental Impact Report
2.2-6
Although no new refineries have been constructed in California since 1969, supply has kept
pace with demand though a combination of refinery upgrades/modernizations and out-of-state
imports (Western States Petroleum Association, 2004).
According to the California Energy Commission's 2003 Integrated Energy Policy Report, the
demand for gasoline and diesel for on-road vehicles is projected to increase by 36 percent over
the next 20 years. Imports of foreign crude oil will increase as in-state and Alaskan supplies
diminish. Since California refineries are already operating close to their full capacity, daily
imports of refined gasoline and diesel are expected to double over the next 20 years. Unless out-
of-state facilities expand, the gasoline and diesel markets will become increasingly volatile, with
the likelihood of shortages and more prolonged periods of high prices.
2.2.2 REGULATORY FRAMEWORK
Federal and state agencies regulate energy consumption through various policies and
programs. Federal agencies, such as the U.S. Department of Transportation (USDOT), U.S.
Department of Energy (USDOE) and the Environmental Protection Agency (EPA) affect energy
consumption in the transportation sector through fuel economy standards, funding for
transportation infrastructure, and funding for energy related research and development
projects. At the state level, the California Energy Commission (CEC) collects and analyzes
energy-related data, prepares state-wide energy policy recommendations and plans, promotes
and funds energy efficiency programs, and regulates the power plant siting process. California is
prevented by federal law from setting state fuel economy standards for new on-road motor
vehicles.
FEDERAL
Energy Policy and Conservation Act
The Energy Policy and Conservation Act of 1975 required that all vehicles sold in the U.S. meet
certain fuel economy goals. The Act gave the National Highway Traffic and Safety
Administration (NHTSA, part of U.S. Department of Transportation (USDOT)) authority to establish
additional vehicle standards and revise existing standards. NHTSA set the fuel economy standard
for new passenger cars at 27.5 miles per gallon (MPG) in 1990, and 20.7 mpg for new light trucks
in 1996. Heavy-duty vehicles (i.e., vehicles and trucks over 8,500 pounds gross vehicle weight)
are not currently subject to fuel economy standards. The Corporate Average Fuel Economy
(CAFE) program, administered by the EPA, was created to determine vehicle manufacturers’
compliance with the fuel economy standards. The EPA calculates a value for each
manufacturer based on city and highway fuel economy test results and vehicle sales. Based on
the information generated under the CAFE program, the USDOT is authorized to assess penalties
for noncompliance.
Intermodal Surface Transportation Efficiency Act (ISTEA)
In 1991, Congress established ISTEA to promote the development of intermodal transportation
systems, maximize mobility, and address national and local interests in air quality and energy. To
meet the new ISTEA requirements, Metropolitan Planning Organizations (MPOs) had to adopt
social, economic, energy, and environmental policies to guide transportation decisions in the
region. MPOs must also consider the consistency of transportation planning with federal, state,
and local energy goals. This requirement was designed to make energy consumption a decision
criterion in determining the best transportation solution.

2.2 ENERGY CONSERVATION
City of Chico Wal-Mart Expansion
April 2009 Revised Draft Environmental Impact Report
2.2-7
STATE
California Environmental Quality Act (CEQA)
An EIR should include a discussion of potentially significant energy impacts of the proposed
project, with emphasis on avoiding or reducing inefficient, wasteful and unnecessary
consumption of energy. Appendix F of the CEQA Guidelines describes a suggested approach
to the energy conservation information and analyses that should be included in an EIR.
State of California Energy Plan
The CEC identifies emerging trends in energy supply, demand, conservation, public health and
safety, and the maintenance of a healthy economy in the state Energy Plan. The plan calls upon
the state to reduce congestion and increase the efficient use of fuel supplies. The plan also
encourages urban designs that reduce vehicle miles traveled and accommodate pedestrian
and bicycle access (SCAG 2001).
2.2.3 IMPACTS AND MITIGATION MEASURES
STANDARDS OF SIGNIFICANCE
The proposed project is considered to have a significant energy impact if implementation of the
project would result in any of the following:
• Wasteful, inefficient, and unnecessary usage of energy.
• Placement of a significant demand on regional energy supply or requirement for
substantial additional capacity.
• Result in a need for new systems or supplies or substantial alterations to the existing power
and natural gas utilities.
METHODOLOGY
Proposed development of additional building space would result in the consumption of
additional energy, including electricity, natural gas and other fossil fuels. For the purposes of this
analysis, the energy consumption of the proposed project is compared to existing conditions.
PROJECT IMPACTS AND MITIGATION MEASURES
Construction Impacts
Impact 2.2.1 Construction and maintenance of the proposed project would result in
additional energy consumption. This is considered a less than significant
impact.
Implementation of the proposed project would involve grading and construction of building
pads, roads, structures, and other appurtenant improvements as well as processing
improvements. These construction activities would require the use of gasoline, diesel fuel, other
fuels, and electricity in order to be completed. Energy usage during construction typically
involves the use of motor vehicles both for transportation of workers and equipment but also for

2.2 ENERGY CONSERVATION
City of Chico Wal-Mart Expansion
April 2009 Revised Draft Environmental Impact Report
2.2-8
direct construction actions such as the use of cranes or lifts. Additional energy usage would
occur as power for tools and equipment used on-site; including but not limited to gas
generators, air compressors, air handlers and filters, and other typical direct construction energy
uses.
Construction of the proposed project would use electricity and gas as a short-term
consequence of construction of the project. Construction of the proposed project would be
similar in the consumption level of electricity and gas as any project of this size. This energy
demand would not result in the need for new systems or supplies or substantial alterations to
existing power and natural gas facilities. Nor would it place a significant demand on regional
energy supply or require substantial additional capacity. Construction activities occur every day
in the PG&E service areas and these activities are not of a magnitude that results in the need for
additional facilities. Energy consumption associated with construction activities is expected to
be minimal, compared to energy consumed in the City, and will not result in local energy
demand exceeding the capacity of PG&E and gasoline/diesel fuel suppliers. Construction
activities are not anticipated to result in wasteful, inefficient, and unnecessary use of energy as
construction contractors would purchase their own gasoline and diesel fuel from local suppliers
and would conserve the use of their supplies to minimize costs to the project. This usage would
constitute a small percentage of typical local daily usage. For these reasons and because of
the temporary nature of construction activities, this effect would be a less than significant
impact.
Mitigation Measures
None required.
Operational Impacts
Impact 2.2.2 Future operation of the project would require substantial amounts of energy.
This could result in a potentially significant impact to energy resources.
The existing Wal-Mart store is 125,889 square feet. The proposed expansion project will add an
additional 97,556 square feet to the existing Wal-Mart store. The total area of the Wal-Mart store
after the expansion would be 223,445 square feet.
Wal-Mart has submitted to the City energy consumption projection calculations of the proposed
expansion (Appendix A of the original EIR). Electricity and/or natural gas energy will be used for
space heating, cooling and ventilation equipment; water heater; cooking and refrigeration
units; interior and exterior lighting of the building and parking lot, and cash register equipment
and other miscellaneous fixtures in the store. Because retail stores have diverse loads, long
operating hours and high occupancy in the evenings, providing an accurate estimate of energy
use data is rather subjective and very store specific. However, Wal-Mart provided energy
consumption rate increases calculated based on historical information available from existing
Wal-Mart stores that employ a number of the energy efficiency features as described below. The
current and expected energy use rates are as follows:
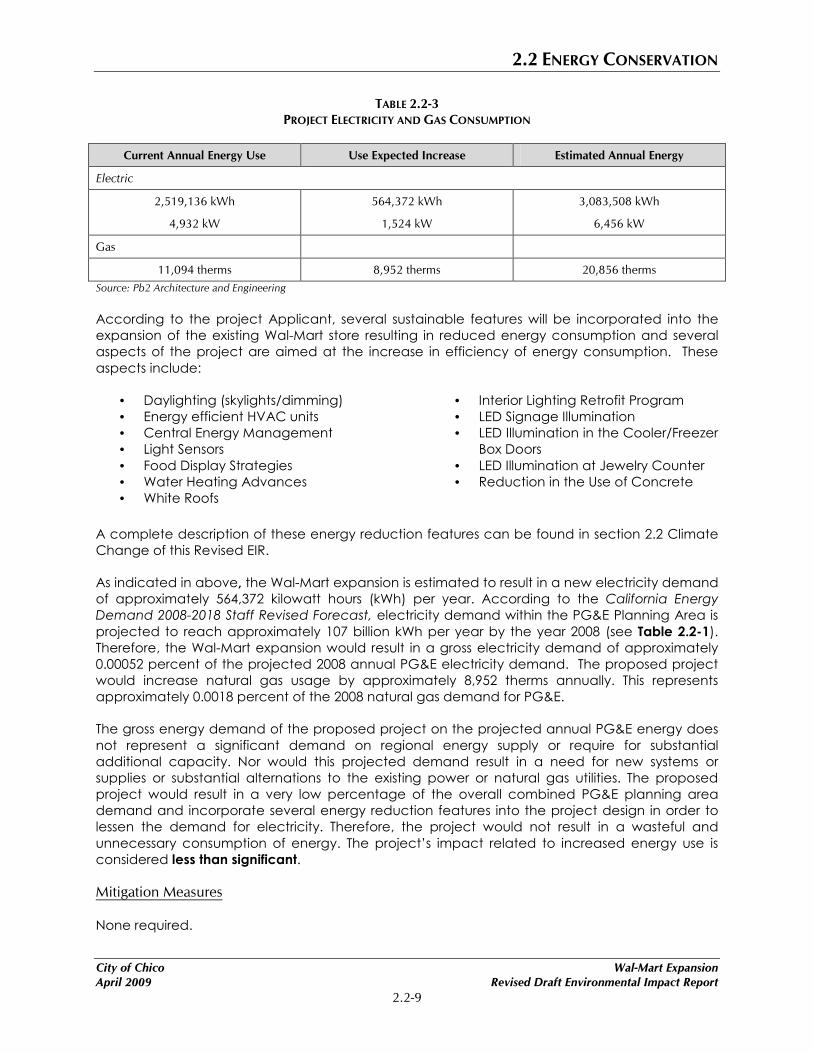
2.2 ENERGY CONSERVATION
City of Chico Wal-Mart Expansion
April 2009 Revised Draft Environmental Impact Report
2.2-9
TABLE 2.2-3
PROJECT ELECTRICITY AND GAS CONSUMPTION
Current Annual Energy Use Use Expected Increase Estimated Annual Energy
Electric
2,519,136 kWh
4,932 kW
564,372 kWh
1,524 kW
3,083,508 kWh
6,456 kW
Gas
11,094 therms 8,952 therms 20,856 therms
Source: Pb2 Architecture and Engineering
According to the project Applicant, several sustainable features will be incorporated into the
expansion of the existing Wal-Mart store resulting in reduced energy consumption and several
aspects of the project are aimed at the increase in efficiency of energy consumption. These
aspects include:
• Daylighting (skylights/dimming)
• Energy efficient HVAC units
• Central Energy Management
• Light Sensors
• Food Display Strategies
• Water Heating Advances
• White Roofs
• Interior Lighting Retrofit Program
• LED Signage Illumination
• LED Illumination in the Cooler/Freezer
Box Doors
• LED Illumination at Jewelry Counter
• Reduction in the Use of Concrete
A complete description of these energy reduction features can be found in section 2.2 Climate
Change of this Revised EIR.
As indicated in above, the Wal-Mart expansion is estimated to result in a new electricity demand
of approximately 564,372 kilowatt hours (kWh) per year. According to the California Energy
Demand 2008-2018 Staff Revised Forecast, electricity demand within the PG&E Planning Area is
projected to reach approximately 107 billion kWh per year by the year 2008 (see Table 2.2-1).
Therefore, the Wal-Mart expansion would result in a gross electricity demand of approximately
0.00052 percent of the projected 2008 annual PG&E electricity demand. The proposed project
would increase natural gas usage by approximately 8,952 therms annually. This represents
approximately 0.0018 percent of the 2008 natural gas demand for PG&E.
The gross energy demand of the proposed project on the projected annual PG&E energy does
not represent a significant demand on regional energy supply or require for substantial
additional capacity. Nor would this projected demand result in a need for new systems or
supplies or substantial alternations to the existing power or natural gas utilities. The proposed
project would result in a very low percentage of the overall combined PG&E planning area
demand and incorporate several energy reduction features into the project design in order to
lessen the demand for electricity. Therefore, the project would not result in a wasteful and
unnecessary consumption of energy. The project’s impact related to increased energy use is
considered less than significant.
Mitigation Measures
None required.

2.2 ENERGY CONSERVATION
City of Chico Wal-Mart Expansion
April 2009 Revised Draft Environmental Impact Report
2.2-10
Traffic Related Impacts
Impact 2.2.3 Traffic increases resulting from the proposed project would require relatively
substantial amounts of petroleum. This is a potentially significant impact to
energy resources.
In 2000, motor vehicle fuel use accounted for 22 percent of total statewide energy consumption
(14.4 billion gallons of fuel). The expansion of the existing Wal-Mart store will be from 125,889
square feet to 223,445 square feet to include an expanded merchandise sales floor, a new
grocery sales area, and expanded garden center.
As the proposed project involves several uses, it is expected that some vehicles visiting one of
the different aspects of the expanded store will also be visiting one (or all) of the other uses.
While the traffic study describes the project as resulting in 4,883 “new” vehicle trips daily to the
store, these trips are not necessarily new but more likely re-routed trips which are currently
consuming gasoline as these trips are currently traveling to other sources of retail/grocery uses in
the area, during one trip. In addition, the expansion retail store, such as the proposed project, is
not likely to produce an increase in population as would a residential development. Other than
additional trucks to serve the expanded store, additional vehicles from an increased population
is unlikely. In fact, implementation of the proposed project may result in a decrease in gasoline
consumption from vehicles emissions due to the availability of retail and grocery shopping at
one location. For example, a vehicle leaving the current Wal-Mart store to visit a grocery store at
another location in the City may very well conduct the same needed grocery shopping at the
project site once expansion occurs. This additional action would not occur using a vehicle but
rather could be accomplished on foot after parking. As such, the actual increase in vehicle
gasoline consumption resulting from project implementation is most likely much less than
projected in Table 2.2-3. This potential reduction in trips could reduce the consumption of
gasoline and therefore not result in a wasteful and unnecessary consumption of energy. The
proposed project would not require additional energy capacity or the need for new energy
systems or supplies.
Therefore, this impact is considered less than significant.
Mitigation Measures
None required
2.2.4 CUMULATIVE SETTING, IMPACTS, AND MITIGATION MEASURES
CUMULATIVE SETTING
The potential for cumulative impacts to energy resources was assessed based upon
consideration of the proposed project in combination with all projects within the PG&E planning
area.
Sources of energy are diverse and widespread. Electricity can be transmitted over long
distances, and supply is usually made available from varying and numerous sources. Electricity
needed in the region may in fact be generated outside of the state or country. It is not possible
to reasonably predict where the new generation facilities would be located, or to evaluate
environmental impacts from the construction and operation of these new facilities. However,
should new generation facilities be proposed in California, the California Energy Commission
conducts a complete environmental review (Public Resources Code section 25541) of proposed

2.2 ENERGY CONSERVATION
City of Chico Wal-Mart Expansion
April 2009 Revised Draft Environmental Impact Report
2.2-11
power plant projects 50 megawatts and larger before approving them. Smaller projects must
also go through environmental review under the oversight of the local jurisdiction in which they
are proposed.
CUMULATIVE IMPACTS AND MITIGATION MEASURES
Cumulative Energy Use Impacts
Impact 2.2.4 The proposed construction and operation of the project in conjunction with
existing, approved, and planned development would require a substantial
use of energy. This is considered a less than cumulatively considerable impact
to energy resources.
The expansion of the existing Wal-Mart store proposed by the project, as well as other
communities and businesses in Chico and the surrounding region, would depend upon the
regional suppliers of energy in the future. The demand for energy at completion of the proposed
store expansion would not by itself be sufficient to trigger the need for new electric or gas
generation facilities. As depicted in Tables 2.2-1 and 2.2-2, electricity demand for the PG&E
service area in the year 2016 is forecasted at 119,644 gigawatt hours and natural gas demand
for the PG&E service area in the year 2016 is forecasted at 5,144,000,000 therms. The proposed
project would result in the annual demand of approximately 0.00047 percent of PG&E’s 2016
forecasted electricity demand and 0.00041 percent of PG&E’s 2016 forecasted natural gas
demand.
PG&E serves a population of approximately 15 million customers in California (Annual Report, pg
15, 2007). PG&E anticipates that sufficient new supplies will be available from a variety of sources
at market-competitive prices to meet existing and projected market demands in its service area.
The new supplies could be delivered through a variety of sources, including new interstate
pipeline facilities and expansion of PG&E’s existing transmission facilities, or PG&E’s or others’
storage facilities (PG&E, 2008). In 2007, PG&E signed eight new renewable energy contracts,
adding over 2,700 gigawatt-hours of annual supply. These included some of the largest
agreements yet for utility-scale concentrating- solar power, and, more recently, the first
agreement to purchase wave energy generated by the Pacific Ocean.
Implementation and operation of the proposed project in combination with all planned and
approved projects within the PG&E planning area would not result in a substantial increase on
regional electricity or natural gas demand relative to the availability of supply such that impacts
would be significant or require for substantial additional capacity. Nor would demand result in a
need for new systems or supplies or substantial alternations to the existing power or natural gas utilities. Therefore, the project’s incremental contribution to cumulative energy impacts would be less than cumulatively considerable.
Mitigation Measures
None required.

2.2 ENERGY CONSERVATION
City of Chico Wal-Mart Expansion
April 2009 Revised Draft Environmental Impact Report
2.2-12
REFERENCES
California Energy Commission (CEC). 2005. California Electricity Consumption by County in 2005.
Accessed March 27, 2008. Available at:
http://www.energy.ca.gov/electricity/electricity_by_county_2005.html
California Energy Commission (CEC). 2006. California's Major Sources of Energy. Accessed March
27, 2008. Available at: http://www.energy.ca.gov/html/energysources.html
California Energy Commission (CEC). 2004. California Natural Gas Facts and Figures. Accessed
March 28, 2008. Available at: http://www.energy.ca.gov/naturalgas/natural_gas_facts.html
California Energy Commission (CEC). 2007a. Integrated Energy Policy Report 2007 Summary.
California Energy Commission (CEC). 2007b. Integrated Energy Policy Report 2007.
California Energy Commission (CEC). 2007c. California Energy Demand 2008-2018, Staff Revised
Forecast. November 2007. Accessed April 1, 2007. Available at:
http://www.energy.ca.gov/2007publications/CEC-200-2007-015/CEC-200-2007-015-SF2.PDF
California Energy Commission (CEC). 2006. Revised Summer 2006 Demand and Five Year
Outlook. Accessed April 04, 2008. Available at:
http://www/energy.ca.gov/2006_summer_outlook
Energy Information Administration (U.S. Department of Energy). 2005. Household Vehicles Energy
Use: Latest Data and Trends. November 2005. Accessed April 07, 2008. Available at
http://www.eia-doe.gov/emeu/rtecs/nhts_survey/2001
pb2 Architecture and Engineering. July 2008. Re: Supercenter Expansion for Walmart Store #2044
Chico CA Letter from Tim F. Donckers to Zach Thomas. July, 14 2008.
PG&E. 2008. 2008 California Gas Report. Accessed July 23, 2008. Available at:
http://www.pge.com/pipeline/library/regulatory/downloads/cgr08.pdf
PG&E Corporation. 2007. Annual Report 2007. Accessed July 23, 2008. Available at:
http://www.pgecorp.com/investors/pdfs/2007AnnualReport.pdf
Western States Petroleum Association (WSPA). 2008. Accessed July 11, 2008. Available at:
http://cpr.ca.gov/updates/archives/pdf/09_17_2004/Panel%20Testimony/SPARANO.TESTIMO
NY.pdf

2.3 TRAFFIC AND CIRCULATION


2.3 TRAFFIC AND CIRCULATION
City of Chico Wal-Mart Expansion
April 2009 Draft Revised Environmental Impact Report
2.3-1
This Section of the Revised Draft Environmental Impact Report completely replaces Section 4.2 of
the November 2006 Draft EIR. This section summarizes the results of a traffic impact study performed
by Omni-Means for the proposed Wal-Mart Expansion project (including consideration of the
impacts associated with development of the 2.42 acre parcel located at the southeastern portion
of the project site). This study is included in Appendix A. The existing transportation setting is
described including the current AM, PM, and Saturday peak hour traffic operations at key
intersections, freeway ramps, and the affected freeway mainline. Impacts of the project on existing
AM, PM, and Saturday peak hour intersection, ramp and mainline operations are identified via
quantification of the trip generation and trip distribution associated with the proposed project,
assuming identified local and regionally approved/pending projects are in place. The section also
evaluates the projected cumulative (year 2020) peak hour operations. It is important to note that
cumulative operations were also obtained from the two sources, Chico 2005-2006 Update of
Development Impact Fees Analysis and Recommendations, Nexus Study (City of Chico, October
2005) and the Meriam Park Phasing Analysis (W-Trans, May 2, 2007). The Nexus Study included a
future horizon year of 2018 to coincide with its General Plan horizon while the Meriam Park land use
plan included an ultimate building phase for the Year 2020 conditions. Data for both Year 2018 and
2020 conditions were used at the study locations as applicable and additional discussion on the
projections and varying horizon years are available within this Section.
Potential base improvements and project-related mitigation measures are identified to alleviate
unacceptable level of traffic impacts at the study intersections, ramps and mainline segments under
project and cumulative conditions. In addition, the section assesses impacts to transit, bicycle, and
pedestrian facilities.
2.3.1 EXISTING SETTING
EXISTING ROADWAY SYSTEM
Roadway Network
The existing Wal-Mart store is currently accessed via three Baney Lane driveways, a Forest Avenue
driveway, and a Business Lane driveway that leads into the rear alley. Figure 2.3-1 identifies the
location of the existing driveways. Roadways that provide primary circulation in the vicinity of the
project site are described below.
State Highways
State Route 99 (SR 99) is a major state freeway facility that traverses north/south through central and
northern California. SR 99 serves as the primary inter-regional auto and truck travel route that
connects the northern valley cities of Chico and Yuba City with Sacramento and central valley cities
of Stockton, Modesto, Fresno, and Bakersfield. Within the City of Chico, SR 99 also serves as a major
commuter route providing vital north/south circulation, providing a four-lane divided cross section
with a posted speed limit of 55 mph. Caltrans reported an Annual Average Daily Traffic Volume
(AADT) of 58,000 and 69,000 vehicles on SR 99 just south and north of the East 20th Street interchange,
respectively. Based upon Caltrans Publication “2004 Annual Average Daily Truck Traffic on the
California State Highway System”, the average truck percentage on SR 99 is approximately 10
percent for the section south and north of the East 20th Street interchange.
City Roadways
The following local roadways are under the jurisdiction of the City of Chico. Given roadway
classifications are based on those established within the City of Chico General Plan, Transportation
Element.

2.3 TRAFFIC AND CIRCULATION
Wal-Mart Expansion City of Chico
Revised Draft Environmental Impact Report April 2009
2.3-2
East 20th Street is a major east-west arterial that begins in the west at Park Avenue, and continues
east through an SR 99 interchange to Bruce Road, where the roadway continues as Warfield Lane
into residential development. With the exception of the easternmost ½ mile of roadway near Bruce
Road, East 20th Street is a divided 4-lane roadway with channelized left turn pockets at major streets,
a posted Class II bike lane, and a posted speed limit of 35 mph.

NO SCALE
Source: Omni-Means Ltd
T:\_
CS\
Wor
k\C
hico
, City
of\
Wal
Mar
t 24
-005
8\Fi
gure
s
Figure 2.3-1Site Plan


2.3 TRAFFIC AND CIRCULATION
City of Chico Wal-Mart Expansion
April 2009 Revised Draft Environmental Impact Report
2.3-5
East Park Avenue and Skyway combine to serve as a major east-west arterial. East Park Avenue
(Business SR 99) extends westward from the SR 99 interchange approximately ¾ mile terminating
at Midway. Skyway extends eastward from the SR 99 interchange deep into the foothills. In the
vicinity of the project site, both roadways are divided 4-lane facilities with channelized left turn
pockets at major streets, except within the SR 99 interchange where only a single westbound
through lane exists between the ramps. The roadways maintain a posted speed limit of 35 mph
west of Notre Dame Boulevard, 45 mph between Notre Dame Boulevard and the City’s eastern
limits, and 50-55 mph east of the City.
Forest Avenue is a major north-south arterial providing connection between the east-west arterial
streets of SR-32, 20th Street, and Skyway (via Notre Dame Boulevard as described below). Within the
vicinity of the project, Forest Avenue maintains a divided 4-lane configuration arterial with
channelized left turn pockets at major streets, a posted Class II bike lane, and a posted speed limit
of 35 mph.
Notre Dame Boulevard is north-south arterial connecting Forest Avenue and Skyway, serving
basically as the southern continuation for Forest Avenue traffic. Although Notre Dame Boulevard
continues north from Forest Avenue and south from Skyway, these facilities are 2-lane collector
roadways. Between Forest Avenue and Skyway, the roadway is a divided 4-lane facility with
channelized left turn pockets and a posted speed limit of 35 mph.
Wittmeier Drive is a short 2-lane east-west roadway which exists along the southern boundary of the
proposed project, terminating to the west as a cul-de-sac, and to the east at Forest Avenue. The
roadway continues east through Forest Avenue into a residential subdivision as Talbert Drive. Two
future driveways along Wittmeier Drive will provide access to the proposed Wal-Mart Expansion
project.
Private Roadways
The following roadways are private roads that provide access in the vicinity of the project site.
Baney Lane is a private street that runs in an east-west direction and has a two-lane undivided cross-
section with a left-turn pocket provided at the easternmost Wal-Mart driveway. At the eastern
terminus, Baney Lane forms a signalized intersection with Forest Avenue, and continues east through
Forest Avenue into a residential subdivision as Parkway Village Drive. At the western terminus, Baney
Lane tees into Business Lane. There are three existing Wal-Mart driveways on Baney Lane that will
continue to provide access to the project site.
Business Lane is a private street that runs in a north-south direction providing connection between
20th Street and Baney Lane. Business Lane has a two-lane undivided cross-section. At the northern
terminus, Business Lane forms a right-turn-only stop sign controlled intersection with 20th Street. Within
the cul-de-sac located at the roadway’s southern terminus south of Baney Lane, the roadway
transitions into the private alley behind the existing Wal-Mart, which will also exist behind the
proposed project as an additional access to and from the project site.
Study Intersections
Existing traffic volumes were provided by the City of Chico for weekday AM, weekday PM, and
Saturday peak hour periods at the critical study intersections listed below. Traffic counts were
updated in November 2004 and again in April 2005. The AM peak hour is defined as the one-hour of
peak traffic flow (which is the highest total volume count over four consecutive 15-minute count
periods) counted between 7:00 AM and 9:00 AM on a typical weekday. The PM peak hour is
defined as the one-hour of peak traffic flow counted between 4:00 PM and 6:00 PM on a typical
weekday. The Saturday peak hour is defined as the one-hour of peak traffic flow counted between
11:30 AM and 1:30 PM on a Saturday.

2.3 TRAFFIC AND CIRCULATION
Wal-Mart Expansion City of Chico
Revised Draft Environmental Impact Report April 2009
2.3-6
1) E. 20th Street / Whitman Avenue
2) E. 20th Street / SR 99 Southbound (SB)
Ramps
3) E. 20th Street / SR 99 Northbound (NB)
Ramps
4) E. 20th Street / Business Lane
5) E. 20th Street / Chico Mall Access
6) E. 20th Street / Forest Avenue
7) Business Lane / ToysRUs Access
8) Baney Lane/Business Lane-Wal-Mart
Driveway Access
9) Baney Lane / Wal-Mart West Driveway
10) Baney Lane / Wal-Mart Central Driveway
11) Baney Lane / Wal-Mart East Driveway
12) Forest Avenue / Baney Lane-Parkway Village Drive
13) Forest Avenue / Wal-Mart Driveway
14) Forest Avenue / Talbert Drive-Wittmeier
Drive
15) Forest Avenue / Notre Dame Boulevard
16) E. Park Avenue-Skyway / Whitman Road
17) E. Park Ave - Skyway / SR 99 SB Off-Ramp
18) E. Park Ave - Skyway / SR 99 NB Off-Ramp
19) Skyway / Notre Dame Boulevard
Intersection turning lane geometrics and traffic control for the above nineteen critical study
intersections are illustrated on Figure 2.3-2. Existing AM, PM, and Saturday peak hour traffic volumes
at the study intersections identified above are shown on Figure 2.3-3.
Freeway Mainline
Existing freeway mainline volumes were provided by the City of Chico along the following freeway
mainline segments:
1) SR 99 – E. Park Avenue-Skyway Interchange to E. 20th Street Interchange
2) SR 99 – E. 20th Street Interchange to SR-32 Interchange
Existing peak hour mainline operations were evaluated utilizing the existing peak hour traffic volumes
shown on Figure 2.3-4. Table 2.3-2 below summarizes current SR 99 freeway mainline operations.
Freeway Ramps
Existing volumes along the following freeway ramps were derived by Omni-Means based on existing
volumes at the ramp intersections:
1) NB SR 99 on-ramp from E. Park Avenue-
Skyway
2) NB SR 99 off-ramp to E. 20th Street
3) NB SR 99 on-ramp from E. 20th Street
4) NB SR 99 off-ramp to SR-32
5) SB SR 99 on-ramp from SR-32
6) SB SR 99 off-ramp to E. 20th Street
7) SB SR 99 on-ramp from E. 20th Street
8) SB SR 99 off-ramp to E. Park Avenue-
Skyway

2.3 TRAFFIC AND CIRCULATION
City of Chico Wal-Mart Expansion
April 2009 Revised Draft Environmental Impact Report
2.3-7
Existing AM, PM, and Saturday peak hour traffic volumes at the freeway mainline segments and
ramp junctions identified above are shown on Figure 2.3-4.
EXISTING TRAFFIC OPERATIONS
Existing traffic volumes were provided by the City of Chico for weekday AM, weekday PM, and
Saturday peak hour periods at the critical study intersections listed above. These volumes were
adjusted and balanced as necessary to establish a final set of existing intersection volumes, which
were subsequently approved by the City. The AM peak hour is defined as the one-hour of peak
traffic flow (which is the highest total volume count over four consecutive 15-minute count periods)
counted between 7:00 AM and 9:00 AM on a typical weekday. The PM peak hour is defined as the
one-hour of peak traffic flow counted between 4:00 PM and 6:00 PM on a typical weekday. The
Saturday peak hour is defined as the one-hour of peak traffic flow counted between 11:30 AM and
1:30 PM on a Saturday.
Existing Intersections
Existing peak hour intersection traffic operations were analyzed utilizing existing traffic volumes
(shown on Figure 2.3-3) and existing intersection lane geometrics and control (shown on Figure 2.3-
2). Table 2.3-1 provides a summary of the Existing peak hour intersection Levels of Service (LOS). See
Section 2.3.4 Methodology for an explanation of Level of Service.
TABLE 2.3-1
EXISTING CONDITIONS: INTERSECTION LEVELS-OF-SERVICE
AM Peak Hour PM Peak Hour Saturday Peak Hour
# Intersection Control
Type1
Target
LOS Delay LOS Warrant
Met2 Delay LOS Warrant
Met2 Delay LOS Warrant
Met2
1 E. 20th St /
Whitman Ave Signal D 18.1 B - 26.3 C - 38.9 D -
2 E. 20th St / SR 99
SB Ramps Signal D 21.6 C - 26.6 C - 27.4 C -
3 E. 20th St / SR 99
NB Ramps Signal D 12.6 B - 38.0 D - 20.5 C -
4 E. 20th St /
Business Ln TWSC D 9.6 A No 12.1 B No 11.6 B No
5 E. 20th St / Chico
Mall Access Signal D 13.6 B - 49.1 D - 61.9 E -
6 E. 20th St / Forest
Ave Signal D 32.9 C - 45.5 D - 71.7 E -
LOS conditions do not apply to intersections 7 through 11 which are private intersections.
Significance is discussed under Impact 2.3.2 of this Traffic Section.
12
Forest Ave /
Baney Ln-
Parkway Village
Dr
Signal D 25.9 C - 27.4 C - 28.3 C -
13 Forest Ave / Wal-
Mart Driveway TWSC D 10.0 A No 10.7 B No 11.0 B No

2.3 TRAFFIC AND CIRCULATION
Wal-Mart Expansion City of Chico
Revised Draft Environmental Impact Report April 2009
2.3-8
AM Peak Hour PM Peak Hour Saturday Peak Hour
# Intersection Control
Type1
Target
LOS Delay LOS Warrant
Met2 Delay LOS Warrant
Met2 Delay LOS Warrant
Met2
14
Forest Ave /
Talbert Dr-
Wittmeier Dr
TWSC D 15.0 B No 36.4 E No 26.5 D No
15 Forest Ave /
Notre Dame Blvd Signal D 19.8 B - 17.8 B - 13.2 B -
16
E. Park Ave-
Skyway /
Whitman Rd
Signal D 8.5 A - 23.2 C - 21.3 C -
17
E. Park Ave-
Skyway / SR 99
SB Ramps
TWSC D 10.2 B - 23.6 C - 12.0 B -
18
E. Park Ave-
Skyway / SR 99
NB Ramps
Signal D 10.1 B - 10.8 B - 9.5 A -
19 Skyway / Notre
Dame Blvd Signal D 27.7 C - 45.7 D - 37.7 D -
Source: Omni Means, 2009 Notes: Bolded entries indicate intersections operating as an Unacceptable LOS. 1) TWSC = Two-Way-Stop-Control (LOS and delay are based on LOS and delay for worst approach). 2) Warrant = Caltrans peak hour-volume based signal warrant. 3) Pvt = private roadways, driveways and/or intersections. City LOS criteria not applicable and excess delays analyzed in terms of
unacceptable vehicle conflict and safety issues.
As shown in Table 2.3-1, the following intersections were found to be currently operating at
unacceptable levels under Existing conditions during at least one peak hour period.
• East 20th Street/Chico Mall Access – This signalized intersection is found to be operating at
unacceptable LOS “E” during the Saturday peak hour period.
• East 20th Street/Forest Avenue – This signalized intersection is found to be operating at
unacceptable LOS “E” during the Saturday peak hour period.
• Forest Avenue/Talbert-Wittmeier Drive – This unsignalized intersection is found to be operating at
unacceptable LOS “E” during the weekday PM peak hour period based on the delay
experienced by vehicles along the stop controlled eastbound Wittmeier Drive approach.
Private Intersections
A few of the roadways and intersections analyzed within the traffic study are private streets
including Baney Lane, Business Lane, and all private driveways leading to City streets (i.e. Chico Mall
Access, Wal-Mart driveways). The City of Chico has established that the City's intersection LOS
standards should not be applied to intersections of two private streets or private driveway
approaches to either private streets or City arterials. (The LOS standards would be applied to
signalized intersections which may include a private street connection, such as East 20th
street/Chico Mall access.) Therefore, intersection LOS conditions are not presented for the private
street intersections including Business Lane/ToysRUs, Business Lane/Baney Lane, and the Baney
Lane/WalMart driveways. However, these intersections were evaluated based on traffic issues
related to safety, sight distance, adherence to design standards, turn lane warrants, conflicts with
adjacent intersections, and/or potential for vehicle conflicts. Impacts related to congestion were
only considered if it impacted adjacent intersections or traffic safety.

2.3 TRAFFIC AND CIRCULATION
City of Chico Wal-Mart Expansion
April 2009 Revised Draft Environmental Impact Report
2.3-9
• Business Lane/ToysRUs Access – This unsignalized intersection which is located approximately 150
feet south of the intersection with East 20th Street is designed with typical minor street standards
with stop controls on the westbound approach and adequate sight distance for all movements.
In addition, there has not been a demonstrated safety problem in the past. Traffic in the area
generally moves at slow speeds.
• Baney Lane/Wal-Mart Driveways – Baney Lane is currently narrow and only is wide enough for
one lane in each direction, west of the easternmost driveway. The street currently serves three
Walmart driveways on the south, two gas station driveways to the northeast and a hotel
driveway to the northwest.
• Business Lane/Baney Lane – This unsignalized intersection is designed with typical minor street
standards with adequate sight distance and stop control on the westbound Baney Lane
approach. There is one approach lane in each direction.
None of the unsignalized intersections identified above meet Caltrans Peak Hour Volume Warrant-3 1(Urban Areas) indicating that the peak hour volumes of minor streets are not large enough to
warrant installation of a traffic signal at these locations.
Freeway Mainline Segments
Existing peak hour mainline operations were evaluated utilizing the existing peak hour traffic volumes
shown on Figure 2.3-4. Table 2.3-2 summarizes current SR 99 freeway mainline operations.
1 Warrant 3 - Minimum Pedestrian Volume. A traffic signal may be warranted where the pedestrian volume crossing the major
street at an intersection or mid-block location during an average day is: 100 or more for each of any four hours; or 190 or more
during any one hour. The pedestrian volume crossing the major street may be reduced as much as 50% of the values given
above when the predominant pedestrian crossing speed is below 1 m/s. In addition to a minimum pedestrian volume of that
stated above, there shall be less than 60 gaps per hour in the traffic stream of adequate length for pedestrians to cross during
the same period when the pedestrian volume criterion is satisfied. Where there is a divided street having a median of sufficient
width for the pedestrian(s) to wait, the requirement applies separately to each direction of vehicular traffic. Where
coordinated traffic signals on each side of the study location provide for platooned traffic which result in fewer than 60 gaps
per hour of adequate length for the pedestrians to cross the street, a traffic signal may not be warranted. This warrant applies
only to those locations where the nearest traffic signal along the major street is greater than 90 m and where a new traffic
signal at the study location would not unduly restrict platooned flow of traffic. Curbside parking at nonintersection locations
should be prohibited for 30 m in advance of and 6 m beyond the crosswalk. A signal installed under this warrant should be of
the traffic-actuated type with push buttons for pedestrians crossing the main street. If such a signal is installed within a signal
system, it shall be coordinated if the signal system is coordinated. Signals installed according to this warrant shall be equipped
with pedestrian indications conforming to requirements set forth in other sections of this Manual (Caltrans, November 2002).

2.3 TRAFFIC AND CIRCULATION
Wal-Mart Expansion City of Chico
Revised Draft Environmental Impact Report April 2009
2.3-10
TABLE 2.3-2
EXISTING CONDITIONS: SR 99 MAINLINE LEVELS-OF-SERVICE
AM Peak Hour PM Peak Hour Saturday Peak Hour Freeway
Mainline
Segment
No.
Lanes
Target
LOS Volume Density
(pc/mi/ln) LOS Volume
Density
(pc/mi/ln) LOS Volume
Density
(pc/mi/ln) LOS
SR 99 NB,
north of
Skyway I/C
2 E 1,912 17.2 B 2,606 23.4 C 1,886 16.9 B
SR 99 SB,
north of
Skyway I/C
2 E 2,391 21.5 C 2,057 18.5 C 1,426 12.8 B
SR 99 NB,
north of
20th Street
I/C
2 E 2,375 21.3 C 3,362 31.6 D 2,393 21.5 C
SR 99 SB,
north of
20th Street
I/C
2 E 2,551 22.9 C 2.264 20.3 C 1,564 14.0 B
Source: Omni Means, 2009 Notes: pc/mi/ln = Passenger Cars per Mile per Lane
As shown in Table 2.3-2, all four mainline segments currently operate at acceptable LOS (LOS “E” or
better per Caltrans significance criteria for freeways) during AM, PM and Saturday peak hour
periods under Existing conditions.

NO SCALE
Source: Omni-Means Ltd
T:\_
CS\
Wor
k\C
hico
, City
of\
Wal
Mar
t 24
-005
8\Fi
gure
s
Figure 2.3-2Existing Lane Geometrics and Control


NO SCALE
Source: Omni-Means Ltd
T:\_
CS\
Wor
k\C
hico
, City
of\
Wal
Mar
t 24
-005
8\Fi
gure
s
Figure 2.3-3Existing Peak Hour Traffic Volumes

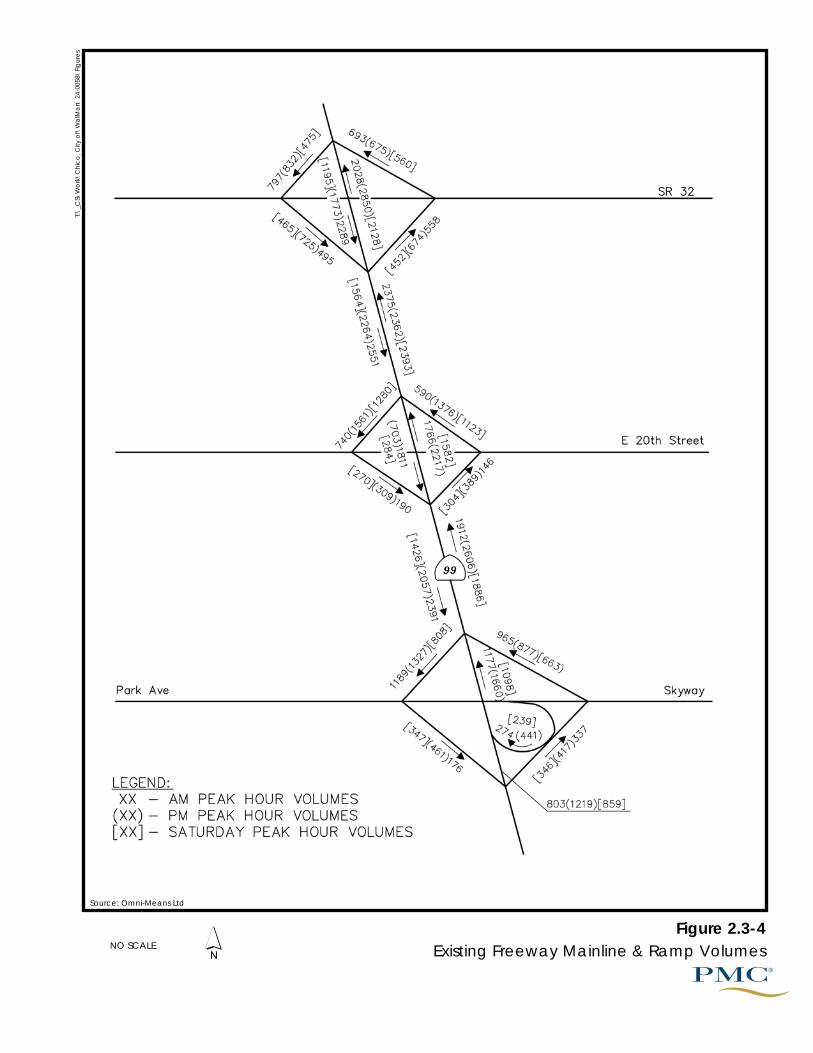
NO SCALE
Source: Omni-Means Ltd
Figure 2.3-4Existing Freeway Mainline & Ramp Volumes
T:\_
CS\
Wor
k\C
hico
, City
of\
Wal
Mar
t 24
-005
8\Fi
gure
s

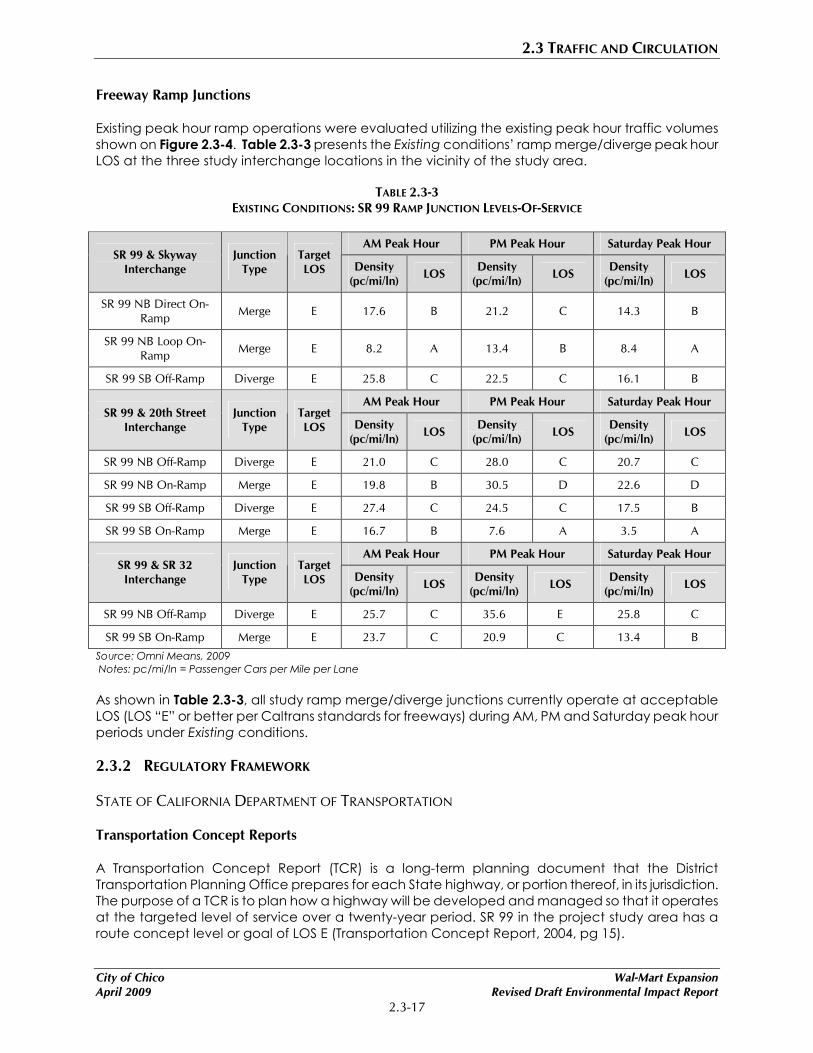
2.3 TRAFFIC AND CIRCULATION
City of Chico Wal-Mart Expansion
April 2009 Revised Draft Environmental Impact Report
2.3-17
Freeway Ramp Junctions
Existing peak hour ramp operations were evaluated utilizing the existing peak hour traffic volumes
shown on Figure 2.3-4. Table 2.3-3 presents the Existing conditions’ ramp merge/diverge peak hour
LOS at the three study interchange locations in the vicinity of the study area.
TABLE 2.3-3
EXISTING CONDITIONS: SR 99 RAMP JUNCTION LEVELS-OF-SERVICE
AM Peak Hour PM Peak Hour Saturday Peak Hour SR 99 & Skyway
Interchange
Junction
Type
Target
LOS Density
(pc/mi/ln) LOS
Density
(pc/mi/ln) LOS
Density
(pc/mi/ln) LOS
SR 99 NB Direct On-
Ramp Merge E 17.6 B 21.2 C 14.3 B
SR 99 NB Loop On-
Ramp Merge E 8.2 A 13.4 B 8.4 A
SR 99 SB Off-Ramp Diverge E 25.8 C 22.5 C 16.1 B
AM Peak Hour PM Peak Hour Saturday Peak Hour SR 99 & 20th Street
Interchange
Junction
Type
Target
LOS Density
(pc/mi/ln) LOS
Density
(pc/mi/ln) LOS
Density
(pc/mi/ln) LOS
SR 99 NB Off-Ramp Diverge E 21.0 C 28.0 C 20.7 C
SR 99 NB On-Ramp Merge E 19.8 B 30.5 D 22.6 D
SR 99 SB Off-Ramp Diverge E 27.4 C 24.5 C 17.5 B
SR 99 SB On-Ramp Merge E 16.7 B 7.6 A 3.5 A
AM Peak Hour PM Peak Hour Saturday Peak Hour SR 99 & SR 32
Interchange
Junction
Type
Target
LOS Density
(pc/mi/ln) LOS
Density
(pc/mi/ln) LOS
Density
(pc/mi/ln) LOS
SR 99 NB Off-Ramp Diverge E 25.7 C 35.6 E 25.8 C
SR 99 SB On-Ramp Merge E 23.7 C 20.9 C 13.4 B
Source: Omni Means, 2009
Notes: pc/mi/ln = Passenger Cars per Mile per Lane
As shown in Table 2.3-3, all study ramp merge/diverge junctions currently operate at acceptable
LOS (LOS “E” or better per Caltrans standards for freeways) during AM, PM and Saturday peak hour
periods under Existing conditions.
2.3.2 REGULATORY FRAMEWORK
STATE OF CALIFORNIA DEPARTMENT OF TRANSPORTATION
Transportation Concept Reports
A Transportation Concept Report (TCR) is a long-term planning document that the District
Transportation Planning Office prepares for each State highway, or portion thereof, in its jurisdiction.
The purpose of a TCR is to plan how a highway will be developed and managed so that it operates
at the targeted level of service over a twenty-year period. SR 99 in the project study area has a
route concept level or goal of LOS E (Transportation Concept Report, 2004, pg 15).

2.3 TRAFFIC AND CIRCULATION
Wal-Mart Expansion City of Chico
Revised Draft Environmental Impact Report April 2009
2.3-18
Level of Service (LOS) is a qualitative measure of operating conditions within a traffic stream, and
their perception by motorists and/or passengers. A LOS definition generally describes these
conditions in terms of such factors as speed, travel time, freedom to maneuver, comfort and
convenience, and safety.
Caltrans Level of Service for Freeways
• LOS A on freeways describes primary free-flow operations. Average operating speeds at the
freeflow speed generally prevail. Vehicles are almost unimpeded in their ability to maneuver
within the traffic stream. Regarding intersections LOS A describes operations with very low delay,
up to 5 seconds per vehicle. This LOS occurs when progression is extremely favorable and most
vehicles arrive during the green phase.
• LOS B represents a reasonable free-flow, and speeds are generally maintained. The ability to
maneuver within the traffic stream is only slightly restricted, and the general level of physical and
psychological comfort provided to drivers is still high. For intersections, LOS B describes
operations with delay greater than 5 and up to 15 seconds per vehicle. This level generally
occurs with good progression, short cycle lengths, or both.
• LOS C provides for flow with speeds still at or near the freeway flow speed of the freeway.
Freedom to maneuver within the traffic stream is noticeably restricted at LOS C, and lane
changes require more vigilance on the part of the driver. For intersections, LOS C describes
operations with delay greater than 15 and up to 25 seconds per vehicle.
• LOS D is the level at which speeds begin to decline slightly with increasing flows. In this range,
density begins to deteriorate somewhat more quickly with increasing flow. Freedom to
maneuver within the traffic stream is more noticeably limited, and the driver experiences
reduced physical and psychological comfort levels. Even minor incidents can be expected to
create queuing, because the traffic stream has little space to absorb disruptions. For
intersections, LOS D describes operations with delay greater than 25 and up to 40 seconds per
vehicle.
• LOS E on freeways is the value that corresponds to the maximum flow rate, or capacity, on the
facility. Operations in this level are volatile, because there are virtually no usable gaps in the
traffic stream. For intersections, LOS E describes operations with delay greater than 40 and up to
60 seconds per vehicle.
• LOS F on freeways represents a stop and go, low speed conditions with little or poor
maneuverability. Speed and traffic flow may drop to zero and considerable delays occur. For
intersections, LOS F describes operations with delay in excess of 60 seconds per vehicle. This
level, considered by most drivers unacceptable often occurs with oversaturation, that is, when
arrival flow rates exceed the capacity of the intersection.
CITY OF CHICO GENERAL PLAN
The City of Chico General Plan Transportation Element is the document that provides the framework
for achieving the City’s transportation system goals. The City of Chico strives to create a balanced
transportation system that serves bicyclist and pedestrians as well as motor vehicles. Table 2.3-4
summarizes the City’s General Plan policies related to vehicular transportation that are applicable
to this project. Policies relating to other components of transportation (e.g., parking) are addressed
in this section.

2.3 TRAFFIC AND CIRCULATION
City of Chico Wal-Mart Expansion
April 2009 Revised Draft Environmental Impact Report
2.3-19
TABLE 2.3-4
CITY OF CHICO GENERAL PLAN - TRANSPORTATION-RELATED POLICY SUMMARY
Policy Policy Description
Consistency with
General Plan
Policy
Analysis
T-G-11
Strive to maintain traffic LOS C on residential
streets and LOS D or better on arterial and
collector streets, at all intersections, and on
principal arterials in the CMP during peak hours.
Consistent, with
mitigation
Mitigation Measures MM 2.3.1 and
2.3.3 would include improvements to
improve LOS where it falls below these
standards.
T-G-12
Accept LOS E for build-out areas served by transit
after finding that:
-There is no practical and feasible way to mitigate
the lower level of service; and
-The uses resulting in the lower level of service
are of clear, overall public benefit.
Consistent, with
mitigation
See consistency analysis under Policy T-
G-11.
T-I-28 Design roadway improvements and evaluate
development proposals based on LOS standards. Consistent
Completed as part of the Wal-Mart
Expansion project.
2.3.3 IMPACTS AND MITIGATION MEASURES
METHODOLOGY
Traffic operations have been quantified through the determination of "Level of Service" (LOS). Level
of Service is a qualitative measure of traffic operating conditions, whereby a letter grade "A" through
"F" is assigned to an intersection or roadway segment representing progressively worsening traffic
conditions as discussed in Table 2.3-6.
Level of Service Analysis Methodologies
Levels of Service have been calculated for all intersection control types using the methods
documented in the Transportation Research Board Publication Highway Capacity Manual, Fourth
Edition, 2000. For signalized intersections and all-way-stop-controlled (AWSC) intersections, the
intersection delays and levels of service are average values for all intersection movements. For two-
way-stop-controlled (TWSC) intersections, the intersection delays and levels of service are
representative of those for the worst-case approach. The average daily traffic based roadway level
of service thresholds are shown in Table 2.3-5. Level of service criteria for different types of
intersection control are outlined in Table 2.3-6.

2.3 TRAFFIC AND CIRCULATION
Wal-Mart Expansion City of Chico
Revised Draft Environmental Impact Report April 2009
2.3-20
TABLE 2.3-5
LEVEL OF SERVICE (LOS) CRITERIA FOR ROADWAYS
Average Daily Traffic (ADT) – Total of Both Directions Roadway Type
LOS “A” LOS “B” LOS “C” LOS “D” LOS “E”
6-Lane Expressway (high access control) 36,000 42,000 48,000 54,000 60,000
6-Lane Divided Arterial (with left-turn lane) 32,000 38,000 43,000 49,000 54,000
4-Lane Expressway (high access control) 24,000 28,000 32,000 36,000 40,000
4-Lane Divided Arterial (with left-turn lane) 22,000 25,000 29,000 32,500 36,000
4-Lane Undivided Arterial (no left-turn lane) 18,000 21,000 24,000 27,000 30,000
2-Lane Arterial (with left-turn lane) 11,000 12,500 14,500 16,000 18,000
2-Lane Arterial (no left-turn lane) 9,000 10,500 12,000 13,500 15,000
4-Lane Collector 12,000 15,000 18,000 21,000 24,000
3-Lane Collector 9,000 11,250 13,500 15,750 18,000
2-Lane Collector 6,000 7,500 9,000 10,500 12,000
Source: Omni Means, 2009 Notes: Based on Highway Capacity Manual, Fourth Edition, Transportation Research Board, 2000.
1. All volume thresholds are approximate and assume ideal roadway characteristics. Actual thresholds for each LOS listed above may vary depending on a variety of factors including (but not limited to) roadway curvature and grade, intersection or interchange spacing, driveway spacing, percentage of trucks and other heavy vehicles, lane widths, signal timing, on-street parking, volume of cross traffic and pedestrians, etc.
2. The City of Chico has established that the City's LOS standards should not be applied to private intersections or private driveway approaches to City arterials.
Private Intersections Methodology
A few of the roadways and intersections analyzed within the traffic study are private streets
including Baney Lane, Business Lane, and all private driveways leading to City streets (i.e. Chico Mall
Access, Wal-Mart driveways). The City of Chico has established that the City's intersection LOS
standards should not be applied to intersections of two private streets or private driveway
approaches to either private streets or City arterials. (The LOS standards would be applied to
signalized intersections which may include a private street connection, such as East 20th
street/Chico Mall access.) Therefore, intersection LOS conditions are not presented for the private
street intersections including Business Lane/ToysRUs, Business Lane/Baney Lane, and the Baney
Lane/WalMart driveways. However, these intersections were evaluated based on traffic issues
related to safety, sight distance, adherence to design standards, turn lane warrants, conflicts with
adjacent intersections, and/or potential for vehicle conflicts. Impacts related to congestion were
only considered if it impacted adjacent intersections or traffic safety.

2.3 TRAFFIC AND CIRCULATION
City of Chico Wal-Mart Expansion
April 2009 Revised Draft Environmental Impact Report
2.3-21
TABLE 2.3-6
LEVEL OF SERVICE (LOS) CRITERIA FOR INTERSECTIONS
Control Delay (seconds/vehicle) Level of
Service Type of Flow Delay Maneuverability
Signalized Unsignalized All-Way Stop
A Stable Flow
Very slight delay. Progression is very favorable, with
most vehicles arriving during the green phase not
stopping at all.
Turning movements are easily
made, and nearly all drivers
find freedom of operation.
< 10.0 < 10.0 < 10.0
B Stable Flow
Good progression and/or short cycle lengths. More
vehicles stop than for LOS A, causing higher levels of
average delay.
Vehicle platoons are formed.
Many drivers begin to feel
somewhat restricted within
groups of vehicles.
>10 and < 20.0 >10 and < 15.0 >10 and < 15.0
C Stable Flow
Higher delays resulting from fair progression and/or
longer cycle lengths. Individual cycle failures may
begin to appear at this level. The number of vehicles
stopping is significant, although many still pass
through the intersection without stopping.
Back-ups may develop behind
turning vehicles. Most drivers
feel somewhat restricted
>20 and < 35.0 >15 and < 25.0 >15 and < 25.0
D Approaching
Unstable Flow
The influence of congestion becomes more
noticeable. Longer delays may result from some
combination of unfavorable progression, long cycle
lengths, or high volume-to-capacity ratios. Many
vehicles stop, and the proportion of vehicles not
stopping declines. Individual cycle failures are
noticeable.
Maneuverability is severely
limited during short periods
due to temporary back-ups.
>35 and < 55.0 >25 and < 35.0 >25 and < 35.0
E Unstable Flow
Generally considered to be the limit of acceptable
delay. Indicative of poor progression, long cycle
lengths, and high volume-to-capacity ratios.
Individual cycle failures are frequent occurrences.
There are typically long queues
of vehicles waiting upstream of
the intersection.
>55 and < 80.0 >35 and < 50.0 >35 and < 50.0
F Forced Flow
Generally considered to be unacceptable to most
drivers. Often occurs with over saturation. May also
occur at high volume-to-capacity ratios. There are
many individual cycle failures. Poor progression and
long cycle lengths may also be major contributing
factors.
Jammed conditions. Back-ups
from other locations restrict or
prevent movement. Volumes
may vary widely, depending
principally on the downstream
back-up conditions.
> 80.0 > 50.0 > 50.0
Source: Omni Means, 2009 References: 1. Highway Capacity Manual, Fourth Edition, Transportation Research Board, 2000.

2.3 TRAFFIC AND CIRCULATION
Wal-Mart Expansion City of Chico
Revised Draft Environmental Impact Report April 2009
2.3-22
Technical Analysis Parameters
Intersections
The Traffix 7.7 software program was used to implement the Highway Capacity Manual (HCM-2000)
analysis methodologies. Assessment of “design level” parameters (including queuing on intersection
lane groups, stacking length requirements, coordinated signal operations analyses, etc.) have been
included in this analysis.
Freeway Mainline, Ramp Merge/Diverge and Weaving LOS Methodologies
The Transportation Research Board (TRB) published Highway Capacity Software 2000 (HCS-2000),
Version 4.1, was applied in this analysis. Freeway mainline, ramp (merge/diverge) junction and
mainline weaving operations peak hour traffic operations were analyzed using methodologies
presented in HCM 2000. Assumptions used in this analysis include:
• 0.90 peak hour factor (both mainline and ramps)
• 10 percent heavy vehicles during the peak hour periods analyzed - obtained from Average
Annual Daily Truck Traffic on the California State Highway System, November 2004
(http://www.dot.ca.gov/hq/traffops/saferesr/trafdata/truck2003final.pdf)
• A Passenger Car Equivalency (PCE) factor of 1.5 (level terrain), established based on the terrain
(level, rolling, or mountainous), was utilized for evaluating the mainline, ramp merge/diverge and
weaving operations.
STANDARDS OF SIGNIFICANCE
To measure whether transportation facilities operate acceptably, or are significantly impacted by
the addition of project generated traffic, State CEQA Guidelines (2008) Appendix G as well as
applicable standards of significance policies were identified for this analysis. Local standards of
significance policies establish Level of Service thresholds for acceptable/tolerable operations of
transportation facilities, as well as the policies regarding what triggers a significant project impact.
The governing policy for a particular study intersection or roadway segment is that which is
established by the agency which owns and maintains the facility, although it might be necessary to
also consider contradicting policies of other agencies which may have some jurisdictional interest
with the facility.
Within this study, the City of Chico and Caltrans both have standards of significance policies which
apply to some, or all, of the study facilities. The standards of significance policies for each of these
agencies are described in detail below, along with how the policies were interpreted for this
analysis. The following local public agency planning documents were referenced to establish
standards of significance for this analysis.
1) City of Chico General Plan 1999, City of Chico Planning Department, 1999.
2) State Route 99 – Chico Corridor Study, Quincy Engineering, October 2001.

2.3 TRAFFIC AND CIRCULATION
City of Chico Wal-Mart Expansion
April 2009 Revised Draft Environmental Impact Report
2.3-23
Significant Impact Threshold Criteria – City and Caltrans Facilities
City of Chico Standards of Significance
The City of Chico General Plan (April 1999) Transportation Element contains the following policies in
the “Standards for Traffic Level of Service” section:
T-G-11: Strive to maintain traffic LOS C on residential streets and LOS D or better on arterial
and collector streets, at all intersections, and on principal arterials in the Congestion
Management Plan during peak hours.
T-G-12: Accept LOS E for built-out areas served by transit after finding that:
• There is no practical and feasible way to mitigate the lower level of service; and
• The uses resulting in the lower level of service are of clear, overall public benefit.
Based on the above standards established in the General Plan, LOS “D” is designated as the
minimum acceptable LOS standard on City facilities. A peak-hour LOS of “D” is taken as the
threshold for acceptable traffic operations at all study intersections.
Caltrans Standards of Significance
The Guide for the Preparation of Traffic Impact Studies (dated December 2002) published by
Caltrans states the following:
“Caltrans endeavors to maintain a target LOS at the transition between LOS “C” and LOS
“D” on State highway facilities, however, Caltrans acknowledges that this may not be
always feasible and recommends that the lead agency consult with Caltrans to determine
the appropriate target LOS.”
The “concept level of service” for study freeway mainline segments along the SR 99 corridor as
stated within the State Route 99 – Chico Corridor Study, Quincy Engineering (October 2001) is
provided below. Note that the “concept level of service” within the Chico Corridor Study were in
turn obtained from the State Route 99 Route Concept Report (Caltrans District 3, July 1989).
• State Route 99 – Estates Drive to Skyway: LOS “D”
• State Route 99 – Skyway to Mud Creek Bridge: LOS “E”
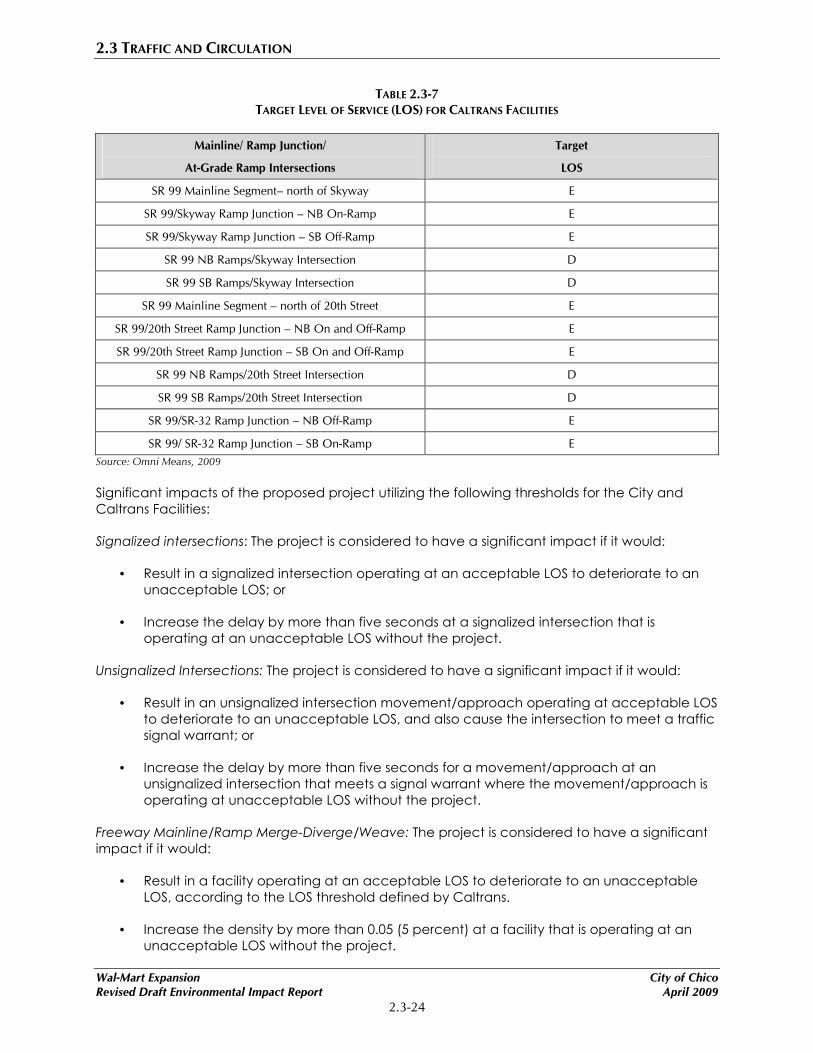
2.3 TRAFFIC AND CIRCULATION
Wal-Mart Expansion City of Chico
Revised Draft Environmental Impact Report April 2009
2.3-24
TABLE 2.3-7
TARGET LEVEL OF SERVICE (LOS) FOR CALTRANS FACILITIES
Mainline/ Ramp Junction/
At-Grade Ramp Intersections
Target
LOS
SR 99 Mainline Segment– north of Skyway E
SR 99/Skyway Ramp Junction – NB On-Ramp E
SR 99/Skyway Ramp Junction – SB Off-Ramp E
SR 99 NB Ramps/Skyway Intersection D
SR 99 SB Ramps/Skyway Intersection D
SR 99 Mainline Segment – north of 20th Street E
SR 99/20th Street Ramp Junction – NB On and Off-Ramp E
SR 99/20th Street Ramp Junction – SB On and Off-Ramp E
SR 99 NB Ramps/20th Street Intersection D
SR 99 SB Ramps/20th Street Intersection D
SR 99/SR-32 Ramp Junction – NB Off-Ramp E
SR 99/ SR-32 Ramp Junction – SB On-Ramp E
Source: Omni Means, 2009
Significant impacts of the proposed project utilizing the following thresholds for the City and
Caltrans Facilities:
Signalized intersections: The project is considered to have a significant impact if it would:
• Result in a signalized intersection operating at an acceptable LOS to deteriorate to an
unacceptable LOS; or
• Increase the delay by more than five seconds at a signalized intersection that is
operating at an unacceptable LOS without the project.
Unsignalized Intersections: The project is considered to have a significant impact if it would:
• Result in an unsignalized intersection movement/approach operating at acceptable LOS
to deteriorate to an unacceptable LOS, and also cause the intersection to meet a traffic
signal warrant; or
• Increase the delay by more than five seconds for a movement/approach at an
unsignalized intersection that meets a signal warrant where the movement/approach is
operating at unacceptable LOS without the project.
Freeway Mainline/Ramp Merge-Diverge/Weave: The project is considered to have a significant
impact if it would:
• Result in a facility operating at an acceptable LOS to deteriorate to an unacceptable
LOS, according to the LOS threshold defined by Caltrans.
• Increase the density by more than 0.05 (5 percent) at a facility that is operating at an
unacceptable LOS without the project.

2.3 TRAFFIC AND CIRCULATION
City of Chico Wal-Mart Expansion
April 2009 Revised Draft Environmental Impact Report
2.3-25
Private Streets Standards of Significance
A few of the intersections analyzed within the traffic study are private streets for which there are no
designated standards of significance. These include Baney Lane, Business Lane, and all private
driveways leading to City streets (i.e. Wal-Mart driveways). The City of Chico has established that
the City's LOS standards should not be applied to private intersections or private driveway
approaches to City arterials. These intersections were evaluated based on traffic issues related to
safety, sight distance, adherence to design standards, turn lane warrants, conflicts with adjacent
intersections, and/or potential for vehicle conflicts. Impacts related to congestion were only
considered if it impacted adjacent intersections or traffic safety.
Traffic Signal Warrant Analysis Criteria
To determine whether “significance” should be associated with unsignalized intersection operations,
a supplemental traffic signal “warrant” analysis was also completed. The term “signal warrants”
refers to the list of established criteria used by Caltrans and other public agencies to quantitatively
justify or ascertain the need for installation of a traffic signal at an otherwise unsignalized intersection
location. This analysis employed the signal warrant criteria presented in the latest edition of the
Federal Highway Administration’s (FHWA) Manual on Uniform Traffic Control Devices (MUTCD), as
amended by the MUTCD 2003 California Supplement, for all study intersections. The signal warrant
criteria are based upon several factors including the volume of vehicular and pedestrian traffic,
frequency of accidents, location of school areas, etc. Both the FHWA’s MUTCD and the MUTCD
2003 California Supplement indicate that the installation of a traffic signal should be considered if
one or more of the signal warrants are met. Specifically, this analysis utilized the Peak Hour Volume
based Warrant 3. Warrant 3 criteria are basically identical for both the FHWA’s MUTCD and the
MUTCD 2003 California Supplement.
California Environmental Quality Act Criteria
Based on the additional criteria used for CEQA analysis, the project will be considered to have a
significant impact if the project or related activities result in:
1) Traffic volumes which exceed established Level of Service standards on roadways
segments or at intersections (LOS D for non-Caltrans facilities owned and maintained by
the City. See Table 2.3-7 for LOS of Caltrans facilities), or which do not meet applicable
safety standards. Based on General Plan policies, significant impacts would generally result
if traffic exceeded LOS C on residential streets, LOS D on arterial and collector
streets/intersections, and (under specific circumstances) LOS E in built-out areas served by
transit,
2) The absence of bikeway facilities in the general locations identified in the General Plan,
consistent with guidelines in the Chico Urban Area Bicycle Plan, or failure to meet
applicable deign requirements and safety standards,
3) Travel characteristics which are not consistent with standards established in the Butte
County Congestion Management Plan (CMP),
4) Substantial impact on existing or proposed public transit systems including rail and air
traffic,
5) Effects on existing parking facilities or demand for new parking not provided for by the
project,

2.3 TRAFFIC AND CIRCULATION
Wal-Mart Expansion City of Chico
Revised Draft Environmental Impact Report April 2009
2.3-26
6) Increased traffic hazards to motor vehicles, bicycles, pedestrian or other traffic, and
7) A change in air traffic patterns, including either an increase in traffic levels or a change in
location that results in substantial safety risks.
The Initial Study for the proposed project evaluated seven transportation related issues, five of
which: 1) a change in air traffic patterns, 2) public transit, 3) the continuation of the bike path
corridor, 4) emergency access and 5) parking, were considered to be less than significant or have
no impact in the Initial Study and are not further discussed in this EIR. For a discussion of the criteria
applied to these issues and the conclusions reached refer to the NOP/Initial Study in Appendix B of
the original DEIR.
ANALYSIS ASSUMPTIONS
Project Trip Generation
This section describes the proposed project and methodologies used to quantify the project trips
added to area transportation facilities.
For purposes of this traffic analysis, the term “project” refers to the development of the10.62 acre site
including the proposed Wal-Mart Expansion project, gas station, and fast food restaurant. Although
it is recognized that the expansion (and associated improvements) will likely be completed prior to
development of the gas station and fast food restaurant, for purposes of this traffic analysis, it was
assumed that the site will be fully developed with all three land uses.
Table 2.3-8 provides a summary of trip generation characteristics for the proposed project.
Typically, project site trip generation is estimated utilizing trip generation rates contained in the
Institute of Transportation Engineers (ITE) Publication Trip Generation (Seventh Edition)2. However,
traffic counts conducted at the existing Wal-Mart store indicate that trip generation rates and
volumes are significantly higher than those calculated from the ITE Trip Generation Manual using the
existing store square footage and ITE rates for a “Free Standing Discount Store” (land use 815). Thus,
given this existing characteristic, it is also assumed that trip rates for the proposed Wal-Mart
Expansion project would also be higher than ITE trip rates for a comparable “Free Standing Discount
Superstore”. For this reason, it was necessary to establish an alternative methodology to estimate an
appropriate trip generation rate for the proposed Wal-Mart store to reflect the anticipated higher
actual rate to the traffic analysis.
Due to the variances described above, it was determined that the direct use of ITE rates was not
appropriate for calculating trip generation for the expanded superstore. Instead an alternative trip
generation methodology was required to establish trip generation for the expanded Wal-Mart
Supercenter. This alternative methodology basically provides for the factoring up of ITE trip
generation characteristics for the proposed site by blending the ITE rates for a “free standing
discount superstore” and the actual observed trip rates at Wal-Mart Supercenters. The specific
methodology used to calculate the final recommended trip generation for the proposed Wal-Mart
Supercenter, including a detailed description of each individual step in the calculations (along with
corresponding tables and graphs), are included in Appendix C of the original DEIR.
2 It is acknowledged that the eighth edition of the ITE Publication Trip Generation is the most recent source of trip generation
rates. However, as the seventh edition ITE Publication Trip Generation contains an elevated rate of trip rates for a Free
Standing Discount Superstore compared with the eighth edition, the higher trip rates of the seventh edition was used in order
to depict a “worst-case” scenario analysis.

2.3 TRAFFIC AND CIRCULATION
City of Chico Wal-Mart Expansion
April 2009 Revised Draft Environmental Impact Report
2.3-27
As shown in Table 2.3-8, within the “‘Unadjusted Project Trip Generation” portion of the table, it is
estimated that the proposed project site will generate a total of 552 AM peak hour trips, 1,160 PM
peak hour trips and 1,399 trips during the Saturday peak hour. However, these total unadjusted
project trips do not take into account existing trips which are already generated by the existing Wal-
Mart, nor internal trips, diverted trips, or pass-by trips which would be associated with the proposed
project.
Existing Wal-Mart trips, as well as internal, diverted, and pass-by trips, will reduce the number of
“new” trips which will be distributed to the study intersections and roadways. Each of these trip
types are described in further detail below.
Existing Wal-Mart Trips
The existing Wal-Mart store currently generates and distributes trips to study intersections and
roadways, which need to be taken into consideration in determining trips that will be generated by
the Wal-Mart Expansion project. The proposed, expanded Wal-Mart will result in higher trip
generation than the existing facility. Vehicle trips currently generated by the existing store are
backed out of the trip generation calculated for the proposed Wal-Mart Expansion since they
already exist within local traffic volumes, and failure to back them out would result in the double
counting of trips. As Table 2.3-8 shows within the “Existing Wal-Mart Trip Generation” portion of the
table, the existing Wal-Mart store generates a total of 314 AM peak hour trips, 844 PM peak hour trips
and 1,116 trips during the Saturday peak hour. These peak hour trips were established from the
driveway counts conducted by OMNI-MEANS in April 2005. The inbound vs. outbound splits for AM
and PM peak hour traffic for the existing Wal-Mart store are different than those established for the
proposed Wal-Mart Expansion project. This difference is to be expected since the two versions of
the store experience different trip generation characteristics, due largely to the presence of the
grocery store.
As shown in Table 2.3-8, after deducting trips which are generated by the existing Wal-Mart facility,
the proposed Wal-Mart Expansion project is projected to generate 238 “net new” unadjusted Wal-
Mart AM peak hour trips, 316 “net new” unadjusted Wal-Mart PM peak hour trips and 283 “net new”
unadjusted Wal-Mart trips during the Saturday peak hour period.

2.3 TRAFFIC AND CIRCULATION
Wal-Mart Expansion City of Chico
Revised Draft Environmental Impact Report April 2009
2.3-28
TABLE 2.3-8
PROJECT TRIP GENERATION
AM Peak Hour Trip Rate PM Peak Hour Trip Rate Saturday Peak Hour Trip
Rate Land Use Category Rate
Unit Total In % Out % Total In % Out % Total In % Out %
Proposed Wal-Mart Superstore
Free Standing
Discount
Superstore1
Per ksf 2.47 51% 49% 5.19 49% 51% 6.26 51% 49%
Gas Station (944)2 Per f.s. 12.07 50% 50% 13.86 50% 50% 19.24 50% 50%
Fast Food
Restaurant w/
Drive-Through
(934)2
Per ksf 53.11 51% 49% 34.64 52% 48% 59.2 51% 49%
Notes: ksf = 1,000 square feet, f.s. = fueling station 1) Trip generation rates equations derived based on the actual field data for Wal-Mart Superstore (see text). 2) Trip generation volumes estimated using the trip rate equations presented in the ITE Trip Generation (7th Edition) for individual use quantities.
Existing Wal-Mart Trip Generation3
AM Peak Hour Trip PM Peak Hour Trip Saturday Peak Hour Trip Land Use
Description Quantity
Total In Out Total In Out Total In Out
Existing Wal-Mart
Trips
125.889
ksf 314 185 129 844 425 419 1,116 594 522
3) Existing Wal-Mart Trips based on actual counts conducted at the Wal-Mart driveways
“Unadjusted “ Proposed Wal-Mart Trip Generation4
AM Peak Hour Trip Rate PM Peak Hour Trip Rate Saturday Peak Hour Trip
Rate Land Use
Description
Rate
Unit Total In% Out% Total In% Out% Total In % Out%
Proposed Wal-Mart
Superstore
Free standing
discount superstore
Per ksf 2.47 51% 49% 5.19 49% 51% 6.26 51% 49%
AM Peak Hour Trip PM Peak Hour Trip Saturday Peak Hour Trip Land Use
Description Quantity
Total In Out Total In Out Total In % Out
Proposed Wal-Mart
Superstore
(“Unadjusted”
Wal-Mart Trips)
223.445
ksf
552
282
270
1,160
568
592
1,399
713
686
Net New “Unadjusted” Wal-
Mart Trips 238 97 141 316 143 173 283 119 164
4) Net New “Unadjusted Trips are derived by subtracting the existing Wal-Mart Trips from the “Unadjusted” Wal-Mart Trips.

2.3 TRAFFIC AND CIRCULATION
City of Chico Wal-Mart Expansion
April 2009 Revised Draft Environmental Impact Report
2.3-29
Net New “Unadjusted” Project Trip Generation (with Diverted/Pass-By and Internal Trips
AM Peak Hour Trip PM Peak Hour Trip Saturday Peak Hour
Trip Land Use
Description Quantity
Total In Out Total In Out Total In Out
Proposed Wal-Mart
Superstore
Gas Station
Fast Food w/
Drive-Through
223.445 ksf
12 f.s.
5 ksf
238
145
266
97
73
136
141
72
130
316
166
173
143
83
90
173
83
83
283
231
296
119
116
151
164
115
145
Total Net New “Unadjusted”
Proposed Project Trips 649 306 343 655 316 339 810 386 424
Note: Net New “unadjusted” External Trips include both diverted/pass-by trips and internal trips.
Internal Trip Reduction5
Internal
Trip
Reduction
%
AM Peak Hour Trip PM Peak Hour Trip Saturday Peak Hour
Trip Land Use
Description
AM, PM, &
Sat. Total In Out Total In Out Total In Out
Proposed Wal-Mart
Superstore
Gas Station
Fast Food w/
Drive-Through
10%
10%
10%
24
14
27
10
7
14
14
7
13
32
16
17
14
8
9
18
8
8
28
23
30
12
12
15
16
11
15
Total Proposed Project
diverted/Pass-by Trips 65 31 34 65 31 34 81 39 42
5) Internal trips calculated based on methodologies outlined within the ITE Generation Handbook (October 1998)
Unadjusted" External Trip Generation (with Diverted Trips)
AM Peak Hour Trip PM Peak Hour Trip Saturday Peak Hour Trip Land Use Description
Total In Out Total In Out Total In Out
Proposed Wal-Mart Superstore
Gas Station
Fast Food w/ Drive-Through
214
131
239
87
66
122
127
65
117
284
150
156
129
75
81
155
75
75
255
208
266
107
104
136
148
104
130
Total “Unadjusted” Proposed
Project External Trips 584 275 309 590 285 305 729 347 382
Note: Unadjusted External Trips includes diverted trips.

2.3 TRAFFIC AND CIRCULATION
Wal-Mart Expansion City of Chico
Revised Draft Environmental Impact Report April 2009
2.3-30
TABLE 2.3-8
PROJECT TRIP GENERATION (CONT.)
Diverted/Pass-By
Diverted/Pass-By
Trip % AM Peak Hour Trip PM Peak Hour Trip
Saturday Peak Hour
Trip Land Use
Description AM, PM Sat. Total In Out Total In Out Total In Out
Proposed Wal-Mart
Superstore6, 7
Gas Station7
Fast Food w/
Drive-Through7
46.4%
42%
49%
45.8%
42%
49%
99
55
117
40
28
67
59
27
50
132
63
76
60
32
44
72
31
32
117
87
130
49
44
74
68
43
56
Total Proposed Project Diverted/Pass-By
Trips 271 135 136 271 136 135 334 167 167
6) Diverted/Pass-By Trip percentage for the Superstore established based on information provided by the City staff and verified with data available from ITE. 7) Diverted//Pass-By Trip percentages established based on multiple ITE source (see text).
Net New Proposed Project Trip Generation
AM Peak Hour Trips PM Peak Hour Trips Saturday Peak Hour
Trips Land Use Description
Total In Out Total In Out Total In Out
Proposed Wal-Mart Superstore
Gas Station
Fast Food w/ Drive-Through
115
76
122
47
38
55
68
38
67
152
87
80
69
43
37
83
44
43
138
121
136
58
60
62
80
61
74
“Net New” Proposed Project
Trips8 313 140 173 319 149 170 395 180 215
8) “Net New” Trips exclude Diverted/Pass-By Trips, internal Trips, and existing Wal-Mart trips within the proposed project. Plus project scenarios were analyzed by adding Diverted/Pass-By Trips at all applicable intersections and the project driveways. Source: Omni Means, 2009
Internal Trip Reductions
As noted previously, this traffic analysis considers development of the entire 10.62 acre site including
the new Wal-Mart Supercenter expansion, gas station, and fast food restaurant. Because the
proposed project is a mixed use development with complimentary land uses, it is expected that
some vehicles visiting one of the three different sections of the project site (Wal-Mart Supercenter,
gas station, and fast food restaurant) will also be visiting one (or both) of the other land uses. For
example, a vehicle leaving the Wal-Mart store may very well stop at the gas station, and/or the fast
food restaurant before leaving the project site. Additionally, some vehicles drawn to the site to stop
at the gas station will also decide to stop at the fast food restaurant (or vice versa), or perhaps the
Wal-Mart store. When a vehicle visits a project site, it is typically calculated as two trips to account
for the inbound and outbound component of the round trip. However, if this same vehicle also
visited one (or both) of the other two land uses, it would result in four (or six) trips when taking into
account the inbound and outbound component to and from each land use. Given the proximity of
the proposed land uses to each other, some of these trips might not even occur using a vehicle but
rather could be accomplished on foot after parking. The primary objective of the traffic analysis is
to analyze impacts to the adjacent roadway system. Therefore it is reasonable to reduce raw trip
generation volumes to account for only the inbound vehicular trip entering the project site, and the
outbound vehicular trip exiting the project site, and neglecting these other internal trips between

2.3 TRAFFIC AND CIRCULATION
City of Chico Wal-Mart Expansion
April 2009 Revised Draft Environmental Impact Report
2.3-31
land uses. Internal trip characteristics were established based on information and methodologies
outlined within the Institute of Transportation Engineers (ITE) Trip Generation Handbook (October
1998) from which internal trip reduction factors for each of the three land uses, and for each analysis
period (daily, AM peak hour, PM peak hour), were established. It is indicated that the Wal-Mart
Expansion project would capture 21 percent and 10 percent internal trips during the AM and PM
peak hour periods, respectively. The gas station would capture 50 percent and 51 percent trips
during the AM and PM peak hour periods, respectively. The fast food restaurant would capture 19
percent and 29 percent trips during the AM and PM peak hour periods, respectively. Similar results
are also anticipated for the Saturday peak hour period. As shown in Table 2.3-8, only a 10 percent
reduction in internal trips (based on PM peak hour for Wal-Mart) was applied within the analysis to
provide for a conservative analysis, while still providing minimal credit for some internal capture.
Pass-by Trips and Diverted Trips
Not all of the traffic generated by either the existing Wal-Mart or the proposed project are newly
generated trips, but rather are trips which will exist with or without the project, and which will be
drawn to the project for a variety of reasons. Pass-by and diverted trips are drawn to the existing
site, and are accounted for within trip generation calculations for the project site. It is expected
that pass-by trips and diverted trips (which are both defined in detail below) are drawn to the
existing site, and will be drawn to the proposed project site, from traffic volumes along: (1) Forest
Avenue, (2) SR 99, (3) 20th Street, (4) Skyway.
Pass-by trips are defined as trips that would occur on the roadway immediately adjacent to the
project with or without the project, which are drawn to the site as a matter of convenience. Within
this analysis, pass-by trips are defined as those trips drawn to the project site that would be traveling
along Forest Avenue. Since pass-by trips would exist along the adjacent roadway with or without
the project, they would not add any trips to any intersections or roadways. However, through
movements at the project driveways would change to left and right-turn movements at the project
driveway intersections, or other intersections such as Forest Avenue/Baney Lane, which channel
traffic to other project driveways.
Diverted trips are similar in nature to pass-by trips. Whereas a pass-by trip is captured from existing
traffic traveling along the roadway adjacent to the project, a diverted trip is captured from existing
traffic along a nearby roadway. To arrive at the site, it is necessary for a diverted trip to go
somewhat “out of its way”, and thus will add trips to selected roadways and intersections in the
vicinity of the project. After leaving the site, the trip will eventually return to the course of travel it
would have been on with or without the project. Since the trip is an existing trip that is already
accounted for, trips are altered or added only to roadway and intersection volumes which
correspond to the diverted portion of the travel route.
Within this analysis, it is assumed that trips will be diverted to the project site from the following
nearby roadways: (1) SR 99 (2) 20th Street, and (3) Skyway.
Diverted/Pass-By trip percentages for the proposed Wal-Mart store were provided by the City and
verified with the following three reference sources:
• Trip Generation Handbook, Institute of Transportation Engineers (ITE), October 1998
• A Study of Pass-by Trips Associated with Retail Development, ITE Journal, March 1991
• Trip Generation Characteristics of Shopping Centers, ITE Journal, June 1996

2.3 TRAFFIC AND CIRCULATION
Wal-Mart Expansion City of Chico
Revised Draft Environmental Impact Report April 2009
2.3-32
Diverted trips percentage for the fast food restaurant type of land use was established following a
review of the ITE Trip Generation Handbook.
It is assumed that the gas station would draw only pass-by trips along Forest Avenue, and not any
diverted trips. Thus, a pass-by trip reduction only was applied for this land use.
As Table 2.3-8 shows within the “Diverted/Pass-By Trips” portion of the table, of the trips generated by
the proposed project, it is assumed that 271 AM peak hour trips, 271 PM peak hour trips and 334
Saturday peak hour trips would be either diverted or pass-by trips which already exist along area
roadways.
“Net New” Project Trips
As shown in Table 2.3-8, after deducting diverted trips, internal trips, and trips which are generated
by the existing Wal-Mart facility, the proposed Wal-Mart Expansion project (including the gas
station/fast food restaurant) is projected to generate 313 “net new” AM peak hour trips, 319 “net
new” PM peak hour trips and 395 “net new” trips during the Saturday peak hour period.
Project Trip Distribution and Assignment
Trip distribution for the Wal-Mart store was analyzed separately from the trip distribution for the gas
station and fast food restaurant because of the different nature of the land uses.
The directional trip distribution and assignment for the Wal-Mart Expansion project was provided by
City staff and was appropriately modified to reflect existing and projected future traffic flows and
travel patterns within the vicinity of the project site. Due consideration was also given for the
location of other similar facilities, and the location of local and regional housing and
employment/commercial centers in relation to the proposed project site when deriving the trip
distribution and assignment patterns for the Wal-Mart Expansion project.
The directional trip distribution and assignment of the gas station/fast food restaurant was estimated
based on the location of other similar facilities, and the location of local and regional housing and
employment/commercial centers in relation to the proposed project site.
Figure 2.3-5a shows the trip distribution for the Wal-Mart superstore and Figure 2.3-5b depicts the trip
distribution for the gas station/fast food restaurant. Figure 2.3-6 shows the resulting project trips
along the study roadways and along effected turning movements at study intersections, assuming
the trip generation, trip distribution, and trip assignment patterns described above.

NO SCALE
Source: Omni-Means Ltd
Figure 2.3-5A“Wal-Mart” Trip Distribution
T:\_
CS\
Wor
k\C
hico
, City
of\
Wal
Mar
t 24
-005
8\Fi
gure
s


NO SCALE
Source: Omni-Means Ltd
Figure 2.3-5B“Fast Food Restaurant/Gas Station” Trip Distribution
T:\_
CS\
Wor
k\C
hico
, City
of\
Wal
Mar
t 24
-005
8\Fi
gure
s


NO SCALE
Source: Omni-Means Ltd
T:\_
CS\
Wor
k\C
hico
, City
of\
Wal
Mar
t 24
-005
8\Fi
gure
s
Figure 2.3-6Project Only Traffic Volumes


2.3 TRAFFIC AND CIRCULATION
City of Chico Wal-Mart Expansion
April 2009 Revised Draft Environmental Impact Report
2.3-39
Project Site Access
The project would utilize all of the existing driveways on Baney Lane, Business Lane, and Forest
Avenue, as well as two new additional driveways to the south onto Wittmeier Drive as part of the
expansion. At present, all of the access points are full access intersections permitting left-turns in
and out of the project site, with the exception of the Forest Avenue driveway, which is a right-
in/right-out driveway. The main project access to the existing Wal-Mart store is currently provided
via the signalized intersection of Forest Avenue/Baney Lane, with traffic traveling to/from the existing
Wal-Mart driveways via Baney Lane.
More detailed descriptions of all of the proposed project driveways, with changes and modifications
pertaining to circulation patterns following the expansion, are provided below:
• As will be discussed under the impacts and mitigation section of the report, it is assumed that
vehicular movements along the back alley to/from the Baney Lane/Business Lane
intersection will be restricted to southbound through movements. Whereas traffic from the
existing Wal-Mart store can currently exit out via the back alley and Business Lane, it is
recommended (and assumed within the analysis) that appropriate signage be provided to
prohibit northbound movements along the back alley to minimize project traffic exiting onto
Business Lane. The primary truck route for the store is via the Baney Lane/Business Lane
intersection with trucks continuing south along the back alley to access the truck bays
located near the southwestern portion of the store. When departing from the store, it is
assumed the trucks will exit primarily via Wittmeier Drive, although departure would be
possible via the alley.
• Traveling east along Baney Lane from Business Lane, the Baney Lane/Wal-Mart West
Driveway is located approximately 100 feet east of Business Lane.
Note: A review of the proposed project site plan shows that there is adequate internal
circulation to allow vehicles to access the westernmost driveway from the main parking lot.
Given that this driveway is located away from the main parking area, and thus experiences
minimal traffic volumes, the net effect is that while some opportunity is provided to make an
outbound left turn toward Business Lane, the actual number of left turns will be minimal, and
negligible for purposes of this traffic analysis.
• The Baney Lane/Wal-Mart Central Driveway is located approximately 480 feet east of
Business Lane, and approximately 700 feet west of Forest Avenue. The proposed project site
plan (Figure 2.3-1) calls for the construction of a raised channelization island to physically
prohibit outbound left turns at this driveway, proposed to address both restricted sight
distance to the east and to encourage traffic to utilize the Forest Avenue access rather than
the Business Lane to Toys R Us private street route. This restriction will be required, and
assumed within the traffic analysis, and existing outbound left-turns from Wal-Mart at this
driveway have been appropriately reassigned onto the network.
• The “new” Baney Lane/Wal-Mart East Driveway is located approximately 450 feet west of
Forest Avenue and approximately 150 feet west of the existing driveway as depicted in
Figure 2.3-1. The proposed project site plan calls for the construction of a raised
channelization island to physically prohibit outbound left turns at this driveway. This
restriction will be required, and assumed within the traffic analysis, and existing outbound
left-turns from the Wal-Mart at this driveway have been appropriately reassigned onto the
network.
• As with the existing store, the Forest Avenue driveway would provide right-in/right-out access
to the project site.

2.3 TRAFFIC AND CIRCULATION
Wal-Mart Expansion City of Chico
Revised Draft Environmental Impact Report April 2009
2.3-40
• The Wittmeier Drive/Forest Avenue intersection would provide full access to the project site
via two new driveways located along Wittmeier Drive.
• The Wittmeier Drive/Forest Avenue intersection (via a new driveway located along Wittmeier
Drive) and the Forest Avenue driveway will provide access to the 2.42 acre out parcel.
Project On-Site Circulation
As the site plan shows, a major component of the on-site circulation system consists of one-way drive
aisles located to the east of the proposed store striped for diagonal parking. As noted within the
Project Site Access section, Business Lane and Wittmeier Drive will provide access to the truck
docking facilities located along the rear of the store. The overall layout of the site provides
satisfactory vehicle circulation throughout the project site. The project site plan also provides for a
pedestrian system of sidewalks and crosswalks which will channel pedestrians arriving from the new
sidewalk/crosswalk system along Forest Avenue to the new store.
Project Truck Traffic
The existing Wal-Mart store currently averages 61 deliveries per week, 31 of which are large 18-wheel
semi trucks. It is anticipated that the proposed Wal-Mart Expansion project will have an average of
85 deliveries per week, 24 more than the existing store. Of these, it is anticipated that 39 will be
large semi trucks, which is 8 more than the existing store. Review of the project site plan shows that
the overall layout of the site provides satisfactory truck access and circulation throughout the site.
The existing truck route/fire lane behind the existing store would remain, but it would be extended.
A truck turnaround approximately 130 feet in diameter would be designated at the end of the truck
route extension, in the southwestern portion of the project site.
Currently, trucks entering the store use Baney Lane/Business Lane, with trucks continuing south along
the back alley to access the truck bays located near the southwestern portion of the store. When
departing from the store, trucks exit via the alley onto Baney Lane or via the internal roadway to the
Forest Avenue driveway.
For the proposed expansion, the primary truck route for the store is anticipated to be via the Baney
Lane/Business Lane intersection with trucks continuing south along the back alley to access the
truck bays located near the southwestern portion of the store. When departing from the store, it is
assumed that the trucks will exit primarily via Wittmeier Drive, although departure would be possible
via the alley.
Project Roadway Improvements
The project circulation improvements that will be in place following the expansion are provided
below:
• The redesigned intersection of Forest Avenue/Wittmeier Drive would be signalized and
improved to contain the following lane geometrics:
−−−− The northbound Forest Avenue approach would provide a through lane, combined
through-right lane and a lengthened exclusive left-turn lane.
−−−− The southbound Forest Avenue approach would provide a through lane, combined
through-right lane and a lengthened exclusive left-turn lane.

2.3 TRAFFIC AND CIRCULATION
City of Chico Wal-Mart Expansion
April 2009 Revised Draft Environmental Impact Report
2.3-41
−−−− The Wittmeier Drive leg of the intersection of Forest/Wittmeier/Talbert Drive is
approximately 40 feet wide with parking activity on both sides. The cul-de-sac is
approximately 425 feet in length before the bulb, with driveways providing access to the
south occurring approximately 150 feet west of the intersection. The eastbound
Wittmeier Drive approach will be improved to provide a left-turn lane, combined left-
through lane and a right turn lane for the following reasons:
• The queue will rarely extend past the southern driveways, so will result in fewer
conflicts.
• The dual left-turn lanes and LOS D conditions for the left-turn are acceptable and will
help in reducing demand at the Baney Lane eastbound left-turn movement at Forest
Avenue, which will in turn reduce pressure on the 20th Street/Toys R Us intersection.
• To accommodate this improvement, the road cross-section will be widened from 40 feet to
64 feet to accommodate 4, 12-foot lanes (three eastbound and one westbound lane) and
2, 8-foot parking shoulders.
−−−− The westbound Talbert Drive (Wittmeier Drive changes to Talbert Drive east of Forest
Avenue) approach would provide a combined through-right-left lane.
• The existing traffic signal at the intersection of Forest Avenue/Baney Lane will be modified as
follows:
−−−− The eastbound Baney Avenue approach would include dual 150 foot eastbound left-
turn lanes approaching Forest Avenue, with approximately 50 feet leading to the dual
left-turn lanes and a combined through-right lane.
−−−− The northbound Forest Avenue approach would provide a through lane, combined
through-right lane and a lengthened exclusive left-turn lane.
SHORT TERM (2010) CONDITIONS
At the direction of the City of Chico, Short Term conditions within this analysis are taken as year 2010,
which is the time at which the proposed project is expected to be completely built and fully
occupied. Raw 2010 traffic volumes were provided by the City (obtained from the following two
sources: (1) Chico 2005-2006 Update of Development Impact Fees Analysis and Recommendations,
Nexus Study, City of Chico, October 2005 and (2) Meriam Park Phasing Analysis, W-Trans, May 2,
2007) and included traffic from the first phase of the Meriam Park, and the proposed Wal-Mart
Expansion project. For purposes of this traffic analysis, it is necessary to back out the specific traffic
volumes within the raw volumes associated with the Wal-Mart Expansion project (provided by the
City) for no project conditions, and add them back for plus project conditions.
The Short Term Plus Project condition is the analysis scenario in which traffic impacts associated with
the proposed project (i.e., the Chico Wal-Mart) are investigated in comparison to the Short Term No
Project condition scenario. Wal-Mart Expansion volumes as established using trip generation and
distribution methodologies provided for within this analysis were added to Short Term No Project
volumes to establish Short Term Plus Project volumes. Short Term conditions assume that some
programmed or planned improvements might be completed, including potentially some project
related improvements.

2.3 TRAFFIC AND CIRCULATION
Wal-Mart Expansion City of Chico
Revised Draft Environmental Impact Report April 2009
2.3-42
Roadway/Intersection Improvements
Based on discussions with the City of Chico staff, it is understood that improvements are planned for
the following four intersections, and likely to be completed by Year 2010. These improvements are
funded under the Nexus Study. A copy of the memo which describes these improvements has been
included in the Appendix C of the original DEIR.
Intersection #1 - E. 20th Street/Whitman Ave:
1) A northbound right-turn overlap phase has been installed.
Intersection #6 - E. 20th Street/Forest Ave:
1) NB approach – a second-left turn lane would be added, and the storage length
increased for both left-turn lanes.
2) SB approach – Traffic signal phasing would be modified to add a right-turn green arrow.
3) EB approach – An exclusive right-turn lane would be provided. Traffic signal phasing
would be modified to include a right-turn arrow.
4) WB approach – The approach would consist of one through-right lane, two through
lanes and one left-turn lane.
Intersection #17 Skyway/SR 99 SB off ramp:
1) Existing westbound traffic must cross eastbound traffic to enter the southbound on-ramp.
This will be eliminated and replaced with a new southbound loop on-ramp on the
northwest side of the interchange.
2) The existing southbound off-ramp for eastbound traffic will be eliminated.
3) The existing southbound off-ramp for westbound traffic will be widened to include all off-
ramp traffic. A new signal will be installed at Skyway and the southbound off-ramp traffic
to allow protected east and west movements onto the Skyway.
Intersection #18 - SR 99/Skyway Northbound ramp intersection:-
1) There will be a single on-ramp that will widen to two lanes to provided additional
capacity.
Intersection #19 - Skyway/Notre Dame Blvd.:
Improvements include roadway widening to both Skyway and Notre Dame Blvd. as follows:
1) The improvements for southbound Notre Dame traffic include an additional right-hand
turn lane, a bike lane, a through-left lane, and a left-hand turn lane at the Skyway
intersection.
2) Skyway will add an exclusive right-turn lane for northbound traffic at Notre Dame. An
additional eastbound through lane will be added through the intersection.

2.3 TRAFFIC AND CIRCULATION
City of Chico Wal-Mart Expansion
April 2009 Revised Draft Environmental Impact Report
2.3-43
These improvements are shown in Figure 2.3-7, and will be assumed to be in place for Short Term
conditions both with and without the proposed project. Existing lane geometrics and control will be
used for analysis at all other study locations.
Short Term No Project Traffic Operations
Short Term (2010) conditions typically refer to analysis scenarios which will exist around Year 2010,
and represent development which is expected to occur by that date including the first phase of
the Meriam Park project (see Table 2.3-9). Figure 2.3-8 shows the Short Term No Project traffic
volumes used in this study established using methodologies described previously.
Intersections
Short Term No Project peak hour intersection traffic operations were analyzed utilizing derived Short
Term No Project peak hour intersection traffic volumes (shown on Figure 2.3-8) and year 2010 lane
geometries and control (shown on Figure 2.3-7). Table 2.3-10 provides a summary of the resulting
peak hour intersection levels of service for the City maintained intersections.
TABLE 2.3-9
PROPOSED, ASSUMED, AND APPROVED PROJECTS
Project Name Commercial Square Footage Residential Units
BHA Senior Congregate Care Facility --- 50
Enloe Hospital 117,860 --
Wal-Mart Expansion 71,000 --
Wal-Mart North 88,750 --
Kohls Shopping Center 86,854 --
Butte Community College Government Office Building 27,349 --
Marriott Hotel -- 119 rooms
Forest Retail Shopping Center 6,816 --
Whitman Tractor Supply 28,116 --
Costco Store 18,046 --
Pacific Retail Shopping Center 53,250 --
West Airport Industrial Park 623,200 --
Oak Valley (Mixed Use) 41,420 494
Hillview -- 210
Belvedere Heights -- 136
Mountain View (Mixed Use) 17,750 270
Sycamore Glen -- 211
McKinney Ranch -- 46
Tuscan Village -- 142
Meriam Park (Mixed Use) 109,006 1,216
Barber Yard -- 418
Doe Mill -- 213
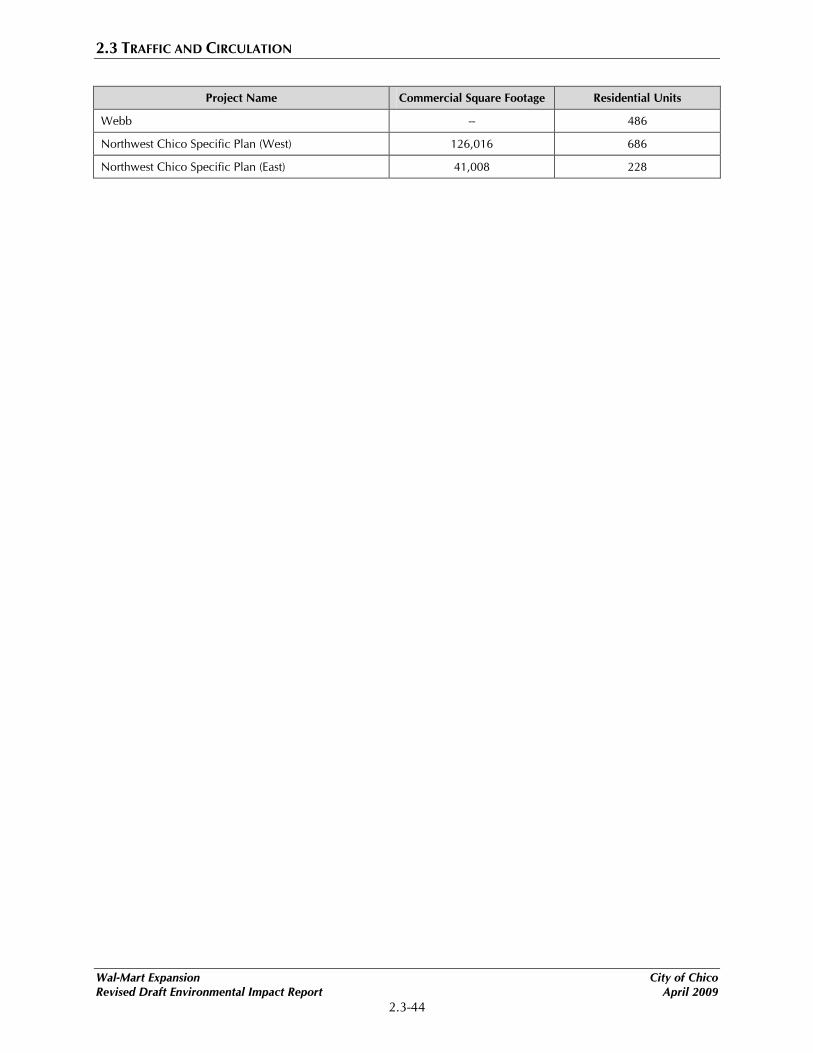
2.3 TRAFFIC AND CIRCULATION
Wal-Mart Expansion City of Chico
Revised Draft Environmental Impact Report April 2009
2.3-44
Project Name Commercial Square Footage Residential Units
Webb -- 486
Northwest Chico Specific Plan (West) 126,016 686
Northwest Chico Specific Plan (East) 41,008 228
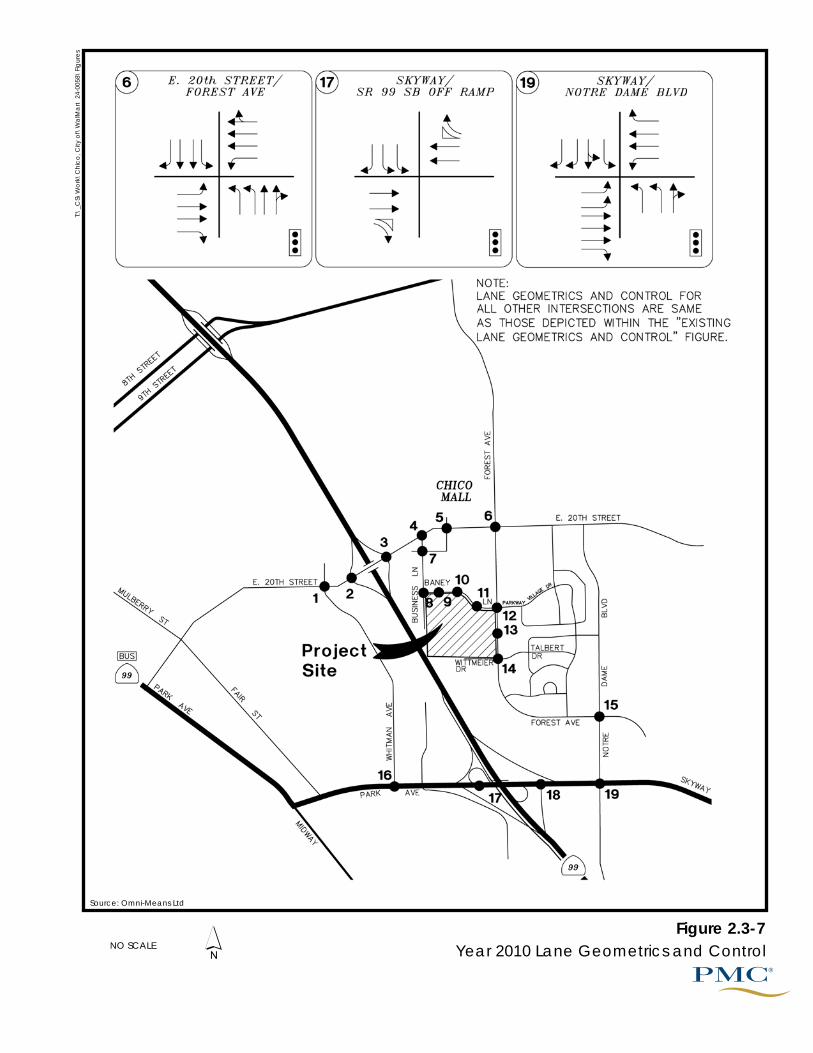
NO SCALE
Source: Omni-Means Ltd
Figure 2.3-7Year 2010 Lane Geometrics and Control
T:\_
CS\
Wor
k\C
hico
, City
of\
Wal
Mar
t 24
-005
8\Fi
gure
s


2.3 TRAFFIC AND CIRCULATION
City of Chico Wal-Mart Expansion
April 2009 Revised Draft Environmental Impact Report
2.3-47
TABLE 2.3-10
SHORT TERM NO PROJECT CONDITIONS: INTERSECTION LEVELS-OF-SERVICE
AM Peak Hour PM Peak Hour Saturday Peak Hour
# Intersection Control
Type1
Target
LOS Delay
L
O
S
Warrant
Met2 Delay
L
O
S
Warrant
Met2 Delay
L
O
S
Warrant
Met2
1 E. 20th St / Whitman
Ave Signal D 14.3 B - 23.5 C - 30.4 C -
2 E. 20th St / SR 99 SB
Ramps Signal D 22.3 C - 31.1 C - 29.5 C -
3 E. 20th St / SR 99 NB
Ramps Signal D 13.6 B - 53.1 D - 23.3 C -
4 E. 20th St / Business
Ln TWSC D 9.6 A No 11.4 B No 11.0 B No
5 E. 20th St / Chico
Mall Access Signal D 13.5 B - 36.0 D - 56.5 E -
6 E. 20th St / Forest
Ave Signal D 25.2 C - 32.5 C - 33.4 C -
LOS conditions do not apply to intersections 7 through 11 which are private intersections.
Significance is discussed under Impact 2.3.2 of this Traffic Section.
12
Forest Ave / Baney
Ln-Parkway Village
Dr
Signal D 24.4 C - 27.2 C - 29.2 C -
13 Forest Ave / Wal-
Mart Driveway TWSC D 10.2 B No 11.7 B No 10.9 B No
14 Forest Ave / Talbert
Dr-Wittmeier Dr TWSC D 19.5 C No 75.7 F No 84.2 F No
15 Forest Ave / Notre
Dame Blvd Signal D 18.1 B - 15.4 B - 11.6 B -
16 E. Park Ave /
Whitman Rd Signal D 8.5 A - 23.7 C - 22.0 C -
17 E. Park Ave-Skyway
/ SR 99 SB Ramps Signal D 19.1 B - 21.7 C - 10.5 B -
18 E. Park Ave-Skyway
/ SR 99 NB Ramps Signal D 10.5 B - 12.1 B - 11.3 B -
19 Skyway / Notre
Dame Blvd Signal D 22.4 C - 31.2 C - 31.3 C -
Source: Omni Means, 2009
Notes: Bolded entries indicate intersections operating as an Unacceptable LOS.
1) TWSC = Two-Way-Stop-Control (LOS and delay are based on LOS and delay for worst approach).
2) Warrant = Caltrans peak hour-volume based signal warrant.
3) Pvt = private roadways, driveways and/or intersections. City LOS criteria not applicable and excess delays analyzed in terms of
unacceptable vehicle conflict and safety issues.

2.3 TRAFFIC AND CIRCULATION
Wal-Mart Expansion City of Chico
Revised Draft Environmental Impact Report April 2009
2.3-48
This page is intentionally left blank.

NO SCALE
Source: Omni-Means Ltd
T:\_
CS\
Wor
k\C
hico
, City
of\
Wal
Mar
t 24
-005
8\Fi
gure
s
Figure 2.3-8Year 2010 No Project Traffic Volumes


NO SCALE
Source: Omni-Means Ltd
Figure 2.3-9Year 2010 No Project Freeway Mainline and Ramp Volumes
T:\_
CS\
Wor
k\C
hico
, City
of\
Wal
Mar
t 24
-005
8\Fi
gure
s


2.3 TRAFFIC AND CIRCULATION
City of Chico Wal-Mart Expansion
April 2009 Revised Draft Environmental Impact Report
2.3-53
Note that operations at a few of the intersections in Table 2.3-10 improve over the Existing conditions
either due to improvements assumed under Short Term conditions or traffic projections which are
lower than the existing traffic volumes.
As shown in Table 2.3-109, the following intersections were found to operate at unacceptable LOS
under Short Term No Project conditions during at least one peak hour period.
• E. 20th Street/Chico Mall Access – This signalized intersection is projected to operate at
unacceptable LOS “E” during the Saturday peak hour period.
• Forest Avenue/Talbert-Wittmeier Drive – This unsignalized intersection is projected to operate
at unacceptable LOS “F” during the PM and Saturday peak hour periods based on the
delay anticipated along the stop controlled Talbert - Wittmeier approaches.
Freeway Mainline Segments
Short Term No Project peak hour mainline operations were evaluated utilizing the existing peak hour
traffic volumes shown on Figure 2.3-9. Table 2.3-11 summarizes Short Term No Project conditions SR
99 freeway mainline operations.
TABLE 2.3-11
SHORT TERM NO PROJECT CONDITIONS: SR 99 MAINLINE LEVELS-OF-SERVICE
AM Peak Hour PM Peak Hour Saturday Peak Hour Freeway
Mainline
Segment
No.
Lanes
Target
LOS Volume Density
(pc/mi/ln) LOS Volume
Density
(pc/mi/ln) LOS Volume
Density
(pc/mi/ln) LOS
SR 99 NB,
north of
Skyway I/C
2 E 2,256 20.2 C 3,263 30.3 D 2,455 22.0 C
SR 99 SB,
north of
Skyway I/C
2 E 2,897 26.2 D 2,613 23.5 C 1,926 17.3 B
SR 99 NB,
north of 20th
Street I/C
2 E 2,673 24.0 C 3,927 42.2 E 2,889 26.1 D
SR 99 SB,
north of 20th
Street I/C
2 E 2,988 27.1 D 2,780 25.0 C 2,019 18.1 C
Source: Omni Means, 2009 Notes: pc/mi/ln = Passenger Cars per Mile per Lane
As shown in Table 2.3-11, all four mainline segments are projected to operate at acceptable LOS
(LOS “E” or better) during AM, PM and Saturday peak hour periods under Short Term No Project
conditions.
Freeway Ramp Junctions
Short Term No Project peak hour ramp operations were evaluated utilizing the Short Term No Project
peak hour traffic volumes shown on Figure 2.3-8. Table 2.3-12 presents the Short Term No Project
conditions’ ramp merge/diverge peak hour LOS at the three study interchange locations in the
vicinity of the study area.

2.3 TRAFFIC AND CIRCULATION
Wal-Mart Expansion City of Chico
Revised Draft Environmental Impact Report April 2009
2.3-54
TABLE 2.3-12
SHORT TERM NO PROJECT CONDITIONS: SR 99 RAMP JUNCTION LEVELS-OF-SERVICE
AM Peak Hour PM Peak Hour Saturday Peak Hour SR 99 & Skyway
Interchange
Junction
Type
Target
LOS Density
(pc/mi/ln) LOS
Density
(pc/mi/ln) LOS
Density
(pc/mi/ln) LOS
SR 99 NB Direct On-
Ramp Merge E 20.7 C 27.1 C 28.5 D
SR 99 NB Loop On-
Ramp Merge E 12.0 B 18.9 B 13.2 B
SR 99 SB Off-Ramp Diverge E 30.9 D 28.0 D 21.1 C
AM Peak Hour PM Peak Hour Saturday Peak Hour SR 99 & 20th Street
Interchange
Junction
Type
Target
LOS Density
(pc/mi/ln) LOS
Density
(pc/mi/ln) LOS
Density
(pc/mi/ln) LOS
SR 99 NB Off-Ramp Diverge E 24.5 C 34.6 D 26.5 C
SR 99 NB On-Ramp Merge E 22.4 C 35.6 F 27.1 C
SR 99 SB Off-Ramp Diverge E 31.8 D 29.7 F 22.1 C
SR 99 SB On-Ramp Merge E 21.1 C 12.3 B 8.1 A
AM Peak Hour PM Peak Hour Saturday Peak Hour SR 99 & SR 32
Interchange
Junction
Type
Target
LOS Density
(pc/mi/ln) LOS
Density
(pc/mi/ln) LOS
Density
(pc/mi/ln) LOS
SR 99 NB Off-Ramp Diverge E 28.6 D 41.2 F 30.8 D
SR 99 SB On-Ramp Merge E 27.6 C 25.6 C 17.6 B
Source: Omni Means, 2009 Notes: Bolded entries indicate intersections operating at Unacceptable LOS. pc/mi/ln = Passenger Cars per Mile per Lane
As shown in Table 2.3-12, all study ramp merge/diverge junctions are projected to operate at
acceptable LOS (LOS “E” or better) during AM, PM and Saturday peak hour periods under Short
Term No Project conditions, with the exception of the following ramp junctions which are projected
to operate at unacceptable LOS F:
• Northbound on-ramp at the SR 99/20th Street interchange
• Southbound off-ramp at the SR 99/20th Street interchange
• Northbound off-ramp at the SR 99/SR-32 interchange
Chico Mall Expansion Improvements
Currently, the Chico Mall is processing the necessary applications to facilitate an expansion. City
staff working in conjunction with Mall representatives, their engineer, and Caltrans, identified certain
necessary improvements along the E. 20th Street corridor to facilitate the expansion and improve
traffic operations along the E. 20th Street corridor. The improvements are described as follows:

2.3 TRAFFIC AND CIRCULATION
City of Chico Wal-Mart Expansion
April 2009 Revised Draft Environmental Impact Report
2.3-55
• E. 20th Street – Widening: E. 20th Street will be widened from a four-lane roadway to a six-
lane roadway between SR 99 and E. 20th Street/Forest Avenue intersection. Additional
modifications are planned to the centerline median to provide required vehicle stacking
and landscaping.
• E. 20th Street – Modified Existing Main Chico Mall Access/ToysRUs Access: The existing Main
Chico Mall Access will be modified to eliminate certain turning movements. No changes are
proposed for the existing ToysRUs Access.
• E. 20th Street – Modified Chico Mall Access/ToysRUs Access Signal Timing: Signal Phasing will
be modified to increase intersection capacity.
• E. 20th Street – New Chico Mall Access: A new signalized T-intersection entrance will be
constructed, west of the Kentucky Fried Chicken building, and will provide for the full range
of turning movements.
• E. 20th Street – Existing Eastern Chico Mall/Target Access: The existing Eastern (unsignalized)
Chico Mall Access will be eliminated. No changes are proposed for the existing Target
Access.
These planned public/private improvements are dependent on the Chico Mall proceeding with the
planned expansion and therefore, not a certainty. Therefore, their construction is not assumed for
purpose of this analysis.
Short Term No Project Traffic Operations without Roadway Improvements Identified For Chico Mall
Expansion
City Intersections
The following intersections under the jurisdiction of the City are found to be operating at an
undesirable level of service under Short Term No Project conditions.
E. 20th Street/Chico Mall Access – The signalized intersection would operate at unacceptable LOS
“E” during the PM and Saturday peak hour periods under Short Term No Project conditions. The
improvement identified under Existing conditions (overlapping southbound right turn and restricting
the eastbound to westbound U-turns) would not provide acceptable levels of service for Short Term
conditions. Implementing the proposed improvements as discussed within the Chico Mall Expansion
Improvements section, would yield acceptable operations at the E 20th St./Chico Mall Access
intersection. These planned public/private improvements are dependent on the Chico Mall
proceeding with the planned expansion and, therefore, are not a certainty.
Forest Avenue/Wittmeier Drive – This unsignalized intersection would operate unacceptably at LOS
“F” during the PM and Saturday peak hour periods under Short Term No Project conditions. The
intersection would operate at unacceptable LOS until the signalization improvements associated
with the proposed Wal-Mart expansion development are implemented. The intersection does not
meet Caltrans peak hour volume signal warrant criteria for Short Term No Project conditions, and as
no other improvements to the intersection would improve the levels of service, no improvements are
recommended under Short Term No Project conditions at this intersection.

2.3 TRAFFIC AND CIRCULATION
Wal-Mart Expansion City of Chico
Revised Draft Environmental Impact Report April 2009
2.3-56
Private Intersections
As mentioned above, five of the intersections analyzed within the traffic study are private streets for
which there are no designated standards of significance. These include Baney Lane, Business Lane,
and all private driveways leading to City streets (i.e. Wal-Mart driveways). The City of Chico has
established that the City's LOS standards should not be applied to private intersections or private
driveway approaches to City arterials. As previously described, LOS is a qualitative measure of
operating conditions within a traffic stream, and their perception by motorists and/or passengers. A
LOS definition generally describes these conditions in terms of such factors as speed, travel time,
freedom to maneuver, comfort and convenience, and safety.
While these intersections were evaluated based on traffic issues related to safety issues only (sight
distance, adherence to design standards, turn lane warrants, conflicts with adjacent intersections,
and/or potential for vehicle conflicts), the qualitative measure of LOS can still be applied as a useful
measurement of intersection efficiency. Therefore, even though the City's LOS standards will not be
applied to private intersections or private driveway approaches to City arterials for the purposes of
impact analysis, the qualitative measure of LOS can still be used describe the functionality of these
intersections. Yet it is important to note that impacts related to congestion were only considered if it
impacted adjacent intersections or traffic safety.
• Business Lane/ToysRUs Access – This unsignalized intersection which is located approximately
150 feet south of the intersection with East 20th Street is designed with typical minor street
standards with stop controls on the westbound approach and adequate sight distance for
all movements. In addition, there has not been a demonstrated safety problem in the past.
Traffic in the area generally moves at slow speeds and is projected to operate inefficiently
though safely during the PM and Saturday Peak hour periods, respectively, based on the
delay along the worst approach (westbound ToysRUs Access) under Short Term No Project
conditions.
• Baney Lane/Wal-Mart Driveways – Baney Lane is currently narrow and only is wide enough
for one lane in each direction, west of the easternmost driveway. The street currently serves
three Wal-Mart driveways on the south, two gas station driveways to the northeast and a
hotel driveway to the northwest. The Wal-Mart driveways which intersect Baney Lane would
operate inefficiently though safely during the PM and Saturday peak hour periods based on
the delay along the worst approach (southbound driveway) under Short Term No Project
conditions. Long queuing would be experienced only by southbound vehicles within the
driveway exiting the gas station in the northwest quadrant of the Forest Avenue/Baney Lane
intersection during the PM peak hour period. During the Saturday peak hour period, both
the northbound and southbound approaches at the intersection would operate with low
efficiency, though safely.
• Business Lane/Baney Lane – This unsignalized intersection is designed with typical minor street
standards with adequate sight distance and stop control on the westbound Baney Lane
approach. There is one approach lane in each direction.
• A discussion of project impacts potentially resulting in safety related issues with these
intersections are provided below under the subsection Short Term Plus Project Traffic
Operations.

2.3 TRAFFIC AND CIRCULATION
City of Chico Wal-Mart Expansion
April 2009 Revised Draft Environmental Impact Report
2.3-57
Ramp Junctions
SR 99/20th Street Interchange – Northbound On-Ramp – The northbound on-ramp at the SR 99/20th
Street interchange would operate at unacceptable LOS “F” during the PM peak hour under Short
Term No Project conditions. The poor level of service is due to the high volume of traffic utilizing the
on-ramp. Provision of an eastbound to northbound loop-on ramp would yield acceptable LOS for
the on-ramp:
Note that this improvement will be in place under year 2020 conditions.
SR 99/20th Street Interchange – Southbound Off-Ramp – The southbound off-ramp at the SR 99/20th
Street interchange would operate at unacceptable LOS “F” during the PM peak hour under Short
Term No Project conditions. The poor level of service is due to the high volume of traffic utilizing the
off-ramp to access Chico Mall and other retail land uses along 20th Street. Provision of a 2-lane
southbound off-ramp (two lanes exiting off the freeway) would yield acceptable operations at the
southbound SR 99 off-ramp diverge junction to 20th Street.
SR 99/SR 32 Interchange – Northbound Off-Ramp – The northbound off-ramp at the SR 99/SR 32
interchange would operate at unacceptable LOS “F” during the PM peak hour under Short Term No
Project conditions. Provision of an additional through lane on the mainline would yield acceptable
operations at the northbound SR 99 off-ramp diverge junction to SR 32.
Short Term Plus Project Traffic Operations
The Short Term Plus Project condition is the analysis scenario in which traffic impacts associated with
the proposed project (i.e., the Chico Wal-Mart Store Expansion) are investigated in comparison to
the Short Term No Project condition scenario.
Intersections
Short Term Plus Project conditions were simulated by superimposing traffic generated by the
proposed project onto Short Term No Project intersection traffic volumes. The resulting Short Term
Plus Project traffic volumes are illustrated in Figure 2.3-10. Short Term Plus Project peak hour
intersection traffic operations were quantified utilizing the Short Term Plus Project peak hour
intersection traffic volumes. Table 2.3-13 contains a summary of the resulting Short Term Plus Project
intersection levels of service.
TABLE 2.3-13
SHORT TERM PLUS PROJECT INTERSECTION LEVELS-OF-SERVICE
AM Peak Hour PM Peak Hour Saturday Peak Hour
# Intersection Control
Type1
Target
LOS Delay
L
O
S
Warran
t Met2 Delay
L
O
S
Warrant
Met2 Delay
L
O
S
Warrant
Met2
1 E. 20th St /
Whitman Ave Signal D 14.3 B - 23.7 C - 30.9 C -
2 E. 20th St / SR 99 SB
Ramps Signal D 22.3 C - 32.7 C - 30.8 C -
3 E. 20th St / SR 99
NB Ramps Signal D 13.6 B - 54.8 D - 23.4 C -
4 E. 20th St / Business
Ln TWSC D 9.7 A No 11.5 B No 11.1 B No
5 E. 20th St / Chico
Mall Access Signal D 13.5 B - 36.6 D - 60.7 E -
6 E. 20th St / Forest
Ave Signal D 27.2 C - 33.5 C - 35.4 D -

2.3 TRAFFIC AND CIRCULATION
Wal-Mart Expansion City of Chico
Revised Draft Environmental Impact Report April 2009
2.3-58
AM Peak Hour PM Peak Hour Saturday Peak Hour
# Intersection Control
Type1
Target
LOS Delay
L
O
S
Warran
t Met2 Delay
L
O
S
Warrant
Met2 Delay
L
O
S
Warrant
Met2
LOS conditions do not apply to intersections 7 through 11 which are private intersections.
Significance is discussed under Impact 2.3.2 of this Traffic Section.
12
Forest Ave / Baney
Ln-Parkway Village
Dr
Signal D 24.4 C - 27.6 C - 29.8 C -
13 Forest Ave / Wal-
Mart Driveway TWSC D 11.3 B No 13.2 B No 12.8 B No
14 Forest Ave / Talbert
Dr-Wittmeier Dr Signal D 28.8 C - 29.8 C - 33.0 C -
15 Forest Ave / Notre
Dame Blvd Signal D 18.1 B - 15.4 B - 11.6 B -
16 E. Park Ave /
Whitman Rd Signal D 8.5 A - 23.7 C - 22.1 C -
17 E. Park Ave-Skyway
/ SR 99 SB Ramps Signal D 19.1 B - 21.8 C - 10.5 B -
18 E. Park Ave-Skyway
/ SR 99 NB Ramps Signal D 10.9 B - 12.6 B - 11.8 B -
19 Skyway / Notre
Dame Blvd Signal D 23.7 C - 33.2 C - 32.3 C -
Source: Omni Means, 2009 Notes: Bolded entries indicate intersections operating as an Unacceptable LOS. TWSC = Two-Way-Stop-Control (LOS and delay are based on LOS and delay for worst approach). Warrant = Caltrans peak hour-volume based signal warrant. Pvt = private roadways, driveways and/or intersections. City LOS criteria not applicable and excess delays analyzed in terms of unacceptable vehicle conflict and safety issues.

NO SCALE
Source: Omni-Means Ltd
T:\_
CS\
Wor
k\C
hico
, City
of\
Wal
Mar
t 24
-005
8\Fi
gure
s
Figure 2.3-10Year 2010 Plus Project Traffic Volumes


2.3 TRAFFIC AND CIRCULATION
City of Chico Wal-Mart Expansion
April 2009 Revised Draft Environmental Impact Report
2.3-61
Whereas the intersection of Forest Avenue/Talbert-Wittmeier Drive was found to be operating
unacceptably at LOS F under Short Term No Project conditions during the PM and Saturday peak
periods, with the plus project roadway improvements in place, the intersection is projected to
operate at LOS “C” during all three study peak periods.
Based on a comparison of “no project” vs. “plus project” intersection levels of service as presented
in Table 2.3-10 and Table 2.3-13, respectively, the following intersections which were found to
operate unacceptably for Short Term No Project conditions will experience an increase in delay with
the addition of project traffic as described below:
• E. 20th Street/Chico Mall Access – This signalized intersection is projected to continue to
operate at unacceptable LOS “E” during the PM and Saturday peak hour periods, with an
increase in intersection delay of 4.2 seconds following implementation of the proposed
project.
Private Intersections
• Business Lane/ToysRUs Access –Based on the traffic projections used in the traffic report
prepared for the project, this intersection would be expected to experience an increase in
delay and queuing on the westbound approach in the ToysRUs parking lot. The introduction
of a traffic signal would not be appropriate given that it is only 150 feet from the Business
Lane intersection with East 20th Street. If the intersection were to remain unsignalized, it is
anticipated that drivers familiar with the area would seek alternative ingress and egress
routes if undesirable queues are observed. Given the intersection design, anticipated turning
movements, stop controlled westbound approach, sight distance adequacy, slower traffic
movements and past safety history, it is not anticipated that vehicle conflict/safety impacts
will arise at this location with added traffic generated by the project and adjacent
development. Therefore, this intersection is expected to operate acceptably.
• Baney Lane/Wal-Mart Driveways –Future development on the north side of the street will
introduce additional driveways. Analysis of circulation and safety issues along Baney Lane
are influenced by the traffic volumes, number of driveways, horizontal curve in the center
section of the street and proximity to the signalized intersection with Forest Avenue.
Placement of driveways including the relocation and left-turn restriction to the Wal-Mart
easternmost driveway (discussed earlier) were recommended to avoid conflicts with
eastbound vehicles queuing at the Forest Avenue traffic signal. Outbound left-turn
restrictions at this driveway (intersection 11) along with the central driveway (intersection 10)
were recommended to force outbound traffic to utilize Forest Avenue. (Since Business Lane is
a private street and has no westbound access to East 20th Street, the City has established a
need to channelize traffic towards Forest Avenue). The project will increase left-turning
movements off of Baney Lane. These volumes combined with the existing turning
movements, proximity to the Forest Avenue intersection, as well as future driveways to the
north side of Baney Lane warrant a separate turn lane to minimize potential vehicle conflicts
at the easternmost and central driveway locations (intersections 11 and 10). Therefore,
because of the left-turn lane warrants and need to avoid conflicts with other driveways to
the north and eastbound queuing at the Forest Avenue traffic signal, a westbound left-turn
lane will be required to serve the easternmost driveway (intersection 11) and a center two-
way left-turn lane will be required to extend from the easternmost driveway to the central
driveway (intersection 10). A separate turn lane is not warranted west of the central
driveway since left-turn movements out of the Wal-Mart onto Baney Lane at the central
driveway are prohibited. Traffic volumes between the central driveway and Business Lane
do not meet minimum volume warrants for left-turn lanes. The site plan includes these
requirements; therefore, the project as proposed would result in acceptable conditions on
Baney Lane.

2.3 TRAFFIC AND CIRCULATION
Wal-Mart Expansion City of Chico
Revised Draft Environmental Impact Report April 2009
2.3-62
• Business Lane/Baney Lane –The intersection would be expected to experience an increase
in delay and queuing in the westbound direction. During peak hours, the westbound queue
would be expected to extend to the westernmost Wal-Mart driveway (intersection 9).
However, given the lower traffic volumes and lower speeds, a separate left-turn lane is not
warranted. Given the adequate sight distance, appropriate existing intersection design and
traffic control, the intersection is expected to operate acceptably.
Freeway Mainline Segments
Short Term Plus Project peak hour mainline operations were evaluated utilizing the peak hour traffic
volumes shown on Figure 2.3-11. Table 2.3-14 summarizes Short Term Plus Project conditions’ SR 99
freeway mainline operations at the two interchange locations in the vicinity of the study area.
TABLE 2.3-14
SHORT TERM PLUS PROJECT CONDITIONS: SR 99 MAINLINE LEVELS-OF-SERVICE
AM Peak Hour PM Peak Hour Saturday Peak Hour
Freeway Mainline
Segment
No.
Lanes
Target
LOS Volume Density
(pc/mi/ln)
L
O
S
Volume Density
(pc/mi/ln)
L
O
S
Volume Density
(pc/mi/ln)
L
O
S
SR 99 NB, north
of Skyway I/C 2 E 2,256 20.2 C 3,263 30.3 D 2,455 22.0 C
SR 99 SB, north of
Skyway I/C 2 E 2,897 26.2 C 2,613 23.5 C 1,926 17.3 B
SR 99 NB, north
of 20th Street I/C 2 E 2,705 24.3 C 3,964 43.2 E 2,929 26.5 D
SR 99 SB, north of
20th Street I/C 2 E 3,018 27.4 D 2,831 26.5 C 2,084 18.7 C
Source: Omni Means, 2009 Notes: pc/mi/ln = Passenger Cars per Mile per Lane
As shown in Table 2.3-13, all four mainline segments are projected to operate at acceptable LOS
(LOS “E” or better) during AM, PM and Saturday peak hour periods under Short Term Plus Project
conditions.
Freeway Ramp Junctions
Short Term Plus Project peak hour ramp operations were evaluated utilizing the peak hour traffic
volumes shown on Figure 2.3-11. Table 2.3-15 presents the Short Term Plus Project conditions’
ramp merge/diverge peak hour LOS at the three study interchange locations in the vicinity of
the study area.

2.3 TRAFFIC AND CIRCULATION
City of Chico Wal-Mart Expansion
April 2009 Revised Draft Environmental Impact Report
2.3-63
TABLE 2.3-15
SHORT TERM PLUS PROJECT CONDITIONS: SR 99 RAMP JUNCTION LEVELS-OF-SERVICE
AM Peak Hour PM Peak Hour Saturday Peak Hour SR 99 & Skyway
Interchange
Junction
Type
Target
LOS Density
(pc/mi/ln) LOS
Density
(pc/mi/ln) LOS
Density
(pc/mi/ln) LOS
SR 99 NB Direct On-
Ramp Merge E 20.7 C 27.1 C 19.4 B
SR 99 NB Loop On-
Ramp Merge E 12.0 B 18.9 B 13.2 B
SR 99 SB Off-Ramp Diverge E 30.9 D 28.0 D 21.1 C
AM Peak Hour PM Peak Hour Saturday Peak Hour SR 99 & E. 20th Street
Interchange
Junction
Type
Target
LOS Density
(pc/mi/ln) LOS Density
(pc/mi/ln) LOS Density
(pc/mi/ln) LOS
SR 99 NB Off-Ramp Diverge E 24.5 C 34.6 D 26.5 C
SR 99 NB On-Ramp Merge E 22.6 C 35.9 F 27.4 C
SR 99 SB Off-Ramp Diverge E 32.1 D 30.2 F 22.7 C
SR 99 SB On-Ramp Merge E 21.1 C 9.8 A 8.4 A
AM Peak Hour PM Peak Hour Saturday Peak Hour SR 99 & SR 32
Interchange
Junction
Type
Target
LOS Density
(pc/mi/ln) LOS
Density
(pc/mi/ln) LOS
Density
(pc/mi/ln) LOS
SR 99 NB Off-Ramp Diverge E 29.0 D 41.6 F 31.2 D
SR 99 SB On-Ramp Merge E 27.9 C 25.9 C 17.9 B
Source: Omni Means, 2009 Notes: Bolded entries indicate intersections operating at Unacceptable LOS. pc/mi/ln = Passenger Cars per Mile per Lane
Based on a comparison of “no project” vs. “plus project” ramp junction levels of service as
presented in Table 2.3-12and Table 2.3-15, respectively, the following ramp junctions which were
found to operate unacceptably for Short Term No Project PM peak hour conditions will experience
an increase in density for “plus project” conditions as shown in Table 2.3-16.
TABLE 2.3-16
SHORT TERM PLUS PROJECT AND NO PROJECT COMPARISONS: SR 99 RAMP JUNCTION LEVELS-OF-SERVICE
PM Peak Hour
SR 99 & 20th Street
Interchange
Junction
Type
Target
LOS 2010 Plus Project
Density/LOS
2010 No
Project
Density/LOS
% Increase
in Density
(DI)
Significant? (DI
greater than 5%)
SR 99 NB On-Ramp Merge E 35.9 F 35.6 F 1.0% No
SR 99 SB On-Ramp Diverge E 30.2 F 29.7 F 2.0% No
PM Peak Hour
SR 99 & SR 32
Interchange
Junction
Type
Target
LOS 2010 Plus Project
Density/LOS
2010 No
Project
Density/LOS
% Increase
in Density
(DI)
Significant? (DI
greater than 5%)
SR 99 NB Off-Ramp Diverge E 41.6 F 41.2 F 1.0% No
Source: Omni Means, 2009 Notes: Bolded entries indicate intersections operating at Unacceptable LOS. pc/mi/ln = Passenger Cars per Mile per Lane

2.3 TRAFFIC AND CIRCULATION
Wal-Mart Expansion City of Chico
Revised Draft Environmental Impact Report April 2009
2.3-64
As shown in Table 2.3-16, the project is anticipated to increase the ramp junction density by two
percent or less to Short Term No Project conditions at the SR 99 NB On-Ramp and SR 99 SB Off-Ramp
(SR 99/20th Street interchange) and SR 99 NB Off-Ramp (SR 99/SR 32 interchange) under PM peak
hour conditions.

NO SCALE
Source: Omni-Means Ltd
Figure 2.3-11Year 2010 Plus Project Freeway Mainline and Ramp Volumes
T:\_
CS\
Wor
k\C
hico
, City
of\
Wal
Mar
t 24
-005
8\Fi
gure
s


2.3 TRAFFIC AND CIRCULATION
City of Chico Wal-Mart Expansion
April 2009 Revised Draft Environmental Impact Report
2.3-67
PROJECT IMPACTS AND MITIGATION MEASURES
Short Term Plus Wal-Mart Project Traffic Impacts
Impact 2.3.1 Development of the proposed project would increase traffic at a sufficient
volume to cause a further decline in LOS under the short term no project
scenario for intersections projected to operate below acceptable City or
Caltrans standards under the short term no project scenario. This is considered a
potentially significant impact.
Development of the project would not result in a reduction in the level of service standard of any
City or Caltrans intersection (signalized or un-signalized) operating at an acceptable level of service
based upon the City’s and Caltrans’ adopted significance threshold criteria. However,
development of the project would result in increased traffic at a sufficient level to cause LOS to
further decline below City or Caltrans standards for intersections projected to operate at an
unacceptable level of service under the short term no project condition.
City Intersections
The following intersection under the jurisdiction of the City is found to be operating at an
undesirable level of service under Short Term Plus Project Saturday peak hour conditions.
• Intersection #5) E. 20th Street/Chico Mall Access
Based on a comparison of “no project” vs. “plus project” intersection levels of service, the East
20th Street/Chico Mall Access intersection which was found to operate unacceptably for Short
Term No Project Saturday peak hour conditions will experience an increase in delay for “plus
project” conditions as shown below.
TABLE 2.3-17
SHORT TERM PLUS PROJECT AND NO PROJECT COMPARISONS: EAST 20TH STREET/ CHICO MALL ACCESS INTERSECTION
Saturday Peak Hour
# Intersection Control
Type
Target
LOS 2010 Plus Project
Density/LOS
2010 No
Project
Density/LOS
Delay
Increase (DI)
Significant? (DI
greater than 5
seconds)
5 E. 20th St./Chico
Mall Access Signal D 60.7 E 56.5 E 4.2 No
Source: Omni Means, 2009
At the East 20th Street/Chico Mall Access intersection, the project is anticipated to increase the
delay by 4.2 seconds to Short Term No Project Saturday conditions. Per the significance threshold
criteria which states that an impact is significant if there is an increase in delay by more than five
seconds at a signalized intersection that is operating at an unacceptable LOS without the project,
project impacts at this intersection for Short Term conditions is less than significant and no additional
mitigations are necessary.
Ramp Junctions / Caltrans Interchanges
The following ramp junctions were found to operate at an undesirable level of service under Short
Term Plus Project conditions.
• SR 99/20th Street Interchange – Southbound Off-Ramp

2.3 TRAFFIC AND CIRCULATION
Wal-Mart Expansion City of Chico
Revised Draft Environmental Impact Report April 2009
2.3-68
• SR 99/20th Street Interchange – Northbound On-Ramp
• SR 99/SR 32 Street Interchange – Northbound Off-Ramp
Based on a comparison of “no project” versus “plus project” ramp junction level of service, the SR 99
Northbound On-Ramp and SR 99 Southbound Off-Ramp (SR 99/20th Street interchange) and SR 99
Northbound Off-Ramp (SR 99/SR 32 interchange), which were found to operate unacceptably for
Short Term No Project PM conditions will experience an increase in density for “plus project”
conditions as shown in Table 2.3-16 above. As shown above, the project is anticipated to increase
the ramp junction density by two percent or less to Short Term No Project conditions at the SR 99
Northbound On-Ramp and SR 99 Southbound Off-Ramp (SR 99/20th Street interchange) and SR 99
Northbound Off-Ramp (SR 99/SR 32 interchange). Per the significance threshold criteria, which
states that an impact is significant if it results in an increase of density of a facility by more than five
percent which is operating at an unacceptable LOS without the project, the project impact at
these ramp junctions for Short Term conditions is less than significant and no additional mitigations
are necessary.
Private Roadway Operation and Project Site Safety
Impact 2.3.2 Inadequate project site circulation and design has the potential to cause
vehicle conflicts and public safety issues based upon the standards of
significance identified in the discussion below. This is a potentially significant
impact.
Inadequate project circulation and design has the potential to create safety conflicts. The City of
Chico does not apply LOS standards to private driveways or private intersections intersecting a City
arterial street. The City evaluates these based on criteria to include safety, sight distance,
adherence to design standards, turn lane warrants, conflicts with adjacent intersections, and/or
potential for vehicle conflicts, as further enumerated in Section 2.3.3, Significant Impact Threshold
Criteria, of this chapter. Pedestrian traffic crossing project vicinity intersections which may
encounter a public safety issue because of the potential for inadequate crosswalk lighting was
additionally considered.
Private Intersections
Business Lane/ToysRUs Access –Based on the traffic projections used in the traffic study prepared for
the project, this intersection would be expected to experience an increase in delay and queuing on
the westbound approach in the ToysRUs parking lot. The introduction of a traffic signal would not be
appropriate given that it is only 150 feet from the Business Lane intersection with East 20th Street. If
the intersection were to remain unsignalized, it is anticipated that drivers familiar with the area
would seek alternative ingress and egress routes if undesirable queues are observed. Given the
intersection design, anticipated turning movements, stop controlled westbound approach, sight
distance adequacy, slower traffic movements and past safety history, it is not anticipated that
vehicle conflict/safety impacts will arise at this location with added traffic generated by the project
and adjacent development. Therefore, this intersection is will operate acceptably.
Baney Lane/Wal-Mart Driveways –Future development on the north side of the street will introduce
additional driveways. Analysis of circulation and safety issues along Baney Lane are influenced by
the traffic volumes, number of driveways, horizontal curve in the center section of the street and
proximity to the signalized intersection with Forest Avenue. Placement of driveways including the
relocation and left-turn restriction to the Wal-Mart easternmost driveway will be required to avoid
conflicts with eastbound vehicles queuing at the Forest Avenue traffic signal. Outbound left-turn
restrictions at this driveway (intersection 11) along with the central driveway (intersection 10) will be

2.3 TRAFFIC AND CIRCULATION
City of Chico Wal-Mart Expansion
April 2009 Revised Draft Environmental Impact Report
2.3-69
required to force outbound traffic to utilize Forest Avenue. (Since Business Lane is a private street and
has no westbound access to East 20th Street, the City has established a need to channelize traffic
towards Forest Avenue). The project will increase left-turning movements off of Baney Lane. These
volumes combined with the existing turning movements, proximity to the Forest Avenue intersection,
as well as future driveways to the north side of Baney Lane warrant a separate turn lane to minimize
potential vehicle conflicts at the easternmost and central driveway locations (intersections 11 and
10). Therefore, because of the left-turn lane warrants and need to avoid conflicts with other
driveways to the north and eastbound queuing at the Forest Avenue traffic signal, the traffic study
prepared for the proposed project has recommended a westbound left-turn lane to serve the
easternmost driveway (intersection 11) and a center two-way left-turn lane to extend from the
easternmost driveway to the central driveway (intersection 10). According to the traffic study, a
separate turn lane is not warranted west of the central driveway since left-turn movements out of
the Wal-Mart onto Baney Lane at the central driveway are prohibited. Traffic volumes between the
central driveway and Business Lane do not meet minimum volume warrants for left-turn lanes.
There are potential sight distance issues for the outbound left turn vehicles with the westbound
Baney Lane traffic at the Baney Lane/Wal-Mart Central Driveway, and the close intersection
spacing between the Baney Lane/Wal-Mart East Driveway and Forest Avenue/Baney Lane
intersection. According to the traffic study prepared for the proposed project, the outbound left
turns should be physically prohibited through construction of channelizations as shown in the site
plan at these two driveways. The site plan includes these requirements; therefore, the project as
proposed would result in acceptable conditions on Baney Lane.
Business Lane/Baney Lane –The intersection would be expected to experience an increase in delay
and queuing in the westbound direction. During peak hours, the westbound queue would be
expected to extend to the westernmost Wal-Mart driveway (intersection 9). However, given the
lower traffic volumes and lower speeds, a separate left-turn lane is not warranted. Given the
adequate sight distance, appropriate existing intersection design and traffic control, the intersection
will operate acceptably.
Project Site Access and Roadway Improvements
Project Site Access
The project would utilize all of the existing driveways on Baney Lane, Business Lane and Forest
Avenue, as well as two new additional driveways to the south onto Wittmeier Drive as part of the
expansion. At present, all of the access points are full access intersections permitting left-turns in
and out of the project site, with the exception of the right-in/right-out driveway along Forest Avenue.
The main project access to the existing Wal-Mart store is currently provided via the signalized
intersection of Forest Avenue/Baney Lane, with traffic traveling to/from the existing Wal-Mart
driveways via Baney Lane.
To reduce project traffic along Business Lane, the project site plan proposes that the Baney
Lane/Wal-Mart Central Driveway and the “new” Baney Lane/Wal-Mart east Driveway be
reconstructed with right-turn channelization to prohibit outbound left-turns and force outbound
traffic towards Forest Avenue.
A review of the proposed project site plan shows that there is adequate internal circulation to allow
vehicles to access the westernmost driveway from the main parking lot. Given that this driveway is
located away from the main parking area, and thus experiences minimal traffic volumes, the net
effect is that while some opportunity is provided to make an outbound left turn toward Business
Lane, the actual number of left turns will be minimal and negligible.

2.3 TRAFFIC AND CIRCULATION
Wal-Mart Expansion City of Chico
Revised Draft Environmental Impact Report April 2009
2.3-70
The proposed project identifies several project site access and project roadway improvements
proposed to be implemented as part of project design. Such improvements to project site access
and roadway design seek to ensure enhanced coordination with the surrounding traffic facilities.
According to the Traffic Study prepared for the project, such project improvement proposals would
be adequate to prevent substantial impacts related to project site access and project roadways
from occurring. While the following project improvements are already proposed as part of the
project, they are presented here as a mitigation measure in order to mandate their implementation
prior to the issuance of the certificate of occupancy.
Mitigation Measures
MM 2.3.2 The following measures currently included as part of project design shall be fully
implemented and funded by the project developer. The project circulation
improvements will be in place before the opening of the expanded Wal-Mart
Supercenter.
• To reduce project traffic along Business Lane, the project shall be required to
reconstruct the Baney Lane/Wal-Mart Central Driveway and the “new”
Baney Lane/Wal-Mart east Driveway with right-turn channelization to prohibit
outbound left-turns and force outbound traffic towards Forest Avenue.
• The redesigned intersection of Forest Avenue/Wittmeier Drive/Talbert Drive
shall be signalized and improved to contain the following lane geometrics:
−−−− The northbound Forest Avenue approach will provide a through lane,
combined through-right lane and a lengthened exclusive left-turn lane.
−−−− The southbound Forest Avenue approach will provide a through lane,
combined through-right lane and a lengthened exclusive left-turn lane.
−−−− The Wittmeier Drive leg of the intersection is approximately 40 feet wide
with parking activity on both sides. The cul-de-sac is approximately 425
feet in length before the bulb, with driveways providing access to the
south occurring approximately 150 feet west of the intersection. The
eastbound Wittmeier Drive approach shall be improved to provide a left-
turn lane, combined left-through lane and a right turn lane for the
following reasons:
• The queue will rarely extend past the southern driveways, so will result
in fewer conflicts.
• The dual left-turn lanes and LOS D conditions for the left-turn are
acceptable and will help in reducing demand at the Baney Lane
eastbound left-turn movement at Forest Avenue, which will in turn
reduce pressure on the 20th Street/Toys R Us intersection.
• To accommodate this improvement, the road cross-section shall be widened
from 40 feet to 64 feet to accommodate 4, 12-foot lanes (three eastbound
and one westbound lane) and 2, 8-foot parking shoulders.
−−−− The westbound Talbert Drive approach will provide a left and a
combined through-right lane.

2.3 TRAFFIC AND CIRCULATION
City of Chico Wal-Mart Expansion
April 2009 Revised Draft Environmental Impact Report
2.3-71
• The existing traffic signal at the intersection of Forest Avenue/Baney Lane will
be modified as follows:
−−−− The eastbound Baney Avenue approach will include dual 150 foot
eastbound left-turn lanes approaching Forest Avenue, with
approximately 50 feet leading to the dual left-turn lanes and a
combined through-right lane. This will still accommodate the 90 percent
queuing of 14 vehicles assuming 25 feet per vehicle.
−−−− The northbound Forest Avenue approach will provide a through lane,
combined through-right lane and a lengthened exclusive left-turn lane.
−−−− Overlap phasing for the southbound right turn.
• The existing traffic segment for Baney Lane between Forest Avenue and
Business Lane will be modified as follows:
−−−− Forest to Eastern Driveway – Lane channelization as shown on Figure 2.3-
1 are adequate and shall be required to make the Baney Lane
intersection with Forest Avenue operate acceptably as well as provide
westbound left-turn access into Wal-Mart.
• Eastbound Baney Lane left-turn at Forest Avenue: Per the site plan, in
addition to the 150 feet dual left-turn lane, there is approximately 50
feet leading to the dual lanes. This requirement will still
accommodate the 90 percent queuing of 14 vehicles, assuming 25
feet per vehicle.
• Westbound left-turn: In accordance with the Traffic Study prepared
for the proposed project, it shall be required that the future maximum
queue be four vehicles, or 100 feet. As shown in the site plan (Figure
2.3-1), there is some transition area leading to the 100 feet of storage
which could potentially store one additional vehicle if present.
Clearance of the westbound left-turn lane shall be aided by the
required new driveway ‘neck’ as shown on the site plan and shall be
approximately 150 feet with no side conflicts and no left-turns onto
Baney Lane.
• Eastern Driveway to Central Driveway – To facilitate efficient movement of
through traffic, reduce vehicle conflicts, and improve vehicle safety along
Baney Lane, this segment of Baney Lane shall be widened to accommodate
three lanes (one lane in each direction and a center two way left turn lane).
Timing/Implementation: Prior to issuance of certificate of occupancy.
Enforcement/Monitoring: City of Chico Planning Services and Building and
Development Services Departments.
Implementation of mitigation measure MM 2.3.2 would reduce traffic impacts to less than
significant.

2.3 TRAFFIC AND CIRCULATION
Wal-Mart Expansion City of Chico
Revised Draft Environmental Impact Report April 2009
2.3-72
Project On-Site Circulation
As the site plan shows, a major component of the on-site circulation system consists of one-way drive
aisles located to the east of the proposed store striped for diagonal parking.
Business Lane and Wittmeier Drive will provide access to the truck docking facilities located along
the rear of the store. The primary truck route for the store is via the Baney Lane/Business Lane
intersection with trucks continuing south along the back alley to access the truck bays located near
the southwestern portion of the store. When departing from the store, it is assumed the trucks will exit
primarily via Wittmeier Drive, although departure would be possible via the alley.
Project Truck Traffic
The existing Wal-Mart store currently averages 61 deliveries per week, 31 of which are via large 18-
wheelers. It is anticipated that the proposed Wal-Mart Supercenter will have an average of 85
deliveries per week, 24 more than the existing store. Of these, it is anticipated that 39 will be large
18-wheelers, which is 8 more than the existing store. A review of the project site plan shows that the
overall layout of the site provides satisfactory truck access and circulation throughout the site. The
existing truck route/fire lane behind the existing store would remain, but it would be extended. A
truck turnaround approximately 130 feet in diameter would be designated at the end of the truck
route extension, in the southwestern portion of the project site. No additional mitigations are
necessary for the truck/fire lane.
The traffic study prepared for the proposed project recommends that vehicular movements along
the back alley to/from the Baney Lane/Business Lane intersection be restricted to southbound
through movements (which was assumed as part of the traffic analysis) in order to decrease
potential vehicle conflicts. This will result in the removal of potential two way travel conflicts
between delivery truck and passenger vehicles on a narrow roadway as well as decreased
potential pedestrian/vehicle conflicts at the footpath crossing of the roadway. To accommodate
this restriction, it is recommended that a sign be placed near the south end of the alley stating
“WAL-MART TRUCK TRAFFIC ONLY – NO THROUGH VEHICLES”. Whereas traffic from the existing Wal-
Mart store can currently exit out via the back alley and Business Lane, implementation of this
recommendation would result in the prohibition of northbound movements along the back alley
continuing on to Business Lane.
The overall layout of the site provides satisfactory vehicle circulation throughout the project site. The
project site plan also provides for a pedestrian system of sidewalks and crosswalks which will channel
pedestrians arriving from the new sidewalk/crosswalk system along Forest Avenue to the new store.
The proposed project identifies several safety mechanisms proposed for implemention as part of
project design. Such improvements seek to ensure the minimization of site safety issues. According
to the Traffic Study prepared for the project, such project improvement proposals would be
adequate to prevent substantial impacts related to private roadway operation and project site
safety. While the following project improvements are already proposed as part of the project, they
are presented here as a mitigation measure in order to mandate their implementation prior to the
issuance of the certificate of occupancy.
Mitigation Measures
MM 2.3.3 The following measures currently included as part of project design shall be fully
implemented and funded by the project developer:
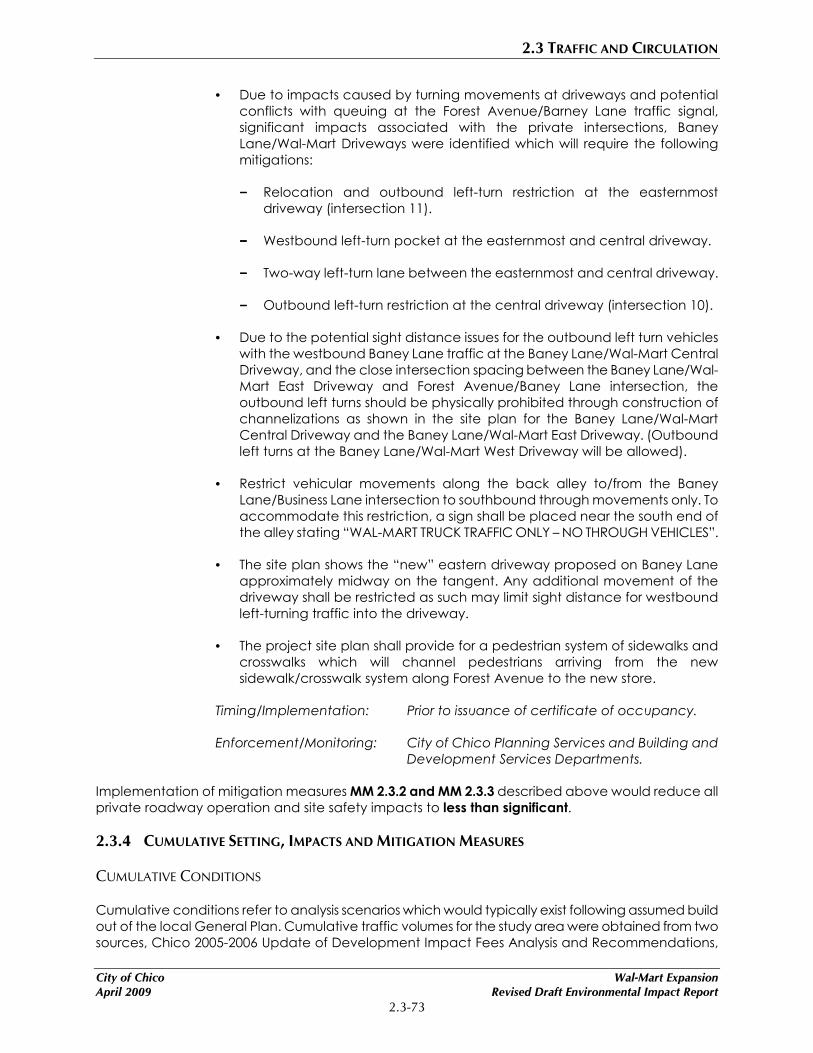
2.3 TRAFFIC AND CIRCULATION
City of Chico Wal-Mart Expansion
April 2009 Revised Draft Environmental Impact Report
2.3-73
• Due to impacts caused by turning movements at driveways and potential
conflicts with queuing at the Forest Avenue/Barney Lane traffic signal,
significant impacts associated with the private intersections, Baney
Lane/Wal-Mart Driveways were identified which will require the following
mitigations:
−−−− Relocation and outbound left-turn restriction at the easternmost
driveway (intersection 11).
−−−− Westbound left-turn pocket at the easternmost and central driveway.
−−−− Two-way left-turn lane between the easternmost and central driveway.
−−−− Outbound left-turn restriction at the central driveway (intersection 10).
• Due to the potential sight distance issues for the outbound left turn vehicles
with the westbound Baney Lane traffic at the Baney Lane/Wal-Mart Central
Driveway, and the close intersection spacing between the Baney Lane/Wal-
Mart East Driveway and Forest Avenue/Baney Lane intersection, the
outbound left turns should be physically prohibited through construction of
channelizations as shown in the site plan for the Baney Lane/Wal-Mart
Central Driveway and the Baney Lane/Wal-Mart East Driveway. (Outbound
left turns at the Baney Lane/Wal-Mart West Driveway will be allowed).
• Restrict vehicular movements along the back alley to/from the Baney
Lane/Business Lane intersection to southbound through movements only. To
accommodate this restriction, a sign shall be placed near the south end of
the alley stating “WAL-MART TRUCK TRAFFIC ONLY – NO THROUGH VEHICLES”.
• The site plan shows the “new” eastern driveway proposed on Baney Lane
approximately midway on the tangent. Any additional movement of the
driveway shall be restricted as such may limit sight distance for westbound
left-turning traffic into the driveway.
• The project site plan shall provide for a pedestrian system of sidewalks and
crosswalks which will channel pedestrians arriving from the new
sidewalk/crosswalk system along Forest Avenue to the new store.
Timing/Implementation: Prior to issuance of certificate of occupancy.
Enforcement/Monitoring: City of Chico Planning Services and Building and
Development Services Departments.
Implementation of mitigation measures MM 2.3.2 and MM 2.3.3 described above would reduce all
private roadway operation and site safety impacts to less than significant.
2.3.4 CUMULATIVE SETTING, IMPACTS AND MITIGATION MEASURES
CUMULATIVE CONDITIONS
Cumulative conditions refer to analysis scenarios which would typically exist following assumed build
out of the local General Plan. Cumulative traffic volumes for the study area were obtained from two
sources, Chico 2005-2006 Update of Development Impact Fees Analysis and Recommendations,

2.3 TRAFFIC AND CIRCULATION
Wal-Mart Expansion City of Chico
Revised Draft Environmental Impact Report April 2009
2.3-74
Nexus Study (City of Chico, October 2005) and the Meriam Park Phasing Analysis (W-Trans, May 2,
2007). The Nexus Study included a future horizon year of 2018 to coincide with its General Plan
horizon and included traffic projections for most of the facilities in the study area. The Meriam Park
Phasing Analysis was completed following completion of the DEIR for the Meriam Park project to
assist with determining phasing of City street improvements. Since the Meriam Park land use plan
included a building phase for the Year 2020, previous traffic projections from the Nexus Study were
updated using straight line growth factors to obtain Year 2020 projections. These projections were
only completed for specific street facilities including East 20th Street from SR 99 to Bruce Road.
Therefore, only those study intersections in this Wal-Mart analysis on East 20th Street from SR 99 to
Forest Avenue had Year 2020 traffic projections available. All other study intersections and roads
including SR 99 ramps and mainline volumes were based on the original Year 2018 Nexus Study
traffic projections. Although a mix of Year 2018 and 2020 horizons were used, all base and future
traffic volumes used in this analysis were based on the latest City traffic projections available. For
ease of reference, within this section, the Cumulative (future) year will be referred to as Year 2020.
Planned/Programmed Improvements
The City of Chico has directed that the following improvements be assumed to be in place for
Cumulative conditions. These improvements are in addition to those identified for Short Term (Year
2010) conditions and included in the memorandum received by the City (copy included in
Appendix A). These improvements are funded under the Nexus Study.
• Auxiliary Lanes will be provided in both directions on SR 99 between Skyway and East 20th
Street interchanges.
• Auxiliary Lanes will be provided in both directions on SR 99 between East 20th Street and SR
32 interchanges.
• Intersection #2) SR 99/20th Street Southbound Ramp intersection including:
−−−− Westbound to southbound on-ramp loop,
−−−− Eastbound free right with ramp improvements, and
−−−− An additional eastbound through lane.
• Intersection #3) SR 99/20th Street Northbound Ramp intersection including:
−−−− Eastbound to northbound on-ramp loop,
−−−− Westbound free right with ramp improvements,
−−−− An additional westbound through lane, and
−−−− Re-striping of the northbound approach to include one shared through-left turn lane,
and two exclusive right-turn lanes.
Figure 2.3-12 shows the lane geometrics and control assumed for Cumulative conditions and Figure
2.3-13 shows the projected Cumulative Base (Cumulative No Project) traffic volumes.

2.3 TRAFFIC AND CIRCULATION
City of Chico Wal-Mart Expansion
April 2009 Revised Draft Environmental Impact Report
2.3-75
Traffic Volumes
As with Short Term conditions, volumes associated with the Wal-Mart Expansion were included within
the Cumulative volumes the City provided. For purposes of this traffic analysis, it is necessary to back
out the specific traffic volumes within the raw volumes associated with the Wal-Mart Expansion
project for no project conditions, and add them back in (as established for this traffic study) for plus
project conditions.
The Cumulative No Project condition investigates traffic operations for year 2020 conditions,
excluding development of the proposed project. The Cumulative Plus Project condition is the
analysis scenario in which traffic impacts associated with the proposed project (i.e., the Chico Wal-
Mart Expansion) are investigated in comparison to the Cumulative No Project condition scenario.
Wal-Mart Expansion volumes as established using trip generation and distribution methodologies
provided for within this analysis were added to Cumulative No Project volumes to establish
Cumulative Plus Project volumes. Cumulative conditions assume that programmed or planned
improvements will be completed, including potentially some project related improvements. Note
that terms Cumulative or Year 2020 conditions have been used interchangeably in the analysis.
Cumulative No Project Traffic Operations
Cumulative No Project conditions establishes a baseline cumulative condition scenario in which the
proposed Chico Wal-Mart Store Expansion is assumed to remain undeveloped (i.e., a “vacant”
project site) through year 2020, and year 2020 land uses are assumed elsewhere.
Intersections
Cumulative No Project AM, PM, and Saturday peak hour intersection traffic operations were
quantified utilizing the Cumulative No Project peak hour intersection traffic volumes (shown on
Figure 2.3-13). Table 2.3-18 contains a summary of the resulting Cumulative No Project intersection
levels of service.
TABLE 2.3-18
CUMULATIVE NO PROJECT CONDITIONS INTERSECTION LEVELS-OF-SERVICE
AM Peak Hour PM Peak Hour Saturday Peak Hour
# Intersection Control
Type1
Target
LOS Delay
L
O
S
Warrant
Met2 Delay
L
O
S
Warrant
Met2 Delay
L
O
S
Warrant
Met2
1 E. 20th St / Whitman
Ave Signal D 12.3 B - 30.7 C - 52.3 D -
2 E. 20th St / SR 99 SB
Ramps Signal D 18.0 B - 27.2 C - 24.4 C -
3 E. 20th St / SR 99 NB
Ramps Signal D 12.4 B - 20.5 C - 18.5 B -
4 E. 20th St / Business
Ln TWSC D 10.8 B No 14.3 B No 13.3 B No
5 E. 20th St / Chico Mall
Access Signal D 15.1 B - 122.1 F - 162.6 F -
6 E. 20th St / Forest Ave Signal D 25.0 C - 46.0 D - 43.9 E -
LOS conditions do not apply to intersections 7 through 11 which are private intersections.
Significance is discussed under Impact 2.3.2 of this Traffic Section.

2.3 TRAFFIC AND CIRCULATION
Wal-Mart Expansion City of Chico
Revised Draft Environmental Impact Report April 2009
2.3-76
AM Peak Hour PM Peak Hour Saturday Peak Hour
# Intersection Control
Type1
Target
LOS Delay
L
O
S
Warrant
Met2 Delay
L
O
S
Warrant
Met2 Delay
L
O
S
Warrant
Met2
12
Forest Ave / Baney
Ln-Parkway Village
Dr
Signal D 21.1 C - 25.0 C - 28.0 C -
13 Forest Ave / Wal-Mart
Driveway TWSC D 10.8 B No 12.9 B No 11.6 B No
14 Forest Ave / Talbert
Dr-Wittmeier Dr TWSC D 25.3 D No 294.5 F No 200.3 F Yes
15 Forest Ave / Notre
Dame Blvd Signal D 18.5 B - 16.4 B - 12.5 B -
16 E. Park Ave-Skyway /
Whitman Rd Signal D 6.5 A - 22.1 C - 20.3 C -
17 E. Park Ave-Skyway /
SR 99 SB Ramps Signal D 20.4 C - 26.3 C - 11.2 B -
18 E. Park Ave-Skyway /
SR 99 NB Ramps Signal D 12.1 B - 17.8 B - 13.9 B -
19 Skyway / Notre Dame
Blvd Signal D 23.7 C - 43.3 D - 34.4 C -
Source: Omni Means, 2009 Notes: Bolded entries indicate intersections operating as an Unacceptable LOS. TWSC = Two-Way-Stop-Control (LOS and delay are based on LOS and delay for worst approach). Warrant = Caltrans peak hour-volume based signal warrant. Pvt = private roadways, driveways and/or intersections. City LOS criteria not applicable and excess delays analyzed in terms of unacceptable vehicle conflict and safety issues.

NO SCALE
Source: Omni-Means Ltd
Figure 2.3-12Year 2020 Geometrics and Control
T:\_
CS\
Wor
k\C
hico
, City
of\
Wal
Mar
t 24
-005
8\Fi
gure
s


NO SCALE
Source: Omni-Means Ltd
T:\_
CS\
Wor
k\C
hico
, City
of\
Wal
Mar
t 24
-005
8\Fi
gure
s
Figure 2.3-13Year 2020 No Project Traffic Volumes


2.3 TRAFFIC AND CIRCULATION
City of Chico Wal-Mart Expansion
April 2009 Revised Draft Environmental Impact Report
2.3-81
As shown in Table 2.3-18, the intersections of E 20th Street with SR 99 ramps are projected to operate
at acceptable LOS “D” or better with the cumulative lane geometrics in place. However, the
signalized intersection at E 20th St./Chico Mall Access is projected to operate at unacceptable LOS
F during the PM and Saturday peak periods under Cumulative No Project conditions. In addition,
Forest Avenue/Wittmeier Drive intersection is projected to operate at unacceptable LOS F based on
the delay projected along the stop controlled eastbound Wittmeier Drive approach.
Freeway Mainline Segments
Cumulative No Project peak hour mainline operations were evaluated utilizing the Cumulative No
Project peak hour traffic volumes shown on Figure 2.3-14. Table 2.3-19 summarizes Cumulative No
Project conditions’ SR 99 freeway mainline operations at the two interchange locations in the vicinity
of the study area.
TABLE 2.3-19
CUMULATIVE NO PROJECT CONDITIONS: SR 99 MAINLINE LEVELS-OF-SERVICE
AM Peak Hour PM Peak Hour Saturday Peak Hour Freeway
Mainline
Segment
No.
Lanes
Target
LOS Volume Density
(pc/mi/ln)
L
O
S
Volume Density
(pc/mi/ln)
L
O
S
Volume Density
(pc/mi/ln)
L
O
S
SR 99 NB, north
of Skyway I/C 3 E 2,860 17.1 B 4,287 25.8 C 3,273 19.6 C
SR 99 SB, north
of Skyway I/C 3 E 3,766 22.5 C 3,458 20.7 C 2,606 15.6 B
SR 99 NB, north
of 20th Street I/C 3 E 3,254 19.5 C 4,877 30.1 D 3,645 21.8 C
SR 99 SB, north
of 20th Street I/C 3 E 3,733 22.3 C 3,535 21.2 C 2,621 15.7 B
Source: Omni Means, 2009 Notes: pc/mi/ln = Passenger Cars per Mile per Lane
As shown in Table 2.3-19, all four mainline segments are projected to operate at acceptable LOS
(LOS “E” or better) during AM, PM and Saturday peak hour periods under Cumulative No Project
conditions. As noted before, auxiliary lanes along SR 99 between the Skyway and Route 32
interchanges are assumed to be in place for Cumulative No Project conditions. As such, the SR 99
mainline operations are evaluated assuming a 6-lane facility.
Freeway Ramp Junctions
Cumulative No Project peak hour ramp operations were evaluated utilizing the Cumulative No
Project peak hour traffic volumes shown on Figure 2.3-13. Table 2.3-20 presents the Cumulative No
Project conditions’ ramp merge/diverge peak hour LOS at the three study interchange locations in
the vicinity of the study area.

2.3 TRAFFIC AND CIRCULATION
Wal-Mart Expansion City of Chico
Revised Draft Environmental Impact Report April 2009
2.3-82
TABLE 2.3-20
CUMULATIVE NO PROJECT CONDITIONS: SR 99 RAMP JUNCTION LEVELS-OF-SERVICE
AM Peak Hour PM Peak Hour Saturday Peak Hour SR 99 & Skyway
Interchange
Junction
Type
Target
LOS Density
(pc/mi/ln) LOS
Density
(pc/mi/ln) LOS
Density
(pc/mi/ln) LOS
SR 99 NB Loop On-
Ramp Merge E 16.5 B 26.7 C 19.4 B
AM Peak Hour PM Peak Hour Saturday Peak Hour SR 99 & 20th Street
Interchange
Junction
Type
Target
LOS Density
(pc/mi/ln) LOS
Density
(pc/mi/ln) LOS
Density
(pc/mi/ln) LOS
SR 99 NB Loop On-
Ramp Diverge E 13.7 B 22.1 C 16.6 B
SR 99 NB Direct On-
Ramp Merge E 18.9 B 32.3 D 24.2 C
SR 99 SB Off-Ramp Diverge E 31.8 D 34.6 F 24.4 C
SR 99 SB Loop On-
Ramp Merge E 18.4 B 12.3 B 8.3 A
AM Peak Hour PM Peak Hour Saturday Peak Hour SR 99 & SR 32
Interchange
Junction
Type
Target
LOS Density
(pc/mi/ln) LOS
Density
(pc/mi/ln) LOS
Density
(pc/mi/ln) LOS
SR 99 NB Off-Ramp Diverge E 27.7 C 50.8 F 33.2 D
SR 99 SB On-Ramp Merge E 24.5 C 32.9 D 18.4 B
Source: Omni Means, 2009 Notes: Bolded entries indicate intersections operating at Unacceptable LOS. pc/mi/ln = Passenger Cars per Mile per Lane
As shown in Table 2.3-20, the southbound off-ramp at the SR 99/20th Street interchange and the
northbound off-ramp at the SR 99/SR 32 interchange are projected to operate at LOS “F” during the
PM peak hour period.

NO SCALE
Source: Omni-Means Ltd
Figure 2.3-14Year 2020 No Project Freeway Mainline and Ramp Volumes
T:\_
CS\
Wor
k\C
hico
, City
of\
Wal
Mar
t 24
-005
8\Fi
gure
s


2.3 TRAFFIC AND CIRCULATION
City of Chico Wal-Mart Expansion
April 2009 Revised Draft Environmental Impact Report
2.3-85
Weaving Analysis
As noted before, an auxiliary lane would be provided along SR 99 between the Skyway and SR-32
interchanges. Since the spacing between the Skyway and 20th Street interchanges is less than 2,500
feet, mainline weaving analysis was performed for the SR 99 segment between the interchanges.
Table 2.3-21 presents the Cumulative No Project conditions’ mainline weave peak hour LOS.
A Weaving Analysis consists of the identification of a number of factors to determine potential traffic
flow and level of service. These include:
• Weaving - The crossing of two or more traffic streams traveling in the same direction along a
significant length of highway, without the aid of traffic control devices (except for guide
signs).
• Weaving Configuration - The organization and continuity of lanes in a weaving segment,
which determines lane-changing characteristics.
• Weaving Diagram - A schematic drawing of flows in a weaving segment, used in analysis.
• Weaving Flow - The traffic movements in a weaving segment that are engaged in weaving
movements.
• Weaving Length - The length from a point on the merge gore at which the right edge of the
freeway shoulder lane and the left edge of the merging lane are 0. 6 meters apart to a point
on the diverge gore at which the edges are 3. 7 meters apart.
• Weaving Segment - A length of highway over which traffic streams cross paths through lane-
changing maneuvers, without the aid of traffic signals; formed between merge and diverge
points.
• Weaving Width - The total number of lanes between the entry and exit gore areas,
including the auxiliary lane, if present.
TABLE 2.3-21
CUMULATIVE NO PROJECT CONDITIONS: SR 99 WEAVING LEVELS-OF-SERVICE
AM Peak Hour PM Peak Hour Sat Peak Hour
Weaving Segment No. Lanes
On Frwy
Target
Level of
Service Density
(pc/mi/ln) LOS
Density
(pc/mi/ln) LOS
Density
(pc/mi/ln) LOS
Northbound SR 99 –
between Skyway and 20th 3 E 27.9 C 43.8 F 30.7 D
Southbound SR 99 –
between Skyway and 20th 3 E 33.5 D 33.4 D 22.1 C
Source: Omni Means, 2009 Notes: Bolded entries indicate intersections operating at Unacceptable LOS. pc/mi/ln = Passenger Cars per Mile per Lane
As shown in Table 2.3-21, under Cumulative No Project conditions, the southbound SR 99 weave
segment between the Skyway and 20th Street interchanges is projected to operate acceptably (LOS
E or better), while the northbound weave segment is projected to operate at unacceptable LOS “F”
during the PM peak hour period.

2.3 TRAFFIC AND CIRCULATION
Wal-Mart Expansion City of Chico
Revised Draft Environmental Impact Report April 2009
2.3-86
CUMULATIVE PLUS PROJECT TRAFFIC OPERATIONS
Cumulative Plus Project conditions are simulated by superimposing traffic generated by the
proposed project (as established under Project Trip Generation above) over the Cumulative No
Project traffic volumes at the study intersections and roadway segments. The resulting Cumulative
Plus Project traffic volumes are illustrated on Figure 2.3-15.
Intersections
Cumulative Plus Project AM, PM, and Saturday peak hour intersection traffic operations were
quantified utilizing the Cumulative Plus Project peak hour intersection traffic volumes shown in Figure
2.3-15. Table 2.3-22 contains a summary of the resulting intersection levels of service.
TABLE 2.3-22
CUMULATIVE PLUS PROJECT CONDITIONS INTERSECTION LEVELS-OF-SERVICE
AM Peak Hour PM Peak Hour Saturday Peak Hour
# Intersection Control
Type1
Target
LOS Delay
L
O
S
Warrant
Met2 Delay
L
O
S
Warrant
Met2 Delay
L
O
S
Warran
t Met2
1 E. 20th St / Whitman
Ave Signal D 12.3 B - 31.7 C - 54.5 D -
2 E. 20th St / SR 99 SB
Ramps Signal D 18.2 B - 28.3 C - 25.1 C -
3 E. 20th St / SR 99 NB
Ramps Signal D 12.4 B - 21.0 C - 18.7 B -
4 E. 20th St / Business
Ln TWSC D 10.9 B No 14.4 B No 13.4 B No
5 E. 20th St / Chico Mall
Access Signal D 15.1 B - 127.9 F - 170.7 F -
6 E. 20th St / Forest Ave Signal D 27.2 C - 52.2 D - 50.8 D -
LOS conditions do not apply to intersections 7 through 11 which are private intersections.
Significance is discussed under Impact 2.3.2 of this Traffic Section.
12
Forest Ave / Baney
Ln-Parkway Village
Dr
Signal D 21.2 C - 25.6 C - 28.6 C -
13 Forest Ave / Wal-Mart
Driveway TWSC D 13.0 B No 14.8 B No 13.8 B No
14 Forest Ave / Talbert
Dr-Wittmeier Dr Signal D 26.0 C - 25.9 C - 30.2 C -
15 Forest Ave / Notre
Dame Blvd Signal D 18.5 B - 16.4 B - 12.5 B -
16 E. Park Ave-Skyway /
Whitman Rd Signal D 6.5 A - 22.2 C - 20.3 C -
17 E. Park Ave-Skyway /
SR 99 SB Ramps Signal D 20.4 C - 26.4 C - 11.1 B -
18 E. Park Ave-Skyway /
SR 99 NB Ramps Signal D 12.5 B - 18.5 B - 14.2 B -

2.3 TRAFFIC AND CIRCULATION
City of Chico Wal-Mart Expansion
April 2009 Revised Draft Environmental Impact Report
2.3-87
AM Peak Hour PM Peak Hour Saturday Peak Hour
# Intersection Control
Type1
Target
LOS Delay
L
O
S
Warrant
Met2 Delay
L
O
S
Warrant
Met2 Delay
L
O
S
Warran
t Met2
19 Skyway / Notre Dame
Blvd Signal D 25.0 C - 47.7 D - 36.6 D -
Source: Omni Means, 2009 Notes: Bolded entries indicate intersections operating as an Unacceptable LOS. TWSC = Two-Way-Stop-Control (LOS and delay are based on LOS and delay for worst approach). Warrant = Caltrans peak hour-volume based signal warrant. Pvt = private roadways, driveways and/or intersections. City LOS criteria not applicable and excess delays analyzed in terms of unacceptable vehicle conflict and safety issues.
Based on a comparison of intersection LOS between the Cumulative No Project and Cumulative
Plus Project conditions as presented in Tables 2.3-18 and 2.3-22, the following intersections that were
projected to operate at unacceptable LOS under Cumulative No Project conditions would continue
to operate at unacceptable LOS with an increase in delay due to the addition of project traffic.
• E. 20th Street/Chico Mall Access – This signalized intersection is projected to continue to
operate at unacceptable LOS “F” during the PM and Saturday peak hour periods. The
proposed project would increase the intersection delay by 5.8 seconds during the PM peak
hour and 8.1 seconds during the Saturday peak hour periods.
The Forest Avenue/Wittmeier intersection will be signalized as a part of the project and is projected
to operate at acceptable LOS “C” during all peak hour periods analyzed.
Private Intersections
A discussion of the impacts at the private intersections which were included in the Short Term Plus
Project conditions section, applies to the Cumulative Plus Project conditions as well.
Freeway Mainline Segments
Cumulative Plus Project peak hour mainline operations were evaluated utilizing the peak hour traffic
volumes shown on Figure 2.3-15. Table 2.3-23 summarizes SR 99 freeway mainline operations at the
two interchange locations in the vicinity of the study area for Cumulative Plus Project conditions.
TABLE 2.3-23
CUMULATIVE PLUS PROJECT CONDITIONS: SR 99 MAINLINE LEVELS-OF-SERVICE
AM Peak Hour PM Peak Hour Saturday Peak Hour
Freeway Mainline
Segment
No.
Lanes
Target
LOS Volume Density
(pc/mi/ln)
L
O
S
Volume Density
(pc/mi/ln)
L
O
S
Volume Density
(pc/mi/ln)
L
O
S
SR 99 NB, north
of Skyway I/C 3 E 2,838 17.0 B 4,259 25.6 C 3,224 19.3 C
SR 99 SB, north of
Skyway I/C 3 E 3,766 22.5 C 3,458 20.7 C 2,606 15.6 B
SR 99 NB, north
of 20th Street I/C 3 E 3,286 19.7 C 4,914 30.5 D 3,695 22.1 C
SR 99 SB, north
of 20th Street I/C 3 E 3,763 22.5 C 3,565 21.3 C 2,651 15.9 B
Source: Omni Means, 2009 Notes: pc/mi/ln = Passenger Cars per Mile per Lane
2.3 TRAFFIC AND CIRCULATION
Wal-Mart Expansion City of Chico
Revised Draft Environmental Impact Report April 2009
2.3-88
As shown in Table 2.3-23, all four mainline segments are projected to operate at acceptable LOS
(LOS “E” or better) during AM, PM and Saturday peak hour periods under Cumulative Plus Project
conditions. As noted previously, auxiliary lanes along SR 99 between the Skyway and SR-32
interchanges are assumed to be in place for Cumulative Plus Project conditions. As such, the SR 99
mainline operations are evaluated assuming a 6-lane facility.

NO SCALE
Source: Omni-Means Ltd
T:\_
CS\
Wor
k\C
hico
, City
of\
Wal
Mar
t 24
-005
8\Fi
gure
s
Figure 2.3-15Year 2020 Plus Project Traffic Volumes


NO SCALE
Source: Omni-Means Ltd
Figure 2.3-16Year 2020 Plus Project Freeway Mainline and Ramp Volumes
T:\_
CS\
Wor
k\C
hico
, City
of\
Wal
Mar
t 24
-005
8\Fi
gure
s


2.3 TRAFFIC AND CIRCULATION
City of Chico Wal-Mart Expansion
April 2009 Revised Draft Environmental Impact Report
2.3-93
Freeway Ramp Junctions
Cumulative Plus Project peak hour ramp operations were evaluated utilizing the Cumulative Plus
Project peak hour traffic volumes shown on Figure 2.3-15. Table 2.3-24 presents the ramp
merge/diverge peak hour LOS at the three study interchange locations in the vicinity of the study
area for Cumulative Plus Project conditions.
TABLE 2.3-24
CUMULATIVE PLUS PROJECT CONDITIONS: SR 99 RAMP JUNCTION LEVELS-OF-SERVICE
AM Peak Hour PM Peak Hour Saturday Peak Hour SR 99 & Skyway
Interchange
Junction
Type
Target
LOS Density
(pc/mi/ln) LOS
Density
(pc/mi/ln) LOS
Density
(pc/mi/ln) LOS
SR 99 NB Loop On-
Ramp Merge E 16.5 B 26.7 C 19.4 B
AM Peak Hour PM Peak Hour Saturday Peak Hour SR 99 & 20th Street
Interchange
Junction
Type
Target
LOS Density
(pc/mi/ln) LOS
Density
(pc/mi/ln) LOS
Density
(pc/mi/ln) LOS
SR 99 NB Loop On-
Ramp Diverge E 13.6 B 21.9 C 16.4 B
SR 99 NB Direct On-
Ramp Merge E 19.1 B 32.5 D 24.3 C
SR 99 SB Off-Ramp Diverge E 32.1 D 34.9 F 24.6 F
SR 99 SB Loop On-
Ramp Merge E 18.4 B 12.3 B 8.3 A
AM Peak Hour PM Peak Hour Saturday Peak Hour SR 99 & SR 32
Interchange
Junction
Type
Target
LOS Density
(pc/mi/ln) LOS
Density
(pc/mi/ln) LOS
Density
(pc/mi/ln) LOS
SR 99 NB Off-Ramp Diverge E 28.2 D 51.1 F 34.2 D
SR 99 SB On-Ramp Merge E 24.8 C 33.7 D 18.6 B
Source: Omni Means, 2009 Notes: Bolded entries indicate intersections operating at Unacceptable LOS. pc/mi/ln = Passenger Cars per Mile per Lane
As shown in Table 2.3-24, all of ramp merge/diverge junctions analyzed are projected to operate at
acceptable LOS under the cumulative plus project conditions, with the following exceptions:
• The southbound off-ramp at the SR 99/20th Street interchange is projected to continue operating
at unacceptable LOS “F” during the PM peak hour (as well as during the Saturday peak hour),
with an increase in density of 0.3 pc/mi/ln or less.
• The northbound off-ramp at the SR 99/SR 32 interchange is projected to continue operating at
unacceptable LOS “F” during the PM peak hour, with an increase in density of 0.3 pc/mi/ln.
• These two ramp junctions, which were found to operate unacceptably for Cumulative No
Project PM and Saturday peak hour conditions will experience an increase in density for “plus
project” conditions as shown in Table 2.3-25.

2.3 TRAFFIC AND CIRCULATION
Wal-Mart Expansion City of Chico
Revised Draft Environmental Impact Report April 2009
2.3-94
TABLE 2.3-25
CUMULATIVE CONDITIONS RAMP JUNCTIONS SIGNIFICANT IMPACT CRITERIA
PM Peak Hour
SR 99 & 20th Street
Interchange
Junction
Type
Target
LOS Cumulative Plus
Project
Density/LOS
Cumulative No
Project
Density/LOS
% Increase
in Density
(DI)
Significant? (DI
greater than 5%)
34.9 F 34.6 F 1.0% No
Saturday Peak Hour
Cumulative Plus
Project
Density/LOS
Cumulative No
Project
Density/LOS
% Increase
in Density
(DI)
Significant? (DI
greater than 5%)
SR 99 SB On-Ramp Diverge E
24.6 F 24.4 C 1.0% Yes
PM Peak Hour
SR 99 & SR 32
Interchange
Junction
Type
Target
LOS Cumulative Plus
Project
Density/LOS
Cumulative No
Project
Density/LOS
% Increase
in Density
(DI)
Significant? (DI
greater than 5%)
51.1 F 50.8 F 1.0% No
Saturday Peak Hour
Cumulative Plus
Project
Density/LOS
Cumulative No
Project
Density/LOS
% Increase
in Density
(DI)
Significant? (DI
greater than 5%)
SR 99 NB Off-Ramp Diverge E
N/A N/A N/A N/A N/A N/A
Source: Omni Means, 2009 Notes: Bolded entries indicate intersections operating at Unacceptable LOS.
As shown in Table 2.3-25, the following ramp diverge junctions analyzed are projected to operate at
acceptable LOS under the plus project conditions:
• For the PM peak hour, at the southbound off-ramp at the SR 99/20th Street interchange, the
project is anticipated to increase the ramp junction density by one percent. For the
Saturday peak hour, the project will cause the ramp junction that was found to be operating
at acceptable LOS C under “no project” conditions to deteriorate to LOS F conditions.
• For the PM peak hour, at the northbound off-ramp at the SR 99/SR 32 interchange, the
project is anticipated to increase the ramp junction density by one percent.
Weaving Analysis
As noted previously, an auxiliary lane would be provided along SR 99 between the Skyway and SR-
32 interchanges. Since the spacing between the Skyway and 20th Street interchanges is less than
2,500 feet, mainline weaving analysis was performed for the SR 99 segment between the
interchanges. Table 2.3-26 presents the Cumulative Plus Project conditions’ mainline weave LOS for
all study peak hour periods.
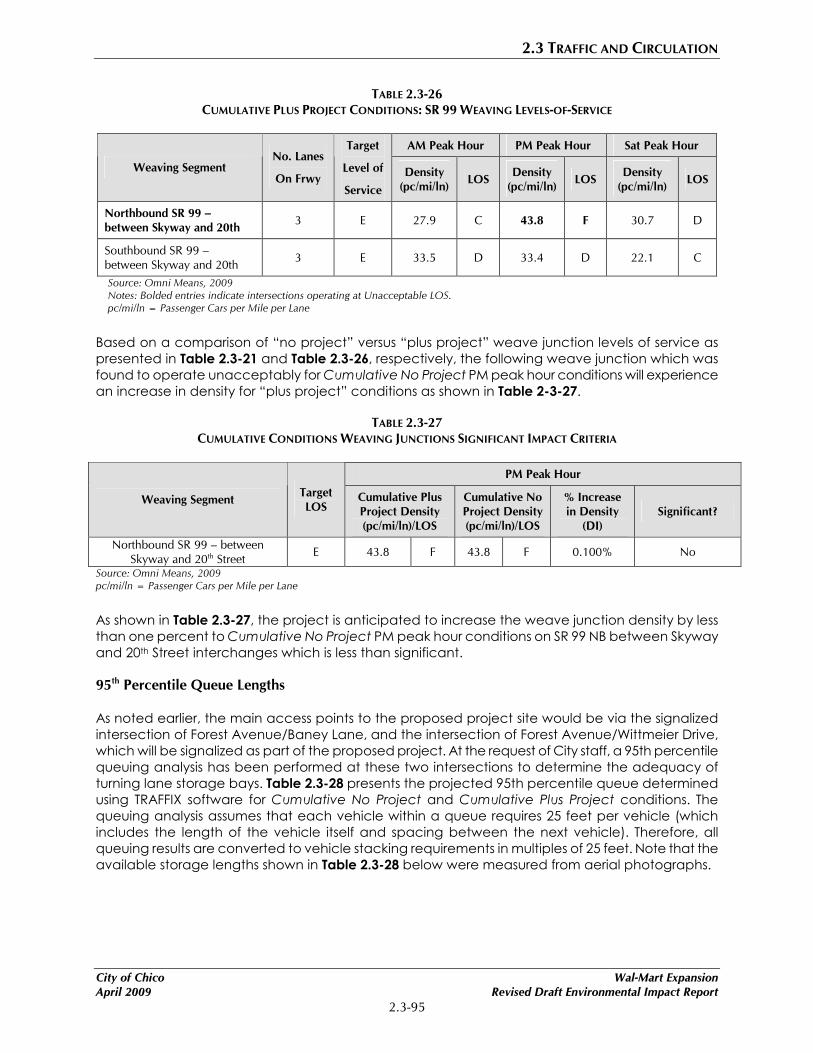
2.3 TRAFFIC AND CIRCULATION
City of Chico Wal-Mart Expansion
April 2009 Revised Draft Environmental Impact Report
2.3-95
TABLE 2.3-26
CUMULATIVE PLUS PROJECT CONDITIONS: SR 99 WEAVING LEVELS-OF-SERVICE
AM Peak Hour PM Peak Hour Sat Peak Hour
Weaving Segment No. Lanes
On Frwy
Target
Level of
Service
Density
(pc/mi/ln) LOS
Density
(pc/mi/ln) LOS
Density
(pc/mi/ln) LOS
Northbound SR 99 –
between Skyway and 20th 3 E 27.9 C 43.8 F 30.7 D
Southbound SR 99 –
between Skyway and 20th 3 E 33.5 D 33.4 D 22.1 C
Source: Omni Means, 2009 Notes: Bolded entries indicate intersections operating at Unacceptable LOS. pc/mi/ln = Passenger Cars per Mile per Lane
Based on a comparison of “no project” versus “plus project” weave junction levels of service as
presented in Table 2.3-21 and Table 2.3-26, respectively, the following weave junction which was
found to operate unacceptably for Cumulative No Project PM peak hour conditions will experience
an increase in density for “plus project” conditions as shown in Table 2-3-27.
TABLE 2.3-27
CUMULATIVE CONDITIONS WEAVING JUNCTIONS SIGNIFICANT IMPACT CRITERIA
PM Peak Hour
Weaving Segment Target
LOS Cumulative Plus
Project Density
(pc/mi/ln)/LOS
Cumulative No
Project Density
(pc/mi/ln)/LOS
% Increase
in Density
(DI)
Significant?
Northbound SR 99 – between
Skyway and 20th Street E 43.8 F 43.8 F 0.100% No
Source: Omni Means, 2009 pc/mi/ln = Passenger Cars per Mile per Lane
As shown in Table 2.3-27, the project is anticipated to increase the weave junction density by less
than one percent to Cumulative No Project PM peak hour conditions on SR 99 NB between Skyway
and 20th Street interchanges which is less than significant.
95th Percentile Queue Lengths
As noted earlier, the main access points to the proposed project site would be via the signalized
intersection of Forest Avenue/Baney Lane, and the intersection of Forest Avenue/Wittmeier Drive,
which will be signalized as part of the proposed project. At the request of City staff, a 95th percentile
queuing analysis has been performed at these two intersections to determine the adequacy of
turning lane storage bays. Table 2.3-28 presents the projected 95th percentile queue determined
using TRAFFIX software for Cumulative No Project and Cumulative Plus Project conditions. The
queuing analysis assumes that each vehicle within a queue requires 25 feet per vehicle (which
includes the length of the vehicle itself and spacing between the next vehicle). Therefore, all
queuing results are converted to vehicle stacking requirements in multiples of 25 feet. Note that the
available storage lengths shown in Table 2.3-28 below were measured from aerial photographs.

2.3 TRAFFIC AND CIRCULATION
Wal-Mart Expansion City of Chico
Revised Draft Environmental Impact Report April 2009
2.3-96
TABLE 2.3-28
CUMULATIVE CONDITIONS QUEUING ANALYSIS
Cumulative No Project Cumulative Plus Project
Intersection Movement
Available
Storage
Length
(feet) AM PM SAT AM PM SAT
Forest
Ave/Baney Lane
NBL
SBL
SBR
EBL
WBL
4601
208
220
3501
128
130
80
40
50
40
250
120
250
350
25
425
55
405
340
35
145
90
60
85
60
270
125
300
395
50
450
60
460
380
75
Forest
Ave/Talbert
Wittmeier Drive
NBL
SBL
EBL
WBL
3251
1901
3001
127
Not Applicable
225
100
250
45
250
155
260
85
320
100
345
85
Source: Omni Means, 2009 1 Approximate length of the turn pocket as proposed to be lengthened as part of the site improvements. Bold – 95th percentile queue would exceed the available storage.
CUMULATIVE IMPACTS AND MITIGATION MEASURES
Cumulative Plus Project Conditions
Impact 2.3.3 Development of the proposed project and all other cumulative development
would increase traffic at sufficient volume to cause LOS to decline below City
and Caltrans standards under cumulative conditions. This is considered a
cumulatively considerable impact.
City Intersections
The following intersection under the jurisdiction of the City was found to operate at an
unacceptable level of service under Cumulative Plus Project conditions.
• E. 20th Street/Chico Mall Access
Based on a comparison of “no project” vs. “plus project” intersection levels of service, the E. 20th
Street/Chico Mall Access intersection which was found to operate unacceptably for Cumulative No
Project PM and Saturday peak hour conditions will experience an increase in delay for “plus project”
conditions as shown below.

2.3 TRAFFIC AND CIRCULATION
City of Chico Wal-Mart Expansion
April 2009 Revised Draft Environmental Impact Report
2.3-97
TABLE 2.3-29
CUMULATIVE PLUS PROJECT CONDITIONS: EAST 20TH STREET/CHICO MALL ACCESS INTERSECTION
PM Peak Hour
# Intersection Control
Type
Target
LOS Cumulative Plus
Project
Density/LOS
Cumulative No
Project
Density/LOS
Delay
Increase (DI)
Significant? (DI
greater than 5
seconds)
5 E. 20th St./Chico
Mall Access Signal D 127.9 F 122.1 F 5.8 Yes
Saturday Peak Hour
# Intersection Control
Type
Target
LOS Cumulative Plus
Project
Density/LOS
Cumulative No
Project
Density/LOS
Delay
Increase (DI)
Significant? (DI
greater than 5
seconds)
5 E. 20th St./Chico
Mall Access Signal D 170.7 F 162.6 F 8.1 Yes
Source: Omni Means, 2009
As shown above, at the E 20th Street/Chico Mall Access intersection, the project is anticipated to
increase the delay by 5.8 seconds and 8.1 seconds during the PM and Saturday peak hour
conditions to Cumulative No Project conditions, respectively. Per the Significant Impact Threshold
Criteria discussed under the Standards of Significance discussion of this section, the project impact
at this intersection for Cumulative conditions is significant.
Implementing the proposed improvements as discussed within the Chico Mall Expansion
Improvements section would yield acceptable operations at the E 20th St./Chico Mall Access
intersection for Cumulative Plus Project conditions. These planned public/private improvements are
dependent on the Chico Mall proceeding with the planned expansion and therefore, are not a
certainty. Until these improvements are constructed, project impacts at this location would remain
significant and unavoidable for Cumulative Plus Project conditions.
Private Intersections
As mentioned previously, a discussion of the impacts at the private intersections which were
included in the Short Term Plus Project conditions section, applies to the Cumulative Plus Project
conditions as well. Mitigation measure MM 2.3.2 would reduce all cumulative site safety impacts to a
less than significant level.
Ramp Junctions
The following ramp junctions were found to operate at an undesirable level of service under
Cumulative Plus Project conditions.
• SR 99/20th Street Interchange – Southbound Off-Ramp
• SR 99/SR 32 Interchange – Northbound Off-Ramp
Based on a comparison of “no project” vs. “plus project” ramp junction levels of service the
following ramp junctions which were found to operate unacceptably for Cumulative No Project PM
and Saturday peak hour conditions will experience an increase in density for “plus project”
conditions as shown below.

2.3 TRAFFIC AND CIRCULATION
Wal-Mart Expansion City of Chico
Revised Draft Environmental Impact Report April 2009
2.3-98
TABLE 2.3-30
CUMULATIVE PLUS PROJECT CONDITIONS: EAST 20TH STREET/CHICO MALL ACCESS INTERSECTION
PM Peak Hour
SR 99 & 20th Street
Interchange
Junction
Type
Target
LOS Cumulative Plus
Project
Density/LOS
Cumulative No
Project
Density/LOS
% Increase
in Density
(DI)
Significant?
34.9 F 34.6 F 1.0% No
Saturday Peak Hour
Cumulative Plus
Project
Density/LOS
Cumulative No
Project
Density/LOS
% Increase
in Density
(DI)
Significant? SR 99 SB Off-Ramp Diverge E
24.6 F 24.4 C 1.0% Yes
PM Peak Hour SR 99 & SR 32
Interchange
Junction
Type
Target
LOS Cumulative Plus
Project
Density/LOS
Cumulative No
Project
Density/LOS
% Increase
in Density
(DI)
Significant?
51.1 F 50.8 F 1.0% No
Saturday Peak Hour
Cumulative Plus
Project
Density/LOS
Cumulative No
Project
Density/LOS
% Increase
in Density
(DI)
Significant? SR 99 NB Off-Ramp Diverge E
N/A N/A N/A N/A N/A N/A
Source: Omni Means, 2009
Southbound off-ramp at the SR 99/20th Street interchange:
• For the PM peak hour, the project is anticipated to increase the ramp junction density by
one percent. Per the Standards of Significance discussed above, the project impact at this
intersection for Cumulative conditions is less than significant.
• For the Saturday peak hour, the project will cause the ramp junction that was found to be
operating at acceptable LOS C under “no project” conditions to deteriorate to LOS F
conditions. Per the Standards of Significance discussed above, the project impact at this
intersection for Cumulative conditions is significant.
Providing a 2-lane southbound off-ramp (with two lanes exiting the freeway) would yield
acceptable operations at the southbound SR 99 off-ramp diverge junction to 20th Street. However, it
is not known if these improvements are economically feasible. Until these improvements are
constructed, project impacts at this location would remain significant and unavoidable for
Cumulative Plus Project conditions.
Northbound off-ramp at the SR 99/SR 32 interchange:
• For the PM peak hour, the project is anticipated to increase the ramp junction density by
one percent. Per the Standards of Significance discussed above, the project impact at this
intersection for Cumulative conditions is less than significant.

2.3 TRAFFIC AND CIRCULATION
City of Chico Wal-Mart Expansion
April 2009 Revised Draft Environmental Impact Report
2.3-99
Weave Segments
The following weave junction was found to operate at an undesirable level of service under
Cumulative Plus Project conditions.
• Northbound SR 99 weave segment between the Skyway and 20th Street interchanges.
Based on a comparison of “no project” vs. “plus project” weave junction levels of service, the
northbound SR 99 weave segment between the Skyway and 20th Street interchanges was found to
operate unacceptably for Cumulative No Project PM peak hour conditions will experience an
increase in density for “plus project” conditions (Table 2.3-27).
The project is anticipated to increase the weave junction density by less than one percent from
Cumulative No Project PM peak hour conditions on SR 99 NB between Skyway and 20th Street
interchanges. Per the Standards of Significance discussed above, the project impact at this
intersection for Cumulative conditions is less than significant.
95th Percentile Queue Lengths
As shown in Table 2.3-28 above, the 95th percentile queues for eastbound left turns and the
southbound right turns exceed the available/proposed storage requirements at the First
Avenue/Baney Lane intersection and the eastbound left turns exceed the available/proposed
storage requirements at the Forest Avenue/Talbert/Wittmeier Drive intersection. The following
mitigation shall be required.
Mitigation Measures
MM 2.3.3 The following measures shall be implemented as part of project design and be
fully implemented and funded by the project developer:
• The proposed eastbound left turn storage on Baney Lane at Forest Avenue
would satisfy the 90th percentile queues for the Saturday peak period and
the 95th percentile queues for both AM and PM peak hours. Since queues
may only exceed storage during the Saturday peak period under 2020
conditions for approximately 5 to 10 percent of the peak hour, this potential
impact shall be addressed through retiming of the traffic signal in the future
as the condition arises.
• The projected 95th percentile queue length for the southbound right turn at
the Forest Avenue/Baney Lane intersection exceeds the available storage for
the PM and Saturday peak periods. The developer shall install right-turn
overlap phasing for the southbound right turn lane which would result in
acceptable operations.
• The proposed eastbound left turn storage on Wittmeir Drive would satisfy the
90th percentile queues for the Saturday peak period and the 95th percentile
queues for both AM and PM peak hours. Since queues may only exceed
storage during the Saturday peak period under 2020 conditions for
approximately 5 to 10 percent of the peak hour, this potential impact shall
be addressed through retiming of the traffic signal in the future as the
condition arises.

2.3 TRAFFIC AND CIRCULATION
Wal-Mart Expansion City of Chico
Revised Draft Environmental Impact Report April 2009
2.3-100
Timing/Implementation: Prior to Final Map Approval the developer shall
install right-turn overlap phasing for the
southbound right turn lane.
Enforcement/Monitoring: City of Chico Planning Services and Building and
Development Services Departments
Implementation of mitigation measures MM 2.3.1and MM 2.3.3 would reduce traffic impacts on
roadway systems while implementation of mitigation measure MM 2.3.2 would reduce site safety
impacts to less than significant. However, while implementing the proposed improvements as
discussed within the Chico Mall Expansion Improvements section would yield acceptable operations
at the E 20th St./Chico Mall Access intersection for Cumulative Plus Project conditions. These
planned public/private improvements are dependent on the Chico Mall proceeding with the
planned expansion and therefore, are not a certainty. Until these improvements are constructed,
project impacts at this location would remain significant and unavoidable for Cumulative Plus
Project conditions.
Furthermore, for the Saturday peak hour, the project will cause the southbound off-ramp at the SR
99/20th Street interchange, which was found to be operating at acceptable LOS C under “no
project” conditions, to deteriorate to LOS F conditions. While the provision of a 2-lane southbound
off-ramp (with two lanes exiting the freeway) would yield acceptable operations at the southbound
SR 99 off-ramp diverge junction to 20th Street, it is not known if these improvements are
economically feasible. Until these improvements are constructed, project impacts would remain
significant and unavoidable for Cumulative Plus Project conditions.

2.3 TRAFFIC AND CIRCULATION
City of Chico Wal-Mart Expansion
April 2009 Revised Draft Environmental Impact Report
2.3-101
REFERENCE:
City of Chico. 1994. General Plan Updated February 1999, City of Chico Planning Department.
Chico, CA
California Department of Transportation (Caltrans). December 2002. Guide for the Preparation of
Traffic Impact Studies. Sacramento, California.
California Department of Transportation (Caltrans). May 2004. State Route 99 Transportation
Concept Report. May 2004. Available online at
http://www.dot.ca.gov/dist3/departments/planning/tcr/draft99.pdf
California Department Of Transportation (Caltrans). November 2002. Chapter 9 Traffic Signals and
Lighting. Sacramento, CA.
Institute of Transportation Engineers. 2003. Trip Generation 7th Edition Volumes 1, 2. Washington, D.C.
Omni Means. March 2009. Chico Wal-Mart Store Expansion Traffic Impact Study - Final Report.
Roseville, CA.
Quincy Engineering. October 2001. State Route 99 – Chico Corridor Study.

3.0 REPORT PREPARERS


3.0 REPORT PREPARERS
City of Chico Wal-Mart Expansion
April 2009 Revised Draft Environmental Impact Report
3.0-1
3.1 REPORT PREPARERS
CITY OF CHICO
Planning Director Stephen Peterson
Senior Planner Zachary Thomas
PACIFIC MUNICIPAL CONSULTANTS – EIR CONSULTANT
Project Manager Mike Martin
Associate Planner Seth Myers
OMNI MEANS – TRAFFIC AND CIRCULATION CONSULTANT
Traffic Analysis Paul Miller


APPENDIX A – CHICO WAL-MART
STORE EXPANSION TRAFFIC IMPACT
STUDY


Chico Wal-Mart Store Expansion Traffic Impact Study
Final Report
Prepared For: Pacific Municipal Consultants Prepared By:

CHICO WAL-MART STORE EXPANSION TRAFFIC IMPACT STUDY
FINAL REPORT
Prepared For:
Pacific Municipal Consultants
Prepared By
OMNI-MEANS, LTD. ENGINEERS & PLANNERS 943 Reserve Drive, Suite 100 Roseville, California 95678
(916) 782-8688
March 2009
25-5130-10 (R782TS008.DOC)

Chico Wal-Mart Store Expansion Traffic Impact Study Page i Pacific Municipal Consultants (R782TS008.DOC./25-5130-10)
TABLE OF CONTENTS INTRODUCTION ........................................................................................................................................ 1 EXISTING ROADWAY SYSTEM.............................................................................................................. 4 STUDY INTERSECTIONS ......................................................................................................................... 5 FREEWAY MAINLINE............................................................................................................................... 7 FREEWAY RAMPS..................................................................................................................................... 7 ANALYSIS METHODOLOGIES/POLICIES ............................................................................................. 7 EXISTING TRAFFIC OPERATIONS....................................................................................................... 15 SHORT TERM (2010) CONDITIONS ...................................................................................................... 18 SHORT TERM NO PROJECT TRAFFIC OPERATIONS........................................................................ 21 PROPOSED PROJECT .............................................................................................................................. 26 SHORT TERM PLUS PROJECT TRAFFIC OPERATIONS.................................................................... 38 CUMULATIVE (YEAR 2020) CONDITIONS ......................................................................................... 44 CUMULATIVE PLUS PROJECT TRAFFIC OPERATIONS .................................................................. 51 RECOMMENDATIONS/MITIGATIONS................................................................................................. 58
LIST OF FIGURES Figure 1 – Project Vicinity Map ................................................................................................................... 2 Figure 2 – Existing Lane Geometrics and Control ....................................................................................... 6 Figure 3 – Existing Peak Hour Volumes ...................................................................................................... 8 Figure 4 – Existing Freeway Mainline & Ramp Volumes............................................................................ 9 Figure 5 – Year 2010 Lane Geometrics and Control .................................................................................. 20 Figure 6 – Year 2010 No Project Traffic Volumes..................................................................................... 22 Figure 7 – Year 2010 No Project Freeway Mainline and Ramp Volumes ................................................. 24 Figure 8 – Project Site Plan ........................................................................................................................ 27 Figure 9A – “Wal-Mart” Trip Distribution................................................................................................. 32 Figure 9B – “Fast Food Restaurant/Gas Station” Trip Distribution ........................................................... 33 Figure 10 – Project Only Traffic Volumes ................................................................................................. 34 Figure 11 – Year 2010 Plus Project Traffic Volumes................................................................................. 39 Figure 12 – Year 2010 Plus Project Freeway Mainline and Ramp Volumes ............................................. 42 Figure 13 – Year 2020 Lane Geometrics and Control ................................................................................ 46 Figure 14 – Year 2020 No Project Traffic Volumes................................................................................... 47 Figure 15 – Year 2020 No Project Freeway Mainline and Ramp Volumes ............................................... 49 Figure 16 – Year 2020 Plus Project Traffic Volumes................................................................................. 52

Chico Wal-Mart Store Expansion Traffic Impact Study Page ii Pacific Municipal Consultants (R782TS008.DOC./25-5130-10)
LIST OF TABLES
Table 1 Level of Service (LOS) Criteria For Intersections......................................................................... 10 Table 2 Level of Service (LOS) Criteria for Roadways ............................................................................. 11 Table 3 Target Level of Service (LOS) for Caltrans Facilities ................................................................... 13 Table 4 Existing Conditions: City Intersections Levels-Of-Service........................................................... 15 Table 5 Existing Conditions: SR 99 Mainline Levels-of-Service............................................................... 16 Table 6 Existing Conditions: SR 99 Ramp Junction Levels-of-Service ..................................................... 17 Table 7 Short Term (Year 2010) No Project Conditions: City Intersections Levels-Of-Service .............. 21 Table 8 Short Term No Project Conditions: SR 99 Mainline Levels-of-Service........................................ 23 Table 9 Short Term No Project Conditions: SR 99 Ramp Junction Levels-of-Service .............................. 25 Table 10 Project Trip Generation................................................................................................................ 28 Table 11A Short Term (Year 2010) Plus Project City Intersections Levels-Of-Service ............................ 38 Table 11B Short Term (Year 2010) City Intersections Significant impact criteria .................................... 40 Table 12 Short Term Plus Project Conditions: SR 99 Mainline Levels-of-Service.................................... 41 Figure 12 – Year 2010 Plus Project Freeway Mainline and Ramp Volumes ............................................. 42 Table 13A Short Term Plus Project Conditions: SR 99 Ramp Junction Levels-of-Service ....................... 43 Table 13B Short Term (Year 2010) Ramp Junctions Significant impact criteria ....................................... 43 Table 14 Cumulative No Project Conditions City Intersections Levels-Of-Service .................................. 45 Table 15 Cumulative No Project Conditions: SR 99 Mainline Levels-of-Service ..................................... 48 Table 16 Cumulative No Project Conditions: SR 99 Ramp Junction Levels-of-Service............................ 50 Table 17 Cumulative No Project Conditions: SR 99 Weaving Levels-of-Service ..................................... 50 Table 18A Cumulative Plus Project Conditions City Intersections Levels-Of-Service.............................. 51 Table 18B Cumulative Conditions City Intersections Significant impact criteria...................................... 53 Table 19 Cumulative Plus Project Conditions: SR 99 Mainline Levels-of-Service ................................... 54 Table 20A Cumulative Plus Project Conditions: SR 99 Ramp Junction Levels-of-Service....................... 55 Table 20B Cumulative Conditions Ramp Junctions Significant impact criteria......................................... 55 Table 21A Cumulative Plus Project Conditions: SR 99 Weaving Levels-of-Service ................................ 57 Table 21B Cumulative Conditions Weaving Junctions Significant impact criteria.................................... 57
APPENDIX
Intersection Level-Of-Service Worksheets SR 99 Freeway Mainline Analysis SR 99 Ramps Analysis Traffic Signal Warrant Worksheets

Chico Wal-Mart Store Expansion Traffic Impact Study Page 1 Pacific Municipal Consultants (R782TS008.DOC./25-5130-10)
INTRODUCTION This report has been prepared to present the results of a traffic impact analysis performed by Omni-Means for the proposed Chico Wal-Mart Store Expansion in the City of Chico. The term “project”, as used in this report, refers to the proposed Chico Wal-Mart Store Expansion. The proposed project is located at 2044 Forest Avenue in the southeastern portion of the City of Chico in Butte County. The project site comprises 27.08 acres and is bounded to the north by Baney Lane, to the east by Forest Avenue, to the south by Wittmeier Drive, and to the west by office-commercial development fronting State Route 99. The site is currently designated as “Community Commercial and Service Commercial” within the City of Chico General Plan, and is currently zoned as Community Commercial. The project site consists of three parcels. Two of the parcels (APN 002-370-055 and 002-370-057) comprise 16.46 acres and currently contain an existing 125,889 sq. ft. Wal-Mart retail store and an adjacent parking lot containing 630 parking spaces. The third parcel (APN 002-170-004) is 10.62 acres and consists of undeveloped land located adjacent to and south of the existing Wal-Mart store. The existing Wal-Mart store is currently accessed via three Baney Lane driveways, a Forest Avenue driveway, and a Business Lane driveway, which leads into the rear alley. Figure 1 shows the project study area. The proposed project would provide for construction of an additional 97,556 sq. ft. to the south side of the existing 125,889 sq. ft. Wal-Mart store to create a 223,445 sq. ft. Wal-Mart Supercenter. Approximately 60,000 sq. ft. of the expansion would be used for a grocery sales area. The remaining square footage would be used for storage and general merchandise sales. The parking lot would be expanded to the south of the existing lot adding 431 parking spaces, which would bring the total number of parking spaces on the project site to 1,061. The project would utilize all of the existing driveways on Baney Lane, Business Lane, and Forest Avenue, as well as two new additional driveways to the south onto Wittmeier Drive as part of the expansion. Also, although not officially a part of the project, the traffic analysis also considers the impacts associated with development of the 2.42 acre out parcel located within the extreme southeastern portion of the project site immediately northwest of the intersection of Forest Avenue/Wittmeier Drive. At present, there are no plans for development of this out parcel. For purposes of this study, based on information provided by the project proponent, this out parcel is assumed to be developed with a gas station (with 12 fueling stations) and a 5,000 sq. ft. fast food restaurant with drive through. Included in this report is a description of the existing transportation setting, including the current AM, PM, and Saturday peak hour traffic operations at key intersections which were selected for analysis by City of Chico staff. In addition, this report includes an analysis and discussion of the following items:
• Impacts of the Short Term Conditions (Year 2010) within the City of Chico on existing AM, PM, and Saturday peak hour intersection operations.
• Quantification of the trip generation and trip distribution associated with the proposed project and the
resulting impacts on existing AM, PM, and Saturday peak hour intersection operations.


Chico Wal-Mart Store Expansion Traffic Impact Study Page 3 Pacific Municipal Consultants (R782TS008.DOC./25-5130-10)
• The projected cumulative (year 2020) peak hour intersection operations with and without the development of the proposed project.
• Potential base improvements and project-related mitigation measures that are needed to alleviate
unacceptable level of traffic impacts at the study intersections and roadway segments, under conditions both without and with the development of the proposed project.
The following traffic scenarios are analyzed as a part of this report,
• Existing Conditions • Short Term No Project Conditions (Year 2010 Scenario) • Short Term Plus Project Conditions (Year 2010 + Project Scenario) • Cumulative No Project Conditions • Cumulative Plus Project Conditions
Existing conditions describes the existing transportation facilities serving the project site, and the traffic operations, which currently exist for those facilities. Short Term conditions refer to analysis scenarios which will exist during the Year 2010, or the appropriate time the proposed project may be built and fully occupied. Short Term 2010 traffic volumes for the study area were obtained from two sources, Chico 2005-2006 Update of Development Impact Fees Analysis and Recommendations, Nexus Study (City of Chico, October 2005) and the Meriam Park Phasing Analysis (W-Trans, May 2, 2007). Both of these sources provided traffic volumes for the 2010 horizon year. Short Term No Project condition investigates traffic operations in Year 2010, but excluding development of the proposed project. The Short Term Plus Project condition is the analysis scenario in which traffic impacts associated with the proposed project (i.e., the Chico Wal-Mart) are investigated in comparison to the Short Term No Project condition scenario. Wal-Mart Expansion volumes as established using trip generation and distribution methodologies provided for within this analysis were added to Short Term No Project volumes to establish Short Term Plus Project volumes. Short Term conditions assumes that some programmed or planned improvements might be completed, including potentially some project related improvements. Cumulative conditions typically refer to analysis scenarios which would exist following assumed build out of the local General Plan. Cumulative traffic volumes for the study area were also obtained from the two sources, Chico 2005-2006 Update of Development Impact Fees Analysis and Recommendations, Nexus Study (City of Chico, October 2005) and the Meriam Park Phasing Analysis (W-Trans, May 2, 2007). The Nexus Study included a future horizon year of 2018 to coincide with its General Plan horizon. The Meriam Park land use plan included an ultimate building phase for the Year 2020 conditions. Data for both Year 2018 and 2020 conditions were used at the study locations as applicable. Additional discussion on the projections and varying horizon years are available within a subsequent section of the report. For ease of reference, within this study, the Cumulative (future) year was referred to as Year 2020. The Cumulative No Project condition investigates traffic operations for Year 2020 conditions, but excluding development of the proposed project. The Cumulative Plus Project condition is the analysis scenario in which traffic impacts associated with the proposed project (i.e., the Chico Wal-Mart Expansion) are investigated in comparison to the Cumulative No Project condition scenario. Wal-Mart Expansion volumes as established using trip generation and distribution methodologies provided for within this analysis were added to Cumulative No Project volumes to establish Cumulative Plus Project volumes. Cumulative conditions assume that programmed or planned improvements will be completed, including potentially some project related improvements. The above traffic scenarios are described in further detail and evaluated in subsequent sections of this report.

Chico Wal-Mart Store Expansion Traffic Impact Study Page 4 Pacific Municipal Consultants (R782TS008.DOC./25-5130-10)
EXISTING ROADWAY SYSTEM Existing conditions describes the existing transportation facilities serving the project site. ROADWAY NETWORK Roadways that provide primary circulation in the vicinity of the project site are described below. State Highways State Route 99 (SR 99) is a major state freeway facility that traverses north/south through central and northern California. SR 99 serves as the primary inter-regional auto and truck travel route that connects the northern valley cities of Chico and Yuba City with Sacramento and central valley cities of Stockton, Modesto, Fresno, and Bakersfield. Within the City of Chico, SR 99 also serves as a major commuter route providing vital north/south circulation, providing a four-lane divided cross section with a posted speed limit of 55 mph. Caltrans reported an Annual Average Daily Traffic Volume (AADT) of 58,000 and 69,000 vehicles on SR 99 just south and north of the East 20th Street interchange, respectively. Based upon Caltrans Publication “2004 Annual Average Daily Truck Traffic on the California State Highway System”, the average truck percentage on SR 99 is approximately 10% for the section south and north of the East 20th Street interchange. City Roadways The following local roadways are under the jurisdiction of the City of Chico. Given roadway classifications are based on those established within the report City of Chico General Plan, Transportation Element. East 20th Street is a major east-west arterial that begins in the west at Park Avenue, and continues east through an SR 99 interchange to Bruce Road, where the roadway continues as Warfield Lane into residential development. With the exception of the easternmost ½ mile of roadway near Bruce Road, East 20th Street is a divided 4-lane roadway with channelized left turn pockets at major streets, a posted Class II bike lane, and a posted speed limit of 35 mph. East Park Avenue and Skyway combine to serve as a major east-west arterial. East Park Avenue (Business SR 99) extends westward from the SR 99 interchange approximately ¾ mile terminating at Midway. Skyway extends eastward from the SR 99 interchange deep into the foothills. In the vicinity of the project site, both roadways are divided 4-lane facilities with channelized left turn pockets at major streets, except within the SR 99 interchange where only a single westbound through lane exists between the ramps. The roadways maintain a posted speed limit of 35 mph west of Notre Dame Boulevard, 45 mph between Notre Dame Boulevard and the City’s eastern limits, and 50-55 mph east of the City. Forest Avenue is a major north-south arterial providing connection between the east-west arterial streets of SR 32, 20th Street, and Skyway (via Notre Dame Boulevard as described below). Within the vicinity of the project, Forest Avenue maintains a divided 4-lane configuration arterial with channelized left turn pockets at major streets, a posted Class II bike lane, and a posted speed limit of 35 mph. Notre Dame Boulevard is north-south arterial connecting Forest Avenue and Skyway, serving basically as the southern continuation for Forest Avenue traffic. Although Notre Dame Boulevard continues north from Forest Avenue and south from Skyway, these facilities are 2-lane collector roadways. Between Forest Avenue and Skyway, the roadway is a divided 4-lane facility with channelized left turn pockets and a posted speed limit of 35 mph. Wittmeier Drive is a short 2-lane east-west roadway which exists along the southern boundary of the proposed project, terminating to the west as a cul-de-sac, and to the east at Forest Avenue. The roadway

Chico Wal-Mart Store Expansion Traffic Impact Study Page 5 Pacific Municipal Consultants (R782TS008.DOC./25-5130-10)
continues east through Forest Avenue into a residential subdivision as Talbert Drive. Two future driveways along Wittmeier Drive will provide access to the proposed Wal-Mart Expansion. The following roadways are private roads that provide access in the vicinity of the project site. Baney Lane is a private street that runs in an east-west direction and has a two-lane undivided cross-section with a left-turn pocket provided at the easternmost Wal-Mart driveway. At the eastern terminus, Baney Lane forms a signalized intersection with Forest Avenue, and continues east through Forest Avenue into a residential subdivision as Parkway Village Drive. At the western terminus, Baney Lane tees into Business Lane. There are three existing Wal-Mart driveways on Baney Lane that will continue to provide access to the project site. Business Lane is a private street that runs in a north-south direction providing connection between 20th Street and Baney Lane. Business Lane has a two-lane undivided cross-section. At the northern terminus, Business Lane forms a right-turn-only stop sign controlled intersection with 20th Street. Within the cul-de-sac located at the roadway’s southern terminus south of Baney Lane, the roadway transitions into the private alley behind the existing Wal-Mart, which will also exist behind the proposed project as an additional access to and from the project site. STUDY INTERSECTIONS
• E. 20th Street / Whitman Avenue • E. 20th Street / SR 99 SB Ramps • E. 20th Street / SR 99 NB Ramps • E. 20th Street / Business Lane • E. 20th Street / Chico Mall Access • E. 20th Street / Forest Avenue • Business Lane / ToysRUs Access (Private Intersection) • Baney Lane / Business Lane-Wal-Mart Driveway (Private Intersection) • Baney Lane / Wal-Mart West Driveway (Private Intersection) • Baney Lane / Wal-Mart Central Driveway (Private Intersection) • Baney Lane / Wal-Mart East Driveway (Private Intersection) • Forest Avenue / Baney Lane-Parkway Village Drive • Forest Avenue / Wal-Mart Driveway • Forest Avenue / Talbert Drive-Wittmeier Drive • Forest Avenue / Notre Dame Boulevard • E. Park Avenue-Skyway / Whitman Road • E. Park Avenue-Skyway / SR 99 SB Off-Ramp • E. Park Avenue-Skyway / SR 99 NB Off-Ramp • Skyway / Notre Dame Boulevard
Intersection turning lane geometrics and traffic control for the above nineteen critical study intersections are illustrated on Figure 2. Existing traffic volumes were provided by the City of Chico for weekday AM, weekday PM, and Saturday peak hour periods at the critical study intersections listed above. These volumes were adjusted and balanced as necessary to establish a final set of existing intersection volumes, which were subsequently approved by the City. The AM peak hour is defined as the one-hour of peak traffic flow (which is the highest total volume count over four consecutive 15-minute count periods) counted between 7:00 AM and 9:00 AM on a typical weekday. The PM peak hour is defined as the one-hour of peak traffic flow counted between 4:00 PM and 6:00 PM on a typical weekday. The Saturday peak hour is defined as the one-hour of peak traffic flow counted between 11:30 AM and 1:30 PM on a Saturday.


Chico Wal-Mart Store Expansion Traffic Impact Study Page 7 Pacific Municipal Consultants (R782TS008.DOC./25-5130-10)
Existing AM, PM, and Saturday peak hour traffic volumes at the study intersections identified above are shown on Figure 3. FREEWAY MAINLINE Existing freeway mainline volumes were provided by the City of Chico along the following freeway mainline segments:
• SR 99 – E. Park Avenue-Skyway Interchange to E. 20th Street Interchange • SR 99 – E. 20th Street Interchange to SR 32 Interchange
FREEWAY RAMPS Existing volumes along the following freeway ramps were derived by Omni-Means based on existing volumes at the ramp intersections which were provided by the City:
• NB SR 99 on-ramp from E. Park Avenue-Skyway • NB SR 99 off-ramp to E. 20th Street • NB SR 99 on-ramp from E. 20th Street • NB SR 99 off-ramp to SR 32 • SB SR 99 on-ramp from SR 32 • SB SR 99 off-ramp to E. 20th Street • SB SR 99 on-ramp from E. 20th Street • SB SR 99 off-ramp to E. Park Avenue-Skyway
Existing AM, PM, and Saturday peak hour traffic volumes at the freeway mainline segments and ramp junctions identified above are shown on Figure 4. ANALYSIS METHODOLOGIES/POLICIES Traffic operations have been quantified through the determination of "Level of Service" (LOS). Level of Service is a qualitative measure of traffic operating conditions, whereby a letter grade "A" through "F" is assigned to an intersection or roadway segment representing progressively worsening traffic conditions. LEVEL OF SERVICE ANALYSIS METHODOLOGIES Levels of Service have been calculated for all intersection control types using the methods documented in the Transportation Research Board Publication Highway Capacity Manual, Fourth Edition, 2000. For signalized intersections and all-way-stop-controlled (AWSC) intersections, the intersection delays and levels of service are average values for all intersection movements. For two-way-stop-controlled (TWSC) intersections, the intersection delays and levels of service are representative of those for the worst-case approach. Level of service criteria for different types of intersection control are outlined in Table 1. The average daily traffic based roadway level of service thresholds are shown in Table 2.


Chico Wal-Mart Store Expansion Traffic Impact Study Page 10 Pacific Municipal Consultants (R782TS008.DOC/25-5130-07)
TABLE 1 LEVEL OF SERVICE (LOS) CRITERIA FOR INTERSECTIONS
CONTROL DELAY (SECONDS/VEHICLE) LEVEL OF SERVICE TYPE OF FLOW DELAY MANEUVERABILITY SIGNALIZED UNSIGNALIZED ALL-WAY STOP
A
Stable Flow
Very slight delay. Progression is very favorable, with most vehicles arriving during the green phase not stopping at all.
Turning movements are easily made, and nearly all drivers find freedom of operation.
< 10.0
< 10.0
< 10.0
B Stable Flow Good progression and/or short cycle lengths. More vehicles stop than for LOS A, causing higher levels of average delay.
Vehicle platoons are formed. Many drivers begin to feel somewhat restricted within groups of vehicles.
>10 and < 20.0 >10 and < 15.0 >10 and < 15.0
C Stable Flow Higher delays resulting from fair progression and/or longer cycle lengths. Individual cycle failures may begin to appear at this level. The number of vehicles stopping is significant, although many still pass through the intersection without stopping.
Back-ups may develop behind turning vehicles. Most drivers feel somewhat restricted
>20 and < 35.0 >15 and < 25.0 >15 and < 25.0
D Approaching Unstable Flow
The influence of congestion becomes more noticeable. Longer delays may result from some combination of unfavorable progression, long cycle lengths, or high volume-to-capacity ratios. Many vehicles stop, and the proportion of vehicles not stopping declines. Individual cycle failures are noticeable.
Maneuverability is severely limited during short periods due to temporary back-ups.
>35 and < 55.0 >25 and < 35.0 >25 and < 35.0
E Unstable Flow Generally considered to be the limit of acceptable delay. Indicative of poor progression, long cycle lengths, and high volume-to-capacity ratios. Individual cycle failures are frequent occurrences.
There are typically long queues of vehicles waiting upstream of the intersection.
>55 and < 80.0 >35 and < 50.0 >35 and < 50.0
F Forced Flow Generally considered to be unacceptable to most drivers. Often occurs with over saturation. May also occur at high volume-to-capacity ratios. There are many individual cycle failures. Poor progression and long cycle lengths may also be major contributing factors.
Jammed conditions. Back-ups from other locations restrict or prevent movement. Volumes may vary widely, depending principally on the downstream back-up conditions.
> 80.0 > 50.0 > 50.0
References: 1. Highway Capacity Manual, Fourth Edition, Transportation Research Board, 2000.

Chico Wal-Mart Store Expansion Traffic Impact Study Page 11 Pacific Municipal Consultants (R782TS008.DOC/25-5130-10)
TABLE 2 LEVEL OF SERVICE (LOS) CRITERIA FOR ROADWAYS
Average Daily Traffic (ADT) – Total of Both Directions
Roadway Type LOS “A” LOS “B” LOS “C” LOS “D” LOS “E”
6-Lane Expressway (high access control) 36,000 42,000 48,000 54,000 60,000
6-Lane Divided Arterial (with left-turn lane) 32,000 38,000 43,000 49,000 54,000
4-Lane Expressway (high access control) 24,000 28,000 32,000 36,000 40,000
4-Lane Divided Arterial (with left-turn lane) 22,000 25,000 29,000 32,500 36,000
4-Lane Undivided Arterial (no left-turn lane) 18,000 21,000 24,000 27,000 30,000
2-Lane Arterial (with left-turn lane) 11,000 12,500 14,500 16,000 18,000
2-Lane Arterial (no left-turn lane) 9,000 10,500 12,000 13,500 15,000
4-Lane Collector 12,000 15,000 18,000 21,000 24,000
3-Lane Collector 9,000 11,250 13,500 15,750 18,000
2-Lane Collector 6,000 7,500 9,000 10,500 12,000 Notes: 1. Based on Highway Capacity Manual, Fourth Edition, Transportation Research Board, 2000.
2. All volume thresholds are approximate and assume ideal roadway characteristics. Actual thresholds for each LOS listed above may vary depending on a variety of factors including (but not limited to) roadway curvature and grade, intersection or interchange spacing, driveway spacing, percentage of trucks and other heavy vehicles, lane widths, signal timing, on-street parking, volume of cross traffic and pedestrians, etc.
STANDARDS OF SIGNIFICANCE To measure whether transportation facilities operate acceptably, or are significantly impacted by the addition of project generated traffic, the applicable standards of significance policies were identified for this study. Standards of significance policies establish level of service thresholds for acceptable/tolerable operations of transportation facilities, as well as the policies regarding what triggers a significant project impact. The governing policy for a particular study intersection or roadway segment is that which is established by the agency which owns and maintains the facility, although it might be necessary to also consider contradicting policies of other agencies which may have some jurisdictional interest with the facility. Within this study, the City of Chico and Caltrans all have standards of significance policies which apply to some, or all, of the study facilities. The standards of significance policies for each of these agencies are described in detail below, along with how the policies were interpreted for this study. The following local public agency planning documents were referenced to establish standards of significance for this analysis.
1) City of Chico General Plan 1999, City of Chico Planning Department, 1999. 2) State Route 99 – Chico Corridor Study, Quincy Engineering, October 2001.
City of Chico Standards of Significance The City of Chico General Plan (April 1999) Transportation Element quotes the following under the “Standards for Traffic Level of Service” section:
T-G-11: Strive to maintain traffic LOS “C” on residential streets and LOS “D” or better on arterial and collector streets, at all intersections, and on principal arterials in the CMP during peak hours. T-G-12: Accept LOS “E” for built-out areas served by transit after finding that:
• There is no practical and feasible way to mitigate the lower level of service; and • The uses resulting in the lower level of service are of clear, overall public benefit.

Chico Wal-Mart Store Expansion Traffic Impact Study Page 12 Pacific Municipal Consultants (R782TS008.DOC/25-5130-10)
Caltrans Standards of Significance The Caltrans published Guide for the Preparation of Traffic Impact Studies (dated December 2002) states the following:
“Caltrans endeavors to maintain a target LOS at the transition between LOS “C” and LOS “D” on State highway facilities, however, Caltrans acknowledges that this may not be always feasible and recommends that the lead agency consult with Caltrans to determine the appropriate target LOS.”
The “concept level of service” for study freeway mainline segments along the SR 99 corridor as stated within the State Route 99 – Chico Corridor Study, Quincy Engineering (October 2001) is provided below. Note that the “concept level of service” within the Chico Corridor Study was in turn obtained from the State Route 99 Route Concept Report (Caltrans District 3, July 1989)
• State Route 99 – Estates Drive to Skyway: LOS “D” • State Route 99 – Skyway to Mud Creek Bridge: LOS “E”
Private Streets Standards of Significance A few of the roadways and intersections analyzed within the traffic study are private streets including Baney Lane, Business Lane, and all private driveways leading to City streets (i.e. Chico Mall Access, Wal-Mart driveways). The City of Chico has established that the City's intersection LOS standards should not be applied to intersections of two private streets or private driveway approaches to either private streets or City arterials. (The LOS standards would be applied to signalized intersections which may include a private street connection, such as East 20th street/Chico Mall access.) Therefore, intersection LOS conditions are not presented for the private street intersections including Business Lane/ToysRUs, Business Lane/Baney Lane, and the Baney Lane/WalMart driveways. However, these intersections were evaluated based on traffic issues related to safety, sight distance, adherence to design standards, turn lane warrants, conflicts with adjacent intersections, and/or potential for vehicle conflicts. Impacts related to congestion were only considered if it impacted adjacent intersections or traffic safety. Standards of Significance Summary For non-Caltrans facilities owned and maintained by the City, LOS “D” will be taken as the governing threshold. For private facilities, including Baney Lane, Business Lane, Chico Mall Access, and Wal-Mart driveways, there will be no LOS threshold. Rather, these intersections were evaluated based on traffic issues related to safety, sight distance, adherence to design standards, turn lane warrants, conflicts with adjacent intersections, and/or potential for vehicle conflicts. Impacts related to congestion were only considered if it impacted adjacent intersections or traffic safety. For Caltrans facilities, the minimum acceptable LOS for SR 99 mainline, ramp junction, and at-grade ramp intersections is based on the concept LOS for the segments identified above. Based on the above discussion, Table 3 provides the target level of service that will be utilized for the mainline, ramp junction, and at-grade ramp intersections.

Chico Wal-Mart Store Expansion Traffic Impact Study Page 13 Pacific Municipal Consultants (R782TS008.DOC/25-5130-10)
TABLE 3 TARGET LEVEL OF SERVICE (LOS) FOR CALTRANS FACILITIES
Mainline/ Ramp Junction/ At-Grade Ramp Intersections
Target LOS
SR 99 Mainline Segment– north of Skyway E
SR 99/Skyway Ramp Junction – NB On-Ramp E
SR 99/Skyway Ramp Junction – SB Off-Ramp E
SR 99 NB Ramps/Skyway Intersection D
SR 99 SB Ramps/Skyway Intersection D
SR 99 Mainline Segment – north of 20th Street E
SR 99/20th Street Ramp Junction – NB On and Off-Ramp E SR 99/20th Street Ramp Junction – SB On and Off-Ramp E SR 99 NB Ramps/20th Street Intersection D
SR 99 SB Ramps/20th Street Intersection D
SR 99/SR 32 Ramp Junction – NB Off-Ramp E
SR 99/ SR 32 Ramp Junction – SB On-Ramp E
SIGNIFICANT IMPACT THRESHOLD CRITERIA – CITY AND CALTRANS FACILITIES This traffic study identified significant impacts of the proposed project utilizing the following thresholds for the City and Caltrans Facilities: Signalized intersections: The project is considered to have a significant impact if it would:
Result in a signalized intersection operating at an acceptable LOS to deteriorate to an unacceptable LOS; or
Increase the delay by more than 5 seconds at a signalized intersection that is operating at an unacceptable LOS without the project.
Unsignalized Intersections: The project is considered to have a significant impact if it would:
Result in an unsignalized intersection movement/approach operating at acceptable LOS to deteriorate to an unacceptable LOS, and also cause the intersection to meet a traffic signal warrant; or
Increase the delay by more than 5 seconds for a movement/approach at an unsignalized intersection that meets a signal warrant where the movement/approach is operating at unacceptable LOS without the project.
Freeway Mainline/Ramp Merge-Diverge/Weave: The project is considered to have a significant impact if it would:
Result in a facility operating at an acceptable LOS to deteriorate to an unacceptable LOS, according to the LOS threshold defined by Caltrans.
Increase the density by more than 0.05 (5%) at a facility that is operating at an unacceptable LOS without the project.
TRAFFIC SIGNAL WARRANT ANALYSIS CRITERIA The term “signal warrants” refers to the list of established criteria used by public agencies to quantitatively justify or ascertain the need for installation of a traffic signal at an otherwise unsignalized intersection location. This study employed the signal warrant criteria presented in the latest edition of the California Manual on Uniform Traffic Control Devices (MUTCD). The signal warrant criteria are based upon several factors including volume of vehicular and pedestrian traffic, frequency of accidents, location of school areas, etc. The MUTCD indicates that the installation of a traffic signal should be considered if one or more of the signal warrants are met. Specifically, this study utilized the Peak-Hour-Volume based Warrant 3 as the

Chico Wal-Mart Store Expansion Traffic Impact Study Page 14 Pacific Municipal Consultants (R782TS008.DOC/25-5130-10)
primary representative type of traffic signal warrant analysis. TURN LANE WARRANT CRITERIA At streets and intersections (including private roads) where there are no existing turn lanes to serve left-turn movements off of the main street, a warrant criteria was used which considers the volume of left-turn traffic and opposing through traffic. This methodology utilizes recommendations of Larson and Mannering for the Washington State Transportation Center (TRAC), as contained in their report "Method for Prioritizing Intersection Improvements" (1997). The authors performed analysis and review of several differing methodologies and found that the 1991 "Modified Harmelink (AASHTO)" model developed by Kikuchi and Chakroborty yielded the most reliable and appropriate recommendations. This criteria considers the potential for left-turning traffic to take shorter than appropriate gaps as well as for potential queuing in determining the need for left-turn lanes. TECHNICAL ANALYSIS PARAMETERS Intersections The Traffix 7.7 (Dowling Associates) software program was used to implement the HCM-2000 analysis methodologies. Assessment of “design level” parameters (including queuing on intersection lane groups, stacking length requirements, coordinated signal operations analyses, etc.) have been included in this study. Freeway Mainline, Ramp Merge/Diverge and Weaving LOS Methodologies Freeway mainline, ramp (merge/diverge) junction and mainline weaving operations peak hour traffic operations were analyzed using methodologies presented in the Highway Capacity Manual (HCM 2000). The Transportation Research Board (TRB) published Highway Capacity Software 2000 (HCS-2000), Version 4.1, was applied in this analysis. Assumptions used in this analysis include:
• 0.90 peak hour factor (both mainline and ramps) • 10 % heavy vehicles during the peak hour periods analyzed - obtained from Average Annual
Daily Truck Traffic on the California State Highway System, November 2004 (http://www.dot.ca.gov/hq/traffops/saferesr/trafdata/truck2003final.pdf)
• A Passenger Car Equivalency (PCE) factor of 1.5 (level terrain), established based on the terrain (level, rolling, or mountainous), was utilized for evaluating the mainline, ramp merge/diverge and weaving operations.

Chico Wal-Mart Store Expansion Traffic Impact Study Page 15 Pacific Municipal Consultants (R782TS008.DOC/25-5130-10)
EXISTING TRAFFIC OPERATIONS Existing conditions were simulated by using existing intersection volumes. INTERSECTIONS Existing peak hour intersection traffic operations were analyzed utilizing existing traffic volumes (shown on Figure 3) and existing intersection lane geometrics and control (shown on Figure 2). Table 4 provides a summary of the Existing peak hour intersection levels of service for the City maintained intersections.
TABLE 4 EXISTING CONDITIONS: CITY INTERSECTIONS LEVELS-OF-SERVICE
#Delay LOS
Warrant Met?2 Delay LOS
Warrant Met?2 Delay LOS
Warrant Met?2
1 E 20th St./Whitman Avenue
Signal D 18.1 B - 26.3 C - 38.9 D -
2 E 20th St./SB SR-99 Ramps
Signal D 21.6 C - 26.6 C - 27.4 C -
3 E 20th St./NB SR-99 Ramps
Signal D 12.6 B - 38.0 D - 20.5 C -
4 E 20th St./Business Lane TWSC D 9.6 A No 12.1 B No 11.6 B No
5 E 20th St./Chico Mall Access
Signal D 13.6 B - 49.1 D - 61.9 E -
6 E 20th St./Forest Ave
Signal D 32.9 C - 45.5 D - 71.7 E -
12 Forest Ave/Baney Lane/Pkwy Village Dr.
Signal D 25.9 C - 27.4 C - 28.3 C -
13 Forest Ave/Wal Mart Dwy
TWSC D 10.0 A No 10.7 B No 11.0 B No
14 Forest Ave/Talbert-Whittmeier Dr.
TWSC D 15.0 B No 36.4 E No 26.5 D No
15 Forest Ave/Notre Dame Blvd.
Signal D 19.8 B - 17.8 B - 13.2 B -
16 E.Park Ave/Whitman Ave
Signal D 8.5 A - 23.2 C - 21.3 C -
17 E.Park Ave/Skyway/SB SR-99 Ramps
TWSC D 10.2 B - 23.6 C - 12.0 B -
18 E.Park Ave/Skyway/NB SR-99 Ramps
Signal D 10.1 B - 10.8 B - 9.5 A -
19 Skyway/Notre Dame Blvd
Signal D 27.7 C - 45.7 D - 37.7 D -
Notes: Bolded entries indicate intersections operating at Unacceptable LOS.
AM Peak Hour PM Peak Hour
LOS conditions do not apply to intersections 7 through 11 which are private intersections. Significance is discussed within the Recommendations/Mitigations section of the report.
1) TWSC = Two Way Stop Control (LOS and delay are based on LOS and delay for worst approach)
IntersectionControl Type1
Sat Peak Hour
Target LOS
2) Warrant = Caltrans Peak hour volume based signal warrant

Chico Wal-Mart Store Expansion Traffic Impact Study Page 16 Pacific Municipal Consultants (R782TS008.DOC/25-5130-10)
As shown in Table 4, the following intersections were found to be currently operating at unacceptable LOS under Existing conditions during at least one peak hour period.
• East 20th Street/Chico Mall Access – This signalized intersection is found to be operating at unacceptable LOS “E” during the Saturday peak hour period.
• East 20th Street/Forest Avenue – This signalized intersection is found to be operating at unacceptable LOS “E” during the Saturday peak hour period.
• Forest Avenue/Talbert-Wittmeier Drive – This unsignalized intersection is found to be operating at unacceptable LOS “E” during the weekday PM peak hour period based on the delay experienced by vehicles along the stop controlled eastbound Wittmeier Drive approach.
PRIVATE INTERSECTIONS Business Lane/ToysRUs Access – This unsignalized intersection which is located approximately 150 feet south of the intersection with East 20th Street is designed with typical minor street standards with stop controls on the westbound approach and adequate sight distance for all movements. In addition, there has not been a demonstrated safety problem in the past. Traffic in the area generally moves at slow speeds. Baney Lane/Wal-Mart Driveways – Baney Lane is currently narrow and only is wide enough for one lane in each direction, west of the easternmost driveway. The street currently serves three Walmart driveways on the south, two gas station driveways to the northeast and a hotel driveway to the northwest. Business Lane/Baney Lane – This unsignalized intersection is designed with typical minor street standards with adequate sight distance and stop control on the westbound Baney Lane approach. There is one approach lane in each direction.
FREEWAY MAINLINE SEGMENTS Existing peak hour mainline operations were evaluated utilizing the existing peak hour traffic volumes shown on Figure 4. Table 5 summarizes Existing conditions’ SR 99 freeway mainline operations.
TABLE 5 EXISTING CONDITIONS: SR 99 MAINLINE LEVELS-OF-SERVICE
Freeway Mainline Segment
No. Lanes Volume
Density, (pc/mi/ln) LOS Volume
Density, (pc/mi/ln) LOS Volume
Density, (pc/mi/ln) LOS
SR 99 NB, north of Skyway I/C 2 E 1,912 17.2 B 2,606 23.4 C 1,886 16.9 B
SR 99 SB, north of Skyway I/C 2 E 2,391 21.5 C 2,057 18.5 C 1,426 12.8 B
SR 99 NB, north of 20th Street I/C
2 E 2,375 21.3 C 3,362 31.6 D 2,393 21.5 C
SR 99 SB, north of 20th
Street I/C2 E 2,551 22.9 C 2,264 20.3 C 1,564 14.0 B
Target LOS
Sat Peak HourAM Peak Hour PM Peak Hour
Notes: pc/mi/ln = Passenger Cars per Mile per Lane As shown in Table 5, all four mainline segments are projected to operate at acceptable LOS (LOS “E” or better) during AM, PM and Saturday peak hour periods under Existing conditions. FREEWAY RAMP JUNCTIONS Existing peak hour ramp operations were evaluated utilizing the existing peak hour traffic volumes shown on Figure 4. Table 6 presents the Existing conditions’ ramp merge/diverge peak hour LOS at the three study interchange locations in the vicinity of the study area.

Chico Wal-Mart Store Expansion Traffic Impact Study Page 17 Pacific Municipal Consultants (R782TS008.DOC/25-5130-10)
TABLE 6 EXISTING CONDITIONS: SR 99 RAMP JUNCTION LEVELS-OF-SERVICE
SR 99 & Skyway Interchange
Junction Type
Density (pc/mi/ln) LOS
Density (pc/mi/ln) LOS
Density (pc/mi/ln) LOS
SR 99 NB Direct On-Ramp Merge E 17.6 B 21.2 C 14.3 BSR 99 NB Loop On-Ramp Merge E 8.2 A 13.4 B 8.4 ASR 99 SB Off-Ramp Diverge E 25.8 C 22.5 C 16.1 B
SR 99 & 20th Street Interchange
Junction Type
Density (pc/mi/ln) LOS
Density (pc/mi/ln) LOS
Density (pc/mi/ln) LOS
SR 99 NB Off-Ramp Diverge E 21.0 C 28.0 C 20.7 CSR 99 NB On-Ramp Merge E 19.8 B 30.5 D 22.6 DSR 99 SB Off-Ramp Diverge E 27.4 C 24.5 C 17.5 BSR 99 SB On-Ramp Merge E 16.7 B 7.6 A 3.5 A
SR 99 & SR 32 Interchange
Junction Type
Density (pc/mi/ln) LOS
Density (pc/mi/ln) LOS
Density (pc/mi/ln) LOS
SR 99 NB Off-Ramp Diverge E 25.7 C 35.6 E 25.8 CSR 99 SB On-Ramp Merge E 23.7 C 20.9 C 13.4 B
AM Peak Hour PM Peak Hour
Target LOS
Target LOS
Target LOS
Sat Peak Hour
Sat Peak Hour
Sat Peak HourAM Peak Hour PM Peak Hour
AM Peak Hour PM Peak Hour
Notes: pc/mi/ln = Passenger Cars per Mile per Lane As shown in Table 6, all study ramp merge/diverge junctions are projected to operate at acceptable LOS (LOS “E” or better) during AM, PM and Saturday peak hour periods under Existing conditions.

Chico Wal-Mart Store Expansion Traffic Impact Study Page 18 Pacific Municipal Consultants (R782TS008.DOC/25-5130-10)
SHORT TERM (2010) CONDITIONS At the direction of the City of Chico, Short Term conditions within this analysis are taken as year 2010, which is the time at which the proposed project is expected to be completely built and fully occupied. Raw 2010 traffic volumes were provided by the City (obtained from the following two sources: (1) Chico 2005-2006 Update of Development Impact Fees Analysis and Recommendations, Nexus Study, City of Chico, October 2005 and (2) Meriam Park Phasing Analysis, W-Trans, May 2, 2007) and included traffic from the first phase of the Meriam Park, and the proposed Wal-Mart Expansion project. For purposes of this traffic analysis, it is necessary to back out the specific traffic volumes within the raw volumes associated with the Wal-Mart Expansion project (provided by the City) for no project conditions, and add them back for plus project conditions. The Short Term Plus Project condition is the analysis scenario in which traffic impacts associated with the proposed project (i.e., the Chico Wal-Mart) are investigated in comparison to the Short Term No Project condition scenario. Wal-Mart Expansion volumes as established using trip generation and distribution methodologies provided for within this analysis were added to Short Term No Project volumes to establish Short Term Plus Project volumes. Short Term conditions assume that some programmed or planned improvements might be completed, including potentially some project related improvements. ROADWAY/INTERSECTION IMPROVEMENTS Based on discussions with the City of Chico staff, it is understood that improvements are planned for the following four intersections, and likely to be completed by Year 2010. These improvements are funded under the Nexus Study. A copy of the memo which describes these improvements has been included in the Appendix. Intersection #1) E. 20th Street/Whitman Ave.:-
1) A northbound right-turn overlap phase has been installed Intersection #6) E. 20th Street/Forest Ave:-
1) NB approach – a second-left turn lane would be added, and the storage length increased for both left-turn lanes
2) SB approach – Traffic signal phasing would be modified to add a right-turn green arrow 3) EB approach – An exclusive right-turn lane would be provided. Traffic signal phasing would be
modified to include a right-turn arrow. 4) WB approach – The approach would consist of one through-right, two throughs and one left.
Intersection #17) Skyway/SR 99 SB off ramp:-
1) Existing westbound traffic must cross eastbound traffic to enter the southbound on-ramp. This will be eliminated and replaced with a new southbound loop on-ramp on the northwest side of the interchange.
2) The existing southbound off-ramp for eastbound traffic will be eliminated 3) The existing southbound off-ramp for westbound traffic will be widened to include all off-ramp
traffic. A new signal will be installed at Skyway and the southbound off-ramp traffic to allow protected east and west movements onto the Skyway.
Intersection #18) SR 99/Skyway Northbound ramp intersection:-
1) There will be a single on-ramp that will widen to two lanes to provided additional capacity.
Intersection #19) Skyway/Notre Dame Blvd.:- Improvements include roadway widening to both Skyway and Notre Dame Blvd. as follows:-
1) The improvements for southbound Notre Dame traffic include an additional right-hand turn lane, a

Chico Wal-Mart Store Expansion Traffic Impact Study Page 19 Pacific Municipal Consultants (R782TS008.DOC/25-5130-10)
bike lane, a through-left lane, and a left-hand turn lane at the Skyway intersection. 2) Skyway will add an exclusive right-turn lane for northbound traffic at Notre Dame. An additional
eastbound through lane will be added through the intersection.
These improvements are shown in Figure 5, and will be assumed to be in place for Short Term conditions both with and without the proposed project. Existing lane geometrics and control will be used for analysis at all other study locations.


Chico Wal-Mart Store Expansion Traffic Impact Study Page 21 Pacific Municipal Consultants (R782TS008.DOC/25-5130-10)
SHORT TERM NO PROJECT TRAFFIC OPERATIONS Short Term (2010) conditions typically refer to analysis scenarios which will exist around Year 2010, and represent development which is expected to occur by that date including the first phase of the Meriam Park project. Figure 6 shows the Short Term No Project traffic volumes used in this study established using methodologies described previously. INTERSECTIONS Short Term No Project peak hour intersection traffic operations were analyzed utilizing derived Short Term No Project peak hour intersection traffic volumes (shown on Figure 6) and Year 2010 lane geometries and control (shown on Figure 5). Table 7 provides a summary of the resulting peak hour intersection levels of service for the City maintained intersections.
TABLE 7
SHORT TERM (YEAR 2010) NO PROJECT CONDITIONS: CITY INTERSECTIONS LEVELS-OF-SERVICE
#Delay LOS
Warrant Met?2 Delay LOS
Warrant Met?2 Delay LOS
Warrant Met?2
1 E 20th St./Whitman Avenue
Signal D 14.3 B - 23.5 C - 30.4 C -
2 E 20th St./ SB SR-99 Ramps
Signal D 22.3 C - 31.1 C - 29.5 C -
3 E 20th St./NB SR-99 Ramps
Signal D 13.6 B - 53.1 D - 23.3 C -
4 E 20th St./Business Lane
TWSC D 9.6 A No 11.4 B No 11.0 B No
5 E 20th St./Chico Mall Access
Signal D 13.5 B - 36.0 D - 56.5 E -
6 E 20th St./Forest Ave
Signal D 25.2 C - 32.5 C - 33.4 C -
12 Forest Ave/Baney Lane/Pkwy Village Dr.
Signal D 24.4 C - 27.2 C - 29.2 C -
13 Forest Ave/Wal Mart Dwy
TWSC D 10.2 B No 11.7 B No 10.9 B No
14 Forest Ave/Talbert-Whittmeier Dr.
TWSC D 19.5 C No 75.7 F No 84.2 F No
15 Forest Ave/Notre Dame Blvd.
Signal D 18.1 B - 15.4 B - 11.6 B -
16 E.Park Ave/Whitman Ave
Signal D 8.5 A - 23.7 C - 22.0 C -
17 E.Park Ave/Skyway/SB SR-99 Ramps
Signal D 19.1 B - 21.7 C - 10.5 B -
18 E.Park Ave/Skyway/NB SR-99 Ramps
Signal D 10.5 B - 12.1 B - 11.3 B -
19 Skyway/Notre Dame Blvd
Signal D 22.4 C - 31.2 C - 31.3 C -
Notes: Bolded entries indicate intersections operating at Unacceptable LOS.1) TWSC = Two Way Stop Control (LOS and delay are based on LOS and delay for worst approach)
IntersectionControl Type1
Sat Peak Hour
Target LOS
2) Warrant = Caltrans Peak hour volume based signal warrant
AM Peak Hour PM Peak Hour
LOS conditions do not apply to intersections 7 through 11 which are private intersections. Significance is discussed within the Recommendations/Mitigations section of the report.


Chico Wal-Mart Store Expansion Traffic Impact Study Page 23 Pacific Municipal Consultants (R782TS008.DOC/25-5130-10)
Note that operations at a few of the intersections in the above table improve over the Existing conditions either due to improvements assumed under Short Term conditions or traffic projections which are lower than the existing traffic volumes. As shown in Table 7, the following intersections were found to operate at unacceptable LOS under Short Term No Project conditions during at least one peak hour period.
• E. 20th Street/Chico Mall Access – This signalized intersection is projected to operate at unacceptable LOS “E” during the Saturday peak hour
• Forest Avenue/Talbert-Wittmeier Drive – This unsignalized intersection is projected to operate at unacceptable LOS “F” during the PM and Saturday peak hour periods based on the delay anticipated along the stop controlled Talbert- Wittmeier approaches.
FREEWAY MAINLINE SEGMENTS Short Term No Project peak hour mainline operations were evaluated utilizing the Short Term No Project peak hour traffic volumes shown on Figure 7. Table 8 summarizes Short Term No Project conditions’ SR 99 freeway mainline operations.
TABLE 8 SHORT TERM NO PROJECT CONDITIONS: SR 99 MAINLINE LEVELS-OF-SERVICE
Freeway Mainline Segment
No. Lanes Volume
Density, (pc/mi/ln) LOS Volume
Density, (pc/mi/ln) LOS Volume
Density, (pc/mi/ln) LOS
SR 99 NB, north of Skyway I/C
2 E 2,256 20.2 C 3,263 30.3 D 2,455 22.0 C
SR 99 SB, north of Skyway I/C
2 E 2,897 26.2 D 2,613 23.5 C 1,926 17.3 B
SR 99 NB, north of 20th Street I/C
2 E 2,673 24.0 C 3,927 42.2 E 2,889 26.1 D
SR 99 SB, north of 20th
Street I/C2 E 2,988 27.1 D 2,780 25.0 C 2,019 18.1 C
Sat Peak HourTarget LOS
AM Peak Hour PM Peak Hour
Notes: pc/mi/ln = Passenger Cars per Mile per Lane As shown in Table 8, all four mainline segments are projected to operate at acceptable LOS (LOS “E” or better) during AM, PM and Saturday peak hour periods under Short Term No Project conditions.

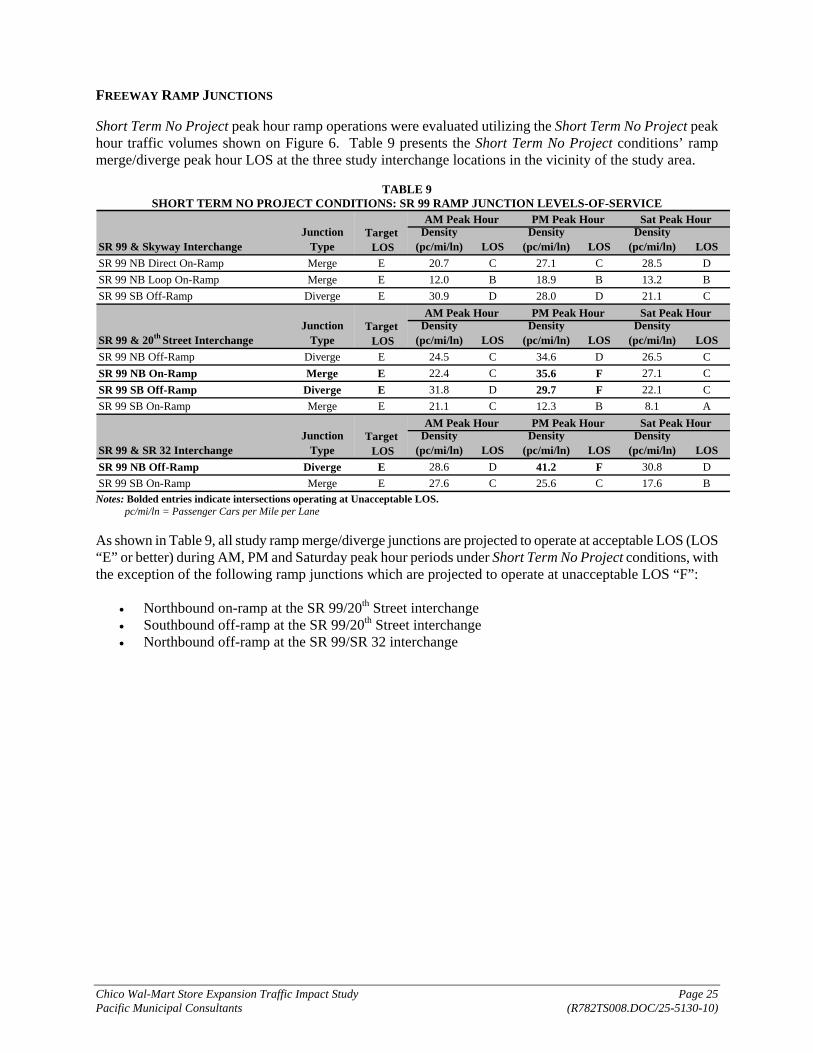
Chico Wal-Mart Store Expansion Traffic Impact Study Page 25 Pacific Municipal Consultants (R782TS008.DOC/25-5130-10)
FREEWAY RAMP JUNCTIONS Short Term No Project peak hour ramp operations were evaluated utilizing the Short Term No Project peak hour traffic volumes shown on Figure 6. Table 9 presents the Short Term No Project conditions’ ramp merge/diverge peak hour LOS at the three study interchange locations in the vicinity of the study area.
TABLE 9
SHORT TERM NO PROJECT CONDITIONS: SR 99 RAMP JUNCTION LEVELS-OF-SERVICE
SR 99 & Skyway InterchangeJunction
TypeDensity
(pc/mi/ln) LOSDensity
(pc/mi/ln) LOSDensity
(pc/mi/ln) LOSSR 99 NB Direct On-Ramp Merge E 20.7 C 27.1 C 28.5 DSR 99 NB Loop On-Ramp Merge E 12.0 B 18.9 B 13.2 BSR 99 SB Off-Ramp Diverge E 30.9 D 28.0 D 21.1 C
SR 99 & 20th Street InterchangeJunction
TypeDensity
(pc/mi/ln) LOSDensity
(pc/mi/ln) LOSDensity
(pc/mi/ln) LOSSR 99 NB Off-Ramp Diverge E 24.5 C 34.6 D 26.5 CSR 99 NB On-Ramp Merge E 22.4 C 35.6 F 27.1 CSR 99 SB Off-Ramp Diverge E 31.8 D 29.7 F 22.1 CSR 99 SB On-Ramp Merge E 21.1 C 12.3 B 8.1 A
SR 99 & SR 32 InterchangeJunction
TypeDensity
(pc/mi/ln) LOSDensity
(pc/mi/ln) LOSDensity
(pc/mi/ln) LOSSR 99 NB Off-Ramp Diverge E 28.6 D 41.2 F 30.8 DSR 99 SB On-Ramp Merge E 27.6 C 25.6 C 17.6 B
Sat Peak HourTarget LOS
AM Peak Hour PM Peak Hour
Target LOS
AM Peak Hour
Target LOS
AM Peak Hour PM Peak Hour Sat Peak Hour
PM Peak Hour Sat Peak Hour
Notes: Bolded entries indicate intersections operating at Unacceptable LOS. pc/mi/ln = Passenger Cars per Mile per Lane As shown in Table 9, all study ramp merge/diverge junctions are projected to operate at acceptable LOS (LOS “E” or better) during AM, PM and Saturday peak hour periods under Short Term No Project conditions, with the exception of the following ramp junctions which are projected to operate at unacceptable LOS “F”:
• Northbound on-ramp at the SR 99/20th Street interchange • Southbound off-ramp at the SR 99/20th Street interchange • Northbound off-ramp at the SR 99/SR 32 interchange

Chico Wal-Mart Store Expansion Traffic Impact Study Page 26 Pacific Municipal Consultants (R782TS008.DOC/25-5130-10)
PROPOSED PROJECT This section describes the proposed project and methodologies used to quantify the project trips added to area transportation facilities. PROJECT DESCRIPTION The proposed project, which is depicted in the project site plan in Figure 8, is located at 2044 Forest Avenue in the southeastern portion of the City of Chico in Butte County. The project site comprises 27.08 acres and is bounded to the north by Baney Lane, to the east by Forest Avenue, to the south by Wittmeier Drive, and to the west by office-commercial development fronting State Route 99. The site is currently designated as “Community Commercial and Service Commercial” within the City of Chico General Plan, and is currently zoned as Community Commercial. The project site consists of three parcels. Two of the parcels (APN 002-370-055 and 002-370-057) comprise 16.46 acres and currently contain an existing 125,889 sq. ft. Wal-Mart retail store and an adjacent parking lot containing 630 parking spaces. The third parcel (APN 002-170-004) is 10.62 acres and consists of undeveloped land located adjacent to and south of the existing Wal-Mart store. The existing Wal-Mart store is currently accessed via three Baney Lane driveways, a Forest Avenue driveway, and a Business Lane driveway, which leads into the rear private alley. The proposed project would provide for construction of an additional 97,556 sq. ft. to the south side of the existing 125,889 sq. ft. Wal-Mart store to create a 223,445 sq. ft. Wal-Mart Supercenter. Approximately 60,000 sq. ft. of the expansion would be used for a grocery sales area. The remaining square footage would be used for storage and general merchandise sales. The parking lot would be expanded to the south of the existing lot adding 431 parking spaces, which would bring the total number of parking spaces on the project site to 1,061. Also, although not officially a part of the project, the traffic analysis also considers the impacts associated with development of the 2.42 acre out parcel located within the extreme southeastern portion of the project site immediately northwest of the intersection of Forest Avenue/Wittmeier Drive. At present, there are no plans for development of this out parcel. For purposes of this study, based on information provided by the project proponent, this out parcel is assumed to be developed with a gas station (with 12 fueling stations) and a 5,000 sq. ft. fast food restaurant with drive through. Thus, for purposes of this traffic analysis, the term “project” (as used in this report) will refer to the development of the entire 10.62 acre site including the new Wal-Mart Supercenter, gas station, and fast food restaurant. Although it is recognized that the expansion (and associated improvements) will likely be completed prior to development of the gas station and fast food restaurant, for purposes of this traffic study, it will be assumed that the site will be fully developed will all three land uses. PROJECT TRIP GENERATION Table 10 provides a summary of trip generation characteristics for the proposed project. Typically, project site trip generation is estimated utilizing trip generation rates contained in the Institute of Transportation Engineers (ITE) Publication Trip Generation (Seventh Edition). At the time this study commenced (2004/2005), the industry standard for estimating trip generation, was utilizing the rates contained in the ITE Publication Trip Generation (Seventh Edition). Subsequent to that, the Eight Edition of the ITE Trip Generation was published (2008). On comparison of the rates for the proposed Wal-Mart Supercenter (use code 815) within the ITE Trip Generation Publication (Eight Edition) to the rates utilized within the study, it was found that the rates utilized within the study were higher and therefore, would provide for a conservative analysis. When compared with the ITE Publication Trip Generation (Seventh Edition), trip rates within the ITE Trip Generation Publication (Eight Edition) for the Gas Station (use code 944) were greater for AM and PM peak hours; and for the Fast Food Restaurant with Drive Through (use code 934) were greater for the Saturday peak hour. However, the increase in trip rates was found to be less than 1% and therefore, would not


Chico Wal-Mart Store Expansion Traffic Impact Study Page 28 Pacific Municipal Consultants (R782TS008.DOC/25-5130-10)
change the results/outcome of this analysis. Therefore, use of ITE Publication Trip Generation (Seventh Edition) was considered appropriate for this study. However, traffic counts conducted at the existing Wal-Mart store indicate that the actual trip generation rates and volumes are significantly higher than those estimated by the ITE Trip Generation Manual using the existing store square footage and ITE rates for a “Free Standing Discount Store” (land use 815). Thus, given this existing characteristic, it is also assumed that trip rates for the proposed Wal-Mart Supercenter would also be higher than ITE trip rates for a comparable “Free Standing Discount Superstore”. For this reason, it was necessary to establish an alternative methodology to estimate trip generation rates for the proposed Wal-Mart store. Details of this methodology, which was approved by City of Chico staff, is provided in an appendix at the end of the report. As shown in Table 10, within the “‘Unadjusted Project Trip Generation” portion of the table, it is estimated that the proposed project site will generate a total of 552 AM peak hour trips, 1,160 PM peak hour trips and 1,399 trips during the Saturday peak hour. However, these total unadjusted project trips do not take into account existing trips which are already generated by the existing Wal-Mart, nor internal trips, diverted trips, or pass-by trips which would be associated with the proposed project. Existing Wal-Mart trips, as well as internal, diverted, and pass-by trips, will reduce the number of “new” trips which will be distributed to the study intersections and roadways. Each of these trip types are described in further detail below. Existing Wal-Mart Trips The existing Wal-Mart store currently generates and distributes trips to study intersections and roadways, which need to be taken into consideration in determining proposed project trips. The proposed, expanded Wal-Mart Supercenter will result in higher trip generation than the existing facility. Vehicle trips currently generated by the existing store should be backed out of the trip generation calculated for the proposed Wal-Mart Supercenter since they already exist within local traffic volumes, and failure to back them out would result in the double counting of trips. As Table 10 shows within the “Existing Wal-Mart Trip Generation” portion of the table, the existing Wal-Mart store generates a total of 314 AM peak hour trips, 844 PM peak hour trips and 1,116 trips during the Saturday peak hour. These peak hour trips were established from the driveway counts conducted by OMNI-MEANS in April 2005. The inbound vs. outbound splits for AM and PM peak hour traffic for the existing Wal-Mart store are different than those established for the proposed Wal-Mart Supercenter. This difference is to be expected since the two versions of the store experience different trip generation characteristics, due largely to the presence of the grocery store. As shown in Table 10, after deducting trips which are generated by the existing Wal-Mart facility, the proposed Wal-Mart Expansion project is projected to generate 238 “net new” unadjusted Wal-Mart AM peak hour trips, 316 “net new” unadjusted Wal-Mart PM peak hour trips and 283 “net new” unadjusted Wal-Mart trips during the Saturday peak hour period.
TABLE 10 PROJECT TRIP GENERATION
Land Use Category AM Pk Hr Trip Rate PM Pk Hr Trip Rate SAT Pk Hr Trip Rate(ITE Code) Total In % O ut % Total In % O ut % Total In % O ut %PROPOSED WALMART SUPERSTOREFree-Standing Discount Superstore 1 2.47 51% 49% 5.19 49% 51% 6.26 51% 49%Gas Station (944)2 12.07 50% 50% 13.86 50% 50% 19.24 50% 50%Fast Food Restaurant w/ Drive-Through (934)2 53.11 51% 49% 34.64 52% 48% 59.2 51% 49%Notes: ksf = 1,000 square feet, f.s. = fueling station1) Trip generation rates equations derived based on the actual field data for Wal-Mart Superstore (See Text).
Rate Unit
per ksfper f.s.per ksf
2) Trip generation volumes estimated using the trip rate equations presented in the ITE Trip Generation (7th Edition) for individual use quantities.

Chico Wal-Mart Store Expansion Traffic Impact Study Page 29 Pacific Municipal Consultants (R782TS008.DOC/25-5130-10)
TABLE 10 – PROJECT TRIP GENERATION CONTINUED
AM Pk Hr Trips PM Pk Hr Trips SAT Pk Hr TripsTotal In Out Total In Out Total In Out
EXISTING WALMART TRIPS 125.889 ksf 314 185 129 844 425 419 1,116 594 5223) Existing Wal-Mart Trips based on actual counts conducted at the Wal-Mart driveways.
Land Use Category AM Pk Hr Trip Rate1 PM Pk Hr Trip Rate1 SAT Pk Hr Trip Rate1
(ITE Code) Total In % Out % Total In % Out % Total In % Out %PROPOSED WALMART SUPERSTOREFree-Standing Discount Superstore 2.47 51% 49% 5.19 49% 51% 6.26 51% 49%
AM Pk Hr Trips PM Pk Hr Trips SAT Pk Hr TripsLand Use Description Total In Out Total In Out Total In OutPROPOSED WALMART SUPERSTORE 223.445 ksf 552 282 270 1,160 568 592 1,399 713 686"UNADJUSTED" WAL-MART TRIPS 552 282 270 1,160 568 592 1,399 713 686NET NEW "UNADJUSTED" WAL-MART TRIPS 238 97 141 316 143 173 283 119 1644) Net New "Unadjusted" Trips are derived by subtracting the existing Wal-Mart Trips from the "Unadjusted" Wal-Mart Trips.
AM Peak Hour Trips PM Peak Hour Trips SAT Pk Hr TripsLand Use Description Total In Out Total In Out Total In OutPROPOSED WALMART SUPERSTORE 223.445 ksf 238 97 141 316 143 173 283 119 164Gas Station 12 f.s. 145 73 72 166 83 83 231 116 115Fast Food Restaurant w/ Drive-Through 5 ksf 266 136 130 173 90 83 296 151 145
649 306 343 655 316 339 810 386 424Note: Net New "Unadjusted" External Trips include both Diverted/Pass-By Trips and Internal trips.
AM Peak Hour Trips PM Peak Hour Trips SAT Pk Hr TripsLand Use Description Total In Out Total In Out Total In OutPROPOSED WALMART SUPERSTORE 24 10 14 32 14 18 28 12 16Gas Station 14 7 7 16 8 8 23 12 11Fast Food Restaurant w/ Drive-Through 27 14 13 17 9 8 30 15 15
65 31 34 65 31 34 81 39 425) Internal Trips calculated based on methodlogies outlind within the ITE Trip Generation Handbook (October 1998).
AM Peak Hour Trips PM Peak Hour Trips SAT Pk Hr TripsTotal In Out Total In Out Total In Out214 87 127 284 129 155 255 107 148131 66 65 150 75 75 208 104 104239 122 117 156 81 75 266 136 130584 275 309 590 285 305 729 347 382
Note: Unadjusted External Trips includes Diverted Trips
AM Peak Hour Trips PM Peak Hour Trips SAT Pk Hr TripsLand Use Description AM,PM SAT Total In Out Total In Out Total In OutPROPOSED WALMART SUPERSTORE6,7 46.4% 45.8% 99 40 59 132 60 72 117 49 68Gas Station7 42% 42% 55 28 27 63 32 31 87 44 43Fast Food Restaurant w/ Drive-Through7 49% 49% 117 67 50 76 44 32 130 74 56
271 135 136 271 136 135 334 167 167
7) Diverted/Pass-By Trip percentages established based on multiple ITE sources (see text).
AM Peak Hour Trips PM Peak Hour Trips SAT Pk Hr TripsLand Use Description Total In Out Total In Out Total In Out
PROPOSED WALMART SUPERSTORE 115 47 68 152 69 83 138 58 80Gas Station 76 38 38 87 43 44 121 60 61Fast Food Restaurant w/ Drive-Through 122 55 67 80 37 43 136 62 74"NET NEW" PROPOSED PROJECT TRIPS 313 140 173 319 149 170 395 180 215
Quantity
Net New "Unadjusted" Project Trip Generation (with Diverted/Pass-By and Internal Trips)
per ksf
Existing Wal-Mart Trip Generation3
"Unadjusted" Proposed Wal-Mart Trip Generation4
Land Use Description
Diverted/PassBy Trip %
Diverted/Pass-By Trips
Quantity
TOTAL "UNADJUSTED" PROPOSED PROJECT EXTERNAL TRIPS
8) "Net New" Trips exclude Diverted/Pass-By Trips, Internal Trips,and existing WalMart trips within proposed project. Plus project scenarios were analyzed by adding diverted/pass-by trips to the "Net New" trips at all applicable intersections and the project driveways.
TOTAL NET NEW "UNADJUSTED" PROPOSED PROJECT TRIPS
Rate Unit
Quantity
TOTAL PROPOSED PROJECT Diverted/Pass-By TRIPS
Net New Proposed Project Trip Generation8
AM,PM and SAT10%10%10%
6) Diverted/Pass-By Trip percentage for the Superstore established based on information provided by the city staff and verified with data available from ITE.
PROPOSED WALMART SUPERSTOREGas StationFast Food Restaurant w/ Drive-Through
Internal Trip Reduction5
Internal Trip Reduction %
TOTAL PROPOSED PROJECT Diverted/Pass-By TRIPS
"Unadjusted" External Trip Generation (with Diverted Trips)

Chico Wal-Mart Store Expansion Traffic Impact Study Page 30 Pacific Municipal Consultants (R782TS008.DOC/25-5130-10)
Internal Trip Reductions As noted previously, this traffic analysis considers development of the entire 10.62 acre site including the new Wal-Mart Supercenter, gas station, and fast food restaurant. Since the proposed project is a mixed use development with complimentary land uses, it is expected that some vehicles visiting one of the three different sections of the project site (Wal-Mart Supercenter, gas station, and fast food restaurant) will also be visiting one (or both) of the other land uses. For example, a vehicle leaving the Wal-Mart store may very well stop at the gas station, and/or the fast food restaurant before leaving the project site. Additionally, some vehicles drawn to the site to stop at the gas station will also decide to stop at the fast food restaurant (or vice versa), or perhaps the Wal-Mart store. When a vehicle visits a project site, it is typically calculated as two trips to account for the inbound and outbound component of the round trip. However, if this same vehicle also visited one (or both) of the other two land uses, it would result in four (or six) trips when taking into account the inbound and outbound component to and from each land use. Given the proximity of the proposed land uses to each other, some of these trips might not even occur using a vehicle but rather could be accomplished on foot after parking. Since the primary objective of the traffic study is to analyze impacts to the adjacent roadway system, it is reasonable to reduce raw trip generation volumes to account for only the inbound vehicular trip entering the project site, and the outbound vehicular trip exiting the project site, and neglecting these other internal trips between land uses. Internal trip characteristics were established based on information and methodologies outlined within the Institute of Transportation Engineers (ITE) Trip Generation Handbook (October 1998) from which internal trip reduction factors for each of the three land uses, and for each analysis period (daily, AM peak hour, PM peak hour), were established. It was observed that the Wal-Mart superstore would capture 21% and 10% internal trips during the AM and PM peak hour periods, respectively. The gas station would capture 50% and 51% trips during the AM and PM peak hour periods, respectively. The fast food restaurant would capture 19% and 29% trips during the AM and PM peak hour periods, respectively. Similar results are also anticipated for the Saturday peak hour period. As shown in Table 10, only a 10% reduction in internal trips (based on PM peak hour for Wal-Mart) was applied within the analysis to provide for a conservative analysis, while still providing minimal credit for some internal capture. Pass-by Trips and Diverted Trips Not all of the traffic generated by either the existing Wal-Mart or the proposed project are newly generated trips, but rather are trips which will exist with or without the project, and which will be drawn to the project for a variety of reasons. Pass-by and diverted trips are drawn to the existing site, and are accounted for within trip generation calculations for the project site. It is expected that pass-by trips and diverted trips (which are both defined in detail below) are drawn to the existing site, and will be drawn to the proposed project site, from traffic volumes along: (1) Forest Avenue, (2) SR 99, (3) 20th Street, (4) Skyway. Pass-by trips are defined as trips which would occur on the roadway immediately adjacent to the project with or without the project, which are drawn to the site as a matter of convenience. Within this analysis, pass-by trips are defined as those trips drawn to the project site which would be traveling along Forest Avenue. Since pass-by trips would exist along the adjacent roadway with or without the project, they would not add any trips to any intersections or roadways. However, through movements at the project driveways would change to left and right-turn movements at the project driveway intersections, or other intersections such as Forest Avenue/Baney Lane which channel traffic to other project driveways. Diverted trips are similar in nature to pass-by trips. Whereas a pass-by trip is captured from existing traffic traveling along the roadway adjacent to the project, a diverted trip is captured from existing traffic along a nearby roadway. To arrive at the site, it is necessary for a diverted trip to go somewhat “out of its way”, and thus will add trips to selected roadways and intersections in the vicinity of the project. After leaving the site, the trip will eventually return to the course of travel it would have been on with or without the project. Since the trip is an existing trip which is already accounted for, trips are altered or added only to roadway and intersection volumes which correspond to the diverted portion of the travel route.

Chico Wal-Mart Store Expansion Traffic Impact Study Page 31 Pacific Municipal Consultants (R782TS008.DOC/25-5130-10)
Within this analysis, it is assumed that trips will be diverted to the project site from the following nearby roadways: (1) SR 99 (2) 20th Street, and (3) Skyway. Diverted/Pass-By trip percentages for the proposed Wal-Mart store were provided by the City and verified with the following three reference sources:
• Trip Generation Handbook, Institute of Transportation Engineers (ITE), October 1998 • A Study of Pass-by Trips Associated with Retail Development, ITE Journal, March 1991 • Trip Generation Characteristics of Shopping Centers, ITE Journal, June 1996
Diverted trips percentage for the fast food restaurant type of land use was established following a review of the ITE Trip Generation Handbook. It is assumed that the gas station would draw only pass-by trips along Forest Avenue, and not any diverted trips. Thus, a pass-by trip reduction was applied for this land use. As Table 10 shows within the “Diverted/Pass-By Trips” portion of the table, of the trips generated by the proposed project, it is assumed that 271 AM peak hour trips, 271 PM peak hour trips and 334 Saturday peak hour trips would be either diverted/pass-by trips which already exist along area roadways. “Net New” Project Trips As shown in Table 10, after deducting diverted trips, internal trips, and trips which are generated by the existing Wal-Mart facility, the proposed Wal-Mart Expansion project (including the gas station/fast food restaurant) is projected to generate 313 “net new” AM peak hour trips, 319 “net new” PM peak hour trips and 395 “net new” trips during the Saturday peak hour period. PROJECT TRIP DISTRIBUTION AND ASSIGNMENT Because of the different nature of the land uses within the proposed project, trip distribution for the Wal-Mart store was analyzed separately from the trip distribution for the gas station and fast food restaurant. The directional trip distribution and assignment for the Wal-Mart superstore was provided by City staff and was appropriately modified to reflect existing and projected future traffic flows and travel patterns within the vicinity of the project site. Due consideration was also given for the location of other similar facilities, and the location of local and regional housing and employment/commercial centers in relation to the proposed project site when deriving the trip distribution and assignment patterns for the Wal-Mart superstore. The directional trip distribution and assignment of the gas station/fast food restaurant was estimated based on the location of other similar facilities, and the location of local and regional housing and employment/commercial centers in relation to the proposed project site. Figure 9a shows the trip distribution for the Wal-Mart superstore and Figure 9b depicts the trip distribution for the gas station/fast food restaurant. Figure 10 shows the resulting project trips along the study roadways and along effected turning movements at study intersections, assuming the trip generation, trip distribution, and trip assignment patterns described above.


Chico Wal-Mart Store Expansion Traffic Impact Study Page 35 Pacific Municipal Consultants (R782TS008.DOC/25-5130-10)
PROJECT SITE ACCESS The project would utilize all of the existing driveways on Baney Lane, Business Lane, and Forest Avenue, as well as two new additional driveways to the south onto Wittmeier Drive as part of the expansion. At present, all of the access points are full access intersections permitting left-turns in and out of the project site, with the exception of the Forest Avenue driveway, which is a right-in/right-out driveway. The main project access to the existing Wal-Mart store is currently provided via the signalized intersection of Forest Avenue/Baney Lane, with traffic traveling to/from the existing Wal-Mart driveways via Baney Lane. More detailed descriptions of all of the proposed project driveways, with changes and modifications pertaining to circulation patterns following the expansion, are provided below:
• As will be discussed under the recommendations and mitigation section of the report, it is assumed that vehicular movements along the back alley to/from the Baney Lane/Business Lane intersection be restricted to southbound through movements. Whereas traffic from the existing Wal-Mart store can currently exit out via the back alley and Business Lane, it is recommended (and assumed within the analysis) that appropriate signage be provided to prohibit northbound movements along the back alley to minimize project traffic exiting onto Business Lane. The primary truck route for the store is via the Baney Lane/Business Lane intersection with trucks continuing south along the back alley to access the truck bays located near the southwestern portion of the store. When departing from the store, it is assumed the trucks will exit primarily via Wittmeier Drive, although departure would be possible via the alley.
• Traveling east along Baney Lane from Business Lane, the Baney Lane/Wal-Mart West Driveway is
located approximately 100 ft. east of Business Lane.
Note: A review of the proposed project site plan shows that there is adequate internal circulation to allow vehicles to access the westernmost driveway from the main parking lot. Given that this driveway is located away from the main parking area, and thus experiences minimal traffic volumes, the net effect is that while some opportunity is provided to make an outbound left turn toward Business Lane, the actual number of left turns will be minimal, and negligible for purposes of this traffic study.
• The Baney Lane/Wal-Mart Central Driveway is located approximately 480 ft. east of Business Lane,
and approximately 700 ft. west of Forest Avenue. The proposed project site plan (Figure 8) calls for the construction of a raised channelization island to physically prohibit outbound left turns at this driveway, proposed to address both restricted sight distance to the east and to encourage traffic to utilize the Forest Avenue access rather than the Business Lane to Toys R Us private street route. This restriction is recommended, and assumed within the traffic analysis, and existing outbound left-turns from the Wal-Mart at this driveway have been appropriately reassigned onto the network.
• The “new” Baney Lane/Wal-Mart East Driveway is located approximately 450 ft. west of Forest
Avenue and approximately 150ft. west of the existing driveway as depicted within the June 6, 2007 site plan, PacLand. The proposed project site plan (Figure 8) calls for the construction of a raised channelization island to physically prohibit outbound left turns at this driveway. This restriction is recommended, and assumed within the traffic analysis, and existing outbound left-turns from the Wal-Mart at this driveway have been appropriately reassigned onto the network.
• As with the existing store, the Forest Avenue driveway would provide right-in/right-out access to the
project site.

Chico Wal-Mart Store Expansion Traffic Impact Study Page 36 Pacific Municipal Consultants (R782TS008.DOC/25-5130-10)
• The Wittmeier Drive/Forest Avenue intersection would provide full access to the project site via two new driveways located along Wittmeier Drive.
• The Wittmeier Drive/Forest Avenue intersection (via a new driveway located along Wittmeier Drive)
and the Forest Avenue driveway will provide access to the 2.42 acre out parcel.
PROJECT ON-SITE CIRCULATION As the site plan shows, a major component of the on-site circulation system consists of one-way drive aisles located to the east of the proposed store striped for diagonal parking. As noted within the Project Site Access section, Business Lane and Wittmeier Drive will provide access to the truck docking facilities located along the rear of the store. The overall layout of the site provides satisfactory vehicle circulation throughout the project site. The project site plan also provides for a pedestrian system of sidewalks and crosswalks which will channel pedestrians arriving from the new sidewalk/crosswalk system along Forest Avenue to the new store. PROJECT TRUCK TRAFFIC The existing Wal-Mart store currently averages 61 deliveries per week, 31 of which are large 18-wheelers. It is anticipated that the proposed Wal-Mart Supercenter will have an average of 85 deliveries per week, 24 more than the existing store. Of these, it is anticipated that 39 will be large 18-wheelers, which is 8 more than the existing store. As described above, a review of the project site plan shows that the overall layout of the site provides satisfactory truck access and circulation throughout the majority of the site. The existing truck route/fire lane behind the existing store would remain, but it would be extended. A truck turnaround approximately 130 feet in diameter would be designated at the end of the truck route extension, in the southwestern portion of the project site. Currently, trucks entering the store use Baney Lane/Business Lane, with trucks continuing south along the back alley to access the truck bays located near the southwestern portion of the store. When departing from the store, trucks exit via the alley onto Baney Lane or via the internal roadway to the Forest Avenue driveway. For the proposed expansion, the primary truck route for the store is anticipated to be via the Baney Lane/Business Lane intersection with trucks continuing south along the back alley to access the truck bays located near the southwestern portion of the store. When departing from the store, it is assumed that the trucks will exit primarily via Wittmeier Drive, although departure would be possible via the alley.

Chico Wal-Mart Store Expansion Traffic Impact Study Page 37 Pacific Municipal Consultants (R782TS008.DOC/25-5130-10)
PROJECT ROADWAY IMPROVEMENTS The project circulation improvements that will be in place following the expansion are provided below.
• The redesigned intersection of Forest Avenue/Wittmeier Drive/Talbert Drive will be signalized and improved to contain the following lane geometrics:
The northbound Forest Avenue approach will provide a through lane, combined through-right lane and a lengthened exclusive left-turn lane.
The southbound Forest Avenue approach will provide a through lane, combined through-right lane and a lengthened exclusive left-turn lane.
The Wittmeier Drive leg of the Forest Avenue/Wittmeier Drive/Talbert Drive intersection is approximately 40 feet wide with parking activity on both sides. The cul-de-sac is approximately 425 feet in length before the bulb, with driveways providing access to the south occurring approximately 150 feet west of the intersection. The eastbound Wittmeier Drive approach will be improved to provide a left-turn lane, combined left-through lane and a right turn lane for the following reasons:
o The queue will rarely extend past the southern driveways, so will result in fewer conflicts.
o The dual left-turn lanes and LOS D conditions for the left-turn are acceptable and will help in reducing demand at the Baney Lane eastbound left-turn movement at Forest Avenue, which will in turn reduce pressure on the 20th Street/Toys R Us intersection.
To accommodate this improvement, the road cross-section will be widened from 40 feet to 64 feet to accommodate 4, 12-foot lanes (three eastbound and one westbound lane) and 2, 8-foot parking shoulders.
The westbound Talbert Drive approach would provide a left and a combined through-right lane.
• The existing traffic signal at the intersection of Forest Avenue/Baney Lane will be modified as
follows: The eastbound Baney Avenue approach will include dual 150 foot eastbound left-turn lanes
approaching Forest Avenue, with approximately 50 feet leading to the dual left-turn lanes and a combined through-right lane.
The northbound Forest Avenue approach will provide a through lane, combined through-right lane and a lengthened exclusive left-turn lane.

Chico Wal-Mart Store Expansion Traffic Impact Study Page 38 Pacific Municipal Consultants (R782TS008.DOC/25-5130-10)
SHORT TERM PLUS PROJECT TRAFFIC OPERATIONS The Short Term Plus Project condition is the analysis scenario in which traffic impacts associated with the proposed project (i.e., the Chico Wal-Mart Store Expansion) are investigated in comparison to the Short Term No Project condition scenario. INTERSECTIONS Short Term Plus Project conditions were simulated by superimposing traffic generated by the proposed project onto Short Term No Project intersection traffic volumes. The resulting Short Term Plus Project traffic volumes are illustrated on Figure 11. Short Term Plus Project peak hour intersection traffic operations were quantified utilizing the Short Term Plus Project peak hour intersection traffic volumes. Table 11A contains a summary of the resulting Short Term Plus Project intersection levels of service for the City maintained intersections.
TABLE 11A
SHORT TERM (YEAR 2010) PLUS PROJECT CITY INTERSECTIONS LEVELS-OF-SERVICE
# Delay LOSWarrant
Met?2 Delay LOSWarrant
Met?2 Delay LOSWarrant
Met?2
1 E 20th St./Whitman Avenue
Signal D 14.3 B - 23.7 C - 30.9 C -
2 E 20th St./ SB SR-99 Ramps
Signal D 22.3 C - 32.7 C - 30.8 C -
3 E 20th St./NB SR-99 Ramps
Signal D 13.6 B - 54.8 D - 23.4 C -
4 E 20th St./Business Lane
TWSC D 9.7 A No 11.5 B No 11.1 B No
5 E 20th St./Chico Mall Access
Signal D 13.5 B - 36.6 D - 60.7 E -
6 E 20th St./Forest Ave
Signal D 27.2 C - 33.5 C - 35.4 D -
12 Forest Ave/ Baney Lane/Pkwy Village Dr.
Signal D 24.4 C - 27.6 C - 29.8 C -
13 Forest Ave/Wal Mart Dwy
TWSC D 11.3 B No 13.2 B No 12.8 B No
14 Forest Ave/Talbert-Whittmeier Dr.
Signal D 28.8 C - 29.8 C - 33.0 C -
15 Forest Ave/Notre Dame Blvd.
Signal D 18.1 B - 15.4 B - 11.6 B -
16 E.Park Ave/Whitman Ave
Signal D 8.5 A - 23.7 C - 22.1 C -
17 E.Park Ave/Skyway/SB SR-99 Ramps
Signal D 19.1 B - 21.8 C - 10.5 B -
18 E.Park Ave/Skyway/NB SR-99 Ramps
Signal D 10.9 B - 12.6 B - 11.8 B -
19 Skyway/Notre Dame Blvd
Signal D 23.7 C - 33.2 C - 32.3 C -
Notes: Bolded entries indicate intersections operating at Unacceptable LOS.
IntersectionControl Type1
Sat Peak Hour
Target LOS
AM Peak Hour PM Peak Hour
2) Warrant = Caltrans Peak hour volume based signal warrant1) TWSC = Two Way Stop Control (LOS and delay are based on LOS and delay for worst approach)
LOS conditions do not apply to intersections 7 through 11 which are private intersections. Significance is discussed within the Recommendations/Mitigations section of the report.


Chico Wal-Mart Store Expansion Traffic Impact Study Page 40 Pacific Municipal Consultants (R782TS008.DOC/25-5130-10)
Whereas the intersection of Forest Avenue/Talbert-Wittmeier Drive was found to be operating unacceptably at LOS “F” under Short Term No Project conditions during the PM and Saturday peak periods, with the plus project roadway improvements in place, the intersection is projected to operate at LOS “C” during all three study peak periods. Based on a comparison of “no project” vs. “plus project” intersection levels of service as presented in Table 7 and Table 11A, respectively, the E. 20th Street/Chico Mall Access intersection which was found to operate unacceptably for Short Term No Project Saturday peak hour conditions will experience an increase in delay for “plus project” conditions as shown in Table 11B.
TABLE 11B SHORT TERM (YEAR 2010) CITY INTERSECTIONS SIGNIFICANT IMPACT CRITERIA
#
Delay Increase
(DI)SIGNIFICANT?
(DI > 5.0 Sec)
5 E 20th St./Chico Mall Access
Signal D 60.7 E 56.5 E 4.2 No
Sat Peak Hour
2010 Plus Prj. Delay/LOS
2010 No Prj. Delay/LOSIntersection
Control Type1
Target LOS
At the E 20th Street/Chico Mall Access intersection, the project is anticipated to increase the delay by 4.2 seconds to Short Term No Project Saturday peak hour conditions. Significant impact discussion and mitigation is discussed within the Mitigations/Recommendations section of the report. PRIVATE INTERSECTIONS Business Lane/ToysRUs Access –Based on the traffic projections used in the anlaysis, the intersection would be expected to experience an increase in delay and queuing on the westbound approach in the ToysRUs parking lot. The introduction of a traffic signal would not be appropriate given that it is only 150 feet from the Business Lane intersection with East 20th Street. If the intersection were to remain unsignalized, it is anticipated that drivers familiar with the area would seek alternative ingress and egress routes if undesirable queues are observed. Given the intersection design, anticipated turning movements, stop controlled westbound approach, sight distance adequacy, slower traffic movements and past safety history, it is not anticipated that vehicle conflict/safety impacts will arise at this location with added traffic generated by the project and adjacent development. Therefore, this intersection is expected to operate acceptably. Baney Lane/Wal-Mart Driveways –Future development on the north side of the street will introduce additional driveways. Analysis of circulation and safety issues along Baney Lane are influenced by the traffic volumes, number of driveways, horizontal curve in the center section of the street and proximity to the signalized intersection with Forest Avenue. Placement of driveways including the relocation and left-turn restriction to the Walmart easternmost driveway (discussed earlier) were recommended to avoid conflicts with eastbound vehicles queuing at the Forest Avenue traffic signal. Outbound left-turn restrictions at this driveway (intersection 11) along with the central driveway (intersection 10) was recommended to force outbound traffic to utilize Forest Avenue. (Since Business Lane is a private street and has no westbound access to East 20th Street, the City has established a need to channelize traffic towards Forest Avenue.) The project will increase left-turning movements off of Baney Lane. These volumes combined with the existing turning movements, proximity to the Forest Avenue intersection as well as future driveways to the north side of Baney Lane, warrant a separate turn lane to minimize potential vehicle conflicts at the easternmost and central driveway locations (intersections 11 and 10). Therefore, because of the left-turn lane warrants and need to avoid conflicts with other driveways to the north and eastbound queuing at the Forest Avenue traffic signal, a westbound left-turn lane is recommended to serve the easternmost driveway (intersection 11) and a center two-way left-turn lane is recommended to extend from the easternmost driveway to the central driveway (intersection 10). A separate turn lane is not warranted west of the central driveway since left-turn movements out of the Walmart onto Baney Lane at the central driveway are prohibited. Traffic volumes

Chico Wal-Mart Store Expansion Traffic Impact Study Page 41 Pacific Municipal Consultants (R782TS008.DOC/25-5130-10)
between the central driveway and Business Lane do not meet minimum volume warrants for left-turn lanes. The site plan includes these recommendations., therefore, the project as proposed would result in acceptable conditions on Baney Lane. Business Lane/Baney Lane –The intersection would be expected to experience an increase in delay and queuing in the westbound direction. During peak hours, the westbound queue would be expected to extend to the westernmost WalMart driveway (intersection 9). However, given the lower traffic volumes and lower speeds, a separate left-turn lane is not warranted. Given the adequate sight distance, appropriate existing intersection design and traffic control, the intersection is expected to operate acceptably. FREEWAY MAINLINE SEGMENTS Short Term Plus Project peak hour mainline operations were evaluated utilizing the peak hour traffic volumes shown on Figure 12. Table 12 summarizes Short Term Plus Project conditions’ SR 99 freeway mainline operations at the two interchange locations in the vicinity of the study area.
TABLE 12
SHORT TERM PLUS PROJECT CONDITIONS: SR 99 MAINLINE LEVELS-OF-SERVICE
Freeway Mainline Segment
No. Lanes Volume
Density, (pc/mi/ln) LOS Volume
Density, (pc/mi/ln) LOS Volume
Density, (pc/mi/ln) LOS
SR 99 NB, north of Skyway I/C 2 E 2,256 20.2 C 3,263 30.3 D 2,455 22.0 C
SR 99 SB, north of Skyway I/C 2 E 2,897 26.2 C 2,613 23.5 C 1,926 17.3 B
SR 99 NB, north of 20th Street I/C
2 E 2,705 24.3 C 3,964 43.2 E 2,929 26.5 D
SR 99 SB, north of 20th
Street I/C2 E 3,018 27.4 D 2,831 26.5 C 2,084 18.7 C
Target LOS
Sat Peak HourAM Peak Hour PM Peak Hour
Notes: pc/mi/ln = Passenger Cars per Mile per Lane As shown in Table 12, all four mainline segments are projected to operate at acceptable LOS (LOS “E” or better) during AM, PM and Saturday peak hour periods under Short Term Plus Project conditions. FREEWAY RAMP JUNCTIONS Short Term Plus Project peak hour ramp operations were evaluated utilizing the peak hour traffic volumes shown on Figure 12. Table 13A presents the Short Term Plus Project conditions’ ramp merge/diverge peak hour LOS at the three study interchange locations in the vicinity of the study area.


Chico Wal-Mart Store Expansion Traffic Impact Study Page 43 Pacific Municipal Consultants (R782TS008.DOC/25-5130-10)
TABLE 13A SHORT TERM PLUS PROJECT CONDITIONS: SR 99 RAMP JUNCTION LEVELS-OF-SERVICE
SR 99 & Skyway InterchangeJunction
TypeDensity
(pc/mi/ln) LOSDensity
(pc/mi/ln) LOSDensity
(pc/mi/ln) LOSSR 99 NB Direct On-Ramp Merge E 20.7 C 27.1 C 19.4 BSR 99 NB Loop On-Ramp Merge E 12.0 B 18.9 B 13.2 BSR 99 SB Off-Ramp Diverge E 30.9 D 28.0 D 21.1 C
SR 99 & 20th Street InterchangeJunction
TypeDensity
(pc/mi/ln) LOSDensity
(pc/mi/ln) LOSDensity
(pc/mi/ln) LOSSR 99 NB Off-Ramp Diverge E 24.5 C 34.6 D 26.5 CSR 99 NB On-Ramp Merge E 22.6 C 35.9 F 27.4 CSR 99 SB Off-Ramp Diverge E 32.1 D 30.2 F 22.7 CSR 99 SB On-Ramp Merge E 21.1 C 9.8 A 8.4 A
SR 99 & SR 32 Interchange Type (pc/mi/ln) LOS (pc/mi/ln) LOS (pc/mi/ln) LOSSR 99 NB Off-Ramp Diverge E 29.0 D 41.6 F 31.2 DSR 99 SB On-Ramp Merge E 27.9 C 25.9 C 17.9 B
Target LOS
AM Peak Hour PM Peak Hour Sat Peak Hour
Target LOS
AM Peak Hour
Target LOS
AM Peak Hour PM Peak Hour Sat Peak Hour
PM Peak Hour Sat Peak Hour
Notes: Bolded entries indicate intersections operating at Unacceptable LOS. pc/mi/ln = Passenger Cars per Mile per Lane Based on a comparison of “no project” vs. “plus project” ramp junction levels of service as presented in Table 9 and Table 13A, respectively, the following ramp junctions which were found to operate unacceptably for Short Term No Project PM peak hour conditions will experience an increase in density for “plus project” conditions as shown in Table 13B.
TABLE 13B SHORT TERM (YEAR 2010) RAMP JUNCTIONS SIGNIFICANT IMPACT CRITERIA
SR 99 & 20th Street Interchange
Junction Type
% Increase in Density
(DI)SIG?
(DI>5%)SR 99 NB On-Ramp Merge E 35.9 F 35.6 F 1.0% NoSR 99 SB Off-Ramp Diverge E 30.2 F 29.7 F 2.0% No
SR 99 & SR 32 Interchange
Junction Type
% Increase in Density
(DI)SIG?
(DI>5%)SR 99 NB Off-Ramp Diverge E 41.6 F 41.2 F 1.0% No
Target LOS
PM Peak Hour
2010 Plus Prj. Density/LOS
2010 No Prj. Density/LOS
Target LOS
PM Peak Hour
2010 Plus Prj. Density/LOS
2010 No Prj. Density/LOS
As shown in Table 13B, the project is anticipated to increase the ramp junction density by 2% or less to Short Term No Project conditions at the SR 99 NB On-Ramp and SR 99 SB Off-Ramp (SR 99/20th Street interchange) and SR 99 NB Off-Ramp (SR 99/SR 32 interchange) under PM peak hour conditions. Significant impact discussion and mitigations are discussed within the Mitigations/Recommendations section of the report.

Chico Wal-Mart Store Expansion Traffic Impact Study Page 44 Pacific Municipal Consultants (R782TS008.DOC/25-5130-10)
CUMULATIVE (YEAR 2020) CONDITIONS Cumulative conditions refer to analysis scenarios which would typically exist following assumed build out of the local General Plan. Cumulative traffic volumes for the study area were obtained from two sources, Chico 2005-2006 Update of Development Impact Fees Analysis and Recommendations, Nexus Study (City of Chico, October 2005) and the Meriam Park Phasing Analysis (W-Trans, May 2, 2007). The Nexus Study included a future horizon year of 2018 to coincide with its General Plan horizon and included traffic projections for most of the facilities in the study area. The Meriam Park Phasing Analysis was completed following completion of the DEIR for the Meriam Park project to assist with determining phasing of City street improvements. Since the Meriam Park land use plan included a building phase for the Year 2020, previous traffic projections from the Nexus Study were updated using straight line growth factors to obtain Year 2020 projections. These projections were only completed for specific street facilities including East 20th Street from SR 99 to Bruce Road. Therefore, only those study intersections in this WalMart study on East 20th Street from SR 99 to Forest Avenue had Year 2020 traffic projections available. All other study intersections and roads including SR 99 ramps and mainline volumes were based on the original Year 2018 Nexus Study traffic projections. Although a mix of Year 2018 and 2020 horizons were used, all base and future traffic volumes used in this Walmart study were based on the latest City traffic projections available. For ease of reference, within this study, the Cumulative (future) year will be referred to as Year 2020. As with Short Term conditions, volumes associated with the Wal-Mart Expansion were included within the Cumulative volumes the City provided. For purposes of this traffic analysis, it is necessary to back out the specific traffic volumes within the raw volumes associated with the Wal-Mart Expansion project for no project conditions, and add them back in (as established for this traffic study) for plus project conditions. The Cumulative No Project condition investigates traffic operations for year 2020 conditions, excluding development of the proposed project. The Cumulative Plus Project condition is the analysis scenario in which traffic impacts associated with the proposed project (i.e., the Chico Wal-Mart Expansion) are investigated in comparison to the Cumulative No Project condition scenario. Wal-Mart Expansion volumes as established using trip generation and distribution methodologies provided for within this analysis were added to Cumulative No Project volumes to establish Cumulative Plus Project volumes. Cumulative conditions assume that programmed or planned improvements will be completed, including potentially some project related improvements. Note that terms Cumulative or Year 2020 conditions have been used interchangeably in the report. PLANNED/PROGRAMMED IMPROVEMENTS The City of Chico has directed that the following improvements be assumed to be in place for Cumulative conditions. These improvements are in addition to those identified for Short Term (Year 2010) conditions and included in the memorandum received by the City (copy included in the Appendix). These improvements are funded under the Nexus Study.
• Auxiliary Lanes will be provided in both directions on SR 99 between Skyway and East 20th Street interchanges
• Auxiliary Lanes will be provided in both directions on SR 99 between East 20th Street and SR 32 interchanges
• Intersection #2) SR 99/20th Street Southbound Ramp intersection – 1. Westbound to southbound on-ramp loop 2. Eastbound free right with ramp improvements 3. An additional eastbound through lane
• Intersection #3) SR 99/20th Street Northbound Ramp intersection – 1. Eastbound to northbound on-ramp loop 2. Westbound free right with ramp improvements
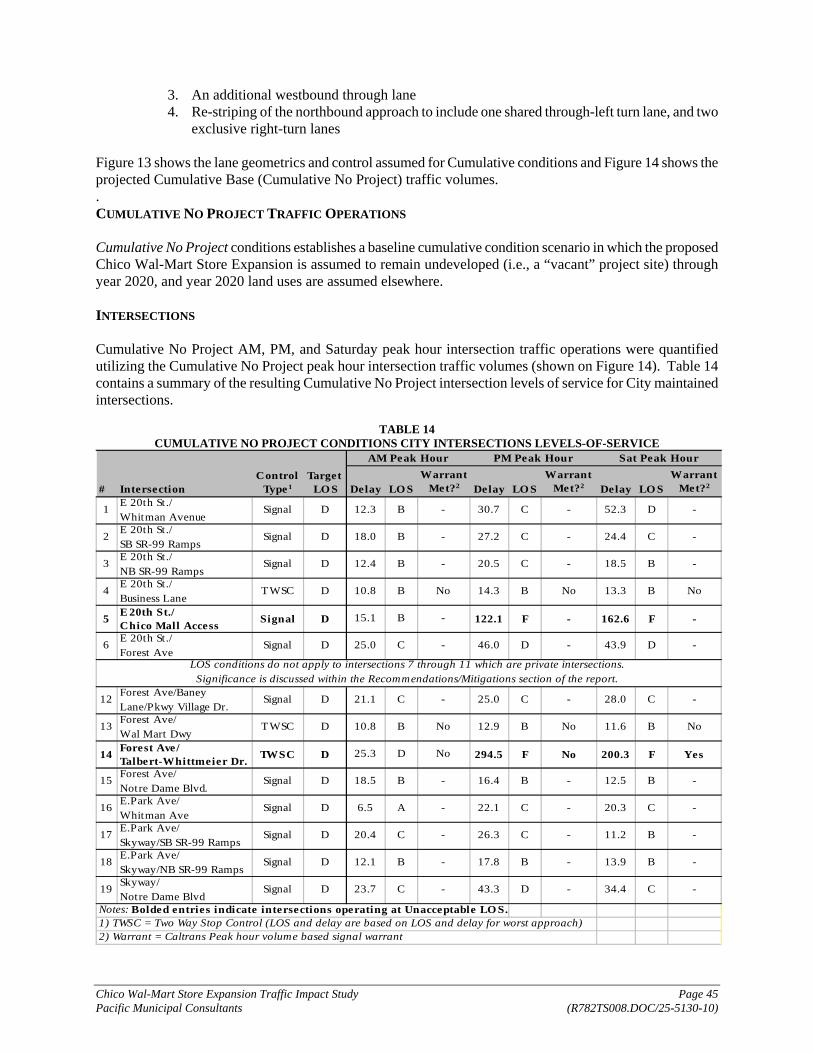
Chico Wal-Mart Store Expansion Traffic Impact Study Page 45 Pacific Municipal Consultants (R782TS008.DOC/25-5130-10)
3. An additional westbound through lane 4. Re-striping of the northbound approach to include one shared through-left turn lane, and two
exclusive right-turn lanes
Figure 13 shows the lane geometrics and control assumed for Cumulative conditions and Figure 14 shows the projected Cumulative Base (Cumulative No Project) traffic volumes. . CUMULATIVE NO PROJECT TRAFFIC OPERATIONS Cumulative No Project conditions establishes a baseline cumulative condition scenario in which the proposed Chico Wal-Mart Store Expansion is assumed to remain undeveloped (i.e., a “vacant” project site) through year 2020, and year 2020 land uses are assumed elsewhere. INTERSECTIONS Cumulative No Project AM, PM, and Saturday peak hour intersection traffic operations were quantified utilizing the Cumulative No Project peak hour intersection traffic volumes (shown on Figure 14). Table 14 contains a summary of the resulting Cumulative No Project intersection levels of service for City maintained intersections.
TABLE 14
CUMULATIVE NO PROJECT CONDITIONS CITY INTERSECTIONS LEVELS-OF-SERVICE
# Delay LO SWarrant
Met?2 Delay LO SWarrant
Met?2 Delay LO SWarrant
Met?2
1 E 20th St./Whitman Avenue
Signal D 12.3 B - 30.7 C - 52.3 D -
2 E 20th St./ SB SR-99 Ramps
Signal D 18.0 B - 27.2 C - 24.4 C -
3 E 20th St./NB SR-99 Ramps
Signal D 12.4 B - 20.5 C - 18.5 B -
4 E 20th St./Business Lane
TWSC D 10.8 B No 14.3 B No 13.3 B No
5 E 20th St./Chico Mall Access Signal D 15.1 B - 122.1 F - 162.6 F -
6 E 20th St./Forest Ave
Signal D 25.0 C - 46.0 D - 43.9 D -
12 Forest Ave/Baney Lane/Pkwy Village Dr.
Signal D 21.1 C - 25.0 C - 28.0 C -
13 Forest Ave/Wal Mart Dwy
TWSC D 10.8 B No 12.9 B No 11.6 B No
14 Forest Ave/Talbert-Whittmeier Dr. TWSC D 25.3 D No 294.5 F No 200.3 F Yes
15 Forest Ave/Notre Dame Blvd.
Signal D 18.5 B - 16.4 B - 12.5 B -
16 E.Park Ave/Whitman Ave
Signal D 6.5 A - 22.1 C - 20.3 C -
17 E.Park Ave/Skyway/SB SR-99 Ramps
Signal D 20.4 C - 26.3 C - 11.2 B -
18 E.Park Ave/Skyway/NB SR-99 Ramps
Signal D 12.1 B - 17.8 B - 13.9 B -
19 Skyway/Notre Dame Blvd
Signal D 23.7 C - 43.3 D - 34.4 C -
Notes: Bolded entries indicate intersections operating at Unacceptable LO S.1) TWSC = Two Way Stop Control (LOS and delay are based on LOS and delay for worst approach)
IntersectionControl
Type 1
Sat Peak HourTarget LO S
LOS conditions do not apply to intersections 7 through 11 which are private intersections. Significance is discussed within the Recommendations/Mitigations section of the report.
2) Warrant = Caltrans Peak hour volume based signal warrant
AM Peak Hour PM Peak Hour


Chico Wal-Mart Store Expansion Traffic Impact Study Page 48 Pacific Municipal Consultants (R782TS008.DOC/25-5130-10)
The intersections of E 20th Street with SR 99 ramps are projected to operate at acceptable LOS “D” or better with the cumulative lane geometrics in place. As shown in Table 14, the signalized intersection at E 20th St./Chico Mall Access is projected to operate at unacceptable LOS F during the PM and Saturday peak periods under Cumulative No Project conditions: As shown in Table 14, the following unsignalized intersection is projected to operate at unacceptable LOS at least during one peak hour period under Cumulative No Project conditions:
• Forest Avenue/Wittmeier Drive is projected to operate at unacceptable LOS F based on the delay projected along the stop controlled eastbound Wittmeier Drive approach.
FREEWAY MAINLINE SEGMENTS Cumulative No Project peak hour mainline operations were evaluated utilizing the Cumulative No Project peak hour traffic volumes shown on Figure 15. Table 15 summarizes Cumulative No Project conditions’ SR 99 freeway mainline operations at the two interchange locations in the vicinity of the study area.
TABLE 15 CUMULATIVE NO PROJECT CONDITIONS: SR 99 MAINLINE LEVELS-OF-SERVICE
Freeway Mainline Segment
No. Lanes Volume
Density, (pc/mi/ln) LOS Volume
Density, (pc/mi/ln) LOS Volume
Density, (pc/mi/ln) LOS
SR 99 NB, north of Skyway I/C
3 E 2,860 17.1 B 4,287 25.8 C 3,273 19.6 C
SR 99 SB, north of Skyway I/C
3 E 3,766 22.5 C 3,458 20.7 C 2,606 15.6 B
SR 99 NB, north of 20th Street I/C
3 E 3,254 19.5 C 4,877 30.1 D 3,645 21.8 C
SR 99 SB, north of 20th
Street I/C3 E 3,733 22.3 C 3,535 21.2 C 2,621 15.7 B
Target LOS
AM Peak Hour PM Peak Hour Sat Peak Hour
Notes: pc/mi/ln = Passenger Cars per Mile per Lane As shown in Table 15, all four mainline segments are projected to operate at acceptable LOS (LOS “E” or better) during AM, PM and Saturday peak hour periods under Cumulative No Project conditions. As noted before, auxiliary lanes along SR 99 between the Skyway and Route 32 interchanges are assumed to be in place for Cumulative No Project conditions. As such, the SR 99 mainline operations are evaluated assuming a 6-lane facility.


Chico Wal-Mart Store Expansion Traffic Impact Study Page 50 Pacific Municipal Consultants (R782TS008.DOC/25-5130-10)
FREEWAY RAMP JUNCTIONS Cumulative No Project peak hour ramp operations were evaluated utilizing the Cumulative No Project peak hour traffic volumes shown on Figure 14. Table 16 presents the Cumulative No Project conditions’ ramp merge/diverge peak hour LOS at the three study interchange locations in the vicinity of the study area.
TABLE 16 CUMULATIVE NO PROJECT CONDITIONS: SR 99 RAMP JUNCTION LEVELS-OF-SERVICE
SR 99 & Skyway InterchangeJunction
TypeDensity
(pc/mi/ln) LOSDensity
(pc/mi/ln) LOSDensity
(pc/mi/ln) LOSSR 99 NB Loop On-Ramp Merge E 16.5 B 26.7 C 19.4 B
SR 99 & 20th Street InterchangeJunction
TypeDensity
(pc/mi/ln) LOSDensity
(pc/mi/ln) LOSDensity
(pc/mi/ln) LOSSR 99 NB Loop On-Ramp Diverge E 13.7 B 22.1 C 16.6 BSR 99 NB Direct On-Ramp Merge E 18.9 B 32.3 D 24.2 CSR 99 SB Off-Ramp Diverge E 31.8 D 34.6 F 24.4 CSR 99 SB Loop On-Ramp Merge E 18.4 B 12.3 B 8.3 A
SR 99 & SR 32 InterchangeJunction
TypeDensity
(pc/mi/ln) LOSDensity
(pc/mi/ln) LOSDensity
(pc/mi/ln) LOSSR 99 NB Off-Ramp Diverge E 27.7 C 50.8 F 33.2 DSR 99 SB On-Ramp Merge E 24.5 C 32.9 D 18.4 B
Sat Peak HourTarget LOS
AM Peak Hour PM Peak Hour
PM Peak Hour Sat Peak Hour
Target LOS
AM Peak Hour PM Peak Hour Sat Peak Hour
Target LOS
AM Peak Hour
Notes: Bolded entries indicate ramp junctions operating at Unacceptable LOS.
pc/mi/ln = Passenger Cars per Mile per Lane As shown in Table 16, the southbound off-ramp at the SR 99/20th Street interchange and the northbound off-ramp at the SR 99/SR 32 interchange are projected to operate at LOS “F” during the PM peak hour period. WEAVING ANALYSIS As noted before, an auxiliary lane would be provided along SR 99 between the Skyway and SR 32 interchanges. Since the spacing between the Skyway and 20th Street interchanges is less than 2500 feet, mainline weaving analysis was performed for the SR 99 segment between the interchanges. Table 17 presents the Cumulative No Project conditions’ mainline weave peak hour LOS.
TABLE 17 CUMULATIVE NO PROJECT CONDITIONS: SR 99 WEAVING LEVELS-OF-SERVICE
AM Peak Hour PM Peak Hour Sat Peak Hour WEAVING SEGMENT
No. Lanes On Frwy
Target Level of Service
Density (pc/mi/ln) LOS
Density (pc/mi/ln) LOS
Density (pc/mi/ln) LOS
Northbound SR 99 – between Skyway and 20th 3 E 27.9 C 43.8 F 30.7 D
Southbound SR 99 – between Skyway and 20th 3 E 33.5 D 33.4 D 22.1 C
Notes: Bolded entries indicate weave segments operating at Unacceptable LOS. pc/mi/ln = Passenger Cars per Mile per Lane As shown in Table 17, under Cumulative No Project conditions, the southbound SR 99 weave segment between the Skyway and 20th Street interchanges is projected to operate acceptably, while the northbound weave segment is projected to operate at unacceptable LOS “F” during the PM peak hour period.

Chico Wal-Mart Store Expansion Traffic Impact Study Page 51 Pacific Municipal Consultants (R782TS008.DOC/25-5130-10)
CUMULATIVE PLUS PROJECT TRAFFIC OPERATIONS Cumulative Plus Project conditions are simulated by superimposing traffic generated by the proposed project over the Cumulative No Project traffic volumes at the study intersections and roadway segments. The resulting Cumulative Plus Project traffic volumes are illustrated on Figure 16. INTERSECTIONS Cumulative Plus Project AM, PM, and Saturday peak hour intersection traffic operations were quantified utilizing the Cumulative Plus Project peak hour intersection traffic volumes shown in Figure 15. Table 18A contains a summary of the resulting intersection levels of service for City maintained intersections.
TABLE 18A CUMULATIVE PLUS PROJECT CONDITIONS CITY INTERSECTIONS LEVELS-OF-SERVICE
#Delay LOS
Warrant Met?2 Delay LOS
Warrant Met?2 Delay LOS
Warrant Met?2
1 E 20th St./Whitman Avenue
Signal D 12.3 B - 31.7 C - 54.5 D -
2 E 20th St./ SB SR-99 Ramps
Signal D 18.2 B - 28.3 C - 25.1 C -
3 E 20th St./NB SR-99 Ramps
Signal D 12.4 B - 21.0 C - 18.7 B -
4 E 20th St./Business Lane
TWSC D 10.9 B No 14.4 B No 13.4 B No
5 E 20th St./Chico Mall Access
Signal D 15.1 B - 127.9 F - 170.7 F -
6 E 20th St./Forest Ave
Signal D 27.2 C - 52.2 D - 50.8 D -
12 Forest Ave/Baney Lane/Pkwy Village Dr.
Signal D 21.2 C - 25.6 C - 28.6 C -
13 Forest Ave/Wal Mart Dwy
TWSC D 13.0 B No 14.8 B No 13.8 B No
14 Forest Ave/Talbert-Whittmeier Dr.
Signal D 26.0 C - 25.9 C - 30.2 C -
15 Forest Ave/Notre Dame Blvd.
Signal D 18.5 B - 16.4 B - 12.5 B -
16 E.Park Ave/Whitman Ave
Signal D 6.5 A - 22.2 C - 20.3 C -
17 E.Park Ave/Skyway/SB SR-99 Ramps
Signal D 20.4 C - 26.4 C - 11.2 B -
18 E.Park Ave/Skyway/NB SR-99 Ramps
Signal D 12.5 B - 18.5 B - 14.2 B -
19 Skyway/Notre Dame Blvd
Signal D 25.0 C - 47.7 D - 36.6 D -
Notes: Bolded entries indicate intersections operating at Unacceptable LOS.
IntersectionControl Type1
Sat Peak Hour
Target LOS
AM Peak Hour PM Peak Hour
LOS conditions do not apply to intersections 7 through 11 which are private intersections. Significance is discussed within the Recommendations/Mitigations section of the report.
1) TWSC = Two Way Stop Control (LOS and delay are based on LOS and delay for worst approach)2) Warrant = Caltrans Peak hour volume based signal warrant


Chico Wal-Mart Store Expansion Traffic Impact Study Page 53 Pacific Municipal Consultants (R782TS008.DOC/25-5130-10)
The Forest Avenue/Wittmeier intersection will be signalized following the expansion and is projected to operate at acceptable LOS “C” during all peak hour periods analyzed within the study.
Based on a comparison of “no project” vs. “plus project” intersection levels of service as presented in Table 14 and Table 18A, respectively, the E. 20th Street/Chico Mall Access intersection which was found to operate unacceptably for Cumulative No Project PM and Saturday peak hour conditions will experience an increase in delay for “plus project” conditions as shown in Table 18B.
TABLE 18B CUMULATIVE CONDITIONS CITY INTERSECTIONS SIGNIFICANT IMPACT CRITERIA
#
Delay Increase
(DI)
SIG? (DI >
5.0 Sec)
Delay Increase
(DI)
SIG? (DI >
5.0 Sec)
5 E 20th St./Chico Mall Access
Signal D 127.9 F 122.1 F 5.8 Yes 170.7 F 162.6 F 8.1 Yes
2020 No Prj.
Delay/LOSIntersectionControl Type1
Target LOS
PM Peak Hour2020 Plus
Prj. Delay/LOS
2020 No Prj.
Delay/LOS
Sat Peak Hour2020 Plus
Prj. Delay/LOS
As shown in Table 18B, at the E 20th Street/Chico Mall Access intersection, the project is anticipated to increase the delay by 5.8 seconds and 8.1 seconds during the PM and Saturday peak hour conditions to Cumulative No Project conditions, respectively. Significant impact discussion and mitigation is discussed within the Mitigations/Recommendations section of the report. 95TH PERCENTILE QUEUE LENGTHS As noted earlier, the main access points to the proposed project site would be via the signalized intersection of Forest Avenue/Baney Lane, and the intersection of Forest Avenue/Wittmeier Drive, which will be signalized as part of the proposed project. At the request of City staff, a 95th percentile queuing analysis has been performed at these two intersections to determine the adequacy of turning lane storage bays. Table 18C presents the projected 95th percentile queue determined using TRAFFIX software for Cumulative No Project and Cumulative Plus Project conditions. The queuing analysis assumes that each vehicle within a queue requires 25 ft. per vehicle (which includes the length of the vehicle itself and spacing between the next vehicle). Therefore, all queuing results are converted to vehicle stacking requirements in multiples of 25 ft. Note that the available storage lengths shown in the Table below were measured from aerial photographs.

Chico Wal-Mart Store Expansion Traffic Impact Study Page 54 Pacific Municipal Consultants (R782TS008.DOC/25-5130-10)
TABLE 18C CUMULATIVE (2020) CONDITIONS QUEUING ANALYSIS
2020 No Project
2020 Plus Project
Intersection Movement
Available Storage length
(ft) AM PM SAT AM PM SAT NBL 4601 130 250 425 145 270 450 SBL 208 80 120 55 90 125 60 SBR 220 40 250 405 60 300 460 EBL 3501 50 350 340 85 395 380
Forest Ave/ Baney Lane
WBL 128 40 25 35 60 50 75 NBL 3251 225 250 320 SBL 1901 100 155 100 EBL 3001 250 260 345
Forest Ave/ Talbert Wittmeier
Drive WBL 127
Not Applicable
45 85 85 1. Approximate length of the turn pocket as proposed to be lengthened as part of the site improvements. 2. Bold - 95th percentile queue would exceed the available storage.
As shown in Table 18C, the 95th percentile queues for eastbound left turns and the southbound right turns exceed the available/proposed storage requirements at the Forest Avenue/Baney Lane intersection and the eastbound left turns exceed the available/proposed storage requirements at the Forest Avenue/Talbert/Wittmeier Drive intersection. Significant impact discussion and mitigation is discussed within the Mitigations/Recommendations section of the report.
PRIVATE INTERSECTIONS A discussion of the impacts at the private intersections which were included in the 2010 Plus Project conditions section, applies to the 2020 Plus Project conditions as well. FREEWAY MAINLINE SEGMENTS Cumulative Plus Project peak hour mainline operations were evaluated utilizing the peak hour traffic volumes shown on Figure 17. Table 19 summarizes SR 99 freeway mainline operations at the two interchange locations in the vicinity of the study area for Cumulative Plus Project conditions.
TABLE 19 CUMULATIVE PLUS PROJECT CONDITIONS: SR 99 MAINLINE LEVELS-OF-SERVICE
Freeway Mainline Segment
No. Lanes Volume
Density, (pc/mi/ln) LOS Volume
Density, (pc/mi/ln) LOS Volume
Density, (pc/mi/ln) LOS
SR 99 NB, north of Skyway I/C
3 E 2,838 17.0 B 4,259 25.6 C 3,224 19.3 C
SR 99 SB, north of Skyway I/C
3 E 3,766 22.5 C 3,458 20.7 C 2,606 15.6 B
SR 99 NB, north of 20th Street I/C
3 E 3,286 19.7 C 4,914 30.5 D 3,695 22.1 C
SR 99 SB, north of 20th
Street I/C3 E 3,763 22.5 C 3,565 21.3 C 2,651 15.9 B
AM Peak Hour PM Peak Hour Sat Peak HourTarget LOS
Notes: pc/mi/ln = Passenger Cars per Mile per Lane As shown in Table 19, all four mainline segments are projected to operate at acceptable LOS (LOS “E” or better) during AM, PM and Saturday peak hour periods under Cumulative Plus Project conditions. As noted before, auxiliary lanes along SR 99 between the Skyway and SR 32 interchanges are assumed to be in place for Cumulative Plus Project conditions. As such, the SR 99 mainline operations are evaluated assuming a 6-

Chico Wal-Mart Store Expansion Traffic Impact Study Page 55 Pacific Municipal Consultants (R782TS008.DOC/25-5130-10)
lane facility. FREEWAY RAMP JUNCTIONS Cumulative Plus Project peak hour ramp operations were evaluated utilizing the Cumulative Plus Project peak hour traffic volumes shown on Figure 16. Table 20A presents the ramp merge/diverge peak hour LOS at the three study interchange locations in the vicinity of the study area for Cumulative Plus Project conditions.
TABLE 20A CUMULATIVE PLUS PROJECT CONDITIONS: SR 99 RAMP JUNCTION LEVELS-OF-SERVICE
SR 99 & Skyway InterchangeJunction
TypeDensity
(pc/mi/ln) LOSDensity
(pc/mi/ln) LOSDensity
(pc/mi/ln) LOSSR 99 NB Loop On-Ramp Merge E 16.5 B 26.7 C 19.4 B
SR 99 & 20th Street InterchangeJunction
TypeDensity
(pc/mi/ln) LOSDensity
(pc/mi/ln) LOSDensity
(pc/mi/ln) LOSSR 99 NB Loop On-Ramp Diverge E 13.6 B 21.9 C 16.4 BSR 99 NB Direct On-Ramp Merge E 19.1 B 32.5 D 24.3 CSR 99 SB Off-Ramp Diverge E 32.1 D 34.9 F 24.6 FSR 99 SB Loop On-Ramp Merge E 18.4 B 12.3 B 8.3 A
SR 99 & SR 32 InterchangeJunction
TypeDensity
(pc/mi/ln) LOSDensity
(pc/mi/ln) LOSDensity
(pc/mi/ln) LOSSR 99 NB Off-Ramp Diverge E 28.2 D 51.1 F 34.2 DSR 99 SB On-Ramp Merge E 24.8 C 33.7 D 18.6 B
Sat Peak HourTarget LOS
AM Peak Hour PM Peak Hour
PM Peak Hour Sat Peak Hour
Target LOS
AM Peak Hour PM Peak Hour Sat Peak Hour
Target LOS
AM Peak Hour
Notes: Bolded entries indicate intersections operating at Unacceptable LOS. pc/mi/ln = Passenger Cars per Mile per Lane Based on a comparison of “no project” vs. “plus project” ramp junction levels of service as presented in Table 16 and Table 20A, respectively, the following ramp junctions which were found to operate unacceptably for Cumulative No Project PM and Saturday peak hour conditions will experience an increase in density for “plus project” conditions as shown in Table 20B.
TABLE 20B CUMULATIVE CONDITIONS RAMP JUNCTIONS SIGNIFICANT IMPACT CRITERIA
SR 99 & 20th Street InterchangeJunction
Type
% Increase in Density
(DI)SIG?
% Increase in Density
(DI)SIG?
SR 99 SB Off-Ramp Diverge E 34.9 F 34.6 F 1.0% No 24.6 F 24.4 C 1.0% YES
SR 99 & SR 32 InterchangeJunction
Type
% Increase in Density
(DI)SIG?
% Increase in Density
(DI)SIG?
SR 99 NB Off-Ramp Diverge E 51.1 F 50.8 F 1.0% No N/A N/A N/A N/A N/A N/A
2018 No Prj. Density/LO S
2018 Plus Prj. Density/LO S
2018 No Prj. Density/LOS
PM Peak Hour SAT Peak Hour
PM Peak Hour
2018 Plus Prj. Density/LO S
2018 No Prj. Density/LO S
2018 Plus Prj. Density/LO S
SAT Peak Hour
2018 Plus Prj. Density/LO S
2018 No Prj. Density/LOS
Target LO S
Target LO S


Chico Wal-Mart Store Expansion Traffic Impact Study Page 57 Pacific Municipal Consultants (R782TS008.DOC/25-5130-10)
As shown in Table 20B, the following ramp diverge junctions analyzed are projected to operate at acceptable LOS under the plus project conditions:
• For the PM peak hour, at the southbound off-ramp at the SR 99/20th Street interchange, the project is anticipated to increase the ramp junction density by 1%. For the Saturday peak hour, the project will cause the ramp junction that was found to be operating at acceptable LOS C under “no project” conditions to deteriorate to LOS F conditions.
• For the PM peak hour, at the northbound off-ramp at the SR 99/SR 32 interchange, the project is anticipated to increase the ramp junction density by 1%.
WEAVING ANALYSIS As noted before, an auxiliary lane would be provided along SR 99 between the Skyway and SR 32 interchanges. Since the spacing between the Skyway and 20th Street interchanges is less than 2,500 feet, mainline weaving analysis was performed for the SR 99 segment between the interchanges. Table 21A presents the Cumulative Plus Project conditions’ mainline weave LOS for all study peak hour periods.
TABLE 21A
CUMULATIVE PLUS PROJECT CONDITIONS: SR 99 WEAVING LEVELS-OF-SERVICE
AM Peak Hour PM Peak Hour Sat Peak Hour WEAVING SEGMENT
No. Lanes On Frwy
Target Level of Service
Density (pc/mi/ln) LOS
Density (pc/mi/ln) LOS
Density (pc/mi/ln) LOS
Northbound SR 99 – between Skyway and 20th 3 E 27.9 C 43.8 F 30.7 D
Southbound SR 99 – between Skyway and 20th 3 E 33.5 D 33.4 D 22.1 C
Notes: Bolded entries indicate intersections operating at Unacceptable LOS. pc/mi/ln = Passenger Cars per Mile per Lane Based on a comparison of “no project” vs. “plus project” weave junction levels of service as presented in Table 17 and Table 21A, respectively, the following weave junction which was found to operate unacceptably for Cumulative No Project PM peak hour conditions will experience an increase in density for “plus project” conditions as shown in Table 21B.
TABLE 21B
CUMULATIVE CONDITIONS WEAVING JUNCTIONS SIGNIFICANT IMPACT CRITERIA
WEAVING SEGMENT
% Increase in Density
(DI)SIG?
Northbound SR 99 – between Skyway and 20th
E 43.8 F 43.8 F 0.100% No
Target LOS
PM Peak Hour2018 Plus Prj.
Density (pc/mi/ln)/
LOS
2018 No Prj. Density
(pc/mi/ln)/LOS
As shown in Table 21B, the project is anticipated to increase the weave junction density by less than 1% to Cumulative No Project PM peak hour conditions on SR 99 NB between Skyway and 20th Street interchanges which is less than significant.

Chico Wal-Mart Store Expansion Traffic Impact Study Page 58 Pacific Municipal Consultants (R782TS008.DOC/25-5130-10)
RECOMMENDATIONS/MITIGATIONS This section presents recommended base improvements as well as project-related mitigation measures at the study intersections and roadway segments, developed based on the findings from the analyses presented in the prior sections of this report. Additional recommendations regarding access to the project site are also included. EXISTING CONDITIONS City Intersections The following intersections under the jurisdiction of the City are found to be operating at an undesirable level of service under Existing conditions. E. 20th Street/Chico Mall Access – The signalized intersection is found to be currently operating at unacceptable LOS “E” during the Saturday peak hour period under Existing conditions. Provision of overlap signal phasing for the southbound right turn movement and restricting the eastbound to westbound U-turns will yield acceptable operations at this intersection for the Saturday peak hour period under Existing conditions. As will be noted later, the improvement identified above would not provide acceptable operations for year 2010 conditions. E. 20th Street/Forest Avenue – The signalized intersection is found to be currently operating at unacceptable LOS “E” during the Saturday peak hour period. In order to achieve acceptable levels of service at this intersection, the following improvement is suggested under Existing conditions:
• Provide an additional left-turn lane along the northbound Forest Avenue approach With this improvement, acceptable LOS “D” would be achieved during the Saturday peak hour period under Existing conditions. Forest Avenue/Wittmeier Drive – This unsignalized intersection currently operates at unacceptable LOS “E” during the PM peak hour period based on the delay along the eastbound Wittmeier Drive approach. The westbound left-turn operates at acceptable LOS “D” and the left-turns along Forest Avenue currently operate at acceptable LOS “A”. The intersection would operate at unacceptable LOS until the signalization improvements associated with the proposed Wal-Mart expansion development are implemented. The intersection does not meet Caltrans peak hour volume signal warrant criteria for Existing conditions, and as no other improvements to the intersection would improve the levels of service, no improvements are recommended under Existing conditions at this intersection. SHORT TERM NO PROJECT CONDITIONS Chico Mall Expansion Improvements Currently, the Chico Mall is processing the necessary applications to facilitate an expansion. City staff working in conjunction with Mall representatives, their engineer, and Caltrans identified certain necessary improvements along the E. 20th Street corridor to facilitate the expansion and improve traffic operations along the E. 20th Street corridor. The improvements are described as follows:
• E. 20th Street – Widening: E. 20th Street will be widened from a four-lane roadway to a six-lane roadway between SR 99 and E. 20th Street/Forest Avenue intersection. Additional modifications are planned to the centerline median to provide required vehicle stacking and landscaping.
• E. 20th Street – Modified Existing Main Chico Mall Access/ToysRUs Access: The existing Main Chico Mall Access will be modified to eliminate certain turning movements. No changes are

Chico Wal-Mart Store Expansion Traffic Impact Study Page 59 Pacific Municipal Consultants (R782TS008.DOC/25-5130-10)
proposed for the existing ToysRUs Access. • E. 20th Street – Modified Chico Mall Access/ToysRUs Access Signal Timing: Signal Phasing will be
modified to increase intersection capacity. • E. 20th Street – New Chico Mall Access: A new signalized T-intersection entrance will be
constructed, west of Kentucky Fried Chicken building, and will provide for the full range of turning movements.
• E. 20th Street – Existing Eastern Chico Mall/Target Access: The existing Eastern (unsignalized) Chico Mall Access will be eliminated. No changes are proposed for the existing Target Access.
These planned public/private improvements are dependent on the Chico Mall proceeding with the planned expansion and therefore, are not a certainty. City Intersections The following intersections under the jurisdiction of the City are found to be operating at an undesirable level of service under Short Term No Project conditions. E. 20th Street/Chico Mall Access – The signalized intersection would operate at unacceptable LOS “E” during the Saturday peak hour periods under Short Term No Project conditions. The improvement identified under Existing conditions (overlapping southbound right turn and restricting the eastbound to westbound U-turns) would not provide acceptable levels of service for Short Term conditions. Implementing the proposed improvements as discussed within the Chico Mall Expansion Improvements section, would yield acceptable operations at the E 20th St./Chico Mall Access intersection. These planned public/private improvements are dependent on the Chico Mall proceeding with the planned expansion and therefore, are not a certainty. Forest Avenue/Wittmeier Drive – This unsignalized intersection would operate unacceptably at LOS “F” during the PM and Saturday peak hour periods under Short Term No Project conditions. The intersection would operate at unacceptable LOS until the signalization improvements associated with the proposed Wal-Mart expansion development are implemented. The intersection does not meet Caltrans peak hour volume signal warrant criteria for Short Term No Project conditions, and as no other improvements to the intersection would improve the levels of service, no improvements are recommended under Short Term No Project conditions at this intersection. Ramp Junctions SR 99/20th Street Interchange – Northbound On-Ramp – The northbound on-ramp at the SR 99/20th Street interchange would operate at unacceptable LOS “F” during the PM peak hour under Short Term No Project conditions. The poor level of service is due to the high volume of traffic utilizing the on-ramp. Provision of the improvement described below would yield acceptable LOS for the on-ramp:
• Provide an eastbound to northbound loop-on ramp. Note that this improvement will be in place under year 2020 conditions.
SR 99/20th Street Interchange – Southbound Off-Ramp – The southbound off-ramp at the SR 99/20th Street interchange would operate at unacceptable LOS “F” during the PM peak hour under Short Term No Project conditions. The poor level of service is due to the high volume of traffic utilizing the off-ramp to access Chico Mall and other retail land uses along 20th Street. Provision of a 2-lane southbound off-ramp (two lanes exiting off the freeway) would yield acceptable operations at the southbound SR 99 off-ramp diverge junction to 20th Street. SR 99/SR 32 Interchange – Northbound Off-Ramp – The northbound off-ramp at the SR 99/SR 32 interchange would operate at unacceptable LOS “F” during the PM peak hour under Short Term No Project conditions. Provision of an additional through lane on the mainline would yield acceptable operations at the
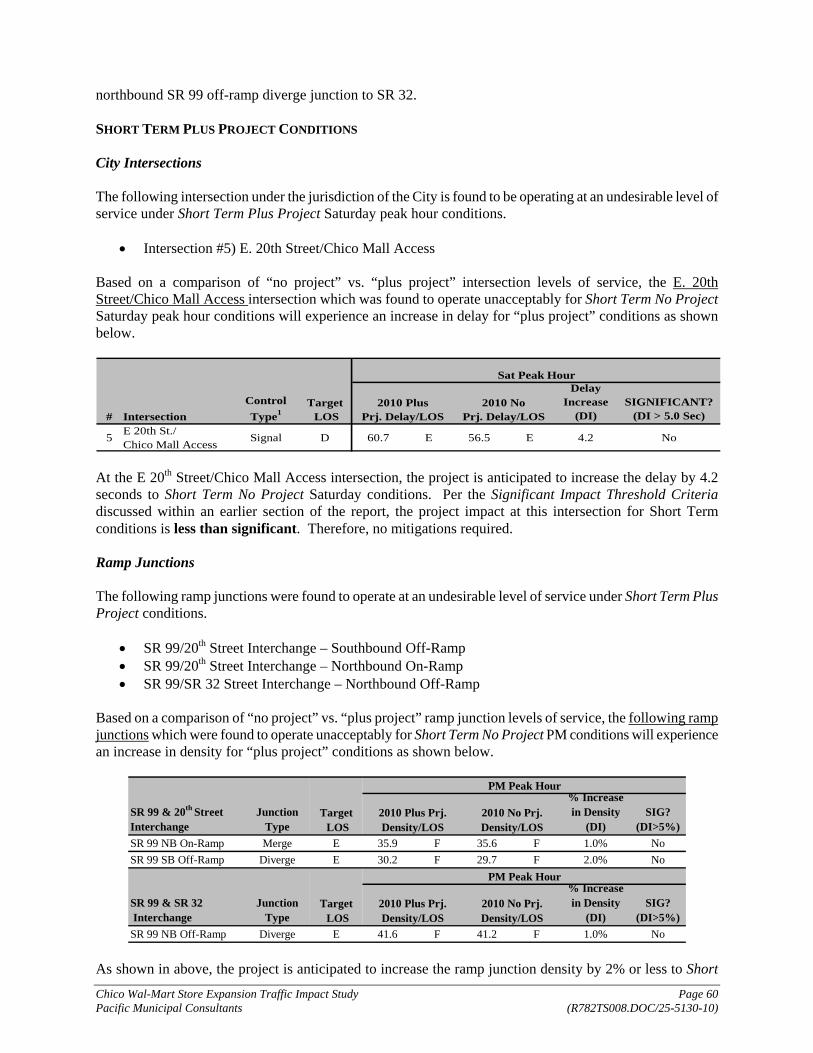
Chico Wal-Mart Store Expansion Traffic Impact Study Page 60 Pacific Municipal Consultants (R782TS008.DOC/25-5130-10)
northbound SR 99 off-ramp diverge junction to SR 32. SHORT TERM PLUS PROJECT CONDITIONS City Intersections The following intersection under the jurisdiction of the City is found to be operating at an undesirable level of service under Short Term Plus Project Saturday peak hour conditions.
• Intersection #5) E. 20th Street/Chico Mall Access Based on a comparison of “no project” vs. “plus project” intersection levels of service, the E. 20th Street/Chico Mall Access intersection which was found to operate unacceptably for Short Term No Project Saturday peak hour conditions will experience an increase in delay for “plus project” conditions as shown below.
#
Delay Increase
(DI)SIGNIFICANT?
(DI > 5.0 Sec)
5 E 20th St./Chico Mall Access
Signal D 60.7 E 56.5 E 4.2 No
Sat Peak Hour
2010 Plus Prj. Delay/LOS
2010 No Prj. Delay/LOSIntersection
Control Type1
Target LOS
At the E 20th Street/Chico Mall Access intersection, the project is anticipated to increase the delay by 4.2 seconds to Short Term No Project Saturday conditions. Per the Significant Impact Threshold Criteria discussed within an earlier section of the report, the project impact at this intersection for Short Term conditions is less than significant. Therefore, no mitigations required. Ramp Junctions The following ramp junctions were found to operate at an undesirable level of service under Short Term Plus Project conditions.
• SR 99/20th Street Interchange – Southbound Off-Ramp • SR 99/20th Street Interchange – Northbound On-Ramp • SR 99/SR 32 Street Interchange – Northbound Off-Ramp
Based on a comparison of “no project” vs. “plus project” ramp junction levels of service, the following ramp junctions which were found to operate unacceptably for Short Term No Project PM conditions will experience an increase in density for “plus project” conditions as shown below.
SR 99 & 20th Street Interchange
Junction Type
% Increase in Density
(DI)SIG?
(DI>5%)SR 99 NB On-Ramp Merge E 35.9 F 35.6 F 1.0% NoSR 99 SB Off-Ramp Diverge E 30.2 F 29.7 F 2.0% No
SR 99 & SR 32 Interchange
Junction Type
% Increase in Density
(DI)SIG?
(DI>5%)SR 99 NB Off-Ramp Diverge E 41.6 F 41.2 F 1.0% No
Target LOS
PM Peak Hour
2010 Plus Prj. Density/LOS
2010 No Prj. Density/LOS
Target LOS
PM Peak Hour
2010 Plus Prj. Density/LOS
2010 No Prj. Density/LOS
As shown in above, the project is anticipated to increase the ramp junction density by 2% or less to Short

Chico Wal-Mart Store Expansion Traffic Impact Study Page 61 Pacific Municipal Consultants (R782TS008.DOC/25-5130-10)
Term No Project conditions at the SR 99 NB On-Ramp and SR 99 SB Off-Ramp (SR 99/20th Street interchange) and SR 99 NB Off-Ramp (SR 99/SR 32 interchange). Per the Significant Impact Threshold Criteria discussed within an earlier section of the report, the project impact at these ramp junctions for Short Term conditions is less than significant. Therefore, no mitigations required.
CUMULATIVE NO PROJECT CONDITIONS City Intersections The following intersections under the jurisdiction of the City are found to be operating at an undesirable level of service under Cumulative No Project conditions. E. 20th Street/Chico Mall Access – The signalized intersection would operate at unacceptable LOS “F” during the PM and Saturday peak hour periods under Cumulative No Project conditions. Implementing the proposed improvements as discussed within the Chico Mall Expansion Improvements section, would yield acceptable operations at the E 20th St./Chico Mall Access intersection for Cumulative No Project conditions. These planned public/private improvements are dependent on the Chico Mall proceeding with the planned expansion and therefore, are not a certainty. Forest Avenue/Wittmeier Drive – This unsignalized intersection would operate unacceptably at LOS “F” during the PM and Saturday peak hour periods under Cumulative No Project conditions. The intersection does meet Caltrans peak hour volume signal warrant criteria for Cumulative No Project conditions. As such, the intersection would operate at unacceptable LOS until the signalization improvements associated with the proposed Wal-Mart expansion development will be implemented. Upon implementation of signalization improvements, the intersection would operate at acceptable LOS “C” for all time periods analyzed within the study under Cumulative No Project conditions. Ramp Junctions SR 99/20th Street Interchange – Southbound Off-Ramp – The southbound off-ramp at the SR 99/20th Street interchange would operate at unacceptable LOS “F” during the PM and Saturday peak hour periods under Cumulative No Project conditions. The poor level of service is due to the high volume of traffic utilizing the off-ramp to access Chico Mall and other retail land uses along 20th Street. Implementation of improvements recommended under Short Term No Project conditions, including provision of a 2-lane southbound off-ramp (with two lanes exiting the freeway), would yield acceptable operations at the southbound SR 99 off-ramp diverge junction to 20th Street. However, it is not known if these improvements are economically feasible. SR 99/SR 32 Interchange – Northbound Off-Ramp – The northbound off-ramp at the SR 99/SR 32 interchange would operate at unacceptable LOS “F” during the PM peak hour period under Cumulative No Project conditions. Provision of an either a two lane ramp (two lanes exiting the freeway) or an additional through lane on the mainline (resulting in four lanes including the auxiliary lane) would yield acceptable operations at the northbound SR 99 off-ramp diverge junction to 20th Street. However, it is not known if these improvements are economically feasible. Weave Segments Northbound SR 99 between Skyway and 20th Street interchanges – The weave segment along northbound SR 99 between the Skyway and 20th Street interchanges is projected to operate at unacceptable LOS ”F” during the PM peak hour period. Provision of an additional northbound through lane (resulting in four lanes including the auxiliary lane) would provide acceptable operations along the segment. However, it is not known if the widening of SR 99 to provide three (3) northbound through lanes in addition to the existing two (2) northbound through lanes (and the future auxiliary lane) is economically feasible.

Chico Wal-Mart Store Expansion Traffic Impact Study Page 62 Pacific Municipal Consultants (R782TS008.DOC/25-5130-10)
CUMULATIVE PLUS PROJECT CONDITIONS City Intersections The following intersection under the jurisdiction of the City is found to be operating at an undesirable level of service under Cumulative Plus Project conditions.
• Intersection #5) E. 20th Street/Chico Mall Access Based on a comparison of “no project” vs. “plus project” intersection levels of service, the E. 20th Street/Chico Mall Access intersection which was found to operate unacceptably for Cumulative No Project PM and Saturday peak hour conditions will experience an increase in delay for “plus project” conditions as shown below.
#
Delay Increase
(DI)
SIG? (DI >
5.0 Sec)
Delay Increase
(DI)
SIG? (DI >
5.0 Sec)
5 E 20th St./Chico Mall Access
Signal D 127.9 F 122.1 F 5.8 Yes 170.7 F 162.6 F 8.1 Yes
2020 No Prj.
Delay/LOSIntersectionControl Type1
Target LOS
PM Peak Hour2020 Plus
Prj. Delay/LOS
2020 No Prj.
Delay/LOS
Sat Peak Hour2020 Plus
Prj. Delay/LOS
As shown above, at the E 20th Street/Chico Mall Access intersection, the project is anticipated to increase the delay by 5.8 seconds and 8.1 seconds during the PM and Saturday peak hour conditions to Cumulative No Project conditions, respectively. Per the Significant Impact Threshold Criteria discussed within an earlier section of the report, the project impact at this intersection for Cumulative conditions is significant. Implementing the proposed improvements as discussed within the Chico Mall Expansion Improvements section, would yield acceptable operations at the E 20th St./Chico Mall Access intersection for Cumulative Plus Project conditions. These planned public/private improvements are dependent on the Chico Mall proceeding with the planned expansion and therefore, are not a certainty. Until these improvements are constructed, project impacts at this location would remain significant and unavoidable for Cumulative Plus Project conditions. Ramp Junctions The following ramp junctions were found to operate at an undesirable level of service under Cumulative Plus Project conditions.
• SR 99/20th Street Interchange – Southbound Off-Ramp • SR 99/SR 32 Interchange – Northbound Off-Ramp
Based on a comparison of “no project” vs. “plus project” ramp junction levels of service the following ramp junctions which were found to operate unacceptably for Cumulative No Project PM and Saturday peak hour conditions will experience an increase in density for “plus project” conditions as shown below.

Chico Wal-Mart Store Expansion Traffic Impact Study Page 63 Pacific Municipal Consultants (R782TS008.DOC/25-5130-10)
SR 99 & 20th Street InterchangeJunction
Type
% Increase in Density
(DI)SIG?
% Increase in Density
(DI)SIG?
SR 99 SB Off-Ramp Diverge E 34.9 F 34.6 F 1.0% No 24.6 F 24.4 C 1.0% YES
SR 99 & SR 32 InterchangeJunction
Type
% Increase in Density
(DI)SIG?
% Increase in Density
(DI)SIG?
SR 99 NB Off-Ramp Diverge E 51.1 F 50.8 F 1.0% No N/A N/A N/A N/A N/A N/A
2018 No Prj. Density/LO S
2018 Plus Prj. Density/LO S
2018 No Prj. Density/LO S
PM Peak Hour SAT Peak Hour
PM Peak Hour
2018 Plus Prj. Density/LO S
2018 No Prj. Density/LO S
2018 Plus Prj. Density/LO S
SAT Peak Hour
2018 Plus Prj. Density/LO S
2018 No Prj. Density/LO S
Target LO S
Target LO S
Southbound off-ramp at the SR 99/20th Street interchange • For the PM peak hour, the project is anticipated to increase the ramp junction density by 1%. Per the
Significant Impact Threshold Criteria discussed within an earlier section of the report, the project impact at this intersection for Cumulative conditions is less than significant.
• For the Saturday peak hour, the project will cause the ramp junction that was found to be operating at acceptable LOS C under “no project” conditions to deteriorate to LOS F conditions. Per the Significant Impact Threshold Criteria discussed within an earlier section of the report, the project impact at this intersection for Cumulative conditions is significant.
Providing a 2-lane southbound off-ramp (with two lanes exiting the freeway) would yield acceptable operations at the southbound SR 99 off-ramp diverge junction to 20th Street. However, it is not known if these improvements are economically feasible. Until these improvements are constructed, project impacts at this location would remain significant and unavoidable for Cumulative Plus Project conditions. Northbound off-ramp at the SR 99/SR 32 interchange
• For the PM peak hour, the project is anticipated to increase the ramp junction density by 1%. Per the Significant Impact Threshold Criteria discussed within an earlier section of the report, the project impact at this intersection for Cumulative conditions is less than significant. Therefore, no mitigations required.
Weave Segments The following weave junction was found to operate at an undesirable level of service under Cumulative Plus Project conditions.
• Southbound SR 99 weave segment between the Skyway and 20th Street interchanges
Based on a comparison of “no project” vs. “plus project” weave junction levels of service, the following weave junctions which was found to operate unacceptably for Cumulative No Project PM peak hour conditions will experience an increase in density for “plus project” conditions.
WEAVING SEGMENT
% Increase in Density
(DI)SIG?
Northbound SR 99 – between Skyway and 20th
E 43.8 F 43.8 F 0.100% No
Target LOS
PM Peak Hour2018 Plus Prj.
Density (pc/mi/ln)/
LOS
2018 No Prj. Density
(pc/mi/ln)/LOS
The project is anticipated to increase the weave junction density by less than 1% to Cumulative No Project PM peak hour conditions on SR 99 NB between Skyway and 20th Street interchanges. Per the Significant Impact Threshold Criteria discussed within an earlier section of the report, the project impact at this

Chico Wal-Mart Store Expansion Traffic Impact Study Page 64 Pacific Municipal Consultants (R782TS008.DOC/25-5130-10)
intersection for Cumulative conditions is less than significant. Therefore, no mitigations required. PRIVATE INTERSECTIONS Based on the discussion contained under 2010 Plus Project conditions, the following impacts and mitigation measures were identified. Business Lane/ToysRUs Access – No significant impacts were identified. Baney Lane/Wal-Mart Driveways – Due to impacts caused by turning movements at driveways and potential conflicts with queuing at the Forest Avenue/Baney Lane traffic signal, significant impacts were identified which require the following mitigations:
• Relocation and outbound left-turn restriction at the easternmost driveway (intersection 11) • Westbound left-turn pocket at the easternmost driveway • Two-way left-turn lane between the easternmost and central driveway • Outbound left-turn restriction at the central driveway (intersection 10)
These improvements are included in the proposed project site plan. Business Lane/Baney Lane – No significant impacts were identified. 95TH PERCENTILE QUEUE LENGTHS The 95th percentile queues for eastbound left turns and the southbound right turns exceed the available/proposed storage requirements at the Forest Avenue/Baney Lane intersection and the eastbound left turns exceed the available/proposed storage requirements at the Forest Avenue/ Wittmeier Drive/ Talbert Drive intersection.
• The proposed eastbound left turn storage on Baney Lane at Forest Avenue would satisfy the 90th percentile queues for the Saturday peak period and the 95th percentile queues for both AM and PM peak hours. Since queues may only exceed storage during the Saturday peak period under 2020 conditions for approximately 5 to 10 percent of the peak hour, this potential impact can be addressed through retiming of the traffic signal in the future as the condition arises.
• The projected 95th percentile queue length for the southbound right turn at the Forest Avenue/Baney Lane intersection exceeds the available storage for the PM and Saturday peak periods. The appropriate mitigation would be to install right-turn overlap phasing for the southbound right turn lane which would result in acceptable operations.
• The proposed eastbound left turn storage on Wittmeir Drive would satisfy the 90th percentile queues for the Saturday peak period and the 95th percentile queues for both AM and PM peak hours. Since queues may only exceed storage during the Saturday peak period under 2020 conditions for approximately 5 to 10 percent of the peak hour, this potential impact can be addressed through retiming of the traffic signal in the future as the condition arises.
PROJECT ROADWAY IMPROVEMENTS The recommended project circulation improvements that will be constructed before the opening of the expanded Wal-Mart Superstore include the following: Forest Avenue/Wittmeier Drive/Talbert Drive Intersection
• The northbound Forest Avenue approach will provide a through lane, combined through-right lane and a lengthened exclusive left-turn lane (to accommodate the projected 95th percentile queue length).

Chico Wal-Mart Store Expansion Traffic Impact Study Page 65 Pacific Municipal Consultants (R782TS008.DOC/25-5130-10)
• The southbound Forest Avenue approach will provide a through lane, combined through-right lane and a lengthened exclusive left-turn lane (to accommodate the projected 95th percentile queue length).
• The Wittmeier Drive leg of the intersection is approximately 40 feet wide with parking activity on both sides. The cul-de-sac is approximately 425 feet in length before the bulb, with driveways providing access to the south occurring approximately 150 feet west of the intersection. The eastbound Wittmeier Drive approach will need to be improved to provide a left-turn lane, combined left-through lane and a right turn lane for the following reasons:
o The queue will rarely extend past the southern driveways, so will result in fewer conflicts. o The dual left-turn lanes and LOS D conditions for the left-turn are acceptable and will help
in reducing demand at the Baney Lane eastbound left-turn movement at Forest Avenue, which will in turn reduce pressure on the 20th Street/Toys R Us intersection.
To accommodate this improvement, the road cross-section will need to be widened from 40 feet to 64 feet to accommodate 4, 12-foot lanes (three eastbound and one westbound lane) and 2, 8-foot parking shoulders.
• The westbound Talbert Drive approach will provide a left lane and a combined through-right lane. It is also recommended that push buttons be provided to facilitate pedestrian access to/from the site at the intersection. Forest Avenue/Baney Lane Intersection
• The eastbound Baney Avenue approach will include dual 150 foot eastbound left-turn lanes approaching Forest Avenue, with approximately 50 feet leading to the dual lanes and a combined through-right lane. This would still accommodate the 90 percent queuing of 14 vehicles, assuming 25 feet per vehicle.
• The northbound Forest Avenue approach will provide a through lane, combined through-right lane and a lengthened exclusive left-turn lane (to accommodate the projected 95th percentile queue length).
• Overlap phasing for the southbound right turn. Baney Lane The following improvements are recommended for the Baney Lane segment between Forest Avenue and Business Lane:
• Forest to Eastern Driveway – Lane channelizations shown on the June 12, 2007 site plan are adequate and are required to make the Baney Lane intersection with Forest operate acceptably as well as provide westbound left-turn access into Wal-Mart. Specific details of the improvement are provided below:
o Eastbound Baney Lane left-turn at Forest Avenue: Per the site plan, in addition to the 150
feet of dual left-turn lane, there is approximately 50 feet leading to the dual lanes. This would still accommodate the 90 percent queuing of 14 vehicles, assuming 25 feet per vehicle.
o Westbound left-turn: Based on calculations, it was determined that the future maximum queue would be 4 vehicles, or 100 feet As shown in the site plan, there is some transition area leading to the 100 feet of storage which could potentially store one additional vehicle if present. Clearance of the westbound left-turn lane would be aided by the new driveway 'neck' which is about 150 feet with no side conflicts and no left-turns onto Baney Lane.
o Baney Lane: The new site plan shows the “new” eastern driveway approximately midway on the tangent. Any additional movement of the driveway may limit sight distance for westbound left-turning traffic into the driveway.
• Eastern Driveway to Central Driveway – To facilitate efficient movement of through traffic, reduce

Chico Wal-Mart Store Expansion Traffic Impact Study Page 66 Pacific Municipal Consultants (R782TS008.DOC/25-5130-10)
vehicle conflicts, and improve vehicle safety along Baney Lane, it is recommended to widen this segment of Baney Lane to accommodate three lanes (one lane in each direction and a center two way left turn lane). The proposed Galleria project requires the first half for left-turn refuge out of their future driveway while Wal-Mart requires the second half for the left-turn into the central driveway. The need for this center lane can be attributed equally to Wal-Mart and the proposed Galleria project on the north side of Baney Lane resulting from the increase in traffic from both of these developments.
PROJECT SITE ACCESS The project would utilize all of the driveways on Baney Lane, Business Lane and Forest Avenue, as well as two new additional driveways to the south onto Wittmeier Drive as part of the expansion. At present, all of the access points are full access intersections permitting left-turns in and out of the project site, with the exception of the right-in/right-out driveway along Forest Avenue. The main project access to the existing Wal-Mart store is currently provided via the signalized intersection of Forest Avenue/Baney Lane, with traffic traveling to/from the existing Wal-Mart driveways via Baney Lane. To reduce project traffic along Business Lane, the project site plan proposes that the Baney Lane/Wal-Mart Central Driveway and the “new” Baney Lane/Wal-Mart East Driveway be reconstructed with right-turn channelization to prohibit outbound left-turns and force outbound traffic towards Forest Avenue. A review of the proposed project site plan shows that there is adequate internal circulation to allow vehicles to access the westernmost driveway from the main parking lot. Given that this driveway is located away from the main parking area, and thus experiences minimal traffic volumes, the net effect is that while some opportunity is provided to make an outbound left turn toward Business Lane, the actual number of left turns will be minimal and negligible. Due to the potential sight distance issues for the outbound left turn vehicles with the westbound Baney Lane traffic at the Baney Lane/Wal-Mart Central Driveway, and the close intersection spacing between the Baney Lane/Wal-Mart East Driveway and Forest Avenue/Baney Lane intersection, it is recommended that the outbound left turns be physically prohibited through construction of channelizations as shown in the site plan at these two driveways. It is recommended that vehicular movements along the back alley to/from the Baney Lane/Business Lane intersection be restricted to southbound through movements (which was assumed as part of the traffic analysis). To accommodate this restriction, it is recommended that a sign be placed near the south end of the alley stating “WAL-MART TRUCK TRAFFIC ONLY – NO THROUGH VEHICLES”. Whereas traffic from the existing Wal-Mart store can currently exit out via the back alley and Business Lane, implementation of this recommendation would result in the prohibition of northbound movements along the back alley continuing on to Business Lane. No additional recommendations are suggested. PROJECT ON-SITE CIRCULATION As the site plan shows, a major component of the on-site circulation system consists of one-way drive aisles located to the east of the proposed store striped for diagonal parking. As noted within the Project Site Access section, Business Lane and Wittmeier Drive will provide access to the truck docking facilities located along the rear of the store. The primary truck route for the store is via the Baney Lane/Business Lane intersection with trucks continuing south along the back alley to access the truck bays located near the southwestern portion of the store. When departing from the store, it is assumed the trucks will exit primarily via Wittmeier Drive, although departure would be possible via the alley.

Chico Wal-Mart Store Expansion Traffic Impact Study Page 67 Pacific Municipal Consultants (R782TS008.DOC/25-5130-10)
The overall layout of the site provides satisfactory vehicle circulation throughout the project site. The project site plan also provides for a pedestrian system of sidewalks and crosswalks which will channel pedestrians arriving from the new sidewalk/crosswalk system along Forest Avenue to the new store. No additional recommendations are suggested. PROJECT TRUCK TRAFFIC The existing Wal-Mart store currently averages 61 deliveries per week, 31 of which are large 18-wheelers. It is anticipated that the proposed Wal-Mart Supercenter will have an average of 85 deliveries per week, 24 more than the existing store. Of these, it is anticipated that 39 will be large 18-wheelers, which is 8 more than the existing store. As described above, a review of the project site plan shows that the overall layout of the site provides satisfactory truck access and circulation throughout the majority of the site. The existing truck route/fire lane behind the existing store would remain, but it would be extended. A truck turnaround approximately 130 feet in diameter would be designated at the end of the truck route extension, in the southwestern portion of the project site. No additional recommendations are suggested.

APPENDIX (Provided on request)
Intersection Level-Of-Service Worksheets
SR 99 Freeway Mainline Analysis SR 99 Ramps Analysis
Intersection Improvements – Memo