revised diesel engine exhaust particulate matter health
TRANSCRIPT

130 2nd Avenue South Edmonds, WA 98020
(425) 778-0907
August 6, 2018
Prepared for
Oath Holdings, Inc. Microsoft Corporation
Sabey Data Centers Vantage Data Centers, LLC
NTT DATA Services, LLC
Revised Diesel Engine Exhaust Particulate Matter
Health Risk Assessment Report Quincy, Washington

Landau Associates
Diesel Engine Exhaust Particulate Matter Health Risk Assessment Report
Quincy, Washington This document was prepared by, or under the direct supervision of, the technical professionals noted below. Document prepared by: Mark W. Brunner Project Manager *Use project role or billing title (e.g., Project Manager, Primary Author, or Senior Staff Scientist, etc.} Document reviewed by: Charles P. Halbert Principal Reviewer Date: August 6, 2018 Project No.: 1678001.010 File path: P:/1678/001/R/HRA Report 08-06-18 Project Coordinator: Christopher C. Young
Landau Associates
DEEP Health Risk Assessment Report 1678001.010 Quincy, Washington ii August 6, 2018
This page intentionally left blank.

Landau Associates
DEEP Health Risk Assessment Report 1678001.010 Quincy, Washington iii August 6, 2018
TABLE OF CONTENTS
Page
LIST OF ABBREVIATIONS AND ACRONYMS ................................................................................................. vii 1.0 EXECUTIVE SUMMARY ................................................................................................................... 1-1
1.1 Background and Objectives ................................................................................................ 1-1 1.2 Health Impacts Evaluation .................................................................................................. 1-1 1.3 Conclusions ......................................................................................................................... 1-2
2.0 BACKGROUND ................................................................................................................................ 2-1 2.1 Description of Setting ......................................................................................................... 2-1 2.2 Forecast Emission Rates ..................................................................................................... 2-1 2.3 Land Use and Zoning .......................................................................................................... 2-2 2.4 Sensitive Receptor Locations .............................................................................................. 2-3
3.0 AIR DISPERSION MODELING .......................................................................................................... 3-1 3.1 Source Characteristics ........................................................................................................ 3-1 3.2 DEEP Emission Estimates .................................................................................................... 3-1
3.2.1 2016 Actual Emissions (Data Center Operations) .............................................3-2 3.2.2 Projected Full Buildout Emissions (Data Center Operations) ............................3-2 3.2.3 Worst-Case Potential-to-Emit Emissions (Data Center Operations) ..................3-2 3.2.4 Mobile Source Emissions ................................................................................3-2 3.2.5 Regional Background Source Emissions ...........................................................3-4
3.3 Air Dispersion Modeling – Model Setup and Assumptions ................................................ 3-4 3.3.1 Receptor Grid Spacing ....................................................................................3-4 3.3.2 Meteorological Pre-Processing .......................................................................3-5 3.3.3 Building Downwash Pre-Processing .................................................................3-6 3.3.4 Terrain Height Pre-Processing .........................................................................3-7
3.4 Modeling Methodology ...................................................................................................... 3-7 4.0 HEALTH RISK ASSESSMENT ............................................................................................................ 4-1
4.1 Hazard Identification .......................................................................................................... 4-1 4.1.1 Overview of DEEP Toxicity ..............................................................................4-1
4.2 Exposure Assessment ......................................................................................................... 4-2 4.2.1 Identifying Routes of Potential Exposure .........................................................4-2 4.2.2 Estimating DEEP Concentrations .....................................................................4-3 4.2.3 Identifying Potentially Exposed Receptor Locations .........................................4-3 4.2.4 Exposure Frequency and Duration ..................................................................4-4 4.2.5 Cumulative Exposure to DEEP in Quincy ..........................................................4-4
4.3 Dose-Response Assessment ............................................................................................... 4-4 4.3.1 Carcinogenic Toxicity of DEEP .........................................................................4-5 4.3.2 Non-Carcinogenic Toxicity of DEEP..................................................................4-5

Landau Associates
DEEP Health Risk Assessment Report 1678001.010 Quincy, Washington iv August 6, 2018
4.4 Risk Characterization .......................................................................................................... 4-5 4.4.1 Evaluating Non-Cancer Hazards ......................................................................4-6 4.4.2 Quantifying an Individual’s Increased Cancer Risk ...........................................4-6
4.5 Identifying Risk Contributors .............................................................................................. 4-8 5.0 UNCERTAINTY CHARACTERIZATION ............................................................................................... 5-1
5.1 Emission Factor and Exposure Uncertainty ........................................................................ 5-1 5.1.1 Emission Factors ............................................................................................5-1 5.1.2 Exposure Factors ............................................................................................5-1
5.2 Air Dispersion Modeling Uncertainty ................................................................................. 5-2 5.3 Toxicity Uncertainty............................................................................................................ 5-2
5.3.1 DEEP Toxicity Uncertainty ...............................................................................5-3 6.0 SHORT-TERM EXPOSURE TO DEEP ................................................................................................. 6-1 7.0 HEALTH IMPACTS FROM NITROGEN DIOXIDE ............................................................................... 7-1
7.1 NO2 and DEEP Interactions ................................................................................................. 7-1 7.2 NO2 as a Standalone Risk Agent ......................................................................................... 7-1
8.0 SUMMARY OF RESULTS .................................................................................................................. 8-1 8.1 Cumulative Cancer Risk ...................................................................................................... 8-1 8.2 Data Center Contribution to Cancer Risk ........................................................................... 8-1 8.3 Non-Cancer Risk Hazard Quotients .................................................................................... 8-2
9.0 CONCLUSIONS ................................................................................................................................ 9-1 10.0 REFERENCES ................................................................................................................................. 10-1
FIGURES
Figure Title
1 Vicinity Map 2 Study Area 3 Quincy Area Zoning Map 4 Receptor Grid 5 2016 Actual DEEP Concentration Contour Map 6 Projected Actual DEEP Concentration Contour Map 7 Potential-to-Emit DEEP Concentration Contour Map 8 Receptor Locations and Cancer Risk Contributions – Northeast Quincy 9 Receptor Locations and Cancer Risk Contributions
10 Cumulative DEEP Cancer Risk Summary 11 Summary of Data Center Contribution to DEEP Cancer Risks

Landau Associates
DEEP Health Risk Assessment Report 1678001.010 Quincy, Washington v August 6, 2018
TABLES
Table Title
1 Emission Estimates – 2016-Actual Data Center Operations 2 Emission Estimates – Projected-Actual Data Center Operations after Full Buildout 3 Emission Estimates – Worst-Case Data Center Operations Potential-to-Emit 4 2016-Actual DEEP Concentrations at Selected Receptor Locations 5 Projected-Actual DEEP Concentrations at Selected Receptor Locations 6 Worst-Case Potential-to-Emit DEEP Concentrations at Selected Receptor Locations 7 2016-Actual Cancer Risk at Selected Receptor Locations 8 Projected-Actual Cancer Risk at Selected Receptor Locations 9 Worst-Case Potential-to-Emit Cancer Risk at Selected Receptor Locations
10 2016-Actual Non-Cancer Hazard Quotient at Selected Receptor Locations 11 Projected-Actual Non-Cancer Hazard Quotient at Selected Receptor Locations 12 Worst-Case Potential-to-Emit Non-Cancer Hazard Quotient at Selected Receptor Locations
APPENDICES (ON DVD)
Appendix Title
A Data Center Source Information Summary Tables B Models and Emission Summary Tables (AERMOD Plot File Post-Processing) C From Ecology – Presentation of Mobile Source Emissions

Landau Associates
DEEP Health Risk Assessment Report 1678001.010 Quincy, Washington vi August 6, 2018
This page intentionally left blank.

Landau Associates
DEEP Health Risk Assessment Report 1678001.010 Quincy, Washington vii August 6, 2018
LIST OF ABBREVIATIONS AND ACRONYMS
µg/m3 microgram per cubic meter µm micrometer AERMAP AMS/EPA regulatory model terrain pre-processor AERMOD AMS/EPA regulatory model AIRPACT Air Indicator Report for Public Awareness and Community
Tracking AMS American Meteorological Society ASOS Automated Surface Observation System BH building height BNSF BNSF Railway BPIP Building Profile Input Program CFR Code of Federal Regulations Data Center Owners Oath Holdings, Inc., Microsoft Corporation, Sabey Data Centers,
Vantage Data Centers, LLC, and NTT DATA Services, LLC DEEP diesel engine exhaust particulate matter Ecology Washington State Department of Ecology EPA US Environmental Protection Agency GEP Good Engineering Practice GFS gap-filling structure HQ hazard quotient HRA health risk assessment km kilometer LAI Landau Associates, Inc. m meter MW megawatt NO2 nitrogen dioxide NOC Notice of Construction NOx nitrogen oxides NWS National Weather Service OEHHA California Office of Environmental Health Hazard Assessment PBW projected building width PM particulate matter PM2.5 particulate matter with an aerodynamic diameter less than or
equal to 2.5 microns PUD public utility district REL reference exposure level RfC reference concentration SR State Route URF unit risk factor VMT vehicle miles traveled WAC Washington Administrative Code

Landau Associates
DEEP Health Risk Assessment Report 1678001.010 Quincy, Washington viii August 6, 2018
This page intentionally left blank.

Landau Associates
DEEP Health Risk Assessment Report 1678001.010 Quincy, Washington 1-1 August 6, 2018
1.0 EXECUTIVE SUMMARY
1.1 Background and Objectives At the request of Oath Holdings, Inc., Microsoft Corporation, Sabey Data Centers, Vantage Data Centers, LLC, and NTT DATA Services, LLC (Data Center Owners, collectively), Landau Associates, Inc. (LAI) has prepared this Health Risk Assessment (HRA) report. This HRA was completed in response to the Washington State Department of Ecology (Ecology) requirement that some of the Data Center Owners conduct an HRA that evaluates the public health risk to residents from diesel engine exhaust particulate matter (DEEP) emissions in the Quincy, Washington area (Figures 1 and 2), including emissions from data centers, highways, locomotives, and other source categories.
As required by Ecology, this HRA examines the impact of DEEP based on the following three data center emissions scenarios: 2016 Actual Data Center Operations (i.e., a typical emissions scenario based on generators that were installed and operational as of 2016), Projected-Actual Data Center Operations after Full Buildout (i.e., a typical emissions scenario based on the number of generators that have been permitted for installation and operation, including those not yet installed and operating), and Worst-Case Data Center Potential-to-Emit. This HRA also includes DEEP from highway vehicle emissions, locomotive emissions, other mobile sources of DEEP emissions, and regional background levels.
1.2 Health Impacts Evaluation This HRA presents the ambient cancer risks caused by emissions of DEEP based on three data center emission scenarios (described in detail in Section 2.2). Under hypothetical worst-case exposure assumptions1, involving residents standing outside their homes for 70 continuous years, the maximum cancer risks for each of the emission scenarios are as follows:
• 2016 Actual Data Center Operations: The maximum cancer risk associated with the 2016 actual data center operations scenario is 139 per million2,3 at the maximally impacted residential location, the East Quincy residence with maximum cumulative impacts. Emissions
1 Hypothetical worst-case exposure scenarios are often evaluated in HRAs as screening-level evaluations of the acceptability of
risks. A hypothetical worst-case exposure scenario is not representative of any true receptor population and significantly overestimates the likely risks to all receptor populations, including residential receptors. In the event that Ecology considers making risk-management decisions on the basis of this HRA, it should first consider an evaluation of cancer risks associated with more representative exposure scenarios.
2 Cancer risks are quantified based on population statistics, and are expressed herein as the number of incremental cancer cases projected per exposed population of 1 million individuals. Cancer risk then is expressed as a number “per million.”
3 The breadth of data and assumptions on which an HRA is based typically gives confidence in cancer risk estimates to one significant figure (i.e., the confidence in the risk assessment’s accuracy extends only to a single digit). In other words, a calculated value of 139 cancers per million would traditionally be reported simply as 100 per million. The contribution of cancer risks associated with DEEP emissions from data centers is so small, relative to transportation-related risks, that they would not be quantified if the traditional reporting of one significant figure were used in this report. Because this HRA has a special interest in the contributions of cancer risks from data center DEEP emissions, the cumulative risk values reported herein have been expanded to include a presumed accuracy at a resolution of 1 cancer per million.

Landau Associates
DEEP Health Risk Assessment Report 1678001.010 Quincy, Washington 1-2 August 6, 2018
from transportation-related sources of DEEP are the primary risk drivers; the contribution of emissions from the data centers at this location is 0.3 percent.
• Projected-Actual Data Center Operations after Full Buildout: The maximum cancer risk associated with the projected actual data center operations at full buildout is 139 per million, at the maximally impacted location, the East Quincy residence with maximum cumulative impacts. Emissions from transportation-related sources of DEEP are the primary risk drivers; the contribution of emissions from the data centers at this location is 0.5 percent.
• Worst-Case Data Center Potential-to-Emit: The maximum cancer risk associated with the worst-case potential-to-emit (all currently permitted emergency diesel engine generators emitting at their maximum permit limits) is 143 per million at the maximally impacted location, the East Quincy residence with maximum cumulative impacts. Emissions from transportation-related sources of DEEP are the primary risk drivers; the contribution of emissions from the data centers at this location is 3.3 percent.
1.3 Conclusions Health risks associated with DEEP in Quincy are typical of a rural area crisscrossed by highways and freight railroad tracks. The percent of that risk attributable to data centers ranges from 0.3 to 8.4 percent at all maximum cumulatively-impacted receptor locations. The proportion of risks associated with data center emissions increases at locations nearer to the data centers, but the cumulative cancer risk associated with DEEP exposure decreases at those locations because they are farther from transportation-related sources—and transportation-related sources are the primary driver of cancer risks associated with DEEP emissions in Quincy.
DEEP cancer risk in more populated areas is generally higher than DEEP cancer risk in rural areas due to higher traffic and locomotive volumes. A 2010 air toxics study found that typical cancer risks from DEEP in the Seattle and Tacoma area are present at values up to 324 cancers per million (PSCAA 2011). The absolute maximum DEEP-related risk in Quincy—estimated under a hypothetical worst-case emissions scenario that greatly overestimates reasonably-expected risks—is 143 cancers per million, or 44 percent of the typical DEEP-related cancer risks in developed Puget Sound areas.

Landau Associates
DEEP Health Risk Assessment Report 1678001.010 Quincy, Washington 2-1 August 6, 2018
2.0 BACKGROUND
2.1 Description of Setting The Quincy area is strategically suited for data center operations due to the region’s dependable and economical electricity supply and well-developed internet fiber infrastructure. Seven data centers currently operate in or near Quincy (Tables 1 and 2). Due to the sensitive nature and high-reliability needs of data center operations—which include public service functions including financial systems management, government and public infrastructure support, and medical information exchange, among other services—data center “down time” comes at a high cost not only to the business sector, but to the public good. Consequently, data centers require redundant power sources that allow for continuous operation in the event of an electrical failure. Each data center in the Quincy area is equipped with multiple diesel-powered backup generator engines to power the data centers in the event of an electrical failure. The Grant County region has a yearly electrical grid reliability rate of more than 99.99 percent, meaning that the generators are rarely operated due to unplanned power loss; however, generator engines must be tested regularly to ensure that the engines and associated systems will function properly when required.
In response to concerns expressed by MYTAPN4 about the health impacts of DEEP from data centers and other diesel engines operating in Quincy, Ecology has required—as conditions of Notice of Construction (NOC) approval orders—that several Data Center Owners (Oath, Microsoft, and Sabey) complete this HRA. Ecology’s objectives for the HRA are expressed as follows (Ecology 2017a):
[The HRA] analyzes the public health risk to Quincy residents from DEEP emissions in the Quincy area, including emissions from data center engines, highways, locomotives, and other source categories…. The study shall model the locations in the community that experience the highest exposure to DEEP emissions, estimate the health risks associated with that exposure, and apportion the health risks among contributing source categories.
Although Vantage Data Centers and NTT DATA Services have no regulatory requirement to actively participate with Oath, Microsoft, and Sabey in the preparation of this HRA, they have elected to voluntarily contribute to its funding and implementation. LAI prepared this HRA document on behalf of the Data Center Owners.
2.2 Forecast Emission Rates As required by Ecology, this HRA examines the impact of DEEP based on the following three data center emission scenarios:
• 2016 Actual Data Center Operations (i.e., a typical emissions scenario). A typical data center emissions scenario was developed based on the number of generators installed and operational in 2016 and reported emissions in 2016. “Actual” emissions are less than worst-
4 Microsoft-Yes; Toxic Air Pollution-No

Landau Associates
DEEP Health Risk Assessment Report 1678001.010 Quincy, Washington 2-2 August 6, 2018
case “potential-to-emit” emissions because the permits provide for operational scenarios that will manifest in reasonably-expected maximum operations scenarios, not typical operating years (this approach is a necessity so that the data centers can operate in compliance with permit conditions). Additional information related to the development of an emissions dataset for this scenario is provided in Section 3.2.1.
• Projected-Actual Data Center Operations after Full Buildout. The projected-actual buildout data center emissions scenario is based on the anticipated DEEP emissions if all seven data centers installed all engines currently permitted under NOC approval orders. Actual (not potential-to-emit) 2016 emissions were scaled up to include emissions from permitted, but yet to be installed, generators to estimate projected full buildout emissions. Additional information related to the development of an emissions dataset for this scenario is provided in Section 3.2.2.
• Worst-Case Data Center Potential-to-Emit. The worst-case data center emissions scenario is based on the unlikely eventuality that all data centers will install all permitted engines and operate up to their current permit limits every year. For this scenario, DEEP emissions were assumed equal to permit limits for all data centers. The worst-case potential-to-emit scenario is a very conservative evaluation that is virtually impossible to achieve in practice because it would require—for every single data center over a long-term exposure period—operating scenarios that are premised on the concurrent realization of two independently conservative conditions. First, the generators would actually have to run for the maximum number of hours permitted annually; although maximum runtimes were approached and maybe even met at some individual data centers during some individual years, it is highly improbable that the maximum permitted runtimes would be exercised at all of the data centers in a single year, much less for multiple consecutive years. Second, the scenario assumes that every hour of operation for every generator occurs at the load for which DEEP emissions are greatest; because the generators are operated at different loads for different purposes, it is virtually impossible for the generators to operate at the maximum DEEP-emitting rate in any single year. Additional information related to the development of an emissions dataset for this scenario is provided in Section 3.2.3.
Emission estimates for the three scenarios are presented in Tables 1 through 3, and detailed data center information and calculation spreadsheets are provided in Appendices A and B.
This HRA also includes DEEP from highway vehicle and locomotive emissions, and other miscellaneous sources of DEEP emissions (i.e., non-highway roadway traffic, construction, and agricultural equipment). Ecology provided estimates of these non-data center emissions for use by the study team, which is discussed in Section 3.2.4 and Appendix C.
2.3 Land Use and Zoning Zoning in the city of Quincy is shown on Figure 3 and receptor locations of interest are summarized in Tables 4 through 12. The topography of the Quincy area is relatively flat with elevations ranging between approximately 1,300 and 1,400 feet above sea level.
Landau Associates
DEEP Health Risk Assessment Report 1678001.010 Quincy, Washington 2-3 August 6, 2018
2.4 Sensitive Receptor Locations The following sensitive receptor locations were identified for this study, summarized in Tables 4 through 12. The receptor grid is shown on Figure 4. The following sensitive receptor locations are described Section 4.2.3:
• Two (2) residences maximally impacted by data centers
• Two (2) residences maximally impacted by cumulative sources
• One (1) recreational area maximally impacted by cumulative sources
• One (1) commercial area maximally impacted by cumulative sources, excluding receptors within data center boundaries
• One (1) senior center, hospital, or nursing home maximally impacted by cumulative sources
• One (1) student exposure scenario that assumes a student will attend kindergarten through grade 12 in the Quincy School District. The evaluation will conservatively assume that at each grade, the student would attend the grade-appropriate school that is maximally impacted by cumulative sources.

Landau Associates
DEEP Health Risk Assessment Report 1678001.010 Quincy, Washington 3-1 August 6, 2018
3.0 AIR DISPERSION MODELING The following sections describe the modeling process, including sources, emission estimates, model setup and methodology, as approved by Ecology (2017c).
3.1 Source Characteristics The seven permitted data centers operating in the Quincy area, as of 2016, had a total of 114 installed diesel-powered backup generator engines to power the data centers in the event of a power outage, with a total installed capacity of approximately 301 megawatts (MW).
The locations of the seven data centers are shown on Figure 2. Table 1 lists the engines installed at each data center and total installed capacity in 2016. Tables 2 and 3 list the permitted engines and capacity at full buildout. Table 3 lists DEEP or particulate matter (PM) permit limits listed in each data center’s current approval order. Note that some approval orders include specific DEEP emission rates or specify that all PM2.5
5 emissions from diesel engines are considered to be DEEP. When not otherwise specified, all PM2.5 emissions in annual reports or permit limits from diesel engines are considered to be DEEP.
During normal operations, generators are run based on different operating scenarios and at different loads, depending on whether the engines are being run for maintenance, testing, or emergency power generation purposes. Emission rates and stack characteristics (temperature and exit velocity) vary depending on the load at which the engine is running. Because DEEP health risk is the result of long-term exposure, and reference exposure levels are based on annual averages (discussed in Section 4.3.1), the annual emission rates and stack characteristics modeled in this HRA are based on reported average annual operating loads, rather than itemized specific operating scenarios.
In addition to data centers, highway and rail traffic contribute to DEEP emissions in the Quincy area. SR 28 bisects Quincy running east and west and SR 281 partially bisects Quincy running north and south. Railroad tracks owned by BNSF Railway (BNSF) cross Quincy running east-northeast and west-southwest approximately ⅓ mile north of the intersection of SR 28 and SR 281 in the approximate center of Quincy. Diesel trucks running through Quincy on the two highways and diesel locomotives on the railroad tracks contribute significant DEEP emissions in the area. Additionally, diesel trucks operate on local streets, making deliveries to local businesses. DEEP emission estimates from truck and rail traffic, other local traffic, and regional background levels were provided by Ecology (described in Sections 3.2.4 and 3.2.5).
3.2 DEEP Emission Estimates This HRA evaluates three data center emission scenarios (2016 actual emissions, projected full buildout emissions, and worst-case potential-to-emit), as described in Section 2.2 and Tables 1
5 Particulate matter with an aerodynamic diameter less than or equal to 2.5 microns.

Landau Associates
DEEP Health Risk Assessment Report 1678001.010 Quincy, Washington 3-2 August 6, 2018
through 3. Each of those scenarios incorporate air quality impacts associated with DEEP emissions from mobile sources, including from the exhaust of truck engines and locomotives. This HRA also incorporates DEEP emission impacts from other local and regional background sources in the Quincy area.
The method for developing DEEP emission estimates for the HRA evaluation is described below.
3.2.1 2016 Actual Emissions (Data Center Operations)
Actual DEEP emissions from the seven currently permitted data centers in Quincy were based on annual reports for operations in 2016, submitted by each data center to Ecology as part of their reporting requirements under each NOC approval order. The 2016 annual reports include generator run-time and fuel usage data for all installed generator engines and DEEP or PM emissions calculated based on vendor-supplied emission estimates. There are currently no other stationary sources of DEEP emissions with permit coverage in the Quincy area.
3.2.2 Projected Full Buildout Emissions (Data Center Operations)
Full buildout emission estimates for the seven currently permitted data centers were based on the 2016 emission estimates described above, scaled up to include all generators currently listed in the data centers’ NOC approval orders. Emission estimates were scaled for each facility by dividing the total 2016 emissions for that facility by total installed generator MW capacity for the facility (to determine emissions per MW) then multiplying by the total MWs permitted to be installed at that facility. This emissions estimate is a hypothetical, upper-end estimate based on the assumption that each data center will install all the generators allowed under each NOC approval order.
3.2.3 Worst-Case Potential-to-Emit Emissions (Data Center Operations)
The worst-case potential-to-emit scenario is based on the assumption that each currently permitted data center in Quincy will install all currently permitted generator engines, and operate all engines up to the limits allowed by each approval order. This emissions scenario significantly overestimates expected emissions from the data centers, and does not represent a reasonably-likely emissions scenario.
3.2.4 Mobile Source Emissions
Mobile DEEP emission sources that were evaluated in this HRA included exhaust from vehicles traveling through Quincy on SR 28, SR 281, and other local roadways and locomotive exhaust from trains traveling through Quincy on the BNSF railroad tracks. Ecology provided an estimate of DEEP emissions data for mobile emission sources and other local and regional background sources (Ecology 2017b).
Ecology developed emission estimates from vehicles by calculating vehicle miles traveled (VMT) based on 2015 data available from the Washington State Department of Transportation for the average

Landau Associates
DEEP Health Risk Assessment Report 1678001.010 Quincy, Washington 3-3 August 6, 2018
annual daily traffic for roadway links within Quincy. Using the US Environmental Protection Agency (EPA) model Motor Vehicle Emission Simulator, Ecology calculated emission estimates for traffic on SR 28, SR 281, and other local roadways based on the calculated VMT data.
Ecology calculated DEEP emissions from locomotives as part of its triennial emissions inventory for Grant County, which was last conducted in 2014. Additionally, BNSF provided Ecology with fuel usage estimates for railroad track segments. Ecology allocated locomotive DEEP emissions to the Quincy area based on the fuel usage reported by Amtrak and BNSF for those track segments.
Other local mobile-source DEEP emission sources include traffic from local roadways, diesel equipment used for construction and agricultural activities. Ecology created seven separate area sources for inclusion in the model, based on spatial surrogates from AIRPACT’s6 air quality forecasting tool (Ecology 2018).
Due to the difficulty in predicting future emission rates, Ecology requested that LAI make the conservative assumption that mobile-source DEEP emissions will remain constant (i.e., emission standards for locomotives in 2014 and trucks in 2015 will remain unchanged for the entire 70-year study period). It is acknowledged that future DEEP emissions from trucks and locomotives are expected to decline over time due to increased fuel efficiency and improvements in emission control technology.
The EPA documented the expected fleet average emission factors by calendar year from 2006 through 2040 in the EPA’s Emission Factors for Locomotives (EPA 2009a). The emission factors take into account the various tiers of locomotive engines that enter the fleet over time as older locomotives are retired. Based on the projected future DEEP emission factors, LAI estimated that the emission rate from locomotives in the study is overestimated by approximately 70 percent. This estimate was conservatively calculated assuming that the emission rate will be constant after 2040, and fuel usage will remain the same as reported in 2014 for the entire 70-year period.
On-highway diesel particulate matter emission reduction programs between 1990 and 2020 were expected to reduce diesel particulate matter by 94 percent (EPA 2004). Recent regulatory actions ensure that on-highway DEEP emissions will continue to be reduced in coming years. In 2014, the EPA promulgated Tier 3 standards, to be phased in beginning in 2017, which include new light- and heavy-duty vehicle emission standards. As stated in the EPA’s Final Rule for Control of Air Pollution from Motor Vehicles: Tier 3 Motor Vehicle Emission and Fuel Standards (EPA 2014), the fully phased-in Tier 3 heavy-duty vehicle tailpipe emission standards will reduce PM emissions by 60 percent compared to current standards. Reductions will continue beyond 2030 as more Tier 3 vehicles make up most of the
6 Air Indicator Report for Public Awareness and Community Tracking (AIRPACT) is an air quality forecast system implemented in
collaboration with Washington State University, Ecology, and the EPA.

Landau Associates
DEEP Health Risk Assessment Report 1678001.010 Quincy, Washington 3-4 August 6, 2018
fleet. On-highway diesel particulate matter emissions are expected to decrease by at least 60 percent over 70 years.
In summary, the simplifying assumption of a constant, higher-than-expected mobile-source emission rate will significantly overestimate overall risks associated with DEEP concentrations.
3.2.5 Regional Background Source Emissions
Other regional DEEP emission sources located outside of Quincy could also contribute to air impacts within Quincy. Regional DEEP emissions were incorporated using an assumed background impact of 0.03 micrograms per cubic meter (µg/m3), as instructed by Ecology. Ecology developed this background value using a median emission rate for the Quincy area from AIRPACT and applying that value to the study area using AERSCREEN7 (Ecology 2017b).
3.3 Air Dispersion Modeling – Model Setup and Assumptions Air dispersion models were used to predict DEEP concentrations caused by emissions from the modeled sources. The AERMOD8 modeling system was used in general accordance with the EPA’s Guideline on Air Quality Models (EPA 2005) to estimate DEEP concentrations.
The Industrial Source Complex-AERMOD View version 9.2.0 interface provided by Lakes Environmental was used for all air dispersion modeling (Lakes Environmental 1995-2016).
This version of the Lakes Environmental software incorporates the most recent version of AERMOD (version 16216r). AERMOD incorporates the data from a variety of pre-processors (described below) to process meteorological parameters, building downwash parameters, and terrain heights along with emission estimates and physical emission point characteristics to predict ambient impacts. The model was used to estimate ambient DEEP concentrations for a network of receptors based on an annual averaging period, as described in Section 3.4.
3.3.1 Receptor Grid Spacing
The following receptor grid, provided by Ecology, consisted of Cartesian flagpole receptor grids placed at a height of 1.5 meters (m) above ground to approximate the human breathing zone:
• Uniform 50-m spacing within a 4.5 by 4.5-kilometer (km) zone centered on the intersection of SR 28 and SR 281, totaling approximately 32,761 receptor locations.
• Uniform 500-m spacing outside of the 4.5 by 4.5-km zone, extending to approximately 7.5 by 7.5 km, totaling an additional 600 receptor locations.
7 The EPA’s recommended screening model used to produce worst-case concentrations for a single source without using hourly
meteorological data. 8 American Meteorological Society (AMS)/EPA regulatory model.

Landau Associates
DEEP Health Risk Assessment Report 1678001.010 Quincy, Washington 3-5 August 6, 2018
Figure 4 illustrates the extents of the two receptor grids.
3.3.2 Meteorological Pre-Processing
AERMET (version 16216) is the meteorological pre-processor model that estimates boundary layer parameters for use in AERMOD. AERMET processes three types of meteorological input data in three stages and generates two input files for the AERMOD model. The two AERMOD input files produced by AERMET are the Surface File with hourly boundary layer parameter estimates, and the Profile File with multi-level observations of wind speed, wind direction, temperature, and standard deviations of fluctuating wind components. The three types of meteorological data that were used by AERMET are described below.
• National Oceanic and Atmospheric Administration, National Centers for Environmental Information, 1-minute Automated Surface Observation System (ASOS) data from Grant County International Airport in Moses Lake, Washington, located approximately 25 miles from Quincy. Five years (2012-2016) of hourly surface data were processed in AERMET.
‒ AERMINUTE was run to reduce the instance of “calms.” A potential concern related to the use of meteorological data for dispersion modeling is the high incidence of “calms,” or periods of time with low wind speeds. National Weather Service (NWS) and Federal Aviation Administration data coding defines a wind speed of less than 3 knots as “calm” and assign a value of 0 knots. This results in an overestimation of the amount of calm conditions. Similarly, if wind speed is up to 6 knots, but wind direction varies more than 60 degrees during a 2-minute averaging period, wind direction is reported as “missing.” AERMINUTE reprocesses ASOS 1-minute wind data at a lower threshold and calculates hourly average wind speed and directions to supplement the standard hourly data processed in AERMET.
• NWS twice-daily upper air soundings from Spokane, Washington. Five years (2012-2016) of upper air data were processed in AERMET.
• The site-specific data required for AERMET are Albedo, Bowen ratio, and surface roughness. Albedo is a measure of the solar radiation reflected back from earth into space. The Bowen ratio is an evaporation-related measurement and is defined as the ratio of sensible heat to latent heat. The surface roughness length is the theoretical height above ground where the wind speed becomes zero. Site-specific data were approximated based on surface data from the meteorological tower at Grant County International Airport. AERSURFACE was used to approximate the Albedo, Bowen ratio, and surface roughness within 12 equal sectors of a circle that has a 1-km radius and is centered on the surface station tower. Looking at each sector individually, AERSURFACE determined the percentage of land-use type within each sector. Land cover data from the US Geological Survey National Land Cover Data 1992 archives were used as an input to AERSURFACE (USGS 1992). Default seasonal categories were used in AERSURFACE to represent the four seasonal categories as follows: 1) midsummer with lush vegetation; 2) autumn with unharvested cropland; 3) late autumn after frost and harvest, or winter with no continuous snow; and 4) transitional spring with partial green coverage or short annuals.

Landau Associates
DEEP Health Risk Assessment Report 1678001.010 Quincy, Washington 3-6 August 6, 2018
3.3.3 Building Downwash Pre-Processing
Building downwash occurs when the aerodynamic turbulence induced by nearby buildings causes a pollutant emitted from an elevated source to be mixed rapidly toward the ground (downwash), resulting in higher ground-level pollutant concentrations. The software program Building Profile Input Program (BPIP)-PRIME was used to determine if exhaust from emission units would be affected by nearby building structures. In general, these determinations are made if a stack’s height is less than the height defined by the EPA’s Good Engineering Practice (GEP) stack height.
GEP stack height is defined as the height of a nearby structure(s) measured from the ground-level elevation at the base of the stack plus 1.5 times the lesser dimension, height, or projected width of the nearby structure(s). For regulatory applications, a building is considered sufficiently close to a stack to cause wake effects when the distance between the stack and the nearest part of the building is less than or equal to 5 times the lesser of the building height (BH) or the projected width of the building (PBW). BPIP-PRIME considers building downwash for point sources that are within the GEP 5L Area of Influence of a structure. The four types of structures considered are:
• Low simple structures
• Tall simple structures
• Multi-tiered structures
• Groups of structures.
Each structure type produces an area of wake effect influence that extends out to a distance of 5 times L directly downwind from the trailing edge of the structure, where L is the lesser of the BH and PBW. As the wind rotates full circle, each direction-specific area of influence changes and is integrated into one overall area of influence termed the GEP 5L Area of Influence. A line drawn around the limit of the overall GEP 5L Area of Influence is termed the GEP 5L limit line. Any stack that is on or within the limit line is affected by GEP wake effects for some wind directions or range of wind directions.
Wakes from two structures, which are closer than the greater of either structure’s L, are considered to be “sufficiently close” to one another that their wakes act as one wake. Therefore, when the projected widths of the structures do not completely overlie each other, the structures are combined and the gap between the two structures is treated as if the gap had been filled with a structure equal in height to the lower structure. Otherwise, the two structures are processed separately.
BPIP-PRIME creates a gap-filling structure (GFS) by connecting each pair of structures on a corner-to-corner basis and/or corner-perpendicular-to-the-other-side basis. In some cases, the GFS can be just two dimensions, height and width. The most outward parts of the lines form the perimeter of the GFS. The GFS perimeter is used together with the perimeters of the connected structures to determine the GEP 5L Area of Influence. Flags are also placed to identify which stacks are being influenced by which structures. To identify which stacks are in the GEP 5L Area of Influence, a system was devised that

Landau Associates
DEEP Health Risk Assessment Report 1678001.010 Quincy, Washington 3-7 August 6, 2018
identifies each structure and its tiers, locates these in a coordinate system, and then processes the structure and tier data to calculate:
• GEP stack heights
• Building heights
• Projected building widths
• Projected building lengths
• The along-flow distance from the stack to the center of the upwind face of the projected building
• The across-flow distance from the stack to the center of the upwind face of the projected building.
Information in this section was obtained from the EPA, Electric Power Research Institute, and Lakes Environmental guidance documents.
For the HRA, buildings on all Quincy data center properties were included in the model.
3.3.4 Terrain Height Pre-Processing
To model complex terrain, AERMOD requires information about the surrounding terrain. This information includes a height scale and a base elevation for each receptor location. The AMS/EPA regulatory model terrain pre-processor (AERMAP) was used to obtain a height scale and the base elevation for a receptor location, and to develop receptor grids with terrain effects.
Digital topographical data for the analysis region were obtained from the Web GIS website (www.webgis.com) and processed for use in AERMOD. The Shuttle Radar Topography Mission data used for this project will have a resolution of approximately 30 m (1 arc-second).
AERMAP produces a receptor output file (*.rou) containing the calculated terrain elevations and scale height for each receptor. The .rou file was used as an input runstream file (AERMOD input file) for the receptor pathway in the terrain options page of the control pathway. AERMAP also produces a source output file (*.sou). This file contains the calculated base elevations for all sources.
3.4 Modeling Methodology The maximum annual average DEEP concentrations were estimated using AERMOD for each scenario described in Sections 3.2.1 through 3.2.3.
Because exposure to DEEP is associated with chronic health risk and cancer risk, health risks for DEEP are estimated based on long-term exposure to DEEP concentrations. Long-term average DEEP concentrations are modeled in AERMOD by setting the model to calculate an annual average exposure concentration at each receptor location. To ensure each model run evaluates the full range of potential meteorological conditions over the course of a year, the data center emergency generator
Landau Associates
DEEP Health Risk Assessment Report 1678001.010 Quincy, Washington 3-8 August 6, 2018
annual emission rates were converted to constant hourly emission rates for input into AERMOD, which were then modeled over 8,760 hours per year with an annual averaging period. For data centers with more than one size of generator, emissions were apportioned to each generator stack based on the generator size expressed in MW.
The stack temperature and exit velocity were assigned for each emergency generator based on the average operating load reported to Ecology in each data center’s annual report. If operating load information was not available in each data center’s annual report, a mid-range operating load was assumed for the purposes of assigning a stack temperature and exit velocity.

Landau Associates
DEEP Health Risk Assessment Report 1678001.010 Quincy, Washington 4-1 August 6, 2018
4.0 HEALTH RISK ASSESSMENT This HRA was conducted in a manner consistent with the approach described in Washington Administrative Code (WAC) 173-460-090 and guidance provided by Ecology. This HRA addresses the public health risk associated with exposure to DEEP from the currently permitted data center emergency diesel engine generators and existing sources of DEEP in the Quincy area. The HRA generally follows the four steps of the standard health risk assessment approach proposed by the National Academy of Sciences (NRC 1983, 1994). These four steps are: 1) hazard identification; 2) exposure assessment; 3) dose-response assessment; and 4) risk characterization. As described later in this document, this HRA did not consider exposure pathways other than inhalation.
4.1 Hazard Identification Hazard identification involves gathering and evaluating toxicity data on the types of health injury or disease that may be produced by a chemical, and on the conditions of exposure under which injury or disease is produced. It may also involve characterization of the behavior of a chemical within the body and the interactions it undergoes with organs, cells, or even parts of cells. This information may be of value in determining whether the forms of toxicity known to be produced by a chemical agent in one population group or in experimental settings are also likely to be produced in human population groups of interest. Note that risk is not assessed at this stage. Hazard identification is conducted to determine whether and to what degree it is scientifically correct to infer that toxic effects observed in one setting will occur in other settings (e.g., whether chemicals found to be carcinogenic or teratogenic in experimental animals would likely be carcinogenic in adequately exposed humans).
4.1.1 Overview of DEEP Toxicity
Diesel engines emit very small, fine (smaller than 2.5 micrometers [µm]) and ultrafine (smaller than 0.1 µm) particles. These particles can enter deep into the lungs when inhaled. Mounting evidence indicates that inhaling fine particles can cause numerous adverse health effects.
Studies of humans and animals specifically exposed to DEEP show that diesel particles can cause both acute and chronic health effects including cancer. Ecology has summarized these health effects in a document titled Concerns about Adverse Health Effects of Diesel Engine Emissions (Ecology 2008).
The health effects listed below have been associated with exposure to very high concentrations of diesel particles, primarily in industrial workplace settings (e.g., underground mines that use diesel equipment) with concentrations much higher than the ambient levels potentially caused by data centers and other sources of DEEP in Quincy.
• Inflammation and irritation of the respiratory tract
• Eye, nose, and throat irritation along with coughing, labored breathing, chest tightness, and wheezing
• Decreased lung function

Landau Associates
DEEP Health Risk Assessment Report 1678001.010 Quincy, Washington 4-2 August 6, 2018
• Worsening of allergic reactions to inhaled allergens
• Asthma attacks and worsening of asthma symptoms
• Heart attack and stroke in people with existing heart disease
• Lung cancer and other forms of cancer
• Increased likelihood of respiratory infections
• Male infertility
• Birth defects
• Impaired lung growth in children.
It is important to note that the estimated levels of DEEP emissions from sources in Quincy were much lower than levels associated with many of the health effects listed above. For the purpose of determining whether cumulative DEEP impacts are acceptable, non-cancer hazards and cancer risks are quantified and presented in the remaining sections of this document.
4.2 Exposure Assessment An exposure assessment involves estimating the extent that the public is exposed to a chemical substance emitted from a facility. This includes:
• Identifying routes of exposure
• Estimating long- and/or short-term offsite pollutant concentrations
• Identifying exposed receptors
• Estimating the duration and frequency of receptors’ exposure.
It is difficult to characterize the amount of time that people will be exposed to DEEP emissions from various sources in Quincy. The EPA’s Air Toxics Risk Assessment Reference Library, Community-Scale Assessment suggests development of an exposure model that combines air dispersion modeling with demographic information about people and activity patterns in the study area (EPA 2006). As described below, this analysis used zoning and land use information for the city of Quincy (Figure 3) with the exposure frequencies for each receptor type shown in Section 4.4.2.1 to develop a conservative exposure scenario for each maximally impacted receptor.
4.2.1 Identifying Routes of Potential Exposure
Humans can be exposed to chemicals in the environment through inhalation, ingestion, or dermal contact. The primary route of exposure to most air pollutants is inhalation; however, some air pollutants may also be absorbed through ingestion or dermal contact. Ecology uses guidance provided in California’s Air Toxics Hot Spots Program Guidance Manual for Preparation of Health Risk Assessments (CalEPA 2015; accessed January 16, 2018) to determine which routes and pathways of exposure to assess for chemicals emitted from a facility.

Landau Associates
DEEP Health Risk Assessment Report 1678001.010 Quincy, Washington 4-3 August 6, 2018
DEEP consists of ultra-fine particles (approximately 0.1 to 1 micron in size) that behave like a gas. Particles do not settle out of the downwind plume by gravity. The primary route of exposure to DEEP is inhalation. Although ingestion or dermal contact can occur when DEEP particles are slowly removed from the atmosphere by deposition onto the ground surface by either molecular diffusion or incorporation into rain droplets, inhalation remains the primary pathway for DEEP exposure. The deposition process is slow and likely occurs many miles downwind of sources. At those far downwind distances, the resulting DEEP concentrations in the surface soil will likely be indistinguishable from regional background values. Therefore, only the inhalation pathway is evaluated in this HRA.
4.2.2 Estimating DEEP Concentrations
To estimate where pollutants will disperse after they are emitted, LAI conducted air dispersion modeling, as described in Section 3.0, which incorporated emissions, meteorological, geographical, and terrain information to estimate pollutant concentrations downwind from a source. Figures 5 through 7 show color-coded maps of estimated annual-average DEEP concentrations in the Quincy area under each emissions scenario.
4.2.3 Identifying Potentially Exposed Receptor Locations
There are several different zoning and land-use types within the city of Quincy, including residential, commercial, institutional, and recreational locations where people could be exposed to DEEP emissions. Figure 3 shows zoning in the Quincy area; however land use also takes into account residences located in areas zoned for other uses. The following receptor locations were evaluated as part of this HRA (summarized in Tables 4 through 6 and shown on Figures 8 and 9):
• Two (2) residences maximally impacted by data centers (one each in east and west Quincy; see Figures 8 and 9)
• Two (2) residences maximally impacted by cumulative sources (one each in east and west Quincy; see Figures 8 and 9)
• One (1) recreational area maximally impacted by cumulative sources (East Park, 724 F Street SE)
• One (1) commercial area maximally impacted by cumulative sources, excluding receptors within data center boundaries (Chevron station at the corner of State Route [SR] 28 and SR 281)
• One (1) senior center, hospital, or nursing home maximally impacted by cumulative sources (Quincy Senior Center, 522 F Street SE)
• One (1) student exposure scenario that assumes a student will attend kindergarten through grade 12 in the Quincy School District. The evaluation will conservatively assume that at each grade, the student would attend the grade-appropriate school that is maximally impacted by cumulative sources (Pioneer Elementary School, 224 J Street SE; Quincy Junior High, 16 Sixth Avenue SE; Quincy Technical High School, 404 1st Avenue SW).

Landau Associates
DEEP Health Risk Assessment Report 1678001.010 Quincy, Washington 4-4 August 6, 2018
4.2.4 Exposure Frequency and Duration
This analysis considers the land use in Quincy to estimate the amount of time a given receptor could be exposed. For example, a receptor is likely to be exposed more frequently and for a longer duration if the DEEP emissions source impacts residential locations—in comparison to other land-use types—because people spend much of their time at home. DEEP concentrations present at industrial or commercial properties in the area are likely to represent an exposure opportunity only during the hours that individuals spend working on those properties.
This analysis uses simplified assumptions about receptors’ exposure frequency and duration and assumes that people at residential receptor locations are potentially continuously exposed, meaning they never leave their property. These behaviors are not typical; however, these assumptions are intended to conservatively overestimate risks to residential receptors for preliminary evaluation purposes. Workplace and other non-residential exposures are also considered, but adjustments are often made because the amount of time that people spend at these locations is more predictable than time spent at their homes. These adjustments are described in Section 4.4.2 when quantifying cancer risk from intermittent exposure to DEEP.
4.2.5 Cumulative Exposure to DEEP in Quincy
Tables 4 through 6 show the calculated cumulative DEEP concentrations in Quincy, which includes all currently permitted data centers as well as nearby highways, the railroad line, and other background sources of DEEP. Figures 5 through 7 present cumulative DEEP contours within the modeling domain. The maximum cumulative concentration at the maximally impacted residence in Quincy, associated with the worst-case potential-to-emit emission scenario, is estimated at 0.48 µg/m3. However, at that location, most of the DEEP exposure is due to emissions from trucks traveling on nearby SR 28 and other local traffic, and only approximately 3 percent of the DEEP exposure is due to emissions from data center sources.
As part of the risk assessment, Ecology will consider all the cumulative impacts of DEEP emissions in the Quincy vicinity. Chapter 173-460 WAC does not currently have a numerical limit on allowable cumulative cancer risks.
4.3 Dose-Response Assessment Dose-response assessment describes the quantitative relationship between the amounts of exposure to a substance (the dose) and the incidence or occurrence of injury (the response). The process often involves establishing a toxicity value or criterion to use in assessing potential health risk. Tables 7 through 9 show calculated lifetime cancer risk from DEEP exposure, and Tables 10 through 12 show non-cancer hazard quotient values for DEEP.

Landau Associates
DEEP Health Risk Assessment Report 1678001.010 Quincy, Washington 4-5 August 6, 2018
4.3.1 Carcinogenic Toxicity of DEEP
The California Office of Environmental Health Hazard Assessment (OEHHA) derived a unit risk factor (URF) for estimating cancer risk from exposure to DEEP. The URF is based on a meta-analysis of several epidemiological studies of humans occupationally exposed to DEEP. URFs are expressed as the upper-bound probability of developing cancer, assuming continuous lifetime exposure to a substance at a concentration of 1 µg/m3, and are expressed in units of inverse concentration (i.e., [µg/m3]-1). OEHHA’s URF for DEEP is 0.0003 (µg/m3)-1 meaning that a lifetime of exposure to 1 µg/m3 of DEEP results in an increased individual cancer risk of 0.03 percent or a population risk of 300 excess cancer cases per million people exposed.
As of February 2003, the EPA does not provide a quantitative estimate of carcinogenic risk from inhalation exposure to DEEP, due to the absence of adequate data (EPA 2003). Therefore, the OEHHA URF has been used in this risk assessment.
In this document, cancer risks are reported using scientific notation to quantify the increased cancer risk of an exposed person, or the number of excess cancers that might result in an exposed population. For example, a cancer risk of 1 x 10⁻⁶ means that if 1 million people are exposed to a carcinogen, one excess cancer might occur, or a person’s chance of getting cancer in their lifetime increases by 1 in 1 million or 0.0001 percent. Note that these estimates are for excess cancers that might result in addition to those normally expected in an unexposed population.
4.3.2 Non-Carcinogenic Toxicity of DEEP
The EPA and OEHHA developed non-carcinogenic toxicological values for DEEP evaluated in this project (CalEPA 1998; EPA; accessed August 23, 2016; 2002). These toxicological values are derived from studies of animals that were exposed to a known amount (concentration) of DEEP, or from epidemiological studies of exposed humans, and are intended to represent a level at or below which non-cancer health effects are not expected, and a metric by which to quantify increased risk from exposure to emissions.
The EPA’s reference concentration (RfC) and OEHHA’s reference exposure level (REL) for diesel engine exhaust (measured as DEEP) was derived from dose-response data on inflammation and changes in the lungs from rat inhalation studies. Each agency established a level of 5 µg/m3 as the concentration of DEEP in air at which long-term exposure is not expected to cause non-cancer health effects (EPA; accessed January 18, 2018; 2009b).
4.4 Risk Characterization Risk characterization involves the integration of data analyses from each step of the HRA to determine the likelihood that the human population in question will experience any of the various health effects associated with a chemical under its known or anticipated conditions of exposure.

Landau Associates
DEEP Health Risk Assessment Report 1678001.010 Quincy, Washington 4-6 August 6, 2018
4.4.1 Evaluating Non-Cancer Hazards
In order to evaluate the potential for non-cancer health effects that may result from exposure to DEEP, exposure concentrations at each receptor location—for each emissions scenario—were compared to the RfC characterizing the non-cancer toxicity of DEEP (5 µg/m3). If a concentration exceeds the RfC or REL, this indicates only the potential for non-cancer health effects. The magnitude of this potential can be inferred from the degree to which this value is exceeded. This comparison is known as a hazard quotient (HQ) and is given by the equation below.
𝐻𝐻𝐻𝐻 =𝐶𝐶𝐶𝐶𝐶𝐶𝐶𝐶𝐶𝐶𝐶𝐶𝐶𝐶𝐶𝐶𝐶𝐶𝐶𝐶𝐶𝐶𝐶𝐶𝐶𝐶 𝐶𝐶𝑜𝑜 𝑝𝑝𝐶𝐶𝑝𝑝𝑝𝑝𝑝𝑝𝐶𝐶𝐶𝐶𝐶𝐶𝐶𝐶 𝐶𝐶𝐶𝐶 𝐶𝐶𝐶𝐶𝐶𝐶 (𝜇𝜇𝜇𝜇/𝑚𝑚3)
𝑅𝑅𝑜𝑜𝐶𝐶,𝑀𝑀𝑅𝑅𝑀𝑀, 𝐶𝐶𝐶𝐶 𝑅𝑅𝑅𝑅𝑀𝑀
An HQ of 1 or less indicates that the exposure to a substance is not expected to result in non-cancer health effects. As the HQ increases above 1, the potential for adverse human health effects increases by an undefined amount, but the manifestation of non-cancer health effects is considered possible. An HQ above 1 would not necessarily result in health impacts due to the application of uncertainty factors in deriving toxicological reference values (RfC or REL) and because the non-cancer health effects may affect only a small fraction of the receptor population.
The non-cancer or chronic HQ for DEEP exposure was calculated using the following equation:
𝐶𝐶ℎ𝐶𝐶𝐶𝐶𝐶𝐶𝐶𝐶𝐶𝐶 𝐻𝐻𝐻𝐻 =𝐴𝐴𝐶𝐶𝐶𝐶𝑝𝑝𝐶𝐶𝑝𝑝 𝐶𝐶𝑎𝑎𝐶𝐶𝐶𝐶𝐶𝐶𝜇𝜇𝐶𝐶 𝐷𝐷𝑅𝑅𝑅𝑅𝐷𝐷 𝐶𝐶𝐶𝐶𝐶𝐶𝐶𝐶𝐶𝐶𝐶𝐶𝐶𝐶𝐶𝐶𝐶𝐶𝐶𝐶𝐶𝐶𝐶𝐶𝐶𝐶 (𝜇𝜇𝜇𝜇/𝑚𝑚3)
5 𝜇𝜇𝜇𝜇/𝑚𝑚3
HQs were calculated for the receptor locations listed in Section 4.2.3. Because chronic toxicity values (RfCs and RELs) are based on a continuous exposure, an adjustment is sometimes necessary or appropriate to account for shorter receptor exposure periods (i.e., people working at business/ commercial properties who are exposed for only 8 hours per day, 5 days per week). While EPA risk assessment guidance recommends adjusting to account for periodic instead of continuous exposure, OEHHA does not employ this practice. For the purpose of this evaluation, an RfC or REL of 5 µg/m3 was used as the chronic risk-based concentration for all scenarios where receptors could be exposed frequently (e.g., residences, work places, or schools).
Tables 10 through 12 show chronic HQs at the maximally exposed receptor locations attributable to DEEP exposure from data centers and all background sources. HQs are significantly lower than 1 for all receptors’ cumulative exposure to DEEP. This indicates that non-cancer effects are not expected to result from chronic exposure to DEEP in Quincy.
4.4.2 Quantifying an Individual’s Increased Cancer Risk
Cancer risk is estimated by determining the concentration of DEEP at each receptor point and multiplying it by its respective URF. Because URFs are based on continuous exposure over a 70-year lifetime, exposure duration and exposure frequency are important considerations.

Landau Associates
DEEP Health Risk Assessment Report 1678001.010 Quincy, Washington 4-7 August 6, 2018
The formula used to determine cancer risk is as follows:
𝑅𝑅𝐶𝐶𝑅𝑅𝑅𝑅 =𝐶𝐶𝐴𝐴𝐴𝐴𝐴𝐴 𝑥𝑥 𝑈𝑈𝑅𝑅𝑈𝑈 𝑥𝑥 𝑅𝑅𝑈𝑈1 𝑥𝑥 𝑅𝑅𝑈𝑈2 𝑥𝑥 𝑅𝑅𝐷𝐷
𝐴𝐴𝐴𝐴
The exposure frequencies for each receptor type are shown below, based on Ecology’s judgment from review of published risk evaluation guidelines.
Exposure Frequencies for Each Receptor Type
Parameter Description
Value Based on Receptor Type
Units Residential Worker School-
Staff School- Student Hospital
CAir Concentration in air at the receptor See Tables 4 through 6 µg/m3
URF Unit Risk Factor 0.0003 (µg/m3)-1
EF1 Exposure Frequency 365 250 200 180 365 Days/Year
EF2 Exposure Frequency 24 8 8 8 24 Hours/Day
ED Exposure Duration 70 40 40 7 (Elem) 4 (HS & College)
1 Years
AT Averaging Time 613,200 Hours
Current regulatory practice assumes that a very small dose of a carcinogen will give a very small cancer risk. Cancer risk estimates are, therefore, not yes or no answers but measures of chance (probability). Such measures, however uncertain, are useful in determining the magnitude of a cancer threat because any level of a carcinogenic contaminant carries an associated risk. The validity of this approach for all cancer-causing chemicals is not clear. Some evidence suggests that certain chemicals considered carcinogenic must exceed a threshold of tolerance before initiating cancer. For such chemicals, risk estimates are not appropriate. Guidelines on cancer risk from the EPA reflect the potential that thresholds for some carcinogenesis exist. However, the EPA still assumes no threshold unless sufficient data indicate otherwise.
Tables 7 through 9 show the cumulative cancer risks for each maximally impacted receptor location and the contribution from each DEEP emission source. This accounts for currently permitted DEEP emissions from data centers, railroad and roadway diesel traffic emissions, and other local DEEP emission sources. A summary of estimated cancer risks at the residential, commercial, and institutional receptor locations with maximum cumulative impacts is shown below, based on the worst-case, not-to-exceed scenario.

Landau Associates
DEEP Health Risk Assessment Report 1678001.010 Quincy, Washington 4-8 August 6, 2018
Estimated Cancer Risks at Selected Receptors
Receptor Description
Worst-Case Not-to-Exceed
Cancer Risk in Total per Million
% Attributed to Data Centers
% Attributed to BNSF, SR 28, SR 281
Residence with Maximum Cumulative Impacts (East Quincy Residence) 143 3.3% 43.2%
Commercial Area with Maximum Cumulative Impacts (Chevron Station at SR 28 and SR 281) 21 4.2% 50.9%
Institutional Receptor with Maximum Cumulative Impacts (Quincy Senior Center) 2.0 3.2% 43.9%
4.5 Identifying Risk Contributors As described above, multiple sources (data centers, highway, railroad, and other background sources) contribute to DEEP exposure at each receptor location. The EPA’s Air Toxics Risk Assessment Reference Library, Community-Scale Assessment (EPA 2006) describes the process of identifying which sources are responsible for most of the risk (called source apportionment analysis). For this HRA, the impacts of DEEP from each source (data centers, SR 28, and SR 281, the railroad line, and other background sources) were modeled individually. Ambient concentrations of DEEP were then summed in order to identify the maximally impacted receptor locations listed in Tables 4 through 12 and shown on Figures 8 and 9. Modeled impacts from each individual source were then compared to the total impacts at each receptor location to develop the source contributions shown in the tables and figures.
Landau Associates
DEEP Health Risk Assessment Report 1678001.010 Quincy, Washington 5-1 August 6, 2018
5.0 UNCERTAINTY CHARACTERIZATION Many factors of the HRA are prone to uncertainty. Uncertainty relates to the lack of exact knowledge regarding many of the assumptions used to estimate the human health impacts of DEEP emissions from the proposed project and “background” sources of DEEP. The EPA’s Air Toxics Risk Assessment Reference Library Technical Resource Manual (EPA 2004) defines the following four categories of uncertainty:
• Scenario uncertainty is a result of incomplete information needed to fully define exposure and/or risk (Section 5.1).
• Model uncertainty is related to uncertainty associated with air modeling (Section 5.2), as well as uncertainty associated with toxicity research using animals, limited populations, or dose response (Section 5.3).
• Parameter uncertainty refers to the modelers’ inability to estimate precise values for certain variables. Parameter uncertainty plays a role in emission factor and modeling uncertainty (Sections 5.1 and 5.2).
• Decision-rule uncertainty is related to the various choices policy-makers and modelers make when planning, conducting and reporting the results of a risk assessment.
The assumptions used in the HRA generally tend to overestimate the health risks presented herein.
5.1 Emission Factor and Exposure Uncertainty
5.1.1 Emission Factors
Emission factors are one of the major uncertainties for DEEP emitted by diesel engines. The modeled emission rates for DEEP emissions associated with data center operations were based on the upper range of vendor estimates for all three emissions scenarios. Use of the upper-end emission estimates without consideration for the lower emission rates that are actually achieved in practice based on load-specific operations results in a significant overestimate of DEEP emissions from data centers. Use of upper-end emission factors in this HRA is expected to result in estimates of data center-related emissions that overstate risks by as much as a factor of 4.
Uncertainty is also associated with emissions from highway and rail traffic and other sources of DEEP emissions in Quincy. Emission estimates used in this assessment were conservatively based on current vehicle emission rates; however, vehicle engines are constantly improving in order to comply with increasingly strict emission standards. Emission factors used to estimate DEEP emission rates for rail and highway traffic are expected to overestimate the actual DEEP emission rates—and associated risks—by more than 70 and 60 percent, respectively.
5.1.2 Exposure Factors
The values used to quantify frequency and duration of exposure to DEEP concentrations tend to overestimate exposure—and, therefore, risk—for each of the exposure scenarios evaluated:
Landau Associates
DEEP Health Risk Assessment Report 1678001.010 Quincy, Washington 5-2 August 6, 2018
residential, occupational, recreational, and institutional (schools and care facilities). The following list highlights the extent to which individual exposure factors may be reasonably expected to overestimate exposure and risk for typical receptor populations:
• Residential Receptor Populations
‒ An exposure frequency of 24 hours per day, 365 days per year is likely to overestimate location-specific exposure by at least 4 percent for even a non-working residential receptor population, which typically spends at least 14 days per year away from home.
‒ An exposure duration of 70 years is likely to overestimate location-specific exposure by at least 40 percent. Reasonable upper-end estimates (95th percentile values) of residential occupancy periods at a single location range between 33 and 46 years; mean values range between 12 and 13 years (EPA 2011).
• Occupational Receptor Populations: An exposure duration of 40 years is likely to overestimate location-specific exposure by at least 30 percent. Occupational mobility statistics show that the overall median occupational tenure is less than 10 years, and that the highest recommended value for median occupational tenure is 30 years (EPA 2011).
• Other Receptor Populations (Hospitals)
‒ A hospital patient population’s exposure frequency and duration of 24 hours per day for a full year is likely to overestimate exposure by a factor of up to 70 or more. The average length of stay for inpatient hospitalizations is less than 5 days (AHRQ 2011).
‒ A transient receptor population’s exposure frequency and duration of 500 hours per year for 30 years is a very conservative estimate that is likely to overestimate population risks by a large margin.
In short, the exposure factors used in this HRA tend to overestimate exposure—and, therefore, risk—to a very significant degree.
5.2 Air Dispersion Modeling Uncertainty The transport of pollutants through the air is a complex process. Regulatory air dispersion models have been developed to estimate the transport and dispersion of pollutants as they travel through the air. Even if all of the numerous input parameters to an air dispersion model are known, random effects found in the real atmosphere will introduce uncertainty. The models are frequently updated as techniques that are more accurate become known, but are developed to avoid underestimating the modeled impacts.
5.3 Toxicity Uncertainty One of the largest sources of uncertainty in any risk evaluation is associated with the scientific community’s limited understanding of the toxicity of most chemicals in humans following exposure to the low concentrations generally encountered in the environment. To account for uncertainty when developing toxicity values (e.g., RfCs), the EPA and other agencies apply “uncertainty” factors to doses or concentrations that were observed to cause non-cancer effects in animals or humans. The EPA
Landau Associates
DEEP Health Risk Assessment Report 1678001.010 Quincy, Washington 5-3 August 6, 2018
applies these uncertainty factors so that it derives a toxicity value that is considered protective of humans including susceptible populations. By default, then, quantified estimates of a chemical’s toxicity tend to overestimate the actual expected toxicity of that chemical based on empirical evidence.
5.3.1 DEEP Toxicity Uncertainty
In the case of the DEEP RfC, the EPA acknowledges (EPA 2002):
… the actual spectrum of the population that may have a greater susceptibility to diesel exhaust (DE) is unknown and cannot be better characterized until more information is available regarding the adverse effects of diesel particulate matter (DPM) in humans.
Quantifying DEEP cancer risk is also uncertain. Although the EPA classifies DEEP as probably carcinogenic to humans, it has not established a URF for quantifying cancer risk. In its health assessment document, the EPA determined that “human exposure-response data are too uncertain to derive a confident quantitative estimate of cancer unit risk based on existing studies” (EPA 2002). However, the EPA suggested that a URF based on existing DEEP toxicity studies would range from 1 x 10⁻⁵ to 1 x 10⁻³ per µg/m3. OEHHA’s DEEP URF (3 x 10⁻⁴ per µg/m3) falls within the higher end of this range. Regarding the range of URFs, the EPA states in its health assessment document for diesel exhaust (EPA 2002):
Lower risks are possible and one cannot rule out zero risk. The risks could be zero because (a) some individuals within the population may have a high tolerance to exposure from [diesel exhaust] and therefore not be susceptible to the cancer risk from environmental exposure, and (b) although evidence of this has not been seen, there could be a threshold of exposure below which there is no cancer risk.
In short, the toxicity values used in this HRA could overestimate or underestimate the actual toxicity associated with DEEP. The body of evidence presented in current scientific literature suggests that the use of OEHHA’s URF for DEEP is more likely to overestimate associated risks than to underestimate them.

Landau Associates
DEEP Health Risk Assessment Report 1678001.010 Quincy, Washington 6-1 August 6, 2018
6.0 SHORT-TERM EXPOSURE TO DEEP As discussed previously, exposure to DEEP can cause both acute and chronic adverse health effects. However, as discussed in Section 4.3.1, reference toxicological values specifically for DEEP exposure at short-term or intermediate intervals (e.g., 24-hour values) do not currently exist. Therefore, short-term risks from DEEP exposure are not quantified in this assessment.

Landau Associates
DEEP Health Risk Assessment Report 1678001.010 Quincy, Washington 7-1 August 6, 2018
7.0 HEALTH IMPACTS FROM NITROGEN DIOXIDE Nitrogen dioxide (NO2) is a red-brown gas that is present in diesel exhaust. It forms when nitrogen, present in diesel fuel and a major component of air, combines with oxygen to produce oxides of nitrogen (NOx). NO2 and other oxides of nitrogen are of concern for ambient air quality because they are part of a complex chain of reactions responsible for the formation of ground-level ozone. Additionally, exposure to NO2 can cause both long-term (chronic) and short-term (acute) health effects. Long-term exposure to NO2 can lead to chronic respiratory illness such as bronchitis and increase the frequency of respiratory illness due to respiratory infections.
This section describes 1) the potential for additive or synergistic toxicity effects between NO2 and DEEP, and 2) the potential for NO2 to present material health risks in its own right.
7.1 NO2 and DEEP Interactions The acute non-cancer effects of NO2 are similar to the acute non-cancer effects of DEEP, described in Section 4.1.1. Specifically, NO2 and DEEP both cause respiratory inflammation and irritation, and may contribute to asthmatic symptoms. Because NO2 and DEEP affect the respiratory system in a similar manner, it is reasonable to expect an additive effect when exposed to both pollutants simultaneously. NO2 has not been classified as a carcinogen; therefore, there are no additive cancer risks associated with concurrent inhalation of NO2 and DEEP. No research was found to indicate the existence of interactive or synergistic effect (greater than the sum of the individual effects) between NO2 and DEEP.
The EPA’s RfC and OEHHA’s REL for diesel engine exhaust (see Section 4.3.2) are based on studies examining the overall toxicity of diesel engine exhaust, which includes NOx and other air contaminants (CalEPA 1998). Therefore, the REL discussed in Section 4.3.2 takes into consideration the health impacts of NO2 present in diesel engine exhaust. In other words, the additive effect of exposure to NO2 and DEEP, when diesel engine exhaust is the source of both pollutants, is negligible because the toxicity factors for DEEP are already premised on concurrent exposure to NO2 in the diesel exhaust.
Because the primary sources of NO2 and DEEP are diesel engine exhaust emissions for acute exposures in the Quincy area, and because the DEEP toxicity factors were developed in the presence of diesel exhaust-related NO2, there is no need to incorporate additive effects of NO2 and DEEP exposure in this HRA. Because NO2 is not classified as a carcinogen, and because there are no known toxicological synergistic effects between NO2 and DEEP, there is no need to adjust DEEP-related cancer risk estimates based on concurrent exposure to NO2.
7.2 NO2 as a Standalone Risk Agent Health impact assessments conducted as part of recent air permit applications show that power outage emissions present the greatest potential for producing high enough short-term concentrations

Landau Associates
DEEP Health Risk Assessment Report 1678001.010 Quincy, Washington 7-2 August 6, 2018
of NO2 to be of concern for susceptible individuals, such as people with asthma. Power outages requiring simultaneous use of emergency generators at multiple data centers in the Quincy area must coincide with specific weather conditions to result in high NO2 concentrations. The Grant County Public Utility District (PUD) has a power reliability of more than 99.99 percent each year (2009 to 2016) and a Customer Average Interruption Duration Index (or average duration of power interruption per customer) of 1.3 to 5 hours over the same period (Grant County PUD 2017). The probability of a power outage (with an occurrence frequency of less than 0.01 percent) occurring in the same hour as weather conditions conducive to maintaining elevated NO2 concentrations (with an occurrence frequency of about 2.4 percent9) is about 0.00024 percent. In other words, the average frequency of occurrence at which those two conditions would occur concurrently is once every 47 years.
The PUD’s county-wide power reliability data apply to all customers over the PUD’s service area; in other words, any one power outage may impact only a small number of customers, which may or may not include some or all of the Quincy data centers. Oath and Microsoft provided historical power outage data for actual planned and unplanned power outages. Oath provided outage data from 2011 through 2017 and Microsoft provided outage data from 2008 through 2017 for the Columbia and MWH data centers. During that period of time, the three data centers experienced a combined total of 6 unplanned and 19 planned (maintenance) hours of facility-wide power outages, totaling approximately 25 hours. The longest single outage was a planned 5½-hour outage affecting only the Microsoft Columbia facility. The only utility outage that occurred simultaneously at all three data centers was due to high winds and that lasted about 1½ hours.
Hours of whole-facility power outage at Microsoft (2008-2017) and Oath (2011-2017) Data Centers
Microsoft Columbia Microsoft MWH Oath
Total hours of power outage
Planned Unplanned Planned Unplanned Planned Unplanned
6 2.6 0.5 1.3 12 2.5
The historical outage data provided by Microsoft and Oath indicate that the actual frequency of power outages affecting all Quincy data centers simultaneously during unfavorable weather conditions would be significantly less than our assumption based on data provided by Grant County PUD.
In short, the likelihood of generating NO2 concentrations of concern is so small that human health risks associated with NO2 exposure in the Quincy area are not expected to be significant. NO2 health risks, therefore, are not evaluated further in this HRA.
9 Meteorological conditions conducive to elevated NO2 concentrations are based on evaluations using a meteorological dataset
from 2001 to 2005.
Landau Associates
DEEP Health Risk Assessment Report 1678001.010 Quincy, Washington 8-1 August 6, 2018
8.0 SUMMARY OF RESULTS
8.1 Cumulative Cancer Risk The residences and businesses that are exposed to the highest cumulative cancer risk are located near the railroad tracks, SR 281, and SR 28, in locations where most of the cancer risk is attributable to trucks, trains, and traffic on other local roadways. The total average cumulative DEEP cancer risks for the maximally exposed receptor locations are listed in Tables 7 through 9.
This HRA evaluated three emission scenarios, varying estimated data center emissions for each scenario, but using the same non-data center emission factors for all scenarios.
• 2016 Actual Data Center Operations. Cancer risk at maximally exposed receptor locations range from 1.1 per million at the maximally impacted school (Quincy Technical High School) to 139 per million at the maximally impacted residence (East Quincy residence).
• Projected-Actual Data Center Operations after Full Buildout. Cancer risk at maximally exposed receptor locations range from 1.1 per million at the maximally impacted school (Quincy Technical High School) to 139 per million at the maximally impacted residence (East Quincy residence).
• Worst-Case Data Center Potential-to-Emit. Cancer risk at maximally exposed receptor locations range from 1.2 per million at the maximally impacted school (Quincy Technical High School) to 143 per million at the maximally impacted residence (East Quincy residence).
For this HRA, both a projected-actual and a worst-case potential-to-emit scenario were evaluated; however, the projected-actual scenario is most representative of a conservative, upper-bound estimate of reasonably likely risks. As discussed in Sections 3.2 and 5.1.1, emission estimates for the worst-case potential-to-emit scenario is based the assumption that each data center will install all currently permitted generator engines and operate all engines up to the limits allowed by each approval order. This emissions scenario significantly overestimates expected emissions from the data centers, and does not represent a reasonably-likely emissions scenario. The projected-actual emission scenario is based on actual 2016 emission estimates, scaled up to include all generators listed in each data center’s NOC approval order, providing a more representative estimate of DEEP emissions and cancer risk in the Quincy area.
Figure 10 shows cumulative cancer risk contours relative to zoning and land use in the Quincy area, based on the projected-actual emissions scenario.
8.2 Data Center Contribution to Cancer Risk As noted above, the modeled worst-case DEEP concentrations in Quincy caused solely by emissions from the currently permitted data centers at the maximally impacted residences, businesses, and sensitive receptor locations range from 0.0014 to 0.14 µg/m3. As presented in Tables 7 through 9, the increased cancer risk associated with DEEP emissions from data centers in Quincy is approximately 3.3 percent of the total cumulative DEEP cancer risk at the maximum cumulatively impacted residential

Landau Associates
DEEP Health Risk Assessment Report 1678001.010 Quincy, Washington 8-2 August 6, 2018
receptor location (East Quincy residence), and between 0.3 and 8.4 percent at all maximum cumulatively impacted receptor locations. Based on the conservatively representative projected-actual scenario, DEEP concentrations from data centers range from 0.0023 to 0.064 µg/m3 at maximally impacted locations, and cancer risk associated with DEEP emissions from data centers at the maximum cumulatively impacted receptor locations ranges between 0.51 and 0.9 percent.
DEEP concentrations at the receptor locations maximally impacted by data centers range from 0.10 to 0.34 µg/m3. Cancer risk factors at the same locations range between 31 and 103 per million for all scenarios, or between 31 and 39 per million for the projected-actual scenario. The contribution of data center emissions to the total cancer risk ranges between 6.1 and 66.8 percent for all scenarios, or between 14 and 49 percent for the projected-actual scenario at these receptor locations.
Figure 11 shows cancer risk contours relative to zoning and land use in the Quincy area due to DEEP emissions from data centers, based on the projected-actual emissions scenario.
8.3 Non-Cancer Risk Hazard Quotients The maximum HQ at any maximally impacted receptor location is 0.11. The maximum HQ related to data centers at any maximally impacted receptor location is 0.021. This evaluation demonstrates that the probability that data centers in Quincy could cause non-cancer health impacts is very low.

Landau Associates
DEEP Health Risk Assessment Report 1678001.010 Quincy, Washington 9-1 August 6, 2018
9.0 CONCLUSIONS Tables 7 through 9 and 10 through 12 show the cancer risk and non-cancer (chronic) risk attributable to each source of DEEP in Quincy at the identified receptor locations. Cancer risk ranges from 1.1 to 143 per million at the maximally impacted receptor locations. Non-cancer risk ranges from 0.021 to 0.11 at the maximally impacted receptor locations. The percent of that risk attributable to data centers ranges from 0.3 and 8.4 percent at all maximum cumulatively impacted receptor locations.
Health risks associated with DEEP in Quincy are typical of a rural area crisscrossed by highways and freight railroad tracks. DEEP cancer risk in more populated areas is generally higher than DEEP cancer risk in rural areas due to higher traffic and locomotive volumes. A 2010 air toxics study found that typical cancer risks from DEEP in the Seattle and Tacoma area are present at values up to 324 cancers per million (PSCAA 2011). The absolute maximum DEEP-related risk in Quincy—estimated under a hypothetical worst-case emissions scenario that greatly overestimates reasonably-expected risks—is 143 cancers per million, or 44 percent of the typical DEEP-related cancer risks in developed Puget Sound areas.

Landau Associates
DEEP Health Risk Assessment Report 1678001.010 Quincy, Washington 10-1 August 6, 2018
10.0 REFERENCES AHRQ. 2011. Healthcare Cost and Utilization Project Facts and Figures: Statistics on Hospital-Based
Care in the United States, 2009. Agency for Healthcare Research and Quality.
CalEPA. 1998. Staff Report: Initial Statement of Reasons for Rulemaking: Proposed Identification of Diesel Exhaust as a Toxic Air Contaminant. Air Resources Board and Office of Environmental Health Hazard Assessment, California Environmental Protection Agency. June.
CalEPA. 2015. Air Toxics Hot Spots Program Risk Assessment Guidelines: Guidance Manual for Preparation of Health Risk Assessments. Air, Community, and Environmental Research Branch, Office of Environmental Health Hazard Assessment, California Environmental Protection Agency. February. http://oehha.ca.gov/media/downloads/crnr/2015guidancemanual.pdf.
Ecology. 2008. White Paper: White Paper: Concerns about Adverse Health Effects of Diesel Engine Emissions. Publication No. 08-02-032. Air Quality Program, Washington State Department of Ecology. December 3.
Ecology. 2017a. Letter: Quincy Community Health Risk Assessment. From Jolaine Johnson, to Senior Community Relations and Datacenter Development Manager, Yahoo! Data Center. January 18.
Ecology. 2017b. "Re: Quincy DEEP Health Risk Assessment Protocol." From Ranil Dhammapala, Air Quality Program, Washington State Department of Ecology, to Mark Brunner, Associate, Landau Associates, Inc. December 22.
Ecology. 2017c. Letter: Quincy WA Diesel Particulate Health Risk Assessment Protocol. From Chris Hanlon-Meyer, to Landau Associates, Inc. November 14.
Ecology. 2018. "Re: Quincy DEEP Health Risk Assessment Protocol." From Ranil Dhammapala, Air Quality Program, Washington State Department of Ecology, to Mark Brunner, Associate, Landau Associates, Inc. January 12.
EPA. "Integrated Risk Information System." US Environmental Protection Agency. https://www.epa.gov/iris.
EPA. 2002. Health Assessment Document for Diesel Engine Exhaust. Publication No. EPA/600/8-90/057F. Office of Research and Development National Center for Environmental Assessment, US Environmental Protection Agency. May.
EPA. 2003. Integrated Risk Information System Chemical Assessment Summary: Diesel Engine Exhaust; CASRN N.A. Section II: Carcinogenicity Assessment for Lifetime Exposure. National Center for Environmental Assessment, US Environmental Protection Agency. February 28.
EPA. 2004. Air Toxics Risk Assessment Reference Library. Volume 1: Technical Resource Manual. Publication No. EPA-453-K-04-001A. Air Quality Assessment Division Office of Air Quality Planning and Standards, Emissions Standards Division, US Environmental Protection Agency. April.
EPA. 2005. Revision to the Guideline on Air Quality Models: Adoption of a Preferred General Purpose (Flat and Complex Terrain) Dispersion Model and Other Revisions: Final Rule. US Environmental Protection Agency. 40 CFR Part 51. November 9.
EPA. 2006. Air Toxics Risk Assessment Reference Library. Volume 3: Community-Scale Assessment. Publication No. EPA-452/K-06-001C. Air Quality Assessment Division Office of Air Quality Planning and Standards, Health and Environmental Impacts Division, US Environmental Protection Agency. April.
Landau Associates
DEEP Health Risk Assessment Report 1678001.010 Quincy, Washington 10-2 August 6, 2018
EPA. 2009a. Emission Factors for Locomotives. Publication No. EPA-420-F-09-025. Office of Transportation and Air Quality, US Environmental Protection Agency. April.
EPA. 2009b. Final: Risk Assessment Guidance for Superfund (RAGS). Volume I: Human Health Evaluation Manual; Part F: Supplemental Guidance for Inhalation Risk Assessment. EPA-540-R-070-002; OSWER 9285.7-82. US Environmental Protection Agency. January.
EPA. 2011. Exposure Factors Handbook: 2011 Edition. Publication No. EPA/600/R-090/052F. Office of Research and Development National Center for Environmental Assessment, US Environmental Protection Agency. September.
EPA. 2014. Final Rule: Control of Air Pollution from Motor Vehicles: Tier 3 Motor Vehicle Emission and Fuel Standards. US Environmental Protection Agency. 40 CFR Parts 79, 80, 85, 86, 600, 1036, 1037, 1039, 1042, 1048, 1054, 1065, and 1066. Federal Register, 23414-23886. April 28.
Grant County PUD. 2017. Grant County PUD System Reliability Indices Numbers. Grant County Public Utility District.
Lakes Environmental. 1995-2016. AERMOD View: Gaussian Plume Air Dispersion Model. 9.2.
NRC. 1983. Risk Assessment in the Federal Government: Managing the Process. Washington, DC: National Research Council, National Academy of Sciences.
NRC. 1994. Science and Judgment in Risk Assessment. Washington, DC: National Research Council Committee on Risk Assessment of Hazardous Air Pollutants.
PSCAA. 2011. 2010 Study of Air Toxics in Tacoma and Seattle. Puget Sound Clean Air Agency. March 1.
USGS. 1992. National Land Cover Data 1992. US Geological Survey. https://www.mrlc.gov/nlcd1992.php.

Data Source: ESRI World Imagery
DEEP Health Risk AssessmentQuincy, Washington Vicinity Map
Figure1
0 22,000 44,000
Scale in Feet
G:\Pro
jects\
1678\
001\01
0\F01
VicMa
p.mxd
3/19
/2018
!
!
!
!
!QuincyTacoma
SpokaneSeattleEverett
Study Area
Study Area
Washington

£¤281
£¤28
Data Source: ESRI World Imagery, Grant County GIS
DEEP Health Risk AssessmentQuincy, Washington Study Area
Figure2
0 6,300 12,600
Scale in FeetG:\Pro
jects\
1678\
001\01
0\F02
StudyA
rea.m
xd 3/
19/20
18
Note1. Black and white reproduction of this color original may reduce its effectiveness and lead to incorrect interpretation.
LegendData Centers
Study Area
County Road
State Road
BNSF Railroad Tracks
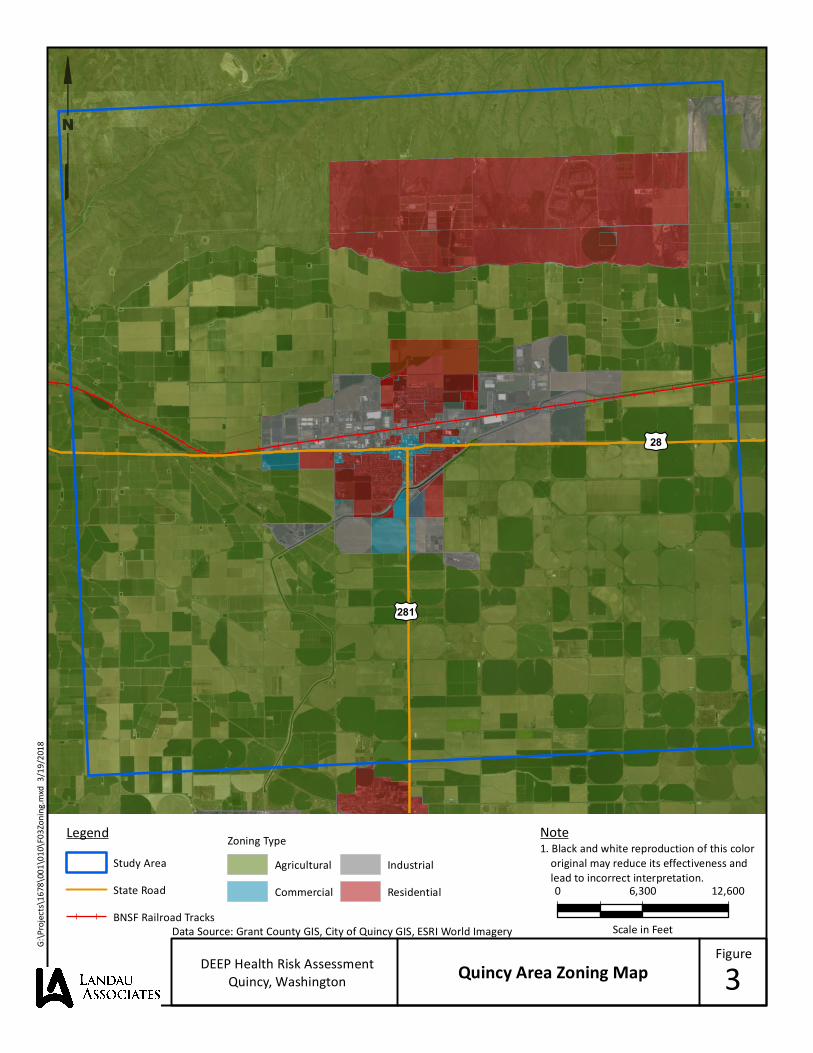
£¤28
£¤281
Data Source: Grant County GIS, City of Quincy GIS, ESRI World Imagery
DEEP Health Risk AssessmentQuincy, Washington Quincy Area Zoning Map
Figure3
0 6,300 12,600
Scale in Feet
Note1. Black and white reproduction of this color original may reduce its effectiveness and lead to incorrect interpretation.
G:\Pro
jects\
1678\
001\01
0\F03
Zoning
.mxd
3/19
/2018
LegendStudy AreaState RoadBNSF Railroad Tracks
Zoning TypeIndustrialResidential
AgriculturalCommercial

£¤281
£¤28
Data Source: ESRI World Imagery, Grant County GIS
DEEP Health Risk AssessmentQuincy, Washington Receptor Grid
Figure4
0 6,400 12,800
Scale in FeetG:\Pro
jects\
1678\
001\01
0\F04
RecGri
d.mxd
3/19
/2018
Note1. Black and white reproduction of this color original may reduce its effectiveness and lead to incorrect interpretation.
Receptor Grid TypeNarrow Spacing (uniform 50-meter spacing)Wide Spacing (uniform 500-meter spacing)
LegendData Centers
County RoadState Road
BNSF Railroad Tracks

£¤281
£¤28
0.05
0.025
0.01
0.0075
0.5
0.25
0.1
0.075
0.05
0.50.25
0.05
0.025
0.025
0.0033 0.0033
0.1
Data Source: ESRI World Imagery, Grant County GIS, Risk Assessment AERMOD Results
DEEP Health Risk AssessmentQuincy, Washington
2016 Actual DEEPConcentration Contour Map
Figure5
Note1. Black and white reproduction of this color original may reduce its effectiveness and lead to incorrect interpretation.
0 2,800 5,600
Scale in Feet
G:\Pro
jects\
1678\
001\01
0\F05
Y2016
_DEEP
.mxd
3/19/
2018
LegendData CentersCounty Road
State RoadBNSF Railroad Tracks
DEEP Concentration Contours0.05 µg/m3
0.075 µg/m3
0.1 µg/m3
0.25 µg/m3
0.5 µg/m3
0.0033 µg/m3
0.0075 µg/m3
0.01 µg/m3
0.025 µg/m3

£¤281
£¤28
0.10.075
0.05
0.01
0.0075
0.025
0.05
0.5
0.25
0.05
0.025 0.025
0.1
Data Source: ESRI World Imagery, Grant County GIS, Risk Assessment AERMOD Results
DEEP Health Risk AssessmentQuincy, Washington
Projected Actual DEEPConcentration Contour Map
Figure60 2,800 5,600
Scale in Feet
G:\Pro
jects\
1678\
001\01
0\F06
PA_DE
EP.mx
d 3/19
/2018
Note1. Black and white reproduction of this color original may reduce its effectiveness and lead to incorrect interpretation.
LegendData CentersCounty Road
State RoadBNSF Railroad Tracks
DEEP Concentration Contours0.05 µg/m3
0.075 µg/m3
0.1 µg/m3
0.25 µg/m3
0.5 µg/m3
0.0033 µg/m3
0.0075 µg/m3
0.01 µg/m3
0.025 µg/m3

£¤281
£¤280.1
0.0750.05
0.01
0.0075
0.025
0.01
0.5
0.25
0.05
0.0075
0.05
0.025
0.025
0.01
0.25
DEEP Health Risk AssessmentQuincy, Washington
Potential-to-Emit DEEPConcentration Contour Map
Figure70 2,800 5,600
Scale in Feet
G:\Pro
jects\
1678\
001\01
0\F07
PTE_D
EEP.m
xd 3/
19/201
8
Note1. Black and white reproduction of this color original may reduce its effectiveness and lead to incorrect interpretation.Data Source: ESRI World Imagery, Grant County GIS, Risk Assessment AERMOD Results
LegendData CentersCounty Road
State RoadBNSF Railroad Tracks
DEEP Concentration Contours0.0075 µg/m3
0.01 µg/m3
0.025 µg/m3
0.05 µg/m3
0.075 µg/m3
0.1 µg/m3
0.25 µg/m3
0.5 µg/m3

Receptor Locations and Cancer Risk Contributions
Northeast QuincyFigure8
0 950 1,900
Scale in FeetG:\Pro
jects\
1678\
001\01
0\F08
RecLoc
_Risk
Cont.
mxd 3
/19/20
18
Note1. Black and white reproduction of this color original may reduce its effectiveness and lead to incorrect interpretation.
Data Source: ESRI World Imagery, Grant County GIS, Risk Assessment AERMOD Results
DEEP Health Risk AssessmentQuincy, Washington
1
1. East-Quincy Residence with Maximum Impacts from Data Centers
2016
Projected Actual
Potential to Emit
Total Risk(per million)
6139
31
Contributions to Cancer Risk
LegendReceptorData Centers County Road
BNSF Railroad Tracks
Data CentersBNSFState Route 28State Route 281Other RoadwaysRegional Background

D St NW
Centr
al Av
e N
B St NE
C St NE
A St NE
2a
D St SW
B St SW
Centr
al Av
e S
1st Ave SW
2nd A
ve SE
D St SE
H St SW
I St SW
1st Av
e SW
I St SE
G St SE
J St SE
L St SE
1st Av
e SE
4th Av
e SE
6th Av
e SE H St SE
C St SE
10
64b4a
8
3 7
9
5
2b
D St NW
13thl
Ave S
WRd
R NW
£¤28
£¤281
2. West-Quincy Residence with Maximum Impacts from Data Centers
4. West-Quincy Residence with Maximum Cumulative Impacts
5. Recreational Area with Maximum Cumulative Impacts (East Park)
3. East-Quincy Residence with Maximum Cumulative Impacts
39
139
122
2.6
63
139
122
2.6
103
143
131
2.7
Total Risk (per million)2016
Projected Actual
Potential to Emit
2016
Projected Actual
Potential to Emit
a
b
a
2016
Projected Actual
Potential to Emit
2016
Projected Actual
Potential to Emit
a
b
a
DEEP Health Risk AssessmentQuincy, Washington
Receptor Locations and Cancer Risk Contributions
Figure90 1,600 3,200
Scale in Feet
G:\Pro
jects\
1678\
001\01
0\F09
RecLoc
_Risk
Cont.
mxd 4
/3/201
8
Note1. Black and white reproduction of this color original may reduce its effectiveness and lead to incorrect interpretation.Data Source: ESRI World Imagery, Grant County GIS, Risk Assessment AERMOD Results
Percent Contributions to Cancer Risk
10. High School with Maximum Cumulative Impacts (Quincy Technical)
6. Commercial Area with Maximum Cumulative Impacts (Chevron Station at SR 28 & SR 281)
7. Senior, Hospital, or Nursing Home Area with Maximum Cumulative Impacts (Quincy Senior Center)
8. Elementary School with Maximum Cumulative Impacts (Pioneer Elementary)
9. Junior High School with Maximum Cumulative Impacts (Quincy Junior High)
2016
Projected Actual
Potential to Emit
2016
Projected Actual
Potential to Emit
2016
Projected Actual
Potential to Emit
2016
Projected Actual
Potential to Emit
20
2016
Projected Actual
Potential to Emit
2.0
1.7
1.6
1.1
20
2.0
1.7
1.6
1.1
21
2.0
1.7
1.6
1.2
Data CentersBNSFState Route 28State Route 281Other RoadwaysRegional Background
LegendReceptor
Data Centers
County Road
State Road
BNSF Railroad Tracks

£¤281
£¤28
DEEP Health Risk AssessmentQuincy, Washington
Cumulative DEEPCancer Risk Summary
Figure100 1,800 3,600
Scale in Feet
G:\Pro
jects\
1678\
001\01
0\F10
PA_Can
cerRis
k.mxd
3/23/
2018
Note1. Cancer risk shown is based on the "Projected-Actual"
modeling scenario.Data Source: ESRI World Imagery, Grant County GIS, Risk Assessment AERMOD Results
2. Black and white reproduction of this color original may reduce its effectiveness and lead to incorrect interpretation.
LegendData Centers
BNSF Railroad
County Road
State Road > 100
10 - 100
Cancer Risk (per million)0 - 1
1 - 10

£¤281
£¤28
DEEP Health Risk AssessmentQuincy, Washington
Summary of Data Center Contribution to DEEP Cancer Risks
Figure110 1,800 3,600
Scale in Feet
G:\Pro
jects\
1678\
001\01
0\F11
PA_DC
oCanc
erRisk
.mxd
3/19
/2018
Data Source: ESRI World Imagery, Grant County GIS, Risk Assessment AERMOD Results
Note1. Cancer risk shown is based on the "Projected-Actual"
modeling scenario.2. Black and white reproduction of this color original
may reduce its effectiveness and lead to incorrect interpretation.
LegendData Centers
BNSF Railroad
County Road
State Road
10 - 25
Cancer Risk (per million)0 - 1
1 - 10

Table 1
Emission Estimates – 2016 Actual Data Center Operations
Quincy, Washington
Page 1 of 1
Data Center
No. of Generators
in 2016 Engine Model
Generator
Capacity (MW)
Emissions per
Generator (ton/yr)
Intuit Data Centers 6 MTU Detroit Diesel 16V4000 G83 2.5 0.008
Microsoft Columbia 35 Caterpillar 3516C 2.5 0.002
1 Caterpillar C27ATAAC 0.75 0.005
16 Caterpillar 3516C‐HD‐TA 2.5 0.016
4 Caterpillar 3516C‐TA 2 0.013
NTT DATA Services 5 Caterpillar C175‐16 3 0.003
6 Caterpillar 3512C 1.5 0.002
10 Caterpillar 3516C 2 0.003
Vantage Data Centers 5 MTU 20V4000 3 0.012
22 MTU Detroit Diesel 16V4000 G83 B3 2 0.001
2 Caterpillar 3516C 2 0.001
2 Caterpillar C175 2.75 0.002
Total Installed 114 263.75
Abbreviations and Acronyms:
MW = megawatts
ton/yr = tons per year
Microsoft MWH
Sabey Data Centers
Oath Holdings
04/06/18 P:\1678\001\R\HRA Report\Quincy HRA_tbs.xlsx 1 Emiss Est 2016 Landau Associates

Table 2
Emission Estimates – Projected‐Actual Data Center Operations after Full Buildout
Quincy, Washington
Page 1 of 1
Data Center
No. of Permitted
Generators Engine Model
Generator
Capacity (MW)
Emissions per
Generator
(ton/yr)
Intuit Data Centers 9 MTU Detroit Diesel 16V4000 G83 2.5 0.008
Microsoft Columbia 37 Caterpillar 3516C 2.5 0.002
1 Caterpillar C27ATAAC 0.75 0.005
40 Caterpillar 3516C‐HD‐TA 2.5 0.016
4 Caterpillar 3516C‐TA 2 0.013
NTT DATA Services 5 Caterpillar C175‐16 3 0.003
6 Caterpillar 3512C 1.5 0.002
38 Caterpillar 3516C 2 0.003
Vantage Data Centers 17 MTU 20V4000 3 0.012
23 MTU Detroit Diesel 16V4000 G83 B3 2 0.001
20 Caterpillar 3516C 2 0.001
5 Caterpillar C175 2.75 0.002
Total 205 474.5
Abbreviations and Acronyms:
MW = megawatts
ton/yr = tons per year
Microsoft MWH
Sabey Data Centers
Oath Holdings
04/06/18 P:\1678\001\R\HRA Report\Quincy HRA_tbs.xlsx 2 Emiss Est PA Landau Associates

Table 3
Emission Estimates – Worst‐Case Data Center Operations Potential‐to‐Emit
Quincy, Washington
Page 1 of 1
Data Center
No. of
Permitted
Generators Engine Model
Generator
Capacity
(MW)
Emissions per
Generator
(ton/yr)
DEEP or PM
Permit Limit
(ton/yr)
Intuit Data Centers 9 MTU Detroit Diesel 16V4000 G83 2.5 0.067 0.60
Microsoft Columbia 37 Caterpillar 3516C 2.5 0.028 1.03
1 Caterpillar C27ATAAC 0.75 0.006
40 Caterpillar 3516C‐HD‐TA 2.5 0.019
4 Caterpillar 3516C‐TA 2 0.015 0.81
NTT DATA Services 5 Caterpillar C175‐16 3 0.025 0.13
6 Caterpillar 3512C 1.5 0.007
38 Caterpillar 3516C 2 0.010 0.41
Vantage Data Centers 17 MTU 20V4000 3 0.013 0.23
23 MTU Detroit Diesel 16V4000 G83 B3 2 0.036
20 Caterpillar 3516C 2 0.036
5 Caterpillar C175 2.75 0.050 1.80
Total 205 474.5
Abbreviations and Acronyms:
DEEP = diesel engine exhaust particulate matter
MW = megawatts
PM = particulate matter
ton/yr = tons per year
Microsoft MWH
Sabey Data Centers
Oath Holdings
04/06/18 P:\1678\001\R\HRA Report\Quincy HRA_tbs.xlsx 3 Emiss Est PTE Landau Associates

Table 4
2016‐Actual DEEP Concentrations at Selected Receptor Locations
Quincy, Washington
Page 1 of 1
Receptor Description E (m) N (m) Total
Data
Centers
Total without
Data Centers BNSF SR 28 SR 281
Other
Roadways
Regional
Background
(1) East Quincy Residence with Maximum Impacts from Data Centers 287000 5236700 0.103 0.036 0.067 0.015 0.007 0.001 0.014 0.03
(2a) West Quincy Residence with Maximum Impacts from Data Centers 283500 5236050 0.210 0.013 0.198 0.025 0.014 0.003 0.125 0.03
(3) East Quincy Residence with Maximum Cumulative Impacts 284650 5235050 0.462 0.002 0.461 0.025 0.174 0.007 0.225 0.03
(4a) West Quincy Residence with Maximum Cumulative Impacts 283900 5234950 0.406 0.003 0.403 0.024 0.108 0.030 0.212 0.03
(5) Recreational Area with Maximum Cumulative Impacts (East Park) 285100 5235050 0.350 0.001 0.348 0.025 0.193 0.004 0.097 0.03
(6) Commercial Area with Maximum Cumulative Impacts (Chevron station at SR 28 and SR 281) 284000 5235000 0.535 0.002 0.532 0.025 0.161 0.097 0.219 0.03
(7) Senior Center, Hospital or Nursing Home Area with Maximum Cumulative Impacts (Quincy Senior Center) 284800 5235050 0.458 0.001 0.456 0.025 0.176 0.006 0.219 0.03
(8) Elementary School with Maximum Cumulative Impacts (Pioneer Elementary) 284300 5234650 0.337 0.002 0.336 0.018 0.037 0.018 0.233 0.03
(9) Junior High School with with Maximum Cumulative Impacts (Quincy Junior High) 284900 5235300 0.318 0.001 0.316 0.036 0.051 0.004 0.195 0.03
(10) High School with Maximum Cumulative Impacts (Quincy Technical) 284000 5235150 0.391 0.003 0.388 0.030 0.098 0.022 0.208 0.03
Abbreviations and Acronyms:
µg/m3 = micrograms per cubic meter
DEEP = diesel engine exhaust particulate matter
E = eastm = meters
N = northSR = State RouteUTM = universal transverse mercator
UTM DEEP Impacts (µg/m3) Attributed to Each Source
04/06/18 P:\1678\001\R\HRA Report\Quincy HRA_tbs.xlsx 4 2016 DEEP Landau Associates

Table 5
Projected‐Actual DEEP Concentrations at Selected Receptor Locations
Quincy, Washington
Page 1 of 1
Receptor Description E (m) N (m) Total
Data
Centers
Total without
Data Centers BNSF SR 28 SR 281
Other
Roadways
Regional
Background
(1) East Quincy Residence with Maximum Impacts from Data Centers 287000 5236700 0.132 0.065 0.067 0.015 0.007 0.001 0.014 0.03
(2b) West Quincy Residence with Maximum Impacts from Data Centers 282350 5236250 0.131 0.019 0.112 0.017 0.012 0.002 0.051 0.03
(3) East Quincy Residence with Maximum Cumulative Impacts 284650 5235050 0.463 0.002 0.461 0.025 0.174 0.007 0.225 0.03
(4a) West Quincy Residence with Maximum Cumulative Impacts 283900 5234950 0.407 0.004 0.403 0.024 0.108 0.030 0.212 0.03
(5) Recreational Area with Maximum Cumulative Impacts (East Park) 285100 5235050 0.351 0.002 0.348 0.025 0.193 0.004 0.097 0.03
(6) Commercial Area with Maximum Cumulative Impacts (Chevron station at SR 28 and SR 281) 284000 5235000 0.536 0.003 0.532 0.025 0.161 0.097 0.219 0.03
(7) Senior Center, Hospital or Nursing Home Area with Maximum Cumulative Impacts (Quincy Senior Center) 284800 5235050 0.459 0.002 0.456 0.025 0.176 0.006 0.219 0.03
(8) Elementary School with Maximum Cumulative Impacts (Pioneer Elementary) 284300 5234650 0.338 0.003 0.336 0.018 0.037 0.018 0.233 0.03
(9) Junior High School with with Maximum Cumulative Impacts (Quincy Junior High) 284900 5235300 0.319 0.002 0.316 0.036 0.051 0.004 0.195 0.03
(10) High School with Maximum Cumulative Impacts (Quincy Technical) 284000 5235150 0.392 0.004 0.388 0.030 0.098 0.022 0.208 0.03
Abbreviations and Acronyms:
µg/m3 = micrograms per cubic meter
DEEP = diesel engine exhaust particulate matter
E = eastm = meters
N = northSR = State RouteUTM = universal transverse mercator
UTM DEEP Impacts (µg/m3) Attributed to Each Source
04/06/18 P:\1678\001\R\HRA Report\Quincy HRA_tbs.xlsx 5 PA DEEP Landau Associates

Table 6
Worst‐Case Potential‐to‐Emit DEEP Concentrations at Selected Receptor Locations
Quincy, Washington
Page 1 of 1
Receptor Description E (m) N (m) Total
Data
Centers
Total without
Data Centers BNSF SR 28 SR 281
Other
Roadways
Regional
Background
(1) East Quincy Residence with Maximum Impacts from Data Centers 287000 5236700 0.202 0.135 0.067 0.015 0.007 0.001 0.014 0.03
(2a) West Quincy Residence with Maximum Impacts from Data Centers 283500 5236050 0.342 0.144 0.198 0.025 0.014 0.003 0.125 0.03
(3) East Quincy Residence with Maximum Cumulative Impacts 284650 5235050 0.476 0.016 0.461 0.025 0.174 0.007 0.225 0.03
(4b) West Quincy Residence with Maximum Cumulative Impacts 283750 5235000 0.436 0.037 0.400 0.025 0.135 0.014 0.196 0.03
(5) Recreational Area with Maximum Cumulative Impacts (East Park) 285100 5235050 0.365 0.017 0.348 0.025 0.193 0.004 0.097 0.03
(6) Commercial Area with Maximum Cumulative Impacts (Chevron station at SR 28 and SR 281) 284000 5235000 0.556 0.023 0.532 0.025 0.161 0.097 0.219 0.03
(7) Senior Center, Hospital or Nursing Home Area with Maximum Cumulative Impacts (Quincy Senior Center) 284800 5235050 0.471 0.015 0.456 0.025 0.176 0.006 0.219 0.03
(8) Elementary School with Maximum Cumulative Impacts (Pioneer Elementary) 284300 5234650 0.353 0.017 0.336 0.018 0.037 0.018 0.233 0.03
(9) Junior High School with with Maximum Cumulative Impacts (Quincy Junior High) 284900 5235300 0.332 0.015 0.316 0.036 0.051 0.004 0.195 0.03
(10) High School with Maximum Cumulative Impacts (Quincy Technical) 284000 5235150 0.414 0.025 0.388 0.030 0.098 0.022 0.208 0.03
Abbreviations and Acronyms:
µg/m3 = micrograms per cubic meter
DEEP = diesel engine exhaust particulate matter
E = eastm = meters
N = northSR = State RouteUTM = universal transverse mercator
UTM DEEP Impacts (µg/m3) Attributed to Each Source
04/06/18 P:\1678\001\R\HRA Report\Quincy HRA_tbs.xlsx 6 PTE DEEP Landau Associates

Table 7
2016‐Actual Cancer Risk at Selected Receptor Locations
Quincy, Washington
Page 1 of 1
Cancer Risk
Receptor Description E (m) N (m)
Total (per
Million)
Data
Centers
Total without
Data Centers BNSF SR 28 SR 281
Other
Roadways
Regional
Background
(1) East Quincy Residence with Maximum Impacts from Data Centers 287000 5236700 31 34.9% 65.1% 14.6% 6.4% 1.1% 13.8% 29.2%
(2a) West Quincy Residence with Maximum Impacts from Data Centers 283500 5236050 63 6.1% 93.9% 12.0% 6.8% 1.4% 59.4% 14.3%
(3) East Quincy Residence with Maximum Cumulative Impacts 284650 5235050 139 0.3% 99.7% 5.5% 37.6% 1.5% 48.7% 6.5%
(4a) West Quincy Residence with Maximum Cumulative Impacts 283900 5234950 122 0.6% 99.4% 5.8% 26.6% 7.4% 52.2% 7.4%
(5) Recreational Area with Maximum Cumulative Impacts (East Park) 285100 5235050 2.6 0.4% 99.6% 7.0% 55.1% 1.2% 27.7% 8.6%
(6) Commercial Area with Maximum Cumulative Impacts (Chevron station at SR 28 and SR 281) 284000 5235000 20 0.4% 99.6% 4.6% 30.1% 18.2% 41.0% 5.6%
(7) Senior Center, Hospital or Nursing Home Area with Maximum Cumulative Impacts (Quincy Senior Center) 284800 5235050 2.0 0.3% 99.7% 5.5% 38.5% 1.2% 47.9% 6.6%
(8) Elementary School with Maximum Cumulative Impacts (Pioneer Elementary) 284300 5234650 1.7 0.5% 99.5% 5.3% 11.0% 5.2% 69.0% 8.9%
(9) Junior High School with with Maximum Cumulative Impacts (Quincy Junior High) 284900 5235300 1.6 0.5% 99.5% 11.3% 16.0% 1.4% 61.4% 9.4%
(10) High School with Maximum Cumulative Impacts (Quincy Technical) 284000 5235150 1.1 0.6% 99.4% 7.7% 25.1% 5.6% 53.3% 7.7%
Abbreviations and Acronyms:
E = eastm = meters
N = northSR = State RouteUTM = universal transverse mercator
UTM Percent Attributed to Each Source
04/06/18 P:\1678\001\R\HRA Report\Quincy HRA_tbs.xlsx 7 2016 CancerRisk Landau Associates

Table 8
Projected‐Actual Cancer Risk at Selected Receptor Locations
Quincy, Washington
Page 1 of 1
Cancer Risk
Receptor Description E (m) N (m)
Total (per
Million)
Data
Centers
Total without
Data Centers BNSF SR 28 SR 281
Other
Roadways
Regional
Background
(1) East Quincy Residence with Maximum Impacts from Data Centers 287000 5236700 39 49.1% 50.9% 11.4% 5.0% 0.9% 10.8% 22.8%
(2b) West Quincy Residence with Maximum Impacts from Data Centers 282350 5236250 39 14.4% 85.6% 13.4% 8.8% 1.6% 38.9% 23.0%
(3) East Quincy Residence with Maximum Cumulative Impacts 284650 5235050 139 0.5% 99.5% 5.4% 37.5% 1.5% 48.6% 6.5%
(4a) West Quincy Residence with Maximum Cumulative Impacts 283900 5234950 122 0.9% 99.1% 5.8% 26.5% 7.4% 52.0% 7.4%
(5) Recreational Area with Maximum Cumulative Impacts (East Park) 285100 5235050 2.6 0.7% 99.3% 7.0% 54.9% 1.2% 27.6% 8.6%
(6) Commercial Area with Maximum Cumulative Impacts (Chevron station at SR 28 and SR 281) 284000 5235000 20 0.6% 99.4% 4.6% 30.1% 18.1% 40.9% 5.6%
(7) Senior Center, Hospital or Nursing Home Area with Maximum Cumulative Impacts (Quincy Senior Center) 284800 5235050 2.0 0.5% 99.5% 5.5% 38.4% 1.2% 47.8% 6.5%
(8) Elementary School with Maximum Cumulative Impacts (Pioneer Elementary) 284300 5234650 1.7 0.8% 99.2% 5.3% 11.0% 5.2% 68.9% 8.9%
(9) Junior High School with with Maximum Cumulative Impacts (Quincy Junior High) 284900 5235300 1.6 0.8% 99.2% 11.2% 16.0% 1.4% 61.2% 9.4%
(10) High School with Maximum Cumulative Impacts (Quincy Technical) 284000 5235150 1.1 0.9% 99.1% 7.7% 25.1% 5.6% 53.1% 7.7%
Abbreviations and Acronyms:
E = eastm = meters
N = northSR = State RouteUTM = universal transverse mercator
UTM Percent Attributed to Each Source
04/06/18 P:\1678\001\R\HRA Report\Quincy HRA_tbs.xlsx 8 PA CancerRisk Landau Associates

Table 9
Worst‐Case Potential‐to‐Emit Cancer Risk at Selected Receptor Locations
Quincy, Washington
Page 1 of 1
Cancer Risk
Receptor Description E (m) N (m)
Total (per
Million)
Data
Centers
Total without
Data Centers BNSF SR 28 SR 281
Other
Roadways
Regional
Background
(1) East Quincy Residence with Maximum Impacts from Data Centers 287000 5236700 61 66.8% 33.2% 7.4% 3.3% 0.6% 7.0% 14.9%
(2a) West Quincy Residence with Maximum Impacts from Data Centers 283500 5236050 103 42.2% 57.8% 7.4% 4.2% 0.9% 36.5% 8.8%
(3) East Quincy Residence with Maximum Cumulative Impacts 284650 5235050 143 3.3% 96.7% 5.3% 36.5% 1.4% 47.3% 6.3%
(4b) West Quincy Residence with Maximum Cumulative Impacts 283750 5235000 131 8.4% 91.6% 5.8% 30.8% 3.3% 44.9% 6.9%
(5) Recreational Area with Maximum Cumulative Impacts (East Park) 285100 5235050 2.7 4.6% 95.4% 6.7% 52.7% 1.2% 26.5% 8.2%
(6) Commercial Area with Maximum Cumulative Impacts (Chevron station at SR 28 and SR 281) 284000 5235000 21 4.2% 95.8% 4.5% 29.0% 17.5% 39.5% 5.4%
(7) Senior Center, Hospital or Nursing Home Area with Maximum Cumulative Impacts (Quincy Senior Center) 284800 5235050 2.0 3.2% 96.8% 5.3% 37.4% 1.2% 46.5% 6.4%
(8) Elementary School with Maximum Cumulative Impacts (Pioneer Elementary) 284300 5234650 1.7 4.9% 95.1% 5.0% 10.5% 5.0% 66.0% 8.5%
(9) Junior High School with with Maximum Cumulative Impacts (Quincy Junior High) 284900 5235300 1.6 4.6% 95.4% 10.8% 15.4% 1.3% 58.8% 9.0%
(10) High School with Maximum Cumulative Impacts (Quincy Technical) 284000 5235150 1.2 6.1% 93.9% 7.3% 23.7% 5.3% 50.3% 7.3%
Abbreviations and Acronyms:
E = eastm = meters
N = northSR = State RouteUTM = universal transverse mercator
UTM Percent Attributed to Each Source
04/06/18 P:\1678\001\R\HRA Report\Quincy HRA_tbs.xlsx 9 PTE CancerRisk Landau Associates

Table 10
2016‐Actual Non‐Cancer Hazard Quotient at Selected Receptor Locations
Quincy, Washington
Page 1 of 1
Receptor Description E (m) N (m)
Hazard
Quotient
Data
Centers
Total without
Data Centers BNSF SR 28 SR 281
Other
Roadways
Regional
Background
(1) East Quincy Residence with Maximum Impacts from Data Centers 287000 5236700 0.021 34.9% 65.1% 14.6% 6.4% 1.1% 13.8% 29.2%
(2a) West Quincy Residence with Maximum Impacts from Data Centers 283500 5236050 0.042 6.1% 93.9% 12.0% 6.8% 1.4% 59.4% 14.3%
(3) East Quincy Residence with Maximum Cumulative Impacts 284650 5235050 0.092 0.3% 99.7% 5.5% 37.6% 1.5% 48.7% 6.5%
(4a) West Quincy Residence with Maximum Cumulative Impacts 283900 5234950 0.081 0.6% 99.4% 5.8% 26.6% 7.4% 52.2% 7.4%
(5) Recreational Area with Maximum Cumulative Impacts (East Park) 285100 5235050 0.070 0.4% 99.6% 7.0% 55.1% 1.2% 27.7% 8.6%
(6) Commercial Area with Maximum Cumulative Impacts (Chevron station at SR 28 and SR 281) 284000 5235000 0.11 0.4% 99.6% 4.6% 30.1% 18.2% 41.0% 5.6%
(7) Senior Center, Hospital or Nursing Home Area with Maximum Cumulative Impacts (Quincy Senior Center) 284800 5235050 0.092 0.3% 99.7% 5.5% 38.5% 1.2% 47.9% 6.6%
(8) Elementary School with Maximum Cumulative Impacts (Pioneer Elementary) 284300 5234650 0.067 0.5% 99.5% 5.3% 11.0% 5.2% 69.0% 8.9%
(9) Junior High School with with Maximum Cumulative Impacts (Quincy Junior High) 284900 5235300 0.064 0.5% 99.5% 11.3% 16.0% 1.4% 61.4% 9.4%
(10) High School with Maximum Cumulative Impacts (Quincy Technical) 284000 5235150 0.078 0.6% 99.4% 7.7% 25.1% 5.6% 53.3% 7.7%
Abbreviations and Acronyms:
E = eastm = meters
N = northSR = State RouteUTM = universal transverse mercator
UTM Percent Attributed to Each Source
04/06/18 P:\1678\001\R\HRA Report\Quincy HRA_tbs.xlsx 10 2016 Non‐cancer Landau Associates

Table 11
Projected‐Actual Non‐Cancer Hazard Quotient at Selected Receptor Locations
Quincy, Washington
Page 1 of 1
Receptor Description E (m) N (m)
Hazard
Quotient
Data
Centers
Total without
Data Centers BNSF SR 28 SR 281
Other
Roadways
Regional
Background
(1) East Quincy Residence with Maximum Impacts from Data Centers 287000 5236700 0.026 49.1% 50.9% 11.4% 5.0% 0.9% 10.8% 22.8%
(2b) West Quincy Residence with Maximum Impacts from Data Centers 282350 5236250 0.026 14.4% 85.6% 13.4% 8.8% 1.6% 38.9% 23.0%
(3) East Quincy Residence with Maximum Cumulative Impacts 284650 5235050 0.093 0.5% 99.5% 5.4% 37.5% 1.5% 48.6% 6.5%
(4a) West Quincy Residence with Maximum Cumulative Impacts 283900 5234950 0.081 0.9% 99.1% 5.8% 26.5% 7.4% 52.0% 7.4%
(5) Recreational Area with Maximum Cumulative Impacts (East Park) 285100 5235050 0.070 0.7% 99.3% 7.0% 54.9% 1.2% 27.6% 8.6%
(6) Commercial Area with Maximum Cumulative Impacts (Chevron station at SR 28 and SR 281) 284000 5235000 0.11 0.6% 99.4% 4.6% 30.1% 18.1% 40.9% 5.6%
(7) Senior Center, Hospital or Nursing Home Area with Maximum Cumulative Impacts (Quincy Senior Center) 284800 5235050 0.092 0.5% 99.5% 5.5% 38.4% 1.2% 47.8% 6.5%
(8) Elementary School with Maximum Cumulative Impacts (Pioneer Elementary) 284300 5234650 0.068 0.8% 99.2% 5.3% 11.0% 5.2% 68.9% 8.9%
(9) Junior High School with with Maximum Cumulative Impacts (Quincy Junior High) 284900 5235300 0.064 0.8% 99.2% 11.2% 16.0% 1.4% 61.2% 9.4%
(10) High School with Maximum Cumulative Impacts (Quincy Technical) 284000 5235150 0.078 0.9% 99.1% 7.7% 25.1% 5.6% 53.1% 7.7%
Abbreviations and Acronyms:
E = eastm = meters
N = northSR = State RouteUTM = universal transverse mercator
UTM Percent Attributed to Each Source
04/06/18 P:\1678\001\R\HRA Report\Quincy HRA_tbs.xlsx 11 PA Non‐cancer Landau Associates
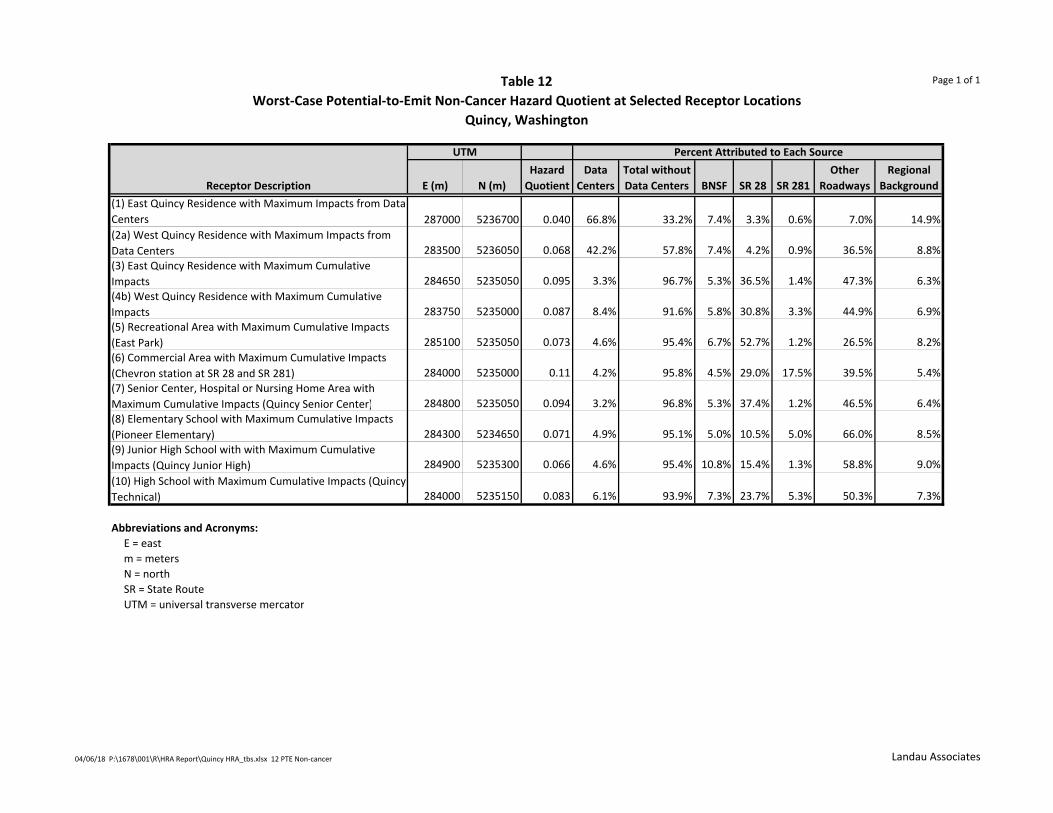
Table 12
Worst‐Case Potential‐to‐Emit Non‐Cancer Hazard Quotient at Selected Receptor Locations
Quincy, Washington
Page 1 of 1
Receptor Description E (m) N (m)
Hazard
Quotient
Data
Centers
Total without
Data Centers BNSF SR 28 SR 281
Other
Roadways
Regional
Background
(1) East Quincy Residence with Maximum Impacts from Data Centers 287000 5236700 0.040 66.8% 33.2% 7.4% 3.3% 0.6% 7.0% 14.9%
(2a) West Quincy Residence with Maximum Impacts from Data Centers 283500 5236050 0.068 42.2% 57.8% 7.4% 4.2% 0.9% 36.5% 8.8%
(3) East Quincy Residence with Maximum Cumulative Impacts 284650 5235050 0.095 3.3% 96.7% 5.3% 36.5% 1.4% 47.3% 6.3%
(4b) West Quincy Residence with Maximum Cumulative Impacts 283750 5235000 0.087 8.4% 91.6% 5.8% 30.8% 3.3% 44.9% 6.9%
(5) Recreational Area with Maximum Cumulative Impacts (East Park) 285100 5235050 0.073 4.6% 95.4% 6.7% 52.7% 1.2% 26.5% 8.2%
(6) Commercial Area with Maximum Cumulative Impacts (Chevron station at SR 28 and SR 281) 284000 5235000 0.11 4.2% 95.8% 4.5% 29.0% 17.5% 39.5% 5.4%
(7) Senior Center, Hospital or Nursing Home Area with Maximum Cumulative Impacts (Quincy Senior Center) 284800 5235050 0.094 3.2% 96.8% 5.3% 37.4% 1.2% 46.5% 6.4%
(8) Elementary School with Maximum Cumulative Impacts (Pioneer Elementary) 284300 5234650 0.071 4.9% 95.1% 5.0% 10.5% 5.0% 66.0% 8.5%
(9) Junior High School with with Maximum Cumulative Impacts (Quincy Junior High) 284900 5235300 0.066 4.6% 95.4% 10.8% 15.4% 1.3% 58.8% 9.0%
(10) High School with Maximum Cumulative Impacts (Quincy Technical) 284000 5235150 0.083 6.1% 93.9% 7.3% 23.7% 5.3% 50.3% 7.3%
Abbreviations and Acronyms:
E = eastm = meters
N = northSR = State RouteUTM = universal transverse mercator
UTM Percent Attributed to Each Source
04/06/18 P:\1678\001\R\HRA Report\Quincy HRA_tbs.xlsx 12 PTE Non‐cancer Landau Associates

APPENDICES A, B, and C
Appendix A: Data Center Source Information Summary Tables
Appendix B: Models and Emission Summary Tables
Appendix C: From Ecology – Presentation of Mobile Source Emissions
(on DVD)