revised cdp for nagpur - nagpur municipal · pdf filerevised cdp for nagpur brijgopal ladda,...
TRANSCRIPT

© 2
013 C
RIS
IL L
td.
All
rig
hts
reserv
ed.
Stakeholder Consultations- Vision Framing
Ministry of Urban Development, CBUD Project
Revised CDP for Nagpur
Brijgopal Ladda, Urban Specialist
Ashutosh Joshi, Municipal Finance Specialist
Harsh Shah, Urban Planner
06th December 2013

© 2
013 C
RIS
IL L
td.
All
rig
hts
reserv
ed.
Background
Salient Aspects of 1st generation CDP
Vision Framing- Group Exercise
Revised CDP Process and progress
City Level Assessment - Our Initial findings & Issues
1
4
5
2
3
Agenda
2

© 2
013 C
RIS
IL L
td.
All
rig
hts
reserv
ed.
Project Background
3
© 2
013 C
RIS
IL L
td.
All
rig
hts
reserv
ed.
Project Background - CBUD
GoI (MOUD & MOHUPA) with the assistance from The World Bank have launched the
Project
– Capacity Building for Urban Development (CBUD) for 30 select cities
The aim is to address the major constraints of urban development and focus on the
capacity building requirements
The project has two components
– Capacity Building for strengthened urban management
– Capacity Building for effective urban poverty monitoring and alleviation.
The project will support selected cities in following areas:
– Land use and planning, Service delivery, Governance and Poverty reduction.
In order to identify broader issues for intervention and areas of assistance pertaining
to development of city, MoUD decided to prepare the CDPs for 30 cities as per the
revised CDP guidelines issued in 2013 and also make available TA for other areas.
CRISIL Risk & Infrastructure Solutions is appointed as consultant
4

© 2
013 C
RIS
IL L
td.
All
rig
hts
reserv
ed.
What is a City Development Plan?
A City Development Plan
– is a comprehensive document outlining the vision and development strategy of
the city,
– Is prepared in extensive consultation with stakeholders to identify the thrust
areas, prioritize projects in order to achieve the objectives and the vision.
Unlike ‘Master Plan’ places a greater emphasis on the spatial
aspects and its regulation
“CDP” takes strategic view of the development of a city and aligns
infrastructure development and service delivery
It’s a dynamic document as CDP follows
– cyclical process with an in-built periodical review mechanism
– respond to the evolving aspirations/needs of the citizens keeping in view the
constraints and opportunities
– CDP should not be restricted to the sectors eligible for funding under the JNNURM
– CDP should cover impact of the sectors/projects/initiatives outside the purview of a ULB
5

© 2
013 C
RIS
IL L
td.
All
rig
hts
reserv
ed.
Approach to CDP Preparation
6
The CDP will be prepared in accordance with the guidelines issued by MoUD
Revenue
Enhancement
Potential
Expenditure
Control Potential
Assets
Management
Potential

© 2
013 C
RIS
IL L
td.
All
rig
hts
reserv
ed.
Proposed Methodology- A 4 Stage Approach
7
Inception meeting
City level Assessment, SWOT Analysis, Review of SLB indicators and ongoing projects & reforms
Submission of Interim Report Stakeholder
Meeting
Preparation of FOP and CIP, framing Vision, Goals, Identification of priority sectors and identification of Infrastructure projects.
Submission of Draft Report Stakeholder
Meeting
Final City Development Plan
Suggestions
From ULB, Committees
From MoUD
1st Step
2nd Step
3rd Step
4th Step
5th Step
Data collection as required for CDP
Review of 1st Generation CDP
Submission of Inception Report

© 2
013 C
RIS
IL L
td.
All
rig
hts
reserv
ed.
Revised CDP Preparation Progress
8

© 2
013 C
RIS
IL L
td.
All
rig
hts
reserv
ed.
Current Status -Revised CDP
9
Kick off meeting was conducted on 2nd Sept 2013
CRIS has submitted the Inception Report to MoUD & NMC on 30th Sept 2013
NMC has formed the Policy and Technical Committees
CRIS team has carried out focused consultations with select stakeholders of the city
City level assessment and SWOT analysis has been completed
1st city level workshop - “The Agenda of the workshop is to provide city level assessment,
key findings and issues, and further to discuss on Vision for the city”
Final
workshop
Inception Report
Interim Report
Draft CDP
Final CDP Workshop

© 2
013 C
RIS
IL L
td.
All
rig
hts
reserv
ed.
City Level Assessment
10

© 2
013 C
RIS
IL L
td.
All
rig
hts
reserv
ed.
General Profile & Demography
Nagpur known as “Orange City” and 2nd Capital of Maharashtra
Nagpur city is spread over an area of 218 sq km
Key Aspects– Census 2011
Population: 24.05 lakhs
Households: 5.32 Lakhs
Household Size: 4.76 persons
Density: 1130 persons/ha
Sex Ratio: 963 per 1000 males
Literacy Rate: 93%
Decadal growth rate: 15%
SC population: 6.33 lakhs
ST population: 2.37 lakhs
Slum population: 8 lakhs
Key observations Declining growth rate since 1971
5% of the state urban population is living in Nagpur city
52% of the nagpur district’ population is living in Nagpur city
In-migration has decreased since 2001
11
866,000
1,217,000
1,622,818
2,052,066
2,405,665
2767309
3078553
3322648
-
500,000
1,000,000
1,500,000
2,000,000
2,500,000
3,000,000
3,500,000
1971 1981 1991 2001 2011 2021 2031 2041
City Population - Nagpur

© 2
013 C
RIS
IL L
td.
All
rig
hts
reserv
ed.
Population Forecast
Various methods used to arrive at the best possible scenario
12
2021
2031
Incremental
Increase
method
29.16
35.54
43.17 2041
Year Exponential
Method
42.76
55.27
71.44
Arithmetic
Increase
method
27.90
31.75
35.60
Geometrical
Progression
32.74
44.58
60.69
2nd Order
Polynomial
28.21
32.27
40.05
-
1,000,000
2,000,000
3,000,000
4,000,000
5,000,000
6,000,000
7,000,000
8,000,000
1971 1981 1991 2001 2011 2021 2031 2041
Past trend Present Future Projection
Airthmetic
Incremental
Exponential
Geometrical
2nd order Polynomial

© 2
013 C
RIS
IL L
td.
All
rig
hts
reserv
ed.
Economic Development
13
Key Economic Drivers
• Export of Oranges is one major economic activity
• Its growth center for the Vidarbha region
• Transit hub for surrounding states
• Rich natural resources in the region
• Presence of state and central organistions
• Various manufacturing industries around the Nagpur
Industrial Development
• 11 MIDCs and MIHAN in Nagpur district
• Butibori MIDC – 722 units operational
• Hingana MIDC - 1266 units operational
• MIHAN – 6 companies have started their operations
• The industries in surround areas of Nagpur has created the
employment for 1.40 lakhs persons
Key Issues
• Lack of new projects to support Economic & Industrial
Development in Nagpur and around
• Lack of support to clear back log of pending projects
• Lack of ‘Investor friendly Policy’
• Lack of acceptance of new policy of LBT by all trade and
commerce association

© 2
013 C
RIS
IL L
td.
All
rig
hts
reserv
ed.
Physical Growth
Administration
– NMC is responsible for preparation of development
plan and its implementation for Nagpur city -235 sq.
km of area
– NIT – In NMC Jurisdiction it looks after regularization
of un-authorised layouts
Development is happening around
MIHAN project
Key issues
– Violation of FSI, building permission norms
– Presence of multiple planning authorities
– Conflicts in implementation of Development
plan as per applicable Acts – MRTP Act,1947
& Gunthewari Act,2001
14
New Development is concentrated in south
west areas of the city

© 2
013 C
RIS
IL L
td.
All
rig
hts
reserv
ed.
Water Supply – Existing System
15
Source:
Kanhan River
PENCH reservoir
Gorewada Tank
Transmission:
Transmission
lines are laid from
3 sources till 5
WTPs
ESRs/GSRs:
• Total 21
ESRs/GSRs
with capacity of
Consumer End:
• Metered – 30%
(working)
• Domestic –
2,45,134
• Bulk supply –
7,243
• Others – 10,033
• Public taps –
5,830
WTPs:
5 WTPs
• Kanhan – 220 MLD
• PENCH I –140 MLD
• PENCH II – 145 MLD
• PENCH III – 125 MLD
• Old Gorewada-16 MLD
Distribution
Network:
Source transmission WTP ESRs/GSRs Distribution Consumer end
24 x 7 water supply project is under implementation by NMC
NMC has outsourced the water supply function to Orange City Water Pvt Ltd. (OCWL) for concession
period of 25 years.
Augmentation of source, transmission and distribution network, storage and infrastructure at consumer end
is being carried out through various projects implemented under JNNURM

© 2
013 C
RIS
IL L
td.
All
rig
hts
reserv
ed.
Water Supply – Service Level Benchmarking
16
1
Coverage
Per Capita Water supply, lpcd
MOUD
Benchmark
100%
135
100%
20%
Metering
Non-Revenue Water (Distribution n/w)
Quality of water supplied
Continuity of water supply, hrs/day
100%
24x7
80%
100%
Redressal of customer Complaints
Cost recovery, as a % of revenue
Collection efficiency 90%
NMC’s
performance
82%
100-110
28%
56%
100%
6 hrs
95%
100%
49%
Performance Parameter

© 2
013 C
RIS
IL L
td.
All
rig
hts
reserv
ed.
Water Supply – Key findings and issues
Water pressure is low in some zone, resulting in uneven water distribution
SLB benchmark
– Lower per capita water supply ,
– High NRW, losses during transmission and distribution of water
– Collection efficiency is less then 50%
Even though Cost recovery of 100% is achieved, collection efficiency is below the
prescribed benchmark.
Currently as various projects are under implementation NMC is not in position to
quantify the SLB indicators
Most of the completed projects are implemented to augment infrastructure to achieve
24 x 7 water supply in Nagpur
Project implementation is running behind actual schedule due to lot of road blocks
and hurdles.
17

© 2
013 C
RIS
IL L
td.
All
rig
hts
reserv
ed.
Sewerage & Sanitation – Existing System
345 MLD of Sewage is generated (only 50% of the water supply)
Only 40% of the city area covered with underground network , and in rest
areas it is flowing through open nallahs
City has only 1 STP with installed capacity of 100 MLD, rest of sewage is
disposed of untreated
NMC has prepared Sewerage Master Plan and water reuse plan
18
Coverage:
• 70% of the city area
is covered
• Only 40% of the city
roads have sewer
pipelines
Collection &
Transporation:
• Length of sewer lines
is 1747 kms
• Dia of pipes vary from
150 mm to 2600 mm
Disposal:
• At present out
fall of untreated
sewage is into
the Gosikhud
Dam
STP:
• Only 1 STP with
install capacity of
100 MLD
• Actula capacity is
80 MLD
Coverage Collection & transportation STP Disposal

© 2
013 C
RIS
IL L
td.
All
rig
hts
reserv
ed.
Sewerage & Sanitation – Service Level Benchmarking
19
1
Coverage of Toilets
Coverage of sewage network services
MOUD
Benchmark
100%
100%
100%
100%
Collection efficiency of sewage network
Adequacy of sewage treatment capacity
Redressal of customer complaints
Quality of sewage treatment
80%
100%
20%
100%
Extent of reuse and recycling of sewage
Cost recovery, as a % of revenue
Collection efficiency 90%
NMC’s
performance
90%
96%
29%
22%
NA
100%
0%
100%
100%
Performance Parameter

© 2
013 C
RIS
IL L
td.
All
rig
hts
reserv
ed.
Sewerage & Sanitation – Key findings and issues
60% of the city area is not covered by UGD
Condition of open nallahs is deteoriating
Inadequate treatment and disposal facilities
During monsoon due flooding sewage and storm water mixes –it’s a major issue
Delay in implementation of projects affecting the service delivery
Currently untreated water is disposed into river, contaminating water bodies
20

© 2
013 C
RIS
IL L
td.
All
rig
hts
reserv
ed.
Solid Waste Management – Existing System
21
Waste collection, transportation, treatment and disposal function is outsourced by NMC
Monitoring of all the activities is carried by NMC.
However waste collection is still a major issue
Waste Generation:
• 750 TPD is the waste
generated
• Waste generated from
various sources is
collected by Door-to-
Door collection
Collection:
• 720 TPD collection is
taking place
• Door-to-door
collection in
residential and
commercial
properties
Treatment:
• 600 TPD waste
processed
• Vermi-composting
plant (Bio degradable)
• Recycling plant (non-
Bio degradable)
transportation:
• 660 TPD is getting
transportation
• Total 611 vehicles
Disposal:
110 TPD – refuse
waste
100 TPD – inert of
processing
• Scientific landfill site
for inert waste
Generation Collection transportation Treatment Disposal

© 2
013 C
RIS
IL L
td.
All
rig
hts
reserv
ed.
Solid Waste Management – Service Level
Benchmarking
22
HH-level coverage of SWM services
Efficiency of collection of MSW
Benchmark
100%
100%
100%
80%
Extent of segregation of MSW
Extent of MSW recovered
Extent of cost recovery
Extent of scientific disposal of MSW
80%
100%
80%
100%
Efficiency in redressal of complaints
Cost recovery, as a % of revenue
NMC’s
performance
95%
95%
28%
9%
NA
100%
97%
NA
Performance Parameter

© 2
013 C
RIS
IL L
td.
All
rig
hts
reserv
ed.
Solid Waste Management – Key findings and issues
23
Seven out of 8 SLB indicators are not achieved
No user charges are levied,
High O&M expenditure
Treatment/Disposal site is located far away from city and there are no transfers station

© 2
013 C
RIS
IL L
td.
All
rig
hts
reserv
ed.
Due negligence towards development of storm water
drainage system at time of planning and
implementation of basic infrastructure while
authorisation of layouts.
Storm water drains only has an coverage of 40%
Multiple incidents of water logging and sewage and
storm water flowing together have been observed
during monsoon
Presently, NMC is feeling the pressure of developing
SWD system
Master plan is prepared by NMC and it aims at
providing 100% coverage in the city. Investment
estimates are around 2000 crores
1. Length of Roads – 2620 kms
2. Storm water drains – 917 kms
(35% of the road network)
3. Coverage – 40% of the city area
Storm Water Drains – Existing System and SLB
24
Coverage of Storm water Drain network
Incidence of water logging / flooding
Benchmark
100%
0
Performance Parameter NMC’s
performance
35%
Max of 45

© 2
013 C
RIS
IL L
td.
All
rig
hts
reserv
ed.
Urban Roads and street lights
City roads are reasonably good and connectivity is
also good.
Roads are well illuminated by installation of around
93,707 street lights, with adequate spacing.
NMC has initiated use of LED lamps to save energy
Majority of the roads are provided with street
furniture and green plantation
Traffic & transportation
Daily 32.80 lakhs of trips/day are made by citizens
56,600 trips are made through inter-city buses
74,770 trips are made through rail mode
Average trip length is 6 kms with trip time around 20
minutes
Traffic & Transportation – Existing System
25
Concrete 1%
Tarred/ Black
Topped/ Bitumino
us Topped
79%
Water Bound
Macadam 20%
Urban Roads
Mercury Vapour Lamps
2%
Sodium Vapour Lamps 86%
Tubelights 11%
Others 1%
Street lights

© 2
013 C
RIS
IL L
td.
All
rig
hts
reserv
ed.
Traffic & Transportation
Public Transportation & IPTS
Public transportation service is outsourced by NMC to
VMIL for concession period of 7 years.
Currently share of PT is only 5% of the total trips
generated in city
240 buses are procured under JNNURM project
12% of the total trips generated are catered by tri-cycle
and autos.
26
Indicators Value
Fleet size 470 buses (VMIL – 230, NMC – 240)
Passenger count 1.25 lakhs/day
No of bus shelters 190 shelters
No of Routes 142 (operational – 56)
Operational Efficiency 54%
PT* 40%
cycel 28%
TW 27%
Car 5%
Travel Demand - Trip Share, 2011
Motorised trips 58%
Non-motorised
trips 42%
Trip Distributions- 2011

© 2
013 C
RIS
IL L
td.
All
rig
hts
reserv
ed.
Traffic & Transportation – Key findings and Issues
Fleet maintenance is not on regular basis and condition of the buses are
deteriorating
Support infrastructure like bus shelters, terminals, workshop, depot, etc. are
required
Serious problem of IPT, use of adultered fuel, old vehicle, high fares, etc. causing
problems to commuters
Also lack of technical expertise within authorities. (transport planner)
27

© 2
013 C
RIS
IL L
td.
All
rig
hts
reserv
ed.
Urban Poor
28
As census
– Population - 858,963 persons
– Total Slum dwelling units -147,716
– No of slums in city – 446 slum
– Slum Footprint in city - 25% 17 (sq km)
– Pucca structure 40%
– Semi-pucca structure 38%
– Katcha structure 22%
287
137
22
16
27
14
44
16
32
40 40
33
25
15
20
3
18
9 6
14 8
24
20
1 3 2 2 1 0 0 5 6 2 0 5 10 15 20 25 30 35 40 45 50
-
50
100
150
200
250
300
350
Notifie
d
Non
-Notifie
d
New
slu
m a
rea
s
La
xm
ina
ga
r
Dha
ram
pe
th
Han
um
an
Nag
ar
Dha
nto
li
Neh
ru N
ag
ar
Ga
nd
hib
ag
h
Sa
tara
njip
ura
La
ka
dg
an
j
Aa
sh
ina
ga
r
Ma
ng
alw
ari
As per Slum classification
Slum -Zonewise
Status of slums in Nagpur
No of slums Notified Non-Notified New slum areas
47
320
424 446
326
446
0
50
100
150
200
250
300
350
400
450
500
0
50
100
150
200
250
300
350
400
450
500
1971 1981 1991 1992 2001 2008 2011
Growth of Slums in Nagpur Series1 Series2
Laxminagar 7%
Dharampeth 11%
Hanuman Nagar
4%
Dhantoli 14%
Nehru Nagar 6%
Gandhibagh 9%
Sataranjipura 12%
Lakadganj 12%
Aashinagar 14%
Mangalwari 11%
Spread of slums in Nagpur

© 2
013 C
RIS
IL L
td.
All
rig
hts
reserv
ed.
Urban Poor – Key issues
– Coordination issues between agencies. As NIT is carrying out development works in slums in the city
for better results coordination between NMC and NIT is required
– Multiple authorities working for slum improvement - NMC, NIT, SRA and MHADA
– More than 50% of the slums have basic infrastructure needs to be de-notified
– BSUP, Housing needs
• Demand for housing is quite high- 1.23 lacs housing required in city to achieve slum free city.
– Social Welfare
• Lack of public awareness – urban poor’s are not aware about the programmes for their social
upliftment
• No support by various NGOs working independently for urban poor
• Lack of adequate staff to implement SJSRY and MBKS program
• Department doesn’t have mechanism and also no enough staff for monitoring of the social
infrastructure developed by NMC
• Inconsistencies in data - Various BPL lists prevailing in NMC departments and also at regional and
state level.
29

© 2
013 C
RIS
IL L
td.
All
rig
hts
reserv
ed.
Octroi has been abolished in since April 2013 in Nagpur and other cities as per Notification by GoM.
• Revenue Account
– Revenue account is in surplus throughout
the review period
• Revenue Income
– Own income contributes 94%
• Tax revenue contributes 72% of total
revenue income.
• Non-tax revenue contributes 22% of
total revenue income.
– Revenue grants contribute 6% of total
revenue income.
– Earlier Octroi was contributing 52% of total
revenue income followed by property tax
at 20% and water charges at 8%.
• Revenue Expenditure
– Salaries’ accounts for 43% of total revenue
expenditure.
– O&M expenditure accounts for 52% of
total revenue expenditure.
– Interest repayment accounts for 5% of
total revenue expenditure.
Municipal Finance– Key Findings
30
458.84 540.9
662.17 745.77
1137.97
362.95 393.66 413.22 499.43
632.03
95.89 147.24
248.94 246.33
505.94
0
200
400
600
800
1000
1200
2008-09 2009-10 2010-11 2011-12 2012-13*
Revenue Account
RI RE Surplus/ (Deficit)
72%
22%
6%
RI Tax Revenues
Non Tax Revenues
Revenue Grants & Contributions
73%
11%
6% 10%
Tax revneues Octroi Tax
PT - General Tax
PT-Sewerage Tax
PT-Water, Fire ,Light Tax
Salaries 43%
O&M 52%
Debt - Interest Payouts
5%
RE
© 2
013 C
RIS
IL L
td.
All
rig
hts
reserv
ed.
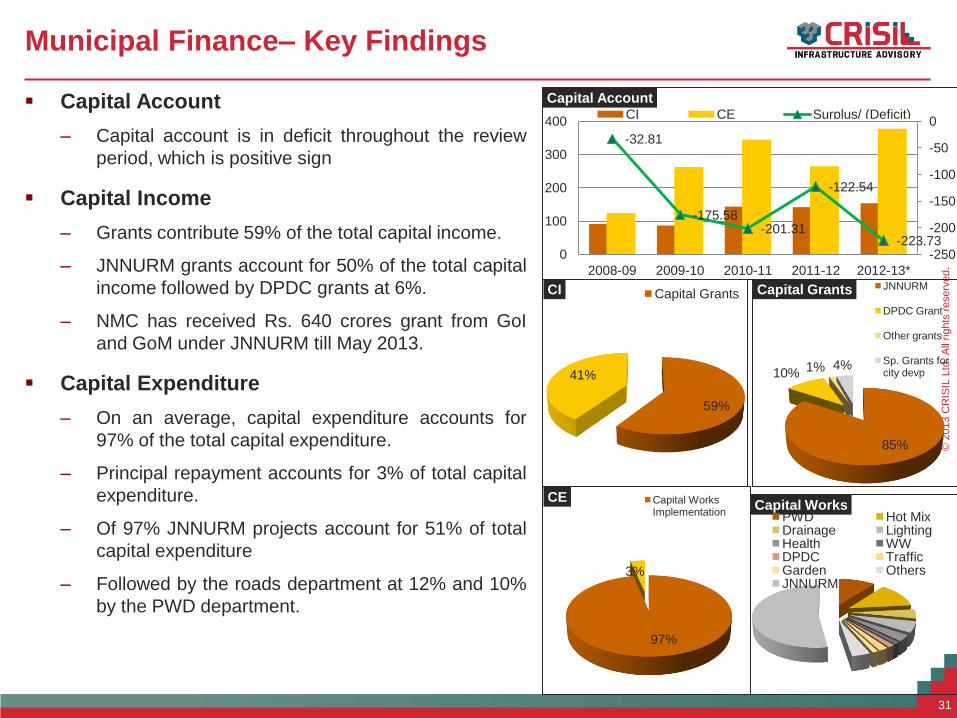
Municipal Finance– Key Findings
31
59%
41%
CI Capital Grants
85%
10% 1% 4%
Capital Grants JNNURM
DPDC Grant
Other grants
Sp. Grants for city devp
97%
3%
CE Capital Works Implementation
Capital Works PWD Hot Mix Drainage Lighting Health WW DPDC Traffic Garden Others JNNURM
Capital Account
– Capital account is in deficit throughout the review
period, which is positive sign
Capital Income
– Grants contribute 59% of the total capital income.
– JNNURM grants account for 50% of the total capital
income followed by DPDC grants at 6%.
– NMC has received Rs. 640 crores grant from GoI
and GoM under JNNURM till May 2013.
Capital Expenditure
– On an average, capital expenditure accounts for
97% of the total capital expenditure.
– Principal repayment accounts for 3% of total capital
expenditure.
– Of 97% JNNURM projects account for 51% of total
capital expenditure
– Followed by the roads department at 12% and 10%
by the PWD department.
-32.81
-175.58 -201.31
-122.54
-223.73 -250
-200
-150
-100
-50
0
0
100
200
300
400
2008-09 2009-10 2010-11 2011-12 2012-13*
Capital Account CI CE Surplus/ (Deficit)

© 2
013 C
RIS
IL L
td.
All
rig
hts
reserv
ed.
Municipal Finance– Key Findings
32
Own source of renveus as % total RI
Per Capita Own revenues
Value
94%
Rs 2785
22%
Rs 399
Non-Tax revenue - % of own soruces
Per capita property tax demand
Salaries - % of Revenue Income
Operating Ratio
30%
0.63
Rs 1000
40%
Per capita O&M expenditure
Salary - % of Revenue Expenditure
Debt Servicing Coverage Ratio 8.29
Indicator
© 2
013 C
RIS
IL L
td.
All
rig
hts
reserv
ed.
Municipal Finance– Key Findings
Key issues
Octroi got abolished and LBT has introduced in Nagpur
– Associations, trade organisations, local vendors have opposed and this has
affected the revenue income for NMC
Lack of robust property tax system is leading to long pending arrears form
defaulters
No user charges on SWM and sewerage .
Scope for expenditure management
33

© 2
013 C
RIS
IL L
td.
All
rig
hts
reserv
ed.
SWOT Analysis
34
• Centrally located in India – large catchment spread in all directions
• Rich mineral resource base
• Well connected to all major cities in India through road, rail and air networks
• Excellent medical and educational facilities available in the city
• Clean and green image of the city
• Low-cost high-skill labour is available for development of services and knowledge based industries
• Location allows for development of a distribution hub
• Enough space available in the city to develop IT parks, health city
• Landlocked cities- industries needing sea transport are not feasible
• Has a low profile and image
• Inadequate city infrastructure and amenities
• Lack of employment opportunities for the large educated young population
• Delay in implementation of MIHAN project may decelerate the expected economic growth
• Deteriorating power situation may discourage rapid economic development
STRENGTH
WEAKNESS
OPPORTUNITIES
THREAT

© 2
013 C
RIS
IL L
td.
All
rig
hts
reserv
ed.
Review of 1st Generation CDP
35

© 2
013 C
RIS
IL L
td.
All
rig
hts
reserv
ed.
Review of 1st generation CDP
1st Generation CDP of Nagpur defines Vision of Nagpur’s development which was
36
City’s Vision
“The Growth Nucleus of Central India”
“To be an eco city that provides adequate, equitable, sustainable access of urban
services for all citizens
.. a city that is safe, livable and promotes growth of its citizens”
Sectoral Vision
Water Supply
“Water for all and 24 x 7 water supplies along with safe,
equity, reliability”
Sewerage
“100% coverage of sewerage collection and treatment
of waste water”
Solid Waste management
“Clean City and Bin-Free City”
Education & Health
“ Eradication of preventive diseases by 2011 and
making nagpur a medical service hub”
Urban Environment
“Clean and Green City”
Urban Poor
“Access to basic services to all urban poor”

© 2
013 C
RIS
IL L
td.
All
rig
hts
reserv
ed.
Review of 1st generation CDP
Recommendations
– Implementation of infrastructure project under JNNURM, BSUP
– Institutional reforms for improving urban governance of the organisation
– Capacity building and augmentation for improving service delivery and timely implementation of
projects
Nagpur’s Capital Investment Plan estimated in CDP
– Total Investment requirement identified was around 5894 crores for all sectors. 19 project worth 26%
of total investment identified got approval under JNNURM and access to 70% of grants
37
No. Sectors Investment as
per CDP
(Rs. Cr)
1 Water supply 590
2 Sewerage 515
3 Storm Water Drains 246
4 Solid Waste Management 50
5 Slum development 1592
6 Water Recycling and Reuse 250
7 Roads 1086
8 MRTS and Traffic Management 1550
9 Social Amenities 15
10 IT/ E-Governance 0
Total 5894
Approved cost
(Rs. Cr)
1249
130
138
14
1518
No. of
Completed
Projects
Expenditure
till June 2013
Other
CAPEX
6 716.41
95.87
2 171.11
1 11.47
8 + 1 994.87 703.00

© 2
013 C
RIS
IL L
td.
All
rig
hts
reserv
ed.
Review of 1st generation CDP
Key reforms implemented at Nagpur
– E-Governance project and reforms are implemented and has been operationalised.
– NMC has implemented Double Entry Accounting System much ahead of JNURM project
– Budgetary reform and codes are prepared and implemented
– Water Supply system – NMC has levied user charges and been able to recover 100%
O&M cost
– AutoDCR for building approvals and guidelines for Building Bye laws
– Bye laws for Recycle and reuse of Waste Water prepared
– Bye laws for Rain Water Harvesting in place
38

© 2
013 C
RIS
IL L
td.
All
rig
hts
reserv
ed.
Vision Framing
39

© 2
013 C
RIS
IL L
td.
All
rig
hts
reserv
ed.
Visioning Exercise - Group Discussion and Strategy
formulation
40
What is expected from groups
– CITY VISION
– SECTORAL STRATEGIES- Groups
1. Urban Infrastructure : Water Supply, Sewerage and
Solid Waste Management
2. Urban Transportation
3. Economic Development
4. Revenue Mobilisation
5. Planning
6. Heritage & Social Infrastructure (Health &
Education)
What is to be done by groups
– Identify the Key Issues (for the assigned sector)
– Key suggestions (for the assigned sector)
– Tentative Project (if any)
– Time frame for implementation wherever possible
– 20 minutes for discussion and 10 minutes for each
group leader to present their views

© 2
013 C
RIS
IL L
td.
All
rig
hts
reserv
ed.
Thank You
41
Please Share your Suggestions and opinions about the Key issues, suggestions on strategies to be
adopted for any of the sectors as provided in the presentation which will be considered while
preparation of revised CDP for Nagpur.
Also, request to share insights, reports, notes, any information you feel is helpful for revise CDP
preparation for Nagpur. For this, please use the below mentioned link;
https://docs.google.com/forms/d/1A_vOI1DfdiYQxaVwn_YTufLnCJGdvIQ78w6hvfN5v7k/viewform
Contact Details;
Share your suggestions with us via e-mail;
• Nodal Officer, NMC, Nagpur – Mr. Shashikant Hastak – [email protected]
• CRISIL – Brijgopal Ladda – [email protected]
Harsh Shah – [email protected]
In case of feeling to call;
• Nodal Officer, NMC, Nagpur – Mr. Shashikant Hastak – +91-9823098620
• CRISIL – Brijgopal Ladda – +91-9966177833
Harsh Shah – +91-8552857799

© 2
013 C
RIS
IL L
td.
All
rig
hts
reserv
ed.
CRISIL Risk & Infrastructure Solutions Limited A Subsidiary of CRISIL Limited, a Standard & Poor’s Company
www.crisil.com