review - vanderbilt university
TRANSCRIPT

REVIEW
13C flux analysis of cyanobacterial metabolism
Adeola O. Adebiyi • Lara J. Jazmin •
Jamey D. Young
Received: 14 April 2014 / Accepted: 22 September 2014
� Springer Science+Business Media Dordrecht 2014
Abstract 13C metabolic flux analysis (MFA) has made
important contributions to our understanding of the phys-
iology of model strains of E. coli and yeast, and it has been
widely used to guide metabolic engineering efforts in these
microorganisms. Recent advancements in 13C MFA
methodology combined with publicly available software
tools are creating new opportunities to extend this approach
to examine less characterized microbes. In particular,
growing interest in the use of cyanobacteria as industrial
hosts for photosynthetic production of biofuels and bio-
chemicals has led to a critical need to better understand
how cyanobacterial metabolic fluxes are regulated in
response to changes in growth conditions or introduction of
heterologous pathways. In this contribution, we review
several prior studies that have applied isotopic steady-state13C MFA to examine heterotrophic or mixotrophic growth
of cyanobacteria, as well as recent studies that have pio-
neered the use of isotopically nonstationary MFA (INST-
MFA) to study autotrophic cultures. We also provide rec-
ommendations for the design and analysis of INST-MFA
experiments in cyanobacteria, based on our previous
experience and a series of simulation studies used to assess
the selection of measurements and sample time points. We
anticipate that this emerging knowledgebase of prior 13C
MFA studies, optimized experimental protocols, and public
software tools will catalyze increasing use of 13C MFA
techniques by the cyanobacteria research community.
Keywords Metabolic flux analysis � Cyanobacteria �Isotope labeling experiment � Optimal experiment design �Isotopically nonstationary MFA
Abbreviations
2PG 2-Phosphoglycolate
3PGA 3-Phosphoglycerate
ACA Acetyl CoA
AKG a-Ketoglutarate
ALA Alanine
ARG Arginine
ASN Asparagine
ASP Aspartate
CIT Citrate
CO2 Carbon dioxide
CYS Cysteine
E4P Erythrose-4-phosphate
F6P Fructose-6-phosphate
FBP Fructose-1,6-bisphosphate
FUM Fumarate
G1P Glucose-1-phosphate
G6P Glucose-6-phosphate
GA Glycerate
GLC Glycolate
GLN Glutamine
GLU Glutamate
GLY Glycine
GLYC Glycogen
GOX Glyoxylate
HIS Histidine
ICI Isocitrate
ILE Isoleucine
Guest Editor: Peter Lindblad.
A. O. Adebiyi � L. J. Jazmin � J. D. Young
Department of Chemical and Biomolecular Engineering,
Vanderbilt University, Nashville, TN 37235, USA
J. D. Young (&)
Department of Molecular Physiology and Biophysics, Vanderbilt
University, Nashville, TN 37235, USA
e-mail: [email protected]
123
Photosynth Res
DOI 10.1007/s11120-014-0045-1
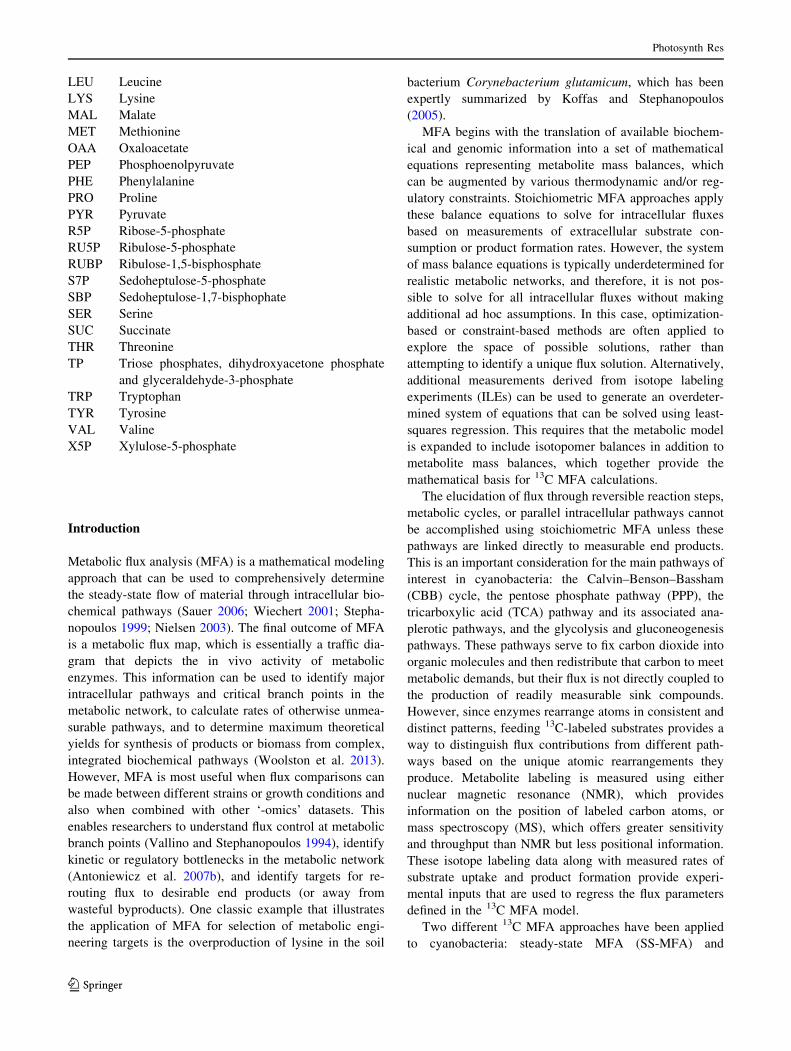
LEU Leucine
LYS Lysine
MAL Malate
MET Methionine
OAA Oxaloacetate
PEP Phosphoenolpyruvate
PHE Phenylalanine
PRO Proline
PYR Pyruvate
R5P Ribose-5-phosphate
RU5P Ribulose-5-phosphate
RUBP Ribulose-1,5-bisphosphate
S7P Sedoheptulose-5-phosphate
SBP Sedoheptulose-1,7-bisphophate
SER Serine
SUC Succinate
THR Threonine
TP Triose phosphates, dihydroxyacetone phosphate
and glyceraldehyde-3-phosphate
TRP Tryptophan
TYR Tyrosine
VAL Valine
X5P Xylulose-5-phosphate
Introduction
Metabolic flux analysis (MFA) is a mathematical modeling
approach that can be used to comprehensively determine
the steady-state flow of material through intracellular bio-
chemical pathways (Sauer 2006; Wiechert 2001; Stepha-
nopoulos 1999; Nielsen 2003). The final outcome of MFA
is a metabolic flux map, which is essentially a traffic dia-
gram that depicts the in vivo activity of metabolic
enzymes. This information can be used to identify major
intracellular pathways and critical branch points in the
metabolic network, to calculate rates of otherwise unmea-
surable pathways, and to determine maximum theoretical
yields for synthesis of products or biomass from complex,
integrated biochemical pathways (Woolston et al. 2013).
However, MFA is most useful when flux comparisons can
be made between different strains or growth conditions and
also when combined with other ‘-omics’ datasets. This
enables researchers to understand flux control at metabolic
branch points (Vallino and Stephanopoulos 1994), identify
kinetic or regulatory bottlenecks in the metabolic network
(Antoniewicz et al. 2007b), and identify targets for re-
routing flux to desirable end products (or away from
wasteful byproducts). One classic example that illustrates
the application of MFA for selection of metabolic engi-
neering targets is the overproduction of lysine in the soil
bacterium Corynebacterium glutamicum, which has been
expertly summarized by Koffas and Stephanopoulos
(2005).
MFA begins with the translation of available biochem-
ical and genomic information into a set of mathematical
equations representing metabolite mass balances, which
can be augmented by various thermodynamic and/or reg-
ulatory constraints. Stoichiometric MFA approaches apply
these balance equations to solve for intracellular fluxes
based on measurements of extracellular substrate con-
sumption or product formation rates. However, the system
of mass balance equations is typically underdetermined for
realistic metabolic networks, and therefore, it is not pos-
sible to solve for all intracellular fluxes without making
additional ad hoc assumptions. In this case, optimization-
based or constraint-based methods are often applied to
explore the space of possible solutions, rather than
attempting to identify a unique flux solution. Alternatively,
additional measurements derived from isotope labeling
experiments (ILEs) can be used to generate an overdeter-
mined system of equations that can be solved using least-
squares regression. This requires that the metabolic model
is expanded to include isotopomer balances in addition to
metabolite mass balances, which together provide the
mathematical basis for 13C MFA calculations.
The elucidation of flux through reversible reaction steps,
metabolic cycles, or parallel intracellular pathways cannot
be accomplished using stoichiometric MFA unless these
pathways are linked directly to measurable end products.
This is an important consideration for the main pathways of
interest in cyanobacteria: the Calvin–Benson–Bassham
(CBB) cycle, the pentose phosphate pathway (PPP), the
tricarboxylic acid (TCA) pathway and its associated ana-
plerotic pathways, and the glycolysis and gluconeogenesis
pathways. These pathways serve to fix carbon dioxide into
organic molecules and then redistribute that carbon to meet
metabolic demands, but their flux is not directly coupled to
the production of readily measurable sink compounds.
However, since enzymes rearrange atoms in consistent and
distinct patterns, feeding 13C-labeled substrates provides a
way to distinguish flux contributions from different path-
ways based on the unique atomic rearrangements they
produce. Metabolite labeling is measured using either
nuclear magnetic resonance (NMR), which provides
information on the position of labeled carbon atoms, or
mass spectroscopy (MS), which offers greater sensitivity
and throughput than NMR but less positional information.
These isotope labeling data along with measured rates of
substrate uptake and product formation provide experi-
mental inputs that are used to regress the flux parameters
defined in the 13C MFA model.
Two different 13C MFA approaches have been applied
to cyanobacteria: steady-state MFA (SS-MFA) and
Photosynth Res
123
isotopically nonstationary MFA (INST-MFA) (Fig. 1). The
term ‘‘steady state’’ refers to isotopic steady state, which
implies that labeling measurements are obtained after 13C
incorporation into intracellular metabolites has fully
equilibrated. Ideally, the experiment is performed in con-
tinuous culture to maintain metabolic steady state
throughout the ILE; alternatively, exponential-phase batch
cultures have been used to approximate metabolic steady-
state conditions. The isotope tracer is typically a mixture of13C labeled glucose analogs, the composition of which
should be selected to maximize flux precision within the
pathways of interest (Antoniewicz 2013). Cell biomass
samples are harvested and hydrolyzed to measure 13C
labeling in proteinogenic amino acids, chosen for their high
intracellular abundance compared to free intracellular
metabolites and for the distinct metabolic pathways rep-
resented by their carbon precursors (Fig. 2). Based on the
assumptions of metabolic and isotopic steady state, the
isotopomer balances form a system of algebraic equations
that can be solved to simulate how isotope labeling
depends on the flux parameters in the 13C MFA model.
Sophisticated computational algorithms such as the
cumomer method and elementary metabolite unit (EMU)
method have been introduced to solve these equations
efficiently, which facilitate rapid flux estimation and sta-
tistical analysis, even in large metabolic networks (Wiec-
hert et al. 1999; Arauzo-Bravo and Shimizu 2003;
Antoniewicz et al. 2007a).
INST-MFA becomes necessary when the assumption of
isotopic steady state is no longer valid. It is especially
useful for studies of autotrophic metabolism, since feeding13CO2 will eventually produce a uniform 13C-labeling
pattern in all downstream metabolites, and therefore,
steady-state labeling measurements do not reflect carbon
atom rearrangements within the network (Shastri and
Morgan 2007). However, transient measurements of iso-
tope incorporation following a feed switch from natural
CO2 to 13CO2 can be used to estimate autotrophic fluxes by
applying INST-MFA (Young et al. 2011). Our lab has
recently developed a package of MATLAB routines called
INCA that automates the computational workflow of INST-
MFA (Young 2014). This involves solving a coupled sys-
tem of ordinary differential equations that comprises the
transient isotopomer balances. INCA relies on the EMU
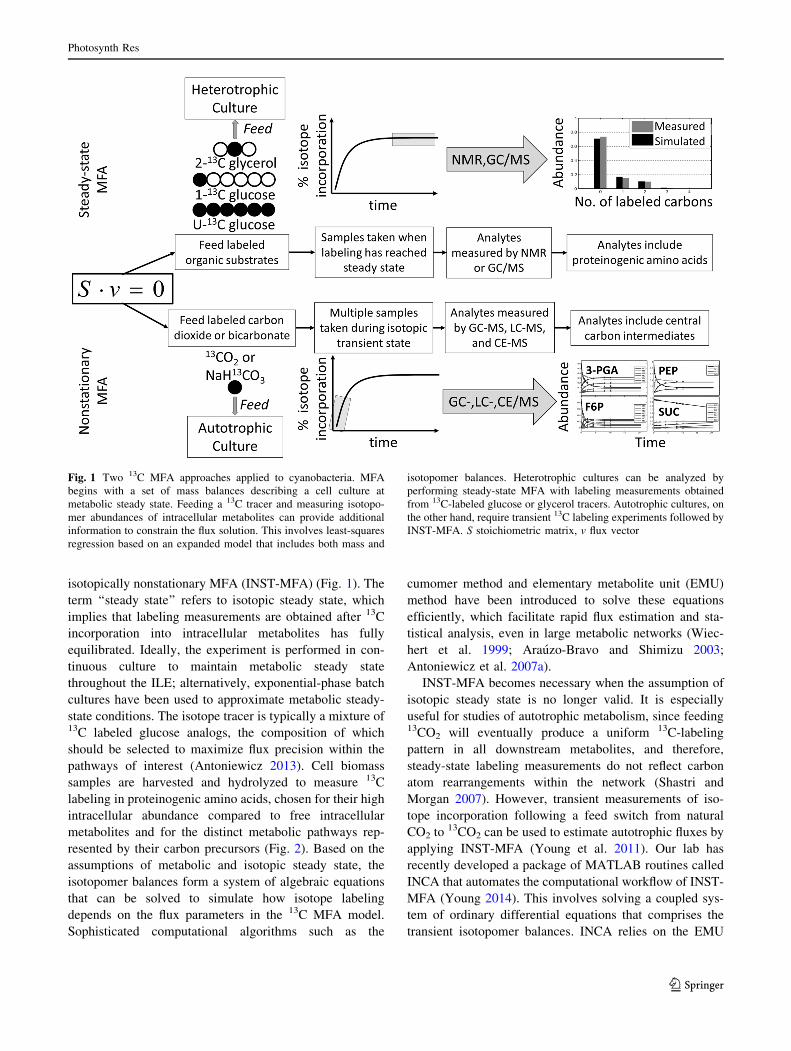
Fig. 1 Two 13C MFA approaches applied to cyanobacteria. MFA
begins with a set of mass balances describing a cell culture at
metabolic steady state. Feeding a 13C tracer and measuring isotopo-
mer abundances of intracellular metabolites can provide additional
information to constrain the flux solution. This involves least-squares
regression based on an expanded model that includes both mass and
isotopomer balances. Heterotrophic cultures can be analyzed by
performing steady-state MFA with labeling measurements obtained
from 13C-labeled glucose or glycerol tracers. Autotrophic cultures, on
the other hand, require transient 13C labeling experiments followed by
INST-MFA. S stoichiometric matrix, v flux vector
Photosynth Res
123
framework to efficiently simulate transient 13C labeling
experiments (Young et al. 2008), making it the first pub-
lically available software package that can apply INST-
MFA to metabolic networks of arbitrary size and com-
plexity. The experimental system must be maintained at
metabolic steady state throughout the labeling time course,
but the tracer experiments are performed on a time scale of
minutes rather than hours in order to assess the dynamics of13C incorporation. For this reason, isotopomer measure-
ments obtained from proteinogenic amino acids are not
useful for INST-MFA due to their slower rate of labeling.
Instead, rapid sampling and cold-quenching of cells is
required to fix the in vivo labeling state of central carbon
metabolites, which can be measured in cell extract samples
using a variety of mass spectrometry approaches (Jazmin
and Young 2013; Jazmin et al. 2014).
Berla et al. (2013) have recently reviewed applications
of stoichiometric MFA to cyanobacteria, and a number of
other recent articles have reviewed applications of 13C
MFA to examine general aspects of microbial metabolism
(Matsuoka and Shimizu 2010; Tang et al. 2009). In this
contribution, we first review prior applications of both SS-
MFA and INST-MFA to cyanobacteria as a way to high-
light its utility for discovering novel metabolic functions in
this important class of microbes. Then, we provide rec-
ommendations for design and analysis of INST-MFA
studies of cyanobacteria, since this is an emerging area of
research with few examples currently established in the
literature. These recommendations are based on our prior
experience with this technique as well as comprehensive in
silico studies that have been performed to optimize the
selection of measurements and sampling time points.
Applications of 13C MFA to cyanobacteria
Steady-state 13C MFA
Steady-state MFA was first applied to Synechocystis sp.
PCC 6803 to investigate central carbon metabolism under
mixotrophic and heterotrophic conditions (Yang et al.
2002a, b, c). The predominant mode of carbon utilization
was determined by analyzing metabolites using a mixed
feed of 90 % unlabeled glucose and 10 % fully labeled
[U-13C6] glucose. Heterotrophic cells were found to utilize
the oxidative PPP (oxPPP) almost exclusively for energy
production, with more than 90 % of the incoming glucose
metabolized by this pathway to produce NADPH for
growth and respiration. The coupling of NADPH produc-
tion to oxidative phosphorylation represents a unique
respiratory pathway found in cyanobacteria and is believed
to compensate for the lack of an intact cyanobacterial TCA
cycle (Pelroy et al. 1972). Under mixotrophic conditions,
Calvin cycle flux was approximately two-fold higher than
glucose uptake, fueled by NADPH and ATP production
from photosynthetic light reactions. However, flux through
RuBisCO still only accounted for one-third of the total
carbon uptake. The authors also noted a substantial cyclic
flux through phosphoenolpyruvate carboxylase (PEPC) and
malic enzyme (ME) under both heterotrophic and mixo-
trophic conditions, which is similar to the pathway of
carbon assimilation found in C4 plants.
In addition to their 13C MFA studies, Yang et al. (2002a)
compared mRNA transcript levels and protein expressions
with pathway fluxes to decipher mechanisms of metabolic
regulation. Consistent with their flux results, genes
encoding phycobilisomes, RuBisCO, and the Calvin-cycle-
associated gap2 isoform of glyceraldehyde-3-phosphate
dehydrogenase (GAPDH) were all transcriptionally
repressed under heterotrophic conditions, while the oxPPP
gene gnd was upregulated by about 60 %. Conversely,
some expression levels did not appear to be in agreement
with the flux results, indicating post-translational regula-
tion by cellular redox or metabolite concentrations. For
example, several genes encoding enzymes of central
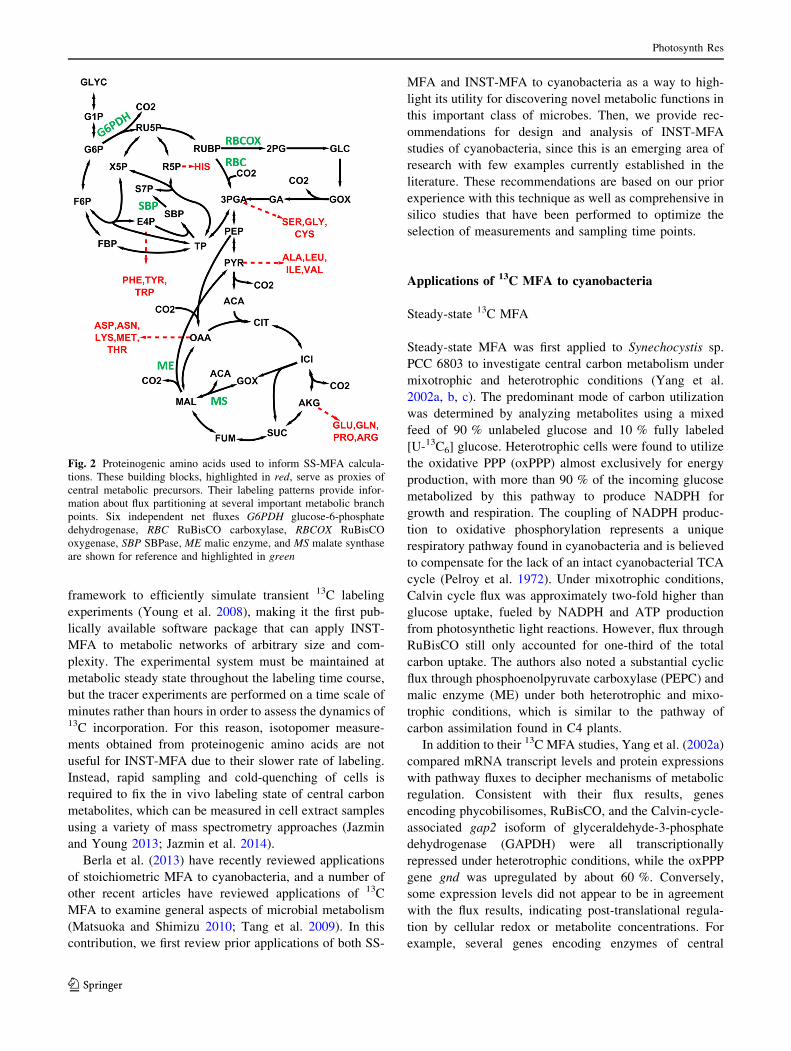
Fig. 2 Proteinogenic amino acids used to inform SS-MFA calcula-
tions. These building blocks, highlighted in red, serve as proxies of
central metabolic precursors. Their labeling patterns provide infor-
mation about flux partitioning at several important metabolic branch
points. Six independent net fluxes G6PDH glucose-6-phosphate
dehydrogenase, RBC RuBisCO carboxylase, RBCOX RuBisCO
oxygenase, SBP SBPase, ME malic enzyme, and MS malate synthase
are shown for reference and highlighted in green
Photosynth Res
123

carbon metabolism including prk, zwf, gap1, fbp, pfkA,
fbaA, fda, glk, cfxE, ppc, icd, and citH were largely unaf-
fected by light at the transcriptional level despite dramatic
rerouting of flux through these pathways. This work
highlights the utility of 13C MFA to uncover novel insights
about regulatory mechanisms when combined with other ‘-
omics’ platforms.
Nakajima et al. (2014) combined 13C MFA with meta-
bolomics and transcriptomics analysis of Synechocystis to
compare cells grown under mixotrophic conditions and
photoheterotrophic conditions. Labeling was achieved by
an optimized 0.7:0.3 mix of [1-13C] glucose and [U-13C6]
glucose while atrazine was added to the photoheterotrophic
cultures to inhibit photosynthesis. Samples were taken
during the exponential growth phase, and nine proteino-
genic amino acids were selected for analysis: alanine,
aspartate, glutamate, phenylalanine, glycine, isoleucine,
leucine, serine, and valine. A comparison of the fluxes and
their 95 % confidence intervals showed that over half of
the fluxes differed significantly between the two culture
conditions. Changes in enzyme expression within these
pathways were less dramatic, with most genes differing by
less than two-fold between mixotrophic and photohetero-
trophic conditions. A six-fold increase in RuBisCo flux was
observed under mixotrophic conditions when compared to
photoheterotrophic conditions. However, there was no
significant change in the levels of RU5P or ribulose-1,5-
bisphosphate (RUBP) or expression of prk, rbcL, or rbcS.
OxPPP flux was elevated under photoheterotrophic condi-
tions to compensate for loss of photosynthetically produced
NAPDH, but gene expression was again unaffected. In
contrast to the previous study of Yang et al. (2002c), some
residual oxPPP flux was still detectable under mixotrophic
conditions. The authors attributed this to the lower light
intensity used in the more recent study (40 vs.
125 lmol m-2 s-1), consistent with model predictions
reported by Shastri and Morgan (2005). The gene that
exhibited the largest expression change was gap1, which
encodes an isoform of glyceraldehyde-3-phospate dehy-
drogenase (GAPDH) that is essential for glycolytic glucose
breakdown and was suggested to respond to NADPH levels
by shifting carbon flow between glycolysis and oxPPP.
Another recent study by You et al. (2014) confirmed
conclusions from previous studies but also provided a new
perspective on TCA cycle in Synechocystis 6803 under
mixotrophic growth conditions. In addition to 13C MFA,
isotope dilution experiments were performed to identify the
presence of particular pathways. To accomplish this, cells
were fully labeled using NaH13CO3 and [U-13C6] glucose,
after which unlabeled glyoxylate or glutamate was added to
determine the activities of specific reactions. Similar to the
flux analysis of Nakajima et al. (2014), this study calcu-
lated a zero flux through the glyoxylate shunt. The MFA
model yielded evidence of high malic enzyme activity in
agreement with the previous analysis by Yang et al.
(2002b). OxPPP flux was low under the light- and carbon-
sufficient conditions of the early-exponential phase, but
labeling in late-exponential phase indicated higher oxPPP
activity. You et al. focused particular attention toward
elucidating the direction and activity of the TCA cycle.
Isotope dilution with glutamate detected carbon flow
through a-ketoglutatarate to succinate, consistent with
activity of the a-ketoglutatarate decarboxylase bypass
pathway recently discovered by Zhang and Bryant (2011).
However, 13C MFA verified that flux through this pathway
was negligibly small, in agreement with previous MFA
studies.
In addition to Synechocystis, other strains of cyanobac-
teria have also become the subject of recent flux profiling
experiments. A steady-state 13C labeling study by Feng
et al. (2010) investigated the effects of different carbon and
nitrogen substrates on the central metabolism of Cyanot-
hece sp. ATCC 51142 under continuous light conditions.
Three labeled substrates were tested ([U-13C] glucose,
[2-13C] glycerol, and [3-13C] pyruvate) in either nitrogen-
fixing or nitrogen-sufficient conditions to determine their
impacts on growth and amino acid biosynthesis. GC–MS
was used to analyze the 13C enrichment of five amino
acids: histidine and serine, which are synthesized in the
Calvin cycle and PPP; alanine, which is derived from
pyruvate; and aspartate and glutamate, which are both TCA
cycle derivatives (Fig. 2). Glycerol addition doubled the
specific growth rate under both nitrogen-fixing and nitro-
gen-sufficient conditions, but neither glucose nor pyruvate
enhanced growth in comparison to a control photoauto-
trophic culture. Consistent with this observation, the con-
tribution of glycerol carbon to amino acid biosynthesis was
substantially higher than either glucose or pyruvate. Fur-
thermore, the amino acids histidine, alanine, and serine
were completely derived from glycerol carbon under
nitrogen-sufficient conditions, indicating a shift to photo-
heterotrophic growth. This study highlights the use of 13C
labeling studies to reveal major pathways of carbon utili-
zation in less characterized species.
Although Feng et al. (2010) made extensive use of 13C
labeling data to determine the contributions of extracellular
carbon substrates to intracellular amino acid pools, the
authors did not attempt to estimate intracellular fluxes
using rigorous pathway modeling. Another study by
Alagesan et al. (2013) provided a more comprehensive flux
analysis of Cyanothece sp. ATCC 51142 metabolism under
similar growth conditions. A comparison of these two
studies underscores the effects that culture conditions and
measurement availability have on the computed fluxes.
Both groups analyzed growth in nitrogen-sufficient and
nitrogen-fixing conditions using 13C-labeled glycerol as a
Photosynth Res
123

carbon source. However, Feng et al. determined that a
glycerol-fed culture in nitrogen-replete media exhibited
photoheterotrophic growth in the presence of light, while
Alagesan et al. observed mixotrophic metabolism under
similar conditions. The variation in culture experimental
setup likely caused this difference, as the latter group chose
a higher light intensity (100 vs. 50 lmol m-2 s-1) to avoid
light limitation, and the cells were harvested early in the
exponential growth phase to maintain sufficient CO2
availability. Also, a greater number of amino acids were
analyzed by Alagesan et al., providing increased redun-
dancy and pathway coverage. This enabled 13C MFA to be
performed based on an extensive metabolic model that
included a complete TCA cycle, as recently reported by
Zhang and Bryant (2011). In both cases, the addition of
glycerol to the media resulted in a higher growth rate, and
both groups also noted incorporation of CO2 through ana-
plerotic pathways involved in the formation of oxaloacetate
(OAA) from PEP (i.e., C4-like metabolism). Further
evaluation of this strain would benefit from standardized
growth conditions and also by extending the 13C MFA
studies to include additional isotopomer measurements
beyond those obtained from proteinogenic amino acids.
13C INST-MFA
The development of software packages such as INCA has
enabled INST-MFA studies of autotrophic metabolism in
cyanobacteria, which complement previous studies that
have been limited to heterotrophic or mixotrophic condi-
tions. The approach was first applied by Young et al.
(2011) to the model cyanobacterium Synechocystis 6803
growing in a controlled photobioreactor. The study relied
on both GC–MS and LC–MS/MS to quantify labeling
trajectories of 15 intracellular metabolites following
administration of 13C-labeled bicarbonate to the culture
(Fig. 3). This was the first comprehensive flux analysis
performed based on isotope labeling data obtained in a
fully autotrophic system. Steady-state labeling was typi-
cally achieved in less than 10 min, with the notable
exception of TCA pathway intermediates (e.g., succinate,
fumarate, and citrate) that were more slowly labeled. The
flux map obtained using 13C INST-MFA was compared to
a previously published linear programing (LP) solution that
predicted the theoretical optimum flux profile needed to
maximize growth and minimize light utilization (Shastri
and Morgan 2005). Overall, the results indicated that
photoautotrophically grown Synechocystis cells exhibited
suboptimal carbon efficiency, with significant loss of fixed
CO2 via oxPPP. This provides an example of how flux
analysis can be used to identify pathways responsible for
reduced productivity, by pinpointing wasteful processes
that contribute to carbon losses. These pathways offer
potential metabolic engineering targets that can be
manipulated to increase flux to desirable products.
Earlier that same year, Huege et al. (2011) published
results from a transient 13C labeling study comparing wild-
type Synechocystis and two photorespiratory pathway
mutants pre-acclimated to either high carbon (HC) or low
carbon (LC) conditions. Although the authors did not
attempt to perform a comprehensive flux analysis, they
were able to assess metabolite turnover and provide local
flux estimates (e.g., sucrose production) based on the
observed dynamics of total 13C enrichment. Despite dif-
fering growth and labeling conditions, the wild-type results
were largely in agreement with the findings of Young et al.
(2011). It was determined in both cases that activity of C3
metabolism involving RuBisCO was the primary source of
carbon fixation, although C4 metabolism through PEP
carboxylase (PEPC) was active to a lesser degree as noted
in the Cyanothece studies (Feng et al. 2010; Alagesan et al.
2013). However, Huege et al. noted PEPC activity only in
LC conditions, whereas Young et al. calculated flux in the
equivalent of HC conditions. Both groups noted that Ru-
BisCO oxygenase activity was very low in the wild-type
strains. Also, the glyoxylate shunt was found to be inactive
in both of these studies, as no evidence was found in the13C labeling data to support its presence under photoau-
totrophic conditions. Lastly, both groups noted the possi-
bility of metabolite channeling within pathways, where
enzymes catalyzing successive reactions cluster together
spatially in order to minimize diffusional limitations. This
effect was revealed by more rapid 13C enrichment and
higher steady-state labeling of some downstream metabo-
lites relative to upstream metabolites, which could not be
explained in the absence of metabolite channeling.
A similar transient 13C labeling study was recently
combined with intracellular metabolite profiling to inves-
tigate the response to nitrate depletion in cyanobacteria
(Hasunuma et al. 2013). In Arthrospira platensis and
Synechocystis 6803, the rate of 13C incorporation in central
carbon metabolites and amino acids was determined over a
thirty-minute period of labeling with NaH13CO3. In com-
parison with cells grown under nitrogen-replete conditions,
nitrogen depletion resulted in lower cell growth rate, lower
percentage of proteins in the cell, and higher glycogen
content. The 13C labeling data indicated that, with the
exception of glutamine and glutamate, the enrichment of
most intracellular metabolites was significantly decreased
in A. platensis cells cultivated without nitrate. These find-
ings suggest that cyanobacteria placed under nitrogen
stress conditions degrade intracellular proteins to amino
acids, which then serve as the carbon source for glycogen
synthesis.
Photosynth Res
123

Study design for 13C INST-MFA of cyanobacteria
Measurement capabilities
In general, there are three types of measurements that are
useful for INST-MFA studies, listed here in order of
importance and discussed further below: (i) extracellular
exchange rates, (ii) intracellular 13C labeling, and (iii)
extracellular 13C labeling. Unlike related approaches such
as kinetic flux profiling (Yuan et al. 2008), direct mea-
surements of intracellular metabolite pool sizes are not
essential for flux estimation by INST-MFA (Young et al.
2011). The pool sizes are treated as adjustable model
parameters, which are optimized to match the experi-
mental labeling dynamics during the data regression.
This is a significant advantage of INST-MFA over other
modeling approaches that depend explicitly on pool size
measurements or kinetic parameters not reliably known
in vivo. While pool size measurements can be provided
to the data regression as a way to further improve flux
resolution, it is often difficult to achieve absolute quan-
tification of intracellular pool sizes due to losses
during metabolite extraction or unknown subcellular
compartmentalization of reactions. Furthermore, we have
learned from experience that precise flux estimates can
be obtained without provision of direct pool size mea-
surements. Therefore, we have avoided the potential
biases that may be introduced by including pool size
measurements in our INST-MFA calculations but instead
have used them to independently validate the model-
derived estimates.
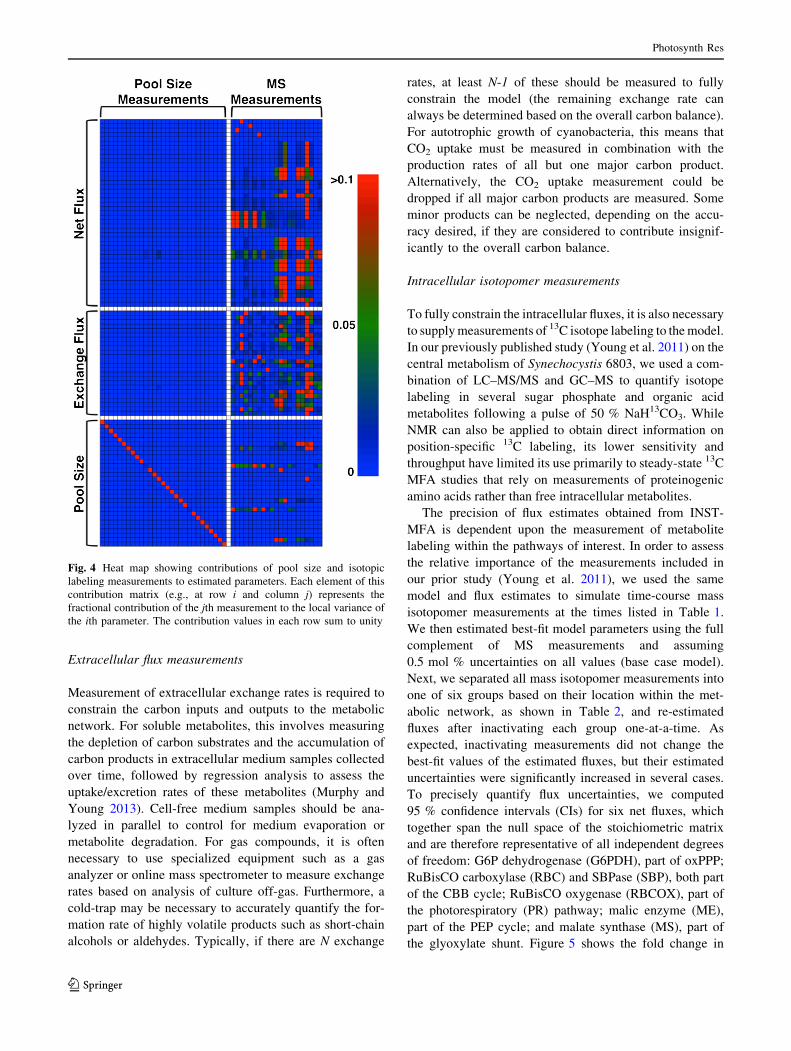
To further examine the effects of pool size measure-
ments on estimated fluxes, we used our previous metabolic
model of Synechocystis 6803 and treated the pool size
estimates determined by INST-MFA as if they were
directly measured values, assuming 10 % relative errors.
From this simulated dataset, we computed a contribution
matrix based on local parameter sensitivities (Antoniewicz
et al. 2006). The contribution heat map (Fig. 4) shows that
the MS labeling measurements were most important for
determining the values of the net and exchange fluxes,
while the pool size measurements made negligible contri-
butions toward flux determination. Therefore, the avail-
ability of direct pool size measurements would not be
expected to significantly improve the precision of flux
estimates obtainable with this model.
Fig. 3 Workflow of INST-MFA in cyanobacteria. Labeled CO2 or
bicarbonate is fed to a culture at metabolic (quasi-) steady state, and
metabolite labeling is measured over time using mass spectrometry.
The mass isotopomer distributions (MIDs) of all measured
metabolites are compared with simulated values produced by a
mathematical model of the transient isotopomer balances. The fluxes
in the model are iteratively adjusted until the simulated MIDs match
their experimentally determined values
Photosynth Res
123
Extracellular flux measurements
Measurement of extracellular exchange rates is required to
constrain the carbon inputs and outputs to the metabolic
network. For soluble metabolites, this involves measuring
the depletion of carbon substrates and the accumulation of
carbon products in extracellular medium samples collected
over time, followed by regression analysis to assess the
uptake/excretion rates of these metabolites (Murphy and
Young 2013). Cell-free medium samples should be ana-
lyzed in parallel to control for medium evaporation or
metabolite degradation. For gas compounds, it is often
necessary to use specialized equipment such as a gas
analyzer or online mass spectrometer to measure exchange
rates based on analysis of culture off-gas. Furthermore, a
cold-trap may be necessary to accurately quantify the for-
mation rate of highly volatile products such as short-chain
alcohols or aldehydes. Typically, if there are N exchange
rates, at least N-1 of these should be measured to fully
constrain the model (the remaining exchange rate can
always be determined based on the overall carbon balance).
For autotrophic growth of cyanobacteria, this means that
CO2 uptake must be measured in combination with the
production rates of all but one major carbon product.
Alternatively, the CO2 uptake measurement could be
dropped if all major carbon products are measured. Some
minor products can be neglected, depending on the accu-
racy desired, if they are considered to contribute insignif-
icantly to the overall carbon balance.
Intracellular isotopomer measurements
To fully constrain the intracellular fluxes, it is also necessary
to supply measurements of 13C isotope labeling to the model.
In our previously published study (Young et al. 2011) on the
central metabolism of Synechocystis 6803, we used a com-
bination of LC–MS/MS and GC–MS to quantify isotope
labeling in several sugar phosphate and organic acid
metabolites following a pulse of 50 % NaH13CO3. While
NMR can also be applied to obtain direct information on
position-specific 13C labeling, its lower sensitivity and
throughput have limited its use primarily to steady-state 13C
MFA studies that rely on measurements of proteinogenic
amino acids rather than free intracellular metabolites.
The precision of flux estimates obtained from INST-
MFA is dependent upon the measurement of metabolite
labeling within the pathways of interest. In order to assess
the relative importance of the measurements included in
our prior study (Young et al. 2011), we used the same
model and flux estimates to simulate time-course mass
isotopomer measurements at the times listed in Table 1.
We then estimated best-fit model parameters using the full
complement of MS measurements and assuming
0.5 mol % uncertainties on all values (base case model).
Next, we separated all mass isotopomer measurements into
one of six groups based on their location within the met-
abolic network, as shown in Table 2, and re-estimated
fluxes after inactivating each group one-at-a-time. As
expected, inactivating measurements did not change the
best-fit values of the estimated fluxes, but their estimated
uncertainties were significantly increased in several cases.
To precisely quantify flux uncertainties, we computed
95 % confidence intervals (CIs) for six net fluxes, which
together span the null space of the stoichiometric matrix
and are therefore representative of all independent degrees
of freedom: G6P dehydrogenase (G6PDH), part of oxPPP;
RuBisCO carboxylase (RBC) and SBPase (SBP), both part
of the CBB cycle; RuBisCO oxygenase (RBCOX), part of
the photorespiratory (PR) pathway; malic enzyme (ME),
part of the PEP cycle; and malate synthase (MS), part of
the glyoxylate shunt. Figure 5 shows the fold change in
Fig. 4 Heat map showing contributions of pool size and isotopic
labeling measurements to estimated parameters. Each element of this
contribution matrix (e.g., at row i and column j) represents the
fractional contribution of the jth measurement to the local variance of
the ith parameter. The contribution values in each row sum to unity
Photosynth Res
123

uncertainty for these six fluxes after inactivating each
measurement group. A group was considered to signifi-
cantly contribute to the identifiability of a particular flux if
the flux’s uncertainty increased by more than 1.5-fold in
response to inactivation of the group. Any groups consid-
ered significant based on this criterion were further
examined by inactivating each individual metabolite within
the group one-at-a-time to determine which contributed the
most toward the observed change in uncertainty.
The results from the flux uncertainty analysis fell into
natural groupings as shown in Fig. 5. The uncertainties of
G6PDH, RBC, and RBCOX fluxes increased by 1.5- to 1.6-
fold upon deactivation of the CBB-5C/7C group, yet fur-
ther analysis showed that this was a cumulative effect of all
four metabolites included in the group, rather than one
specific metabolite. Additionally, the uncertainties of
G6PDH and RBC nearly doubled with the inactivation of
the G6P measurement, and RBCOX quadrupled by the
inactivation of the PR pathway metabolite glycerate. The
second grouping contained the fluxes ME and MS, for
which significant changes were observed upon inactivation
of the TCA pathway measurements (over 5-fold and 2-fold,
respectively) and PEP cycle measurements (over 1.5-fold
and 2.5-fold, respectively). Citrate contributed the most
toward the importance of the TCA group, although no
single measurement within this group was responsible for
the entirety of the observed effect on either ME or MS.
Inactivation of MAL alone led to a nearly 2.5-fold increase
in the ME uncertainty and over a 1.5-fold change in the MS
uncertainty. Furthermore, inactivation of glycerate mea-
surements led to an almost 4-fold increase in the MS
uncertainty, likely because the substrate of this enzyme,
glyoxylate, is also an intermediate in the PR pathway. The
uncertainty of the remaining flux, SBP, was most strongly
affected by the inactivation of the two CBB cycle groups.
In this case, the change induced by dropping the CBB-3C/
6C group was most affected by DHAP (1.6-fold increase),
while the response to dropping the CBB-5C/7C group was
more clearly due to inactivation of the S7P measurement
(7-fold increase).
We also investigated the effects of varying the timing of
sample collections by inactivating different measurement
time points and re-estimating uncertainties for the same six
independent fluxes (Fig. 6). Although most flux estimates
were robust to dropping a few evenly spaced time points,
the identifiability of the SBP flux was affected quite
strongly by evenly spaced removal of time points,
increasing nearly 2-fold upon inactivation of odd time
points. This appears to be largely due to loss of information
at the early time points, since dropping all time points in
the range under 2 min (i = 1–5) caused the SBP flux
uncertainty to increase almost 4-fold. On the other hand,
the other five fluxes were more strongly affected by inac-
tivation of the late time points (i = 6–10). This is likely
due to the fact that insufficient labeling was obtained in
some slowly labeled metabolites (e.g., TCA cycle inter-
mediates) to adequately constrain the flux solution based
on the early time points alone. Predictably, inactivation of
all but three time points (i = 4, 7, and 10) resulted in
increased uncertainty of all fluxes, although the effect on
SBP was more dramatic.
Table 1 Time points chosen
for simulation of mass
isotopomer measurements
Exponentially spaced time
points were simulated as
suggested by Noh and Wiechert
2006): ti = abi-1 for i = 1,
2,…, n, where t1 = a = 20 s,
n = 10, and tn = 900 s. The
exact times calculated using this
formula were rounded to the
values shown
i Ti (s)
1 20
2 30
3 45
4 70
5 110
6 165
7 250
8 390
9 590
10 900
Table 2 List of simulated ion fragments
CBB-3C/6C (G1) CBB-5C/7C (G2) TCA (G3) PEP-cyc (G4) PR (G5) OXPPP (G6)
3PGA185 (1.1) R5P229 (2.1) SUC247 (3.1) PEP167 (4.1) GA292 G6P259
3PGA357 (1.1) RUBP309 (2.2) FUM245 (3.2) MAL233 (4.2) GA307
3PGA459 (1.1) S7P289 (2.3) CIT273 (3.3)
DHAP169 (1.2) RU5P229 (2.4) CIT363 (3.3)
F6P259 (1.3) CIT375 (3.3)
GAP169 (1.4) CIT465 (3.3)
The measured ions were divided into one of six groups based on pathway location and size. The six groups contain CBB cycle 3- and 6-carbon
metabolites, CBB cycle 5- and 7-carbon metabolites, TCA pathway metabolites, PEP cycle metabolites, PR pathway metabolites, and oxPPP
metabolites. The groups were numbered as shown in parentheses, and in the case of G1–G4, ions representing individual metabolites were also
organized into numbered subgroups
Photosynth Res
123

Extracellular isotopomer measurements
Measurement of isotope labeling in extracellular products
is typically unnecessary since their labeling simply reflects
the slow accumulation of material derived from a more
rapidly labeled intracellular pool. These measurements can
provide consistency checks on the intracellular measure-
ments, but usually do not contribute important new infor-
mation. On the other hand, it is important to estimate the
labeling of the tracer substrate itself, which could be 13CO2
or NaH13CO3 in photoautotrophic studies. This could be
estimated based on labeling measurements of CBB inter-
mediates obtained at long time points (after the system
reaches isotopic steady state), since the 13C enrichment of
intracellular metabolites should asymptotically approach
the tracer enrichment at these times. However, this estimate
could be biased downward if there are metabolically
inactive (i.e., ‘‘cold’’) pools that do not fully label even at
long times. Therefore, it would be useful to directly mea-
sure the enrichment of extracellular bicarbonate, although
this has not been done in previous INST-MFA studies. If
necessary, the model can account for the dynamics of
tracer mixing by including an extracellular bicarbonate
pool that gradually equilibrates with the tracer.
Experimental design
Cell culture experiments should be designed to mimic the
physiological conditions of interest as closely as possible,
in order to maximize the relevance of the MFA results. Due
to the substantial biological variance existing within many
organisms, the Metabolomics Standards Initiative has rec-
ommended a minimum of triplicate (n = 3) biological
sampling and analyses, with n = 5 preferred (Sumner et al.
2007). Measurement of extracellular exchange rates can be
performed using parallel experiments in the absence of
isotope tracers, or extracellular samples can be collected
from the ILEs to enable simultaneous measurement of
exchange rates and 13C enrichments from the same culture.
Prior to administering the 13C tracer, the culture metabo-
lism should have reached a stable quasi-steady state (QSS).
This is typically achieved during exponential growth of cell
cultures. Non-exponential cultures can also achieve QSS
metabolism as long as they are not experiencing rapid
Fig. 5 Effect of removing measurements on flux uncertainties.
Groups of measurements (G1–G6) were inactivated in the model,
and the 95 % confidence interval (CI) width for each of six
independent fluxes was recalculated and compared to the base case
model, which includes all measurements examined by Young et al.
(2011). If the CI width increased by more than 1.5-fold, the analysis
was repeated for each individual metabolite in the group to determine
which one(s) contributed most to the observed increase. See Table 2
for a list of measurements included in each group
Photosynth Res
123

changes in growth rate or nutrient levels (i.e., any changes
in metabolism are slow relative to the time scale of the
isotope labeling experiment). However, in these cases, it
may be desirable to perform the labeling experiments in
continuous mode (i.e., in a chemostat or turbidostat) to
achieve maximum control and reproducibility. This would
ensure that the cultures are experiencing the same growth
rate and turbidity during each replicate experiment and will
also enable the culture to be maintained in a fixed QSS for
extended periods of time. The main drawback is that
continuous cultures are more complicated to operate and
may not accurately represent the growth conditions of
interest for bioprocess applications.
Once the QSS to be studied has been established, either13CO2 or NaH13CO3 can be introduced to the culture.
NaH13CO3 can be introduced directly into the culture medium
as a bolus (in batch mode) or as a prime-constant infusion (in
continuous mode). 13CO2 can be introduced by switching the
gas feed to a tracer mixture with identical chemical compo-
sition but with unlabeled CO2 replaced by 13CO2. In either
case, care should be taken not to disturb the previously
established metabolic QSS. One advantage of using a 13CO2
gas feed is that unlabeled carbon will be rapidly washed out of
the culture and replaced by the tracer. Shastri and Morgan
(2007) have performed computational simulations, which
demonstrate that an immediate step change in the enrichment
of dissolved CO2 is possible by selecting proper operating
conditions that account for the volumetric gas–liquid mass
transfer coefficient and composition of air (i.e., %CO2) fed to
the system. This labeling method enables the study of either
light-limited or CO2-limited cultures. If feeding NaH13CO3,
bicarbonate should already be at saturating levels so that the
additional NaH13CO3 bolus will not alter metabolism. In this
case, it is only possible to study light-limited cultures without
disturbing the QSS. Also, a significant amount of NaH13CO3
will need to be added to achieve adequate 13C enrichment of
the extracellular bicarbonate pool, since the tracer will be
diluted by the pre-existing unlabeled bicarbonate in the
medium. In our prior studies, we have found that at least 50 %
enrichment of the extracellular bicarbonate pool is sufficient
for precise flux estimation, although lower enrichments have
not been rigorously assessed.
Once the tracer has been introduced, a time series of cell
and medium samples should be collected at 5–10 time
points spanning 20 min to 1 h. The culture should be
sampled more frequently at early time points when labeling
is changing most rapidly (Noh and Wiechert 2006). Longer
time points (i.e., 1 h or longer), however, provide addi-
tional information especially useful for metabolites with
low turnover rates, such as those in the TCA cycle. The
biomass samples should be rapidly cold-quenched using a
low-temperature solution and centrifuged or filtered to
Fig. 6 Effect of removing time points on flux uncertainties. a Using
data simulated from the base case model, groups of time points were
inactivated as indicated to examine their effect on the CI width of six
independent fluxes. b Transient metabolite labeling data for
RUBP309 is shown as an example of the base case, with a dotted
line to separate time points 1–5 from time points 6–10 (upper), and of
time points 4, 7, and 10 only (lower)
Photosynth Res
123

remove the spent medium (Krall et al. 2009). Then, the cell
pellet can be flash-frozen in liquid nitrogen or can proceed
directly into the metabolite extraction protocol. Culture
medium samples do not need to be rapidly cold-quenched
but instead can be centrifuged to remove cells and then
frozen for later analysis. If 13C flux analysis is to be per-
formed at multiple time points during the growth cycle, it is
recommended to use parallel replicate cultures and intro-
duce the tracer to each culture at different times, rather than
labeling the same culture repeatedly. The INCA program is
currently only able to describe experiments that begin with
an unlabeled (i.e., naturally labeled) culture at the time the
tracer is introduced, so repeatedly labeling the same culture
is not amenable to analysis.
Computational resources
In addition to the experimental requirements for INST-
MFA, there is also a substantial computational component.
This involves developing a mathematical model of the
differential mass and isotopomer balances that describe the
flow of carbon through the metabolic network. The INCA
software package automates the development and solution
of these balance equations (Young 2014). However, sig-
nificant user input is still required (i) to identify the proper
reaction equations and specify metabolite properties, (ii) to
supply experimental measurements and tracer information
to the model, (iii) to investigate and resolve points of
disagreement between the model simulations and the
experimental measurements, and (iv) to assess the quality
of the results and provide biological interpretation. In
addition to software, a small Beowulf computer cluster can
be used to speed up long-running computations. Although
many types of INST-MFA calculations can be performed
on a single computer, some types of calculations (e.g.,
sensitivity analysis to determine parameter uncertainties)
can take several days if not parallelized. INCA has built-in
capabilities for parallelization of certain time-consuming
processes, which can be invoked within a cluster comput-
ing framework. Our lab currently uses a cluster of eight
quad-core Dell desktop computers running the Rocks 6.0
Linux distribution (http://www.rocksclusters.org). INCA
can use either the MATLAB Distributed Computing Server
with Parallel Computing Toolbox or the Condor job
scheduler (pre-packaged with Rocks) to distribute jobs to
compute nodes within the cluster.
Conclusions & future outlook
13C MFA has emerged as an important platform to extract
otherwise unobservable information about metabolic
pathway fluxes through inference from experimental mea-
surements. While the models used for MFA are not
intended to be predictive on their own, the information they
provide can be used to develop and validate other types of
models (either stoichiometric or kinetic models) that pos-
sess predictive capabilities. Furthermore, the direct insight
derived from viewing a flux map can itself often lead to
intuitive predictions about pathway operation. Comparison
of flux maps obtained under varying experimental condi-
tions or in the presence of targeted genetic manipulations
provides a functional readout on the global impact that
these perturbations have on cell metabolism. This infor-
mation can be used to identify rigid nodes, which resist
change when neighboring enzymes are manipulated, and
flexible nodes that are amenable to easy modulation. Such
knowledge is critical for rational selection of metabolic
engineering targets.
While much prior work has focused on the develop-
ment of stoichiometric MFA models in cyanobacteria, and
in fact several genome-scale metabolic reconstructions
are now becoming available, the major disadvantage of
these models is that they cannot provide a unique flux
solution unless a cellular growth objective is postulated
(e.g., as in flux balance analysis, or FBA). In this case, it
is important to note that the flux solution obtained from
FBA does not represent the actual flux distribution within
the system but instead a theoretical solution predicted to
optimize growth. Therefore, even when FBA predictions
are available, performing 13C MFA studies can pinpoint
unexpected deviations between theoretically and experi-
mentally determined fluxes that indicate suboptimal
pathway function or a lack of understanding about path-
way operation. While some prior studies have found sat-
isfactory agreement between the two types of flux
solutions, others have noted significant disagreements
between the two (Schuetz et al. 2007; Young et al. 2011).
Indeed, it is precisely these disagreements between theory
and experiment that often suggest new discoveries, thus
highlighting the potential for 13C MFA to expand our
understanding of cyanobacterial metabolism. Realizing
this potential requires continued development of experi-
mental protocols and computational tools that facilitate
the application of 13C MFA to a wider range of cyano-
bacterial strains and growth conditions. The recent
emergence of the INST-MFA approach, along with
enabling software such as INCA, provides a significant
example of how 13C MFA is expanding its reach to
encompass new experimental systems (e.g., autotrophic
cultures) that were not previously amenable to study.
Acknowledgments This project was supported by the U.S.
Department of Energy (DOE) Award DE-SC008118 and the U.S.
Department of Education Graduate Assistance in Areas of National
Photosynth Res
123

Need Award P200A090323. LJJ was supported by the DOE Office of
Science Graduate Fellowship DE-AC05-06OR23100.
References
Alagesan S, Gaudana SB, Sinha A, Wangikar PP (2013) Metabolic
flux analysis of Cyanothece sp. ATCC 51142 under mixotrophic
conditions. Photosynth Res 118(1–2):191–198. doi:10.1007/
s11120-013-9911-5
Antoniewicz MR (2013) 13C metabolic flux analysis: optimal design
of isotopic labeling experiments. Curr Opin Biotechnol
2013(24):1116–1121
Antoniewicz MR, Kelleher JK, Stephanopoulos G (2006) Determi-
nation of confidence intervals of metabolic fluxes estimated from
stable isotope measurements. Metab Eng 8(4):324–337. doi:10.
1016/j.ymben.2006.01.004
Antoniewicz MR, Kelleher JK, Stephanopoulos G (2007a) Elemen-
tary metabolite units (EMU): a novel framework for modeling
isotopic distributions. Metab Eng 9(1):68–86. doi:10.1016/j.
ymben.2006.09.001
Antoniewicz MR, Kraynie DF, Laffend LA, Gonzalez-Lergier J,
Kelleher JK, Stephanopoulos G (2007b) Metabolic flux analysis
in a nonstationary system: fed-batch fermentation of a high
yielding strain of E. coli producing 1,3-propanediol. Metab Eng
9(3):277–292. doi:10.1016/j.ymben.2007.01.003
Arauzo-Bravo MJ, Shimizu K (2003) An improved method for
statistical analysis of metabolic flux analysis using isotopomer
mapping matrices with analytical expressions. J Biotechnol
105(1–2):117–133. doi:10.1016/S0168-1656(03)00169-X
Berla BM, Saha R, Immethun CM, Maranas CD, Moon TS, Pakrasi
HB (2013) Synthetic biology of cyanobacteria: unique chal-
lenges and opportunities. Frontiers Microbiol 4:246. doi:10.
3389/fmicb.2013.00246
Feng X, Bandyopadhyay A, Berla B, Page L, Wu B, Pakrasi HB, Tang
YJ (2010) Mixotrophic and photoheterotrophic metabolism in
Cyanothece sp. ATCC 51142 under continuous light. Microbiol-
ogy 156(8):2566–2574. doi:10.1099/mic.0.038232-0
Hasunuma T, Kikuyama F, Matsuda M, Aikawa S, Izumi Y, Kondo A
(2013) Dynamic metabolic profiling of cyanobacterial glycogen
biosynthesis under conditions of nitrate depletion. J Exp Bot
64(10):2943–2954. doi:10.1093/jxb/ert134
Huege J, Goetze J, Schwarz D, Bauwe H, Hagemann M, Kopka J
(2011) Modulation of the major paths of carbon in photorespi-
ratory mutants of synechocystis. PLoS One 6(1):e16278
Jazmin LJ, Young JD (2013) Isotopically nonstationary 13C metabolic
flux analysis. In: Alper HS (ed) Systems metabolic engineering,
vol 985., Methods in molecular biologyHumana Press, Totowa,
pp 367–390. doi:10.1007/978-1-62703-299-5_18
Jazmin LJ, O’Grady JP, Ma F, Allen DK, Morgan JA, Young JD
(2014) Isotopically nonstationary MFA (INST-MFA) of auto-
trophic metabolism. In: Dieuaide-Noubhani M, Alonso AP (eds)
Plant metabolic flux analysis, vol 1090., Methods in molecular
biologyHumana Press, Totowa, pp 181–210. doi:10.1007/978-1-
62703-688-7_12
Koffas M, Stephanopoulos G (2005) Strain improvement by meta-
bolic engineering: lysine production as a case study for systems
biology. Curr Opin Biotechnol 16(3):361–366. doi:10.1016/j.
copbio.2005.04.010
Krall L, Huege J, Catchpole G, Steinhauser D, Willmitzer L (2009)
Assessment of sampling strategies for gas chromatography-mass
spectrometry (GC-MS) based metabolomics of cyanobacteria.
J Chromatogr B Analyt Technol Biomed Life Sci
877(27):2952–2960. doi:10.1016/j.jchromb.2009.07.006
Matsuoka Y, Shimizu K (2010) Current status of 13C-metabolic flux
analysis and future perspectives. Process Biochem
45(12):1873–1881. doi:10.1016/j.procbio.2010.03.025
Murphy TA, Young JD (2013) ETA: robust software for determina-
tion of cell specific rates from extracellular time courses.
Biotechnol Bioeng 110(6):1748–1758. doi:10.1002/bit.24836
Nakajima T, Kajihata S, Yoshikawa K, Matsuda F, Furusawa C,
Hirasawa T, Shimizu H (2014) Integrated Metabolic flux and
omics analysis of Synechocystis sp. PCC 6803 under mixo-
trophic and photoheterotrophic conditions. Plant cell physiol.
doi:10.1093/pcp/pcu091
Nielsen J (2003) It is all about metabolic fluxes. J Bacteriol
185(24):7031–7035
Noh K, Wiechert W (2006) Experimental design principles for
isotopically instationary 13C labeling experiments. Biotechnol
Bioeng 94(2):234–251. doi:10.1002/bit.20803
Pelroy RA, Rippka R, Stanier RY (1972) Metabolism of glucose by
unicellular blue-green algae. Arch Mikrobiol 87(4):303–322
Sauer U (2006) Metabolic networks in motion: 13C-based flux
analysis. Mol Syst Biol. doi:10.1038/msb4100109
Schuetz R, Kuepfer L, Sauer U (2007) Systematic evaluation of
objective functions for predicting intracellular fluxes in Esche-
richia coli. Mol Syst Biol. doi:10.1038/msb4100162
Shastri AA, Morgan JA (2005) Flux balance analysis of photoauto-
trophic metabolism. Biotechnol Prog 21(6):1617–1626. doi:10.
1021/bp050246d
Shastri AA, Morgan JA (2007) A transient isotopic labeling
methodology for 13C metabolic flux analysis of photoautotro-
phic microorganisms. Phytochemistry 68(16–18):2302–2312.
doi:10.1016/j.phytochem.2007.03.042
Stephanopoulos G (1999) Metabolic fluxes and metabolic engineer-
ing. Metab Eng 1:1–11
Sumner L, Amberg A, Barrett D, Beale M, Beger R, Daykin C, Fan
TM, Fiehn O, Goodacre R, Griffin J, Hankemeier T, Hardy N,
Harnly J, Higashi R, Kopka J, Lane A, Lindon J, Marriott P,
Nicholls A, Reily M, Thaden J, Viant M (2007) Proposed
minimum reporting standards for chemical analysis. Metabolo-
mics 3(3):211–221. doi:10.1007/s11306-007-0082-2
Tang YJ, Martin HG, Myers S, Rodriguez S, Baidoo EEK, Keasling
JD (2009) Advances in analysis of microbial metabolic fluxes via
C-13 isotopic labeling. Mass Spectrom Rev 28(2):362–375.
doi:10.1002/Mas.20191
Vallino JJ, Stephanopoulos G (1994) Carbon flux distributions at the
pyruvate branch point in corynebacterium-glutamicum during
lysine overproduction. Biotechnol Progr 10(3):320–326. doi:10.
1021/Bp00027a013
Wiechert W (2001) 13C metabolic flux analysis. Metab Eng
3(3):195–206. doi:10.1006/mben.2001.0187
Wiechert W, Mollney M, Isermann N, Wurzel M, de Graaf AA (1999)
Bidirectional reaction steps in metabolic networks: III. Explicit
solution and analysis of isotopomer labeling systems. Biotechnol
Bioeng 66(2):69–85
Woolston BM, Edgar S, Stephanopoulos G (2013) Metabolic engineering:
past and future. Annual review of chemical and biomolecular
engineering 4:259–288. doi:10.1146/annurev-chembioeng-061312-
103312
Yang C, Hua Q, Shimizu K (2002a) Integration of the information
from gene expression and metabolic fluxes for the analysis of the
regulatory mechanisms in Synechocystis. Appl Microbiol Bio-
technol 58(6):813–822. doi:10.1007/s00253-002-0949-0
Yang C, Hua Q, Shimizu K (2002b) Metabolic flux analysis in
Synechocystis using isotope distribution from 13C-labeled
glucose. Metab Eng 4(3):202–216. doi:10.1006/mben.2002.0226
Yang C, Hua Q, Shimizu K (2002c) Quantitative analysis of
intracellular metabolic fluxes using GC–MS and two-dimen-
sional NMR spectroscopy. J Biosci Bioeng 93(1):78–87
Photosynth Res
123

You L, Berla B, He L, Pakrasi HB, Tang YJ (2014) 13C-MFA
delineates the photomixotrophic metabolism of Synechocystis sp.
PCC 6803 under light- and carbon-sufficient conditions. Bio-
technol J 9(5):684–692. doi:10.1002/biot.201300477
Young JD (2014) INCA: a computational platform for isotopically
non-stationary metabolic flux analysis. Bioinformatics. doi:10.
1093/bioinformatics/btu015
Young JD, Walther JL, Antoniewicz MR, Yoo H, Stephanopoulos G
(2008) An elementary metabolite unit (EMU) based method of
isotopically nonstationary flux analysis. Biotechnol Bioeng
99(3):686–699. doi:10.1002/bit.21632
Young JD, Shastri AA, Stephanopoulos G, Morgan JA (2011)
Mapping photoautotrophic metabolism with isotopically non-
stationary (13)C flux analysis. Metab Eng 13(6):656–665.
doi:10.1016/j.ymben.2011.08.002
Yuan J, Bennett BD, Rabinowitz JD (2008) Kinetic flux profiling for
quantitation of cellular metabolic fluxes. Nat Protoc
3(8):1328–1340. doi:10.1038/nprot.2008.131
Zhang S, Bryant DA (2011) The tricarboxylic acid cycle in
cyanobacteria. Science 334(6062):1551–1553. doi:10.1126/
science.1210858
Photosynth Res
123