review of tier 2: analysis of salary thresholds - gov.uk · pdf fileanalysis of salary...
TRANSCRIPT

Review of Tier 2
Migration Advisory Committee
July 2015
Analysis of Salary Thresholds

Migration Advisory Committee, 3rd Floor, Seacole Building, 2 Marsham Street, London, SW1P 4DF www.gov.uk/government/organisations/migration-advisory-committee email: [email protected]

Review of Tier 2:
Analysis of Salary Thresholds
Migration Advisory Committee
July 2015


Contents
Contents
Chairman’s Foreword ......................................................................................... 1
The Migration Advisory Committee and Secretariat ........................................ 3
Chapter 1 Introduction ................................................................................ 5
1.1 About the MAC ................................................................................... 5
1.2 What we were asked to do ................................................................. 5
1.3 What we did ....................................................................................... 6
1.4 Structure of the report ........................................................................ 6
1.5 Thank you .......................................................................................... 7
Chapter 2 Policy and Data Context ............................................................ 9
2.1 Introduction ........................................................................................ 9
2.2 Overview of the Points Based System and Tier 2 .............................. 9
2.3 Overview of Tier 2 (General) and Tier 2 (Intra-Company Transfer) . 10
2.4 Previous MAC work on Tier 2 .......................................................... 12
2.5 Data Context .................................................................................... 15
2.6 Trends over time .............................................................................. 15
2.7 Migrants in occupations skilled to NQF6+ ........................................ 17
Chapter 3 Economic rationale for increasing the Tier 2 salary thresholds ................................................................................ 21
3.1 Introduction ...................................................................................... 21
3.2 Salary distributions for Tier 2 migrants ............................................. 22
3.3 Evidence from partners on undercutting .......................................... 30
3.4 Conclusions ..................................................................................... 32
Chapter 4 Impact of increasing the minimum salary threshold ............ 35
4.1 Introduction ...................................................................................... 35
4.2 The minimum salary threshold for Tier 2 (General) .......................... 35
4.3 The minimum salary threshold for short-term intra-company transfers .................................................................................................. 36
Contents

Contents
4.4 The minimum salary threshold for long-term intra-company transfers.. ................................................................................................... 37
4.5 Salaries paid to highly specialised experts and individuals filling skills shortages skilled to NQF6+ .............................................................. 40
4.6 The impact on applications under Tier 2 of an increase in the minimum salary thresholds ............................................................... 42
4.7 Conclusions ...................................................................................... 56
Chapter 5 Occupation-specific thresholds ............................................. 59
5.1 Introduction ...................................................................................... 59
5.2 Impact of a change in the occupation-specific thresholds for all occupations and individuals ............................................................. 59
5.3 Impact of a change in the occupation-specific thresholds excluding those occupations not currently based on percentile thresholds. ..... 61
5.4 Impact of a change in the occupation-specific thresholds for all occupations, splitting new entrants and experienced workers. ......... 62
5.5 Occupations affected by an increase in the occupation-specific thresholds ......................................................................................... 65
5.6 Impact of a change in the occupation-specific thresholds on those occupations not currently based on percentile thresholds ................ 73
5.7 Partner evidence .............................................................................. 78
5.8 Conclusions ...................................................................................... 84
Chapter 6 Further work ............................................................................. 89
6.1 Introduction ...................................................................................... 89
6.2 Prioritisation of applications/occupations Tier 2 (General) ............... 89
6.3 Interaction of a skills levy with the salary threshold .......................... 92
6.4 The minimum earnings threshold for permanent settlement ............ 94
6.5 Considering regional pay variations ................................................. 95
6.6 Occupations qualified to NQF6+ ...................................................... 98
6.7 Sources of data on pay .................................................................... 99
6.8 Conclusions .................................................................................... 100
Chapter 7 Summary and conclusions ................................................... 103
7.1 Introduction .................................................................................... 103
7.2 Economic rationale for setting new minimum salary thresholds ..... 103
7.3 Increasing the minimum salary thresholds for all occupations ....... 104
7.4 Increasing the occupational salary thresholds for each occupation 106
7.5 Further work ................................................................................... 108
7.6 Conclusions .................................................................................... 109
Annex A Consultation ........................................................................... 111

Contents
A.1 List of organisations that responded to the call for evidence who did not request anonymity .................................................................... 111
A.2 Indicative List of organisations we met with/attended our forums .. 116
Annex B Salary thresholds for occupations skilled to NQF6+ .......... 119
Annex C Salary distributions for individual occupations .................. 123
C.1 Introduction .................................................................................... 123
C.2 Salary distributions for Tier 2 General (RLMT and SOL) and ASHE for SOC codes with the highest usage. .......................................... 124
C.3 Salary distributions for Tier 2 General (RLMT and SOL) new entrants and experienced workers compared to ASHE new hires in high usage occupations .................................................................................... 128
C.4 Salary distributions for Tier 2 (Intra-Company Transfers) for high usage occupations. ........................................................................ 132
C.5 Age distributions for Tier 2 (General) and the UK for high usage occupations, and salary distributions for key age groups ............... 139
C.6 Age distributions for Tier 2 (Intra-Company Transfers) and the UK for high usage occupations, and salary distributions for key age groups .. ................................................................................................ 149
C.7 Tables to accompany Figures 3.1, 3.3, 3.5 and 3.6 ....................... 159
Annex D Main occupational usage of RCOS by month ..................... 161
Annex E Analysis of ASHE regional data by main (2-digit) Tier 2 occupations, 2014 ................................................................. 165
Abbreviations ................................................................................................ 169
References ................................................................................................ 171


Contents
1
Chairman’s Foreword
Soon after the recent General Election, the Migration Advisory Committee (MAC) was commissioned to examine Tier 2 of the (now rather misleadingly titled) points based immigration system. Tier 2 mainly consists of non-EU work migration.
Our work is in two tranches. This report (“Little MAC”) analyses pay thresholds. First, minimum pay thresholds for: Tier 2 General migrants who enter under either the shortage occupation route or the resident labour market test route; short term (under one year) intra-company transfers (ICT); and long term ICTs. Second, minimum thresholds for each of the 96 occupations skilled to NQF6 which comprise the bulk of new Tier 2 migrants.
Third, minimum thresholds for new entrants into these 96 occupations.
Tranche two (“Big MAC”) will be completed by December. This covers:
the case for and against an expanded shortage occupation list (including key public service workers) coupled with the closure of the remainder of Tier 2 (General);
analysis of a skills levy involving either a one-off or annual levy per migrant. This would raise the cost of employing migrants and therefore intersects with the pay threshold question;
examination of the automatic right of Tier 2 dependants to work;
analysis of the case for and against a sunset clause, such that a job or occupation can only remain on the shortage list for a maximum duration of years;
examination of the case for tightening the intra-company transfer route. The numbers entering via this route each year have risen from 29,200 in 2010 to 36,600 in 2014. This will analyse the use of allowances and the case for or against intra-company transfer migrants paying the health surcharge.
Our focus in this report is on analysis rather than recommendations. We examine the evidence concerning the possibility that migrants undercut British residents. We set out the impact on the number of migrants excluded as the pay thresholds are raised (assuming firms do not raise their pay offer). We urge caution over thresholds because such decisions interact with the second tranche of our work, particularly the skills levy. In any event a modest rise in the minimum thresholds would have minimal impact on Tier 2 (General) because currently the prioritisation
Chairman’s Foreword

Analysis of Salary Thresholds
2
system with the limit is yielding required pay above £30,000 (except for occupations within the shortage occupation list which are prioritised first). Further, the tight timetable means we have had insufficient time to fully consider the extensive evidence on this topic and, at this stage, cannot fully assess the impact of raising pay thresholds on particular companies and organisations.
We acknowledge with thanks the help of the stakeholders in organising and attending very constructive meetings and providing written evidence in the very short period we have had to complete this report. And our splendid secretariat have, as always, provided excellent stakeholder meetings, economic analysis and drafts.
Professor Sir David Metcalf CBE

Contents
3
The Migration Advisory Committee and Secretariat
The Migration Advisory Committee (MAC) is a non-statutory, non-time limited, non-departmental public body (NDPB) which was established in 2007 and is funded by the Home Office. The MAC is comprised of economists and migration experts who are publicly appointed in line with guidance published by the Office of the Commissioner for Public Appointments; along with ex-officio representatives of the UK Commission for Employment and Skills and the Home Office.
Chair Members
UK Commission for Employment and Skills representative
Professor Sir David Metcalf CBE
(from August 2007)
Professor Alan Manning
(from March 2015)
Dr Jennifer Smith
(from November 2012)
Lesley Giles
Home Office representative
Professor Jonathan Wadsworth
(from December 2007)
Professor Jackline Wahba
(from November 2012)
John Thompson
The secretariat
Cordella Dawson; Ciaran Devlin; Stephen Earl; Paul Garner; Tim Harrison; Christopher Haynes; Bethan Hunt; Anna Lacey; Jessica Latchford, Caroline O’Loughlin, Christine Stone; Josephine Thomas.
The Migration Advisory Committee and Secretariat


Chapter 1: Introduction
5
Chapter 1 Introduction
1.1 About the MAC
1.1 The Migration Advisory Committee (MAC) is a non-departmental public body comprised of economists and migration experts that provides transparent, independent and evidence-based advice to the Government on migration issues. The questions we address are determined by the Government.
1.2 The MAC has previously been asked to provide advice on a wide range of immigration issues such as the design of the Points Based System (PBS) for managed migration including annual limits, low-skilled migration into the UK and the Tier 1(Investor) route.
1.2 What we were asked to do
1.3 The Government has asked the MAC to provide advice on a number of potential changes to Tier 2 of the Points Based System to address concerns about the rising number of migrants in that route and reliance on them to fill shortages. This wide review is due to be completed by December 2015.
1.4 The MAC has also been asked to provide early advice in a much shorter timeframe on the economic rationale for and the impact on net migration of setting new minimum salary thresholds to ensure that Tier 2 migrants are not undercutting the resident labour force. Specifically, the MAC was asked to consider the impact of:
I. increasing the Tier 2 (General) minimum salary threshold of £20,800 and the Tier 2 (ICT) minimum salary thresholds of £24,800 for the short-term category and £41,500 for the long-term category to a level that better aligns with the salaries paid to highly-specialised experts or individuals filling skills shortages skilled to NQF level 6 or higher;
II. increasing the Tier 2 minimum salaries per occupation for experienced workers from the 25th percentile to the 50th or 75th percentiles, or other appropriate measure;
Chapter 1 Introduction

Analysis of Salary Thresholds
6
III. increasing the Tier 2 minimum salaries per occupation for new entrant workers from the 10th percentile to the 25th or 50th percentiles, or other appropriate measure.
1.5 The MAC was asked to report on the salary thresholds aspects of the review of Tier 2 by 21 July 2015.
1.3 What we did
Call for evidence
1.6 Despite this short timeframe we issued a call for evidence to collect the views and opinions of interested partners. The call for evidence was launched on 18 June 2015 and closed on 3 July 2015.
1.7 159 written submissions of evidence were received from organisations and individuals. A list of those who supplied evidence, and who have not requested anonymity, is provided in Annex A to this report.
1.8 Meetings were held with representatives from over 100 organisations. Most of the meetings were in a forum style which allowed us to meet a number of partners simultaneously.
1.9 We understand that a number of other partners would have liked to respond, or would have liked to respond more fully, but were not able to do so given the short time period and the need for them to consult with their partners.
1.10 It has not proved possible, in the time available, to set out all of the points raised across the different sectors that responded to us. Instead we highlight in this report some of the key themes that did emerge from the partner evidence. We also include some illustrative quotes where relevant. We will provide a more detailed account of the evidence on salary thresholds in our report on the wider Tier 2 review in December 2015. We will also include in that review any evidence on salary thresholds that partners were not able to provide to us in time for this report.
1.4 Structure of the report
1.11 The report is structured as follows:
Chapter 2 provides the relevant policy and data context to Tier 2 and summarises previous MAC reports that have looked at aspects of the salary thresholds.
Chapter 3 considers the economic rationale for increasing Tier 2 salary thresholds and provides an analysis of the salaries paid to Tier 2 migrants compared with the salaries paid overall within the UK to skilled workers. It considers whether there is evidence to suggest that Tier 2 migrants are undercutting the resident labour force.

Chapter 1: Introduction
7
In Chapter 4 we look at the impact of increasing the minimum salary thresholds and whether the thresholds can be aligned to the salaries paid to highly specialised experts and those occupations experiencing skills shortages.
Chapter 5 considers the impact of increasing the occupation-specific thresholds for new entrants and for experienced workers. Chapters 4 and 5 thus simulate the potential impact of raising pay thresholds on migrant numbers, assuming the sponsors were to keep pay at the same levels.
Chapter 6 sets out a number of issues that the MAC will consider further during the course of the wider Tier 2 commission.
Chapter 7 concludes and presents a summary of our findings.
1.5 Thank you
1.12 We are grateful to all our partners who responded to our call for evidence and to those who engaged with us at meetings and events. The Government asked us to conduct this review to a very tight timescale and we are very appreciative of partners’ efforts in the time available. There is an opportunity to comment further on our wider Tier 2 review, the call for evidence for which remains open until 25 September 2015.


Chapter 2: Policy and Data Context
9
Chapter 2 Policy and Data Context
2.1 Introduction
2.1 This chapter presents an overview of the UK Points Based System (PBS) for immigration along with a more detailed look at the main elements of Tier 2. The chapter goes on to briefly summarise previous MAC recommendations in relation to salary thresholds, before presenting a summary of recent data trends within Tier 2.
2.2 Overview of the Points Based System and Tier 2
2.2 The PBS for migration to the UK from outside the European Economic Area (EEA) was introduced in 2008 and consists of five tiers as set out in Table 2.1.
Table 2.1: The five tiers of the Points Based System Name of tier Immigrant groups covered by tier
Tier 1 Investors, entrepreneurs, graduate entrepreneurs and exceptionally talented migrants.
Tier 2 Skilled workers with a job offer in the UK.
Tier 3 Low-skilled workers needed to fill specific temporary labour shortages. Tier 3 has never been opened.
Tier 4 Students.
Tier 5 Youth mobility and temporary workers. This route is for those allowed to work in the UK for a limited period of time to satisfy primarily non-economic objectives.
Source: Migration Advisory Committee, 2012
2.3 Tier 2 of the Points Based System is the primary route for economic migration to the UK. Broadly, the route is for skilled workers from outside the EEA who have an offer of skilled employment in the UK.
2.4 There are four routes within Tier 2: Tier 2 (General), Tier 2 (Intra-company Transfers), Tier 2 (Minister of Religion) and Tier 2 (Sportsperson). For the purposes of this report we do not consider the Minister of Religion and Sportsperson routes.
Chapter 2 Policy and Data Context

Analysis of Salary Thresholds
10
2.3 Overview of Tier 2 (General) and Tier 2 (Intra-Company Transfer)
Tier 2 (General)
2.5 The Tier 2 (General) visa is for migrants from outside the EEA (and Switzerland) who wish to be employed in the UK in a skilled job. Migrants must be sponsored (i.e. have a Certificate of Sponsorship (CoS) from a licensed sponsor) and the work they do in the UK must relate to the work of the sponsor organisation. There is a limit on the number of CoS, called Restricted CoS (RCoS), that will be issued each year of 20,700 for most Tier 2 (General) main applicants applying from outside of the UK.
2.6 Until recent months, the route has been undersubscribed and therefore the limit not reached. The limit was hit for the first time in June 2015. Table 2.2 outlines how applications are prioritised when the monthly limit is reached. The application must score points from both columns but can only score points for one entry in the first column. For example, if a job is a shortage occupation but the employer has carried out a resident labour market test, the application will score 75 points from the first column, not 105. A further score is then added for the salary paid for the job. For example, if the job is a shortage occupation and the salary payable is £26,500 the application will score 75 points plus a further 8 points for salary, giving 83 points in total. Points for salary will not be awarded if it is not at or above the appropriate rate for the job.
Table 2.2: Criteria for prioritisation of restricted CoS Type of job Points Salary Points
Shortage occupation 75 £100,000 - £155,299.99 30
£75,000 - £99,999.99 25
PhD-level occupation code and job passes RLMT or an exception applies
50 £46,000 - £74,999.99 20
£32,000 - £45,999.99 15
£28,000 - £31,999.99 10
£27,000 - £27,999.99 9
Job passes RLMT or an exception applies
30 £26,000 - £26,999.99 8
£25,000 - £25,999.99 7
£24,000 - £24,999.99 6
£23,000 - £23,999.99 5
£22,000 - £22,999.99 4
£21,000 - £21,999.99 3
£20,800 - £20,999.99 2 Source: Home Office, 2015
2.7 All Tier 2 (General) migrants must be employed in a job with an annual salary of at least £20,800. However there are also occupation specific minimum thresholds and where these are greater than £20,800, these provide the minimum salary requirement for that occupation.
2.8 The salary thresholds for experienced workers are set at the 25th percentile for full-time employees in each occupation, mostly calculated

Chapter 2: Policy and Data Context
11
using the Annual Survey of Hours and Earnings (ASHE), a survey of employers conducted by the Office for National Statistics. These thresholds apply to all Tier 2 (General) migrants, including those who were previously granted a Tier 2 visa at a lower salary rate (see below) because they were a new entrant into an occupation and who are applying to extend their stay in the UK under Tier 2, beyond 3 years and 1 month (the maximum grant for initial Tier 2 applications).
2.9 Lower pay thresholds for new entrant employees are set at the 10th percentile of the pay distribution for full-time employees in that occupation. The new entrant thresholds apply to:
Graduates switching into Tier 2 (General) under the post-study provisions;
Graduate recruits where the organisation used a university “milkround” to satisfy the Resident Labour Market Test (RLMT);
Graduates sponsored in the Intra-company Transfer Graduate Trainee route; and
Any workers making an initial application who are aged 25 or under on the date they apply.
Tier 2 Intra-company transfers
2.10 The Tier 2 (Intra-Company Transfer) route focuses on specialists and managers. The route allows multinational companies to transfer these key personnel from their overseas branches to the UK for temporary periods. Long-term transferees are able to come to the UK for a period of up to five years and short-term transferees can come for up to 12 months. There is a ‘cooling off’ period of 12 months at the end of the migrant’s stay during which time the migrant cannot reapply for a visa to return to the UK. Very high earners (those earning in excess of £155,300) can remain in the UK for up to 9 years and are exempt from the cooling off period.
2.11 Migrants using the Tier 2 (Intra-Company Transfer) route also need to show that they are being paid the appropriate salary. For long-term and short-term intra-company transferees there is an overall minimum threshold, but the occupational specific minimum thresholds laid out in paragraphs 2.8-2.9 also apply. The overall minimum threshold for each type of Tier 2 (Intra-Company Transfer) visa are as follows:
Long-term Staff - a minimum of £41,500 or the appropriate rate for the role (whichever is higher);
Short-term Staff, Graduate Trainee or Skills Transfer - a minimum of £24,800 or the appropriate rate (whichever is higher); and,
Staff already in the UK on a Tier 2 (Intra-Company Transfer) visa or work permit issued before 6 April 2011 - at least the appropriate rate.

Analysis of Salary Thresholds
12
2.4 Previous MAC work on Tier 2
2.12 The MAC has previously looked in detail at Tier 2 in a number of our reports. Table 2.3 summarises our main findings and recommendations relating to salary thresholds and highlights whether the Government implemented our recommendations. Interested readers are directed to the relevant reports for further information.
2.13 The issues outlined in Table 2.3 will be revisited in this report as well as in the wider review of Tier 2 for December 2015.

Chapter 2: Policy and Data Context
13
Table 2.3: Previous MAC work on Tier 2 MAC Report Recommendations Government implemented Analysis of the Points-Based System: Tier 2 and dependants (August 2009)
The minimum salary should be set at £20,000 per year, roughly equivalent to the 30th percentile
of the earnings distributions for all full-time workers.
Raising the minimum threshold for gaining 10 points to £24,000 per annum, and raising the minimum threshold for gaining 15 points to £28,000 per annum.
Certain occupations involved in the delivery of key public services, to be set out by the Government, should be awarded an extra 5 points under the Resident Labour Market Test (RLMT) route. This would also apply to individuals working in these occupations switching to Tier 2 from the Tier 1 post-study category
Allowances used for Points Based System (PBS) points purposes be scaled down when calculating points for earnings under the PBS.
Yes
Implemented with changes
Implemented with changes
No
Analysis of the Points Based System: London Weighting (August 2010)
London weighting should continue to be regarded as part of earnings in the points calculation in relation to Tiers 1 and 2 of the PBS.
Yes
Limits on Migration: Limit on Tier 2 (General) for 2012/13 and associated policies (February 2012)
The limit of 20,700 for Tier 2 (General) be maintained at the 2012/13 level.
The MAC did not think there was reason to believe that either increasing or reducing the £40,000 threshold would provide a better fit with the General Agreement on Trade in Services (GATS) definitions of senior managers and specialists.
In relation to Intra-Company Transfers, the Government may wish to assess individual migrants and the jobs they are entering on a case-by-case basis (according to some set criteria and, potentially, sector- or occupation-specific guidance on minimum earnings levels for senior managers and specialists).
Recommended against regional variation in the minimum salary thresholds for the intra-company transfer route as this would be difficult to implement in practice.
Recommended against down-rating allowances
Recommended against waiving the RLMT requirement for certain categories of jobs.
Yes
Yes (i.e. did not change the threshold)
No
Yes (i.e. did not introduce regional variations)
Yes (i.e. did not down-rate)
Yes (i.e. did not waive)
Analysis of the Points Based System: List of occupations skilled at NQF level 6 and above and review of the Tier 2 codes of
In terms of minimum pay thresholds, for experienced employees the options the MAC considered were to either use the median (50th percentile) of the pay distribution by occupation or the lower quartile (25th percentile). As the median measure could disadvantage both regional employees and less experienced (but not new entrant) employees, the MAC determined that the 25th percentile would be more appropriate.
The MAC considered the minimum pay rates for new entrants under Tier 2 and it was

Analysis of Salary Thresholds
14
Table 2.3: Previous MAC work on Tier 2 practice (October 2012)
recommended that this should be set at the 10th percentile of the occupation. This percentile
was chosen on the basis that a skilled employee who had just left full-time education typically earned around the 9
th percentile of the pay distribution for their occupation.
To determine the maximum number of years since an individual left full-time education before they can no longer be considered a new entrant, it was found that it takes approximately 3.5 years after leaving full-time education to reach the 25th percentile. Therefore the MAC suggested that it seems reasonable that after 3 years a new entrant becomes classified as an experienced worker.
The MAC recommended the following:
I. Pay thresholds for experienced employees should normally be set at the 25th percentile of the pay distribution for full-time employees in that occupation.
II. Pay thresholds for new entrant employees should be set at the 10th percentile of the pay distribution for full-time employees in that occupation.
III. A Tier 2 main applicant who joined a UK-based establishment as a new entrant, when applying for further leave to remain after three years should face the default experienced pay threshold.
IV. New entrant employees be defined as, full-time employees who have left full-time education less than 3 years ago;
V. All entrants to graduate recruitment schemes be classified as new entrant employees for the purpose of setting pay thresholds; and
VI. Trainee barristers entering pupillages be classified as new entrant employees for the purpose of setting pay thresholds.
VII. The pay thresholds for the occupations set at the 25th or 10th percentile of the Annual Survey of Hours and Earnings (ASHE) distributions are updated according to the annual ASHE data timetable. For non-ASHE pay thresholds, we recommended updating annually according to the national pay inflation of full-time workers from the annual ASHE data. Pay thresholds based on national professional pay scales, such as the NHS Agenda for Change or national teachers‟ pay scales, should be updated in line with their annual increase.
VIII. The minimum pay thresholds for experienced employees in SOC 1136 information communication and technology directors, SOC 2133 IT specialist managers and SOC 2134 IT project and programme managers should be updated using the latest data from the Incomes Data Services (IDS) database.
I. Yes
II. Yes
III. Yes
IV. Implemented with changes (see section 2.9 of this chapter)
V. Implemented with changes (see
section 2.9 of this chapter)
VI. Yes
VII. Yes
VIII. Yes (until 2015 when IDS data became no longer available)

Chapter 2: Policy and Data Context
15
2.5 Data Context
Use of Tier 2 in 2014
2.14 In 2014, 52,478 Tier 2 entry clearance visas were issued to main applicants under the Tier 2 (General) and Tier 2 (Intra-Company Transfer) routes. This accounted for 10 per cent of all entry clearance visas issued, excluding visitor and transit visas (Table 2.4). In addition, 35,266 in-country extensions were issued to Tier 2 main applicants in 2014. By comparison, 200,359 Tier 4 (Student) entry clearance visas and 68,231 Tier 4 in-country extensions were issued to main applicants in the same year.
2.15 15,255 visas were issued to main applicants through Tier 2 (General), approximately 91 per cent of which came through the RLMT route, with the remaining 9 per cent coming through the shortage occupation route. 36,635 visas were issued to main applicants through the Tier 2 (Intra-Company Transfer) route (Table 2.4). Of the 35,266 in-country extensions, 26,700 were through Tier 2 (General) and 8,045 through the Tier 2 (Intra-Company Transfer) route.
2.16 In 2014, 67 per cent of grants of extension of stay under the Tier 2 route were to existing Tier 2 migrants. A further 16 per cent of grants were to individuals switching from a Tier 4 (General Student) visa.
2.6 Trends over time
2.17 Demand for entry clearance visas for skilled workers under Tier 2 has been rising faster than both total UK employment and employment for NQF6+ occupations. Figure 2.1 compares the employment trends for the UK as a whole, and for NQF6+ occupations with the volumes of entry clearance visas for Tier 2 (General) and Tier 2 (Intra-Company Transfer). The index numbers of each category are relative to their respective levels in 2009 and so measure the percentage change since 2009. The number of entry clearance visas for Tier 2 (General) has increased significantly since 2011, with a consistent growth rate of over 20 per cent in the last three consecutive years. Demand for entry clearance visas for Tier 2 (Intra-Company Transfer) was slightly more muted, with a fall of 2 per cent in 2012, followed by a 14 per cent and 10 per cent growth increase in 2013 and 2014 respectively.

Analysis of Salary Thresholds
16
2.18 Table 2.4 shows that the number of entry clearance and extension visas granted to main applicants remained relatively stable between 2009 and 2012, rising from 36,287 to 39,171 and 27,851 to 29,524 for entry clearance and extension visas respectively.
Table 2.4: Entry clearance visas issued and granted extensions of stay for Tier 2, 2009 to 2014 2009 2010 2011 2012 2013 2014
Entry clearance visas Main applicants 36,287 39,922 38,088 39,171 45,636 52,478
Tier 2: General 8,556 9,914 7,764 9,420 11,779 15,255
Intra-company transfers 22,029 29,170 29,708 29,255 33,240 36,635
Other 5,661 835 614 496 617 588
Dependants 26,982 28,268 28,344 28,933 34,346 38,247
Granted extensions of stay
Main applicants 27,851 21,269 18,205 29,524 37,656 35,266
Tier 2: General 12,900 14,306 11,295 20,185 28,377 26,700
Intra-company transfers 6,624 6,149 6,377 8,656 8,546 8,045
Other 7,898 789 531 681 733 521
Dependants 23,007 16,194 13,525 20,668 25,499 25,668
Total 114,127 105,653 98,162 118,296 143,137 151,659
Source: Home Office Immigration Statistics, May 2015. “Other” includes Ministers of Religion, Sportspersons and a few legacy applications under the Work Permit scheme.
Figure 2.1: Index of total UK employment, employment in NQF6+ occupations, entry clearance visas for Tier 2 (General) and Tier 2 (Intra-Company Transfer), 2009-2014.
60
80
100
120
140
160
180
200
2009 2010 2011 2012 2013 2014
Tier 2 - General Tier 2- Intra Company Transfer
Total UK employment Total employment in NQF6+ occupations
Source: Home Office Immigration Statistics, May 2015 and Labour Force Survey, Q1 2009-2014

Chapter 2: Policy and Data Context
17
2.19 Since 2012 there has been a significant increase in the numbers of both entry clearance and extension visas issued. For main applicants, entry clearance visas under Tier 2 increased by 34 per cent from 2012 to 2014.
2.20 Within Tier 2, the Tier 2 (General) route experienced the most significant increase in this time period, from 9,420 entry clearance visas in 2012 to 15,255 in 2014, showing an increase of 62 per cent. Extensions of stay granted to main applicants under Tier 2 increased by 19 per cent in the same period, again driven by an increase within the Tier 2 (General) route.
2.21 Tier 2 dependant entry clearance visas have followed a broadly similar trend, rising moderately from 2009 to 2012, then significantly increasing by 32 per cent from 2012 to 2014, hitting a peak of 38,247 in 2014.
2.7 Migrants in occupations skilled to NQF6+
2.22 In the first quarter of 2015, there were approximately 29.7 million people aged 16-64 employed in the UK; 84 per cent were UK-born, and 16 per cent were non-UK born (of which 6 per cent were born in the European Union (EU) and 10 per cent were born outside the EU).
2.23 There were 8.4 million people working in occupations skilled to NQF6+ (28 per cent of all employed). Of these, 7.0 million were UK-born and 1.4 million were foreign born. At 16 per cent the share of skilled migrants in the workforce working in NQF6+ occupations is the same as the proportion of all migrants in the workforce.
Table 2.5: Total employment of individuals aged 16-64 by country of birth in occupations qualified to NQF6 and above
2011 2012 2013 2014 2015
Region Total (000s)
% Total (000s)
% Total (000s)
% Total (000s)
% Total (000s)
%
EU 360 4 360 5 380 5 420 5 430 5
Non-EU
840 10 850 11 870 11 910 11 930 11
UK 6,860 85 6,610 85 6,830 85 6,980 84 7,060 84
All 8,050 100 7,810 100 8,090 100 8,320 100 8,430 100
Notes: For all individuals in employment aged between 16 and 64 for whom a SOC code and country of birth could be allocated. For definitions of occupations skilled to NQF6+ please see Annex B. Source: Labour Force Survey, Q1 2011-2015
2.24 Table 2.6 lists the top 10 occupations by CoS granted both for in-country and out-of-country for each of the four main routes under Tier 2. Occupations are grouped by 4-digit 2010 Standard Occupational Classifications (SOC) as defined by the Office for National Statistics (ONS). Medical practitioners were the single biggest user of CoS under the Shortage Occupation List (637 CoS granted), and the second biggest under RLMT at 2,824. The IT sector accounts for just under two-thirds of CoS granted under the intra-company transfer route.

Analysis of Salary Thresholds
18
Table 2.6: Top 10 occupations for grants of Certificate of Sponsorship, split by route under Tier 2, in-country and out-of-country combined (year ending March 2015)
Shortage Occupation List
SOC Occupation Number of CoS
2211 Medical practitioners 637
2126 Design and development engineers 323
5434 Chefs 228
2121 Civil engineers 221
2314 Secondary education teaching professionals 199
2217 Medical radiographers 159
2136 Programmers and software development professionals 156
2123 Electrical engineers 139
2442 Social workers 123
3416 Arts officers, producers and directors 121
Total SOL 3,123
Resident Labour Market Test
SOC Occupation Number of CoS
2119 Natural and social science professionals n.e.c. 3,550
2211 Medical practitioners 2,824
2136 Programmers and software development professionals 2,618
2231 Nurses 2,499
2423 Management consultants and business analysts 2,416
3545 Sales accounts and business development managers 2,401
3534 Finance and investment analysts and advisers 1,684
2135 IT business analysts, architects and systems designers 1,547
2421 Chartered and certified accountants 1,299
2311 Higher education teaching professionals 1,229
Total RLMT 35,277
Short Term Intra-Company Transfer
SOC Occupation Number of CoS
2136 Programmers and software development professionals 7,546
2135 IT business analysts, architects and systems designers 5,358
2139 Information technology and telecommunications professionals 3,713
2423 Management consultants and business analysts 1,299
2134 IT project and programme managers 578
3534 Finance and investment analysts and advisers 563
2126 Design and development engineers 562
2421 Chartered and certified accountants 389
2137 Web design and development professionals 351
3545 Sales accounts and business development managers 316
Total STICT 24,257

Chapter 2: Policy and Data Context
19
Table 2.6: Top 10 occupations for grants of Certificate of Sponsorship, split by route under Tier 2, in-country and out-of-country combined (year ending March 2015)
Long Term Intra-Company Transfer
SOC Occupation Number of CoS
2135 IT business analysts, architects and systems designers 2,886
2134 IT project and programme managers 1,733
2136 Programmers and software development professionals 1,590
2423 Management consultants and business analysts 1,017
2139 Information technology and telecommunications professionals 981
3545 Sales accounts and business development managers 842
1132 Marketing and sales directors 799
2133 IT specialist managers 760
1115 Chief executives and senior officials 600
3534 Finance and investment analysts and advisers 544
Total LTICT 17,010
Source: Home Office Management Information, year ending March 2015
2.25 This analysis is based on used CoS data - that is, visas actually used. The CoS include both out-of-country applications and in-country applications. In-country applications include individuals switching from another visa route into Tier 2 as well as individuals applying for an extension in Tier 2. This is derived from management information (MI) produced by UK Visas and Immigration in the Home Office and provides a breakdown by occupation, job title and salaries offered.
2.26 In the year ending March 2015, the median salary of applicants under the SOL was £36,000 for in-country applications and £38,500 for out-of-country applications (Table 2.7). The salary for the 10th percentile for applicants using the SOL is £27,000 for out-of-country applications which is significantly higher than the current £20,800 minimum salary threshold. It is important to note that the salaries shown for the MI include allowances.
2.27 The median salary for applicants under the RLMT route was £33,000 for in-country and £40,500 for out-of-country applications in the same period. Approximately 30 per cent of out-of-country applicants under this route, representing fewer than 4,400 individuals, were offered salaries below £32,000.
2.28 The median salary was £62,321 for in-country and £37,174 for out-of-country applicants under the short-term intra-company transfer route in the year ending March 2015. Fewer than 30 per cent of out-of-country applicants under this route were offered salaries below £32,000. Moreover, the 10th percentile figure of £29,285 for out-of-country applications is significantly higher than the current £24,800 minimum salary threshold.

Analysis of Salary Thresholds
20
Table 2.7: Salary distribution (deciles and quartiles) by Tier 2 route for both in-country and out-of-country applications, based on Certificates of Sponsorship, year ending March 2015 (£)
Percentile SOL RLMT ICT ST ICT LT
In Country
Out-of-country
In Country
Out-of-country
In Country
Out-of-country
In Country
Out-of-country
10th 25,243 27,000 22,000 26,446 33,204 29,285 45,000 43,460
20th 29,570 29,975 24,299 30,000 39,875 30,711 48,410 46,500
25th 29,758 30,002 25,800 30,728 44,032 31,200 50,700 48,050
30th 30,002 31,892 27,700 32,000 49,186 32,004 53,357 50,335
40th 32,914 35,000 30,070 35,610 57,550 33,780 60,000 56,700
50th 36,000 38,500 33,000 40,500 62,321 37,174 70,099 65,556
60th 40,502 42,926 36,248 47,500 67,617 46,000 78,695 75,000
70th 47,274 50,000 42,139 57,000 72,278 53,633 96,750 87,390
75th 51,071 55,000 46,035 64,000 75,039 58,200 112,347 100,000
80th 56,733 60,000 53,071 73,000 78,873 62,871 131,590 116,600
90th 70,763 75,644 72,989 114,950 103,309 81,495 200,000 169,314
Total number of applications
1,736 1,387 20,593 14,684 1,010 23,247 5,860 11,150
Source: Home Office Management Information, year ending March 2015
2.29 In the same period, the median salary for applicants under the long-term intra-company transfer route was £70,099 for in-country and £65,556 for out-of-country applicants, with fewer than 30 per cent of out-of-country applicants (around 3,350 individuals) being offered salaries below £50,300.
2.30 In Chapter 3 we use the management information to consider whether there is any evidence of Tier 2 migrants undercutting the resident labour market.

21
Chapter 3 Economic rationale for increasing the Tier 2 salary thresholds
3.1 Introduction
3.1 In this chapter we consider the question the Government asked us in relation to the economic rationale for increasing the Tier 2 salary thresholds:
“The MAC has been asked to provide early advice on the economic rationale for and the impact on net migration of setting new minimum salary thresholds to ensure that Tier 2 migrants are not undercutting the resident labour force”
3.2 Preventing undercutting by migrant workers has been presented as one economic rationale for increasing the salary thresholds. We look at whether there is evidence to suggest that Tier 2 migrants are undercutting the resident labour force. We do this by comparing the salaries paid to Tier 2 migrants with the salaries paid to skilled workers within the UK overall. The chapter then explores the economic rationale for raising thresholds as a way of meeting the government’s policy objective of reducing skilled migration to the UK. We also present a summary of the evidence we received from partners on undercutting and on the impact of setting higher salary thresholds.
3.3 In addition to undercutting, we also examine whether there is evidence that current salary thresholds result in migrants being paid above the going rate for the occupation. We do this because a further economic rationale for increasing the salary threshold may be to ensure that recruiting migrants brings with it an element of upwards pressure on wages for resident workers. If wages are increasing, this will incentivise an increase in the resident labour supply in the longer term. Without this upward pressure on wages, there is a risk that reliance on migrant labour becomes a permanent rather than a temporary feature of these labour markets. Nevertheless, we recognise that skilled migrants (relative to less skilled) are more likely to be complementary to British workers and have favourable dynamic effects such as knowledge transfer which can help raise productivity.
3.4 The wider economic literature on the impacts of skilled migration on wages of resident workers has generally found either no effect or a modest positive effect. A key study by Dustmann et al. (2008) found that migration
Chapter 3 Economic rationale for increasing the Tier 2 salary thresholds

Analysis of Salary Thresholds
22
contributed to wage growth overall and especially so for higher paid (skilled) workers. These positive effects were counterbalanced by a decline in wage growth for the lowest decile of the wage distribution. Nickell and Salaheen (2008) found a small but significant negative impact on average occupational wages with a modest positive effect on professionals wages. Manacorda et al. (2012) found little impact of migration on native wages across the skill distribution and concluded that the main impact of increased immigration in the UK is on the wages of immigrants who are already here.
3.5 In our report “Analysis of the Impacts of Migration” (Migration Advisory Committee, 2012), we concluded that studies estimating the impact of migrants on UK wages have generally found little or no impact on average wages.
3.2 Salary distributions for Tier 2 migrants
3.6 In this section we present an analysis of the distribution of salaries paid to Tier 2 migrants and compare these against the salaries paid to:
All skilled workers in the UK labour market – overall and within individual occupations;
All new hires in the UK labour market – overall and within individual occupations;
Skilled workers in the UK labour market with a similar age profile to Tier 2 migrants – overall and within individual occupations.
3.7 In order to compare salaries paid to Tier 2 migrants with those paid to UK resident workers, we need to find a comparison group within the UK labour market that is of similar composition to the recent pool of Tier 2 migrants. Ideally, we would use a matched comparison group of UK resident workers formed by matching individual Tier 2 migrants to one or more UK residents who have been recently hired into the same occupation and are a similar age. By focusing on new hires (those who have been with their current employer for twelve months or less) we identify those who have been competing against recent Tier 2 migrants in recruitment. By matching on occupation and age, we could be relatively confident that the migrant and the resident were doing similar roles with similar levels of experience.
3.8 However, it has not been possible in the time available to implement such an approach. Instead, we focus in turn on comparisons of Tier 2 migrants with the overall labour market, with new hires only, and finally within specific age bands. As far as possible we also look at the distributions within individual occupations for each of these groups – but this is dependent on sample sizes across the datasets we use.
3.9 Data on Tier 2 migrants’ salaries comes from Home Office management information (MI) which includes information on the migrant’s occupation,

Chapter 3: Economic rationale for increasing Tier 2 salary thresholds
23
the salary paid by the sponsoring employer and some limited individual characteristics such as the migrant’s age and nationality.
3.10 The best source of data on wages paid to employees in the UK labour market is the Annual Survey of Hours and Earnings (ASHE). ASHE is produced annually by the Office for National Statistics and the most recent dataset was published in November 2014. ASHE permits a rich analysis of wages by occupation and allows us to identify newly hired employees.
3.11 By comparing Home Office MI to ASHE we can begin to analyse whether there is undercutting by Tier 2 migrants. It is extremely difficult to categorically identify undercutting – this would require us to identify that a migrant is paid less than the going rate for a UK resident who is otherwise identical in terms of experience, skills and productivity. But by comparing the wage distributions we can gain a certain degree of insight into how the wages paid to migrants compare to those of UK workers. More detailed analysis than we can undertake before the Government’s deadline for this commission is required to answer the question more definitively.
Table 3.1: Median annual salaries for Tier 2 migrants and skilled workers Group Median annual salary
Tier 2 – Shortage Occupation List £37,000
Tier 2 – Resident Labour Market Test £35,000
Tier 2 – Short-term Intra-company transfer £38,000
Tier 2 – Long-term Intra-company transfer £67,000
ASHE – Continuously employed skilled workers (NQF 6+) £39,000
ASHE – Newly hired skilled workers (NQF 6+) £34,000 Notes: Median annual salaries rounded to nearest thousand. ASHE data separated into continuously employed and new hires based on whether employee started a new job within the last twelve months. Skilled workers in ASHE are defined to be those working in occupations defined as NQF 6+. Source: Tier 2 salary data taken from Home Office management information based on Certificates of Sponsorship granted in year ending March 2015. Other data from ASHE 2014.
3.12 Median salaries paid to Tier 2 migrants (Table 3.1) are broadly similar to the median salaries paid to newly hired skilled workers according to ASHE, with the exception of long-term intra-company transferees which are substantially higher. However, looking at the medians alone does not reveal much – in the analysis which follows we examine the full distribution of salaries paid across these groups.
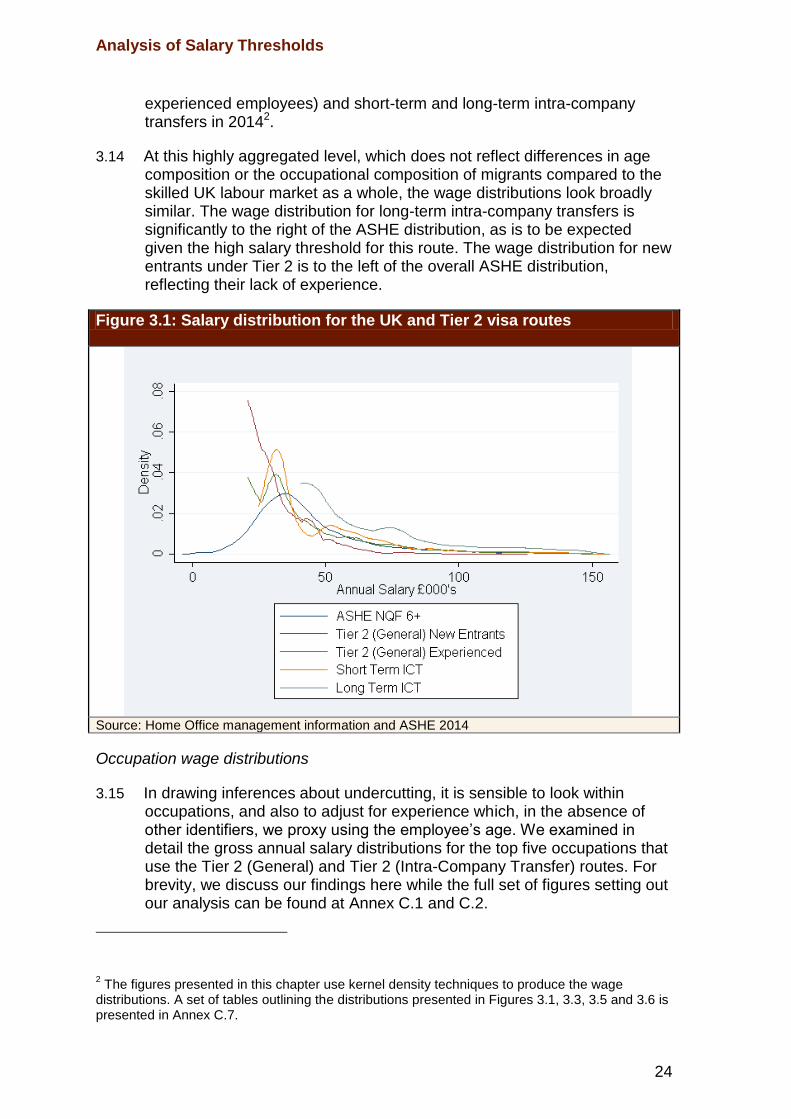
3.13 Figure 3.1 presents the wage distribution from ASHE 2014 for full-time employees in occupations classed as being skilled to National Qualifications Framework level 6 and above (NQF6+), which is the skill threshold for Tier 2 migrants1. Alongside the wage distribution for skilled workers across the UK labour market, the chart presents the wage distribution for Tier 2 (General) migrants (split into new entrants and
1A small number of occupations on the Shortage Occupation List are not skilled to NQF 6+.
Analysis of Salary Thresholds
24
experienced employees) and short-term and long-term intra-company transfers in 20142.
3.14 At this highly aggregated level, which does not reflect differences in age composition or the occupational composition of migrants compared to the skilled UK labour market as a whole, the wage distributions look broadly similar. The wage distribution for long-term intra-company transfers is significantly to the right of the ASHE distribution, as is to be expected given the high salary threshold for this route. The wage distribution for new entrants under Tier 2 is to the left of the overall ASHE distribution, reflecting their lack of experience.
Figure 3.1: Salary distribution for the UK and Tier 2 visa routes
Source: Home Office management information and ASHE 2014
Occupation wage distributions
3.15 In drawing inferences about undercutting, it is sensible to look within occupations, and also to adjust for experience which, in the absence of other identifiers, we proxy using the employee’s age. We examined in detail the gross annual salary distributions for the top five occupations that use the Tier 2 (General) and Tier 2 (Intra-Company Transfer) routes. For brevity, we discuss our findings here while the full set of figures setting out our analysis can be found at Annex C.1 and C.2.
2 The figures presented in this chapter use kernel density techniques to produce the wage
distributions. A set of tables outlining the distributions presented in Figures 3.1, 3.3, 3.5 and 3.6 is presented in Annex C.7.

Chapter 3: Economic rationale for increasing Tier 2 salary thresholds
25
3.16 Figure 3.2 below provides, for illustration, an example of one of the occupational charts, for IT business analysts, architects and systems designers (SOC 2135) entering under Tier 2 (General). The red line represents the distribution of gross annual pay (including allowances) for Tier 2 (General) migrants in this occupation. The blue line represents the distribution of gross annual pay for all full-time, working-age employees in SOC 2135 in the UK, using ASHE 2014. The vertical red line represents the 25th percentile for this occupation which is the current minimum salary threshold for experienced workers. In some occupations, the £41,500 overall minimum threshold for the long-term intra-company transfer route is greater than the 25th percentile – this is clearly marked on the charts.
Figure 3.2: Salary distribution for IT business analysts, architects and systems designers (2135) for the UK and Tier 2 (General)
Source: Home Office management information and ASHE 2014
3.17 We noted that for most occupations, the salaries paid to Tier 2 migrants cluster around the minimum salary thresholds set out in the Home Office codes of practice. This is an indication that the salary thresholds are binding and that, with a free choice, employers might otherwise be expected to offer lower wages in some cases. To some extent, this clustering is to be expected – in cases where the threshold binds (in other words, where the wage the employer would like to pay is lower than the threshold), the employer may top up wages in order to meet the threshold, provided it remains profitable to recruit the migrant at this higher wage. So there will be a clustering at the threshold that is absent from the ASHE distribution for the rest of the UK labour market in that occupation. This clustering may also be particularly expected given the age profile (and, by proxy, experience) of Tier 2 migrants – see below. It should be stressed that this clustering does not, on its own, indicate undercutting. Indeed, it

Analysis of Salary Thresholds
26
may be evidence that the current salary thresholds are operating as intended, putting slight upward pressure on wages.
3.18 Aside from the clustering at the threshold, we also noted that the right tail of the wage distribution for Tier 2 (General) migrants is, for some occupations, longer than for the overall UK labour market, i.e. there are a small number of individual migrants in receipt of higher salaries than are paid to native workers. At the same time, a visual inspection suggests that the total mass of the distribution towards the top end is lower for Tier 2 (General) migrants than for natives in many occupations. However we have not carried out a systematic comparison of the distributions for individual occupations. This lower mass towards the top of the distribution is again not, on its own, evidence of undercutting as it could be affected by factors such as the age composition of migrants compared to the UK workforce as a whole. This is explored in more detail below.
3.19 For short-term and long-term intra-company transfers, however, the wage distributions for individual occupations are, in general, markedly to the right of the distribution from ASHE.
3.20 There is also debate about the relevant comparison group for migrants. For instance, one plausible argument is that, rather than comparing Tier 2 salaries against the rest of the UK labour market, the relevant comparison is with salaries paid to new hires over the past year because these are the individuals who have competed directly in recruitment against Tier 2 migrants in the past year.
3.21 Figure 3.3 below presents the overall ASHE wage distribution for full-time employees in NQF6+ occupations who have been with their employer for less than twelve months. These wage distributions are compared to those for Tier 2 (General) new entrants (proxied by those aged 25 and under) and Tier 2 (General) experienced hires (proxied by those older than 25). For this analysis, we focused on Tier 2 (General). The intra-company transfer routes are slightly different as intra-company transferees must have already spent at least twelve months with their employer.

Chapter 3: Economic rationale for increasing Tier 2 salary thresholds
27
Figure 3.3: Salary distribution for occupations skilled to NQF 6+ for the UK and Tier 2 General
Source: Home Office management information and ASHE 2014
3.22 This analysis suggests that, in aggregate, the wage distribution for Tier 2 (General) migrants, both new entrants and experienced, is to the right of the wage distribution for new hires in the UK labour market. On this basis there is therefore little evidence of undercutting by Tier 2 (General) migrants at the aggregate level.
3.23 We examined variants of Figure 3.3 above for a selection of individual occupations. Data limitations meant this was only feasible for a small number of occupations with large enough samples occurring in both ASHE and in the Home Office MI. The full set of these figures is included in Annex C.3. The wages for specific occupations paid to Tier 2 migrants compared to new hires suggest that, in most cases, the wages paid to Tier 2 migrants are consistent with, or greater than, those paid to recently hired native workers. Again, this is not indicative of undercutting.
Age-adjusted distributions
3.24 A comparison of wages paid to migrants against those paid to resident workers should compare like with like. In addition to looking at the occupation of a migrant, it is sensible to adjust for the migrant’s age. If migrants are generally older (more experienced) or younger (less experienced) than resident workers, their wages should be higher or lower than the UK average. We therefore examined, where data permitted, the wage distributions within occupations for banded age groups. We assumed that migrants within these age categories were likely to have similar levels of experience to UK resident workers within the same age group.

Analysis of Salary Thresholds
28
3.25 Figure 3.4 shows the age distribution in ASHE for full-time employees working in occupations skilled to NQF6+ alongside the age distribution for different categories of Tier 2 migrants. It is evident that Tier 2 migrants are generally concentrated between the ages of twenty and forty, with a slightly older age profile for long-term intra-company transferees. In contrast, the age distribution of the UK workforce is much more evenly spread across a greater variety of working ages.
Figure 3.4: Age distribution for skilled UK employees and Tier 2 migrants
Source: Home Office management information and ASHE 2014
3.26 Given the relatively concentrated age profile of Tier 2 migrants, it is sensible to focus on the wage distributions for the 16–25 and 26–40 age groups across all occupations to ensure a closer matching with resident workers. These are presented in Figures 3.5 and 3.6. Within these age groups, Tier 2 migrants are paid broadly in line with resident workers, with a slightly greater concentration of Tier 2 migrants towards the top of the wage distribution compared to natives. The exception to this is long-term intra-company transferees, for whom the wage distribution is to the right of the distribution for resident workers in both age groups, suggesting that long-term intra-company transfer migrants are generally in receipt of salaries significantly higher than are typical amongst skilled resident workers of a similar age.

Chapter 3: Economic rationale for increasing Tier 2 salary thresholds
29
Figure 3.5: Salary distribution for the UK and Tier 2 visa routes for 16–25 age group
Source: Home Office management information and ASHE 2014
Figure 3.6: Salary distribution for the UK and Tier 2 visa routes for 26–40 age group
Source: Home Office management information and ASHE 2014
3.27 As part of our wider analysis of the pay of Tier 2 migrants and resident workers, we used Home Office MI to examine the age distributions for individual occupations, focusing on high volume occupations only due to data limitations. For these occupations, we produced age-adjusted wage

Analysis of Salary Thresholds
30
distributions by limiting our focus to the main age group in the age distribution for that occupation. The full set of age-adjusted occupational wage distributions that we examined is at Annex C.4. These show that, in general, but not in all cases, the wage distribution for Tier 2 migrants is broadly in line with that for resident workers of similar age, and in many cases indicate higher wages for Tier 2 migrants.
3.28 The extent to which it is valid to adjust for age in analysing undercutting is debateable. Adjusting for age allows an examination of whether migrants with similar experience are paid the same as resident workers but adjusting for age could mask employer substitution of migrants for resident workers across age groups. For example, if an employer chose to employ a young migrant because they are cheaper than a more experienced resident worker, then this could be a form of undercutting.
3.29 It is also true that younger resident workers could undercut experienced resident workers in the same way. Competition between younger and older workers is a vital part of a competitive labour market, but it is not obvious that the migration system should facilitate such competition through the recruitment of migrant workers. However, we have not been able, in the time available and with the available data, to determine whether this form of substitution is currently taking place to a significant extent. We note that previous research has found evidence of imperfect substitutability of resident for migrant workers across age groups (Manacorda et al., 2012).
3.3 Evidence from partners on undercutting
3.30 We received a great deal of evidence from partners in relation to the salaries paid by employers to Tier 2 migrants. Lots of the submissions we received stated that Tier 2 migrants are paid the going rate for the role and that the costs of recruiting a migrant meant that a suitable UK worker would be hired if available. However, some respondents said that the salary thresholds were lower than the actual salaries being paid in the current market place. Some went further and said that this meant that employers could take on migrant employees through Tier 2 at a lower cost than on the open market by paying only the salary threshold.
3.31 Some responses from trade unions highlighted that there had been a number of cases of migrants being employed to undercut local workers. The TUC said that this was particularly the case in the IT and telecommunications sector where the salary threshold was significantly lower than the going rate for many jobs in those sectors.
3.32 In contrast, evidence we received from companies in the IT sector said that the salaries they paid to Tier 2 migrants, mostly under the intra-company transfer routes, were at or above the going rate for UK workers. Many of the IT firms who responded to the call for evidence highlighted the higher costs involved in recruiting a migrant worker and stated that a UK worker would be hired if available.

Chapter 3: Economic rationale for increasing Tier 2 salary thresholds
31
3.33 A comparison of the Arts sector sample salary data by UK Screen showed no evidence of employers setting salaries at the minimum threshold and that the thresholds were not being used to drive down market rates. By contrast, the British Society of Cinematographers said that they were concerned that skilled workers from outside the UK were undercutting the salaries paid to European workers and that tax avoidance was used to encourage under-payment of salaries. As such, they were in favour of raising the salary thresholds.
3.34 A number of representatives from the education sector said that a national framework agreement for higher education staff required employers in that sector to pay all staff the appropriate wage for the job, and thus acted to preclude undercutting by Tier 2 migrants. The CBI said that the overall cost of hiring a migrant via the Tier 2 route made it considerably more expensive than hiring a UK or EEA national.
3.35 The Department for Business, Innovation and Skills (BIS) stated that there is little evidence that highly-skilled migrants are undercutting UK highly skilled workers. BIS stated that there is unlikely to be any meaningful impact of the Tier 2 salary thresholds on the overall UK wage distribution, even within specific occupations or industries.
3.36 PwC said that during the recruitment process, in order to comply with anti-discrimination legislation, businesses will be unaware of the immigration status of an individual candidate and will make recruitment decisions based upon the candidate’s suitability for the role. Therefore, salary offers will be made upon a range of factors that are unlikely to include consideration of the relevant Tier 2 minimum salary threshold as this could give rise to discrimination claims.
“Ubisoft pays 25% of the workforce at its NE-based studio, Reflections, below the 25th percentile and pay less than 10% of the workforce above the 50th percentile (in the relevant pay band). Therefore, skilled migrants are already being well-remunerated by entering on 25th percentile.”
Ubisoft response to MAC call for evidence
3.37 Care England said that the current thresholds provide an appropriate level of assurance that salary rates for overseas recruits are in line with the local market. They are in line with current pay-rates and do not provide any opportunity for overseas labour to undercut local staff who are permanently employed.
3.38 In evidence from the engineering sector, we were told that migrants’ salaries are often benchmarked to those paid to domestic workers, ensuring that there is no cost advantage to recruiting a migrant.
Analysis of Salary Thresholds
32
3.4 Conclusions
3.39 Strong evidence of undercutting of resident workers would provide an economic rationale for raising the current salary thresholds, on the basis that employers are turning to Tier 2 migrants at least partly in order to cut costs rather than because the skilled labour is unavailable in the UK labour market.
3.40 However, the initial analysis we have carried out to date, albeit in the limited time available, does not suggest widespread undercutting is taking place within the Tier 2 route. Examining the distribution of wages paid to Tier 2 migrants in comparison to the skilled resident workforce – both overall and within occupations, and adjusting for age - suggests that Tier 2 migrants are generally paid in line with, and often paid more than, equivalent resident workers. It should be stressed that this conclusion is preliminary and tentative and could be subject to change following a more in-depth analysis. It should also be noted that we have looked only at wage effects in this report. We have not considered the possibility of displacement of resident workers by migrants. However this is an issue we will pursue as part of our wider commission with a focus on specific occupations and sectors.
3.41 Our findings do not mean that there are no examples of undercutting or that undercutting does not happen – indeed it is likely that there are some employers recruiting Tier 2 migrants at less than the going rate for a native worker. Some partners have presented evidence of cases of undercutting – and there may be some occupations or sectors where it is more prevalent than in others. However, our analysis suggests that if there is undercutting within Tier 2 it is isolated rather than widespread practice.
3.42 The laws of supply and demand dictate that higher salary thresholds should reduce employer demand for skilled migrant labour (as their price is going up) and, all things being equal, reduce inflows of skilled migrants and their dependants under Tier 2, thus helping the Government to achieve its aim of reducing skilled immigration into the UK. However, this impact will be at the margin – while some employers will reduce their recruitment of migrant labour, others will not be significantly affected. In section 3.3 we presented evidence from partners to illustrate this point. In Chapters 4 and 5 of this report we set out the potential change in inflows under a range of different salary thresholds.
3.43 Aside from contributing to the Government’s aim of reducing migration, a rise in the salary threshold is likely to have a range of other economic impacts. If employers are unable to afford skilled Tier 2 labour and cannot source appropriate labour from within the UK or the European Economic Area, this could lead to bottlenecks constraining the growth of individual firms (see evidence from partners in section 3.3), particularly as the UK approaches full employment. To some extent this is already the case as the Tier 2 (General) limit has begun to bind in recent months (see Chapter
Chapter 3: Economic rationale for increasing Tier 2 salary thresholds
33
6), resulting in some employers being refused Certificates of Sponsorship under Tier 2 (General).
3.44 Restricting Tier 2 inflows could also limit UK productivity growth because of the skill level of Tier 2 migrants. Skilled migrants contribute to productivity growth both through a compositional effect on the workforce (being more skilled than the average resident worker) and also through dynamic impacts which, although difficult to measure, help raise productivity across the board. These dynamic impacts arise as a result of the different set of skills, knowledge, experience and connections to other countries that skilled migrants bring which can lead to improvements in the way UK firms do business (Nathan et al., 2013).
3.45 Chapter 4 will assess the impact on migrant numbers of increasing the overall salary thresholds for Tier 2.


35
Chapter 4 Impact of increasing the minimum salary threshold
4.1 Introduction
4.1 In this chapter we consider the question the Government asked us in relation to the minimum salary threshold, namely, the impact of:
“Increasing the Tier 2 (General) minimum salary threshold of £20,800 and the Tier 2 (ICT) minimum salary thresholds of £24,800 for the short-term category and £41,500 for the long-term category to a level that better aligns with the salaries paid to highly specialised experts or individuals filling skills shortages skilled to NQF level 6 or higher”.
4.2 The chapter first sets out the methodology behind the current minimum salary thresholds and assesses whether the thresholds should be revised to reflect changes in policy and increases in earnings. It then goes on to set out the potential impact on applications under Tier 2 of an increase in the minimum thresholds, including looking at the main occupations that would be affected.
4.2 The minimum salary threshold for Tier 2 (General)
4.3 This section addresses the question put to us regarding the £20,800 income threshold for Tier 2 (General).
4.4 The Tier 2 (General) threshold originates from a review of the Shortage Occupation list carried out by the MAC in 2008 and a subsequent review of Tier 2 in 2009. At the time, the skill requirement for Tier 2 was at National Qualifications Framework (NQF) level 3, which is equivalent to an A-level.
“[We] concluded that a minimum annual salary equivalent to approximately £10 per hour indicates that an occupation is skilled; £10 per hour is equivalent to slightly over £20,000 per year for a typical working week of 40 hours.
It is difficult to argue, except in specific circumstances where pay may not be a good indicator of skill, that a job paying less than £20,000 per year is skilled to level 3: it is roughly equivalent to only the 30th percentile of the earnings distribution for full-time workers (Annual Survey of Hours and Earnings (ASHE), April 2008).”
MAC, Analysis of the Points Based System, 2009
Chapter 4 Impact of increasing the minimum salary threshold

Analysis of Salary Thresholds
36
4.5 In 2011, the Government increased the skill requirement to NQF4 (equivalent to a diploma). Following the MAC review of Tier 2 in 2012, the skills requirement was further raised to NQF level 6 and above (NQF6+) (bachelor’s degree or equivalent). Using the Annual Survey of Hours and Earnings (ASHE) 2014, the median salary for occupations skilled to NQF6+ is £39,000. Taking account of the fact that the 10th percentile for all occupations skilled to NQF6+ is £23,000, on this basis at least there is a strong rationale for increasing the minimum salary threshold for Tier 2 (General).
Table 4.1: Salary distribution of employees in occupations skilled to NQF6+ (£)
Percentile 10th 20
th 25
th 30
th 40
th 50
th 60
th 70
th 75
th
23,000
28,000
30,000
32,000
35,000
39,000
43,000
49,000
53,000
Source: MAC Analysis of Annual Survey of Hours and Earnings, 2014. Occupations skilled to NQF6+
are set out in Annex B.
4.6 Table 4.1 includes individuals who are not skilled to NQF6 but who work in occupations that are classified as skilled to NQF6. ASHE does not have details on individual characteristics or qualifications. However, using the Labour Force Survey, we can look at the salary distributions for individuals who are both qualified to NQF6 and who are working in occupations classified as skilled to NQF6. In effect, the salary distribution is very similar.
Table 4.2: Salary distribution of employees skilled to NQF6+ working within occupations skilled to NQF6+ (£)
Percentile 10th 20th 25th 30th 40th 50th 60th 70th 75th
23,000 27,000 30,000 31,000 35,000 39,000 43,000 49,000 51,000
Source: MAC Analysis of Labour Force Survey, 2014. Occupations skilled to NQF6+ are set out in Annex B. Individuals skilled to NQF6 includes those who have higher and first degrees and NVQs at level 5 but not foundation and other degrees or HNC/HND/BTECs.
4.3 The minimum salary threshold for short-term intra-company transfers
4.7 This section addresses the question put to us with regards to the £24,800 income threshold for short-term intra-company transfers. The £24,800 threshold was derived from our report “Analysis of the Points Based System” (Migration Advisory Committee, 2009), which also set the original £20,000 threshold for Tier 2 (General).
4.8 In the 2009 report, we recommended that 5 points should be awarded for a minimum salary of £20,000 (the minimum salary threshold). We recommended that 20 points be awarded for prospective earnings of at least £32,000 per annum which was the median pay of full-time, working age employees in skilled occupations in the UK labour market. To consider what minimum levels of earnings should be required to obtain 10 points and 15 points, the assumption was made that the relationship between skill and the position on the relevant point of the salary distribution is linear and positive. 5 points were suggested for being in the bottom third of the pay distribution between £20,000 and £32,000, 10 points for being in the middle third and 15 points for being in the top third. This distribution was generated from a sample comprising four quarters of the Labour Force Survey (2008 Q2 to 2009 Q1).

Chapter 4: Impact of increasing minimum salary threshold
37
4.9 At the time of the 2009 report we found that a large proportion of recruitment via the resident labour market test (RLMT) route was into health and education-related occupations. We recommended that certain occupations involved in the delivery of key public services (to be determined by the Government) be awarded an extra 5 points under the RLMT route. The Home Office translated the 5 point differential into a £4,000 higher salary requirement for short-term intra-company transfers.
4.10 Therefore, if the minimum salary threshold for Tier 2 (General) is increased, the minimum salary threshold for short-term intra-company transfers should be increased at least in line with the increase in the threshold for Tier 2 (General).
4.4 The minimum salary threshold for long-term intra-company transfers
4.11 We now focus on the £41,500 income threshold for the long-term intra-company transfer route. One of the requirements under the General Agreement on Trade in Services (GATS) is that the UK must allow the temporary presence of those intra-company transferees who are senior managers or specialists. The £41,500 threshold was set to act as a proxy in order to determine whether a migrant is a senior manager or specialist.
4.12 In our report “Limits on Migration” (Migration Advisory Committee, 2012), we considered a number of options for identifying senior managers and specialists, based on the Standard Occupational Classification (SOC) occupation hierarchy and SOC 2000 skill level. The analysis is repeated here, using the latest data from the Labour Force Survey and the SOC 2010 classifications, and shown in Tables 4.3 and 4.4 respectively.
4.13 The SOC skill level categorisation is based on the amount of time required to become fully competent, the time taken to gain the required formal or work-based training, and the experience required in an occupation.

Analysis of Salary Thresholds
38
Table 4.3: Description of the 1-digit SOC 2010 hierarchy
Major group General nature of qualifications, training and experience for occupations in the major group
1 Managers, directors and senior officials
A significant amount of knowledge and experience of the production processes and service requirements associated with the efficient functioning of organisations and businesses.
2 Professional occupations
A degree or equivalent qualification, with some occupations requiring postgraduate qualifications and/or a formal period of experience-related training.
3 Associate professional and technical occupations
An associated high-level vocational qualification, often involving a substantial period of full-time training or further study. Some additional task-related training is usually provided through a formal period of induction.
4 Administrative and secretarial occupations
A good standard of general education. Certain occupations will require further additional vocational training to a well-defined standard (e.g. office skills).
5 Skilled trades occupations
A substantial period of training, often provided by means of a work based training programme.
6 Caring, leisure and other service occupations
A good standard of general education. Certain occupations will require further additional vocational training, often provided by means of a work-based training programme.
7 Sales and customer service occupations
A general education and a programme of work-based training related to sales procedures. Some occupations require additional specific technical knowledge but are included in this major group because the primary task involves selling.
8 Process, plant and machine operatives
The knowledge and experience necessary to operate vehicles and other mobile and stationary machinery, to operate and monitor industrial plant and equipment, to assemble products from component parts according to strict rules and procedures and subject assembled parts to routine tests. Most occupations in this major group will specify a minimum standard of competence for associated tasks and will have a related period of formal training.
9 Elementary occupations
Occupations classified at this level will usually require a minimum general level of education (that is, that which is acquired by the end of the period of compulsory education). Some occupations at this level will also have short periods of work-related training in areas such as health and safety, food hygiene, and customer service requirements.
Source: ONS SOC 2010
4.14 The options used to identify senior managers and specialists, based on the SOC 2010 hierarchy and qualifications, are shown in Table 4.5. Option 1 uses major (1-digit) SOC 2010 group 1, managers and senior officials, as a proxy for senior managers and specialists. Option 2 uses major SOC 2010 groups 1 and 2 combined (therefore also including professional occupations) as a proxy, with option 3 using groups 1, 2 and 3 (therefore also including associate professional and technical occupations). Option 4 uses the highest SOC skill level categorisation, level 4, whilst option 5 includes the top two, level 4 and 3. Finally, option 6 is based on individuals qualified to NQF6+, whilst option 7 is based on occupations deemed to be skilled to NQF6+ overall.

Chapter 4: Impact of increasing minimum salary threshold
39
Table 4.4: The SOC 2010 skill level hierarchy
SOC skill level
2-digit SOC
Sub-major occupation
4 11 Corporate managers
21 Science, research, engineering and technology professionals
22 Health professionals
23 Teaching and research professionals
24 Business, media and public service professionals
3 12 Other managers and proprietors
31 Science, engineering and technology associate professionals
32 Health and social care associate professionals
33 Protective service occupations
34 Culture, media and sports occupations
35 Business and public service associate professionals
51 Skilled agricultural and related trades
52 Skilled metal and electrical trades
53 Skilled construction and building trades
54 Textiles, printing and other skilled trades
2 41 Administrative occupations
42 Secretariat and related occupations
61 Caring personal service occupations
62 Leisure, travel and related personal service occupations
71 Sales occupations
72 Customer service occupations
81 Process, plant and machine operatives
82 Transport and mobile machine drivers and operatives
1 91 Elementary trades and related occupations
92 Elementary administration and service occupations
Source: ONS SOC 2010
Table 4.5: Potential options for identifying senior managers/specialists Option number Description
1 1-digit SOC = 1
2 1-digit SOC = 1 and 2
3 1-digit SOC = 1,2 and 3
4 SOC skill level = 4
5 SOC skill level = 3 and 4
6 Qualifications held = NQF6+
7 Occupation classified as NQF6+ Notes: SOC is SOC 2010 in all cases. The definition of each 1-digit SOC is given in Table 4.3. The definition of each SOC skill level is given in Table 4.4.
4.15 In order to identify an appropriate salary threshold, the options identified in Table 4.5 can be applied to the Labour Force Survey and the Annual Survey of Hours and Earnings with the results set out in Table 4.6.

Analysis of Salary Thresholds
40
Table 4.6: Median annual gross salaries for alternative options to identify senior managers and specialists, LFS 2014 Q1-Q4 and ASHE 2014
Option number Description LFS ASHE
1 1-digit SOC = 1 £37,000 £40,000
2 1-digit SOC = 1 and 2 £36,000 £37,000
3 1-digit SOC = 1, 2 and 3 £34,000 £35,000
4 SOC skill level = 4 £36,000 £38,000
5 SOC skill level = 3 and 4 £31,000 £34,000
6 Qualifications held = NQF6+
£34,000 N/A
7 Occupation classified as NQF6+
£37,000 £39,000
Notes: Occupations grouped using 2010 Standard Occupational Classifications (SOC) as defined by the Office for National Statistics. Salary data from the Annual Survey of Hours and Earnings (ASHE) are for full-time workers during the period January 2014 to December 2014 and are provisional. Salary data from the Labour Force Survey (LFS) are the average annual gross salaries for full-time workers for the period 2014 Q1 to 2014 Q4. All salaries rounded to the nearest thousand. Source: MAC analysis of Annual Survey of Hours and Earnings (2014) and the Labour Force Survey, 2014 Q1-Q4
4.16 Consistent with the conclusions in the MAC 2012 report, there is no quantitative reason to suggest that a salary threshold lower than £40,000 would be an appropriate proxy test for identifying senior managers and specialists.
4.5 Salaries paid to highly specialised experts and individuals filling skills shortages skilled to NQF6+
4.17 In economic theory, pay is assumed to be a reflection partly of skill. The more skilled an individual is, the greater their value and therefore the more they may be paid. Shortages of desired skills will lead to excess demand resulting in an increase in price (or pay). If this theory holds, an increase in the salary thresholds could be an effective mechanism to restrict Tier 2 to highly specialised experts and individuals filling skills shortages.
4.18 However, there are a number of reasons why pay may not always appropriately reflect the skill level or reflect a skill shortage. In particular, pay could be influenced by a number of factors including the size of the business, the experience of the employee, the region and also whether the employer is in the public or private sector.
4.19 Some of the responses to our call for evidence gave extensive consideration to whether pay was a good reflection of skill. Some respondents such as J. Dunlop, Ground Forum, Aeropeople, and the Royal Pharmaceutical Society stated that pay is a good proxy for skill or the least worst proxy. A number of law firms said there were problems with pay as a proxy for skill in sectors with a traditionally low wage structure. Respondents from the education sector also emphasised this point and said that most academic and research employees at the earliest stage of their careers have a high level of skill (reflected in qualifications such as a PhD) yet receive a comparatively low salary (e.g. Research Councils UK). Similarly, evidence from Campaign for Science and Engineering noted that researchers in engineering fields receive

Chapter 4: Impact of increasing minimum salary threshold
41
relatively low pay, despite their high skill level. Pay levels within the education sector were highly correlated with experience but pay progression is not automatic. Additionally, the highest demand is not necessarily at the more senior levels (i.e. the higher paid).
4.20 The Department for Business, Innovation and Skills (BIS) stated that businesses are best placed to decide which individual’s skills best match the role available and which individuals are experts in their area.
4.21 One law firm said that migrants often perform routine accountancy roles as firms cannot find UK staff with necessary qualifications and experience. Laura Devine Solicitors said that higher pay may be more reflective of seniority than expertise. Further, the University and Colleges Employers Association said that the total remuneration package could include relatively attractive pension schemes and non-financial benefits such as generous holiday entitlements.
“We offer an all encompassing total reward package including; salary, pension, flexible benefits, affinity discount schemes. The total reward package philosophy is one which considers compensation, benefits, discounts learning and development opportunities.”
Siemens response to MAC call for evidence
4.22 Responses from the energy sector were uniformly of the view that pay was not a suitable proxy, with Horizon Nuclear Power referring to the use of salary as a proxy as being ‘an exceptionally blunt instrument’. Partly this was due to the wide variety of roles within the same SOC codes, differences in regional pay and also in the amount of experience of members of staff. Horizon Nuclear Power said that the demand for workers often focussed on those with certain qualities and experience. Siemens said that they do not consider pay to be the sole measure of the worth of an employee. TUC and Unison said that they were concerned that an increasing number of workers were not being paid at levels that reflect their skill level. Total said that pay should be somehow supplemented with consideration of the amount of experience to develop a better proxy for skill. Engineering the Future (an alliance of professional engineering institutions and national organisations representing professional engineers) said that elements such as professional registration could be used instead of pay. However, the Engineering Employers Federation expressed concern that using the definition of being chartered as constituting the skill level may put that threshold too high for many companies. They, therefore, favoured a salary threshold as being simpler to determine and easier to understand.
4.23 A number of NHS Foundation Trusts and the Royal College of Nursing said that pay was not the only measure of nurses’ skill. They pointed out that there had been limited pay increases over the past 5 years, mostly at 1 per cent, and that there was often differentiation between private and public sector nurses’ pay. The Shelford Group said that pay was a good proxy as long as incremental progression was recognised. Care England said that while pay was one indication of skill, staff in the care sector who do have high skills were not necessarily highly paid.

Analysis of Salary Thresholds
42
4.24 Further analysis is required to consider the options for focusing the route on highly specialised experts and individuals filling skills shortages. This will include consideration of whether pay is the best reflection of skill and skill shortages, or whether alternative criteria should be considered.
4.6 The impact on applications under Tier 2 of an increase in the minimum salary thresholds
4.25 Simulations can illustrate the potential impacts that may occur as a result of changes in overall salary thresholds. This technique can be used to demonstrate the possible impacts of changing the overall salary threshold across all routes and occupations including the number of individuals that would potentially be restricted from entering the UK under Tier 2 as a direct result of being paid a salary below a higher minimum threshold. As Box 4.1 sets out, the simulations are static and assume that the migrant sponsor does not increase their salary offer to meet the new thresholds.
Box 4.1 Simulation of impacts of raising pay thresholds
Simulations can illustrate the potential impact on migrant numbers as a result of changes in the Tier 2 salary thresholds. The current salary thresholds include allowances.
The simulations do not account for the possibility that the migrant sponsor increases the salary offer in order to meet the new thresholds. There could also be switching between routes and occupations.
The simulations therefore show how many CoS applications would be affected based on Tier 2 volumes in 2014, and should not be interpreted as an estimate of the reduction in demand for visas.
The analysis assumes that the thresholds apply to both in-country and out-of-country applications. An increase in the salary thresholds for out-of-country applications could see a reduction in the number of migrants entering the UK (reduced inflow). An increase in the salary threshold for in-country applications, which includes extensions and switching from other routes, could see an increase in the number of migrants leaving the UK (increased outflow). Both effects would lead to an overall reduction in net migration.
4.26 Across the four routes, out-of-country visa applications account for approximately 62 per cent of all CoS granted under Tier 2. This is especially so for the short-term intra-company transfer route where 96 per cent of applications are out-of-country. For the long-term intra-company transfer route, around two-thirds (66 per cent) of CoS granted were out-of-country. By contrast, for Tier 2 (General) overall the majority (58 per cent) of applications are granted in-country.
4.27 Overall median salaries for in-country applications are lower than for out-of-country applications within Tier 2 (General): £37,000 versus £40,000 respectively. Therefore, in respect of Tier 2 (General) any increase in the salary thresholds would have a greater effect on in-country applications. Conversely, for both the short-term and long-term intra-company transfer routes, the median salary is higher for in-country applications. For the short-term intra-company transfer route, the median salary for in-country
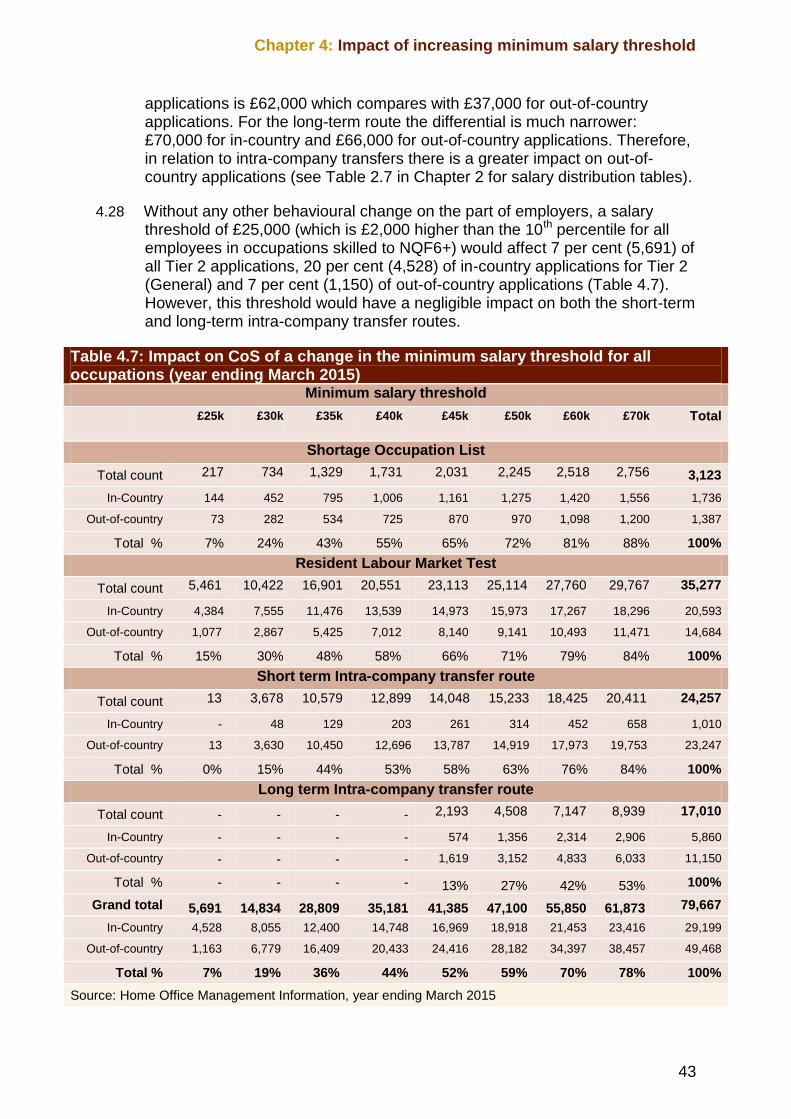
Chapter 4: Impact of increasing minimum salary threshold
43
applications is £62,000 which compares with £37,000 for out-of-country applications. For the long-term route the differential is much narrower: £70,000 for in-country and £66,000 for out-of-country applications. Therefore, in relation to intra-company transfers there is a greater impact on out-of-country applications (see Table 2.7 in Chapter 2 for salary distribution tables).
4.28 Without any other behavioural change on the part of employers, a salary threshold of £25,000 (which is £2,000 higher than the 10th percentile for all employees in occupations skilled to NQF6+) would affect 7 per cent (5,691) of all Tier 2 applications, 20 per cent (4,528) of in-country applications for Tier 2 (General) and 7 per cent (1,150) of out-of-country applications (Table 4.7). However, this threshold would have a negligible impact on both the short-term and long-term intra-company transfer routes.
Table 4.7: Impact on CoS of a change in the minimum salary threshold for all occupations (year ending March 2015)
Minimum salary threshold
£25k £30k £35k £40k £45k £50k £60k £70k Total
Shortage Occupation List
Total count 217
734
1,329
1,731
2,031
2,245
2,518
2,756
3,123
In-Country 144 452 795 1,006 1,161 1,275 1,420 1,556 1,736
Out-of-country 73 282 534 725 870 970 1,098 1,200 1,387
Total % 7% 24% 43% 55% 65% 72% 81% 88% 100%
Resident Labour Market Test
Total count 5,461
10,422
16,901
20,551
23,113
25,114
27,760
29,767
35,277
In-Country 4,384 7,555 11,476 13,539 14,973 15,973 17,267 18,296 20,593
Out-of-country 1,077 2,867 5,425 7,012 8,140 9,141 10,493 11,471 14,684
Total % 15% 30% 48% 58% 66% 71% 79% 84% 100%
Short term Intra-company transfer route
Total count 13
3,678
10,579
12,899
14,048
15,233
18,425
20,411
24,257
In-Country - 48 129 203 261 314 452 658 1,010
Out-of-country 13 3,630 10,450 12,696 13,787 14,919 17,973 19,753 23,247
Total % 0% 15% 44% 53% 58% 63% 76% 84% 100%
Long term Intra-company transfer route
Total count - - - - 2,193
4,508
7,147
8,939
17,010
In-Country - - - - 574 1,356 2,314 2,906 5,860
Out-of-country - - - - 1,619 3,152 4,833 6,033 11,150
Total % - - - - 13% 27% 42% 53% 100%
Grand total 5,691 14,834 28,809 35,181 41,385 47,100 55,850 61,873 79,667
In-Country 4,528 8,055 12,400 14,748 16,969 18,918 21,453 23,416 29,199
Out-of-country 1,163 6,779 16,409 20,433 24,416 28,182 34,397 38,457 49,468
Total % 7% 19% 36% 44% 52% 59% 70% 78% 100%
Source: Home Office Management Information, year ending March 2015
Analysis of Salary Thresholds
44
4.29 A salary threshold of £40,000 would affect 44 per cent of applications across Tier 2 (35,181 applications). For Tier 2 (General) it would affect 65 per cent (14,545) of in-country applications and 48 per cent (7,737) of out-of-country applications. For the short-term intra-company transfer route it would affect 20 per cent (203) of in-country applications and 55 per cent (12,696) of out-of-country applications, with no impact on the long-term intra-company transfer route.
4.30 In order to begin to have an impact on the long-term intra-company transfer route, the flat salary threshold would have to be raised to £50,000, where the threshold would affect 27 per cent of long-term applications, including 23 per cent (1,356) of in-country applications and 28 per cent (3,152) of out-of-country applications.
4.31 Under the current Home Office Codes of Practice, new entrants are subject to the same flat threshold as experienced workers, although there are some exceptions to this such as for pre-registration nurses (see Box 4.2 below).
Box 4.2: Current exemption from salary threshold for nurses
Nurse and midwife posts start at Band 5, but there is allowance in the current Codes of Practice for posts at Band 3 or equivalent in the Agenda for Change 2013 with a starting salary of under £20,000. This provision allows overseas trained nurses (non-UK /EEA) to come to the UK as healthcare assistants to undertake an Overseas Nursing Programme under Tier 2 to train to gain Nursing and Midwifery Council (NMC) registration as a nurse. Their Tier 2 applications are assessed on the guaranteed annual salary that will be paid when the individual achieves NMC registration. They may be paid under £20,000 while they are training. If the applicant has not achieved NMC registration after nine months, their leave may be curtailed. Midwives have a similar arrangement on adaptation courses.
Source: Department of Health response to MAC call for evidence
4.32 Table 4.8 restricts the Management Information sample to those aged under 26 as an imperfect proxy for new entrants. Some migrants aged 26 and over may qualify as new entrants, equally not all applicants under the age of 26 are necessarily new entrants.
4.33 Table 4.8 shows that an increase in the minimum salary threshold will have a significant impact on new entrants. For example, a £30,000 threshold would affect 43 per cent (3,679) of applications overall, with the shortage occupation list experiencing the biggest impact. There would be no impact on the long-term intra-company transfer route. There may be a case for excluding new entrants from any substantial increase in the salary thresholds as they tend to earn less.

Chapter 4: Impact of increasing minimum salary threshold
45
Table 4.8: Impact on CoS of a change in the minimum salary threshold for all occupations and restricted to those aged under 26 years of age (year ending March 2015)
Minimum salary threshold
£25k £30k £35k £40k £45k £50k £60k £70k Total
Shortage Occupation List
Total count 77 160 202 227 243 246 252 258 265
In-Country 49 96 119 129 134 137 140 143 147
Out-of-country 28 64 83 98 109 109 112 115 118
Total % 29% 60% 76% 86% 92% 93% 95% 97% 100%
Resident Labour Market Test
Total count 1,216 2,259 2,921 3,363 3,657 3,952 4,220 4,312 4,390
In-Country 916 1,537 1,912 2,117 2,251 2,381 2,460 2,512 2,552
Out-of-country 300 722 1,009 1,246 1,406 1,571 1,760 1,800 1,838
Total % 28% 51% 67% 77% 83% 90% 96% 98% 100%
Short term Intra-company transfer route
Total count 6 1,260 1,820 1,954 2,119 2,375 2,850 3,038 3,422
In-Country - 17 24 28 33 40 65 84 105
Out-of-country 6 1,243 1,796 1,926 2,086 2,335 2,785 2,954 3,317
Total % 0% 37% 53% 57% 62% 69% 83% 89% 100%
Long term Intra-company transfer route
Total count - - - - 84 168 250 292 401
In-Country - - - - 1 4 9 10 17
Out-of-country - - - - 83 164 241 282 384
Total % - - - - 21% 42% 62% 73% 100%
Grand total 1,299 3,679 4,943 5,544 6,103 6,741 7,572 7,900 8,478
In-Country 965 1,650 2,055 2,274 2,419 2,562 2,674 2,749 2,821
Out-of-country 334 2,029 2,888 3,270 3,684 4,179 4,898 5,151 5,657
Total % 15% 43% 58% 65% 72% 80% 89% 93% 100%
Source: Home Office Management Information, year ending March 2015

Analysis of Salary Thresholds
46
4.34 Table 4.10 presents the effects on the top five occupations affected, in terms of total applications, of an increase in the salary threshold of £25,000, £30,000 and £40,000. Long-term intra-company transfers are not included as the current threshold is already £41,500.
4.35 The table shows that with a £30,000 threshold, Chefs and Secondary education teaching professionals would be most significantly affected within the shortage occupation list, affecting 136 (60 per cent) and 105 (53 per cent) applications respectively. Through the RLMT route, Nurses would be most affected with 1,942 applications (78 per cent) within the occupation being affected. For the short-term intra-company-transfer route, the biggest impact would be within the IT sector. For example, 1,433 applications (39 per cent)
Table 4.9: Impact on CoS of a change in the minimum salary threshold for all occupations and restricted to those aged 26 years of age and over (year ending March 2015)
Minimum salary threshold
£25k £30k £35k £40k £45k £50k £60k £70k Total
Shortage Occupation List
Total count 140 574 1,127 1,504 1,788 1,999 2,266 2,498 2,858
In-Country 95 356 676 877 1,027 1,138 1,280 1,413 1,589
Out-of-country 45 218 451 627 761 861 986 1,085 1,269
Total % 5% 20% 39% 53% 63% 70% 79% 87% 100%
Resident Labour Market Test
Total count 4,245 8,163 13,980 17,188 19,456 21,162 23,540 24,455 30,887
In-Country 3,468 6,018 9,564 11,422 12,722 13,592 14,807 15,784 18,041
Out-of-country 777 2,145 4,416 5,766 6,734 7,570 8,733 9,671 12,846
Total % 14% 26% 45% 56% 63% 69% 76% 79% 100%
Short term Intra-company transfer route
Total count 7 2,418 8,759 10,945 11,929 12,858 15,575 17,373 20,835
In-Country - 31 105 175 228 274 387 574 905
Out-of-country 7 2,387 8,654 10,770 11,701 12,584 15,188 16,799 19,930
Total % 0% 12% 42% 53% 57% 62% 75% 83% 100%
Long term Intra-company transfer route
Total count - - - - 2,109 4,340 6,897 8,647 16,609
In-Country - - - - 573 1,352 2,305 2,896 5,843
Out-of-country - - - - 1,536 2,988 4,592 5,751 10,766
Total % - - - - 13% 26% 42% 52% 100%
Grand total 4,392 11,155 23,866 29,637 35,282 40,359 48,278 52,973 71,189
In-Country 3,563 6,405 10,345 12,474 14,550 16,356 18,779 20,667 26,378
Out-of-country 829 4,750 13,521 17,163 20,732 24,003 29,499 33,306 44,811
Total % 6% 16% 34% 42% 50% 57% 68% 74% 100%
Source: Home Office Management Information, year ending March 2015

Chapter 4: Impact of increasing minimum salary threshold
47
for Information technology and telecommunications professionals would be affected.
Table 4.10: Top 5 Occupations affected by salary thresholds at £25,000, £30,000 and £40,000, split by route (year ending March 2015)
Shortage Occupation List route
SOC code Occupation title
Median salary No.
affected In Country Out-of-
country %
Total
£25,000
2314 Secondary education teaching professionals
29,379 51 17 34 26%
3416 Arts officers, producers and directors 45,000 26 23 3 21%
2126 Design and development engineers 35,000 21 18 3 7%
2136 Programmers and software development professionals
33,000 19 18 1 12%
2217 Medical radiographers 35,159 13 6 7 8%
Total restricted: 217 144 73 7%
£30,000
5434 Chefs 29,600 136 112 24 60%
2314 Secondary education teaching professionals
29,379 105 29 76 53%
2126 Design and development engineers 35,000 77 44 33 24%
2442 Social workers 30,750 52 21 31 42%
2136 Programmers and software development professionals
33,000 49 44 5 31%
Total restricted: 734 452 282 24%
£40,000
5434 Chefs 29,600 215 160 55 94%
2126 Design and development engineers 35,000 211 123 88 65%
2314 Secondary education teaching professionals
29,379 175 62 113 88%
2211 Medical practitioners 59,539 124 60 64 19%
2217 Medical radiographers 35,159 124 49 75 78%
Total restricted: 1,731 1,006 725 55%
Resident Labour Market Test route
SOC code Occupation title
Median salary No.
affected In Country Out-of-
country %
Total
£25,000
2231 Nurses 24,836 1,299 648 651 52%
3545 Sales accounts and business development managers
25,038 1,138 1,102 36 47%
2139 Information technology and telecommunications professionals
30,000 215 213 2 21%
2421 Chartered and certified accountants 35,200 202 167 35 16%
2472 Public relations professionals 22,550 192 165 27 60%
Total restricted: 5,461 4,384 1,077 15%
£30,000
2231 Nurses 24,836 1,942 890 1,052 78%
3545 Sales accounts and business development managers
25,038 1,317 1,242 75 55%
2119 Natural and social science professionals n.e.c.
31,644 1,057 674 383 30%
2421 Chartered and certified accountants 35,200 496 345 151 38%

Analysis of Salary Thresholds
48
Table 4.10: Top 5 Occupations affected by salary thresholds at £25,000, £30,000 and £40,000, split by route (year ending March 2015)
2423 Management consultants and business analysts
46,035 428 348 80 18%
Total restricted: 10,422 7,555 2,867 30%
£40,000
2119 Natural and social science professionals n.e.c.
31,644 3,190 2,002 1,188 90%
2231 Nurses 24,836 2,456 1,174 1,282 98%
3545 Sales accounts and business development managers
25,038 1,816 1,512 304 76%
2136 Programmers and software development professionals
37,000 1,452 839 613 55%
2423 Management consultants and business analysts
46,035 867 603 264 36%
Total restricted: 20,551 13,539 7,012 58%
Short term Intra-company Transfer route
SOC code
Occupation title Median salary No. affected
In Country Out-of-country
% Total
£25,000
3538 Financial accounts managers 56,843 3 - 3 2%
2122 Mechanical engineers 47,694 2 - 2 1%
2126 Design and development engineers 40,991 2 - 2 0%
3532 Brokers 73,952 2 - 2 3%
3534 Finance and investment analysts and advisers
71,973 1 - 1 0%
Total restricted: 13 - 13 0%
£30,000
2139 Information technology and telecommunications professionals
32,153 1,433 8 1,425 39%
2136 Programmers and software development professionals
33,270 1,364 25 1,339 18%
2137 Web design and development professionals
26,846 286 1 285 81%
2423 Management consultants and business analysts
62,942 104 1 103 8%
2126 Design and development engineers 40,991 101 1 100 18%
Total restricted: 3,678 48 3,630 15%
£40,000
2136 Programmers and software development professionals
33,270 5,168 73 5,095 68%
2135 IT business analysts, architects and systems designers
36,100 3,330 34 3,296 62%
2139 Information technology and telecommunications professionals
32,153 2,596 46 2,550 70%
2137 Web design and development professionals
26,846 320 1 319 91%
2423 Management consultants and business analysts
62,942 245 5 240 19%
Total restricted: 12,899 203 12,696 53%
Source: Home Office Management Information, year ending March 2015
4.36 Whereas Table 4.10 above focuses on the top five occupations affected in terms of total number of CoS, Figure 4.1 below demonstrates, for each occupation the proportion of Certificates of Sponsorship that would potentially

Chapter 4: Impact of increasing minimum salary threshold
49
be affected by a £25,000, £30,000 and £40,000 threshold under Tier 2 (General). This analysis was replicated for short-term intra-company transfers (Figure 4.2). Long-term intra-company transfers are not included as the current threshold is £41,500. The numbers above each bar represent total CoS granted for that occupation in the year to end March 2015.
4.37 It is important to note that when considering the proportion affected, some of the occupations most affected (i.e. close to 100 per cent), had very few CoS used within that occupation.
4.38 Figure 4.1 shows that for Tier 2 (General), the top five occupations affected by a £25,000 threshold, by proportion, are: 2449 Welfare professionals where 100 per cent (20) would be affected, as well as 67 percent (50) of Therapy professionals (SOC 2229), 60 per cent (192) of Public relations professionals (SOC 2472), 56 per cent (5) of Education advisors and school inspectors (SOC 2318) and 54 percent (21) of Social services managers and directors (SOC 1184).
4.39 For short-term intra-company transfers (Figure 4.2), the top five occupations affected by a £30,000 threshold are: 100 per cent (1) of 1181 Health services and public health managers and directors, as well as 100 per cent (1) of Health professionals n.e.c (SOC 2219), 81 per cent (284) of Web design and development professionals (SOC 2137), 65 per cent (13) of Natural and social science professional n.e.c (SOC 2119) and 50 per cent (2) of Chartered surveyors (SOC 2434).

Analysis of Salary Thresholds
50
Figure 4.1: Percentage of all occupations affected at the nth threshold under Tier 2: (General) (year ending March 2015)
1 20
8 2 32
54
87
55
13
92
28
14
51
07
32
02
61
16
35
11
42
40
36
01
85
14
73
22
11
31
32
01
6 43
02
74
35
02
76
12
93
51
54
16
10
12
03
17
21
01
92
40
11
24
26
22
08
21
86
49
9 9 47
84
16
81
66
39
02
53
35
15
53
50
27
81
29
92
22
96
14
92
63
14
22
77
47
01
22
92
55
10
81
93
4 14
41
57
04
42
55
92
28
13
43
71
30
47
63
40
35
82
41
62
02
34
61
29
44
96
16
84
13
45
87
29
97
60
30
11
08
49
6
0%
10%
20%
30%
40%
50%
60%
70%
80%
90%
100%
22
32
|2
44
9 |
24
51
|3
54
1 |
52
15
|2
23
1 |
22
29
|2
31
2 |
11
84
|5
43
4 |
24
42
|2
31
9 |
24
72
|2
45
2 |
24
32
|2
22
2 |
21
14
|2
22
1 |
34
12
|2
11
9 |
11
81
|2
42
6 |
24
31
|2
11
1 |
22
23
|2
31
5 |
31
13
|2
13
7 |
35
38
|2
21
3 |
21
12
|2
21
9 |
23
16
|5
23
5 |
23
14
|3
42
2 |
24
29
|2
21
7 |
21
39
|3
54
5 |
24
34
|3
41
4 |
21
42
|2
12
4 |
24
73
|2
12
6 |
23
18
|3
41
5 |
21
29
|5
24
9 |
11
61
|1
12
1 |
21
22
|2
21
4 |
24
33
|2
21
6 |
23
17
|1
13
5 |
21
27
|2
42
1 |
21
13
|2
46
1 |
24
71
|2
12
3 |
11
33
|2
13
6 |
24
36
|2
31
1 |
24
62
|2
15
0 |
34
16
|2
14
1 |
22
12
|2
46
3 |
21
35
|2
12
1 |
34
11
|3
21
8 |
24
25
|1
13
9 |
22
15
|3
53
5 |
11
22
|3
42
1 |
34
13
|2
42
4 |
24
23
|2
13
3 |
22
11
|2
41
9 |
24
13
|3
53
4 |
11
34
|1
13
2 |
21
34
|2
41
2 |
11
50
|3
53
2 |
11
36
|1
13
1 |
£25,000 £30,000 £40,000 Total
Source: Home Office Management Information, year ending March 2015

Chapter 4: Impact of increasing minimum salary threshold
51
Figure 4.2: Percentage of all occupations affected at the nth threshold under Tier 2: (Intra-company transfers) (short-term) (year ending March 2015)
1 1 1 10
4
35
1
8
20
37
13
75
46
18
8
53
58
14
0
56
2
22
5
78
22
10
1
63
77
26
8 38
9
45
16
7
31
6
60
14
14
15
31
1
12
99
14
6
6 21
8
44
11
8
23
9
16
8 8 8 58
39
56
3
63
11
58
47
21
3
17
17
10
3
57
8
24
1
12
2
0%
10%
20%
30%
40%
50%
60%
70%
80%
90%
100%
11
81
|
22
13
|
22
19
|
23
15
|
24
34
|
21
37
|
11
61
|
21
19
|
21
39
|
21
36
|
24
62
|
21
35
|
24
61
|
21
26
|
21
22
|
24
29
|
24
73
|
21
23
|
21
24
|
11
21
|
24
72
|
21
12
|
24
21
|
21
13
|
11
35
|
35
45
|
24
25
|
11
39
|
21
11
|
24
31
|
21
29
|
24
23
|
35
38
|
34
16
|
21
27
|
24
36
|
24
13
|
24
24
|
11
34
|
21
42
|
24
26
|
24
33
|
24
71
|
11
50
|
35
34
|
35
32
|
23
11
|
35
35
|
11
33
|
21
21
|
11
22
|
21
50
|
11
32
|
21
34
|
21
33
|
11
31
|
£25,000 £30,000 £40,000 Total
Source: Home Office Management Information, year ending March 2015

Analysis of Salary Thresholds
52
Increasing the thresholds to a level that better aligns with the salaries of highly specialised and/or highly skilled experts
4.40 A number of firms said that increasing thresholds would impact firms’ ability to recruit graduates into graduate programmes. Total said that they recruit expert workers straight from university and therefore offer only a graduate level salary.
4.41 Some partners across a number of sectors said that increases in thresholds would lead to artificially inflated salaries across the board for all other staff at that level. On the other hand, some partners said that increases in the minimum thresholds could lead to a migrant worker being paid more than UK colleagues with the same skill set in order to meet those thresholds, potentially risking pay discrimination claims. This is of particular concern for those firms that would likely be unable to absorb artificial inflation of wages across their staff due to cost pressures.
4.42 Overall, a number of firms said that increases in thresholds could lead to increases in the cost of their services, prevent expansion of business and thus possibly cause certain business areas to grow elsewhere in the world at the expense of the UK. NASSCOM said that a straw poll of their members suggested that each 10 percentile rise in salary thresholds would add 5 to 8 per cent to their overall costs.
4.43 For example, Tata Consultancy Services said that higher thresholds may result in their providing increasingly ‘off-the-shelf’ solutions, due to having less access to staff to provide on-site customisation. This would leave clients to tackle implementation on their own with potentially worse outcomes; leading to some focusing their growth elsewhere in the world at the expense of the UK economy.
4.44 PwC said that increasing salaries to a level significantly beyond the market rate for a particular role will mean that companies will be forced to relocate operations to other countries. This will directly impact resident workers who could lose their UK-based role and detrimentally impact UK-based supply chains.
4.45 The education sector said that increased thresholds would prevent universities from being able to recruit the best global talent and put at risk their ability to compete for non-UK based research income. The Russell Group recommended that, if a decision were made to recommend increasing the minimum salary thresholds, separate arrangements should be made for international students transferring from Tier 4. Otherwise this would have a negative impact on the UK’s competitiveness in international education.
4.46 The Scottish Government Minister for Europe and International Development also told us that increasing Tier 2 salary thresholds would make it increasingly difficult for skilled and talented international graduates to transition into skilled employment in the UK. The Scottish Government’s Post Study Work Working Group noted in their report that graduates, both UK and non-UK nationals, do not always move immediately into work that would meet the requirements of Tier 2 and instead, there may be a period of orientation in the workplace while the graduate develops and gains work

Chapter 4: Impact of increasing minimum salary threshold
53
experience. We heard similar evidence from a number of Scottish universities when we visited Scotland during the course of this review.
4.47 Some respondents (e.g. Kingsley Napley, Law Society of Scotland, Engineering the Future) said that some types of firm (e.g. start-ups, niche skills/roles in certain sectors) or some regions (e.g. Scotland) would be more detrimentally affected than others.
4.48 Penningtons Manches said that not all highly specialised/skilled roles are highly paid and therefore raising salary thresholds across the board, without taking into consideration the industry, the sector, where these jobs are located, and whether the firm is a start-up will have a highly detrimental impact on recruitment into these skilled roles. The Association of the British Pharmaceutical Industry, and some pharmaceutical companies, said that not all the employees that companies want to bring to the UK are of a senior level and hence are not earning higher salaries.
4.49 One partner said that intra-company transferees could be paid a salary higher than their usual earnings in their home country making it difficult to retain such staff once their visa ends. Infosys said that increasing Tier 2 (General) salary thresholds and those for the short-term intra-company transfer route would not have a significant impact as they already pay above the threshold. They were unable to model the impact on long-term intra-company transfers given the short timeframe and asked that decisions to significantly increase this threshold be delayed to allow companies time to assess the impact and adjust accordingly.
“The IoD considers the proposal to further increase the minimum salary thresholds for Tier 2 to be an unnecessary constraint on employing skilled workers from abroad.”
Institute of Directors response to MAC call for evidence
“LBG has significant concerns with a proposal that increases remuneration for non-EEA employees (potentially) and increases the cost to UK employers whilst also challenging the existing robust pay policy. With the proposal of a skills levy a live issue we consider a decision to increase salary levels at this stage to be premature.”
Lloyds Banking Group response to MAC call for evidence
4.50 Unison said that increases in the salary thresholds would be detrimental to sectors covered by national agreements. The TUC believes that raising the threshold for occupations not covered by national agreements would play an important role in preventing employers from using non-EU migrant workers to undercut skilled workers in the resident labour market, subject to protection for existing migrant workers when applying to extend their visas.
4.51 Partners from the health sector said that many relatively modestly remunerated roles such as nurses, midwives, paramedics, occupational

Analysis of Salary Thresholds
54
therapists, healthcare scientists and radiographers are both highly specialised and highly skilled. NHS Employers said that an increase in the minimum salary threshold or the appropriate salary to beyond the entry point of any pay scale would automatically remove the ability of employers in the NHS to recruit anyone without applying a salary above that of anyone recruited from the UK or EEA. This would affect the employment of all health and care workers who are appointed generally at the bottom of the appropriate pay scale regardless of their migration circumstances. The evidence from NHS Foundation Trusts said that raising thresholds would have a significant detrimental impact on care and treatment for patients. A number of Trusts cited the amount of non-EEA nurse recruitment they were having to undertake, along with increases in the use of agency staff, citing the shortfall in domestic training.
“Raising the general threshold would impact on Band 5 nurses from outside the EEA being able to support the UK nursing workforce which is already under significant pressure in terms of both numbers and skills-mix...Among the most significant impacts would be:
Exacerbating existing nursing shortages and unsafe staffing levels
Increasing the risk of poor patient care outcomes
Higher rates of burn-out and early retirement from the profession by existing nurses
Greater reliance on agency nursing staff
Greater pressure on particularly vulnerable sectors (such as care homes).”
Royal College of Nursing response to MAC call for evidence
4.52 In their response to our call for evidence, HCL Workforce Solutions highlighted the role recruitment of international staff can have in driving down costs for the healthcare system. They said that for every 1,000 nurses recruited overseas, £25 million can be saved on approved agency rates
4.53 Care England said that increasing the thresholds could make it impossible to recruit nurses unless these were identified as shortage occupations and would exacerbate an already precarious position making operation of nursing home care services uneconomic. Impacts on the resident labour market test route could endanger the safety of current provision leading to closure and loss of critical provision in some locations.
Impact of increasing the thresholds to a level that restricts the route to occupations skilled to NQF level 6 or higher, which, are experiencing skills shortages
4.54 The Northern Ireland Strategic Migration Partnership identified some roles which would not be able to be filled from migrant recruitment following an increase in salary thresholds to a level commensurate with NQF6 and PhD

Chapter 4: Impact of increasing minimum salary threshold
55
level scientific roles, namely Chemists and Analysts (SOC 2111), Application Developers (SOC 2136) and Bioinformaticians (SOC 2425).
4.55 The Royal Institute of British Architects said that architects were not likely to be included in a shortage occupation list and that it may therefore become impossible for international students to acquire the necessary practical experience to qualify, thus impacting on the international student market.
“The RIBA has grave ethical concerns about students of architecture paying significant sums of money to come to the UK to study, but being unable to qualify through lack of the professional practical experience that is an essential prerequisite for candidates seeking to undertake the RIBA Professional Practice Examination.”
Royal Institute of British Architects response to MAC call for evidence
4.56 PwC and Squire Patton Boggs said that roles where there are skills shortages do not equate to roles that are paid significantly above the market rate. Accordingly, artificially raising the minimum salary threshold beyond the market rate has the potential to significantly increase skills shortages in those areas.
4.57 Some partners from the education sector were concerned that restricting the Tier 2 route to shortage only would have extreme significance for higher education institutions. That is, it would severely hamper their ability to recruit sufficiently skilled and specialised staff to attract and deliver high value and high quality research projects, to undertake high quality teaching and to attract students and deliver knowledge exchange activities with industry and business.
4.58 Respondents from the arts sector (e.g. UK Screen and Society of London Theatres) said that while some roles in that sector were already on the shortage occupation list, a number of them were below NQF6 level and were not highly paid but played a vital role in the UK’s ability to attract and deliver high value inward investment productions.
4.59 Kingsley Napley wrote to us on behalf of clients employing Artists, Authors and Dancers, which all meet the NQF4 criteria. They suggested that consideration be given to creating a new route outside of Tier 2 for these occupations.
4.60 Other respondents such as Engineering the Future and TES Electronic Solutions suggested that in relation to the engineering sector niche technical areas and regional variations ought to be considered. Furthermore, TES proposed that a scarcity exemption could be introduced for those specific roles and skills that are in shortage as opposed to a blanket threshold. Employers in the energy sector said that UK firms could be left at a severe disadvantage and that the Government’s policy for industry growth would be drastically hampered. Horizon Nuclear Power suggested a joined-up approach among departments.
Analysis of Salary Thresholds
56
4.61 The Department of Health expressed concern about the intention to restrict the ability for employers to recruit from overseas to occupations for which shortages are more localised and employers have demonstrated that there is no suitably qualified resident worker available to fill the role. This would have a deleterious effect and lead to unwarranted competition between employers seeking to manage local shortages and increased agency and employment costs, potentially leading to a market effect that creates a national shortage. The Department of Health said that retaining access to overseas labour is essential where employers have exhausted all routes to recruit from the resident labour market, and have made efforts to up-skill their own workforce.
4.7 Conclusions
4.62 The original principles used to set the minimum threshold of £20,800 were relevant when the skill requirement was NQF3 and above (equivalent to an A-level). The current skill requirement is NQF6 and above (equivalent to a bachelor’s degree). If the same principles were applied to the current skill requirement, this would imply a substantial rise in the salary threshold in the range of £31,000 (the 30th percentile) to £39,000 (the median).
4.63 There is little doubt that an immediate introduction of a salary threshold at this level would be strongly opposed by many employers and would cause serious problems in particular sectors, including the education and health sectors. It is important to note that the earnings of new hires are typically lower than that for employees generally. However, it should be noted that the prioritisation system under the annual Tier 2 (General) limit means the salary requirement is presently within the £31,000 - £39,000 range already, for applications for restricted Certificates of Sponsorship.
4.64 Looking at the methodology for setting the £41,500 threshold for long-term intra-company transfers, this still seems appropriate and in line with the definition used within the GATS requirements. However, there may be a case for increasing the threshold if the objective is to reduce the number of migrants coming through Tier 2.
4.65 Evidence from our partners was mixed as to whether pay is a suitable proxy for highly specialised skills or skills shortages. Whilst some said it was a good reflection of skill, others stated that pay tends to reflect age and experience and not necessarily skill. A number of partners stated that pay increases over the past 5 years have been limited and therefore an increasing number of workers are not being paid at levels that reflect their skill level. Further analysis is required to consider the options for focusing the route on highly specialised experts and individuals filling skills shortages. This will include consideration of whether pay is the best reflection of skill and skill shortages, or if there are alternative criteria to consider.
4.66 Setting the salary threshold level to the 10th percentile for all occupations skilled to NQF6 would mean a minimum threshold of £23,000. To illustrate the impact this would have on successful Certificate of Sponsorship applications, the analysis shows that increasing the flat threshold to £25,000 would affect 7 per cent (5,691) of all Tier 2 applications, 20 per cent (4,528) of in-country applications for Tier 2 (General) and 7 per cent

Chapter 4: Impact of increasing minimum salary threshold
57
(1,150) of out-of-country applications. However, this threshold would have a negligible impact on both the short-term and long-term intra-company transfer routes.
4.67 Setting the salary threshold level at the median earnings for all occupations skilled to NQF6 and above would mean a minimum threshold of £39,000. As an illustration, a salary threshold of £40,000 would affect 44 per cent of applications across Tier 2 (35,181 applications). For Tier 2 (General) it would affect 65 per cent (14,545) of in-country applications and 48 per cent (7,737) of out-of-country applications. For the short-term intra-company transfer route it would affect 20 per cent (203) of in-country applications and 55 per cent (12,696) of out-of country applications, with no impact on the long-term intra-company transfer route.
4.68 There was significant concern amongst partners over the impact on business of an increase in salary thresholds. Responses included the potential increase in the cost of their services, the increased likelihood of businesses off-shoring their services and the impact on specific regions or types of firm (e.g. start-ups). Partners also raised concerns that there may be a disproportionate impact on sectors with nationally agreed pay scales, particularly in the public sector, where all employees, regardless of nationality, are paid the same.
4.69 By their very nature, new entrants would be most impacted by any increase in the minimum salary thresholds. A number of partners raised concerns about the impact on graduate schemes and international students if there was an increase in the minimum threshold. An increase in the threshold to £25,000 would affect 28 per cent (1,290) of all applications (both in-country and out-of-country) for new entrants through Tier 2 (General) whilst an increase in the threshold to £40,000 would affect 77 per cent (3,590) of new entrants through Tier 2 (General) and 57 per cent (1,950) of new entrants through the short-term intra-company transfer route.
4.70 Chapter 5 will consider the impact on migrant numbers of increasing the occupation-specific thresholds.


59
Chapter 5 Occupation-specific thresholds
5.1 Introduction
5.1 In this chapter we consider the questions the Government asked us in relation to the occupation-specific thresholds. We were asked to consider the impact of:
“Increasing the Tier 2 minimum salaries per occupation for experienced workers from the 25th percentile to the 50th or 75th percentiles, or other appropriate measure;
Increasing the Tier 2 minimum salaries per occupation for new entrant workers from the 10th percentile to the 25th or 50th percentiles, or other appropriate measure.”
5.2 This chapter sets out the impact on applications under Tier 2 of an increase in the occupation-specific thresholds, including looking at the main occupations affected.
5.2 Impact of a change in the occupation-specific thresholds for all occupations and individuals
5.3 As well as, or instead of, revising the overall minimum thresholds for Tier 2, the occupation-specific thresholds for each occupation can be revised too. Raising the occupation-specific thresholds is a more targeted approach than raising the overall minimum thresholds as it takes into account the different distributions of pay within each occupation, and thus provides an occupation specific threshold around which employers can recruit.
5.4 The Annual Survey for Hours and Earnings (ASHE) is used to determine the salary distribution for full-time UK employees whose pay was not affected by absence.
5.5 Once again, we used simulations to illustrate the potential impacts that may occur as a result of changes in the occupation-specific thresholds. For example, the salary at the 10th percentile for each occupation in ASHE can be used to assess the impact on migrants coming through Tier 2. Current salaries of Tier 2 migrants are taken from the Certificates of
Chapter 5 Occupation specific thresholds

Analysis of Salary Thresholds
60
Sponsorship (CoS) data described in Chapter 4. As set out in Box 4.1 in Chapter 4, the simulations assume that the migrant sponsor does not increase their salary offer to meet the new threshold. The data include both in-country and out-of-country applications.
5.6 It should be noted that this analysis attempts to use the latest available data in order to make the analysis as representative as possible. The most recent ASHE data is from 2014, which has been used where possible. However, the CoS data is representative of the 2014 Codes of Practice which in turn relates to ASHE data from 2013. Thus, there may be some inconsistency between the data sources, which may affect the analysis. For example, there is the potential for some individuals to have salaries that fall below the 25th percentile by 2014 standards yet their salaries were sufficiently high to pass the threshold at the time of application. This means that the analysis may overstate the impact of raising thresholds on CoS applications.
5.7 It is important to note that under the current Codes of Practice there are a number of occupations, particularly in the health and education sector, that are not currently based on percentile thresholds from ASHE. For example, the salary threshold for Nurses is based on nationally agreed pay bands within the NHS Agenda for Change.
5.8 In addition, the management information (MI) available does not distinguish between new entrants and experienced workers. There are lower pay thresholds for new entrant employees which are set at the 10th percentile of the pay distribution for full-time employees in that occupation.
5.9 To consider the impact of an increase in the occupation-specific thresholds, a number of iterations of the analysis have been carried out. First, the analysis was carried out looking at the impact of an increase in the occupation-specific thresholds across all occupations. Second, the analysis was carried out excluding those occupations that are currently based on nationally agreed pay bands. Finally, the analysis was carried out using age as a proxy for new entrants in order to consider the impact on new entrants and experienced workers.
5.10 Table 5.1 considers the impact of an increase in the occupation-specific thresholds on all Certificates of Sponsorship, regardless of occupation or age.
5.11 For the year ending March 2015, the MI indicates that 47 per cent of existing CoS applications fall below the median UK salary for each occupation. Implementing a threshold based on the 30th percentile for each occupation would affect 31 per cent (24,580) of CoS applications. That is, 32 per cent (997), 42 per cent (14,699) and 36 per cent (8,782) would be affected through the SOL, RLMT and short-term intra-company transfer routes respectively. There is likely to be only a minor impact on the long-term intra-company transfer route (102 applications).
5.12 The introduction of a threshold based on the median salary for each occupation would affect over 50 per cent of applications within the shortage occupation route, RLMT and short-term intra-company transfer routes, whilst having a minimal effect on the long-term intra-company

Chapter 5: Occupation specific thresholds
61
route. Notably, setting the threshold as high as the 75th percentile would, under current volumes, only restrict 38 per cent (6,503) of applicants under the long-term intra-company transfer route.
Table 5.1: Impact on CoS of a change in the occupation-specific salary threshold for each occupation (year ending March 2015)
Percentile 20th
25th
30th
40th
Median 60th
70th
75th
Total
Shortage Occupation List
Total count 537 834 997 1,340 1,692 1,996 2,192 2,272 3,123
In-Country 315 458 537 728 934 1,101 1,205 1,244 1,736
Out-of-country 222 376 460 612 758 895 987 1,028 1,387
Total % 17% 27% 32% 43% 54% 64% 70% 73% 100%
Resident Labour Market Test
Total count 8,971 12,088 14,699 18,76
7 21,741 24,146 26,403 27,189 35,277
In-Country 6,999 8,748 10,153 12,60
2 14,259 15,584 16,740 17,140 20,593
Out-of-country 1,972 3,340 4,546 6,165 7,482 8,562 9,663 10,049 14,684
Total % 25% 34% 42% 53% 62% 68% 75% 77% 100%
Short term Intra-company transfer route
Total count 1,159 6,312 8,782 11,707 13,023 14,039 15,271 16,143 24,257
In-Country 25 62 106 165 207 265 323 353 1,010
Out-of-country 1,134 6,250 8,676 11,542 12,816 13,774 14,948 15,790 23,247
Total % 5% 26% 36% 48% 54% 58% 63% 67% 100%
Long term Intra-company transfer route
Total count 15 54 102 399 1,093 3,211 5,575 6,503 17,010
In-Country 9 25 42 139 324 921 1,747 2,104 5,860
Out-of-country 6 29 60 260 769 2,290 3,828 4,399 11,150
Total % 0% 0% 1% 2% 6% 19% 33% 38% 100%
Grand total 10,682 19,288 24,580 32,213 37,549 43,392 49,441 52,107 79,667
In-Country 7,348 9,293 10,838 13,634 15,724 17,871 20,015 20,841 29,199
Out-of-country 3,334 9,995 13,742 18,579 21,825 25,521 29,426 31,266 50,468
Total % 13% 24% 31% 40% 47% 54% 62% 65% 100%
Notes: Using ASHE 2014 data for all occupations including healthcare, teachers and IT professionals. Not all SOC codes have a corresponding value for each percentile under ASHE. As such, all of these values may be under-counted. SOC 2150 has no values in ASHE at 4 or 3 digit SOC2014 level for all percentiles except the 40th and the median. As such all other values may be undercounted, they represent 108 of the total COS for RLMT, 17 for STICT and 66 for LTICT Source: Home Office Management Information, year ending March 2015
5.3 Impact of a change in the occupation-specific thresholds excluding those occupations not currently based on percentile thresholds.
5.13 Table 5.2 narrows down this analysis to exclude the effect of the health and education sector occupations that are based on national pay scales

Analysis of Salary Thresholds
62
instead of percentiles. This provides an interpretation of how various percentiles would restrict CoS given the current Codes of Practice. The removal of these occupations has lowered the overall effect across each of the percentiles. A salary threshold at the 30th percentile would affect 28 per cent (19,664) of all applications. At the median, 43 per cent (30,257) would be affected.
Table 5.2 Impact on CoS of a change in the occupation-specific salary threshold for each occupation excluding NHS and teachers (year ending March 2015)
Percentile 20th
25th
30th 40th
Median 60th
70th
75th
Total
Shortage Occupation List
Total count 283 469 559 700 874 1,007 1,131 1,185 1,956
In-Country 201 299 347 431 530 610 674 698 1,144
Out-of-country 82 170 212 269 344 397 457 487 812
Total % 14% 24% 29% 36% 45% 51% 58% 61% 100%
Resident Labour Market Test
Total count 5,849 8,341 10,223 13,061 15,282 17,132 19,062 19,731 27,337
In-Country 4,979 6,368 7,458 9,143 10,350 11,296 12,261 12,587 15,787
Out-of-country 870 1,973 2,765 3,918 4,932 5,836 6,801 7,144 11,550
Total % 21% 31% 37% 48% 56% 63% 70% 72% 100%
Short term Intra-company transfer route
Total count 1,159 6,310 8,780 11,694 13,009 14,024 15,256 16,128 24,226
In-Country 25 62 106 165 207 265 323 353 1,010
Out-of-country 1,134 6,248 8,674 11,529 12,802 13,759 14,933 15,775 23,216
Total % 5% 26% 36% 48% 54% 58% 63% 67% 100%
Long term Intra-company transfer route
Total count 15 54 102 399 1,092 3,210 5,574 6,502 16,999
In-Country 9 25 42 139 324 921 1,747 2,104 5,860
Out-of-country 6 29 60 260 768 2,289 3,827 4,398 11,139
Total % 0% 0% 1% 2% 6% 19% 33% 38% 100%
Grand total 7,306 15,174 19,664 25,854 30,257 35,373 41,023 43,546 70,518
In-Country 5,214 6,754 7,953 9,878 11,411 13,092 15,005 15,742 23,801
Out-of-country 2,092 8,420 11,711 15,976 18,846 22,281 26,018 27,804 46,717
Total % 10% 22% 28% 37% 43% 50% 58% 62% 100%
Notes: Using ASHE 2014 data for all occupations including healthcare, teachers and IT professionals. Not all SOC codes have a corresponding value for each percentile under ASHE. As such, all of these values may be under-counted. SOC 2150 has no values in ASHE at 4 or 3 digit SOC2014 level for all percentiles except the 40th and the median. As such all other values may be undercounted, they represent 108 of the total COS for RLMT, 17 for STICT and 66 for LTICT. Source: Home Office Management Information, year ending March 2015
5.4 Impact of a change in the occupation-specific thresholds for all occupations, splitting new entrants and experienced workers.
5.14 Age can be used as a proxy in order to consider the impact of an increase in the occupation-specific thresholds for new entrants and experienced workers separately. The MI has been split by individuals aged 26 or above

Chapter 5: Occupation specific thresholds
63
(experienced workers) and those aged below 26 (new entrants). However, it is important to note that age is not the only criterion used to judge eligibility for a new entrant and therefore some new entrants will be inaccurately included in the experienced workers thresholds.
Table 5.3: Impact on CoS of a change in the occupation-specific salary threshold for each occupation (excluding NHS and teachers) and restricted to those 26 years of age and over (year ending March 2015) Percentile 30
th 40
th Median 60
th 70
th 75
th Total
Shortage Occupation List
Total count 434 558 710 833 950 1003 1,742
In-Country 262 334 424 501 562 586 1,010
Out-of-country 172 224 286 332 388 417 732
Total % 25% 32% 41% 48% 55% 58% 100%
Resident Labour Market Test
Total count 8,045 10,594 12,549 14,127 15,727 16,338 23,562
In-Country 5,844 7,336 8,429 9,261 10,078 10,380 13,425
Out-of-country 2,201 3,258 4,120 4,866 5,649 5,958 10,137
Total % 34% 45% 53% 60% 67% 69% 100%
Short term Intra-company transfer route
Total count 7,123 9,844 11,049 11,930 12,981 13,710 20,805
In-Country 83 137 177 231 283 309 905
Out-of-country 7,040 9,707 10,872 11,699 12,698 13,401 19,900
Total % 34% 47% 53% 57% 62% 66% 100%
Long term Intra-company transfer route
Total count 99 388 1,078 3,123 5,419 6,310 16,598
In-Country 42 138 323 918 1,744 2,096 5,843
Out-of-country 57 250 755 2,205 3,675 4,214 10,755
Total % 1% 2% 6% 19% 33% 38% 100%
Grand total 15,701 21,384 25,386 30,013 35,077 37,361 62,707
In-Country 6,231 7,945 9,353 10,911 12,667 13,371 21,183
Out-of-country 9,470 13,439 16,033 19,102 22,410 23,990 41,524
Total % 25% 34% 40% 48% 56% 60% 100%
Notes: Not all SOC codes have a corresponding value for each percentile under ASHE. SOC 2150 has no values in ASHE at 4 or 3 digit SOC2014 level for all percentiles except the 40th and the median. As such all other values may be undercounted, they represent 108 of the total COS for RLMT, 17 for short-term intra-company transfers and 66 for long-term intra-company transfers Source: Home Office Management Information, year ending March 2015.
5.15 Table 5.3 outlines the effect on experienced workers outside of the education and health sectors. As would be expected, by removing new entrants who would be assumed to be paid a lower wage, fewer applicants are affected at the lower percentiles. However, 25 per cent (15,701) of applicants are still affected at the 30th percentile, compared with 28 per cent (19,664) when the entire age range is used.

Analysis of Salary Thresholds
64
Table 5.4 Impact on CoS of a change in the occupation-specific salary threshold for each occupation excluding NHS and teachers and restricted to those under 26 years of age (year ending March 2015) Percentile 20
th 25
th 30
th 40
th Median 60th Total
Shortage Occupation List
Total count 92 120 125 142 164 174 214
In-Country 68 83 85 97 106 109 134
Out-of-country 24 37 40 45 58 65 80
Total % 43% 56% 58% 66% 77% 81% 100%
Resident Labour Market Test
Total count 1,581 1,905 2,178 2,467 2,733 3,005 3,775
In-Country 1,261 1,445 1,614 1,807 1,921 2,035 2,362
Out-of-country 320 460 564 660 812 970 1,413
Total % 42% 50% 58% 65% 72% 80% 100%
Short term Intra-company transfer route
Total count 641 1,498 1,657 1,850 1,960 2,094 3,421
In-Country 9 17 23 28 30 34 105
Out-of-country 632 1,481 1,634 1,822 1,930 2,060 3,316
Total % 19% 44% 48% 54% 57% 61% 100%
Long term Intra-company transfer route
Total count 1 1 3 11 14 87 401
In-Country 0 0 0 1 1 3 17
Out-of-country 1 1 3 10 13 84 384
Total % 0% 0% 1% 3% 3% 22% 100%
Grand total 2,315 3,524 3,963 4,470 4,871 5,360 7,811
In-Country 1,338 1,545 1,722 1,933 2,058 2,181 2,618
Out-of-country 977 1,979 2,241 2,537 2,813 3,179 5,193
Total % 30% 45% 51% 57% 62% 69% 100%
Notes: Not all SOC codes have a corresponding value for each percentile under ASHE. SOC 2150 has no values in ASHE at 4 or 3 digit SOC2014 level for all percentiles except the 40th and the median. As such all other values may be undercounted, they represent 108 of the total COS for RLMT, 17 for short-term intra-company transfers and 66 for long-term intra-company transfers. Source: Home Office Management Information, year ending March 2015.
5.16 Table 5.4 considers just new entrants by restricting the sample to those aged under 26. The analysis shows that at the 25th percentile, 45 per cent (3,524) of new entrant Tier 2 applications would be affected. For Tier 2 (General), 61 per cent (1,528) of in-country applications would be affected and 33 per cent (497) of out-of-country applications would be affected. For the short-term intra-company transfer route, this would affect 16 per cent (17) of in-country applications and 45 per cent (1,481) of out-of-country applications. There would be negligible impact on the long-term intra-company transfer route. A salary threshold at the 50th percentile would affect 62 per cent (4,871) of new entrant applications, including 58 per cent (870) of out-of-country applications for Tier 2 (General).

Chapter 5: Occupation specific thresholds
65
5.5 Occupations affected by an increase in the occupation-specific thresholds
5.17 Table 5.5 considers the top five occupations that would potentially be affected for each route, in terms of total number of CoS, at the 30th, median and 75th percentiles. All ages are considered for each occupation.
Table 5.5: Top 5 Occupations affected by an nth occupation-specific threshold, both in country and out-of-country, for each occupation split by route (year ending March 2015)
Shortage Occupation List route
SOC code Occupation title
Salary at n
th
percentile (£) No.
Affected In
Country Out-of-
country % Total
30th Percentile
2211* Medical practitioners 50,204 230 110 120 36%
2126 Design and development engineers 33,092 135 77 58 42%
2314* Secondary education teaching professionals
31,287 111 32 79 56%
2136 Programmers and software development professionals
33,258 80 57 23 51%
2123 Electrical engineers 37,434 55 33 22 40%
Total restricted: 997 537 460 32%
Median
2211* Medical practitioners 71,141 481 255 226 76%
2126 Design and development engineers 38,549 204 118 86 63%
2314* Secondary education teaching professionals
36,987 163 57 106 82%
2136 Programmers and software development professionals
40,007 115 73 42 74%
2123 Electrical engineers 43,711 92 56 36 66%
Total restricted: 1,692 934 758 54%
75th Percentile
2211* Medical practitioners 105,192 624 341 283 98%
2126 Design and development engineers 48,760 285 161 124 88%
2314* Secondary education teaching professionals
42,833 180 66 114 90%
2217* Medical radiographers 41,530 134 52 82 84%
2136 Programmers and software development professionals
49,302 131 82 49 84%
Total restricted: 2,272 1,244 1,028 73%

Analysis of Salary Thresholds
66
Table 5.5: Top 5 Occupations affected by an nth occupation-specific threshold, both in country and out-of-country, for each occupation split by route (year ending March 2015)
Resident Labour Market Test route
SOC code Occupation title
Salary at nth percentile (£)
No. affected
In Country
Out-of-country
% Total
30th Percentile
3545 Sales accounts and business development managers
34,534 1,694 1,448 246 71%
2231* Nurses 27,624 1,673 786 887 67%
2119 Natural and social science professionals n.e.c.
30,808 1,464 910 554 41%
2211* Medical practitioners 50,204 1,342 929 413 48%
2136 Programmers and software development professionals
33,258 929 565 364 35%
Total restricted: 14,699 10,153 4,546 42%
Median
2119 Natural and social science professionals n.e.c.
35,860 2,800 1,752 1,048 79%
2211* Medical practitioners 71,141 2,384 1,629 755 84%
2231* Nurses 31,641 2,131 969 1,162 85%
3545 Sales accounts and business development managers
42,595 1,891 1,547 344 79%
2136 Programmers and software development professionals
40,007 1,544 881 663 59%
Total restricted: 21,741 14,259 7,482 62%
75th Percentile
2119 Natural and social science professionals n.e.c.
44,108 3,312 2,087 1,225 93%
2211* Medical practitioners 105,192 2,776 1,883 893 98%
2231* Nurses 36,907 2,409 1,151 1,258 96%
3545 Sales accounts and business development managers
57,887 2,084 1,628 456 87%
2136 Programmers and software development professionals
49,302 1,895 1,075 820 72%
Total restricted: 27,189 17,140 10,049 77%

Chapter 5: Occupation specific thresholds
67
Table 5.5: Top 5 Occupations affected by an nth occupation-specific threshold, both in country and out-of-country, for each occupation split by route (year ending March 2015)
Short term Intra-company Transfer route
SOC code
Occupation title Salary at nth percentile
(£)
No. affected
In Country
Out-of-country
% Total
30th Percentile
2136 Programmers and software development professionals
33,258 3,768 46 3,722 50%
2135 IT business analysts, architects and systems designers
34,884 2,376 15 2,361 44%
2139 Information technology and telecommunications professionals
31,540 1,772 15 1,757 48%
2126 Design and development engineers 33,092 188 1 187 33%
2423 Management consultants and business analysts
32,176 132 1 131 10%
Total restricted: 8,782 106 8,676 36%
Median
2136 Programmers and software development professionals
40,007 5,169 73 5,095 68%
2135 IT business analysts, architects and systems designers
41,983 3,438 36 3,402 64%
2139 Information technology and telecommunications professionals
39,759 2,534 39 2,495 68%
2137 Web design and development professionals
29,171 263 1 262 75%
2423 Management consultants and business analysts
40,691 254 6 248 20%
Total restricted: 13,023 207 12,816 54%
75th Percentile
2136 Programmers and software development professionals
49,302 5,594 86 5,508 74%
2135 IT business analysts, architects and systems designers
55,115 4,237 71 4,166 79%
2139 Information technology and telecommunications professionals
52,609 3,074 66 3,008 83%
2423 Management consultants and business analysts
54,120 480 16 464 37%
2126 Design and development engineers 48,760 329 3 326 59%
Total restricted: 16,143 353 15,790 67%

Analysis of Salary Thresholds
68
Table 5.5: Top 5 Occupations affected by an nth occupation-specific threshold, both in country and out-of-country, for each occupation split by route (year ending March 2015)
Long term Intra-company Transfer route
SOC code
Occupation title Salary at nth percentile (£)
No. affected
In Country
Out-of-country
% Total
30th Percentile
1132 Marketing and sales directors 52,536 64 34 30 8%
1115 Chief executives and senior officials 56,553 15 3 12 3%
3532 Brokers 46,002 11 3 8 7%
1131 Financial managers and directors 44,293 6 0 6 1%
1136* Information technology and telecommunications directors
50,323 4 2 2 3%
Total restricted: 102 42 60 1%
Median
2134* IT project and programme managers
46,997 428 120 308 25%
1132 Marketing and sales directors 70,742 177 88 89 22%
2133* IT specialist managers 44,906 145 33 112 19%
2135 IT business analysts, architects and systems designers
41,983 103 31 72 4%
1131 Financial managers and directors 61,108 56 18 38 10%
Total restricted: 1,093 324 769 6%
75th Percentile
2135 IT business analysts, architects and systems designers
55,115 1,734 602 1,132 60%
2134* IT project and programme managers
57,532 1,065 376 689 61%
2136 Programmers and software development professionals
49,302 706 264 442 44%
2139 Information technology and telecommunications professionals
52,609 560 171 389 57%
1132 Marketing and sales directors 98,530 332 156 176 42%
Total restricted: 6,503 2,104 4,399 38%
Notes: Salary at the nth percentile uses full-time ASHE 2014 data for the UK for all SOC codes. * No. affected for SOC 2231 (Nurses) and 2211 (Medical Practitioners) uses ASHE 2014 data despite using the Agenda for Change pay scale in the codes of practice. No. affected for SOC 2133 (IT specialist managers), 2134 (IT project and programme managers) and SOC 1136 (Information technology and telecommunications directors)use ASHE 2014 data despite using the Income Data Services pay in the codes of practice. No. affected for SOC 2314 (Secondary education teaching professionals) uses ASHE 2014 data despite using the National Teaching payscales in the codes of practice. Source: Home Office Management Information, year ending March 2015
5.18 The table shows that at all three percentiles (30th, median and 75th), Medical practitioners (SOC 2211) and Design and development engineers (SOC 2126) would be most significantly affected within the shortage occupation list. For example, a median threshold would affect 481 (76 per cent) applications for Medical Practitioners and 204 (63 per cent) applications for Design and development engineers.
5.19 Through the RLMT route, Natural and social science professionals would be most affected at the median with 2,800 applications (79 per cent) within the occupation being affected. Medical Practitioners and Nurses (SOC 2231) would also be significantly affected, with over 80 per cent of
Chapter 5: Occupation specific thresholds
69
applications within each occupation being hit by a median salary threshold.
5.20 For the short-term intra-company transfer route, the biggest impact would be within the IT sector. For example, at a median threshold, 5,169 applications (68 per cent) of applications for Programmers and software development professionals (SOC 2136) would be affected. Similarly, under the long-term intra-company transfer route, IT project and programme managers (SOC 2134) would be the most affected by a median threshold, with 428 applications (25 per cent) affected.
5.21 Figure 5.1 focuses on the percentage of each occupation affected at the 30th, median and 75th percentile under Tier 2 (General). This highlights which occupations would be most affected as a proportion of total applications for that occupation at each of these thresholds. This analysis was replicated for both short-term and long-term intra-company transfers in Figures 5.2 and 5.3. The numbers above each bar represent total CoS granted for that occupation. It is important to note that when considering the percentage affected, some of the occupations most affected (i.e. close to 100 per cent), had very few CoS used within that occupation. For example, SOC code 2232, Midwives, shows 100 percent affected at the 30th percentile, but had only 1 CoS in the year ending March 2015.
5.22 Figure 5.1 shows that for Tier 2 (General) a median salary threshold would affect 100 percent (1) of Midwives (SOC 2232), 100 percent (20) of Welfare professionals (SOC 2449), 97 percent (73) of Therapy professionals (SOC 2229), 95 percent (37) of Social services managers and directors (SOC1184) and 94 percent (80) of Health services and public health managers and directors (SOC 1181).
5.23 For short-term intra-company transfers, Figure 5.2 shows that a median salary threshold would affect 100 percent (1) of Health services and public health managers and directors (SOC1181), 100 percent (1) of Pharmacists (SOC 2213), 100 percent (1) of Health professionals n.e.c (SOC 2219), 100 percent (10) of Primary and nursery education teaching professionals (SOC 2315) and 100 percent (1) of Chartered surveyors (SOC2434).
5.24 For long-term intra-company transfers, Figure 5.3 shows that a median salary threshold would affect 100 percent (1) of Health services and public health managers and directors (SOC 1181), 100 percent (3) of Aircraft pilots and flight engineers (SOC3512), 25 percent (1) of Higher education teaching professionals (SOC 2311), 25 percent (433) of IT project and programme managers (SOC 2134) and 22 percent (176) of Marketing and sales directors (SOC 1132).

Analysis of Salary Thresholds
70
Figure 5.1: Percentage of all occupations affected at the nth percentile under Tier 2: General (year ending March 2015) 2
53
75
11 1
12
08 4 2 3
34
61
35
03
97
58
52
54
83
22
51
36
01
32
01
01
91
13
14
24
02
63
27
63
52
08
33
64
92
40
12
03
12
29
27
41
47
26
21
81
72
41
61
26 12
99
14
52
01
10
74
30
39
01
57
04
78
9 13
41
29
35
01
42
16
66
31
49
27
74
70
55
13
41
47
22
26
21
34
22
78
10
12
55
20
29 41
68
96
58
73
58
22
82
41
61
93
44
22
99
13
04
74
55
29
41
68
44
06
09
49
64
96
63
10
82
05
67
0%
10%
20%
30%
40%
50%
60%
70%
80%
90%
100%
22
14
|2
21
5 |
22
16
|2
23
2 |
24
32
|2
44
9 |
24
51
|2
46
3 |
35
41
|5
21
5 |
22
11
|2
21
3 |
11
84
|2
22
9 |
11
81
|2
23
1 |
24
31
|2
31
2 |
21
19
|2
47
2 |
21
39
|2
11
1 |
22
21
|3
41
2 |
21
23
|2
11
2 |
23
16
|2
12
4 |
24
33
|2
12
6 |
35
45
|2
42
9 |
23
11
|3
53
8 |
24
26
|2
45
2 |
24
73
|2
21
7 |
23
14
|2
43
4 |
31
13
|2
42
1 |
24
42
|2
31
5 |
23
19
|2
13
7 |
21
22
|2
13
5 |
21
29
|2
31
8 |
11
39
|2
21
9 |
11
35
|1
13
3 |
11
21
|2
22
2 |
24
71
|2
13
6 |
24
36
|2
31
7 |
11
34
|2
21
2 |
24
12
|2
11
3 |
21
42
|2
22
3 |
34
14
|2
12
7 |
34
22
|2
46
2 |
21
33
|3
41
5 |
52
49
|1
16
1 |
24
61
|1
13
2 |
24
24
|2
42
5 |
24
23
|3
41
6 |
21
21
|2
13
4 |
35
35
|1
12
2 |
21
41
|3
41
1 |
24
19
|3
53
4 |
34
13
|1
15
0 |
32
18
|2
41
3 |
11
31
|3
42
1 |
11
36
|1
12
3 |
11
15
|
30th Percentile Median 75th Percentile Total
Notes: Excludes SOC codes 2114, 2150, 3532 and 5235 as ASHE data was not available at all percentiles. Source: Home Office Management Information, year ending March 2015
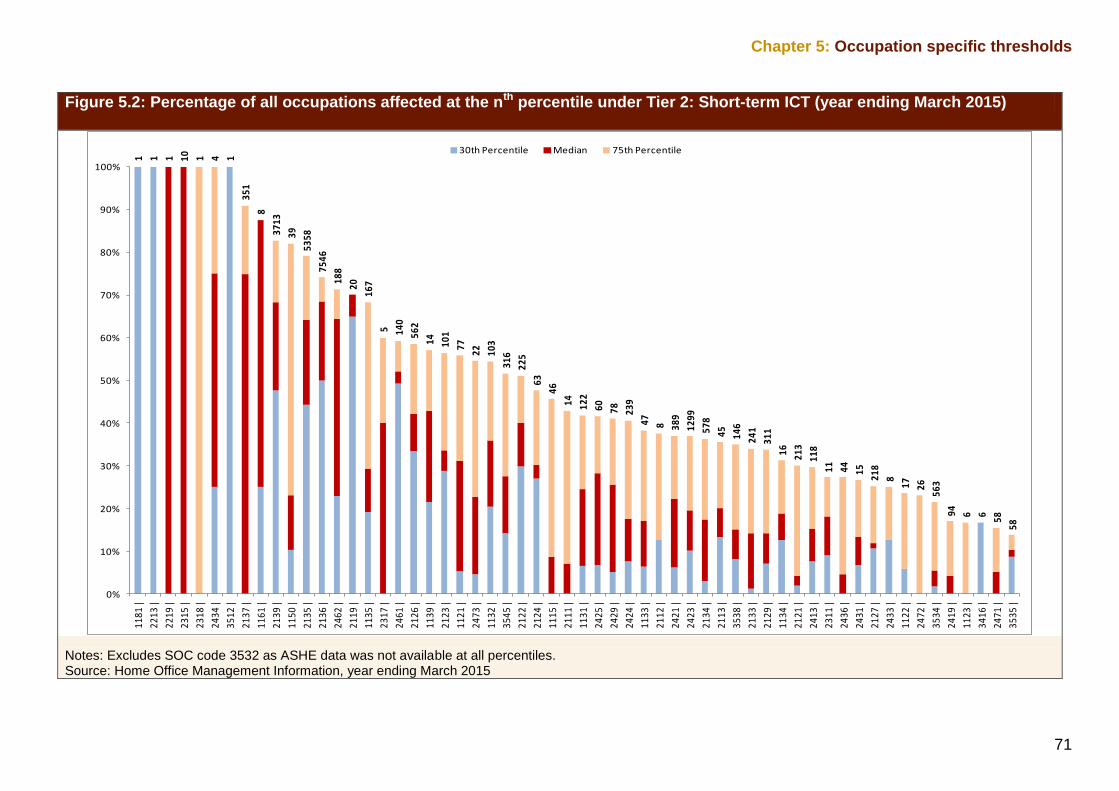
Chapter 5: Occupation specific thresholds
71
Figure 5.2: Percentage of all occupations affected at the nth percentile under Tier 2: Short-term ICT (year ending March 2015)
1 1 1 10 1 4 1
351
8
3713
39
5358
7546
188
20
167
5 140
562
14 101
77
22 103
316
225
63
46
14 122
60 78 239
47 8 389
1299
578
45 146
241
311
16 213
118
11 44 15
218
8
17 26
563
94 6 6 58
58
0%
10%
20%
30%
40%
50%
60%
70%
80%
90%
100%
1181
|
2213
|
2219
|
2315
|
2318
|
2434
|
3512
|
2137
|
1161
|
2139
|
1150
|
2135
|
2136
|
2462
|
2119
|
1135
|
2317
|
2461
|
2126
|
1139
|
2123
|
1121
|
2473
|
1132
|
3545
|
2122
|
2124
|
1115
|
2111
|
1131
|
2425
|
2429
|
2424
|
1133
|
2112
|
2421
|
2423
|
2134
|
2113
|
3538
|
2133
|
2129
|
1134
|
2121
|
2413
|
2311
|
2436
|
2431
|
2127
|
2433
|
1122
|
2472
|
3534
|
2419
|
1123
|
3416
|
2471
|
3535
|
30th Percentile Median 75th Percentile Series4
Notes: Excludes SOC code 3532 as ASHE data was not available at all percentiles. Source: Home Office Management Information, year ending March 2015

Analysis of Salary Thresholds
72
Figure 5.3: Percentage of all occupations affected at the nth percentile under Tier 2: Long-term ICT (year ending March 2015)
1 1 31
73
32
88
69
81
76
05
71
59
07
99
35
35
07
33
28
42
54
21
01
76
00
14
04 2
49
34
35
21
00
41
15
41
32
10
91
40
49
25
95
14
21
61
24
20
54
42
11
21
39
21
67
14
78
36
01
58
42
48
67
83
0%
10%
20%
30%
40%
50%
60%
70%
80%
90%
100%
11
81
|2
21
6 |
35
12
|2
13
4 |
21
35
|2
13
9 |
21
33
|1
13
4 |
21
36
|1
13
2 |
11
50
|2
42
1 |
21
12
|2
47
3 |
35
45
|1
13
1 |
24
23
|1
11
5 |
11
39
|2
31
1 |
11
35
|2
42
4 |
21
23
|3
53
5 |
24
29
|2
12
6 |
11
33
|2
41
9 |
11
36
|2
42
5 |
21
24
|3
53
8 |
24
31
|1
12
1 |
24
62
|2
11
9 |
35
34
|3
41
6 |
21
22
|2
12
9 |
35
32
|2
12
1 |
11
23
|2
41
3 |
21
27
|2
43
6 |
11
22
|2
47
1 |
21
13
|
30th Percentile Median 75th Percentile Series4
Source: Home Office Management Information, year ending March 2015

Chapter 5: Occupation specific thresholds
73
5.6 Impact of a change in the occupation-specific thresholds on those occupations not currently based on percentile thresholds
5.25 As discussed above, not all occupations currently use occupation-specific thresholds under the current codes of practice. Whilst a number of these were individual thresholds that have simply been uplifted since the evidence was provided to the MAC in 2011, occupations in the health, education and IT sectors utilise entirely separate pay scales.
5.26 All occupations in the health sector have thresholds based on the NHS Agenda for Change which sets out pay bands corresponding to “the knowledge, responsibility, skills and effort needed for the job” (NHS Employers 2014). Currently, with some exceptions, the threshold is based at Band 5 and above.
5.27 Table 5.9 aggregates all occupations with thresholds currently based on the NHS Agenda for Change, including both nurses and medical practitioners. Similar to the previous analysis, each band indicates the number of CoS that would be affected by raising the salary threshold to that level. A one band threshold increase, from Band 5+ to Band 6+ would affect 3 per cent (28) of applicants under the SOL route and 29 per cent (1,784) of applicants under RLMT.
Table 5.9: Impact on CoS of a change in the 2014 NHS Agenda for Change pay scales for all relevant occupations (year ending March 2015) SOL RLMT ICT Short Term ICT Long Term
Restricted to: Base Salary
No. Affected
% No. Affected
% No. Affected
% No. Affected
%
Band 3+ 16,271 0 0% 0 0% 0 0% 0 0%
Band 4+ 18,838 0 0% 0 0% 0 0% 0 0%
Band 5+ 21,478 3 0% 308 5% 0 0% 0 0%
Band 6+ 25,783 28 3% 1,784 29% 0 0% 0 0%
Band 7+ 30,764 124 15% 3,036 49% 1 11% 0 0%
Band 8 Range A+
39,239 284 34% 3,941 64% 2 22% 0 0%
Band 8 Range B+
45,707 384 45% 4,422 71% 2 22% 1 20%
Band 8 Range C+
54,998 479 57% 4,948 80% 2 22% 1 20%
Band 8 Range D+
65,922 645 76% 5,601 91% 2 22% 3 60%
Band 9+ 77,850 738 87% 5,891 95% 2 22% 4 80%
Total 845 100% 6,185 100% 9 100% 5 100%
Notes: This analysis covers all occupations currently utilising the NHS Agenda for Change pay scales. This includes the following SOC Codes: 2211; 2212; 2213; 2214; 2215; 2217; 2218; 2219; 2221; 2222; 2223; 2229; 2231; 2232. Source: Home Office Management Information, year ending March 2015

Analysis of Salary Thresholds
74
5.28 Tables 5.10 and 5.11 disaggregate this overall effect to show the disproportionate effect such a change in thresholds would have on Nurses (SOC 2231). The same shift in thresholds from Band 5+ to Band 6+ would affect 57 per cent (1,442) of all nurses. In turn, such a shift would affect less than 1 per cent (19) of Medical practitioners (SOC 2211).
5.29 Increasing the threshold further to Band 8+ would affect 98 per cent (2,496) of applications for Nurses. The same threshold would in turn affect 18 per cent (117) of Medical practitioners under SOL and 28 per cent (802) under RLMT.
Table 5.10: Impact on CoS of a change in the 2014 NHS Agenda for Change pay scales for SOC 2231: Nurses (year ending March 2015) SOL RLMT
Restricted to: Base Salary
No. Affected
% No. Affected
%
Band 3+ 16,271 0 0% 0 0%
Band 4+ 18,838 0 0% 0 0%
Band 5+ 21,478 2 4% 184 7%
Band 6+ 25,783 14 29% 1,428 57%
Band 7+ 30,764 32 65% 2,076 83%
Band 8 Range A+
39,239 48 98% 2,448 98%
Band 8 Range B+
45,707 49 100% 2,486 99%
Band 8 Range C+
54,998 49 100% 2,491 100%
Band 8 Range D+
65,922 49 100% 2,491 100%
Band 9+ 77,850 49 100% 2,491 100%
Total 49 100% 2,499 100%
Source: Home Office Management Information, year ending March 2015

Chapter 5: Occupation specific thresholds
75
Table 5.11: Impact on CoS of a change in the 2014 NHS Agenda for Change pay scales for SOC 2211: Medical Practitioners (year ending March 2015) SOL RLMT
Restricted to: Base Salary
No. Affecte
d
% No. Affected
%
Band 3+ 16,271 0 0% 0 0%
Band 4+ 18,838 0 0% 0 0%
Band 5+ 21,478 0 0% 1 0%
Band 6+ 25,783 0 0% 19 1%
Band 7+ 30,764 52 8% 475 17%
Band 8 Range A+
39,239 117 18% 802 28%
Band 8 Range B+
45,707 192 30% 1,146 41%
Band 8 Range C+
54,998 274 43% 1,636 58%
Band 8 Range D+
65,922 438 69% 2,265 80%
Band 9+ 77,850 530 83% 2,551 90%
Total 637 100% 2,824 100%
Source: Home Office Management Information, year ending March 2015
5.30 Three occupations in the IT sector, namely Information technology and telecommunications directors (SOC 1136), IT specialist managers (SOC 2133) and IT project and programme managers (SOC 2134) currently have thresholds based on the 2014 Income Data Services (IDS) report. It is notable that this report is no longer produced and therefore does not represent a viable long term source of data for the thresholds of these occupations.
5.31 For each of the occupations, the IDS reports percentiles which are substantially higher than for the occupation under ASHE. As such, the number that are affected at each percentile are substantially higher than the corresponding percentile under ASHE. Even if the percentile threshold were to be raised, a move away from the IDS report to ASHE may in fact decrease the number of CoS affected.
5.32 Figures 5.12 - 5.14 show the number of affected CoS applications at different thresholds, based on the IDS pay scales. Across all routes, a median salary threshold would affect 28 per cent (74) of applications for SOC 1136 Information technology and telecommunications directors across all routes, 34 per cent (411) of SOC 2133 IT specialist managers and 42 per cent (1,091) of SOC 2134 IT project and programme managers.
5.33 By comparison, the same median threshold utilising the ASHE data source in lieu of the IDS pay scales would restrict 9 per cent, 20 per cent and 22 per cent of SOCs 1136, 2133 and 2134 respectively.

Analysis of Salary Thresholds
76
Table 5.12: Impact on CoS of a change in the 2014 Income Data Services pay scales for SOC 1136 Information technology and telecommunications directors (year ending March 2015) RLMT ICT Short Term ICT Long Term
Base Salary
No. Affected
% No. Affected
% No. Affected
%
25th 75,000 20 19% 0 0% 12 9%
50th 96,332 33 31% 2 11% 39 29%
75th 122,458 52 48% 9 50% 74 53%
Total 108 100% 18 100% 140 100% Source: Home Office Management Information, year ending March 2015
Table 5.13: Impact on CoS of a change in the 2014 Income Data Services pay scales for SOC 2133 IT specialist managers (year ending March 2015) RLMT ICT Short Term ICT Long Term
Base Salary
No. Affected
% No. Affected
% No. Affected
%
25th 40,000 58 29% 8 3% 0 0%
50th 50,000 110 54% 43 18% 258 34%
75th 63,515 149 74% 90 37% 471 62%
Total 202 100% 241 100% 760 100%
Source: Home Office Management Information, year ending March 2015
Table 5.14: Impact on CoS of a change in the 2014 Income Data Services pay scales for SOC 2134 IT project and programme managers (year ending March 2015) RLMT ICT Short Term ICT Long Term
Base Salary
No. Affected
% No. Affected
% No. Affected
%
25th 40,308 68 23% 31 5% 0 0%
50th 52,000 150 50% 165 29% 776 45%
75th 63,000 192 64% 269 47% 1,229 71%
Total 299 100% 578 100% 1,733 100%
Source: Home Office Management Information, year ending March 2015
5.34 Secondary education teaching professionals (SOC 2314), Primary and nursery education teaching professionals (SOC 2315) and Special needs education teaching (SOC 2316) have thresholds based on the National Teaching payscales which relate to the training and experience the job requires. Table 5.15 analyses the effect of increasing the threshold to more qualified bands. Increasing thresholds to only those qualified to “post-threshold” would restrict 74 per cent (147) of applicants under SOL and 64 per cent (292) of applicants under RLMT.
5.35 SOC 2312, Further Education teaching professionals, has a threshold based on the Teaching Union payscales. The impact of raising the

Chapter 5: Occupation specific thresholds
77
threshold are presented in table 5.16. For example, an increase in this threshold to the Senior Lecturer band would restrict 75 per cent (38) of all applications.
Table 5.15: Impact on CoS of a change in the 2014 National Teaching pay scales for SOC 2314: Secondary education teaching professionals, 2315: Primary and nursery education teaching professional and 2316: Special needs education teaching professionals (year ending March 2015) SOL RLMT ICT Short Term
Base Salary
No. Affected
% No. Affected
% No. Affected
%
Unqualified* 20,800 0 0% 0 0% 0 0%
Qualified 21,804 6 3% 31 7% 0 0%
Post-threshold 34,523 147 74% 292 64% 10 100%
Leadership 37,836 164 82% 338 75% 10 100%
Total 199 100% 453 100% 10 100%
Notes: This analysis, as in the codes of practice, uses the lowest value of the three national teaching payscales provided by: England and Wales – Department for Education; Northern Ireland – NASUWT; Scotland – SNCT. Source: Home Office Management Information, year ending March 2015
Table 5.16: Impact on CoS of a change in the 2014 Teaching Union pay scales for SOC 2312 Further Education teaching professionals (year ending March 2015) SOL RLMT ICT Short Term
Base Salary
No. Affected
% No. Affected
% No. Affected
%
Lecturer 21,936 0 0% 2 4% 0 0%
Senior Lecturer
32,421 0 0% 38 75% 0 0%
Management / Principle
lecturer
36,162 0 0% 47 92% 0 0%
Total 0 100% 51 100% 1 100%
Notes: This analysis, as in the codes of practice, uses the lowest value of the teaching union payscales provided by: England– ATL; Northern Ireland – UCU; Wales – ATL. Source: Home Office Management Information, year ending March 2015
5.36 The bands used in this analysis use the lowest value found on the four national payscales: England, Wales, Scotland and Northern Ireland. However, frequently these data are out of date and not necessarily an accurate representation of the wages being offered in these occupations
5.37 SOC 2311 Higher education teaching professionals also uses separate pay scales, but the lack of distinct bands prevents any comparative analysis being performed.

Analysis of Salary Thresholds
78
5.7 Partner evidence
What would be the impact of increasing the Tier 2 minimum thresholds from the 10th to the 25th percentile for each occupation for new entrant workers?
5.38 A number of firms raised concerns that an increase in the salary thresholds for new entrants to the 25th percentile would impact recruitment of graduates onto graduate programmes and could lead to relocation of graduate schemes overseas.
5.39 The Department for Business, Innovation and Skills (BIS) said that raising the threshold would potentially prevent talented, but younger skilled workers from entering the UK. They go on to say that this would be especially true of those businesses outside of London that are trying to compete for the recruitment of young skilled workers, for example as part of graduate recruitment schemes.
5.40 The pharmaceutical sector expressed concerns about pre-registration pharmacist roles. The Royal Pharmaceutical Society said that the market for Overseas Pharmacists’ Assessment Programmes (OSPAP) would be greatly reduced and would probably result in a reduction of OSPAP providers with a consequent reduction in the income of UK universities.
5.41 Rolls Royce said that an increase up to the 15th percentile could be absorbed while the Engineering Employers’ Federation said that an increase of the threshold would reduce the affordability of graduate recruitment to the extent that it would ‘ultimately abolish the entry-level rate.
5.42 Penningtons Manches said that to comply with the new increased rate, companies will need to raise the graduate level salaries for all workers so as not to discriminate. CMS Cameron McKenna LLP said that they pay a set salary for trainees across each of their offices. They would not be able to change these to accommodate an individual who may require a visa as it would cause friction across the trainee population. Similarly, Kingsley Napley said that increased thresholds would have the effect of pushing up salaries across the board, leading to reduced budgets for hiring staff, including resident workers. Partners stated that, by their nature, new entrants to the workforce will have only recently completed their education and have limited work experience. They therefore should fall at the lower end of the salary distribution for that occupation. For those sponsors with client contracts to service, higher staff costs will impact their competitiveness and could potentially lead sponsors to relocate their business to a country with lower salary costs. One partner said that they run some of their graduate programmes from their Scotland office where they rely on the new entrant salary as regional market rate salaries are lower. If an even higher salary threshold were implemented, they would need to re-evaluate conducting such programmes in Scotland.

Chapter 5: Occupation specific thresholds
79
5.43 Respondents from the education sector said that the increase for new entrants to the 25th percentile would prevent universities from being able to sponsor early stage academic talent such as junior and graduate researchers and possibly losing this talent overseas. Concern was expressed that new entrants such as postdoctoral researchers would not meet the proposed experienced worker rates after three years and one month, preventing extensions. The majority of research staff are funded by grants from external funding bodies and meeting increased salary levels will not be possible. Universities UK pointed out that for occupations which require professional registration or accreditation, salary progression is linked to successful completion of the accreditation process. The starting salary can be very low but increase significantly once a new entrant is fully qualified into the role. Universities UK quote figures from the Royal Institute of British Architects showing that the median starting salary for the typical entry level role of architectural assistant was just over £19,500 in 2014, and this figure was just under £13,000 in Northern Ireland. However, the median figure for fully qualified architects was £33,470. The National Union of Students said that an increase would put pressure on those applying at new entrant level but also restrict those migrants with a high level of skill to the businesses that can afford the salary thresholds. For example, we were told that many PhD students have abandoned research to pursue jobs in industry.
5.44 Respondents from the Arts sector gave the example of new entrants into the dance sector where an increase to the 25th percentile would put the threshold significantly over the pay of established dancers. A rise in salaries would be totally at odds with the significant reduction in funding of this sector with the impact that some leading dance companies would not be able to use Tier 2 for new entrants.
5.45 Some partners stressed the impact on small and medium sized enterprises (SMEs), making Tier 2 a route that only large corporations can use and thus stunting SMEs ability to ensure that they could remain competitive in the global context. Business institutions expressed concern about the impact on the tech and creative sectors. The growth of these sectors is partly driven by start-ups who could be particularly hard-hit by increases in the minimum thresholds.
“London is Europe’s leading start-up hub for tech sector...The sector‘s growth is in large-part driven by start-ups, who would be very hard hit by such a change in minimum thresholds...If start-up or small businesses choose to locate elsewhere because of the difficulty of recruiting talent in London, this will have a knock-on effect on London’s creative sector (in digital advertising, for example).”
London First response to MAC call for evidence
5.46 Newland Chase said that in some lower paid industries such as engineering and architecture, market rate starting salaries are already

Analysis of Salary Thresholds
80
below the Tier 2 salary thresholds. Engineering the Future said that variations due to differences in company size, the region and other factors, may lead to disproportionate impacts on some low-paid roles. Newland Chase and J. Dunlop said this would hit those switching from Tier 4 student visas as a disproportionate increase above the current market rate would restrict the opportunity for employers to secure the most talented UK graduates, having just completed their training in UK institutions.
5.47 Some respondents such as Total and the TUC (in relation to electrical engineers) were supportive of increasing the threshold to the 20th percentile.
“Total is supportive of the need to increase the existing salary thresholds to 20th percentile to avoid undercutting the resident labour force”.
Total response to MAC call for evidence
5.48 The Department of Health said that it was standard practice for all new entrants to be paid at the bottom pay point and that the current system therefore prevents undercutting. An increase in the minimum salary thresholds away from the bottom pay point for each occupation would make it impossible for employers in the NHS to operate in accordance with the nationally-set pay arrangements. If employers in the NHS were forced to increase the rates of pay for the overseas labour force this would mean that resident workers would stand to lose out. The Department would also like to see the current exemption from the salary thresholds that exists for some nursing posts maintained.
5.49 The evidence from NHS Foundation Trusts and NHS Employers was that migrants were hired at the base point of grade. Raising salary thresholds would either rule them out, lead to wage inflation, or result in equal pay claims.
“An increase in the minimum salary thresholds for each occupation would make it impossible for employers in the NHS to operate in accordance with the nationally-agreed pay and contractual arrangements which have been designed to ensure equity across professions and which comply with the Equality Act 2010. The system ensures there is no undercutting of pay for the resident workforce through recruiting from overseas.”
NHS Employers response to MAC call for evidence
What would be the impact of increasing the Tier 2 minimum thresholds from the 25th to the 50th or 75th percentiles for each occupation for experienced workers?
5.50 A number of partners told us that increasing the thresholds significantly would price firms out of employing people with essential experience. The

Chapter 5: Occupation specific thresholds
81
CBI expressed a number of concerns on the likely impact of raising the threshold from the 25th percentile to the median or the 75th percentile. First, businesses are hiring highly skilled migrants to fill skill shortages in the UK workforce and their options are to increase the wages of migrants, to move teams offshore or run a vacancy. Where the impact is to increase the pay of migrants, their salaries will have to be topped up from other budgets – budgets for training, investment or pay rises for example. Employers that would not be able to afford to increase salaries would either move teams abroad or risk losing business to international competitors who do not employ workers in the UK. The CBI told us that the overwhelming view of their members was that being able to access highly skilled migrants under the Tier 2 (General) and Tier 2 (Intra-Company Transfer) routes leads to more investment in the UK, bringing global jobs here, and creating more employment opportunities for UK nationals, not fewer.
5.51 Moreover, evidence from the National Grid stated that they had attempted to address the shortages in the skilled job market by recruiting less experienced workers. In this way, they are able to fill roles at a lower level with ‘progression through flow through grades’ as training is passed and required authorisations are obtained. These recruits are often trained to at least NQF6 level with two to three years additional industry experience. Due to their additional experience, these lower skilled recruits are overqualified for a graduate level salary within the SOC codes, despite being relatively inexperienced for the vacancies.
5.52 ASDA said that raising thresholds so that they did not sit within their existing salary bandings would lead, where there is a skills gap, to a move to rely on settled workers for roles where they currently recruit migrants (Pharmacists, Optometrist, senior managers). However, if the required skills could not be found in the resident workforce then the role may remain vacant, negatively impacting the general functioning and growth of the business. ASDA said that intra-company transferees brought experience from another international market. Where this experience was absolutely necessary for the role, increasing the threshold would not be a deterrent to hiring international workers, but it would place the company at a disadvantage financially. Increasing thresholds unrealistically could stifle the company’s ability to deliver innovation and replicate best practice.
“...we would urge the Committee not to advise on too quick and too far an increase in salary thresholds, if it does indeed recommend one...It is our view that the Government should be mindful of the impact that increasing the thresholds too far, which would take a number of our small Tier 2 contingent out of the normal wage distribution, may have on our ability to bring vital international experience to the UK workplace”.
ASDA response to MAC call for evidence

Analysis of Salary Thresholds
82
5.53 The increase to the 50th percentile would be less damaging than to the 75th and would impact fewer offices. Centrica said that the 50th percentile is above the salary presently paid to a third of current experienced migrant staff. Increasing salaries to this percentile would not be economically feasible and positions would go unfilled. Total said that the increase should be limited to the 40th percentile, any higher would be unmanageable, provided the principle of including recurrent allowances be retained.
5.54 The Society of London Theatres said that an increase to the 50th percentile would prevent the majority of leading dance companies from using Tier 2 to recruit experienced dancers. Additionally, having to terminate the employment of a new entrant after 3 years and one month because the 50th percentile is not aligned with the company’s pay structure would negate the training investment made in new entrants, particularly for companies with an exclusive repertoire or distinctive style.
5.55 For PhD posts, Heriot-Watt told us that the minimum level at which universities could appoint migrant workers would be Senior Lecturer level or above for academic posts or Senior Research Fellow level for research posts in order to comply with the salary thresholds. The sector would be unable to fill key research and academic roles or would fill them with less qualified UK or EEA staff, negatively impacting on the UK’s ability to deliver its research and teaching commitments.
5.56 A number of partners across the sectors highlighted concerns that having to pay Tier 2 migrants a higher salary than their resident workforce would lead to indirect discrimination claims from their resident labour force or to artificially inflating remuneration packages in the market. Partners said that the Tier 2 route will be limited in future to those in highly paid, senior positions only and will exclude entry level graduates and technical experts or would increase internal costs and thus make businesses less competitive as they will seek to recover these costs by increasing the fees charged to clients. This has the potential to increase inflation as the costs of services increase. Universities UK also said that an increase would result in universities having to pay inflated salaries to migrant staff to meet the threshold and would carry a risk of discrimination pay claims and create a two-tier pay system which would be inherently unfair to UK and EEA staff.
5.57 Laura Devine Solicitors highlighted the potential for a disproportionate impact of these increases on sectors where salaries are lower (creative, public sector, charities), on start-up companies and SMEs, and on employers outside of London. Nissan and Toyota said that an increase in the salary threshold for intra-company transfers could reduce the numbers coming to the UK and could prevent the beneficial upskilling of the domestic workforce in such areas as Nissan’s global training hub in the North East of England.

Chapter 5: Occupation specific thresholds
83
“NMUK in Sunderland is one of the main global training plants for Nissan. Currently we have large numbers of assignees coming to the UK from Japan to support specific projects and to develop their skills under out Talent programme. It is important to the success of the Company that we continue to support the transfer of skills. If the salary bands were to increase this may affect our ability to host assignees from countries such as India and China.”
Nissan response to MAC call for evidence
5.58 The TUC said that the threshold should be increased to the 50th percentile for occupations that do not currently use nationally agreed pay scales as this is the market rate that employers tend to look at. They said that they are not sure of any sustainable case to raise the threshold to the 75th percentile and believed this would lead to discrimination against migrant workers who would become too expensive to hire. The Association of British Orchestras said that orchestras do not have new entrant positions and that all are paid equally. Moving the minimum salary to £24,200 would not be problematic for UK orchestras as tutti musicians are paid at this higher level.
5.59 The Department of Health recommended that the current arrangements for the NHS are maintained. The Department also said it was important to recognise that there may be circumstances where such pay progression may not be possible for economic circumstances and that it should be possible to make exceptions in these rare cases.
“A change in arrangements for overseas workers in the NHS and care sector would make it impossible for employers to operate in accordance with the nationally-set pay arrangements which work on the basis of annual increments up to the maximum of their pay band. It would impact on the ability of employers to retain overseas staff that they have invested in training and developing to fill supply gaps.”
Department of Health response to MAC call for evidence
5.60 In the care sector Four Seasons Health Care told us that they are already paying a premium of around £3,500 for registered nurses (band 5). Despite this and having hired more than 600 registered nurses from the EU, they report they are still losing 26 nurses a month, mainly to the NHS (acute) sector. They said a higher salary threshold will result in having to pay care nurses an even higher premium.
Analysis of Salary Thresholds
84
“Forcing new salary thresholds will result in having to pay Nurses £10,000 higher than our salary band, or not delivering services. This is simply not achievable given that our annual public sector fee increase is between 1 – 2 %”
Four Seasons Health Care response to MAC call for evidence
5.61 The Scottish Government Health Workforce Directorate said that using the 75th percentile would result in a salary threshold of £105,192 for medical practitioners. Setting the salary threshold at this level would restrict entry under Tier 2 to senior consultants, restrict the pool of labour for hospitals and GP surgeries to recruit and place the delivery of health and health care in Scotland in jeopardy.
5.62 By contrast, Migrationwatch said that the thresholds should be increased.
“Someone entering the UK on a Tier 2 General Visa is constrained to working solely for their sponsor. This gives them much less bargaining power when it comes to salary increases. To counter this, we suggest that the required salary threshold is raised to 50% of the relevant occupation for experienced hires and 25% of the relevant occupation for new entrant workers.”
Migrationwatch response to MAC call for evidence
5.8 Conclusions
5.63 The Government asked the MAC to assess the impact of increasing the occupation-specific thresholds for experienced workers from the 25th percentile to the 50th or 75th. Excluding occupations that are currently based on nationally agreed pay scales within the health and education sector, and using age as a proxy for new entrants, the number of applications affected by a 50th and 75th percentile threshold can be assessed. An occupation-specific threshold set at the 50th percentile (median) would affect 40 per cent (25,400 of applications across Tier 2. For Tier 2 (General) it would affect 61 per cent (8,853) of in-country applications and 40 per cent (4,406) of out-of-country applications. For the short-term intra-company transfer route it would affect 20 per cent (177) of in-country applications and 55 per cent (10,872) of out-of-country applications. Only 6 per cent (1,078) of long-term intra-company transfer applications would be affected.
5.64 In comparison, an occupation-specific threshold set at the 75th percentile for experienced workers would affect 60 per cent (37,360) of all Tier 2 applications. The most significant impact would be on Tier 2 (General) where 76 percent (10,966) of in-country applications would be affected and 59 per cent (6,375) of out-of-country applications affected.

Chapter 5: Occupation specific thresholds
85
5.65 Looking at occupations which would be most impacted by a median salary threshold, in terms of total volume, Natural and Social Science Professionals n.e.c (SOC 2119) would be the most affected within the RLMT route, with 2,800 applications affected (79 per cent of applications within that occupation). For short-term intra-company transfers, the IT sector would be the most affected, with 5,169 Programmers and software development professionals (SOC 2136) being affected (68 per cent of applications within that occupation).
5.66 Looking at the top five occupations affected in terms of percentage, Table 5.17 shows that a median salary threshold would affect 97 per cent (73) of Therapy Professionals n.e.c (SOC 2229) through the RLMT route, as well as 95 per cent (37) of Social services managers and directors (SOC 1184) and 94 per cent (80) of Health services and public health managers and directors (SOC 1181). There are also a number of occupations with only one or two applications which would be completely excluded.
5.67 The Government also asked the MAC to assess the impact of increasing the occupation-specific thresholds for new entrants from the 10th to the 25th or 50th percentile. The analysis shows that at the 25th percentile, 45 per cent (3,524) of new entrant Tier 2 applications would be affected. For Tier 2 (General), 61 per cent (1,528) of in-country applications would be affected and 33 per cent (497) of out-of-country applications would be affected. For the short-term intra-company transfer route, this would affect 16 per cent (17) of in-country applications and 45 per cent (1,481) of out-of-country applications. There would be negligible impact on the long-term intra-company transfer route. A salary threshold at the 50th percentile would affect 62 per cent (4,870) of new entrant applications, including 58 per cent (870) of out-of-country applications for Tier 2 (General).
5.68 Currently a number of occupations use alternative sources of data in lieu of ASHE to act as salary thresholds. In many cases this data provides a more accurate representation of the salaries being paid to workers in these occupations. However, the data currently being used is out of date for several occupations in the education sector, whilst the IDS is no longer produced for those occupations in the IT sector. In the wider Tier 2 review, due consideration will be given to the viability of some of the current data sources, and the option to use others where possible.
5.69 Another point for further consideration is that under the current Codes of Practice, new entrants are expected to meet the threshold for experienced workers within three years in order to qualify for renewal. Evidence provided to us suggests that this can currently be a difficult criterion to meet. Any rise in the experienced worker salary threshold, be it to the 50th or 75th percentile, needs to consider the effect on new entrants’ ability to reach the threshold within three years. This will be explored in further detail in the wider review of Tier 2.
5.70 Chapter 6 will set out the further work required to answer the questions put to the MAC by the Government.

Analysis of Salary Thresholds
86
Table 5.17: Top 5 Occupations affected by an nth occupation-specific threshold, in country and out-of-country combined, for each occupation split by route (year ending March 2015)
Shortage Occupation List route
SOC code Occupation title
Salary at median
(£) No.
affected In
Country Out-of-
country % Total
Top 5 occupations affected by median threshold (volume)
2211* Medical practitioners 71,141 481 255 226 76%
2126 Design and development engineers
38,549 204 118 86 63%
2314* Secondary education teaching professionals
36,987 163 57 106 82%
2136 Programmers and software development professionals
40,007 115 73 42 74%
2123 Electrical engineers 43,711 92 56 36 66%
Top 5 occupations affected by median threshold (%)
2212 Biological scientists and biochemists
33,482 8 6 2 89%
2135 IT business analysts, architects and systems designers
31,500 19 13 6 83%
2314* Secondary education teaching professionals
29,379 163 57 106 82%
2211*
Medical practitioners 59,539 481 255 226 76%
2142 Environment professionals 25,875 6 4 2 75%
Total restricted: 1, 692 934 758 54%
Resident Labour Market Test route
SOC code Occupation title
Salary at Median
(£) No.
affected In
Country Out-of-
country % Total
Top 5 occupations affected by median threshold (volume)
2119 Natural and social science professionals n.e.c.
35,860 2,800 1,752 1,048 79%
2211* Medical practitioners 71,141 2,384 1,629 755 84%
2231* Nurses 31,641 2,131 969 1,162 85%
3545 Sales accounts and business development managers
42,595 1,891 1,547 344 79%
2136 Programmers and software development professionals
40,007 1,544 881 663 59%
Top 5 occupations affected by median threshold (%)
2232* Midwives 28,755 1 1 0 100%
2449 Welfare Professionals n.e.c. 23,293 20 18 2 100%
2229* Therapy professionals n.e.c. 21,600 73 56 17 97%
1184 Social services managers and directors
24,000 37 36 1 95%
1181 Health services and public health managers and directors
25,400 80 76 4 94%
Total restricted: 21,741 14,259 7,482 62%

Chapter 5: Occupation specific thresholds
87
Table 5.17: Top 5 Occupations affected by an nth occupation-specific threshold, in country and out-of-country combined, for each occupation split by route (year ending March 2015)
Short term Intra-company Transfer route
SOC code
Occupation title
Salary at Median (£)
No. affected
In Country
Out-of-country
% Total
Top 5 occupations affected by median threshold (volume)
2136 Programmers and software development professionals
40,007 5,169 73 5,095 68%
2135 IT business analysts, architects and systems designers
41,983 3,438 36 3,402 64%
2139 Information technology and telecommunications professionals
39,759 2,534 39 2,495 68%
2137 Web design and development professionals
29,171 263 1 262 75%
2423 Management consultants and business analysts
40,691 254 6 248 20%
Top 5 occupations affected by median threshold (%)
1181 2213* 2219* 2315* 3512
Health services and public health managers and directors Pharmacists Health professionals n.e.c. Primary and nursery education teaching professionals Aircraft pilots and flight engineers
25,000
32,935 27,200 31,200
66,457
1
1 1
10
1
0
0 0 0
0
1
1 1
10
1
100%
100% 100% 100%
100%
Total restricted: 13,023 207 12,816 54%
Long term Intra-company Transfer route
SOC code
Occupation title Salary at Median (£)
No. affected
In Country
Out-of-country
% Total
Top 5 occupations affected by median threshold (volume)
2134* IT project and programme managers
46,997 428 120 308 25%
1132 Marketing and sales directors 70,742 177 88 89 22%
2133* IT specialist managers 44,906 145 33 112 19%
2135 IT business analysts, architects and systems designers
41,983 103 31 72 4%
1131 Financial managers and directors 61,108 56 18 38 10%
Top 5 occupations affected by median threshold (%)
1181 3512 2134 2311* 1132
Health services and public health managers and directors Aircraft pilots and flight engineers IT project and programme managers Higher education teaching professionals Marketing and sales directors
44,600
67,896 53,800 77,150
110,000
1
3 428
1
177
0
0 120
0
88
1
3 308
1
89
100%
100% 25% 25%
22%
Total restricted: 1,093 324 769 6%

Analysis of Salary Thresholds
88
Table 5.17: Top 5 Occupations affected by an nth occupation-specific threshold, in country and out-of-country combined, for each occupation split by route (year ending March 2015)
Notes: Salary at the nth percentile uses full-time ASHE 2014 data for the UK for all SOC codes. * No. affected for SOC 2231 (Nurses), 2211 (Medical Practitioners), 2232 (Midwives), 2229 (Therapy professionals n.e.c.), 2213 (Pharmacists) and 2219 (Health professionals n.e.c.) use ASHE 2014 data despite using the Agenda for Change pay scale in the codes of practice. No. affected for SOC 2133 (IT specialist managers), 2134 (IT project and programme managers) and SOC 1136 (Information technology and telecommunications directors) use ASHE 2014 data despite using the Income Data Services pay in the codes of practice. No. affected for SOC 2314 (Secondary education teaching professionals), 2315 (Primary and nursery education teaching professionals) and 2311 (Higher education teaching professionals) use ASHE 2014 data despite using the National Teaching pay scales in the codes of practice. Source: Home Office Management Information, year ending March 2015

89
Chapter 6 Further work
6.1 Introduction
6.1 The timeframe for this first part of the MAC’s Tier 2 commission has been extremely tight. In five weeks we have undertaken a good deal of quantitative analysis and stakeholder engagement and have successfully run, albeit briefly, a call for evidence specifically around the salary threshold issue.
6.2 Inevitably there are a number of issues resulting from the responses we have received from partners that merit further consideration beyond this initial five-week timeframe. We will continue to consider these and report back fully in our overall review of Tier 2.
6.3 There are some issues which need to be considered in the round, namely:
The issues associated with the Tier 2 General limit being reached in recent months; and
The overlap between raising salary thresholds and the proposed introduction of a skills levy.
6.4 We also set out in this chapter our thinking on the following areas:
Regional pay variations;
Those occupations qualified to NQF6+; and
Alternative sources for benchmarking pay data by sector/occupation.
6.5 We begin by addressing these broader points on the levy and limit, before considering those other issues identified above and not discussed elsewhere in this report.
6.2 Prioritisation of applications/occupations Tier 2 (General)
6.6 The Tier 2 (General) route has been subject to an annual limit of 20,700 places for main visa applicants since 2011. The Government has announced that this limit will remain in place for the duration of this Parliament. The limit is spread across a monthly allocation of 2,650 for the first month (April) followed by 1,650 a month for the rest of the financial
Chapter 6 Further work

Analysis of Salary Thresholds
90
year. Any unused allocation in one month can be carried over to the following month.
6.7 In recent months, demand for restricted Certificates of Sponsorship (RCoS) has been rising markedly from around 1,500 in March 2015 to in excess of 3,000 in July 2015 (Figure 6.1).
6.8 In June 2015 the monthly limit was reached for the first time since the limit’s introduction, reflecting wider UK economic and employment growth, as shown in Figure 2.1 in Chapter 2. This has meant that the allocation of RCoS has been prioritised in line with a pre-arranged process. This is largely based on salary levels (Table 2.2 in Chapter 2 sets out the full criteria), and as a consequence it is applications in relation to NQF6+ level occupations that are not on the shortage occupation list (SOL) and which pay less than other occupations that have been refused.
Figure 6.1: Monthly RCoS Grants and Refusals, April 2014- July 2015
0
500
1,000
1,500
2,000
2,500
3,000
3,500
Apr-14 May-14 Jun-14 Jul-14 Aug-14 Sep-14 Oct-14 Nov-14 Dec-14 Jan-15 Feb-15 Mar-15 Apr-15 May-15 Jun-15 Jul-15
Granted Refused
Source: Home Office Management Information (July 2015)
6.9 Comparing the period April to July 2014 with the same time period for 2015, the total number of RCoS applications increased by almost 3,500 or by over 50 per cent.
6.10 Table 6.1 below indicates that predominantly public sector occupations3 appear to have accounted for the majority of the increase (especially among nurses (an increase of 1,531), medical practitioners (424) and primary and secondary school teachers (306)). IT-related occupations
3 We recognise that these occupations are not entirely limited to the public sector.

Chapter 7: Summary and conclusions
91
were up by 337 and finance, accountancy and management consultancy occupations grew by around 500. (We present in Annex D a series of graphs showing monthly trends for the main occupations under Tier 2 (General)).
6.11 To some extent these increases were offset by a decline (242) in RCoS applications spread across 35 occupations. This was mainly among mechanical engineers (a decline of 51 applications or 70 per cent of the April-July 2014 volume), physical scientists (down 23; 41 per cent) and sales accounts and business development managers (down 22; 9 per cent).
Table 6.1: Growth in RCOS applications, 2014 (April-July) and 2015 (April-July) Occupation 2014 2015 Change Percent
change
Nurses 733 2264 1531 209%
Medical Practitioners 476 900 424 89%
Chartered and certified accountants 197 482 285 145%
Programmers and software development professionals
567 816 249 44%
Secondary education teaching professionals 116 346 230 198%
Management consultants and business analysts 466 594 128 28%
Finance and investment analysts and advisers 386 476 90 23%
IT business analysts, architects and systems designers
290 378 88 30%
Health professionals not elsewhere classified 9 94 85 944%
Primary and nursery education teaching professionals
56 132 76 136%
Source: Home Office Management Information (July 2015)
6.12 As highlighted above, RCoS applications for the lower-paying occupations that are not included on SOL are at greater risk of being refused when the Tier 2 limit is reached. In June 2015 jobs paying less than £46,000 failed to have their applications granted. In July the pay cut-off was £32,000.
6.13 In June and July 2015, almost 2,500 RCoS applications were refused. Unless an occupation is currently on the shortage occupation list, the current prioritisation system when the limit is reached means that the lowest paying occupations will be the most significantly affected.
6.14 During our partner engagement for this commission we were told that accountants, management consultants and occupations within the public sector (especially nurses and teachers) were being significantly affected by the Tier 2 limit. In addition, a number of partners raised concerns about the impact of the limit on graduate entry schemes.
6.15 This raises important, and potentially urgent, issues in the short-term, not least while the MAC completes its full review of Tier 2. The rise in applications for public sector professions – particularly in healthcare – and the subsequent refusal rate will put greater pressure on these sectors’ delivery of services until a longer-term solution to filling vacancies other than through non-EEA immigration is found.

Analysis of Salary Thresholds
92
6.16 In the second part of our commission we will be carrying out more sector-specific enquiries to assess the underlying dynamics of this growth in the use of migrant labour. Primarily, we will look at the sustainable supply of UK trained healthcare workers with the medium to long-term aim of reducing the sector’s reliance on migration. Inevitably, this will focus on both recruitment and retention issues within healthcare and in other sectors. For now, though, the Government may wish to consider such professions separately from the Tier 2 limit on a temporary basis and perhaps with a separate healthcare limit.
6.17 Similarly, the issue of graduate recruitment schemes requires urgent attention, and some temporary respite from the limit may be needed here to ensure these schemes can proceed for the current year.
6.3 Interaction of a skills levy with the salary threshold
6.18 In the wider review of Tier 2, which will report in mid-December 2015, the Government has asked the MAC to advise on the impact of:
“…applying a skills levy to businesses recruiting from outside the EEA, the proceeds from which would fund apprenticeships in the UK. This should consider which businesses the levy should apply to and the impact of different levels of levy, balancing the need to maximise the incentive for employers to recruit and train UK workers with the ability of businesses to access the skilled migrants they need;”
6.19 Both an increase in the salary thresholds and the application of a skills levy will increase the cost to business of hiring a migrant. The key difference is that an increase in the salary thresholds will directly benefit the migrant if his or her salary increases whereas the application of a skills levy will deliver funds to the Government.
6.20 It is therefore not possible to fully assess the impact on migrants and the economy of an increase in salary thresholds without also assessing the impact of a skills levy. Given that the Government could decide to both increase thresholds and introduce a levy, it is important to consider together the impact of these two mechanisms.
6.21 Figures 6.3 and 6.4 (see below) demonstrate how either raising salary thresholds or introducing a levy may operate in practice. Either mechanism will increase the cost to the employer of hiring a migrant worker. Other things being equal, this higher cost of labour will result in a fall in demand – i.e. fewer migrants will be recruited. This represents a loss to employers in terms of reduced access to migrant workers and hence the skills of those workers. It is unclear what would be the overall effect on the employer’s wage bill: higher wages for new recruits will push up average wages, but this will be offset by the fact that fewer migrant workers are hired. A number of respondents to our call for evidence said that a higher cost would not deter them from bringing in the skilled migrants that they need.

Chapter 7: Summary and conclusions
93
6.22 It is this uncertainty over the impact of the interplay between the thresholds and the levy, together with the comments of partners set out below, that makes us hesitate to conclude, at this stage, whether, and to what extent, salary thresholds should be raised. Once we have had the opportunity in the wider Tier 2 review to consider the skills levy issue in greater detail we will provide more considered advice.
Figure 6.2: Impact of an increase in the salary threshold on demand for migrants
Notes: It is important to note that an increase in the salary thresholds would only have an impact in cases where the current equilibrium price is below the salary threshold. The figures depict the direct income flows to the different parties and do not include indirect flows such as the tax revenue that comes from the earnings of migrants and firms.
D
P
P threshold
P *
Q e Q threshold
Minimum salary threshold
Higher wages for migrants
Loss to m
igra
nts
Q
Deadweight loss to business

Analysis of Salary Thresholds
94
6.4 The minimum earnings threshold for permanent settlement
6.23 We received a number of responses to our call for evidence raising concerns around the minimum £35,000 pay threshold for selecting those migrants in the UK with Tier 2 (General) visas who may settle permanently in the UK.
6.24 Home Office changed the settlement rules in 2012 to break the near-automatic link between coming to the UK to work or study temporarily, and settling permanently. The new rules would apply to migrants who entered Tier 2 from 6 April 2011. Therefore, from 2016, non-EEA workers will need to earn at least £35k to settle in the UK for longer than six years (unless they are working in a shortage or PhD-level qualification).
6.25 The level of threshold was informed in part by earlier work by the MAC (“Settlement rights of migrants in Tier 1 and Tier 2”, November 2011). The Government decided to apply the minimum income threshold for settlement across all occupations covered by Tier 2, though in its recommendations at the time the MAC had recognised the need for a limited number of exceptions, for example in the public sector,
6.26 Because the threshold for settlement will take effect in 2016, partners have expressed concern that many of the staff they have recruited through Tier
Figure 6.3: Impact of a skills levy on demand for migrants
Notes: The figures depict the direct income flows to the different parties and do not include indirect flows such as the tax revenue that comes from the earnings of migrants and firms.
D
P
P *
Q e Q + levy
Skills levy per migrant Revenue to Government
Loss to m
igra
nts
Q
Deadweight loss to business
P* + levy
Chapter 7: Summary and conclusions
95
2 (General) since 2011 and whose earnings are significantly below the £35,000 threshold will be forced to leave the UK.
6.27 The MAC has not been tasked with reviewing the minimum income requirement for settlement as part of its current commission. However, it is clear that our consideration of salary thresholds for new skilled migrants will at least partially overlap with that for the earnings threshold for settlement. We shall therefore return to this in our wider review of Tier 2.
6.5 Considering regional pay variations
6.28 The MAC has been asked to consider the regional impact of its recommendations across both parts of the Tier 2 commission. We included a question in the salary thresholds call for evidence specifically seeking information and views from partners on this issue and we highlight below some of the responses we received.
6.29 The MAC has previously considered the impacts of regional variations in pay and we summarise those recommendations in Chapter 2 of this report. Most recently we covered this during our review of the Codes of Practice (Migration Advisory Committee, 2012), where we concluded:
“We examined the issue of regional variation of pay thresholds and in particular the fact that pay rates are often higher in London than elsewhere in the UK. We do not suggest different thresholds for different regions of the UK. This would increase the potential complexity of the codes of practice. Further, by setting a national minimum pay threshold by occupation at the 25th percentile this mechanism effectively allows for higher rates of pay in London being concentrated at the upper end of the earnings distribution.”
6.30 Using data from the Annual Survey of Hours and Earning, we considered all full-time employees as a whole across English regions plus Scotland, Wales and Northern Ireland (see Figure 6.4 below. Further graphs demonstrating the regional variation in pay by 2-digit occupation are included in Annex E). With the clear exception of London, and to a lesser extent the South East of England, the variation in pay between regions at the 25th, 50th (median) and 75th percentiles is relatively small.
6.31 Conducting a similar exercise for the broad 2-digit occupations mostly used under Tier 2, the picture is very similar (see Annex E for charts). Data limitations in ASHE preclude a robust analysis of the distribution of 4-digit occupations at the regional level and we accept that inevitably this broader grouping of occupations may mask more marked regional differences in pay for certain occupations or job titles.

Analysis of Salary Thresholds
96
Figure 6.4: Earning distribution for all full-time employees by region, 2014
£0
£5,000
£10,000
£15,000
£20,000
£25,000
£30,000
£35,000
£40,000
£45,000
£50,000
£55,000
25th Median 75th
Source: Annual Survey of Hours and Earnings 2014
6.32 Responses to our call for evidence were mixed as to whether the minimum salary threshold should take account of variations in regional pay:
It was recognised that nationally negotiated pay (predominantly in the public sector) already reflected to some extent regional differences. Beyond this, high cost area supplements were used (particularly for inner and outer London) to adjust for higher cost of living in some areas.

Chapter 7: Summary and conclusions
97
“As outlined, in the NHS Agenda for Change (AfC) operates as a national pay structure (with geographical allowances to take into account differences in cost of living). This reflects the status of the NHS as a national organisation, with AfC facilitating employment mobility across different NHS trusts and boards. Similarly, most independent sector health and social care organisations use some form of cost of living premia in high cost of living areas. A threshold which took into account regional variations could lead to inequities whereby nursing staff are penalised for living in lower cost areas.”
Royal College of Nursing response to MAC call for evidence
There was recognition too that regional thresholds would be difficult to administer and although intuitively attractive, regional pay variance was probably impossible to implement as staff are necessarily mobile within the UK.
The TUC and UNISON told us that setting pay thresholds at lower levels in certain regions may encourage employers to situate themselves in lower paying regions which encourages undercutting.
“The TUC does not believe pay should be set by region. We believe people should be paid for the job they do, not where they live. Setting the pay thresholds lower for migrants recruited into jobs in certain regions may encourage employers to situate themselves in lower paying regions, encouraging undercutting.”
TUC response to MAC call for evidence
There was a good deal of support for regional pay variations. In some cases this was location specific – i.e. recognising the higher cost of living in London and the South-East (Techcity UK), or highlighting the wide variations within regions such as Scotland, Wales and Northern Ireland (SDI, Scottish Government, Welsh Government, NISMP). In other cases the support for regional pay variation was more general. A number of partners from the legal or management consultancy sectors (either for their own organisations or for their clients) highlighted the need to take regional pay variations into account and some partners considered it of paramount importance that the minimum salary thresholds recognise regional differences in pay.
There were also examples of where regional pay differentials were not significant or would not be appropriate. Balfour Beatty told us this was the case for many of their recruits who are expected to work flexibly across the UK.
6.33 We shall continue to assess the evidence on variations in regional pay as part of our wider Tier 2 review. However, for now we are content that there
Analysis of Salary Thresholds
98
are no major regional variations that may require more urgent attention, particularly as the 25th percentile allows sufficient consideration of pay levels outside of London.
6.6 Occupations qualified to NQF6+
Updating the list of NQF6+ occupations
6.34 In 2012, (Migration Advisory Committee, 2012) we set out which 4-digit occupations qualified as NQF6+ - essentially degree level – in order to establish a minimum skills requirement for entrants into the Tier 2 route.
6.35 That report concluded that 97 of the total 369 4-digit occupations should be classed as being at the level of NQF6 or above. Since then, the MAC has recommended (MAC Partial Review of SOL, 2015) – and the Government has accepted – that paramedics also be added to this list.
6.36 Beyond this we have not undertaken a full review of qualifying occupations since 2012, but this is something we will revisit and report on as part of the wider Tier 2 commission.
Tier 2 occupations not qualified to NQF6+
6.37 In 2013, (Migration Advisory Committee, 2013) we were asked to consider the so-called ‘creative’ occupations, namely, artists, authors, actors, dancers and designers, alongside musicians which is already considered skilled to NQF6+. Because these are not based on recognised degree level qualifications, it is not possible to measure these against other occupations in a like-for-like way. The MAC recognised this and concluded that the five creative occupations not otherwise considered to be skilled to NQF6+ should remain eligible under Tier 2. In practice, the volumes coming into the UK have been and remain relatively low: in the 15 months since April 2014 there have been fewer than 200 RCoS applications for these occupations.
6.38 Since the MAC produced the first shortage list in 2008 the minimum qualifications requirement for Tier 2 occupations has risen from NQF3 to NQF6. Over time, a number of legacy occupations, such as overhead linesworkers, have remained on the shortage occupation list despite their qualification level being below NQF6. Most recently (Migration Advisory Committee, 2015) we recommended that not only should linesworkers remain on the list, but the previous distinction between high- and low-voltage workers be removed such that all linesworkers would be eligible for inclusion.
6.39 In both cases mentioned above we will need to revisit these occupations and determine how these may be impacted by the recommendations we make in our wider review of Tier 2.

Chapter 7: Summary and conclusions
99
6.7 Sources of data on pay
6.40 In 2012, (Migration Advisory Committee, 2012) we sought the best available sources of salary data by occupation. We concluded that for the majority of occupations the Annual Survey of Hours and Earnings (ASHE) provided the most comprehensive and consistent source for wage data. However, out of the 97 NQF6+ occupations we identified there remained 34 where alternative sources were identified. This included many public sector occupations – for instance, in healthcare where we were able to utilise the existing pay band structure within the NHS Agenda for Change. But it was also the case that we relied on evidence from the Bar Council for barristers and judges and from the Royal Institute of British Architects in the case of architects.
6.41 One sector we considered at length in 2012 was IT. A number of 4-digit occupations within IT are heavy users of both Tier 2 (General) and the intra-company transfer route. At the time, the ASHE salary data was not considered the best available and we opted instead for data produced by Incomes Data Services. This data is no longer available and we shall have to revisit this issue and carefully consider how best to evidence both wage levels and wage growth in the IT industry.
6.42 Responses to our call for evidence also suggested a number of alternative sources for pay data:
Sector-specific salary benchmark surveys: for instance, those carried out by organisations such as Mercer, Hay and Towers-Watson, used either as a direct substitute or in conjunction with other data sources. We were told these sources could provide more granularity around market rates of pay for specific jobs as well as by region. We were also told that some organisations make significant investments in assessing a number of comparable pay sources to determine their own pay-setting.
Making better use of existing data sources: the Tech Partnership told us that they have commissioned the Office for National Statistics (ONS) to provide a more detailed dataset on salaries in the IT sector broken down by region, age and industry. We are also aware of the potential to use pay data gained from trawling the web for data on vacancies posted online.
Reverting to updated pay data sets: in MAC (2012) we considered the use of the Destinations of Leavers from Higher Education (DLHE) survey to benchmark graduate salaries. At the time this was based on the previous occupational categorisation (SOC 2000), but this has since been updated to SOC 2010, thereby bringing it into line with our broader approach. We were told by Universities Scotland that this would remove concern over incompatibility with the ASHE.
Differentiating between public and private sector: the NUS told us that measures should be included to reflect the difference in public and

Analysis of Salary Thresholds
100
private sector roles, and by definition pay. We learned from the partner evidence that real differences do exist for some occupations. A similar point was raised by the higher education sector where Research Councils UK proposed that certain SOC codes within the research field be adapted to reflect private versus public sector salary levels It is important therefore that we understand such pay variation within occupational codes and job titles.
“Further, measures to reflect the constraints on salary levels experienced by public sector or regulated industries which aren’t necessarily [sic] to respond to the pay rates that market demand would indicate may also be helpful.”
National Grid response to MAC Call for evidence
Inappropriate pay measures: we were told by a number of higher education institutions (HEIs) that they do not operate on the basis of the current benchmark, the national teaching scales. It was suggested by Oxford University, Heriot-Watt amongst others that the Joint Negotiating Committee for Higher Education Staff (JNCHES) be used instead.
6.43 A number of partners also highlighted the need to take into consideration remuneration beyond base pay. Respondents from within the engineering sector suggested that the full compensation package, such as relocation benefits, be considered when looking at salary thresholds. An example was given of employees deployed to work on oil platforms who are eligible for additional compensation such as performance bonuses and field pay as industry standard practice. Consideration should be given to other assistance provided to new recruits such as accommodation and relocation allowances, even if paid directly by the firm rather than recompensed to the employee.
6.44 Once again, this area merits further attention to ensure that we arrive at an optimal set of data sources for determining pay benchmarks across all 4-digit occupations. We shall therefore continue to assess these alternative data sources with a view to making recommendations in our wider review.
6.8 Conclusions
6.45 This chapter has set out a number of issues that will require further consideration by the MAC during the course of the wider Tier 2 commission. We shall report on these in our wider review, to be delivered to the Government in December.
6.46 In particular, the proposal for a skills levy is bound up with the question around raising salary thresholds. Both would increase the cost for employers to hire skilled migrants from outside the EEA and most likely result in a decline in the use of migrant workers. Because we have been

Chapter 7: Summary and conclusions
101
asked to address the skills levy in the second part of our review of Tier 2, it is too early to advise fully on salary thresholds at this stage.
6.47 This chapter has also highlighted more pressing issues arising from the recent hitting of the Tier 2 limit. Lower paid occupations are being affected the most. These are often in the public sector, which may have consequences for delivery of public services. Similarly affected are graduate entry schemes, which by definition are generally at the lower end of the pay distribution. The Government may wish to consider temporary respite in these cases at least until the MAC has reported fully on Tier 2 in the wider review.


103
Chapter 7 Summary and conclusions
7.1 Introduction
7.1 The Government asked us to consider the economic rationale for and the impact on net migration of setting new minimum salary thresholds, with a focus on ensuring that Tier 2 migrants are not undercutting the resident labour force. We were asked to consider the impact of increasing the minimum salary thresholds as well as increasing the occupation-specific thresholds. Sections 7.2-7.4 below consider each of the above issues in turn. In Section 7.5 we discuss the further work required to answer the questions posed.
7.2 It is important to note that in this report we have not made any recommendations.
7.2 Economic rationale for setting new minimum salary thresholds
7.3 We looked at the salary distribution for Tier 2 migrants compared to all skilled workers in the UK labour market to consider whether there is any evidence of undercutting of resident workers. Our initial analysis does not provide much evidence of undercutting. However, this conclusion is tentative and we will be conducting more in-depth analysis for our December report to test this further.
7.4 As well as preventing undercutting, an increase in the minimum salary thresholds could also be justified if it puts upward pressure on wages in sectors which are currently relying on migrants to fill skills shortages. Without upward pressure on wages there is little incentive for more natives to enter these occupations and the reliance on migrant labour will be a permanent rather than temporary feature of these labour markets. An increase in the salary thresholds will likely contribute to the Government’s aim of reducing skilled immigration in the UK. Higher salary thresholds should reduce employer demand for skilled migrant labour and, all things being equal, reduce inflows of skilled migrants as well as their dependants under Tier 2.
7.5 In terms of the Government’s objective to reduce migration, the impact of increasing the salary thresholds is dependant on the reaction of business. If businesses choose to continue to hire migrants at a higher salary, the
Chapter 7 Summary and conclusions
Analysis of Salary Thresholds
104
impact will be reduced. The analysis below assumes no reaction by business and therefore could be a significant overestimate of the impact on numbers.
7.6 However, aside from helping the Government achieve its aim of reducing migration, a rise in the salary threshold would have a range of other economic impacts. If employers are unable to afford skilled Tier 2 labour and cannot source appropriate labour from within the UK or the European Economic Area (EEA), this could lead to bottlenecks constraining the growth of individual firms, particularly as the UK approaches full employment. To some extent this is already the case as the Tier 2 (General) limit has been reached in recent months, resulting in some employers being refused Certificates of Sponsorship.
7.7 Restricting Tier 2 inflows could also limit UK productivity growth because of the skill level of Tier 2 migrants. Skilled migrants contribute to productivity growth both through a compositional effect on the workforce (being more skilled than the average resident worker) and also through dynamic impacts which, although difficult to measure, help raise productivity across the board. These dynamic impacts arise as a result of the different set of skills, knowledge, experience and connections to other countries that skilled migrants bring which can lead to improvements in the way UK firms do business.
7.3 Increasing the minimum salary thresholds for all occupations
7.8 The original principles used to set the minimum threshold of £20,800 were relevant when the skill requirement was NQF3 and above. The current skill requirement is NQF6 and above. If the same principles applied to the current skill requirement this would imply a substantial rise in the salary threshold in the range of £31,000 (30th percentile) to £39,000 (the median).
7.9 There is little doubt that an immediate introduction of a salary threshold at this level would be strongly opposed by many employers and would cause serious problems in particular sectors, including the education and health sectors. It is important to note that the earnings of new hires are typically lower than that for employees generally. However, it should be noted that with the current prioritisation system in place under the limit on Tier 2 (General) this means the salary requirement for the RLMT route is presently within the £31,000 - £39,000 range already.
7.10 The £41,500 threshold for long-term intra-company transfers still seems appropriate and in line with the definition used within the GATS requirements. However, there may be a rationale for increasing this threshold if the Government’s aim is to reduce economic migration.
7.11 Evidence from partners was mixed as to whether pay is a suitable proxy for highly specialised skills or skills shortages. Whilst some said it was a good reflection of skill, others stated that pay tends to reflect age and experience and not necessarily skill. Also, a number of partners stated that

Chapter 7: Summary and conclusions
105
subdued wage growth generally over the past 5 years meant that an increasing number of workers are not being paid at levels that reflect their skill level. Further analysis is required to consider the options for focusing the route on highly specialised experts and individuals filling skills shortages. This will include consideration of whether pay is the best reflection of skill and skill shortages, or if there are alternative criteria to consider.
7.12 Setting the salary threshold level to the 10th percentile for all occupations skilled to NQF6 would mean a minimum threshold of £23,000. To illustrate the impact this would have on Certificate of Sponsorship (CoS) applications, the analysis shows that increasing the flat threshold to £25,000 would affect 7 per cent (5,691) of all Tier 2 applications, 20 per cent (4,528) of in-country applications for Tier 2 (General) and 7 per cent (1,150) of out-of-country applications based on the volumes experienced in the year to end March 2015. However, this threshold would have a negligible impact on both the short-term and long-term intra-company transfer routes.
7.13 Setting the salary threshold level at the median earnings for all occupations skilled to NQF6 and above would mean a minimum threshold of £39,000. As an illustration, a salary threshold of £40,000 would affect 44 per cent of applications across Tier 2 (35,181 applications). For Tier 2 (General) it would affect 65 per cent (14,545) of in-country applications and 48 per cent (7,737) of out-of-country applications. For the short-term intra-company transfer route it would affect 20 per cent (203) of in-country applications and 55 per cent (12,696) of out-of country applications, with no impact on the long-term intra-company transfer route.
Table 7.1: Impact on CoS of a change in the minimum salary threshold of £25k or £40k (year ending March 2015)
Tier 2 (General) Tier 2 (Intra-Company Transfer)-short term
TOTAL
In-Country
% Out of country
% In-Country
% Out of country
% In-Country
% Out of country
%
£25k 4,528 20 1,150 7 - 0 13 0 4,528 16 1,163 2
£40k 14,545 65 7,737 48 203 20 12,696 55 14,748 51 20,433 41
Source: Home Office Management Information, year ending March 2015
7.14 In order to begin to have an impact on the long-term intra-company transfer route, the flat salary threshold would have to be raised to £50k, where the threshold would affect 27 per cent of long-term applications, including 23 per cent (1,356) of in-country applications and 28 per cent (3,152) of out-of-country applications, again based on volumes over the past year.
7.15 There was significant concern amongst partners over the impact on business of an increase in salary thresholds. Responses included the potential increase in the cost of their services, the increased likelihood of business off-shoring their services and the impact on specific regions or

Analysis of Salary Thresholds
106
types of firm (e.g. start-ups). Partners also raised concerns that there may be a disproportionate impact on sectors with nationally agreed pay scales, particularly in the public sector, where all employees, regardless of nationality, are paid the same.
7.16 By their very nature, new entrants would be most impacted by any increase in the minimum salary thresholds. A number of partners raised concerns about the impact on graduate schemes and international students if there was an increase in the minimum threshold. An increase in the threshold to £25,000 would affect 28 per cent (1,290) of all applications through Tier 2 (General) whilst an increase in the threshold to £40,000 would affect 77 per cent (3,590) of new entrants through Tier 2 (General) and 57 per cent (1,954) of new entrants through the short-term intra-company transfer route.
7.4 Increasing the occupational salary thresholds for each occupation
7.17 The Government asked the MAC to assess the impact of increasing the occupation-specific thresholds for experienced workers from the 25th percentile to the 50th or 75th. Excluding occupations that are currently based on nationally agreed pay scales within the health and education sector, and using age as a proxy for new entrants, the number of applications affected by a 50th and 75th percentile threshold can be assessed. An occupation-specific threshold set at the 50th percentile (median) would affect 40 per cent (25,386) of applications across Tier 2. For Tier 2 (General) it would affect 61 per cent (8,853) of in-country applications and 41 per cent (4,406) of out-of-country applications. For the short-term intra-company transfer route it would affect 20 per cent (177) of in-country applications and 55 per cent (10,872) of out-of-country applications. Only 6 per cent (1,078) of in-country long-term intra-company transfer applications would be affected.
7.18 In comparison, an occupation-specific threshold set at the 75th percentile for experienced workers would affect 60 per cent (37,360) of all Tier 2 applications. The most significant impact would be on Tier 2 (General) where 76 percent (10,966) of in-country applications would be affected and 59 per cent (6,375) of out-of-country applications affected.

Chapter 7: Summary and conclusions
107
Table 7.2: Impact on CoS volumes of a change in the occupation-specific salary threshold to the median or 75th percentile for experienced workers, for all occupations currently based on percentile thresholds (year ending March 2015)
Tier 2 (General) Tier 2 (Intra-Company Transfer)- short term
Tier 2 (Intra-Company Transfer)- long term
TOTAL
In-Country
% Out of country
% In-Country
% Out of country
% In-Country
% Out of country
% In-Country
% Out of country
%
50th 8,853 61 4,406 41 177 20 10,872 55 323 6 755 7 9,353 44 16,033 39
75th 10,966 76 6,375 59 309 34 13,401 67 2,096 36 4,214 39 13,371 63 23,990 58
Source: Home Office Management Information, year ending March 2015. Excludes SOC codes: 2211, 2212, 2213, 2214, 2215, 2217, 2218, 2219, 2221, 2222, 2223, 2229, 2231, 2232, 2311, 2312, 2314, 2315, 2316, 2442, and 3213.
7.19 Looking at occupations which would be most impacted by a median salary threshold, Natural and Social Science Professionals n.e.c would be the most affected within the RLMT route, with 2,800 applications affected (79 per cent of applications within that occupation). For short-term intra-company transfers, the IT sector would be the most affected, with 5,169 Programmers and software development professionals being affected (68 per cent of applications within that occupation).
7.20 The Government also asked the MAC to assess the impact of increasing the occupation-specific thresholds for new entrants from the 10th to the 25th or 50th percentile. The analysis shows that at the 25th percentile, 45 per cent (3,524) of new entrant Tier 2 applications would be affected. For Tier 2 (General), 61 per cent (1,528) of in-country applications would be affected and 33 per cent (497) of out-of-country applications would be affected. For the short-term intra-company transfer route, this would affect 16 per cent (17) of in-country applications and 45 per cent (1,481) of out-of-country applications. There would be negligible impact on the long-term intra-company transfer route. A salary threshold at the 50th percentile would affect 62 per cent (4,871) of new entrant applications, including 58 per cent (870) of out-of-country applications for Tier 2 (General).
Table 7.3: Impact on CoS volumes of a change in the occupation-specific salary threshold to the 25th percentile or median for new entrants, for all occupations currently based on percentile thresholds (year ending March 2015) Tier 2 (General) Tier 2 (Intra-Company
Transfer)- short term Tier 2 (Intra-Company Transfer)- long term
TOTAL
In-Country
% Out of country
% In-Country
% Out of country
% In-Country
% Out of country
% In-Country
% Out of country
%
25th 1,528 61 497 33 17 16 1,481 45 0 0 1 0 1,545 59 1,979 38
50th 2,027 81 870 58 30 29 1,930 58 1 6 13 3 2,058 79 2,813 54
Source: Home Office Management Information, year ending March 2015. Excludes SOC codes: 2211, 2212, 2213, 2214, 2215, 2217, 2218, 2219, 2221, 2222, 2223, 2229, 2231, 2232, 2311, 2312, 2314, 2315, 2316, 2442, and 3213.
7.21 Currently a number of occupations use alternative sources of data in lieu of ASHE to act as salary thresholds. In many cases this data provides a more accurate representation of the salaries being paid to workers in these occupations. However, the data currently being used is out of date

Analysis of Salary Thresholds
108
for several occupations in the education sector, whilst the data is no longer produced for certain occupations in the IT sector which relied on the Income Data Services report. In the wider Tier 2 review, due consideration will be given to the viability of some of the current data sources, and the option to use others where possible.
7.22 Another point for further consideration is that under the current Codes of Practice, new entrants are expected to meet the threshold for experienced workers within three years in order to qualify for renewal. Evidence provided to us suggests that this can currently be a difficult criterion to meet. Any rise in the experienced worker salary threshold, be it to the 50th or 75th percentile, needs to consider the effect on new entrants’ ability to reach the threshold within three years. This will be explored in further detail in the wider review of Tier 2.
7.5 Further work
7.23 There are a number of issues that require our further consideration during the course of the wider Tier 2 commission. We shall report on these in December.
7.24 In particular, the proposal for a skills levy is bound up with the question around raising salary thresholds. Both would increase the cost for employers to hire skilled migrants from outside the EEA and most likely result in a decline in the use of migrant workers. Because we have been asked to address the skills levy in the second part of our review of Tier 2, it is too early to advise fully on salary thresholds at this stage.
7.25 There are also more pressing issues arising from the recent hitting of the Tier 2 limit. Lower paid occupations are being affected the most. These are often in the public sector, which may have consequences for delivery of public services. Similarly affected are graduate entry schemes, which by definition are generally at the lower end of the pay distribution. The Government may wish to consider temporary respite in these cases at least until we have reported fully on Tier 2 in December.
7.26 We were asked to consider the regional impact of our findings. From initial analysis, it was found that, with the clear exception of London and to a lesser extent the South East, the variation in pay between regions is relatively small. We shall continue to assess the evidence on variations in regional pay as part of our wider Tier 2 review. However, for now we are content that there are no major regional variations that may require more urgent attention, particularly as the 25th percentile allows sufficient consideration of pay levels outside of London.
7.27 We will need to revisit the list of occupations skilled to NQF6 and above, as well as the creative and legacy occupations that are not skilled to NQF6 but are currently allowed through Tier 2.
7.28 Finally, responses from our initial call for evidence suggested a number of alternative sources for pay data that could be used to set the pay

Chapter 7: Summary and conclusions
109
thresholds. These included using sector-specific salary benchmark surveys, making better use of existing data sources and differentiating between public and private sector pay. Once again, this area merits further attention to ensure that the optimal set of data sources is used for determining pay thresholds. We will continue to assess these alternative data sources with a view to making recommendations in our December report.
7.6 Conclusions
7.29 We prefer occupation specific thresholds, based on the nth percentile for each occupation, rather than flat thresholds which apply across all occupations. Occupation specific thresholds, unlike flat thresholds, take into account the different distributions of pay within each occupation and do not prevent certain occupations from being able to recruit. However, there is also a good case for increasing the overall minimum threshold of £20,800 for Tier 2 (General) as this was calculated in 2009 when the skill requirement was NQF3 and it is now NQF6.
7.30 However, we would urge caution in making any significant changes to the salary thresholds until the wider review of Tier 2 has been completed in December 2015. The salary thresholds should not be considered in isolation as they interact with the other proposals within the commission, not least the proposed skills levy. In addition, the tight timetable for this report means that we have not had sufficient time to carry out the analysis required or fully consider the extensive evidence provided by our partners. Therefore, at this stage, we draw no conclusions about the impact of raising the salary thresholds.

111
Annex A Consultation
A.1 List of organisations that responded to the call for evidence who did not request anonymity
Academy of Medical Sciences
Aeropeople
AGCAS
Airbus UK
Almac Group NI
Amey
Amplifon
Andrew Holland
Aon plc
Asda
Association for Consultancy and Engineering
Association of British Orchestras
Association of School and College Leaders
Association of the British Pharmaceutical Industry
Balfour Beatty
Bangor University
Barking, Havering and Redbridge University Hospital NHS Trust
BCUHB (Wales NHS)
Annex A Consultation

Analysis of Salary Thresholds
112
BIS
Boots UK
British Film Commission
British Medical Association
British Society of Cinematographers
British Veterinary Association
Campaign for Science and Engineering
Care England
Career Interactive
CBI
Central Manchester University Hospitals NHS Foundation
Centrica plc
China Telecom
China Unicom
CMS Cameron McKenna LLP
Cranfield University
Deloitte
Department of Health
Dr Ginne Bonnie
Durham University
EEF
Embassy of Japan
Ernst & Young LLP
Four Season Health Care
Fragomen LLP on behalf of SAP (UK) Ltd
Great Ormond Street Hospital for Children NHS Foundation Trust
Ground Forum

Annex A: Consultation
113
Guy’s and St Thomas’ NHS Foundation Trust
HCL Workforce Solutions
Heriot-Watt University
Hillingdon hospitals NHS Foundation trust
Horizon Nuclear Power
Hospital of St John and Elizabeth
Hutchinson Care Homes
Infosys
Institute of Directors
IPSE
James Wallace-Dunlop
Japanese Chambers of Commerce
Japanese Culinary Academy UK
JETRO
Jewish Care
Kings College Hospital NHS Foundation
Kingsley Napley LLP
Laura Devine Solicitors
Law Society of Scotland
Lloyds Banking Group
London Ambulance Service NHS Trust
London First
M K Hayat
Magrath LLP
Mathworks
Medivet
Migration Watch

Analysis of Salary Thresholds
114
Million+
MWH UK Ltd
NASSCOM
National Grid
National Union Students
Newcastle University
Newland Chase
NHS employers
Nissan Motor Manufacturing UK
North Middlesex University Hospital
Northern Ireland Strategic Migration Partnership
Nottingham Trent University
Oxford Brookes University
Penningtons Manches LLP
Peter Kellard
Pharmacy Schools Council
Price Waterhouse Cooper
Recruitment Employment Confederation
Red House Ashtead ltd
Research Councils UK
Rolls Royce plc
Royal Academy of Engineering
Royal College Nursing
Royal College of Paediatrics and Child Health
Royal college of Physicians
Royal Free London NHS Foundation Trust
Royal Institute of British Architects

Annex A: Consultation
115
Royal National Orthopaedic Hospital NHS Trust
Royal Orthopaedic Hospital NHS Foundation Trust
Royal Pharmaceutical Society
Royal Society
Russell Group
Scottish Government - Health Workforce Directorate
Scottish Government - Minister for Europe and International Development
Shelford Group
Siemens plc
Society of Biology
Society of London Theatre
Society of Practising Veterinary Surgeons
Squire Patton Boggs UK LLP
Talent Scotland
TCS
Tech Partnership
Techcity UK
TES Electronic
The academy of Medical Sciences
Thorogood
Total EP UK
Toyota UK
TUC
Ubisoft
UCLH NHS foundation trust
UK Power Networks
UK Screen

Analysis of Salary Thresholds
116
Ukie
Unison
Universities and Colleges Employers Association
Universities Scotland
Universities UK
University of Cambridge
University of Derby
University of Edinburgh
University of Essex
University of Exeter
University of Huddersfield
University of Leeds
University of Liverpool
University of Manchester
University of Oxford
University of Strathclyde
University of Surrey
Wellcome Trust
Welsh Government
Wright Hassall LLP
A.2 Indicative List of organisations we met with/attended our forums
Balfour Beatty
British Medical Association
Centre for Workforce Intelligence
Department of Health

Annex A: Consultation
117
Department for Works and Pensions
Deloitte LLP
Kingsley Napley LLP
Laura Devine Solicitors
Pennington Manches LLP
NHS Employers
Royal College of Nursing
ScotlandIS
Scottish Minister
Scottish Government
Tata Consultancy Services
TUC
UKIE
Unison
Unite


119
Annex B Salary thresholds for occupations skilled to NQF6+
Salary thresholds for occupations skilled to NQF6+ taken from the Codes of Practice for Skilled Workers, Home Office, 2015.
SOC 2010 Occupation 10th 25th Source
1115 Chief executives and senior officials 35,300 52,900
1116 Elected officers and representatives 30,700 49,500 Based on 3 digit SOC Code
1121 Production managers and directors in manufacturing
20,800 31,000
1122 Production managers and directors in construction
20,800 30,100
1123 Production managers and directors in mining and energy
20,800 37,600
1131 Financial managers and directors 26,700 40,400
1132 Marketing and sales directors 33,300 47,900
1133 Purchasing managers and directors 30,000 36,600
1134 Advertising and public relations directors
28,300 46,000 Based on 3 digit SOC Code and 2013 ASHE
1135 Human resource managers and directors
27,000 35,000
1136 Information technology and telecommunications directors
32,300 75,500 Income Data Services
1139 Functional managers and directors n.e.c.
24,100 35,100
1150 Financial institution managers and directors
26,600 35,800
1161 Managers and directors in transport and distribution
23,200 29,000
1172 Senior police officers 50,800 54,000 Based on 2013 ASHE
1173 Senior officers in fire, ambulance, prison and related services
37,900 37,900
1181 Health services and public health managers and directors
26,700 35,500
1184 Social services managers and directors
26,700 35,500
2111 Chemical scientists 21,000 27,200 Evidence from partners who responded to the Migration Advisory Committee in 2011 uplifted based on national changes in earnings.
2112 Biological scientists and biochemists
21,000 27,200
2113 Physical scientists 21,000 27,200
2114 Social and humanities scientists 21,000 27,200
2119 Natural and social science professionals n.e.c.
21,000 27,200
2121 Civil engineers 22,800 30,000
Annex B Salary thresholds for occupations skilled to NQF6+

Analysis of Salary Thresholds
120
Salary thresholds for occupations skilled to NQF6+ taken from the Codes of Practice for Skilled Workers, Home Office, 2015.
2122 Mechanical engineers 27,400 32,900 Based on 2013 ASHE
2123 Electrical engineers 24,800 35,600 * Apart from power system engineer, control engineer or protection engineer in the electricity transmission and distribution industry which is set at £32,500 based on the National Grid Submission to MAC in 2011
2124 Electronics engineers 25,200 31,300 Based on 3 digit SOC Code
2126 Design and development engineers 25,300 32,100
2127 Production and process engineers 22,900 30,000
2129 Engineering professionals n.e.c. 26,100 32,000
2133 IT specialist managers 26,500 40,300 Incomes Data Services
2134 IT project and programme managers
28,200 40,600
2135 IT business analysts, architects and systems designers
25,800 33,000
2136 Programmers and software development professionals
24,000 31,100
2137 Web design and development professionals
20,800 23,400
2139 Information technology and telecommunications professionals
20,800 29,900
2141 Conservation professionals 20,800 22,800
2142 Environment professionals 20,800 24,300
2150 Research and development managers
27,700 34,800 Based on 2013 ASHE
2211 Medical practitioners NHS Agenda for Change 2014
2212 Psychologists
2213 Pharmacists
2214 Ophthalmic opticians
2215 Dental practitioners
2216 Veterinarians 25,200 35,800
2217 Medical radiographers NHS Agenda for Change 2014
2218 Podiatrists
2219 Health professionals n.e.c.
2221 Physiotherapists
2222 Occupational therapists
2223 Speech and language therapists
2229 Therapy professionals n.e.c.
2231 Nurses
2232 Midwives
2311 Higher education teaching professionals
Teachers' national pay scales
2312 Further education teaching professionals
2314 Secondary education teaching professionals
2315 Primary and nursery education teaching professionals
2316 Special needs education teaching professionals

Annex B: Salary thresholds occupations skilled to NQF6+
121
Salary thresholds for occupations skilled to NQF6+ taken from the Codes of Practice for Skilled Workers, Home Office, 2015.
2317 Senior professionals of educational establishments
26,600 39,500
2318 Education advisers and school inspectors
20,800 24,600
2319 Teaching and other educational professionals n.e.c.
20,800 20,800
2412 Barristers and judges 20,800 31,900 Evidence provided by the Bar Council in 2011 uplifted based on national changes in earnings.
2413 Solicitors 24,700 32,000
2419 Legal professionals n.e.c. 33,300 44,100
2421 Chartered and certified accountants 21,600 28,600
2423 Management consultants and business analysts
23,000 30,000
2424 Business and financial project management professionals
24,100 33,300
2425 Actuaries, economists and statisticians
26,500 34,700
2426 Business and related research professionals
20,800 26,500
2429 Business, research and administrative professionals n.e.c.
24,300 29,400
2431 Architects Evidence provided by the Royal Institute of British Architects in 2011 uplifted based on national changes in earnings.
2432 Town planning officers 22,800 26,700
2433 Quantity surveyors 23,400 30,400
2434 Chartered surveyors 22,000 28,000
2436 Construction project managers and related professionals
23,900 25,500 Based on 2013 ASHE
2442 Social workers NHS Agenda for Change 2014
2443 Probation officers 20,800 29,300
2449 Welfare professionals n.e.c. 20,800 23,100
2451 Librarians 20,800 20,800
2452 Archivists and curators 20,800 20,800
2461 Quality control and planning engineers
23,000 29,400
2462 Quality assurance and regulatory professionals
24,300 30,400
2463 Environmental health professionals 23,800 29,100 Based on 2013 ASHE
2471 Journalists, newspaper and periodical editors
20,800 25,100
2472 Public relations professionals 20,800 23,000
2473 Advertising accounts managers and creative directors
22,800 28,300
3213 Paramedics NHS Agenda for Change 2014
3411* Artists 20,800 21,500 Based on 2013 ASHE
3412* Authors, writers 20,800 22,800
3413* Actors, entertainers 20,800 24,200
3414* Dancers and choreographers 20,800 24,200
3422* Product, clothing and related 20,800 23,000

Analysis of Salary Thresholds
122
Salary thresholds for occupations skilled to NQF6+ taken from the Codes of Practice for Skilled Workers, Home Office, 2015.
designers
3415 Musicians 20,800 24,200 Based on 3 digit SOC code
3416 Arts officers, producers and directors
24,600 30,500
3512 Aircraft pilots and flight engineers 33,100 69,600
3532 Brokers 22,200 40,500 Based on 2013 ASHE
3534 Finance and investment analysts and advisers
21,400 26,900
3535 Taxation experts 20,800 33,900
3538 Financial accounts managers 22,200 27,500
3545 Sales accounts and business development managers
25,000 32,500
5249* Electrical and electronic trades not elsewhere classified
32,000 32,000 LE2-equivaltent line workers only. Evidence provided to the MAC in 2014 through the partial review of the shortage occupation list
5434* Chefs 15,300 15,300 £29,570 for skilled chefs on Shortage Occupation List
Notes: Those in bold and italics reflect occupations that are not currently based on the Annual Survey of Hours and Earnings. *- reflects occupations not skilled to NQF6. See Home Office Codes of Practice for other sources used. X= unreliable. Two occupations, namely SOC 1171: Officers in armed forces and SOC: 2444 Clergy have been excluded from this table despite meeting the qualification standard. This is due to ineligibility for the Tier 2: General and Intra-Company Transfer routes under the current 2015 Codes of Practice. Source: Gross Annual Pay for Full Time Employee Jobs, UK. Annual Survey of Hours and Earnings, Office for National Statistics, 2014 provisional results. Available here: http://www.ons.gov.uk/ons/publications/re-reference-tables.html?edition=tcm%3A77-337425 Table 14.7a.

123
Annex C Salary distributions for individual occupations
C.1 Introduction
C.1 This annex presents the salary distributions for selected high-volume occupations under Tier 2, in comparison to the ASHE salary distributions for the same occupation across the UK labour market. There are five sub-sections to this Annex:
Salary distributions for Tier 2 (General) compared with ASHE for high usage occupations.
Salary distribution for Tier 2 (General) new entrants and experienced workers, compared with ASHE new hires for high usage occupations.
Salary distributions for Tier 2 (Intra-Company Transfers) compared with ASHE for high usage occupations.
Age distributions for Tier 2 (General) compared with ASHE for high usage occupations, and accompanying salary distributions for key age groups.
Tables representing annual salaries at the nth percentile, corresponding to figures presented in Chapter 3.
C.2 In each chart, the red line shows the current threshold at the 25th percentile for each occupation (with the exception of occupations for which salaries are based on national pay scales, such as healthcare or teaching occupations). A black dashed line is used to identify the higher flat threshold of £41,500 for long term ICTs.
Annex C Salary distributions for individual occupations

Analysis of Salary Thresholds
124
C.2 Salary distributions for Tier 2 General (RLMT and SOL) and ASHE for SOC codes with the highest usage.
C.3 The vertical red line on each graph represents the point of the 25th percentile. Figures with nothing to represent the 25th percentile are those occupations where thresholds are based on national pay scales.
Figure C 2.1: Salary distribution for natural and social science professionals (2119) for the UK and Tier 2 (General)
Figure C 2.2: Salary distribution for design and development engineers (2126) for the UK and Tier 2 (General)

Annex C: Salary distributions for individual occupations
125
Figure C 2.3: Salary distribution for IT business analysts, architects and systems designers (2135) for the UK and Tier 2 (General)
Figure C 2.4: Salary distribution for programmers and software development professionals (2136) for the UK and Tier 2 (General)

Analysis of Salary Thresholds
126
Figure C 2.5: Salary distribution for medical practitioners (2211) for the UK and Tier 2 (General)
Figure C 2.6: Salary distribution for nurses (2231) for the UK and Tier 2 (General)

Annex C: Salary distributions for individual occupations
127
Figure C 2.7: Salary distribution for management consultants and business analysts (2423) for the UK and Tier 2 (General)
Figure C 2.8: Salary distribution for finance and investment analysts and advisors (3534) for the UK and Tier 2 (General)

Analysis of Salary Thresholds
128
C.3 Salary distributions for Tier 2 General (RLMT and SOL) new entrants and experienced workers compared to ASHE new hires in high usage occupations
Figure C 3.1: Salary distribution for natural and social science professionals (2119) for the UK and Tier 2 (General)
Figure C 3.2: Salary distribution for design and development engineers (2126) for the UK and Tier 2 (General)

Annex C: Salary distributions for individual occupations
129
Figure C 3.3: Salary distribution for IT business analysts, architects and systems designers (2135) for the UK and Tier 2 (General)
Figure C 3.4: Salary distribution for programmers and software development professionals (2136) for the UK and Tier 2 (General)

Analysis of Salary Thresholds
130
Figure C 3.5 Salary distribution for medical practitioners (2211) for the UK and Tier 2 (General)
Figure C 3.6 Salary distribution for nurses (2231) for the UK and Tier 2 (General)
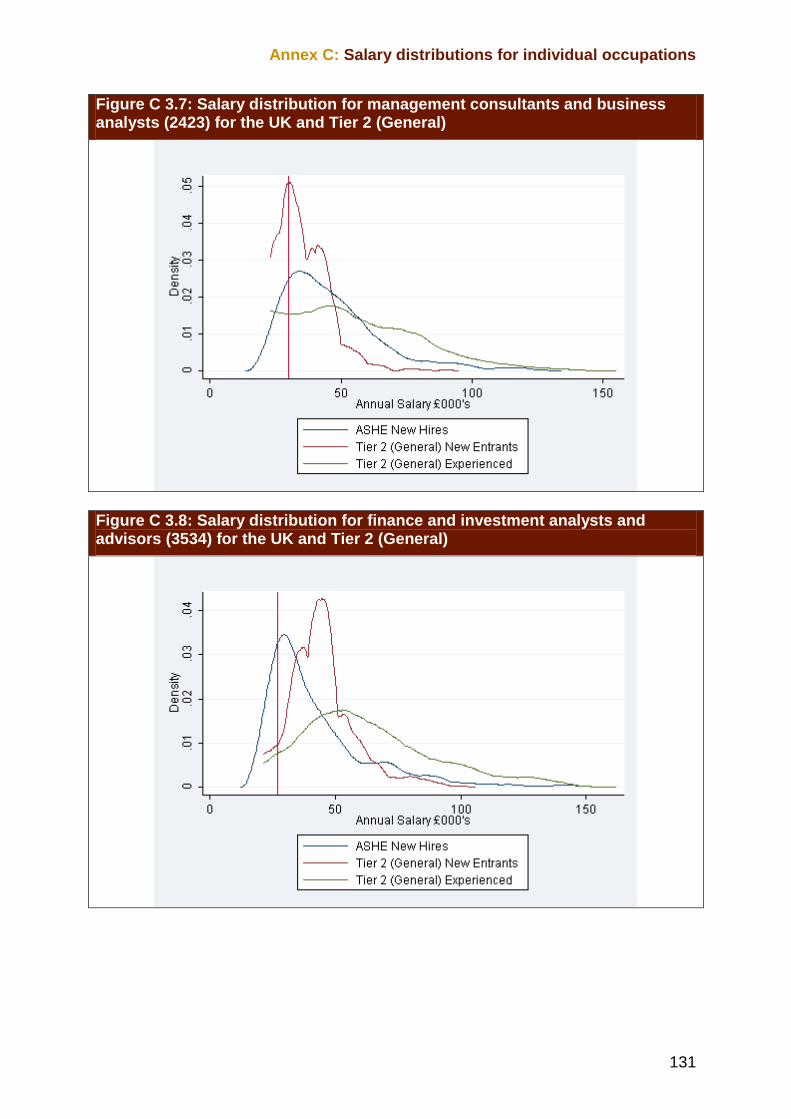
Annex C: Salary distributions for individual occupations
131
Figure C 3.7: Salary distribution for management consultants and business analysts (2423) for the UK and Tier 2 (General)
Figure C 3.8: Salary distribution for finance and investment analysts and advisors (3534) for the UK and Tier 2 (General)

Analysis of Salary Thresholds
132
C.4 Salary distributions for Tier 2 (Intra-Company Transfers) for high usage occupations.
C.4 The red vertical line indicates the 25th percentile occupational threshold, and the black dashed line marks the overall minimum threshold of £41,500 for long term ICTs.
Figure C 4.1: Salary distributions for chief executives and senior officials (1115) for the UK and Tier 2 ICTs
Figure C 4.2: Salary distributions for marketing and sales directors (1132) for the UK and Tier 2 ICTs

Annex C: Salary distributions for individual occupations
133
Figure C 4.3: Salary distributions for design and development engineers (2126) for the UK and Tier 2 ICTs
Figure C 4.4: Salary distributions for electrical engineers (2133) for the UK and Tier 2 ICTs
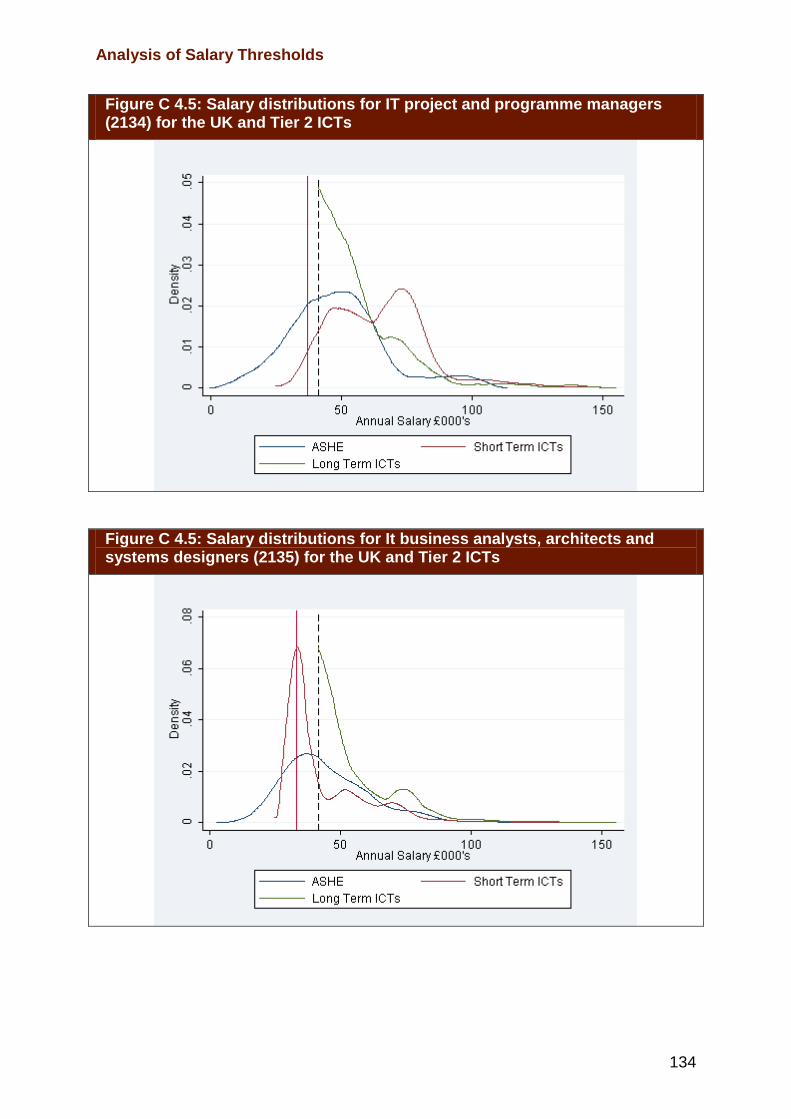
Analysis of Salary Thresholds
134
Figure C 4.5: Salary distributions for IT project and programme managers (2134) for the UK and Tier 2 ICTs
Figure C 4.5: Salary distributions for It business analysts, architects and systems designers (2135) for the UK and Tier 2 ICTs

Annex C: Salary distributions for individual occupations
135
Figure C 4.6: Salary distributions for programmers and software development professionals (2136) for the UK and Tier 2 ICTs
Figure C 4.7: Salary distributions for web design and development professionals (2137) for the UK and Tier 2 ICTs

Analysis of Salary Thresholds
136
Figure C 4.8:Salary distributions for information technology and telecommunications professionals (2139) for the UK and Tier 2 ICTs
Figure C 4.9: Salary distributions for chartered and certified accountants (2421) for the UK and Tier 2 ICTs

Annex C: Salary distributions for individual occupations
137
Figure C 4.10: Salary distributions for consultants, actuaries, economists (2423) for the UK and Tier 2 ICTs
Figure C 4.11: Salary distributions for finance and investment analysts and advisors (3534) for the UK and Tier 2 ICTs
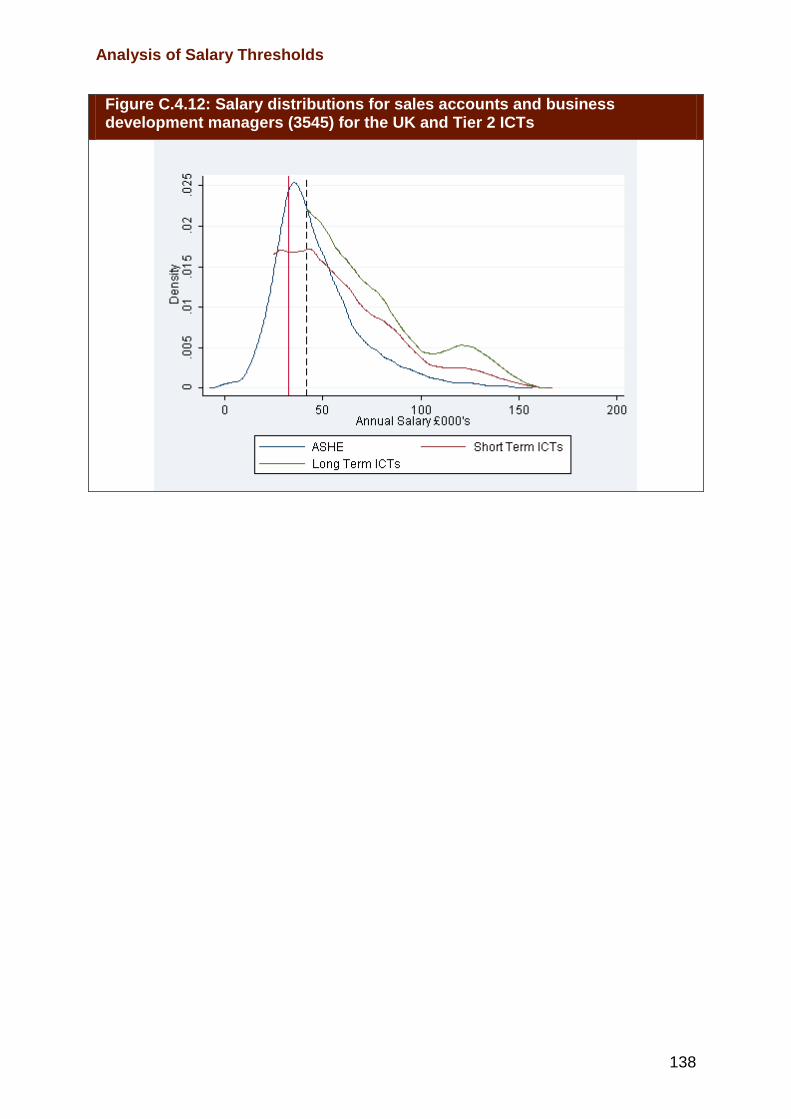
Analysis of Salary Thresholds
138
Figure C.4.12: Salary distributions for sales accounts and business development managers (3545) for the UK and Tier 2 ICTs

Annex C: Salary distributions for individual occupations
139
C.5 Age distributions for Tier 2 (General) and the UK for high usage occupations, and salary distributions for key age groups
Figure C.5.1a Age distribution for natural and social science professionals (2119) for the UK and Tier 2 (General)
Figure C 5.1b: Salary distribution for natural and social science professionals (2119) aged 26-35 for the UK and Tier 2 (General)
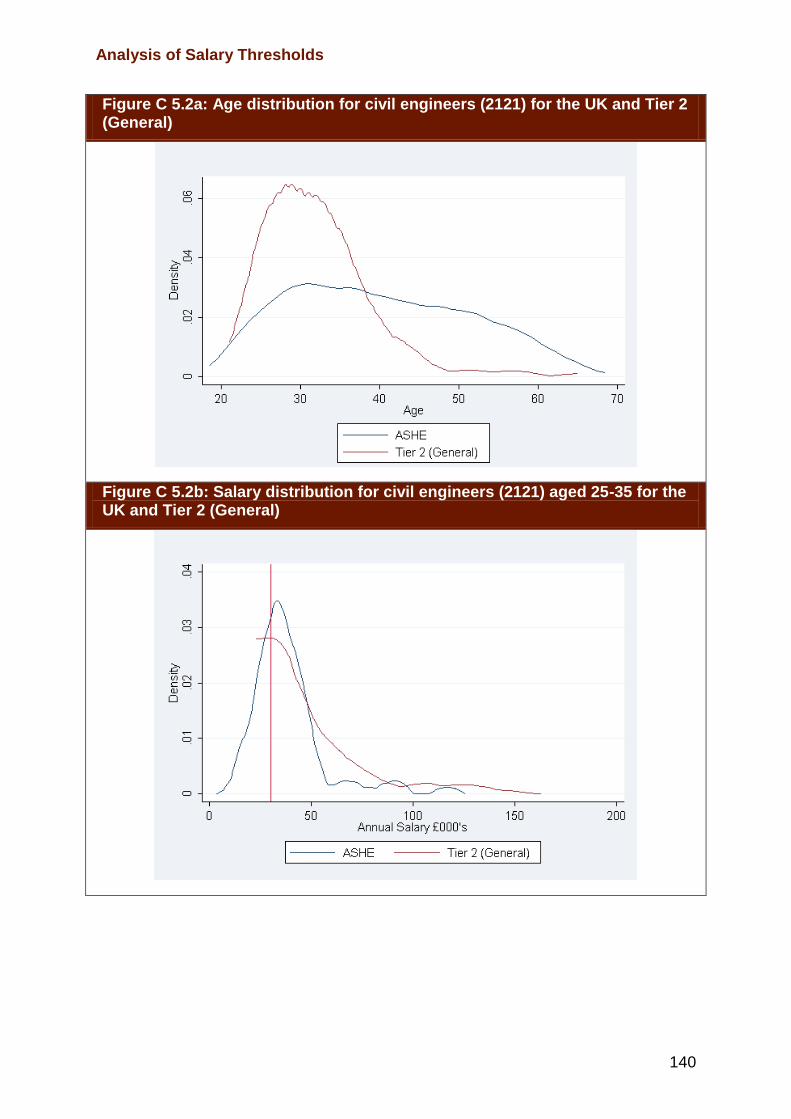
Analysis of Salary Thresholds
140
Figure C 5.2a: Age distribution for civil engineers (2121) for the UK and Tier 2 (General)
Figure C 5.2b: Salary distribution for civil engineers (2121) aged 25-35 for the UK and Tier 2 (General)

Annex C: Salary distributions for individual occupations
141
Figure C 5.3a: Age distributions for design and development engineers (2126) for the UK and Tier 2 (General)
Figure C 5.3b: Salary distribution for design and development engineers (2126) aged 26-35 for the UK and Tier 2 (General

Analysis of Salary Thresholds
142
Figure C 5.4a:Age distributions for programmers and software development professionals (2136) for the UK and Tier 2 (General)
Figure C 5.4b: Salary distribution for programmers and software development professionals (2136) aged 26-35 for the UK and Tier 2 (General)

Annex C: Salary distributions for individual occupations
143
Figure C 5.5a: Age distributions for medical practitioners (2211) for the UK and Tier 2 (General)
Figure C 5.5b: Salary distributions for medical practitioners (2211) aged 31-40 for the UK and Tier 2 (General)

Analysis of Salary Thresholds
144
Figure C 5.6a: Age distributions for nurses (2231) for the UK and Tier 2 (General)
Figure C 5.6b: Salary distribution for nurses (2231) aged 26-35 for the UK and Tier 2 (General)

Annex C: Salary distributions for individual occupations
145
Figure C 5.7a: Age distributions for secondary education teaching professionals (2314) for the UK and Tier 2 (General)
Figure C 5.7b: Salary distribution for secondary education teaching professionals (2314) aged 26-35 for the UK and Tier 2 (General)

Analysis of Salary Thresholds
146
Figure C 5.8a: Age distributions for management consultants and business managers (2423) for the UK and Tier 2 (General)
Figure C 5.8b: Salary distribution for management consultants and business managers (2423) aged 26-35 for the UK and Tier 2 (General)

Annex C: Salary distributions for individual occupations
147
Figure C 5.9a: Age distributions for sales accounts and business development managers (3545) for the UK and Tier 2 (General)
Figure C 5.9b: Salary distribution for sales accounts and business development managers (3545) aged 26-35 for the UK and Tier 2 (General)

Analysis of Salary Thresholds
148
Figure C 5.10a: Age distributions for chefs (5434) for the UK and Tier 2 (General)
Figure C 5.10b: Salary distributions for chefs (5434) aged 31-40 for the UK and Tier 2 (General)

Annex C: Salary distributions for individual occupations
149
C.6 Age distributions for Tier 2 (Intra-Company Transfers) and the UK for high usage occupations, and salary distributions for key age groups
Figure C 6.1a: Age distributions for chief executives and senior officials (1115) for the UK and Tier 2 ICTs
Figure C 6.1b: Salary distributions for chief executives and senior officials (1115) aged 41-50 for the UK and Tier 2 ICTs

Analysis of Salary Thresholds
150
Figure C 6.2a: Age distributions for marketing and sales directors (1132) for the UK and Tier 2 ICTs
Figure C 6.2b: Salary distributions for marketing and sales directors (1132) for the UK aged 26-35 for the UK and Tier 2 ICTs

Annex C: Salary distributions for individual occupations
151
Figure C 6.3a: Age distributions for IT specialist managers (2133) for the UK and Tier 2 ICTs
Figure C 6.3b: Salary distributions for IT specialist managers (2133) aged 31-40 for the UK and Tier 2 ICTs

Analysis of Salary Thresholds
152
Figure C 6.4a: Age distributions for IT project and programme managers (2134) for the UK and Tier 2 ICTs
Figure C 6.4b: Salary distribution for IT project programme managers (2134) aged 36-45 for the UK and Tier 2 ICTs

Annex C: Salary distributions for individual occupations
153
Figure C 6.5a: Age distributions for IT business analysts, architects and systems designers (2135) for the UK and Tier 2 ICTs
Figure C 6.5b: Salary distribution for IT business analysts, architects and systems designers (2135) aged 31-40 for the UK and Tier 2 ICTs

Analysis of Salary Thresholds
154
Figure C 6.6a: Age distributions for programmers and software development professionals (2136) for the UK and Tier 2 ICTs
Figure C 6.6b: Salary distribution for programmers and software development professionals (2136) aged 26-35 for the UK and Tier 2 ICTs

Annex C: Salary distributions for individual occupations
155
Figure C 6.7a: Age distributions for information technology and telecommunications professionals (2139) for the UK and Tier 2 ICTs
Figure C 6.7b: Salary distribution for information and technology and telecommunications professionals (2139) aged 26-35 for the UK and Tier 2 ICTs

Analysis of Salary Thresholds
156
Figure C 6.8a: Age distributions for management consultants and business analysts (2423) for the UK and Tier 2 ICTs
Figure C 6.8b: Salary distributions for management consultants and business analysts (2423) aged 26-35 for the UK and Tier 2 ICTs

Annex C: Salary distributions for individual occupations
157
Figure C 6.9a: Age distributions for finance and investment analysts and advisors (3534) for the UK and Tier 2 ICTs
Figure C 6.9b: Salary distributions for finance and investment analysts and advisors (3534) aged 26-35 for the UK and Tier 2 ICTs

Analysis of Salary Thresholds
158
Figure C 6.10a: Age distributions for sales accounts and business development managers (3545) for the UK and Tier 2 ICTs
Figure C 6.10b: Salary distributions for sales accounts and business development managers (3545) aged 26-40 for the UK and Tier 2 ICTs
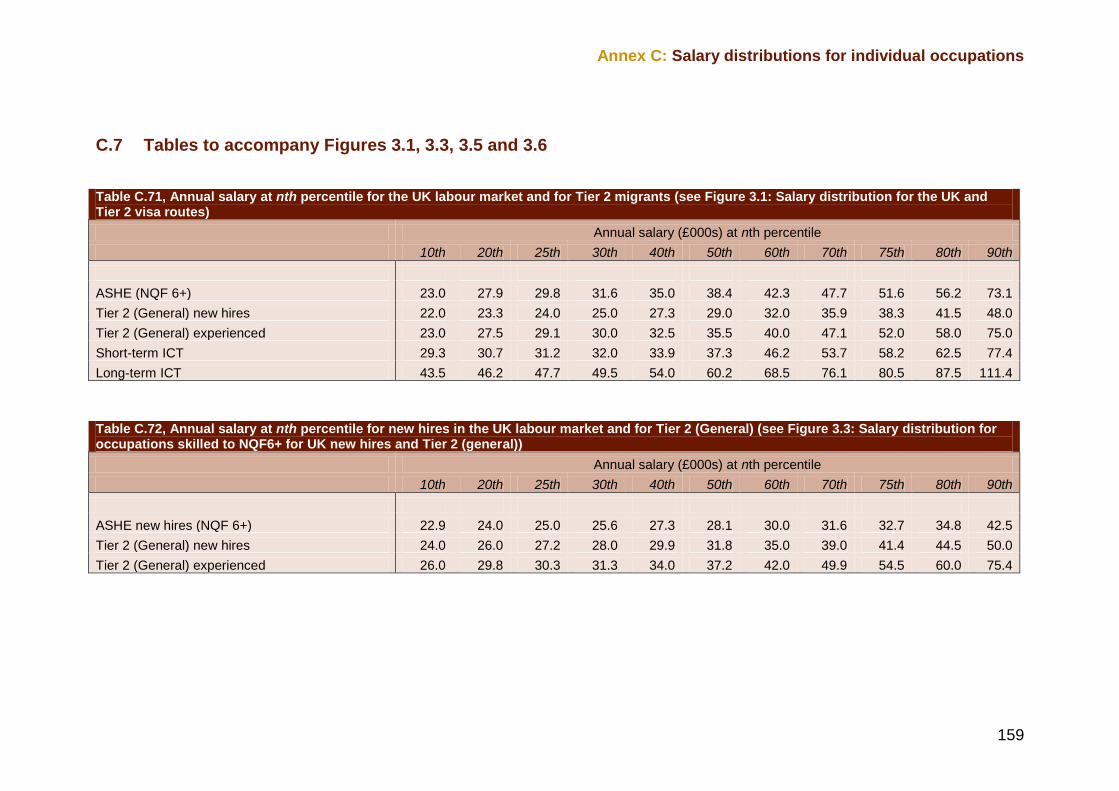
Annex C: Salary distributions for individual occupations
159
C.7 Tables to accompany Figures 3.1, 3.3, 3.5 and 3.6
Table C.71, Annual salary at nth percentile for the UK labour market and for Tier 2 migrants (see Figure 3.1: Salary distribution for the UK and Tier 2 visa routes)
Annual salary (£000s) at nth percentile
10th 20th 25th 30th 40th 50th 60th 70th 75th 80th 90th
ASHE (NQF 6+) 23.0 27.9 29.8 31.6 35.0 38.4 42.3 47.7 51.6 56.2 73.1
Tier 2 (General) new hires 22.0 23.3 24.0 25.0 27.3 29.0 32.0 35.9 38.3 41.5 48.0
Tier 2 (General) experienced 23.0 27.5 29.1 30.0 32.5 35.5 40.0 47.1 52.0 58.0 75.0
Short-term ICT 29.3 30.7 31.2 32.0 33.9 37.3 46.2 53.7 58.2 62.5 77.4
Long-term ICT 43.5 46.2 47.7 49.5 54.0 60.2 68.5 76.1 80.5 87.5 111.4
Table C.72, Annual salary at nth percentile for new hires in the UK labour market and for Tier 2 (General) (see Figure 3.3: Salary distribution for occupations skilled to NQF6+ for UK new hires and Tier 2 (general))
Annual salary (£000s) at nth percentile
10th 20th 25th 30th 40th 50th 60th 70th 75th 80th 90th
ASHE new hires (NQF 6+) 22.9 24.0 25.0 25.6 27.3 28.1 30.0 31.6 32.7 34.8 42.5
Tier 2 (General) new hires 24.0 26.0 27.2 28.0 29.9 31.8 35.0 39.0 41.4 44.5 50.0
Tier 2 (General) experienced 26.0 29.8 30.3 31.3 34.0 37.2 42.0 49.9 54.5 60.0 75.4

Analysis of Salary Thresholds
160
Table C.73. Annual salary at nth percentile for the UK labour market and for Tier 2 migrants, 16 - 25 age group(see Figure 3.5: Salary distribution for the UK and Tier 2 visa routes for 16 - 25 age group)
Annual salary (£000s) at nth percentile
10th 20th 25th 30th 40th 50th 60th 70th 75th 80th 90th
ASHE (NQF 6+) 16.4 19.9 21.4 22.5 23.8 25.3 26.7 28.5 29.7 31.0 36.7
Tier 2 (General) 22.0 23.5 24.2 25.0 27.3 29.0 32.0 36.0 38.3 41.5 48.0
Short-term ICT 26.0 27.2 28.6 29.6 30.4 33.2 42.0 50.1 53.6 58.5 72.4
Long-term ICT 42.6 44.3 45.0 46.2 49.1 52.0 57.0 64.8 73.0 77.9 95.0
Table C.74. Annual salary at nth percentile for the UK labour market and forTier 2 mgirants, 26 - 40 age group (see Figure 3.5: Salary distribution for the UK and Tier 2 visa routes for 26 - 40 age group)
Annual salary (£000s) at nth percentile
10th 20th 25th 30th 40th 50th 60th 70th 75th 80th 90th
ASHE (NQF 6+) 22.7 27.0 28.6 30.1 33.0 36.0 39.5 44.0 47.0 51.0 65.1
Tier 2 (General) 23.0 27.3 28.9 30.0 32.0 35.0 39.7 45.1 50.0 55.5 70.9
Short-term ICT 29.6 31.2 31.7 32.0 33.9 36.8 43.9 52.5 56.4 61.3 73.9
Long-term ICT 43.3 45.6 47.0 48.2 52.2 57.7 65.1 73.8 76.6 81.1 101.8

161
Annex D Main occupational usage of RCOS by month
Figure D.1: Monthly RCOS grants by selected 4-digit occupation, April 2014 - July 2015
0
100
200
300
400
500
600
700
800
900
1,000
1,100
2231 Nurses 2136 Programmers and software development
professionals
2211 Medical practitioners 2119 Natural and social science professionals not elsewhere
classified
2423 Management consultants and business analysts
Monthly RCOS grants by selected 4-digit occupation, April 2014 - July 2015
Apr-14 May-14 Jun-14 Jul-14 Aug-14 Sep-14 Oct-14 Nov-14 Dec-14 Jan-15 Feb-15 Mar-15 Apr-15 May-15 Jun-15 Jul-15
Annex D Main occupational usage of RCoS by month

Analysis of Salary Thresholds
162
Figure D.2: Monthly RCOS grants by selected 4-digit occupation, April 2014 - July 2015
0
10
20
30
40
50
60
70
80
90
100
110
120
130
140
150
2135 IT business analysts,
architects and systems designers
3534 Finance and investment
analysts and advisers2421 Chartered and certified
accountants3545 Sales accounts and
business development managers
2139 Information technology
and telecommunications professionals not elsewhere
classified
2311 Higher education
teaching professionals
Monthly RCOS grants by selected 4-digit occupation, April 2014 - July 2015Apr-14 May-14 Jun-14 Jul-14 Aug-14 Sep-14 Oct-14 Nov-14 Dec-14 Jan-15 Feb-15 Mar-15 Apr-15 May-15 Jun-15 Jul-15
Figure D.3: Monthly RCOS grants by selected 4-digit occupation, April 2014 - July 2015
0
10
20
30
40
50
60
70
80
90
100
110
120
130
140
150
2126 Design and development
engineers
2413 Solicitors 2314 Secondary education teaching
professionals
1132 Marketing and sales directors
2121 Civil engineers 2134 IT project and programme managers
2424 Business and financial project
management
professionals
Monthly RCOS grants by selected 4-digit occupation, April 2014 - July 2015
Apr-14 May-14 Jun-14 Jul-14 Aug-14 Sep-14 Oct-14 Nov-14 Dec-14 Jan-15 Feb-15 Mar-15 Apr-15 May-15 Jun-15 Jul-15

Annex D: Main occupational usage of RCoS by month
163
Figure D.4: Monthly RCOS grants by selected 4-digit occupation, April 2014 - July 2015
0
10
20
30
40
50
60
70
80
90
100
110
120
130
140
150
2137 Web design and development professionals
2129 Engineering professionals not elsewhere classified
2122 Mechanical engineers 2315 Primary and nursery education teaching professionals
2113 Physical scientists
Monthly RCOS grants by selected 4-digit occupation, April 2014 - July 2015
Apr-14 May-14 Jun-14 Jul-14 Aug-14 Sep-14 Oct-14 Nov-14 Dec-14 Jan-15 Feb-15 Mar-15 Apr-15 May-15 Jun-15 Jul-15


165
Annex E Analysis of ASHE regional data by main (2-digit) Tier 2 occupations, 2014
Figure E.1: Salary distribution for Science, research, engineering and technology professionals (SOC 21) by Region, 2014
£0
£5,000
£10,000
£15,000
£20,000
£25,000
£30,000
£35,000
£40,000
£45,000
£50,000
£55,000
£60,000
£65,000 10th 25th Median 75th
Notes: North East no data at 75th percentile – 70th percentile used instead; West Midlands no data available at 10th percentile
Annex E Analysis of ASHE regional data by main (2-digit) Tier 2 occupations, 2014

Analysis of Salary Thresholds
166
Figure E.2: Salary distribution for Healthcare (SOC 22) by Region, 2014
£0
£5,000
£10,000
£15,000
£20,000
£25,000
£30,000
£35,000
£40,000
£45,000
£50,000
£55,000
£60,000
£65,000 10th 25th Median 75th
Notes: East Midlands and South East not included due to lack of data at 10th and 75th percentiles; North West no data available at 10th percentile
Figure E.3: Salary distribution for Teaching and educational professionals (SOC 23) by Region, 2014
£0
£5,000
£10,000
£15,000
£20,000
£25,000
£30,000
£35,000
£40,000
£45,000
£50,000
£55,000
£60,000
£65,000 10th 25th Median 75th
Notes: North East no data; South West no data available at 10th percentile.

Annex E: Analysis of ASHE regional data
167
Figure E.4: Salary distribution for Business, media and public service professionals (SOC 24) by Region, 2014
£0
£5,000
£10,000
£15,000
£20,000
£25,000
£30,000
£35,000
£40,000
£45,000
£50,000
£55,000
£60,000
£65,000 10th 25th Median 75th
Notes: North East and West Midlands no data available at 10th percentile
Figure E.5: Salary distribution for Business and public service associate professionals (SOC 35) by Region, 2014
£0
£5,000
£10,000
£15,000
£20,000
£25,000
£30,000
£35,000
£40,000
£45,000
£50,000
£55,000
£60,000
£65,000 10th 25th Median 75th
Notes: none


Abbreviations
169
Abbreviations
AfC Agenda for Change
ASHE Annual Survey of Hours and Earnings
BIS Department for Business Innovation & Skills
BSC British Society of Cinematographers
BTEC Business and Technology Education Council
CBI Confederation of British Industry
CoS Certificate of Sponsorship
DLHE Destination of Leavers from Higher Education
DoH Department of Health
EEA European Economic Area
EU European Union
HNC Higher National Certificate
HND Higher national Diploma
ICT Intra Company transfer
IDS Income Data Services
IoD Institute of Directors
IPSE Association of Independent Professionals and the Self Employed
LFS Labour Force Survey
MAC Migration Advisory Committee
Abbreviations

Analysis of Salary Thresholds
170
MI Management Information
NASSCOM National Association of Software and Services Companies
NHS National Health Service
NMC Nursing and Midwifery Council
NISMP Northern Ireland Strategic Migration Partnership
NQF National Qualifications Framework
ONS Office for National Statistics
OSPAP Overseas Pharmacists’ Assessment Programmes
PBS Points Based System
PhD Doctor of Philosophy
PwC PricewaterhouseCoopers Legal LLP
RI BA Royal Institute of British Architects
RCoS Restricted Certificate of Sponsorship
RLMT Resident Labour Market Test
SME Small Medium Enterprise
SOC Standard Occupational Classification
SOL Shortage Occupation List
TCS Tata Consultancy Services
TUC Trade Union Congress

171
References
Dustmann, C., Frattini, T. and Preston, I. (2008) ‘The Effect of Immigration along the Distribution of Wages’, Centre for Research and Analysis of Migration Discussion Paper No. 03/08. London: University College, Centre for Research and Analysis of Migration. Manacorda, M., Manning, A. and Wadsworth, J. (2012), The Impact Of Immigration On The Structure Of Wages: Theory And Evidence From Britain. Journal of the European Economic Association, 10: 120–151 Migration Advisory Committee (2009), Analysis of the Points Based System: Tier 2 and dependants, August 2009. Available at: https://www.gov.uk/government/uploads/system/uploads/attachment_data/file/257266/mac-august-09.pdf Salary Thresholds/ Migration Advisory Committee (2010), Analysis of the Points Based System: London Weighting, August 2010. Available at: https://www.gov.uk/government/uploads/system/uploads/attachment_data/file/257248/report.pdf Migration Advisory Committee (2011), Settlement rights of migrants in Tier 1 and Tier, November 2011. Available at: https://www.gov.uk/government/uploads/system/uploads/attachment_data/file/257256/mac-settlement-report.pdf Migration Advisory Committee (2012a) Analysis of the Impacts of Migration, January 2012. Available at: https://www.gov.uk/government/uploads/system/uploads/attachment_data/file/257235/analysis-of-the-impacts.pdf Migration Advisory Committee (2012b), Limits on Migration: Limit on Tier 2 (General) for 2012/13 and associated policies’, February 2012. Available at: https://www.gov.uk/government/uploads/system/uploads/attachment_data/file/257252/tier2-limit-report.pdf Migration Advisory Committee (2012c), Analysis of the points-based system: List of occupations skilled at NQF level 6 and above and review of the Tier 2 codes of
References

References
172
practice, October 2012. Available at: https://www.gov.uk/government/publications/analysis-of-the-points-based-system-tier-2-at-nqf-level-6 Migration Advisory Committee (2013) Skilled Shortage Sensible: Full review of the recommended shortage occupation lists for the UK and Scotland, a sunset clause and the creative occupations, February 2013. Available at: https://www.gov.uk/government/uploads/system/uploads/attachment_data/file/257241/mac-report.pdf Migration Advisory Committee (2015) Partial review of the Shortage Occupation Lists for the UK and for Scotland, February 2015. Available at: https://www.gov.uk/government/uploads/system/uploads/attachment_data/file/406775/Partial_review_of_the_SOL_for_UK_and_Scotland_Report.pdf Migration Advisory Committee (2015) Call for Evidence: Review of Tier 2, July 2015. Available at: https://www.gov.uk/government/uploads/system/uploads/attachment_data/file/441429/Call_for_Evidence_Review_of_Tier_2.pdf Nathan, M., Rolfe, H., Vargas-Silva, C. (2013) ‘The Economic and Labour Market Impacts of Tier 1 entrepreneur and investor migrants - Report to the Migration Advisory Committee’. Nickell, S. and Saleheen, J. (2008) ‘The impact of immigration on occupational wages: evidence from Britain’, Federal Reserve Bank of Boston, Working Paper No. 08-6.

173

Migration Advisory Committee Report ww.gov.uk/government/organisations/migration-advisory-committee © Crown copyright. ISBN: 978-1-78246-831-8