review of the livestock/meat and milk value chains and ... of the livestock/meat and milk value...
TRANSCRIPT
REVIEW OF THE LIVESTOCK/MEAT AND MILK
VALUE CHAINS AND POLICY INFLUENCING
THEM IN GHANA

ii
REVIEW OF THE LIVESTOCK/MEAT AND MILK VALUE CHAINS AND
POLICY INFLUENCING THEM IN GHANA
Kwame Oppong-Apane
Edited by
Olanrewaju Smith
Abdou Salla
Berhanu Bedane
Published by the Food and Agriculture Organization of the United Nations and
the Economic Community of West African States
2016
ii
The designations employed and the presentation of material in this information product do not imply the expression of any
opinion whatsoever on the part of the Food and Agriculture Organization of the United Nations (FAO), or of the Economic
Community of West African States (ECOWAS) concerning the legal or development status of any country, territory, city or
area or of its authorities, or concerning the delimitation of its frontiers or boundaries. The mention of specific companies or
products of manufacturers, whether or not these have been patented, does not imply that these have been endorsed or
recommended by FAO, or ECOWAS in preference to others of a similar nature that are not mentioned.
The views expressed in this information product are those of the author(s) and do not necessarily reflect the views or policies
of FAO, or the ECOWAS.
© FAO and ECOWAS, 2016
FAO encourages the use, reproduction and dissemination of material in this information product. Except where otherwise
indicated, material may be copied, downloaded and printed for private study, research and teaching purposes, or for use in
non-commercial products or services, provided that appropriate acknowledgement of FAO as the source and copyright holder
is given and that FAO’s endorsement of users’ views, products or services is not implied in any way.
All requests for translation and adaptation rights, and for resale and other commercial use rights should be made via
www.fao.org/contact-us/licence-request or addressed to [email protected].
FAO information products are available on the FAO website (www.fao.org/publications) and can be purchased through
Cover photos
Top row left to right 1. A bucher selling meat cuts in Tajikstan - © FAO / Vasily Maximov 2. A child looking after cattle in
Beinam, Niger - © FAO / Ado Youssouf 3. Weighing milk in Naivasha, Kenya - © FAO / Simon Maina
Bottom row left to right 1. Chopping meat in Kumasi, Ghana - © FAO / Pietro Cenini 2. Masai men at livestock market in
Kenya - © FAO / Simon Maina 3. A women after milking in Chifra, Ethiopia - © FAO / Giulio Napolitano
iii
Table of contents
LIST OF ACRONYMS AND ABBREVIATIONS ............................................................................................... vii
LIST OF TABLES ...................................................................................................................................................... viii
LIST OF FIGURES ....................................................................................................................................................... x
EXECUTIVE SUMMARY .......................................................................................................................................... xi
1. INTRODUCTION ........................................................................................................................................ 1
2. SOCIO-ECONOMIC CONTEXT OF THE MEAT AND MILK VALUE CHAINS ....................... 3
2.1. Ghana land area and human population trend........................................................................................ 3
2.2 Current GDP of the country and trends in recent years ..................................................................... 3
2.3 Contribution of each of the meat and milk value chains to the national GDP and its trend ....... 4
2.4 Contribution to house-hold income, wellbeing, employment .............................................................. 4
2.5 Proportion of population engaged in meat and milk value chains ....................................................... 5
2.5.1. The main objectives of producing meat and milk ........................................................................... 5
3. THE DESCRIPTION AND MAPPING OF THE MEAT AND MILK VALUE CHAINS ................ 6
3.1. The structure of the meat and milk value chains ................................................................................... 6
3.2. Physical flows of meat and milk among the different components .................................................... 6
3.3 Milk value chain ................................................................................................................................................ 7
3.4. Primary production process ...................................................................................................................... 10
3.4.1. Prevailing livestock farming or other animal production systems ............................................ 10
3.4.2. Average farm size ................................................................................................................................. 11
3.4.3. Yield per unit weight per species of animal and milk production per cow per day and per
lactation .................................................................................................................................................. 11
3.4.4. Total production of meat and milk from each farming system ................................................. 12
3.4.5. Meat and milk post-harvest losses ................................................................................................... 12
3.4.6. Output storage capacity ..................................................................................................................... 12
3.5 Inputs and factors for primary production ............................................................................................. 13
3.5.1. Type and quantity of input required for the meat and milk value chain ................................. 13
3.5.2. Purchase prices of input per type for the meat and milk value chain. .................................... 14
3.5.3. Seasonality in prices and quantities of the main inputs ............................................................... 14
3.5.4. Stocking costs of inputs ...................................................................................................................... 14
3.5.5. Transportation costs of inputs from various locations ............................................................... 15
3.6. Processing stages up to the final commodity......................................................................................... 15
3.7 Various by-products and/or joint products ............................................................................................ 16
3.8 Geographical location of the different value chain components ........................................................ 17
iv
3.9 Amount of land and other natural resources allocated to the meat and milk value chains ........ 17
3.10 Resources ..................................................................................................................................................... 18
3.11 Impact of the meat and milk value chains on environment .............................................................. 18
3.12 Production and value addition potential ................................................................................................ 19
3.13 Number of value chain actors by component ...................................................................................... 19
3.14 Current and potential (domestic) demand of meat and milk ........................................................... 19
3.15 Current and potential (foreign) demand of meat and milk ............................................................... 20
3.16 Specific features of products, including product differentiation ...................................................... 20
The products capacity to fulfill international requirements (sanitary and other .................................. 20
3.17 Urban rural relationships .......................................................................................................................... 20
3.18 Synergies with other activities ................................................................................................................. 21
3.19 Role in local production systems ............................................................................................................ 21
4. INFRASTRUCTURE AND OTHER SUPPORT SERVICES ............................................................... 22
4.1 Transport ....................................................................................................................................................... 22
4.2 Packaging and stocking costs of output .................................................................................................. 22
4.3 Equipment, required investment, facilities and related ....................................................................... 22
4.4 Extension and technical support .............................................................................................................. 22
4.5 Quality control and certification .............................................................................................................. 23
5. MARKETING, TRADE AND PRICES ..................................................................................................... 24
5.1 Produced and traded quantities of the commodity .............................................................................. 24
5.2 Home consumption and marketed shares of the produced good, if any ....................................... 24
5.3 Producer price of the commodity at various locations ...................................................................... 24
5.4 Consumer price of the commodity at various locations ................................................................... 25
5.5 Location of the main markets in the region and/or at national ........................................................ 25
5.6 Seasonality in prices and quantities of the output ............................................................................... 26
5.7 Socio-economic features of current and potential customers, including spending capacities .. 26
5.8 The degree of competitiveness (existence of monopolies or otherwise) ..................................... 26
5.9 Control over prices (different prices setting and control) ................................................................ 27
5.10 Wholesale and retail distribution ............................................................................................................ 27

v
5.11 International price trends .......................................................................................................................... 27
5.12 Balance of trade ........................................................................................................................................... 27
5.13 Current and potential competitors ......................................................................................................... 28
6. GOVERNANCE AND INSTITUTIONAL ARRANGEMENT .......................................................... 29
6.1 The organization and interactions among the different value chain actors in vertical
integration processes. ................................................................................................................................. 29
6.2 Existence of association/cooperatives and their strength .................................................................. 29
7. NATIONAL OR REGIONAL PROJECT FROM WHICH THE VALUE CHAINS BENEFIT .... 32
8. POLICIES AND STRATEGIES .................................................................................................................. 33
8.1 Incentives or disincentives to producers and consumers ................................................................... 35
8.2 Credit policies .............................................................................................................................................. 35
8.3 International trade policies ........................................................................................................................ 35
8.4 Acts, regulations and laws governing the value chain ......................................................................... 36
8.5 Major constraints requiring policy interventions ................................................................................. 36
8.6 Suggested policies for smooth operation of meat and milk value ................................................... 37
9. CONSTRAINTS AFFECTING MEAT AND MILK VALUE CHAINS AND PROPOSED
SOLUTIONS .............................................................................................................................................................. 39
9.1 Constraints .................................................................................................................................................... 39
9.2 Proposed solutions ...................................................................................................................................... 41
9.3 Prioritized areas of interventions ............................................................................................................ 42
10 SUGGESTED PROJECTS AND PROGRAMMES ................................................................................ 43
11 CONCLUSIONS ......................................................................................................................................... 47
12 REFERENCES ................................................................................................................................................ 48
13 ANNEX TABLE: COST OF PROPOSED PROGRAMME ................................................................ 50

vi

vii
LIST OF ACRONYMS AND ABBREVIATIONS
AfDB African Development Bank
AI Artificial Insemination
APD Animal Production Directorate
ARI Animal Research Institute
CET Common External Tariff
CFI Cost Insurance and Freight
CSIR Council for Scientific and Industrial Research
ECOWAS Economic Commission of West African States
FAO Food and Agriculture Organization of the United Nations
FASDEP Food and Agriculture Sector Development Policy
FBO Farmer Based Organisation
FDA Food and Drugs Authority
GDP Gross Domestic Product
GH¢ Ghanaian cedi
GoG Government of Ghana
GSA Ghana Standards Authority
GSS Ghana Statistical Service
GTZ German Technical Cooperation
IFAD International Fund for Agricultural Development
Kg Kilogram
MoFA Ministry of Food and Agriculture
MTASIP Medium Term Agricultural Sector Investment Plan
NDPC National Development Planning Council
NGO Non-Governmental Organisations
SRID Statistics Research and Information Directorate
US$ United States dollars
VSD Veterinary Services Directorate
WASH West African Short Horn
viii
LIST OF TABLES
Table 1: Ghana land area and human population trend ..................................................................................... 3
Table 2: Contribution of Agriculture and Livestock to GDP ........................................................................... 3
Table 3: Breeds, types and population of livestock ............................................................................................ 4
Table 4: Trends in annual domestic production of meat and milk (tonnes) ................................................ 4
Table 5: Monetary value of domestic livestock products in 2011 (US$ million) ......................................... 4
Table 6: Imports of live animals, heads .................................................................................................................. 6
Table 7: Milk imports (tonnes) ................................................................................................................................ 8
Table 8: Main types of market agents in traditional milk product markets .................................................. 8
Table 9: Average farm sizes for various species of livestock ......................................................................... 11
Table 10: Mature weight, dressing percentage and carcass weight of livestock ........................................ 11
Table 11: Domestic milk production per cow ................................................................................................... 12
Table 12: Meat and milk production from farming systems, tonnes (2013) ............................................... 12
Table 13: Quantity of inputs required for the meat and milk value chain .................................................. 13
Table 14: Importation of veterinary products, 2009 ........................................................................................ 13
Table 15: Prices of inputs for livestock production ......................................................................................... 14
Table 16: Transportation of maize from producer markets, GHC .............................................................. 15
Table 17: Processing stages of the commodities ............................................................................................... 15
Table 18: Processing stages of milk ...................................................................................................................... 15
Table 19: Meat and milk by-products and joint-products ............................................................................... 16
Table 20: Processing level of meat and milk....................................................................................................... 17
Table 21: Geographical location of components in the meat and milk value chain .................................. 17
Table 22: Environmental impacts through meat and milk value chains ....................................................... 18
Table 23: Imported livestock products (tonnes) ............................................................................................... 24
Table 24: Producer price of animals (GHC) ...................................................................................................... 25
Table 25: Meat and milk prices in regional capitals (GHC/kg) ....................................................................... 25
Table 26: Major livestock markets, 2012 ............................................................................................................ 26
Table 27: Balance of meat and milk trade (US$ 1000) .................................................................................... 27
Table 28: National dairy and butchers/meat cutters/ small livestock owners association ...................... 29
Table 29: Major NGOs acting in support to the livestock/meat and milk value chains .......................... 30
Table 30: Operational areas of NGOs supporting livestock/meat and milk value chains ....................... 31
Table 31: On-going projects and partners in the livestock sector, 2012 .................................................... 32
Table 32: Current national policies and strategies ........................................................................................... 33
Table 33: SWOT analysis of the livestock and meat value chains ................................................................ 39
ix
Table 34: SWOT analysis of the milk/milk products value chain .................................................................. 40
Table 35: Annex Table - Cost of Proposed Programme ................................................................................ 50

x
LIST OF FIGURES
Figure 1: Livestock/meat value chain ...................................................................................................................... 7
Figure 2: Milk value chain .......................................................................................................................................... 9

xi
EXECUTIVE SUMMARY
The study provides an overview of Ghana’s livestock/meat and dairy value chains. It addresses the
current status of the value chains, makes an inventory of the strengths and constraints of the value
chains, as well as policies that could affect them. It also identifies gaps and prescribes solutions. A
programme is proposed for investment in the value chains.
Socio economic context
The livestock sector contributes significantly to the national economy through its positive impacts on
food security, employment opportunities for a large proportion of the population, prospects for
wealth creation, income enhancement and improvement in rural livelihoods. The main objectives of
producing livestock products in the smallholder system are for subsistence and household
consumption, while the commercial farms have profit as a motive.The livestock sector contributed
GH¢1 159 million amounting to 1.7 percent of the national Gross Domestic product (GDP) and
about 7.4 percent of agricultural GDP in 2012. The sector grew at 5.1 percent in 2011, falling slightly
to 5.0 percent in 2012, and produced a total of 234 041 tonnes of meat, eggs and milk in 2011
valued at US$851.03 million (FAO, 2013). Import figures for 2011 were 138 803 tonnes (M0FA,
2012) valued at US$553.57 (FAO, 2013) and the sector engaged 41.3 percent of the Ghanaian
population in 2011 (Akunzule, 2012).
Current status of livestock/meat and milk value chains
The structure of the livestock /meat and milk value chains reflects the economic relations among
players at each stage of the chains. Actors in the value chains comprised input dealers, producers,
processors, wholesalers, retailers, consumers research scientists and policy makers.There are
several governmental, non-governmental organisations (NGOs) and associations in the value chains
scattered all over the country performing different functions including advocacy. The associations are
poorly linked and have not been very effective in their functions and need to be strengthened to play
effective roles in the development of the chains.
For all the livestock commodities there are a few companies that import inputs such as veterinary
drugs, vaccines, feed additives, feed ingredients and concentrates. Two major vaccines against
Newcastle Disease and Anthrax are produced locally by the Veterinary Services Directorate (VSD)
of the Ministry of Food and Agriculture (MoFA). A few feed milling companies produce compounded
and concentrate feeds for livestock farmers. There are only four standard abattoirs for the slaughter
of cattle, sheep, goats and pigs and six processing plants for poultry in the country.
The uptake of research output has been low in the past, partly as a result of the top-down approach
to research. The introduction of the Research Extension Linkage Committee concept has improved
extension delivery and uptake and is benefiting primary producers in the value chains. There is,
however, a need to strengthen the capacity of both researchers and extensionists.
There are several regulatory bodies currently ensuring the quality control and certification of feed,
meat, milk and dairy products. Those for feed control are the Animal Production Directorate (APD)
of MoFA, Ghana Standards Authority (GSA) and Food and Drugs Authority (FDA). The Veterinary
Services Directorate, together with FDA, has the responsibility for veterinary drugs, vaccines, and
livestock products and by-products quality control. Coordination among the regulatory institutions
has not been very effective thus militating against the development of the meat and milk value chains.
xii
Policies on livestock/meat and milk value chains
Policy instruments to improve the effectiveness of the livestock/meat and milk value chains can be
found in the medium term national development policy framework: Ghana Shared Growth and
Development Agenda by the National Development Planning Council (NDPC, 2010). Some of the
policies have also been captured under the Food and Agriculture Sector Development Policy II
(FASDEP II). The policies include: Provision of waiver of duty on imported agricultural inputs;
Improving access to operators of technology; Improving appropriate financial instruments to
enhance the competiveness of the actors in production, processing and marketing; Improving the
dispensation of animal health service and Design appropriate interventions to address processing and
marketing of meat and milk products and by-products.
Others are: Establishing a commission to deal with unfair international trade practices; Impose
tariffs on imported meat; Increase awareness on food safety and public health; Enacting consumer
protection law and establish a national body to prevent sub-standard, fake and hazardous goods
getting on to local markets; Improving cross-sectoral environmental management, including climate
change and biodiversity; Improving technology adoption; Supporting large scale cultivation of maize
and soybeans for formulation of animal feed and improve access to quality feed.
Some of the key strategies being implemented under FASDEP II are: Focusing on improving animal
health; Improving access to quality feed and water; Enhancing performance of indigenous breeds
through a programme of selection; Developing commercial poultry as the priority for improving
meat supply in the short term, while measures are implemented to transform smallholder
production into profitable enterprises; Improve access of operators to technology and appropriate
financial instruments to enhance their competitiveness with imports.
Some gaps identified in the operation of the policies include: Importation of low quality feed and feed
ingredients; Ineffectiveness of feed quality regulatory bodies and quality checks of imported and local
products in the market; Inadequate access to technology and high interest on loans; Lack of access
to quality animal health care in some communities; Farmer Based Organizations (FBOs) that are not
very effective in seeking smallholder access to services ; Low capacity of local producers to make
products more competitive with imported ones; Inadequate capacity of research institutions to
deliver technologies and inadequate extension delivery resulting from low extension-farmer ratio.
The major constraints in the livestock/meat and milk value chains and the gaps identified in the
operation of the policies were confirmed by a cross section of participants representing various
actors in the value chains at the livestock/meat and milk value chain workshop. A programme titled
“Enhancing the performance of meat and milk value chains through improved animal genetic
resources, feed resources and meat processing systems” comprising two projects (i) Support for
enhancing livestock /meat value chain, and (ii) Support for enhancing milk value chain in Ghana are
proposed to improve the performance of the livestock, meat and milk value chains at a cost of
US$167 480.00. The programme will run for a period of three years.
1. INTRODUCTION
The Ghana livestock sub-sector is dominated by small scale operators who are mainly crop farmers
keeping livestock to supplement their incomes and/or for food security purposes. There are few
well-organized commercial poultry and pig operations in the country (MoFA, 2010).
Livestock population statistics are generally poor as there has been no livestock census for several
decades in Ghana. MoFA has been relying on projections, which do not accurately portray the
livestock situation (MoFA, 2010) as there has not been any consistent monitoring of the livestock
population since the last census.
The livestock sector is an important component of Ghana’s agriculture, and contributes in direct
products about 8.69 and 1.7 percents of agricultural and national GDP respectively (GSS, 2013).
These amounts do not include the value of secondary products, such as manure, draught power and
transport provided to the crop sector. The sector’s socio-economic importance in the reduction of
rural poverty is well acknowledged, particularly among farmers in the Northern, Upper West and
Upper East regions. Manure from livestock is now an invaluable resource to the crop and vegetable
farmers for the maintenance of soil fertility and structure as well as control of soil erosion.
Livestock supply not only meat, milk and eggs, but also skins for leather, bones, blood and horns for
animal feed.
The use of bullocks for land preparation allows farmers to crop larger areas than would have been
possible in view of the high cost involved in using tractor power. Among the numerous
contributions of the livestock, meat and dairy value chain to the national economy is food security as
it provides animal protein to enhance the nutritional status of the human population. Livestock offer
prospects for employment, wealth creation, income enhancement and improvement in rural
livelihoods. The livestock sector is dominated by small scale operators who are mainly crop farmers
keeping livestock to supplement their incomes and/or for security purposes. There are, however,
few well-organized commercial poultry and pig operations in the country (MoFA, 2010).
The livestock value chain describes the full range of activities which are required to bring livestock,
meat and milk products and their by-products or service from conception, through the input of
various services (such as feed milling, hatching and health care), the different phases of production
(involving a combination of physical transformation such as processing) to the delivery of products
to final consumers, and final disposal after use. Since 2005, German Technical Cooperation (GTZ)
has focused on the development of the Guinea fowl value chain in the three northern regions, and
this has led to the establishment of a vibrant Guinea fowl farmer’s associations in the area. In
general, the value chain development in the country’s livestock sector is limited (Akunzule, 2012).
The Government of Ghana (GoG) with assistance from some Non-Governmental Organisations
(NGOs) and Donor Partners have applied a number of instruments in the implementation of
projects to address the constraints in the livestock sector. However, most of the projects did not
achieve the desired impact. This might have resulted partially from too much emphasis being put on
production with not enough attention given to the other components along the livestock value
chain. It is expected that future development in the livestock sector will be more successful and
sustainable if interventions are done using the value chain approach.

2
The objective of the consultancy was to review the livestock/meat and milk value chains and take
stock of policies influencing them, and assist the national focal person for livestock/meat and milk
value chain in organizing and conducting a national validation workshop. More specifically, the
following were to be undertaken; i. Establish the current status of livestock/meat and milk value
chains, ii) Conduct an inventory of current policies on livestock/meat and milk value chains and
identify gaps, iii) Identify projects and programmes for the development/enhancement of
livestock/meat and milk value chains and propose priority investment plans for each value chain, iv)
Identify policies facilitating the development or enhancement of livestock/meat and milk value chains
and suggest mechanism of embedding them in key national policy documents.
Data were sourced directly or indirectly from international organisations such as the Food and
Agriculture Organization of the United Nations (FAO), Ghanaian public sector institutions, private
sector organizations and farmer/processor associations as well as some key actors involved in the
livestock sector. Data obtained from field studies were used to fill gaps and confirm some secondary
data.
The document is presented in thirteen chapters. The First and Second chapters present Executive
Summary and Introduction to the study respectively. The Third, Fourth and Fifth Chapters present
Overview of the Socio-Economic Context, Mapping, Infrastructure and Other Support Services of
the Meat and Milk Value Chains. Chapter Six deals with the Marketing, Trade and Prices of Livestock
and Livestock Products; Chapter Seven presents the Governance and Institutional Arrangement of
the different Value Chain Actors while Chapter Eight presents the National or Regional Projects
from which the Value Chains Benefit. Chapter Nine presents Policies and Strategies Influencing the
Meat and Milk Value Chains and Chapter Ten deals with the Constraints Affecting Value Chains and
Proposed Solutions. Chapter Eleven suggests a Programme for Improving the Performance of the
Value Chains, while Chapter Twelve presents the Conclusions emanating from the study. Chapter
Thirteen provides References to data used in the document.
3
2. SOCIO-ECONOMIC CONTEXT OF THE MEAT AND MILK VALUE CHAINS
2.1. Ghana land area and human population trend
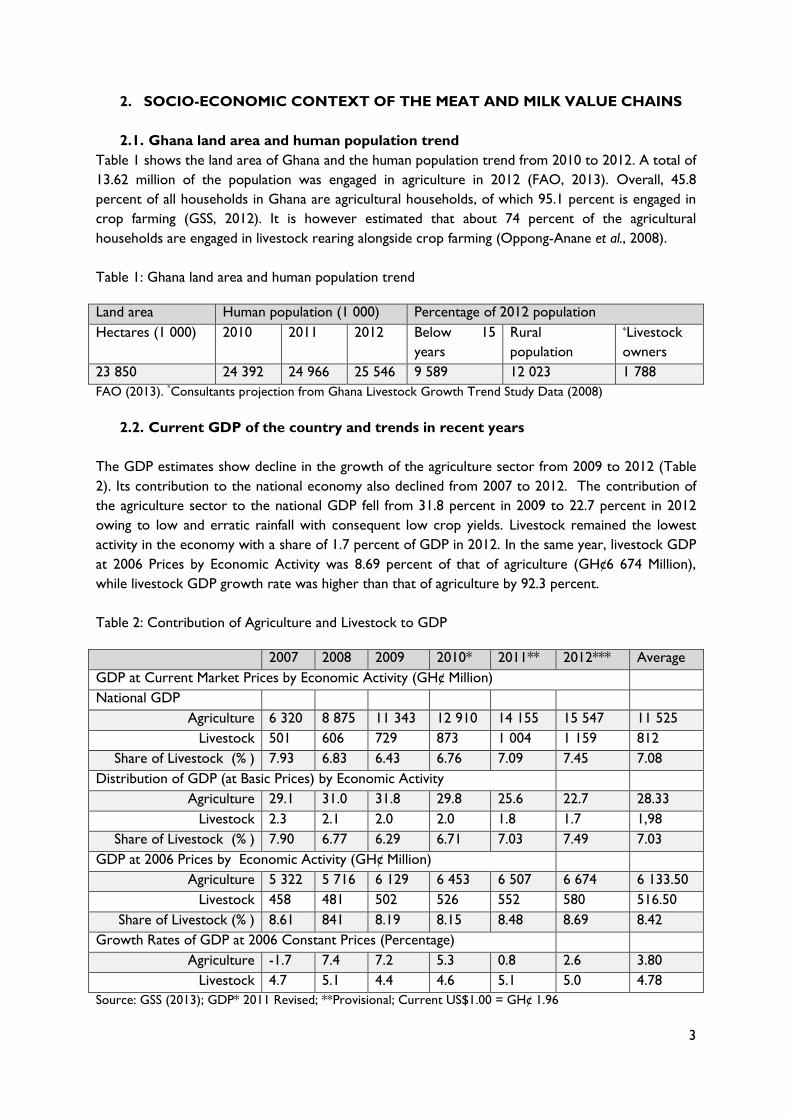
Table 1 shows the land area of Ghana and the human population trend from 2010 to 2012. A total of
13.62 million of the population was engaged in agriculture in 2012 (FAO, 2013). Overall, 45.8
percent of all households in Ghana are agricultural households, of which 95.1 percent is engaged in
crop farming (GSS, 2012). It is however estimated that about 74 percent of the agricultural
households are engaged in livestock rearing alongside crop farming (Oppong-Anane et al., 2008).
Table 1: Ghana land area and human population trend
Land area Human population (1 000) Percentage of 2012 population
Hectares (1 000) 2010 2011 2012 Below 15
years
Rural
population
*Livestock
owners
23 850 24 392 24 966 25 546 9 589 12 023 1 788
FAO (2013). *Consultants projection from Ghana Livestock Growth Trend Study Data (2008)
2.2. Current GDP of the country and trends in recent years
The GDP estimates show decline in the growth of the agriculture sector from 2009 to 2012 (Table
2). Its contribution to the national economy also declined from 2007 to 2012. The contribution of
the agriculture sector to the national GDP fell from 31.8 percent in 2009 to 22.7 percent in 2012
owing to low and erratic rainfall with consequent low crop yields. Livestock remained the lowest
activity in the economy with a share of 1.7 percent of GDP in 2012. In the same year, livestock GDP
at 2006 Prices by Economic Activity was 8.69 percent of that of agriculture (GH¢6 674 Million),
while livestock GDP growth rate was higher than that of agriculture by 92.3 percent.
Table 2: Contribution of Agriculture and Livestock to GDP
2007 2008 2009 2010* 2011** 2012*** Average
GDP at Current Market Prices by Economic Activity (GH¢ Million)
National GDP
Agriculture 6 320 8 875 11 343 12 910 14 155 15 547 11 525
Livestock 501 606 729 873 1 004 1 159 812
Share of Livestock (% ) 7.93 6.83 6.43 6.76 7.09 7.45 7.08
Distribution of GDP (at Basic Prices) by Economic Activity
Agriculture 29.1 31.0 31.8 29.8 25.6 22.7 28.33
Livestock 2.3 2.1 2.0 2.0 1.8 1.7 1,98
Share of Livestock (% ) 7.90 6.77 6.29 6.71 7.03 7.49 7.03
GDP at 2006 Prices by Economic Activity (GH¢ Million)
Agriculture 5 322 5 716 6 129 6 453 6 507 6 674 6 133.50
Livestock 458 481 502 526 552 580 516.50
Share of Livestock (% ) 8.61 841 8.19 8.15 8.48 8.69 8.42
Growth Rates of GDP at 2006 Constant Prices (Percentage)
Agriculture -1.7 7.4 7.2 5.3 0.8 2.6 3.80
Livestock 4.7 5.1 4.4 4.6 5.1 5.0 4.78
Source: GSS (2013); GDP* 2011 Revised; **Provisional; Current US$1.00 = GH¢ 1.96
4
2.3. Contribution of each of the meat and milk value chains to the national GDP and
its trend
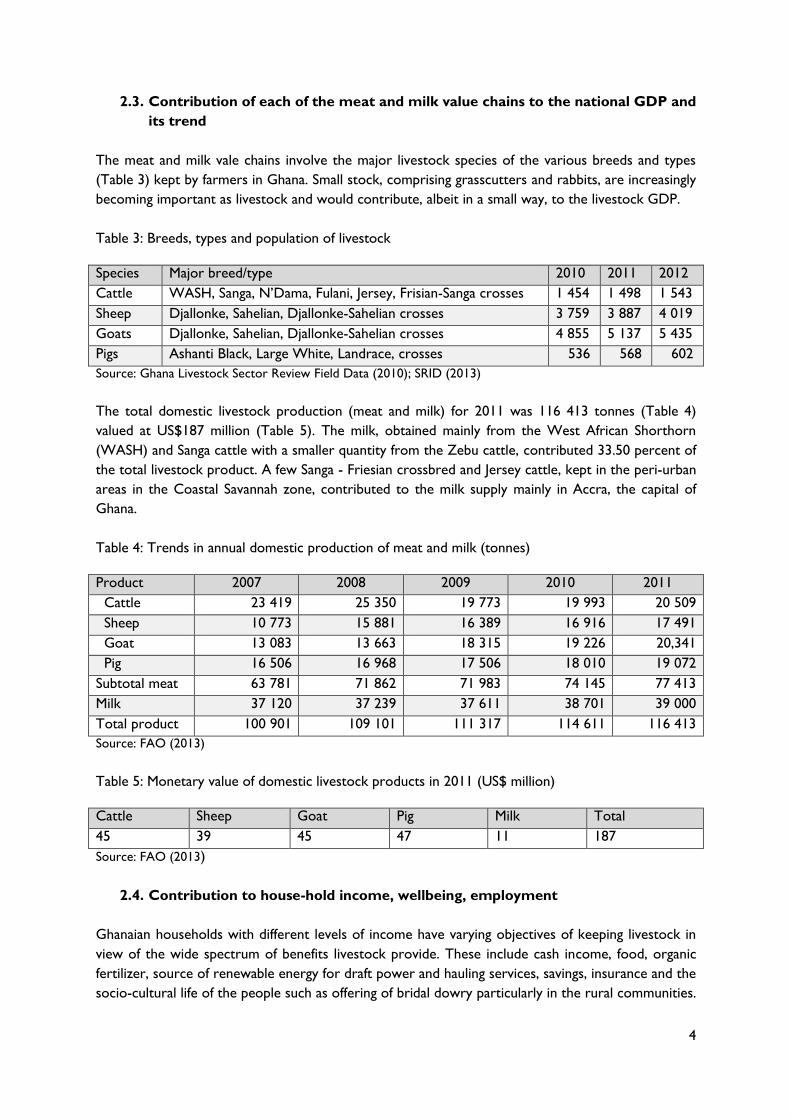
The meat and milk vale chains involve the major livestock species of the various breeds and types
(Table 3) kept by farmers in Ghana. Small stock, comprising grasscutters and rabbits, are increasingly
becoming important as livestock and would contribute, albeit in a small way, to the livestock GDP.
Table 3: Breeds, types and population of livestock
Species Major breed/type 2010 2011 2012
Cattle WASH, Sanga, N’Dama, Fulani, Jersey, Frisian-Sanga crosses 1 454 1 498 1 543
Sheep Djallonke, Sahelian, Djallonke-Sahelian crosses 3 759 3 887 4 019
Goats Djallonke, Sahelian, Djallonke-Sahelian crosses 4 855 5 137 5 435
Pigs Ashanti Black, Large White, Landrace, crosses 536 568 602
Source: Ghana Livestock Sector Review Field Data (2010); SRID (2013)
The total domestic livestock production (meat and milk) for 2011 was 116 413 tonnes (Table 4)
valued at US$187 million (Table 5). The milk, obtained mainly from the West African Shorthorn
(WASH) and Sanga cattle with a smaller quantity from the Zebu cattle, contributed 33.50 percent of
the total livestock product. A few Sanga - Friesian crossbred and Jersey cattle, kept in the peri-urban
areas in the Coastal Savannah zone, contributed to the milk supply mainly in Accra, the capital of
Ghana.
Table 4: Trends in annual domestic production of meat and milk (tonnes)
Product 2007 2008 2009 2010 2011
Cattle 23 419 25 350 19 773 19 993 20 509
Sheep 10 773 15 881 16 389 16 916 17 491
Goat 13 083 13 663 18 315 19 226 20,341
Pig 16 506 16 968 17 506 18 010 19 072
Subtotal meat 63 781 71 862 71 983 74 145 77 413
Milk 37 120 37 239 37 611 38 701 39 000
Total product 100 901 109 101 111 317 114 611 116 413
Source: FAO (2013)
Table 5: Monetary value of domestic livestock products in 2011 (US$ million)
Cattle Sheep Goat Pig Milk Total
45 39 45 47 11 187
Source: FAO (2013)
2.4. Contribution to house-hold income, wellbeing, employment
Ghanaian households with different levels of income have varying objectives of keeping livestock in
view of the wide spectrum of benefits livestock provide. These include cash income, food, organic
fertilizer, source of renewable energy for draft power and hauling services, savings, insurance and the
socio-cultural life of the people such as offering of bridal dowry particularly in the rural communities.
5
Livestock may also be sold to increase farm size and to procure inputs such as seeds, fertilizer, farm
tools and labour. Livestock stabilizes the socio-economic capability of households by providing
reliable income in times when prices of crops are low due to bumper harvest.
2.5. Proportion of population engaged in meat and milk value chains
The proportion of population engaged in agriculture is 41.3 percent and the proportion of
population (from total agriculture) engaged in livestock production is 40.0 percent (Akunzule, 2012)
2.5.1. The main objectives of producing meat and milk
The main objective of producing livestock products in the smallholder system is for subsistence and
for satisfying household consumption. Medium and large scale producers of livestock products are
commercial enterprises with the motive of producing for the general market and enhancement of
financial status. Currently, domestic meat and milk production are geared towards domestic
production with no intention of export.
6
3. THE DESCRIPTION AND MAPPING OF THE MEAT AND MILK VALUE CHAINS
3.1. The structure of the meat and milk value chains
Major actors in the meat and milk value chain comprise importers, input dealers, producers,
processors, wholesalers, retailers and consumers. For all the livestock commodities, there are a few
large companies that import veterinary inputs. Formulated feed which is used largely in poultry and
pig production is produced by few large feed milling companies though a number of the farms
produce their own feed. Cattle, sheep, goat, pigs and milk are produced largely by smallholders who
generally sell livestock and milk to middlemen.
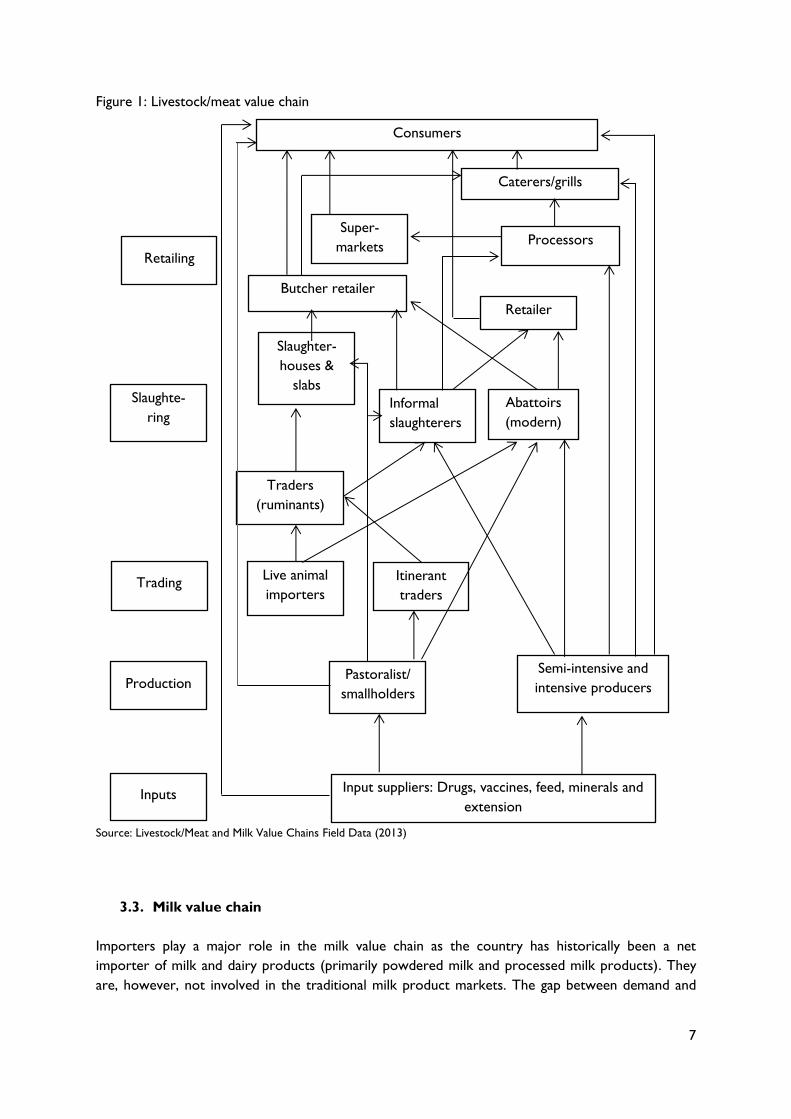
3.2. Physical flows of meat and milk among the different components
The physical flow of livestock/meat for cattle, sheep, goats, and pigs (Figure 1) starts with the
production of cattle by pastoralists, sheep and goats by smallholder farmers, and pigs reared mostly
under intensive production. Also live cattle (Zebu), sheep and goats imported from neighboring
West-African countries such as Burkina Faso, Mali and Niger get into the chain. A number of live
animals get into the country uncounted for as a result of the porous nature of the borders. The
movement of trade animals across the borders through official entry points, with quarantine stations,
is monitored by the VSD staff in order to prevent the introduction and spread of animal diseases.
Since most of the animals do not come through appropriate points of entry, data of live animal
imports are not reliable.
Table 6 shows the trade animals that passed through the official entry points.
Table 6: Imports of live animals, head
Type of animals 2011 2012
Cattle 9 384 23 622
Sheep 2 835 9 840
Goats 2 495 10 008
Source: VSD (2013)
Itinerant traders may collect animals from pastoralists and smallholders. These end up with traders
in live animal markets and then to butchers who may formally slaughter the animals in abattoirs,
slaughterhouses and slaughter slabs. Butchers may also obtain animals directly from pastoralists and
smallholders. Most of them retail the animals they slaughter. Meat from butchers may also go to
caterers, khebab sellers (grills) or to consumers directly. Some supermarkets usually have in-house
processing units and may receive their meat supplies from abattoirs and informal slaughterers.
Producers who rear animals intensively (e.g. pigs) may slaughter their animals informally and retail
the meat themselves. They may also supply livestock directly to processors who may use the
services of abattoirs or do their own slaughtering. Such processors may supply meat and meat
products to supermarkets which may be integrated to the processing facilities or sell to caterers and
grill operators. Supermarkets retail their meat to consumers, while caterers also reach consumers
by using the meat for food. Meat also reaches consumers through khebab sellers and grill operators.
Consumers may also get their animal supplies directly from the producers or live animal markets.
7
Figure 1: Livestock/meat value chain
Source: Livestock/Meat and Milk Value Chains Field Data (2013)
3.3. Milk value chain
Importers play a major role in the milk value chain as the country has historically been a net
importer of milk and dairy products (primarily powdered milk and processed milk products). They
are, however, not involved in the traditional milk product markets. The gap between demand and
Pastoralist/
smallholders
Semi-intensive and
intensive producers
Live animal
importers
Itinerant
traders
Traders
(ruminants)
Informal
slaughterers
Abattoirs
(modern)
Super-
markets
Consumers
Caterers/grills
Input suppliers: Drugs, vaccines, feed, minerals and
extension Inputs
Production
Slaughte-
ring
Retailing
Trading
Processors
Slaughter-
houses &
slabs
Butcher retailer
Retailer
8
local production of milk and dairy products keeps on widening year after year to the extent that the
imported milk and dairy products increased by 2 268 percent from 2006 to 2012 (Table 7).
Ghana’s dairy processors (including ice cream, baby foods, chocolate milk, yoghurt, and long-life milk
producers) rely on combining and reconstituting milk powder imported mostly from the European
Union countries. Dairy products such as infant formula, cheese, butter and ice cream are imported.
A total of 34 local dairy processors had registered with the Ghana Food and Drugs Authority by
2009. Prominent among the producers were Nestles Ghana Ltd, Fan Milk, Promisidor and West
Africa Distribution Ltd. Artisanal production of yogurt from locally produced milk is reducing in
favour of industrial production that uses almost solely imported milk powder. The small scale
yoghurt manufactures use approximately 20 percent locally produced milk to 80 percent imported
milk powder (Apori, et al. 2010).
Table 7: Milk imports (tonnes)
Year 2006 2007 2008 2009 2010 2011 2012
Quantity 1 044 2 656 2 719 11 406 27 323 27 619 24 728
Source: SRID (2013)
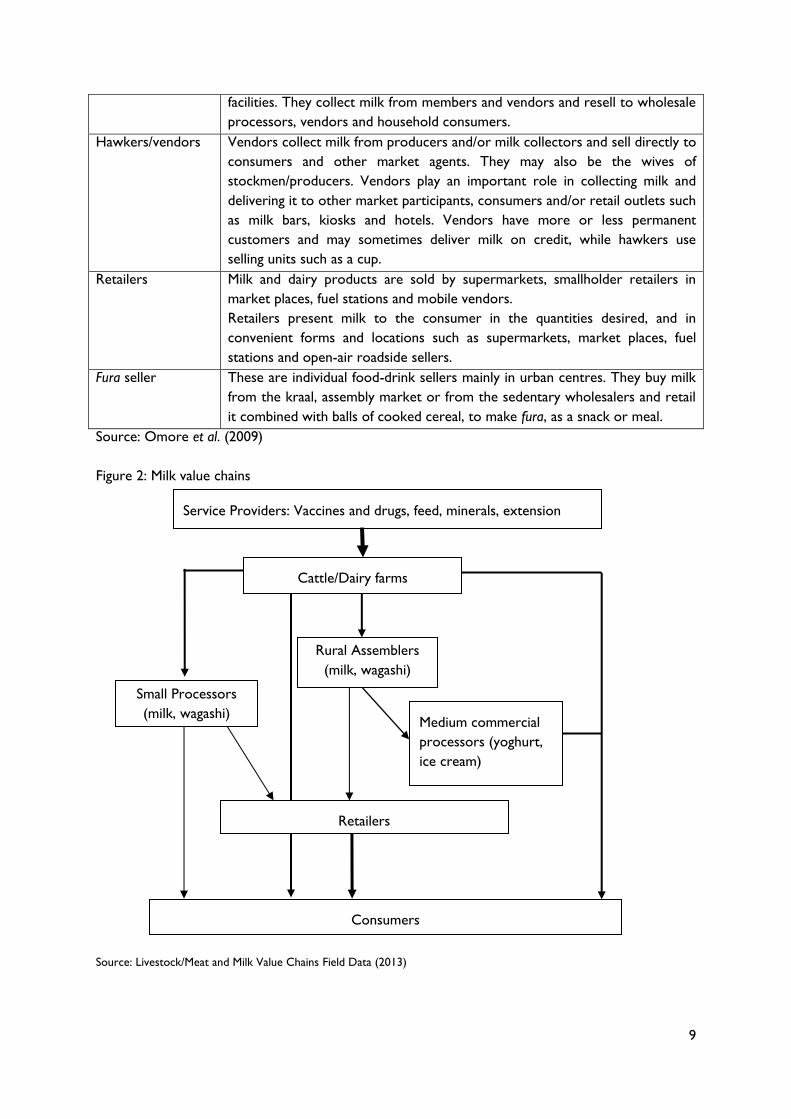
An important feature about domestic milk supply in Ghana is that there is usually a separation
between cattle owning and cattle keeping. While cattle owners can be from any ethnic group, they
arrange to have the cattle kept and milked by herdsmen mainly from the Fulani tribe, who have
greater indigenous knowledge of husbandry practices. While the owners buy and sell the animals,
the herdsmen or stockmen collect and sell the milk. Milk is produced largely by pastoralists using
WASH and Sanga cattle and few intensive producers who use Friesian X Sanga crossbreds and the
exotic Jersey breed. Market agents in the traditional milk value chain are shown in Table 8 and figure
2.
Table 8: Main types of market agents in traditional milk product markets
Type of seller Description
Producer-seller Producers who also sell their milk. These are herdsmen or their wives who
sell their own milk at the farm/kraal or in the village, rural town or roadside.
They often consume some of the milk. They are included among processors
below.
Processors These types of sellers procure milk to process into other products like
yoghurt, ice cream and cheese. These include home processors of soft cheese
known as wagashi, generally wives of stockmen/producers. Processors of
yogurt may also receive their supplies from specialized dairy farmers using
exotic breeds
Private
wholesalers/
Assembler
Wholesalers buy milk in bulk from producers and/or rural assemblers and sell
it to retailers. Assemblers sell generally to other wholesalers. No chilling is
generally used. They therefore play the role of bulkers in the marketing
system.
Collection centres/
dairy cooperatives
Dairy cooperatives facilitate milk collection and marketing; this activity is
located around collection centres. Most dairy cooperatives have cooling
9
facilities. They collect milk from members and vendors and resell to wholesale
processors, vendors and household consumers.
Hawkers/vendors Vendors collect milk from producers and/or milk collectors and sell directly to
consumers and other market agents. They may also be the wives of
stockmen/producers. Vendors play an important role in collecting milk and
delivering it to other market participants, consumers and/or retail outlets such
as milk bars, kiosks and hotels. Vendors have more or less permanent
customers and may sometimes deliver milk on credit, while hawkers use
selling units such as a cup.
Retailers Milk and dairy products are sold by supermarkets, smallholder retailers in
market places, fuel stations and mobile vendors.
Retailers present milk to the consumer in the quantities desired, and in
convenient forms and locations such as supermarkets, market places, fuel
stations and open-air roadside sellers.
Fura seller These are individual food-drink sellers mainly in urban centres. They buy milk
from the kraal, assembly market or from the sedentary wholesalers and retail
it combined with balls of cooked cereal, to make fura, as a snack or meal.
Source: Omore et al. (2009)
Figure 2: Milk value chains
Source: Livestock/Meat and Milk Value Chains Field Data (2013)
Cattle/Dairy farms
Rural Assemblers
(milk, wagashi)
Small Processors
(milk, wagashi) Medium commercial
processors (yoghurt,
ice cream)
Retailers
Consumers
Service Providers: Vaccines and drugs, feed, minerals, extension
10
3.4. Primary production process
3.4.1. Prevailing livestock farming or other animal production systems
Ghana’s agriculture is predominantly smallholder, traditional and rain-fed, and the farming systems
vary. There are three main farming systems, crop only, livestock only and crop-livestock systems,
with the second and third systems giving rise to the prevailing animal production systems. The major
system practiced nationwide is mixed farming (crop-livestock system) where about 74 percent of the
rural households cultivate crops and rear some livestock (Oppong-Anane et al. 2008).
Non-ruminant production systems
Pigs: Semi-extensive pig production occurs under the traditional smallholder practice in the rural
areas. The system is based mainly on the indigenous Ashanti Black Forest pig which is found
throughout the country and constitutes about 70 percent of the national pig population. Crosses
between the indigenous and exotic breeds are also used in this system. The pigs are kept in pens and
given minimal feed based on household leftovers, and in particular fresh and boiled cassava and
cassava peels. In some cases, the pigs are allowed to scavenge for food. Intensive pig production
system is based mainly on the exotic Large White and Landrace breeds and their crosses. The
system, practiced mainly in the southern areas of the country is commercialized and may be
classified as small, medium or large scale (Oppong-Anane, 2010).
Ruminant production Systems
Sheep and Goats: The extensive sheep and goat production system, also known as traditional small
ruminant production system, consists largely of free grazing village flocks of Djallonké sheep and
goats normally exhibiting poor productivity. Diseases, mostly helminthiasis and peste des petits
ruminants (PPR), are the main causes of poor productivity and high mortality among the animals. This
system is progressively changing into semi-intensive system throughout the country. In the semi-
intensive system simple pens are provided for the animals within or attached to the owner’s house.
The system is based on cut and carry of forages and the use of household wastes. Various other
crop residues and by-products are also used. The intensive system is similar to that of the semi-
intensive except that in the former all the feed is provided in the pen. This system is commonly
practiced in the peri-urban areas (Oppong-Anane, 2010).
Cattle: The extensive beef cattle production system is the main cattle production system practiced
in the country and is based mainly on extensive grazing by smallholder herds. It is linked with a milk
production system whereby milk is shared between the herdsman and the calf, with the surplus
going to the market. In this system, settled farmers whose main occupation is crop cultivation own
cattle. Ownership may be direct, personal and individual, or in the form of trusteeship for family
property. Where a large herd is found, the family groups owning them may be several, varying
widely in size and in relationship. Very few cattle farms fall under the semi-intensive system. In this
commercial production system, cattle are owned mainly by professionals and businessmen living
elsewhere with little or no involvement in the management of the animals. A few farms belonging to
state institutions also fall under this system. In this case, cattle may graze on sown pastures as well as
natural pastures which are often improved with introduced forage legumes (Oppong-Anane, 2010).
There are no intensive cattle farms in the country.
11
Over 90 percent of the domestic milk production comes from agro-pastoral herds with low milk off-
take of about 0.8 and 0.4 kg/cow/day in the rainy and dry seasons respectively. The local breeds of
cattle used in this system have low genetic potential for milk production and remain mediocre
producers even when the best possible feeding and husbandry conditions are available. There are
about a hundred households keeping between one and six dairy cows at their backyards on
commercial basis, and using Friesian - Sanga crossbreds or Jersey cows in the peri-urban Savannah
areas of the Greater Accra and Eastern regions. Such cattle may produce as much as 2 700 kg of
milk per lactation (Oppong-Anane, 2008).
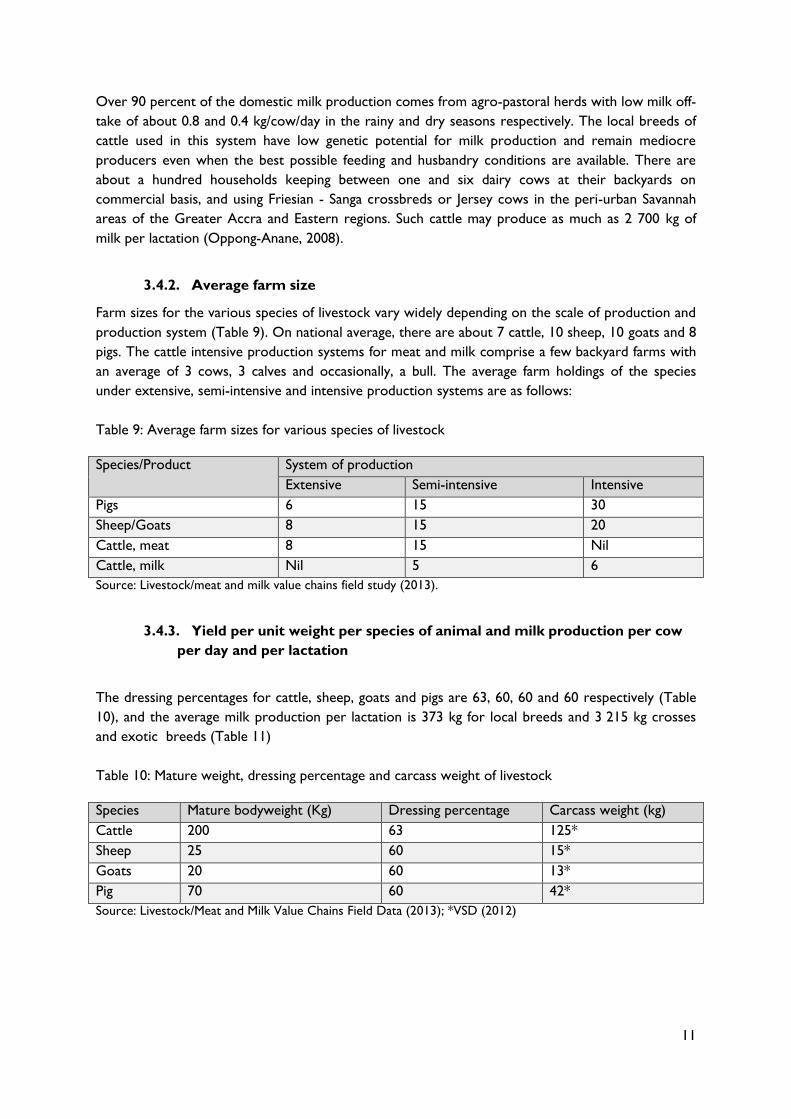
3.4.2. Average farm size
Farm sizes for the various species of livestock vary widely depending on the scale of production and
production system (Table 9). On national average, there are about 7 cattle, 10 sheep, 10 goats and 8
pigs. The cattle intensive production systems for meat and milk comprise a few backyard farms with
an average of 3 cows, 3 calves and occasionally, a bull. The average farm holdings of the species
under extensive, semi-intensive and intensive production systems are as follows:
Table 9: Average farm sizes for various species of livestock
Species/Product System of production
Extensive Semi-intensive Intensive
Pigs 6 15 30
Sheep/Goats 8 15 20
Cattle, meat 8 15 Nil
Cattle, milk Nil 5 6
Source: Livestock/meat and milk value chains field study (2013).
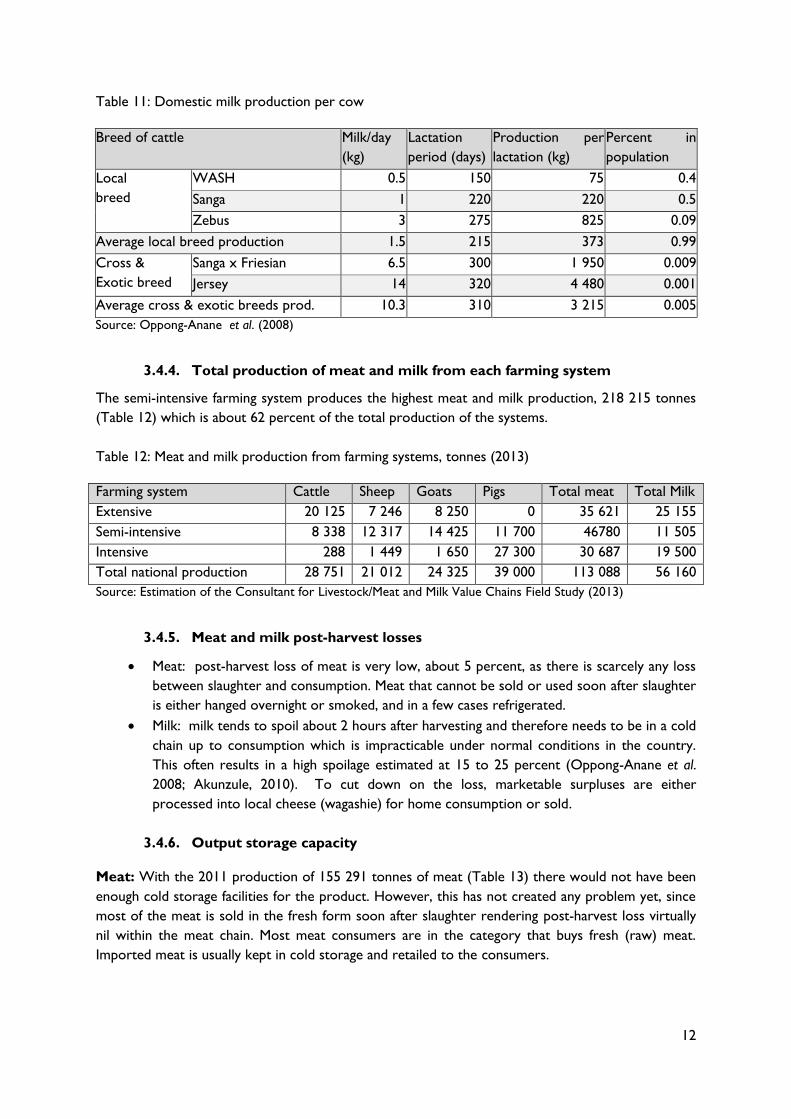
3.4.3. Yield per unit weight per species of animal and milk production per cow
per day and per lactation
The dressing percentages for cattle, sheep, goats and pigs are 63, 60, 60 and 60 respectively (Table
10), and the average milk production per lactation is 373 kg for local breeds and 3 215 kg crosses
and exotic breeds (Table 11)
Table 10: Mature weight, dressing percentage and carcass weight of livestock
Species Mature bodyweight (Kg) Dressing percentage Carcass weight (kg)
Cattle 200 63 125*
Sheep 25 60 15*
Goats 20 60 13*
Pig 70 60 42*
Source: Livestock/Meat and Milk Value Chains Field Data (2013); *VSD (2012)
12
Table 11: Domestic milk production per cow
Breed of cattle Milk/day
(kg)
Lactation
period (days)
Production per
lactation (kg)
Percent in
population
Local
breed
WASH 0.5 150 75 0.4
Sanga 1 220 220 0.5
Zebus 3 275 825 0.09
Average local breed production 1.5 215 373 0.99
Cross &
Exotic breed
Sanga x Friesian 6.5 300 1 950 0.009
Jersey 14 320 4 480 0.001
Average cross & exotic breeds prod. 10.3 310 3 215 0.005
Source: Oppong-Anane et al. (2008)
3.4.4. Total production of meat and milk from each farming system
The semi-intensive farming system produces the highest meat and milk production, 218 215 tonnes
(Table 12) which is about 62 percent of the total production of the systems.
Table 12: Meat and milk production from farming systems, tonnes (2013)
Farming system Cattle Sheep Goats Pigs Total meat Total Milk
Extensive 20 125 7 246 8 250 0 35 621 25 155
Semi-intensive 8 338 12 317 14 425 11 700 46780 11 505
Intensive 288 1 449 1 650 27 300 30 687 19 500
Total national production 28 751 21 012 24 325 39 000 113 088 56 160
Source: Estimation of the Consultant for Livestock/Meat and Milk Value Chains Field Study (2013)
3.4.5. Meat and milk post-harvest losses
Meat: post-harvest loss of meat is very low, about 5 percent, as there is scarcely any loss
between slaughter and consumption. Meat that cannot be sold or used soon after slaughter
is either hanged overnight or smoked, and in a few cases refrigerated.
Milk: milk tends to spoil about 2 hours after harvesting and therefore needs to be in a cold
chain up to consumption which is impracticable under normal conditions in the country.
This often results in a high spoilage estimated at 15 to 25 percent (Oppong-Anane et al.
2008; Akunzule, 2010). To cut down on the loss, marketable surpluses are either
processed into local cheese (wagashie) for home consumption or sold.
3.4.6. Output storage capacity
Meat: With the 2011 production of 155 291 tonnes of meat (Table 13) there would not have been
enough cold storage facilities for the product. However, this has not created any problem yet, since
most of the meat is sold in the fresh form soon after slaughter rendering post-harvest loss virtually
nil within the meat chain. Most meat consumers are in the category that buys fresh (raw) meat.
Imported meat is usually kept in cold storage and retailed to the consumers.
13
Milk: Domestic milk production is far more than the available storage facilities can cope with. Apart
from the government established Amrahia Dairy Farm and the few private mini dairy centres such as
Wankam Farms and that of the research institutions that have bulk tanks and other storage facilities,
storage for raw milk does not exist. Milk is mostly sold fresh.
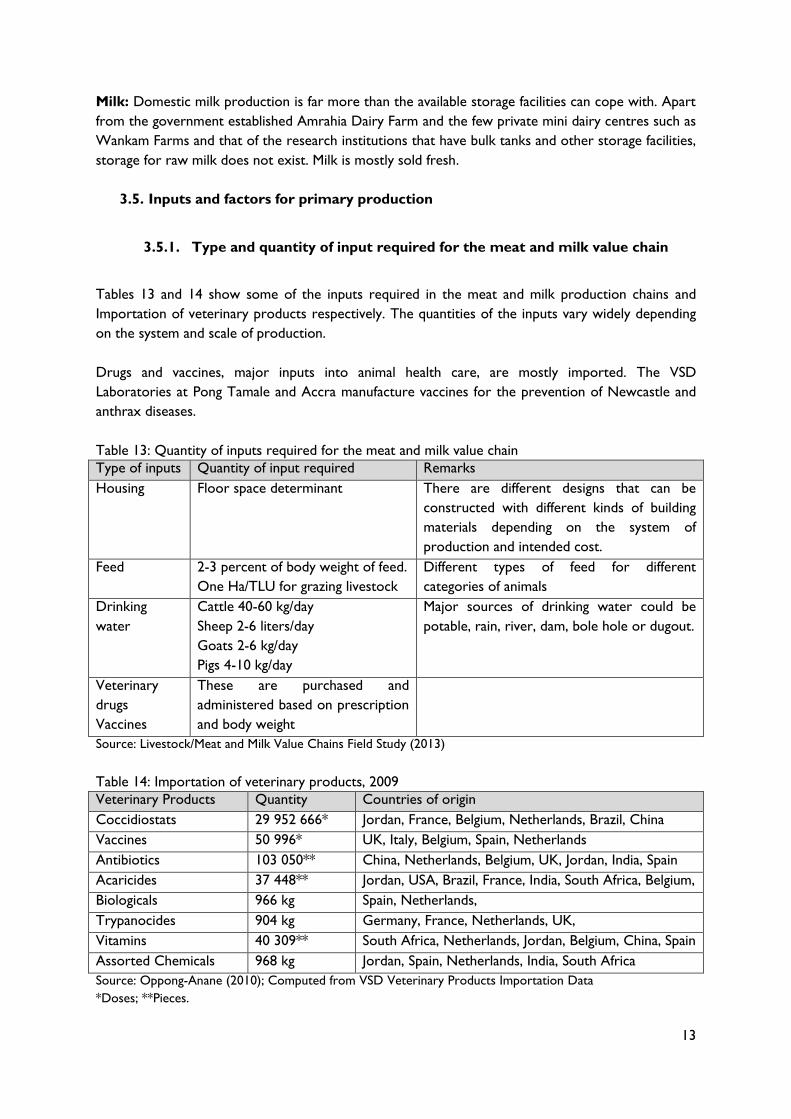
3.5. Inputs and factors for primary production
3.5.1. Type and quantity of input required for the meat and milk value chain
Tables 13 and 14 show some of the inputs required in the meat and milk production chains and
Importation of veterinary products respectively. The quantities of the inputs vary widely depending
on the system and scale of production.
Drugs and vaccines, major inputs into animal health care, are mostly imported. The VSD
Laboratories at Pong Tamale and Accra manufacture vaccines for the prevention of Newcastle and
anthrax diseases.
Table 13: Quantity of inputs required for the meat and milk value chain
Type of inputs Quantity of input required Remarks
Housing
Floor space determinant There are different designs that can be
constructed with different kinds of building
materials depending on the system of
production and intended cost.
Feed
2-3 percent of body weight of feed.
One Ha/TLU for grazing livestock
Different types of feed for different
categories of animals
Drinking
water
Cattle 40-60 kg/day
Sheep 2-6 liters/day
Goats 2-6 kg/day
Pigs 4-10 kg/day
Major sources of drinking water could be
potable, rain, river, dam, bole hole or dugout.
Veterinary
drugs
Vaccines
These are purchased and
administered based on prescription
and body weight
Source: Livestock/Meat and Milk Value Chains Field Study (2013)
Table 14: Importation of veterinary products, 2009
Veterinary Products Quantity Countries of origin
Coccidiostats 29 952 666* Jordan, France, Belgium, Netherlands, Brazil, China
Vaccines 50 996* UK, Italy, Belgium, Spain, Netherlands
Antibiotics 103 050** China, Netherlands, Belgium, UK, Jordan, India, Spain
Acaricides 37 448** Jordan, USA, Brazil, France, India, South Africa, Belgium,
Biologicals 966 kg Spain, Netherlands,
Trypanocides 904 kg Germany, France, Netherlands, UK,
Vitamins 40 309** South Africa, Netherlands, Jordan, Belgium, China, Spain
Assorted Chemicals 968 kg Jordan, Spain, Netherlands, India, South Africa
Source: Oppong-Anane (2010); Computed from VSD Veterinary Products Importation Data
*Doses; **Pieces.
14
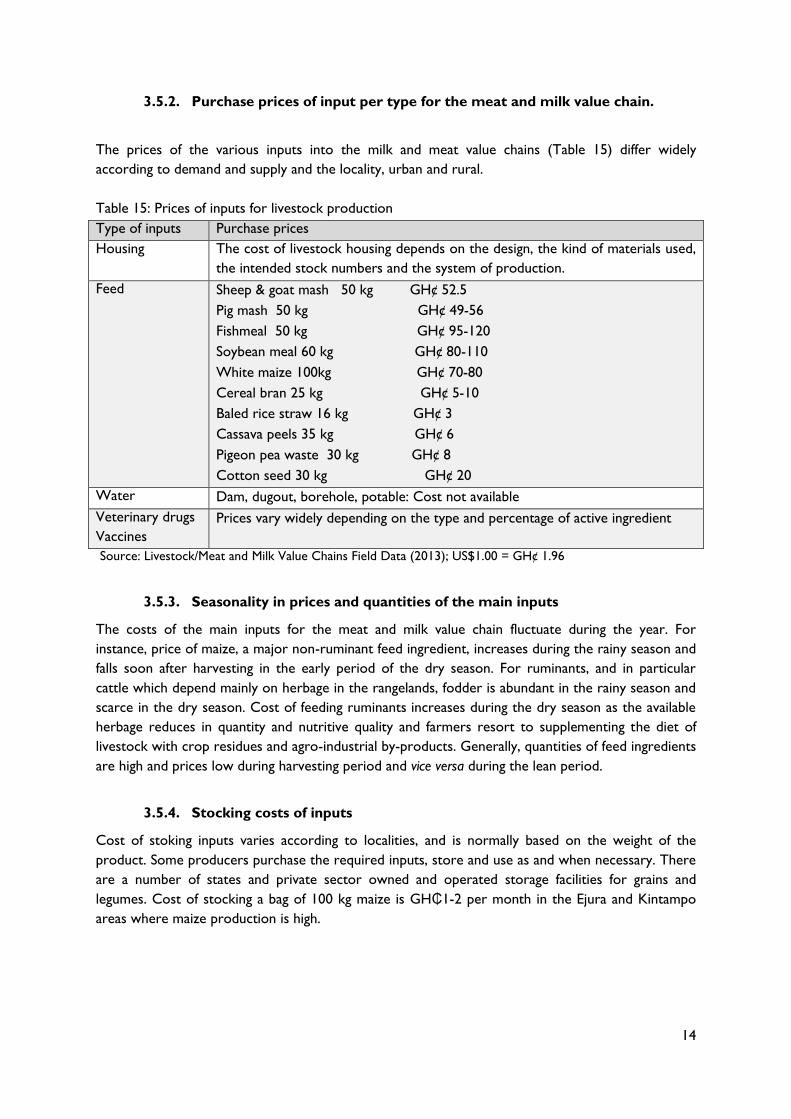
3.5.2. Purchase prices of input per type for the meat and milk value chain.
The prices of the various inputs into the milk and meat value chains (Table 15) differ widely
according to demand and supply and the locality, urban and rural.
Table 15: Prices of inputs for livestock production
Type of inputs Purchase prices
Housing The cost of livestock housing depends on the design, the kind of materials used,
the intended stock numbers and the system of production.
Feed
Sheep & goat mash 50 kg GH¢ 52.5
Pig mash 50 kg GH¢ 49-56
Fishmeal 50 kg GH¢ 95-120
Soybean meal 60 kg GH¢ 80-110
White maize 100kg GH¢ 70-80
Cereal bran 25 kg GH¢ 5-10
Baled rice straw 16 kg GH¢ 3
Cassava peels 35 kg GH¢ 6
Pigeon pea waste 30 kg GH¢ 8
Cotton seed 30 kg GH¢ 20
Water Dam, dugout, borehole, potable: Cost not available
Veterinary drugs
Vaccines
Prices vary widely depending on the type and percentage of active ingredient
Source: Livestock/Meat and Milk Value Chains Field Data (2013); US$1.00 = GH¢ 1.96
3.5.3. Seasonality in prices and quantities of the main inputs
The costs of the main inputs for the meat and milk value chain fluctuate during the year. For
instance, price of maize, a major non-ruminant feed ingredient, increases during the rainy season and
falls soon after harvesting in the early period of the dry season. For ruminants, and in particular
cattle which depend mainly on herbage in the rangelands, fodder is abundant in the rainy season and
scarce in the dry season. Cost of feeding ruminants increases during the dry season as the available
herbage reduces in quantity and nutritive quality and farmers resort to supplementing the diet of
livestock with crop residues and agro-industrial by-products. Generally, quantities of feed ingredients
are high and prices low during harvesting period and vice versa during the lean period.
3.5.4. Stocking costs of inputs
Cost of stoking inputs varies according to localities, and is normally based on the weight of the
product. Some producers purchase the required inputs, store and use as and when necessary. There
are a number of states and private sector owned and operated storage facilities for grains and
legumes. Cost of stocking a bag of 100 kg maize is GH₵1-2 per month in the Ejura and Kintampo
areas where maize production is high.
15
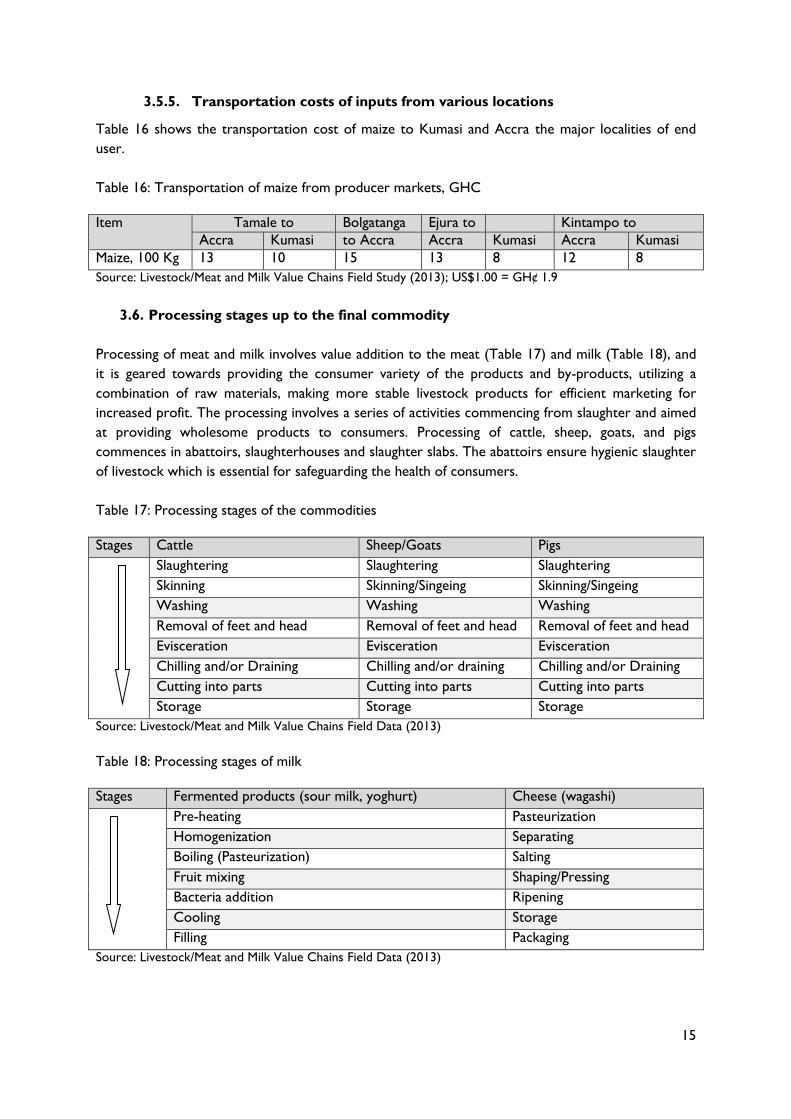
3.5.5. Transportation costs of inputs from various locations
Table 16 shows the transportation cost of maize to Kumasi and Accra the major localities of end
user.
Table 16: Transportation of maize from producer markets, GHC
Item Tamale to Bolgatanga Ejura to Kintampo to
Accra Kumasi to Accra Accra Kumasi Accra Kumasi
Maize, 100 Kg 13 10 15 13 8 12 8
Source: Livestock/Meat and Milk Value Chains Field Study (2013); US$1.00 = GH¢ 1.9
3.6. Processing stages up to the final commodity
Processing of meat and milk involves value addition to the meat (Table 17) and milk (Table 18), and
it is geared towards providing the consumer variety of the products and by-products, utilizing a
combination of raw materials, making more stable livestock products for efficient marketing for
increased profit. The processing involves a series of activities commencing from slaughter and aimed
at providing wholesome products to consumers. Processing of cattle, sheep, goats, and pigs
commences in abattoirs, slaughterhouses and slaughter slabs. The abattoirs ensure hygienic slaughter
of livestock which is essential for safeguarding the health of consumers.
Table 17: Processing stages of the commodities
Stages Cattle Sheep/Goats Pigs
Slaughtering Slaughtering Slaughtering
Skinning Skinning/Singeing Skinning/Singeing
Washing Washing Washing
Removal of feet and head Removal of feet and head Removal of feet and head
Evisceration Evisceration Evisceration
Chilling and/or Draining Chilling and/or draining Chilling and/or Draining
Cutting into parts Cutting into parts Cutting into parts
Storage Storage Storage
Source: Livestock/Meat and Milk Value Chains Field Data (2013)
Table 18: Processing stages of milk
Stages Fermented products (sour milk, yoghurt) Cheese (wagashi)
Pre-heating Pasteurization
Homogenization Separating
Boiling (Pasteurization) Salting
Fruit mixing Shaping/Pressing
Bacteria addition Ripening
Cooling Storage
Filling Packaging
Source: Livestock/Meat and Milk Value Chains Field Data (2013)
16
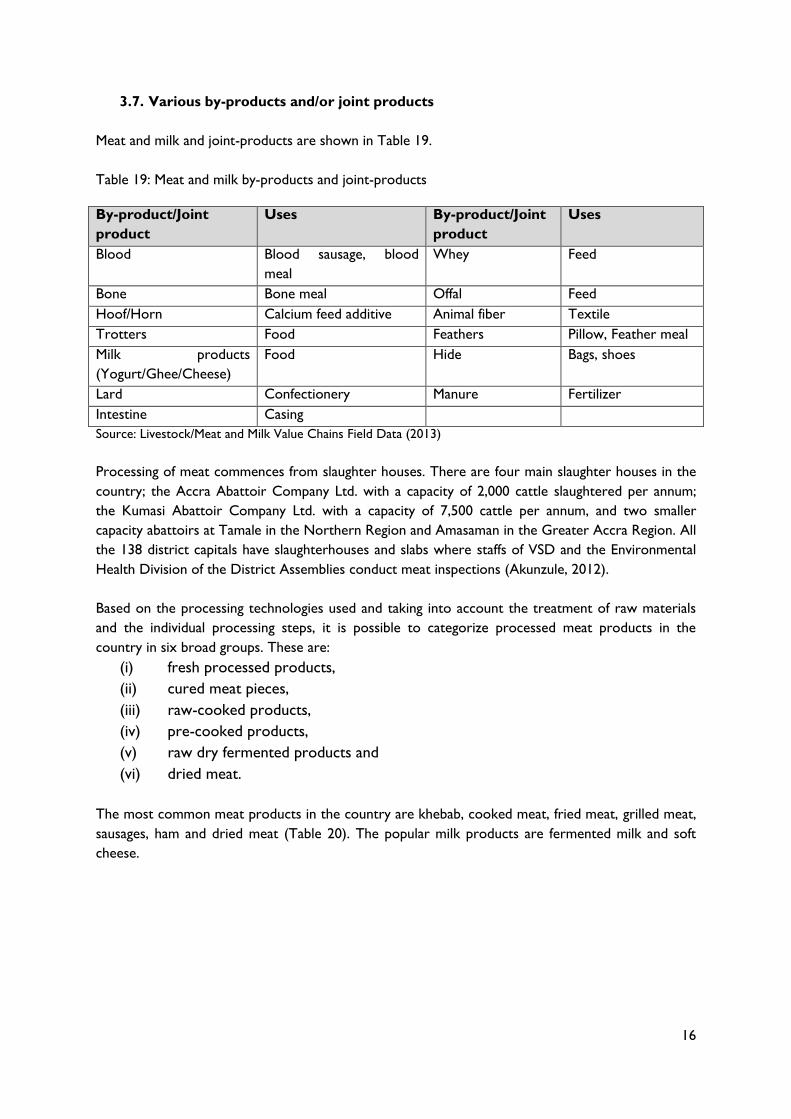
3.7. Various by-products and/or joint products
Meat and milk and joint-products are shown in Table 19.
Table 19: Meat and milk by-products and joint-products
By-product/Joint
product
Uses By-product/Joint
product
Uses
Blood Blood sausage, blood
meal
Whey Feed
Bone Bone meal Offal Feed
Hoof/Horn Calcium feed additive Animal fiber Textile
Trotters Food Feathers Pillow, Feather meal
Milk products
(Yogurt/Ghee/Cheese)
Food Hide Bags, shoes
Lard Confectionery Manure Fertilizer
Intestine Casing
Source: Livestock/Meat and Milk Value Chains Field Data (2013)
Processing of meat commences from slaughter houses. There are four main slaughter houses in the
country; the Accra Abattoir Company Ltd. with a capacity of 2,000 cattle slaughtered per annum;
the Kumasi Abattoir Company Ltd. with a capacity of 7,500 cattle per annum, and two smaller
capacity abattoirs at Tamale in the Northern Region and Amasaman in the Greater Accra Region. All
the 138 district capitals have slaughterhouses and slabs where staffs of VSD and the Environmental
Health Division of the District Assemblies conduct meat inspections (Akunzule, 2012).
Based on the processing technologies used and taking into account the treatment of raw materials
and the individual processing steps, it is possible to categorize processed meat products in the
country in six broad groups. These are:
(i) fresh processed products,
(ii) cured meat pieces,
(iii) raw-cooked products,
(iv) pre-cooked products,
(v) raw dry fermented products and
(vi) dried meat.
The most common meat products in the country are khebab, cooked meat, fried meat, grilled meat,
sausages, ham and dried meat (Table 20). The popular milk products are fermented milk and soft
cheese.

17
Table 20: Processing level of meat and milk
Cattle Sheep Goat Pig Milk
Beef Mutton Chevron Pork Raw milk
Khebab Khebab Khebab Khebab Pasteurized milk
Sausage Sausage Sausage Sausage Fermented milk
Grilled Grilled Grilled Grilled Cheese
Fried Fried Fried Fried Butter
Cooked Cooked Cooked Cooked Ghee
Source: Livestock/Meat and Milk Value Chains Field Data (2013)
3.8. Geographical location of the different value chain components
Most of the meat from ruminant sources is obtained from the northern part of Ghana while poultry
and pork are mostly obtained from commercial farms in the middle and southern Ghana. Milk comes
mainly from the northern and coastal areas. Table 21 shows the geographical actors in the meat and
milk value chain.
Table 21: Geographical location of components in the meat and milk value chain
Components Geographical location
Meat Milk
Input suppliers
Feed millers
Drug shops
Accra, Kumasi
Regional and district capitals
Accra, Kumasi
Regional and district capitals
Primary producers
Maize
Soybeans
Livestock
Countrywide
Derived Savannah zone
Countrywide
Countrywide
Derived Savannah zone
Countrywide/MoFA livestock stations
Marketing
Middlemen
Slaughterhouses
Processors
Wholesalers
Retailers
Countrywide
Regional and district centres
Regional centres
Regional and district centres
Countrywide
Countrywide
On-farm/Regional centres
Regional and district centres
Countrywide
Consumers Countrywide Countrywide
Source: Adapted from Akunzule (2012)
3.9. Amount of land and other natural resources allocated to the meat and milk
value chains
Rangeland comprising savannah woodlands and unimproved pastures which cover an area of 89 000
square kilometers, i.e. 37 percent of total land area of Ghaba, is available for grazing of livestock and
wildlife. In addition, some parts of the 45,000 square kilometers of land under bush fallow and other
uses are also available for grazing (SRID, 2011). The decline in the size and condition of the
rangelands in the last 30 years (Alhassan et al., 1999; Oppong-Anane et al., 2008) is manifested in the
loss of plant and wildlife species, the seasonality and drying out of water bodies resulting from a
18
number of factors with varying degrees of influence, with bush burning accounting for the greatest
change (Oppong-Anane et al., 2008).
3.10. Resources
There are no specifically reserved land areas in Ghana for grazing except on state established
livestock stations even though some communities do have grazing lands overs own with hardy and
nutritious leguminous forages for communal use. Moreover, land is also becoming limited due to
competition from estate developers and most commercial poultry and pig farms in the peri-urban
areas compete with settlements and some have had to fold up. Water is a scarce resource in some
communities, and there is competition between man and livestock for water. However, there are a
number of stock water development projects to address the problem.
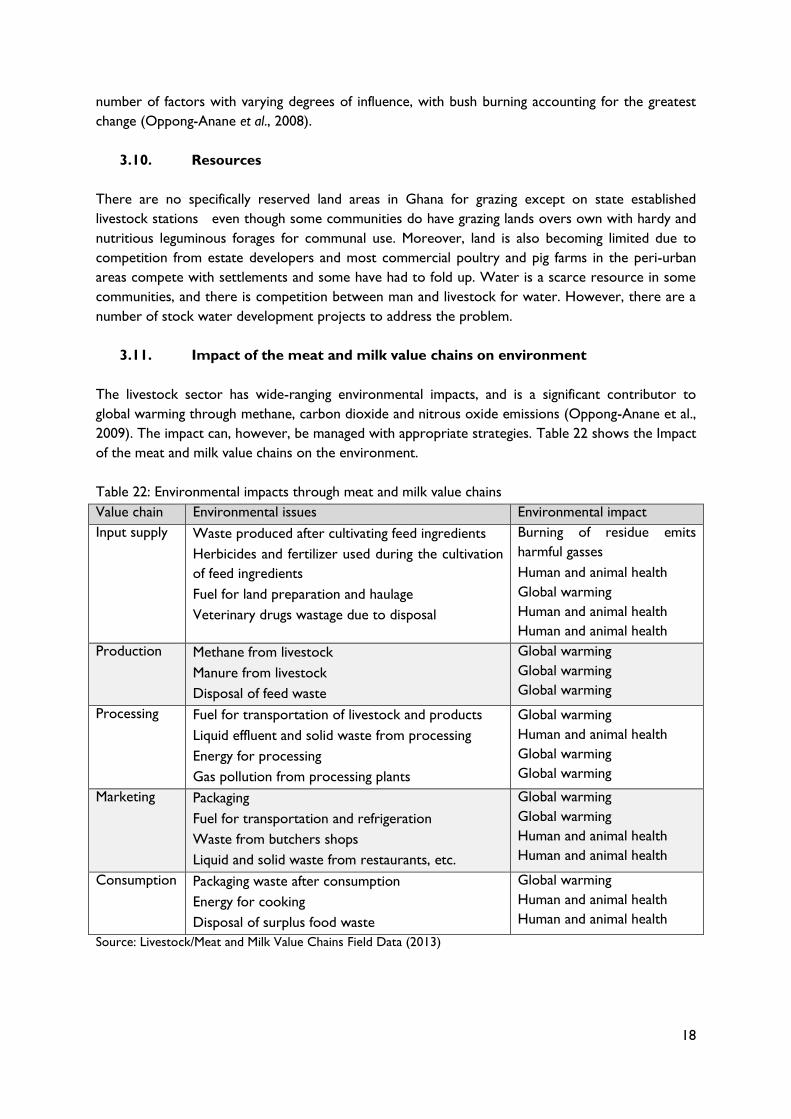
3.11. Impact of the meat and milk value chains on environment
The livestock sector has wide-ranging environmental impacts, and is a significant contributor to
global warming through methane, carbon dioxide and nitrous oxide emissions (Oppong-Anane et al.,
2009). The impact can, however, be managed with appropriate strategies. Table 22 shows the Impact
of the meat and milk value chains on the environment.
Table 22: Environmental impacts through meat and milk value chains
Value chain Environmental issues Environmental impact
Input supply Waste produced after cultivating feed ingredients
Herbicides and fertilizer used during the cultivation
of feed ingredients
Fuel for land preparation and haulage
Veterinary drugs wastage due to disposal
Burning of residue emits
harmful gasses
Human and animal health
Global warming
Human and animal health
Human and animal health
Production Methane from livestock
Manure from livestock
Disposal of feed waste
Global warming
Global warming
Global warming
Processing Fuel for transportation of livestock and products
Liquid effluent and solid waste from processing
Energy for processing
Gas pollution from processing plants
Global warming
Human and animal health
Global warming
Global warming
Marketing Packaging
Fuel for transportation and refrigeration
Waste from butchers shops
Liquid and solid waste from restaurants, etc.
Global warming
Global warming
Human and animal health
Human and animal health
Consumption Packaging waste after consumption
Energy for cooking
Disposal of surplus food waste
Global warming
Human and animal health
Human and animal health
Source: Livestock/Meat and Milk Value Chains Field Data (2013)
19
3.12. Production and value addition potential
High production and value addition potential exist for all the livestock commodities in particular
poultry and pigs and milk as a product. The value addition potential of pigs is higher than that of the
ruminants as pork may be processed into more popular products. A major value addition potential
of ruminants that has not been fully exploited in Ghana is the skin for leather products.
3.13. Number of value chain actors by component
There is no available data on the number of value chain actors in the country. The meat and milk
value chain actors comprise:
Inputs and services providers
Input dealers for the provision of inputs
Transporters of various inputs
Feed millers for the provision of feed.
Livestock breeders for the supply of breeding animals
Drug suppliers for provision of drugs and vaccines.
Farmers for primary production
Farmers producing maize and soybean for livestock feed
Livestock producers: pigs, cattle, sheep and goats
Market actors
Middlemen for intermediary trade or marketing
Butchers for slaughtering and cutting of meat
Processors for value addition to meat and milk
Wholesalers for storage and sale of meat and milk and by-products
Retailers for sale of meat and milk and by-products
Consumers
Industrial (hotels, restaurants, etc.)
Home consumers
3.15. Current and potential (domestic) demand of meat and milk
With a current domestic meat consumption estimated at 13.9 kg/capita/annum, it is estimated that
for a population of about 25.20 million the country needs a total of 350 280 tonnes of meat to meet
demand.
Also with a current milk consumption estimated at 8.48 kg/capita/annum a total of 221 760 tonnes of
milk would be required to meet national demands. The total current demand for meat and milk,
572 040 tonnes, is significantly higher than the potential domestic production in view of the fact that
the total production of meat, eggs and milk was 234 041 tonnes in 2011. There is therefore a high
potential demand for the products considering the increasing demand that will come from increasing
incomes, growing population and increasing urbanization.
20
3.16. Current and potential (foreign) demand of meat and milk
There is no current export demand for meat, milk and dairy products from Ghana, neither is there
any potential for exporting livestock products in the foreseeable future. Nevertheless, a total of
79.26 tonnes of livestock meat and offal amounting to US$1 141.00 was exported in 2011 (MoFA,
2012).
3.17. Specific features of products, including product differentiation
There are different kinds of clients who consume milk and meat products in Ghana.
It is mostly foreign clients and a few persons in urban areas who buy choice cuts of meat such as
pork chops, spare ribs and fillet that are not provided by butchers at meat shops, but are obtainable
mainly from supermarkets. Though milk is sold fresh, there is a relatively higher degree of product
differentiation. Fresh milk is processed into wagashi cheese, fermented cultured milk and ghee
targeted at clients of Hausa and northern Ghana extraction. The high valued milk products are
available only in supermarkets.
3.18. The products capacity to fulfill international requirements (sanitary and
other
Sanitary condition for slaughtering and processing of meat in Ghana has improved significantly.
However, the capacity to export in the first place and to fulfill international requirements is low. The
law concerning the inspection of meat (Local Government Act, 1961; Act 54) has not been reviewed
nor updated thus making it inapplicable in the present time. For instance meat inspection function is
not a monopoly of the VSD as the mandate for meat inspection by the Public Health Department of
the Metropolitan, Municipal and District Assemblies has not been repealed though the later may not
have the capacity to do so.
3.19. Urban rural relationships
Generally most producers of meat and milk are in the rural areas whereas the majority of
consumers are in the urban areas. The demand and consumption of livestock meat and dairy
products are highly influenced by household income. Per capital consumption of the products are
higher in urban than rural areas because of the high income level differentials. However, a number of
factors affect fresh milk consumption in the urban areas where most people are not used to
consuming fresh milk. These include lactose intolerance and unwholesome milking procedures used
by some herdsmen (Akunzule, 2012) and lack of good cold/refrigeration facilities for milk.
Hides and skin from cattle, sheep and goats are used for the leather industry and in particular for the
manufacturing of bags and footwear in the northern regions of the country. Cattle (bullocks) are
used for animal traction to help with land cultivation, carting of water and feed for livestock as well
as carting manure for crop production. Livestock and livestock products are sometimes sold to
generate income to finance crop production.
21
3.20. Synergies with other activities
Hides and skin from cattle, sheep and goats are used for the leather industry and in particular for the
manufacturing of bags and footwear in the northern regions of the country. Cattle (bullocks) are
used for animal traction to help with land cultivation, carting of water and feed for livestock as well
as carting manure for crop production. Livestock and livestock products are sometimes sold to
generate income to finance crop production.
3.21. Role in local production systems
Livestock/meat and milk value chains play important roles in the livestock productions systems.
However the impact is not well felt as a result of the numerous challenges facing the chains.
Livestock production is a major source of income for the rural household, enhances livelihoods and
provides employment (see Section 9.5).
22
4. INFRASTRUCTURE AND OTHER SUPPORT SERVICES
4.1 Transport
Livestock are transported by road and in a few cases by boats on the Volta Lake. Live animals are
generally transported in open vehicles, by hoof, on bicycles and motorbikes. Cold storage facilities
for freezing meat prior to transportation to reduce contamination are often not available. Most
herdsmen and producers normally sell their milk at the kraal (farm gate) or in their homes and only
12 percent transport it to a sale point. Most market intermediaries (72 percent) also transport their
milk from the collection point on foot; 21 percent use public transport, 6 percent use bicycles, 1
percent use their own vehicles, and only 1 percent of market agents hire vehicles (Omore et al.,
2009).
4.2 Packaging and stocking costs of output
Meat sold at butchers and meat shops are placed in polythene bags for customers, whereas meat
sold in the supermarkets are appropriately packed in sealed polythene bags. Cold stores provide
storage facilities for imported meat but may also store locally produced meat for short periods. A
100 kg meat attracts a fee of GH₵20.00 per week on the average.
4.3 Equipment, required investment, facilities and related
Various facilities and equipment are required for effective performance along the livestock/meat and
milk value chain. However, the requirement and investment vary widely and depend, among others,
on the type of species of livestock kept, system of production, type and scale of processing and
marketing. Related depreciation also varies widely and depends mostly on the cost and quality of
investment. Required iinvestments and equipment for livestock/meat and milk production include.
Production: land, housing, machinery and equipment, water source, breeding stock, feed,
health care facilities, capital.
Transformation: abattoirs, meat and dairy processing industries, cleaning and disinfection
equipment, cold storage facilities, capital.
Commercialization: livestock markets, transport, storage, vans and trucks, capital.
Services/equipment: generators, fridges and deep freezers (for storage of vaccines and
biological specimen for post mortem), laboratories, skilled labour, capital.
4.4 Extension and technical support
The Directorate of Agricultural Extension Services of MoFA oversees agricultural technology
diffusion through the management of an extension delivery service and ensures that appropriate
technology is transferred to actors in the livestock/meat and milk value chains in the country. The
core functions of the directorate are (i) Extension Policy formulation and Planning; (ii) Coordination
of Extension activities; (iii) Provision of Technical support to the regions and districts in the planning
and implementation of extension activities; (iv) Monitoring and Evaluation of all extension activities
under MoFA. Currently, Ghana's agricultural extension policy is the Unified Extension System geared
towards improving the extension delivery. The uptake of research output has been rather low, part
of the reason being the top-down approach to research.
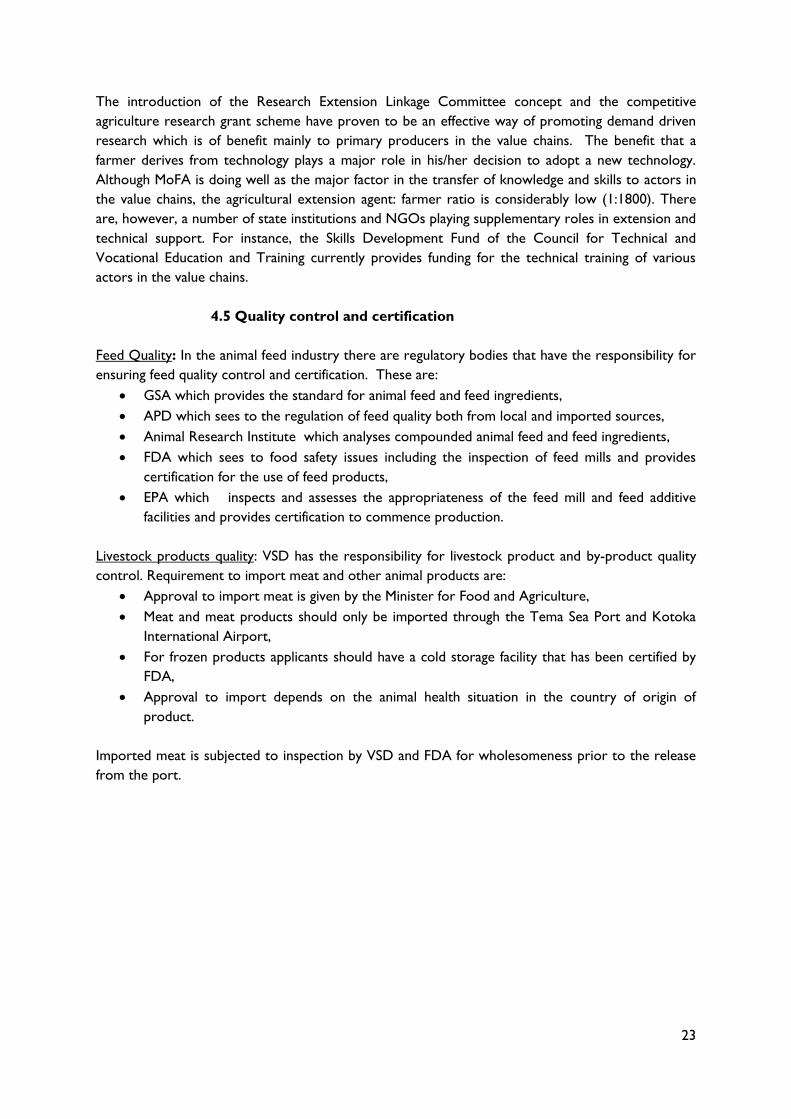
23
The introduction of the Research Extension Linkage Committee concept and the competitive
agriculture research grant scheme have proven to be an effective way of promoting demand driven
research which is of benefit mainly to primary producers in the value chains. The benefit that a
farmer derives from technology plays a major role in his/her decision to adopt a new technology.
Although MoFA is doing well as the major factor in the transfer of knowledge and skills to actors in
the value chains, the agricultural extension agent: farmer ratio is considerably low (1:1800). There
are, however, a number of state institutions and NGOs playing supplementary roles in extension and
technical support. For instance, the Skills Development Fund of the Council for Technical and
Vocational Education and Training currently provides funding for the technical training of various
actors in the value chains.
4.5 Quality control and certification
Feed Quality: In the animal feed industry there are regulatory bodies that have the responsibility for
ensuring feed quality control and certification. These are:
GSA which provides the standard for animal feed and feed ingredients,
APD which sees to the regulation of feed quality both from local and imported sources,
Animal Research Institute which analyses compounded animal feed and feed ingredients,
FDA which sees to food safety issues including the inspection of feed mills and provides
certification for the use of feed products,
EPA which inspects and assesses the appropriateness of the feed mill and feed additive
facilities and provides certification to commence production.
Livestock products quality: VSD has the responsibility for livestock product and by-product quality
control. Requirement to import meat and other animal products are:
Approval to import meat is given by the Minister for Food and Agriculture,
Meat and meat products should only be imported through the Tema Sea Port and Kotoka
International Airport,
For frozen products applicants should have a cold storage facility that has been certified by
FDA,
Approval to import depends on the animal health situation in the country of origin of
product.
Imported meat is subjected to inspection by VSD and FDA for wholesomeness prior to the release
from the port.
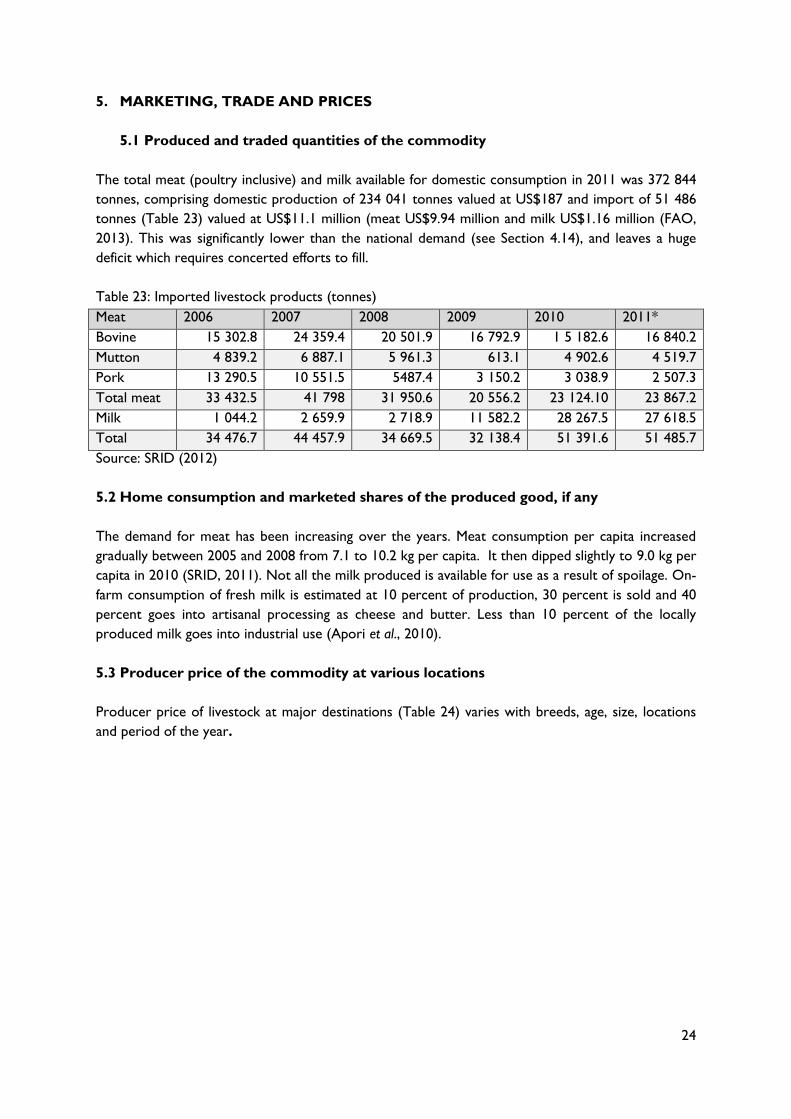
24
5. MARKETING, TRADE AND PRICES
5.1 Produced and traded quantities of the commodity
The total meat (poultry inclusive) and milk available for domestic consumption in 2011 was 372 844
tonnes, comprising domestic production of 234 041 tonnes valued at US$187 and import of 51 486
tonnes (Table 23) valued at US$11.1 million (meat US$9.94 million and milk US$1.16 million (FAO,
2013). This was significantly lower than the national demand (see Section 4.14), and leaves a huge
deficit which requires concerted efforts to fill.
Table 23: Imported livestock products (tonnes)
Meat 2006 2007 2008 2009 2010 2011*
Bovine 15 302.8 24 359.4 20 501.9 16 792.9 1 5 182.6 16 840.2
Mutton 4 839.2 6 887.1 5 961.3 613.1 4 902.6 4 519.7
Pork 13 290.5 10 551.5 5487.4 3 150.2 3 038.9 2 507.3
Total meat 33 432.5 41 798 31 950.6 20 556.2 23 124.10 23 867.2
Milk 1 044.2 2 659.9 2 718.9 11 582.2 28 267.5 27 618.5
Total 34 476.7 44 457.9 34 669.5 32 138.4 51 391.6 51 485.7
Source: SRID (2012)
5.2 Home consumption and marketed shares of the produced good, if any
The demand for meat has been increasing over the years. Meat consumption per capita increased
gradually between 2005 and 2008 from 7.1 to 10.2 kg per capita. It then dipped slightly to 9.0 kg per
capita in 2010 (SRID, 2011). Not all the milk produced is available for use as a result of spoilage. On-
farm consumption of fresh milk is estimated at 10 percent of production, 30 percent is sold and 40
percent goes into artisanal processing as cheese and butter. Less than 10 percent of the locally
produced milk goes into industrial use (Apori et al., 2010).
5.3 Producer price of the commodity at various locations
Producer price of livestock at major destinations (Table 24) varies with breeds, age, size, locations
and period of the year.
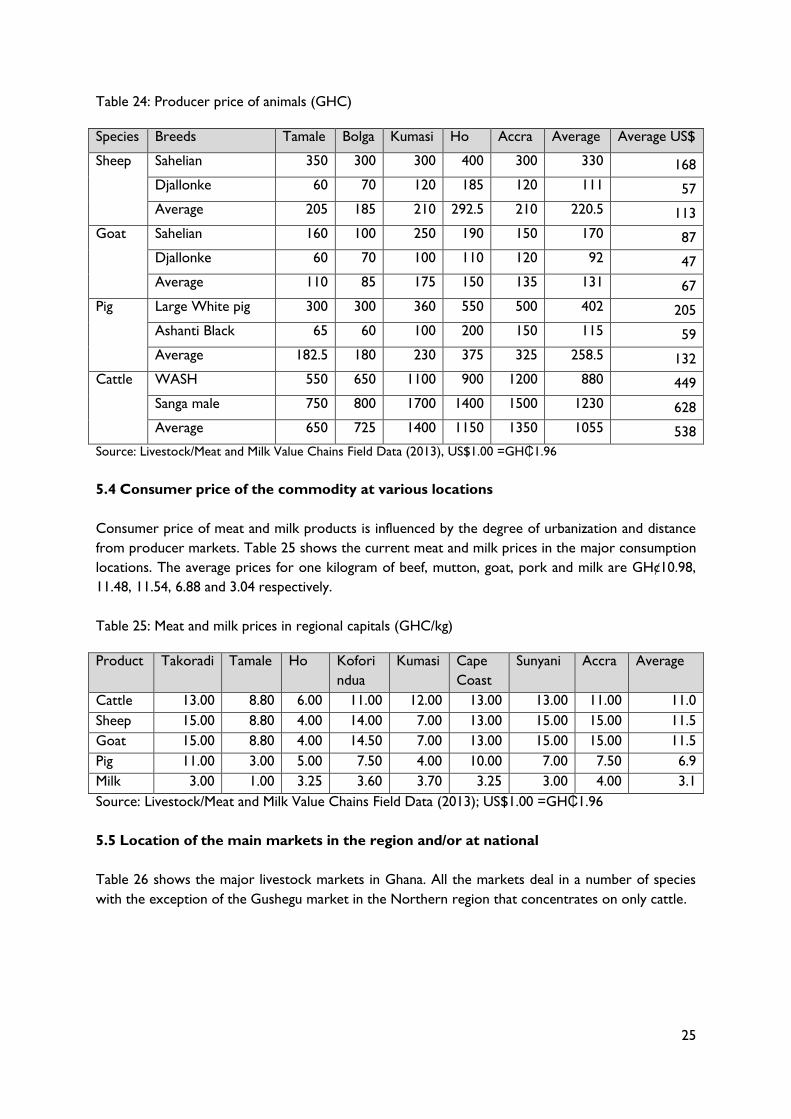
25
Table 24: Producer price of animals (GHC)
Species Breeds Tamale Bolga Kumasi Ho Accra Average Average US$
Sheep Sahelian 350 300 300 400 300 330 168
Djallonke 60 70 120 185 120 111 57
Average 205 185 210 292.5 210 220.5 113
Goat Sahelian 160 100 250 190 150 170 87
Djallonke 60 70 100 110 120 92 47
Average 110 85 175 150 135 131 67
Pig Large White pig 300 300 360 550 500 402 205
Ashanti Black 65 60 100 200 150 115 59
Average 182.5 180 230 375 325 258.5 132
Cattle WASH 550 650 1100 900 1200 880 449
Sanga male 750 800 1700 1400 1500 1230 628
Average 650 725 1400 1150 1350 1055 538
Source: Livestock/Meat and Milk Value Chains Field Data (2013), US$1.00 =GH₵1.96
5.4 Consumer price of the commodity at various locations
Consumer price of meat and milk products is influenced by the degree of urbanization and distance
from producer markets. Table 25 shows the current meat and milk prices in the major consumption
locations. The average prices for one kilogram of beef, mutton, goat, pork and milk are GH¢10.98,
11.48, 11.54, 6.88 and 3.04 respectively.
Table 25: Meat and milk prices in regional capitals (GHC/kg)
Product Takoradi Tamale Ho Kofori
ndua
Kumasi Cape
Coast
Sunyani Accra Average
Cattle 13.00 8.80 6.00 11.00 12.00 13.00 13.00 11.00 11.0
Sheep 15.00 8.80 4.00 14.00 7.00 13.00 15.00 15.00 11.5
Goat 15.00 8.80 4.00 14.50 7.00 13.00 15.00 15.00 11.5
Pig 11.00 3.00 5.00 7.50 4.00 10.00 7.00 7.50 6.9
Milk 3.00 1.00 3.25 3.60 3.70 3.25 3.00 4.00 3.1
Source: Livestock/Meat and Milk Value Chains Field Data (2013); US$1.00 =GH₵1.96
5.5 Location of the main markets in the region and/or at national
Table 26 shows the major livestock markets in Ghana. All the markets deal in a number of species
with the exception of the Gushegu market in the Northern region that concentrates on only cattle.
26
Table 26: Major livestock markets, 2012
Name of Market Location Species of animals
James Town Livestock Market Accra Sheep, goats
Turaku Livestock Market Tulaku,Tema Cattle, sheep, goats
Gushegu Market Gushegu Cattle
Techiman Market Techiman Cattle, sheep, goats
Kumasi Cattle Market Kumasi Cattle, sheep and goats
Bolgatanga Cattle Market Bolgatanga Cattle, sheep, goats
Navrongo Cattle Market Navrongo Cattle, sheep, goats
Bongo Cattle Market Bongo Cattle, sheep, goat
Paga Cattle Market Paga Cattle, sheep, goats
Source: Akunzule (2012)
The proportion of the population that does not consume livestock products is estimated at 5
percent. The assumption is that currently about 23.94 million people consume meat with less than
30 percent consuming locally produced milk and its products.
5.6 Seasonality in prices and quantities of the output
Meat prices do not change much as supply is evenly distributed throughout the year. However, total
production of milk in the dry season is about 60 percent of that in the rainy season thus raising the
price from GH¢2.5 to GH¢4.5 per kg.
5.7 Socio-economic features of current and potential customers, including
spending capacities
Meat: Livestock product consumption tends to increase with increasing literacy and household
income. Since meat consumption is often an indicator of the economic status of an individual, people
with a higher social or economic status, as in the urban areas,tend to consume more meat and high
quality meat products than in the rural areas. The estimated annual per capita consumption of meat,
poultry and fish by the urban households in 2007 (GH¢ 20.65) was about double that of rural
household (GSS, 2008).
Milk: The situation with milk and milk products to consumers is similar to that of meat. However,
per capita consumption of locally produced milk and dairy products is low in the urban areas as a
result of the perception that locally produced milk is not safe for consumption.
5.8 The degree of competitiveness (existence of monopolies or otherwise)
Meat: There is no competition from the large imports of meat and meat products with the
exception of poultry which are sold at lower prices and thus affects the growth of the local industry.
Milk: For the milk value chain, competition is almost non-existent.
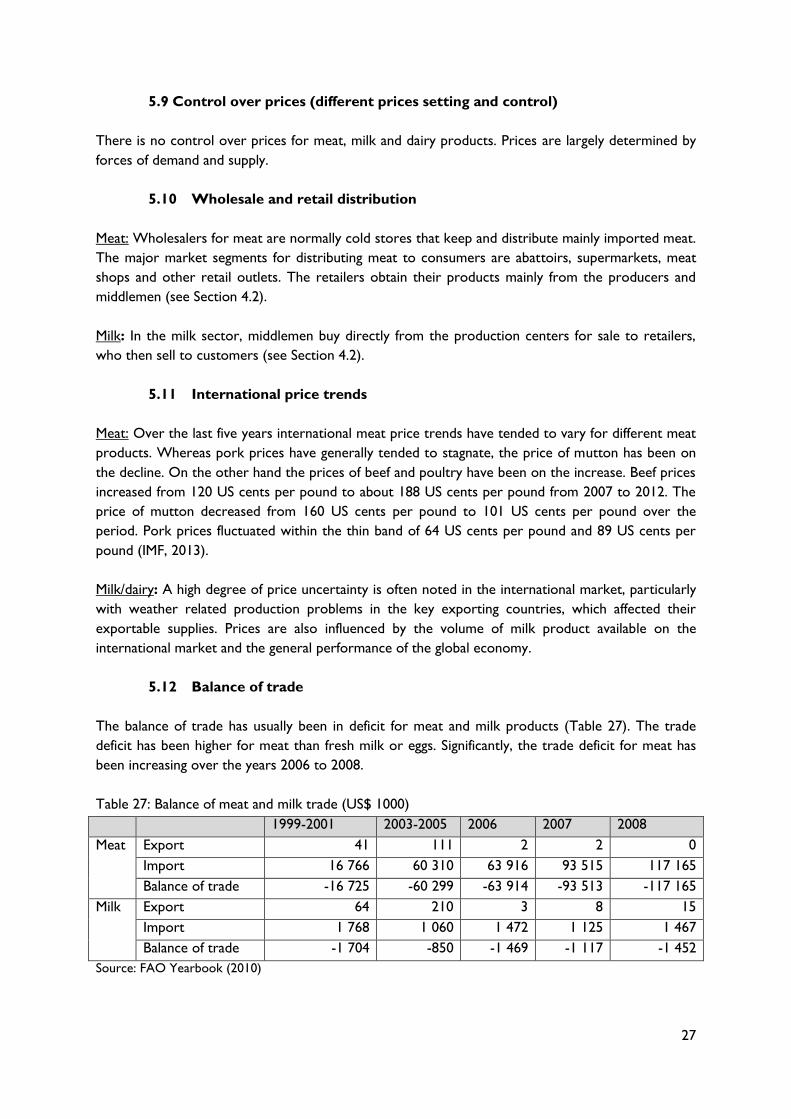
27
5.9 Control over prices (different prices setting and control)
There is no control over prices for meat, milk and dairy products. Prices are largely determined by
forces of demand and supply.
5.10 Wholesale and retail distribution
Meat: Wholesalers for meat are normally cold stores that keep and distribute mainly imported meat.
The major market segments for distributing meat to consumers are abattoirs, supermarkets, meat
shops and other retail outlets. The retailers obtain their products mainly from the producers and
middlemen (see Section 4.2).
Milk: In the milk sector, middlemen buy directly from the production centers for sale to retailers,
who then sell to customers (see Section 4.2).
5.11 International price trends
Meat: Over the last five years international meat price trends have tended to vary for different meat
products. Whereas pork prices have generally tended to stagnate, the price of mutton has been on
the decline. On the other hand the prices of beef and poultry have been on the increase. Beef prices
increased from 120 US cents per pound to about 188 US cents per pound from 2007 to 2012. The
price of mutton decreased from 160 US cents per pound to 101 US cents per pound over the
period. Pork prices fluctuated within the thin band of 64 US cents per pound and 89 US cents per
pound (IMF, 2013).
Milk/dairy: A high degree of price uncertainty is often noted in the international market, particularly
with weather related production problems in the key exporting countries, which affected their
exportable supplies. Prices are also influenced by the volume of milk product available on the
international market and the general performance of the global economy.
5.12 Balance of trade
The balance of trade has usually been in deficit for meat and milk products (Table 27). The trade
deficit has been higher for meat than fresh milk or eggs. Significantly, the trade deficit for meat has
been increasing over the years 2006 to 2008.
Table 27: Balance of meat and milk trade (US$ 1000)
1999-2001 2003-2005 2006 2007 2008
Meat Export 41 111 2 2 0
Import 16 766 60 310 63 916 93 515 117 165
Balance of trade -16 725 -60 299 -63 914 -93 513 -117 165
Milk Export 64 210 3 8 15
Import 1 768 1 060 1 472 1 125 1 467
Balance of trade -1 704 -850 -1 469 -1 117 -1 452
Source: FAO Yearbook (2010)
28
5.13 Current and potential competitors
Meat: Current and potential competitors for meat imports are Brazil, Argentina, USA and European
Union countries.
Milk: Current and potential competitors for milk and dairy product imports are Europe: Belgium,
France, Germany, Italy, United Kingdom, Switzerland, Netherlands, Ireland, Denmark; America:
Uruguay, Peru, Argentina, Canada, United States; Asia: China, Kuwait, India, Japan, Korea, Lebanon,
United Arab Emirates; Oceania: Australia, New Zealand; and Africa: South Africa, Morocco, Egypt.
Some West and Central African countries namely Gabon, Nigeria and Cote d’Ivoire serve as
channels for importation of dairy products into the country (Apori et al., 2010).
Meat: The vast majority of cattle, sheep and goat farms are operated by smallholders who may
produce without serious commercial motives. Though most pig farmers are smallholders, they tend
to be commercially minded. Some of the large scale pig farms are vertically integrated and produce
their own feed.
Milk: Increasingly, some contractual relationships can be found between milk processors, vendors
and milk producers in the peri-urban areas. These contracts, however, are usually verbal and may
relate to price of produce and supply conditions.
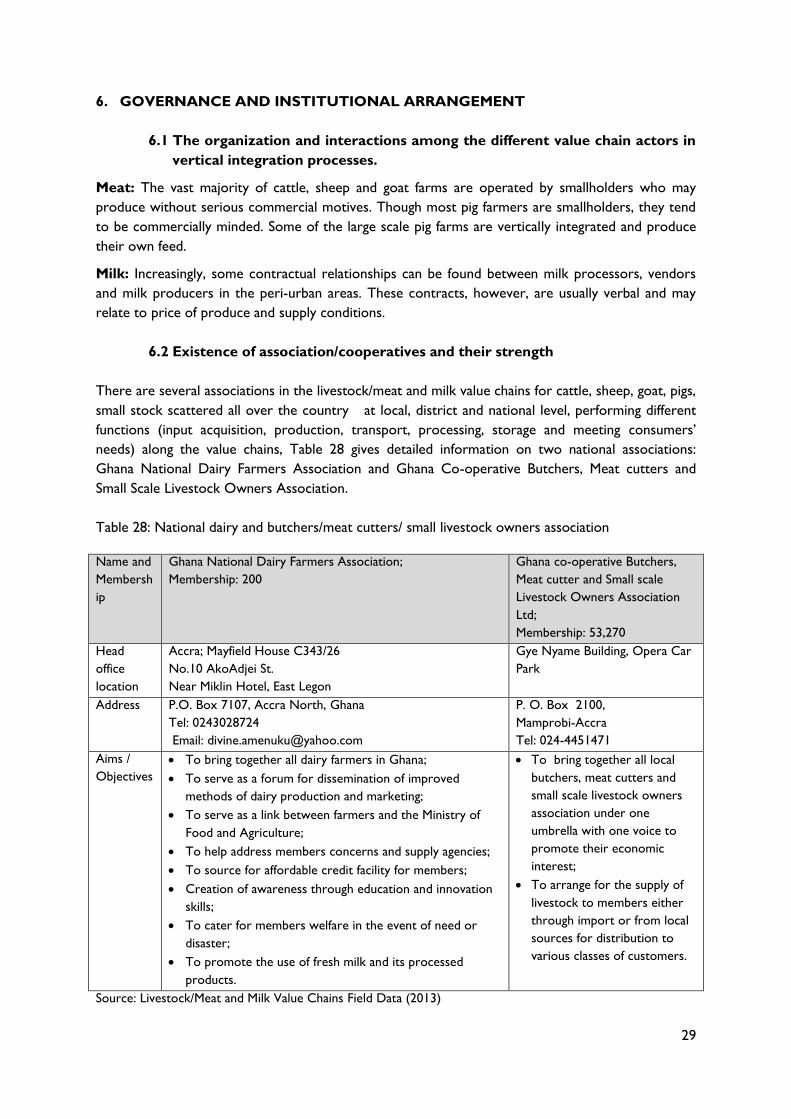
29
6. GOVERNANCE AND INSTITUTIONAL ARRANGEMENT
6.1 The organization and interactions among the different value chain actors in
vertical integration processes.
Meat: The vast majority of cattle, sheep and goat farms are operated by smallholders who may
produce without serious commercial motives. Though most pig farmers are smallholders, they tend
to be commercially minded. Some of the large scale pig farms are vertically integrated and produce
their own feed.
Milk: Increasingly, some contractual relationships can be found between milk processors, vendors
and milk producers in the peri-urban areas. These contracts, however, are usually verbal and may
relate to price of produce and supply conditions.
6.2 Existence of association/cooperatives and their strength
There are several associations in the livestock/meat and milk value chains for cattle, sheep, goat, pigs,
small stock scattered all over the country at local, district and national level, performing different
functions (input acquisition, production, transport, processing, storage and meeting consumers’
needs) along the value chains, Table 28 gives detailed information on two national associations:
Ghana National Dairy Farmers Association and Ghana Co-operative Butchers, Meat cutters and
Small Scale Livestock Owners Association.
Table 28: National dairy and butchers/meat cutters/ small livestock owners association
Name and
Membersh
ip
Ghana National Dairy Farmers Association;
Membership: 200
Ghana co-operative Butchers,
Meat cutter and Small scale
Livestock Owners Association
Ltd;
Membership: 53,270
Head
office
location
Accra; Mayfield House C343/26
No.10 AkoAdjei St.
Near Miklin Hotel, East Legon
Gye Nyame Building, Opera Car
Park
Address P.O. Box 7107, Accra North, Ghana
Tel: 0243028724
Email: [email protected]
P. O. Box 2100,
Mamprobi-Accra
Tel: 024-4451471
Aims /
Objectives
To bring together all dairy farmers in Ghana;
To serve as a forum for dissemination of improved
methods of dairy production and marketing;
To serve as a link between farmers and the Ministry of
Food and Agriculture;
To help address members concerns and supply agencies;
To source for affordable credit facility for members;
Creation of awareness through education and innovation
skills;
To cater for members welfare in the event of need or
disaster;
To promote the use of fresh milk and its processed
products.
To bring together all local
butchers, meat cutters and
small scale livestock owners
association under one
umbrella with one voice to
promote their economic
interest;
To arrange for the supply of
livestock to members either
through import or from local
sources for distribution to
various classes of customers.
Source: Livestock/Meat and Milk Value Chains Field Data (2013)
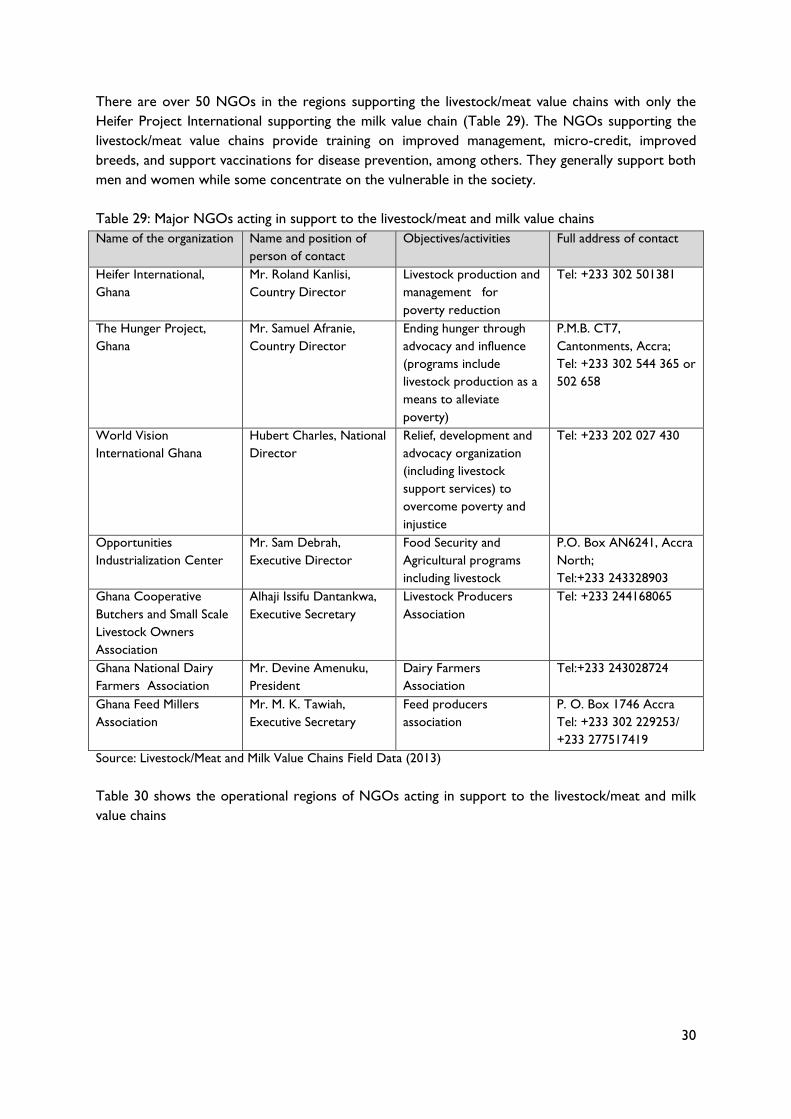
30
There are over 50 NGOs in the regions supporting the livestock/meat value chains with only the
Heifer Project International supporting the milk value chain (Table 29). The NGOs supporting the
livestock/meat value chains provide training on improved management, micro-credit, improved
breeds, and support vaccinations for disease prevention, among others. They generally support both
men and women while some concentrate on the vulnerable in the society.
Table 29: Major NGOs acting in support to the livestock/meat and milk value chains
Name of the organization Name and position of
person of contact
Objectives/activities Full address of contact
Heifer International,
Ghana
Mr. Roland Kanlisi,
Country Director
Livestock production and
management for
poverty reduction
Tel: +233 302 501381
The Hunger Project,
Ghana
Mr. Samuel Afranie,
Country Director
Ending hunger through
advocacy and influence
(programs include
livestock production as a
means to alleviate
poverty)
P.M.B. CT7,
Cantonments, Accra;
Tel: +233 302 544 365 or
502 658
World Vision
International Ghana
Hubert Charles, National
Director
Relief, development and
advocacy organization
(including livestock
support services) to
overcome poverty and
injustice
Tel: +233 202 027 430
Opportunities
Industrialization Center
Mr. Sam Debrah,
Executive Director
Food Security and
Agricultural programs
including livestock
P.O. Box AN6241, Accra
North;
Tel:+233 243328903
Ghana Cooperative
Butchers and Small Scale
Livestock Owners
Association
Alhaji Issifu Dantankwa,
Executive Secretary
Livestock Producers
Association
Tel: +233 244168065
Ghana National Dairy
Farmers Association
Mr. Devine Amenuku,
President
Dairy Farmers
Association
Tel:+233 243028724
Ghana Feed Millers
Association
Mr. M. K. Tawiah,
Executive Secretary
Feed producers
association
P. O. Box 1746 Accra
Tel: +233 302 229253/
+233 277517419
Source: Livestock/Meat and Milk Value Chains Field Data (2013)
Table 30 shows the operational regions of NGOs acting in support to the livestock/meat and milk
value chains
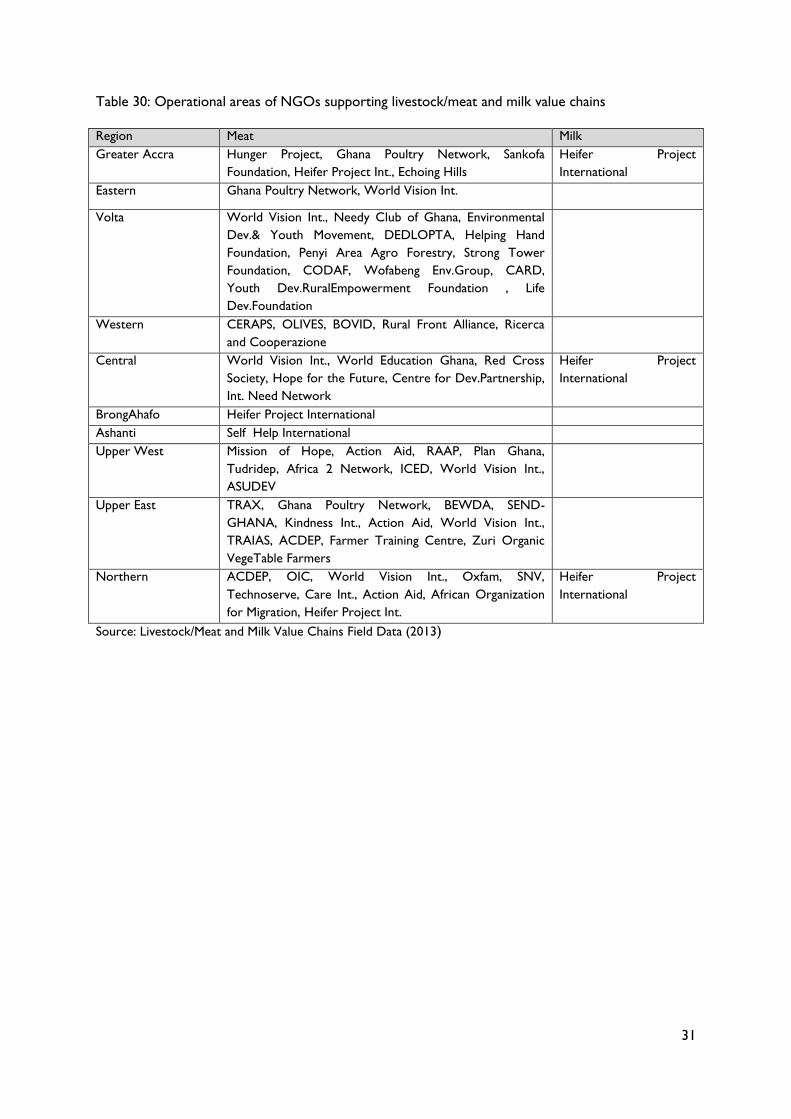
31
Table 30: Operational areas of NGOs supporting livestock/meat and milk value chains
Region Meat Milk
Greater Accra Hunger Project, Ghana Poultry Network, Sankofa
Foundation, Heifer Project Int., Echoing Hills
Heifer Project
International
Eastern Ghana Poultry Network, World Vision Int.
Volta
World Vision Int., Needy Club of Ghana, Environmental
Dev.& Youth Movement, DEDLOPTA, Helping Hand
Foundation, Penyi Area Agro Forestry, Strong Tower
Foundation, CODAF, Wofabeng Env.Group, CARD,
Youth Dev.RuralEmpowerment Foundation , Life
Dev.Foundation
Western
CERAPS, OLIVES, BOVID, Rural Front Alliance, Ricerca
and Cooperazione
Central
World Vision Int., World Education Ghana, Red Cross
Society, Hope for the Future, Centre for Dev.Partnership,
Int. Need Network
Heifer Project
International
BrongAhafo Heifer Project International
Ashanti Self Help International
Upper West
Mission of Hope, Action Aid, RAAP, Plan Ghana,
Tudridep, Africa 2 Network, ICED, World Vision Int.,
ASUDEV
Upper East
TRAX, Ghana Poultry Network, BEWDA, SEND-
GHANA, Kindness Int., Action Aid, World Vision Int.,
TRAIAS, ACDEP, Farmer Training Centre, Zuri Organic
VegeTable Farmers
Northern
ACDEP, OIC, World Vision Int., Oxfam, SNV,
Technoserve, Care Int., Action Aid, African Organization
for Migration, Heifer Project Int.
Heifer Project
International
Source: Livestock/Meat and Milk Value Chains Field Data (2013)
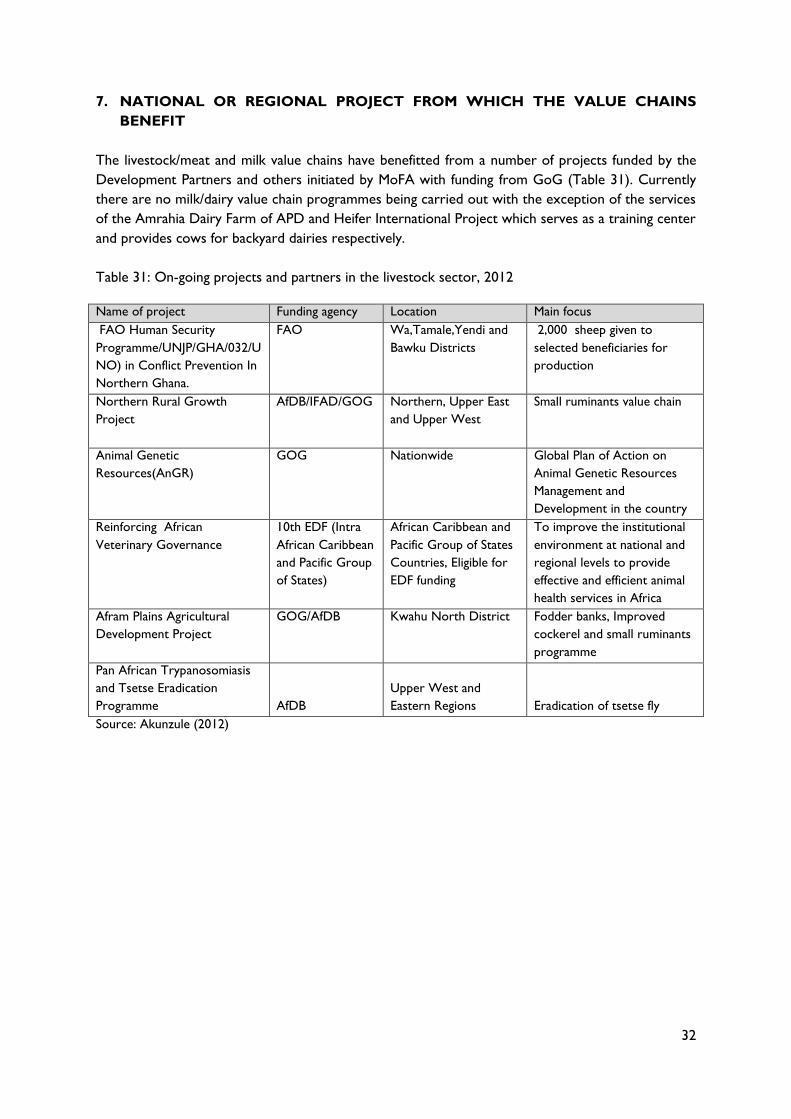
32
7. NATIONAL OR REGIONAL PROJECT FROM WHICH THE VALUE CHAINS
BENEFIT
The livestock/meat and milk value chains have benefitted from a number of projects funded by the
Development Partners and others initiated by MoFA with funding from GoG (Table 31). Currently
there are no milk/dairy value chain programmes being carried out with the exception of the services
of the Amrahia Dairy Farm of APD and Heifer International Project which serves as a training center
and provides cows for backyard dairies respectively.
Table 31: On-going projects and partners in the livestock sector, 2012
Name of project Funding agency Location Main focus
FAO Human Security
Programme/UNJP/GHA/032/U
NO) in Conflict Prevention In
Northern Ghana.
FAO Wa,Tamale,Yendi and
Bawku Districts
2,000 sheep given to
selected beneficiaries for
production
Northern Rural Growth
Project
AfDB/IFAD/GOG Northern, Upper East
and Upper West
Small ruminants value chain
Animal Genetic
Resources(AnGR)
GOG Nationwide Global Plan of Action on
Animal Genetic Resources
Management and
Development in the country
Reinforcing African
Veterinary Governance
10th EDF (Intra
African Caribbean
and Pacific Group
of States)
African Caribbean and
Pacific Group of States
Countries, Eligible for
EDF funding
To improve the institutional
environment at national and
regional levels to provide
effective and efficient animal
health services in Africa
Afram Plains Agricultural
Development Project
GOG/AfDB Kwahu North District Fodder banks, Improved
cockerel and small ruminants
programme
Pan African Trypanosomiasis
and Tsetse Eradication
Programme AfDB
Upper West and
Eastern Regions Eradication of tsetse fly
Source: Akunzule (2012)
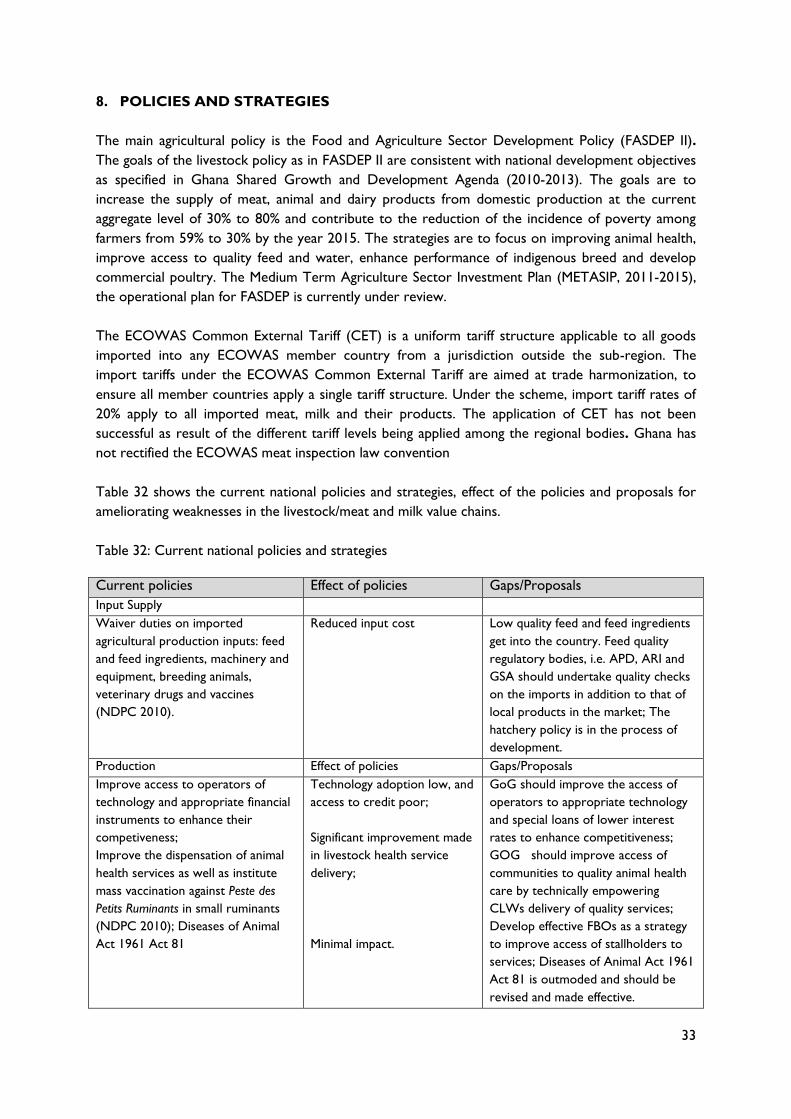
33
8. POLICIES AND STRATEGIES
The main agricultural policy is the Food and Agriculture Sector Development Policy (FASDEP II).
The goals of the livestock policy as in FASDEP II are consistent with national development objectives
as specified in Ghana Shared Growth and Development Agenda (2010-2013). The goals are to
increase the supply of meat, animal and dairy products from domestic production at the current
aggregate level of 30% to 80% and contribute to the reduction of the incidence of poverty among
farmers from 59% to 30% by the year 2015. The strategies are to focus on improving animal health,
improve access to quality feed and water, enhance performance of indigenous breed and develop
commercial poultry. The Medium Term Agriculture Sector Investment Plan (METASIP, 2011-2015),
the operational plan for FASDEP is currently under review.
The ECOWAS Common External Tariff (CET) is a uniform tariff structure applicable to all goods
imported into any ECOWAS member country from a jurisdiction outside the sub-region. The
import tariffs under the ECOWAS Common External Tariff are aimed at trade harmonization, to
ensure all member countries apply a single tariff structure. Under the scheme, import tariff rates of
20% apply to all imported meat, milk and their products. The application of CET has not been
successful as result of the different tariff levels being applied among the regional bodies. Ghana has
not rectified the ECOWAS meat inspection law convention
Table 32 shows the current national policies and strategies, effect of the policies and proposals for
ameliorating weaknesses in the livestock/meat and milk value chains.
Table 32: Current national policies and strategies
Current policies Effect of policies Gaps/Proposals
Input Supply
Waiver duties on imported
agricultural production inputs: feed
and feed ingredients, machinery and
equipment, breeding animals,
veterinary drugs and vaccines
(NDPC 2010).
Reduced input cost Low quality feed and feed ingredients
get into the country. Feed quality
regulatory bodies, i.e. APD, ARI and
GSA should undertake quality checks
on the imports in addition to that of
local products in the market; The
hatchery policy is in the process of
development.
Production Effect of policies Gaps/Proposals
Improve access to operators of
technology and appropriate financial
instruments to enhance their
competiveness;
Improve the dispensation of animal
health services as well as institute
mass vaccination against Peste des
Petits Ruminants in small ruminants
(NDPC 2010); Diseases of Animal
Act 1961 Act 81
Technology adoption low, and
access to credit poor;
Significant improvement made
in livestock health service
delivery;
Minimal impact.
GoG should improve the access of
operators to appropriate technology
and special loans of lower interest
rates to enhance competitiveness;
GOG should improve access of
communities to quality animal health
care by technically empowering
CLWs delivery of quality services;
Develop effective FBOs as a strategy
to improve access of stallholders to
services; Diseases of Animal Act 1961
Act 81 is outmoded and should be
revised and made effective.
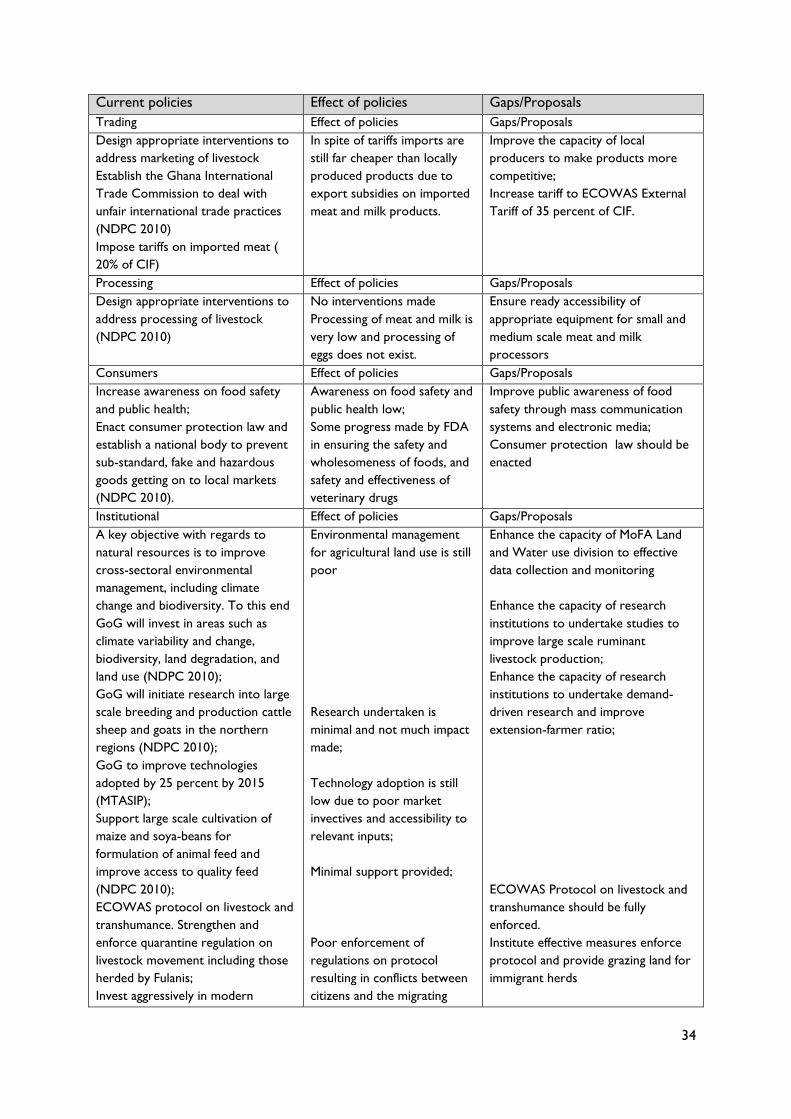
34
Current policies Effect of policies Gaps/Proposals
Trading Effect of policies Gaps/Proposals
Design appropriate interventions to
address marketing of livestock
Establish the Ghana International
Trade Commission to deal with
unfair international trade practices
(NDPC 2010)
Impose tariffs on imported meat (
20% of CIF)
In spite of tariffs imports are
still far cheaper than locally
produced products due to
export subsidies on imported
meat and milk products.
Improve the capacity of local
producers to make products more
competitive;
Increase tariff to ECOWAS External
Tariff of 35 percent of CIF.
Processing Effect of policies Gaps/Proposals
Design appropriate interventions to
address processing of livestock
(NDPC 2010)
No interventions made
Processing of meat and milk is
very low and processing of
eggs does not exist.
Ensure ready accessibility of
appropriate equipment for small and
medium scale meat and milk
processors
Consumers Effect of policies Gaps/Proposals
Increase awareness on food safety
and public health;
Enact consumer protection law and
establish a national body to prevent
sub-standard, fake and hazardous
goods getting on to local markets
(NDPC 2010).
Awareness on food safety and
public health low;
Some progress made by FDA
in ensuring the safety and
wholesomeness of foods, and
safety and effectiveness of
veterinary drugs
Improve public awareness of food
safety through mass communication
systems and electronic media;
Consumer protection law should be
enacted
Institutional Effect of policies Gaps/Proposals
A key objective with regards to
natural resources is to improve
cross-sectoral environmental
management, including climate
change and biodiversity. To this end
GoG will invest in areas such as
climate variability and change,
biodiversity, land degradation, and
land use (NDPC 2010);
GoG will initiate research into large
scale breeding and production cattle
sheep and goats in the northern
regions (NDPC 2010);
GoG to improve technologies
adopted by 25 percent by 2015
(MTASIP);
Support large scale cultivation of
maize and soya-beans for
formulation of animal feed and
improve access to quality feed
(NDPC 2010);
ECOWAS protocol on livestock and
transhumance. Strengthen and
enforce quarantine regulation on
livestock movement including those
herded by Fulanis;
Invest aggressively in modern
Environmental management
for agricultural land use is still
poor
Research undertaken is
minimal and not much impact
made;
Technology adoption is still
low due to poor market
invectives and accessibility to
relevant inputs;
Minimal support provided;
Poor enforcement of
regulations on protocol
resulting in conflicts between
citizens and the migrating
Enhance the capacity of MoFA Land
and Water use division to effective
data collection and monitoring
Enhance the capacity of research
institutions to undertake studies to
improve large scale ruminant
livestock production;
Enhance the capacity of research
institutions to undertake demand-
driven research and improve
extension-farmer ratio;
ECOWAS Protocol on livestock and
transhumance should be fully
enforced.
Institute effective measures enforce
protocol and provide grazing land for
immigrant herds
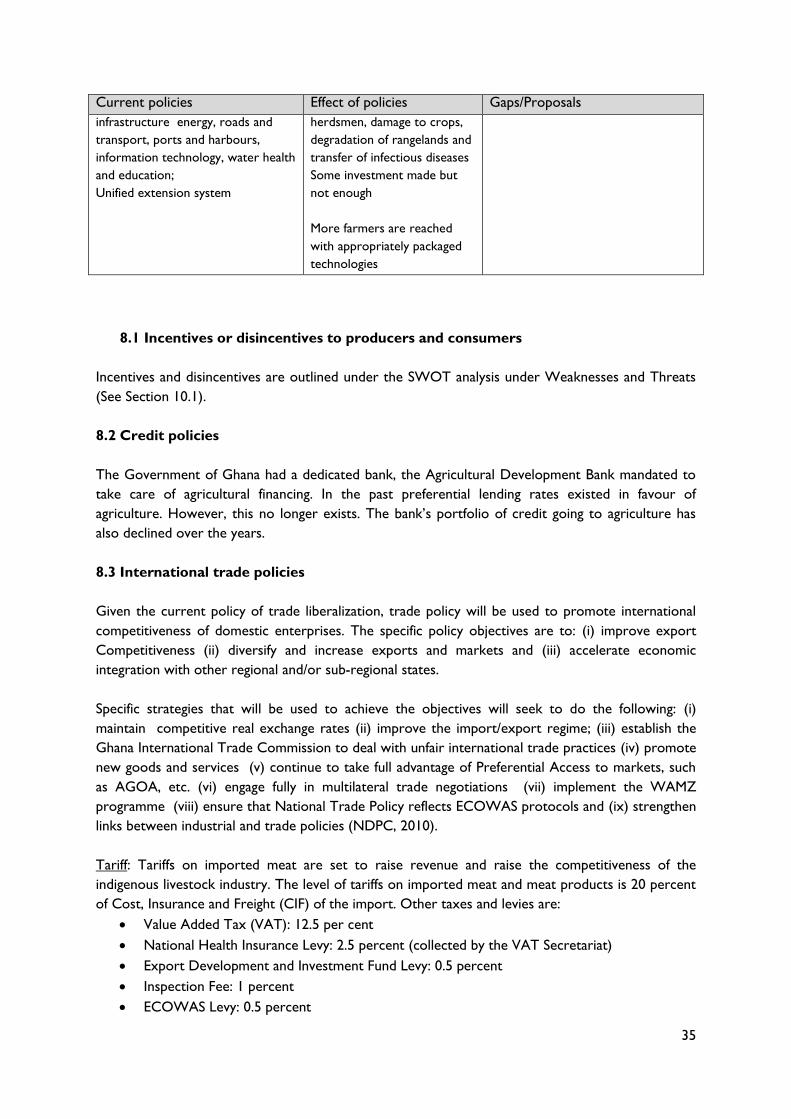
35
Current policies Effect of policies Gaps/Proposals
infrastructure energy, roads and
transport, ports and harbours,
information technology, water health
and education;
Unified extension system
herdsmen, damage to crops,
degradation of rangelands and
transfer of infectious diseases
Some investment made but
not enough
More farmers are reached
with appropriately packaged
technologies
8.1 Incentives or disincentives to producers and consumers
Incentives and disincentives are outlined under the SWOT analysis under Weaknesses and Threats
(See Section 10.1).
8.2 Credit policies
The Government of Ghana had a dedicated bank, the Agricultural Development Bank mandated to
take care of agricultural financing. In the past preferential lending rates existed in favour of
agriculture. However, this no longer exists. The bank’s portfolio of credit going to agriculture has
also declined over the years.
8.3 International trade policies
Given the current policy of trade liberalization, trade policy will be used to promote international
competitiveness of domestic enterprises. The specific policy objectives are to: (i) improve export
Competitiveness (ii) diversify and increase exports and markets and (iii) accelerate economic
integration with other regional and/or sub-regional states.
Specific strategies that will be used to achieve the objectives will seek to do the following: (i)
maintain competitive real exchange rates (ii) improve the import/export regime; (iii) establish the
Ghana International Trade Commission to deal with unfair international trade practices (iv) promote
new goods and services (v) continue to take full advantage of Preferential Access to markets, such
as AGOA, etc. (vi) engage fully in multilateral trade negotiations (vii) implement the WAMZ
programme (viii) ensure that National Trade Policy reflects ECOWAS protocols and (ix) strengthen
links between industrial and trade policies (NDPC, 2010).
Tariff: Tariffs on imported meat are set to raise revenue and raise the competitiveness of the
indigenous livestock industry. The level of tariffs on imported meat and meat products is 20 percent
of Cost, Insurance and Freight (CIF) of the import. Other taxes and levies are:
Value Added Tax (VAT): 12.5 per cent
National Health Insurance Levy: 2.5 percent (collected by the VAT Secretariat)
Export Development and Investment Fund Levy: 0.5 percent
Inspection Fee: 1 percent
ECOWAS Levy: 0.5 percent
36
Ghana Customs Network: 0.4 percent of CIF.
8.4 Acts, regulations and laws governing the value chain
The GoG policy measures and regulations, aimed at the development of the livestock industry are
based on a set of strategies specified in the Livestock Development Policy. These strategies target
the different categories of actors in the livestock sector, and address issues of breed improvement,
production and health management, processing and marketing. Some of the key strategies being
implemented are: (i) Focus on improving animal health (ii) Improve access to quality feed and water
(iii) Enhance performance of indigenous breeds through a programme of selection and artificial
insemination (AI) (iv) Develop commercial poultry as the priority for improving meat supply in the
short term, while measures are implemented to transform smallholder production into profitable
enterprises and (v) Improve access of operators to technology and appropriate financial instruments
to enhance their competitiveness with imports (MoFA, 2007)
Feed quality control: There is an ongoing effort to check the quality of animal feed produced in the
country, spearheaded by APD, GSA and ARI. Under an MOU signed in 2012 by the three institutions
for the implementation of Feed Quality Control: GSA would provide the standards for animal feeds
and feed ingredients; APD would sample feed from commercial feed millers across the country and
ARI would analyze the feed samples for the determination of the nutrient quality. The public would
be informed accordingly regularly about the results of the feed quality tests.
Food and Drugs Authority: FDA is mandated to implement Food and Drugs Law of 1992 (PNDCL
305B), which regulates the manufacture, importation, exportation, distribution, use and
advertisements of food, drugs, cosmetics, medical devices and household chemicals with respect to
ensuring their safety, quality and efficacy. As part of its mandate, FDA ensures the safety and
wholesomeness of foods (including meat and milk and their products) and the safety and efficacy of
veterinary drugs.
Veterinary Services Directorate: Importers of live animals and livestock products have to obtain
Veterinary Import Permit from VSD. Importation of live animals is based on import permit issued by
the VSD and a sanitary certificate signed by the official veterinary office of the country of origin
(Akunzule, 2012).
8.5 Major constraints requiring policy interventions
There are numerous constraints militating against the development of the livestock/meat and milk
value chains that need policy intervention. The major ones are:
Production constraints
Lack of genetically improved breeds.
Poor availability and accessibility of feeds.
Inappropriate livestock housing structures
Poor availability and accessibility of vaccines and drugs
Weak research and extension services.
37
Lack of credit/insurance facilities
Transportation
Inappropriate vehicles and equipment for transporting live animals, meat and milk (e.g. milk
churns, crates cold vans etc.).
Lack of low interest credit facilities
Poor road infrastructure
Processing and storage
Dilapidated slaughter houses and slabs
Lack of cooling facilities and storage for meat, eggs and milk
Lack of processing facilities
Lack of low interest credit facilities
Inadequate capacity in handling and processing of various products
Marketing
Lack of standard pricing system.
Inappropriate marketing facilities
Weak producer association
The major constraints, in terms of priority, requiring policy interventions are:
Unavailability of good quality and affordable feed
Weak research and extension services
Unavailability of improve breeding stock
Poor storage and processing facilities
8.6 Suggested policies for smooth operation of meat and milk value
The short-term nature of livestock projects provides quick fixes but failed to bring the required
impacts on the meat and milk value chains. To show visible impact, livestock projects require a
longer life span and sustained support to provide sustainable solutions. The erstwhile National
Livestock Services Project and Livestock Development Project for example were too short and did
not make the required impacts. The following modified recommendations in the completion report
of the AgSSIP should be considered in future livestock development policy formulation;
There should be more emphasis on the various actors in the livestock/meat and milk value
chains than on products (livestock, milk, meat and eggs)
Demand driven and client-focused service delivery instead of supply driven.
The development of policies that recognize differences between actors in the chains and not
blanket policies for all.
Programmes that cater for the whole sector (along value chains) instead of project level
approaches which have partial coverage.
Policies and strategies that provide sustainable solutions instead of those that provide quick
fixes

38
Policies in which government enables a range of actors in the private sector to deliver
quality services instead of government delivering services
Policies that cater for all clients/stakeholders instead of policies that are selective policy of
setting up a livestock development fund
Policy to increase tariff on selected livestock imports
Setting up of National Livestock Development Council with a sub-committee for Poultry
Development
Policies that are pro-poor and lead to wealth creation
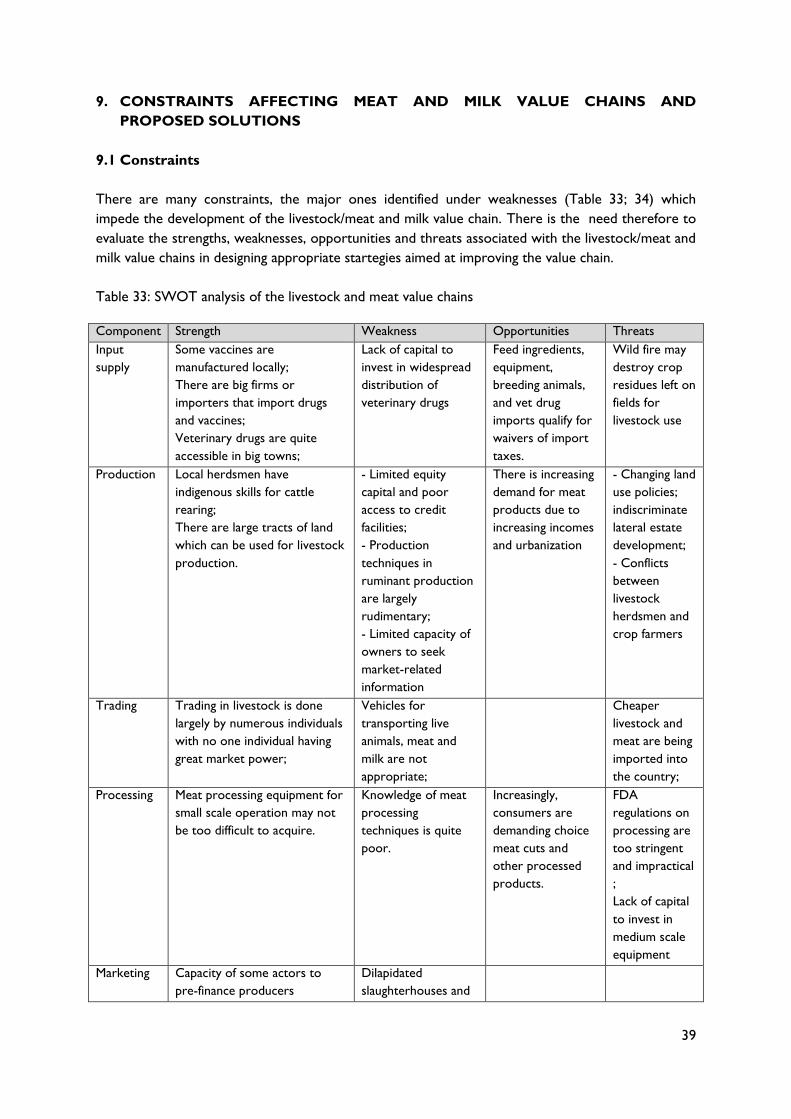
39
9. CONSTRAINTS AFFECTING MEAT AND MILK VALUE CHAINS AND
PROPOSED SOLUTIONS
9.1 Constraints
There are many constraints, the major ones identified under weaknesses (Table 33; 34) which
impede the development of the livestock/meat and milk value chain. There is the need therefore to
evaluate the strengths, weaknesses, opportunities and threats associated with the livestock/meat and
milk value chains in designing appropriate startegies aimed at improving the value chain.
Table 33: SWOT analysis of the livestock and meat value chains
Component Strength Weakness Opportunities Threats
Input
supply
Some vaccines are
manufactured locally;
There are big firms or
importers that import drugs
and vaccines;
Veterinary drugs are quite
accessible in big towns;
Lack of capital to
invest in widespread
distribution of
veterinary drugs
Feed ingredients,
equipment,
breeding animals,
and vet drug
imports qualify for
waivers of import
taxes.
Wild fire may
destroy crop
residues left on
fields for
livestock use
Production Local herdsmen have
indigenous skills for cattle
rearing;
There are large tracts of land
which can be used for livestock
production.
- Limited equity
capital and poor
access to credit
facilities;
- Production
techniques in
ruminant production
are largely
rudimentary;
- Limited capacity of
owners to seek
market-related
information
There is increasing
demand for meat
products due to
increasing incomes
and urbanization
- Changing land
use policies;
indiscriminate
lateral estate
development;
- Conflicts
between
livestock
herdsmen and
crop farmers
Trading Trading in livestock is done
largely by numerous individuals
with no one individual having
great market power;
Vehicles for
transporting live
animals, meat and
milk are not
appropriate;
Cheaper
livestock and
meat are being
imported into
the country;
Processing Meat processing equipment for
small scale operation may not
be too difficult to acquire.
Knowledge of meat
processing
techniques is quite
poor.
Increasingly,
consumers are
demanding choice
meat cuts and
other processed
products.
FDA
regulations on
processing are
too stringent
and impractical
;
Lack of capital
to invest in
medium scale
equipment
Marketing Capacity of some actors to
pre-finance producers
Dilapidated
slaughterhouses and
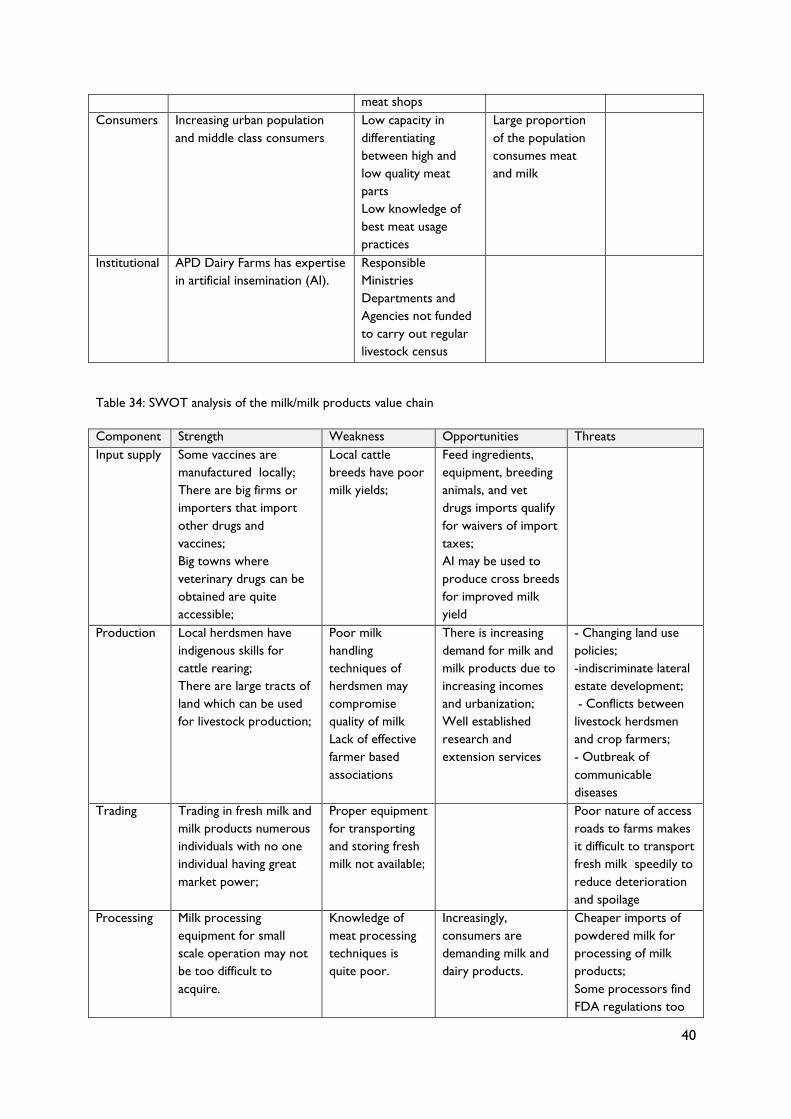
40
meat shops
Consumers Increasing urban population
and middle class consumers
Low capacity in
differentiating
between high and
low quality meat
parts
Low knowledge of
best meat usage
practices
Large proportion
of the population
consumes meat
and milk
Institutional APD Dairy Farms has expertise
in artificial insemination (AI).
Responsible
Ministries
Departments and
Agencies not funded
to carry out regular
livestock census
Table 34: SWOT analysis of the milk/milk products value chain
Component Strength Weakness Opportunities Threats
Input supply Some vaccines are
manufactured locally;
There are big firms or
importers that import
other drugs and
vaccines;
Big towns where
veterinary drugs can be
obtained are quite
accessible;
Local cattle
breeds have poor
milk yields;
Feed ingredients,
equipment, breeding
animals, and vet
drugs imports qualify
for waivers of import
taxes;
AI may be used to
produce cross breeds
for improved milk
yield
Production Local herdsmen have
indigenous skills for
cattle rearing;
There are large tracts of
land which can be used
for livestock production;
Poor milk
handling
techniques of
herdsmen may
compromise
quality of milk
Lack of effective
farmer based
associations
There is increasing
demand for milk and
milk products due to
increasing incomes
and urbanization;
Well established
research and
extension services
- Changing land use
policies;
-indiscriminate lateral
estate development;
- Conflicts between
livestock herdsmen
and crop farmers;
- Outbreak of
communicable
diseases
Trading Trading in fresh milk and
milk products numerous
individuals with no one
individual having great
market power;
Proper equipment
for transporting
and storing fresh
milk not available;
Poor nature of access
roads to farms makes
it difficult to transport
fresh milk speedily to
reduce deterioration
and spoilage
Processing Milk processing
equipment for small
scale operation may not
be too difficult to
acquire.
Knowledge of
meat processing
techniques is
quite poor.
Increasingly,
consumers are
demanding milk and
dairy products.
Cheaper imports of
powdered milk for
processing of milk
products;
Some processors find
FDA regulations too
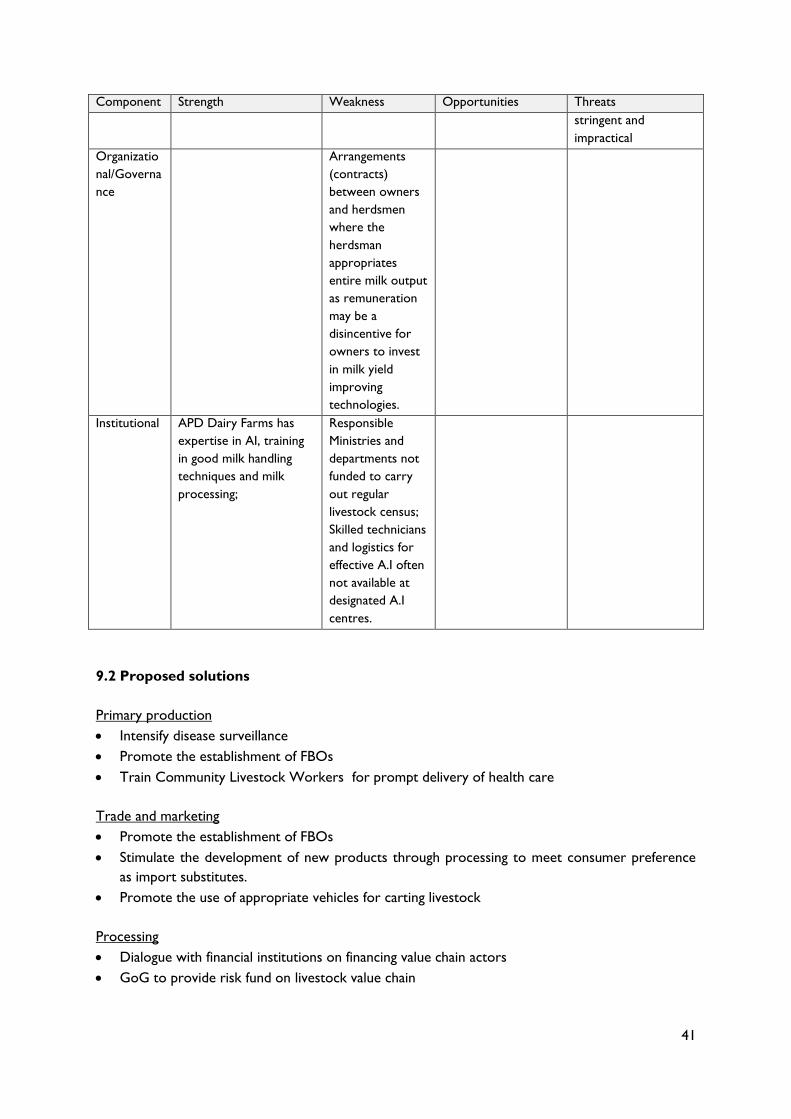
41
Component Strength Weakness Opportunities Threats
stringent and
impractical
Organizatio
nal/Governa
nce
Arrangements
(contracts)
between owners
and herdsmen
where the
herdsman
appropriates
entire milk output
as remuneration
may be a
disincentive for
owners to invest
in milk yield
improving
technologies.
Institutional APD Dairy Farms has
expertise in AI, training
in good milk handling
techniques and milk
processing;
Responsible
Ministries and
departments not
funded to carry
out regular
livestock census;
Skilled technicians
and logistics for
effective A.I often
not available at
designated A.I
centres.
9.2 Proposed solutions
Primary production
Intensify disease surveillance
Promote the establishment of FBOs
Train Community Livestock Workers for prompt delivery of health care
Trade and marketing
Promote the establishment of FBOs
Stimulate the development of new products through processing to meet consumer preference
as import substitutes.
Promote the use of appropriate vehicles for carting livestock
Processing
Dialogue with financial institutions on financing value chain actors
GoG to provide risk fund on livestock value chain
42
Promote the delivery of demand oriented services to support value chain actors by public and
private service institutions
Public authorities responsible for establishing enabling environment for value chain development
should be effective in delivery of responsibilities.
Professional organization and capacity building
Build capacity of members to provide quality services to actors in the value chains
Institutional
Promote biosecurity along the value chain and in particular primary production and processing
Provide policies to enhance fair competition among local production and imports
Establish a Livestock Development Council
Set up standing committee of all the regulatory agencies to ensure cooperation, collaboration,
efficiency and effectiveness in their operations and achievement of common or overlapping
objectives
9.3 Prioritized areas of interventions
Inputs
Strengthening local capacity in veterinary drugs and vaccine production
Promotion of cassava as livestock feed Production
Establishment of effective FBOs
Provision of risk fund for livestock production
Strengthening linkages between production and input supply/processing/market
Processing
Provision of low interest loans
Provision of appropriate processing facilities
Develop national capacity of personnel and equipment for meat and milk processing
Marketing
Provision of market information
Provision of appropriate infrastructure
Consumers
Enact consumer protection a law
43
10 SUGGESTED PROJECTS AND PROGRAMMES
Proposed Programme Title
Enhancing the performance of meat and milk value chains through improved animal genetic, feed
resources and slaughtering systems.
Background and Justification for the programme
At per capita meat and milk consumption of 21.38 kg, the national demand, estimated at 572 000
tonnes, is significantly higher than the potential domestic production which stood at 234 000 tonnes
in 2011. This leaves a huge deficit that requires concerted efforts to fill.
Major constraints of the livestock/meat and milk value chain are non-availability of quality feed
resources, high cost of feed, low performance of local breeds in particular milk yield, high cost and
non-availability of dairy/processing equipment, low standards of slaughtering and dilapidated and
unhygienic butchers meat shops. These constraints were confirmed by a cross section of participants
representing various actors in the value chains at the FAO/ECOWAS livestock/meat and milk value
chain workshop held in Accra on the 30th of May 2013.
In recent past, the government with assistance from some NGOs and Development Partners have
applied a number of instruments to address the constraints in the livestock sector. The thrust of the
approach has been public-led service delivery, complemented with stand-alone projects. The
implementation of the projects was on short and medium term basis and did not achieve the
expected impact on improving meat and milk production in the country.
Even though most projects were judged as successful, emphasis was on production, with not much
attention being given to the other components of the chains. Very little was also done in terms of
value chain governance to ensure effective vertical and horizontal linkages. The value chain approach
to addressing the identified challenges would ensure that all actors play their roles for increased
performance of the livestock industry. Two proposals are therefore proposed.
The following 2 projects one for the meat value chain and another for the milk value chain will
address many of the above issues, and they conform to provisions in both the FASDEP II and the
Ghana Shared Growth and Développement Agenda (2010-2013). They also have the potential to
improve quantity and quality of meat and milk products, and improve the efficiency and performance
of actors in the value chains such as traders and processors, and serve as a guide to future
interventions in the domestic livestock industry.
Long term objective
To improve nutrition of the communities, create employment and wealth leading to improved
standards of living
Short term objectives
To produce high quality and affordable feed using non-conventional and lesser known feed
resources
To improve productivity and reduce mortality and morbidity of non-ruminant and ruminant
livestock by improved feeding.
To increase milk production by improved feeding
44
To increase incomes of smallholder farmers by improved milk production
To improve efficiency and performance in meat and milk processing and marketing
To build capacity of meat cutters/butchers to improve performance
Project area
Twelve administrative districts in Greater Accra, Eastern, Volta and Northern regions
Project duration
The proposed projects will run for three (3) years
Project costs
The two projects will cost US$167 480.00. (Meat Value Chain: US$109 940.00 and Milk Value Chain:
US$ 57 540.00.00)
Responsible Ministry
Ministry of Food and Agriculture
Implementing Agency
Animal Production Directorate
Project 1: Support for enhancing the meat value chain
Components
Capacity building of meat producers, traders, butchers and processors
Logistics support to small ruminant farmers for feed preparation and butchers to improve their
operations.
Logistic support to cassava farmers to produce quality cassava chips for livestock feeding
Strengthening existing meat producing associations and formation of new groups
Development of the meat and milk value chains.
Improving slaughtering methods and meat handling
Project management
Capacity building of meat producers, traders, processors and butchers
Train small ruminant farmers on effective utilization of crop residues and agro-industrial by
products.
Train feed millers on feed formulation using lesser known feed resources such as cassava
Train meat cutters/ butchers on hygienic meat handling and storage
Logistics support to small ruminant farmers for feed preparation and butchers to improve their
operations
Provide smallholder ruminant farmers with tools/equipment for preparation of silage, baled rice
straw and storage of agro-industrial by products.
Provide meat cutters/butchers with requisite tools/equipment.
Logistic support to cassava farmers to produce quality cassava chips for livestock feeding
45
Provide mini-chippers for slicing cassava and solar dryers for producing high quality chips for
feed milling.
Strengthening existing meat producing associations and formation of new groups
Facilitate the formation of new associations along the meat value chain.
Establish efficient market information systems for dissemination to actors
Conduct regular stakeholder meetings, fora and workshops.
Assess the performance of existing producer associations for improvement
Development of the meat value chain
Create platform for actors by organizing meetings to introduce concept, select core team,
identify goals and objectives, plan and launch the platform for the meat and milk value chain.
Develop and strengthen vertical and horizontal linkages among actors in the meat and value
chains by facilitating meetings to identify constraints/ feasible solutions and bring actors to
relevant business support services.
Support producer associations to improve governance structure in the chains by facilitating
meetings on product requirement, market demand and develop chain management plans.
Facilitate the establishment of an efficient mobile phone SMS market information system through
meetings and workshops.
Improving slaughtering methods and meat handling
Train butchers in proper slaughtering and meat handling techniques
Project management
Implement all the activities effectively to achieve project objectives
Project 2: Support for enhancing the milk value chain
Components
Capacity building of milk producers, traders and processors
Train smallholder dairy farmers on effective utilization of crop residues and agro-industrial
by products for enhanced milk production
Train milk producers on hygienic milk collection and handling
Train milk processors on preparation of new products from fresh milk
Logistics support to smallholder dairy farmers, milk traders and processors
Provide smallholder dairy farmers with tools/equipment for preparation of silage, baled rice
straw and storage of agro-industrial by products.
Provide milk collectors and processors with requisite tools/equipment for handling and
storage of raw milk.
46
Development in the milk value chain
Facilitate the formation of new milk producing associations and strengthen new associations
along the milk value chain.
Promotion of milk consumption
Create awareness on good values of milk in human nutrition.
Facilitate the linking of small dairy producers to the School Feeding Programme.
Facilitate the development of marketing outlets for milk processors.
Project management
Implement all the activities effectively to achieve project objectives
47
11 CONCLUSIONS
Livestock is an important component of the nation’s agriculture and contributes significantly to the
national food security, employment creation, income generation and improvement in rural
livelihoods. Notwithstanding this, the livestock/meat and milk value chains face numerous challenges
militating against the development of the livestock sector thus suppressing its potential to make a
more significant contribution to the national economy. The performances of the various actors in
the value chains have not been very effective as a result of unsolved challenges within the sector.
However, opportunities exist for improving the efficiency and performance of actors at the various
levels of the chains.
Livestock producers are often exposed to malpractices such as poor quality inputs in the form of
feed and drugs that negatively affect the performance of animals and by extension the profitability of
the entire industry. Large imports of meat and meat products have affected the development of the
domestic poultry industry as it cannot be competitive with the “cheap” imports. Policy measures
aimed at improving the performance of the industry should be implemented and regulatory measures
vigorously enforced. Imports should be controlled by appropriate quotas and tariffs, and the use of
standards to control imports of poor quality produce will have to be pursued. Attention will also be
given to improving standards of products in local markets and for food safety. It is of prime
importance that the value chain concept is taken into consideration in future interventions to ensure
effective use of resources to achieve the objectives of introduced interventions, improved
performance and sustainability of the livestock industry.
This consultancy established the current status of livestock/meat and milk value chains, provided an
inventory of current policies influencing the chains and identified gaps and solutions. It also identified
policies facilitating the development or enhancement of the chains as well as constraints affecting the
value chains and proposed solutions. It proposed a programme and investment plans for two
projects aimed at developing the livestock/meat and milk value chains. The proposed programme if
implemented will be expected to enhance significantly the performance of Ghana’s meat and milk
value chains.
48
12 REFERENCES
1. Apori, S.A. Oppong-Anane, K. Osei D.Y. & Dwumoh, K. 2010. Ghana’s Dairy Sector Brief.
Orrani Consulting, United Kingdom.
2. Akunzule, A.N. 2012. Ghana livestock Sector Review. First Draft Report.
3. Alhassan, W.S. Karbo, N. Aboe A. & Oppong-Anane, K. 1999. Ghana’s Savannah Rangelands:
Agro-ecology, current improvement and usage practices, research needs and sustainable
management criteria. National Agricultural Research Project. Council for Scientific and
Industrial Research, Accra, Ghana.
4. FAO. 2013. FAOSTAT data. Food and Agriculture Organization, Rome.
http://faostat.fao.org/. Accessed April 3, 2013.
5. FAO Yearbook. 2013. Food and Agriculture Organization of the United Nations, Rome.
6. GSS. 2008. Ghana Living Standards Survey Report of the Fifth Round (GLSS 5). Ghana
Statistical Service, Accra, Ghana.
7. GSS. 2012. Population and Housing Census. Ghana Statistical Service, Accra, Ghana.
8. GSS. 2013. Revised Gross Domestic Product 2012. Ghana Statistical Service, Accra, Ghana.
http://statsghana.gov.gh/gdp.html. Accessed March 5, 2013.
9. IMF. 2013. International Monetary Fund. Monthly Commodity Data.
www.imf.org/external/np/res/commod/index.aspx. Accessed March 20, 2013
10. NDPC. 2010. National Development Planning Commission. Ghana Shared Growth and
Development Agenda (GSGDA), 2010-2013. Accra, Ghana.
11. MoFA. 2007. Ghana Livestock Development Policy. Ministry of Food and Agriculture, Accra,
Ghana.
12. MoFA. 2010. Medium Term Agriculture Sector Investment Plan (METASIP) 2011 – 2015.
Ministry of Food and Agriculture, Accra, Ghana.
13. MoFA. 2012. Annual Report-2011. Ministry of Food and Agriculture, Accra, Ghana.
14. Omore, A. Staal, J.S. Wanyoike, F. Osafo, E.L.K. Barton, L.K.D. Mdoe, N. Nurah, & G. Aning,
G. 2009. Market Mechanisms and Efficiency in Urban Dairy Product Markets in Ghana and
Tanzania. ILRI Research Report 19. International Livestock Research Institute, Nairobi,
Kenya.
15. Oppong-Anane, K. Karbo, N. Doku, C. K. Dittoh, J.S. Bayor, H. Rhule S.W.A. Ameleke, G.Y.
& Sottie, E.T. 2008. Ghana’s Livestock Growth Trend. Ministry of Food and Agriculture,
Accra. Ghana.
16. Oppong-Anane, K. Apori, S.O. Eshun, J.F. & Osei, D.Y. 2009. The impact of livestock
production on global warming. Proceedings of the Ghana Society of Animal Production.
Kumasi, Ghana.
17. Oppong-Anane, K. 2010. Ghana’s Livestock Sector Review. FAO West African Office, Accra.
49
18. SRID. 2011. Statistical Research and Information Directorate. Agriculture in Ghana. Facts
and Figures. Statistical Research and Information Directorate, Ministry of Food and
Agriculture, Accra, Ghana.
19. SRID, 2012. Statistical Research and Information Directorate Agriculture in Ghana. Facts and
Figures. Statistical Research and Information Directorate, Ministry of Food and Agriculture,
Accra, Ghana.
20. SRID. 2013. Statistical Research and Information Directorate Agriculture in Ghana. Facts and
Figures. Statistical Research and Information Directorate, Ministry of Food and Agriculture,
Accra, Ghana.
21. VSD 2012. Veterinary Services Directorate. Imports of Live Animals. Veterinary Services
Directorate. Ministry of Food and Agriculture, Accra, Ghana.
22. VSD 2013. Veterinary Services Directorate. Imports of Live Animals. Veterinary Services
Directorate. Ministry of Food and Agriculture, Accra, Ghana.
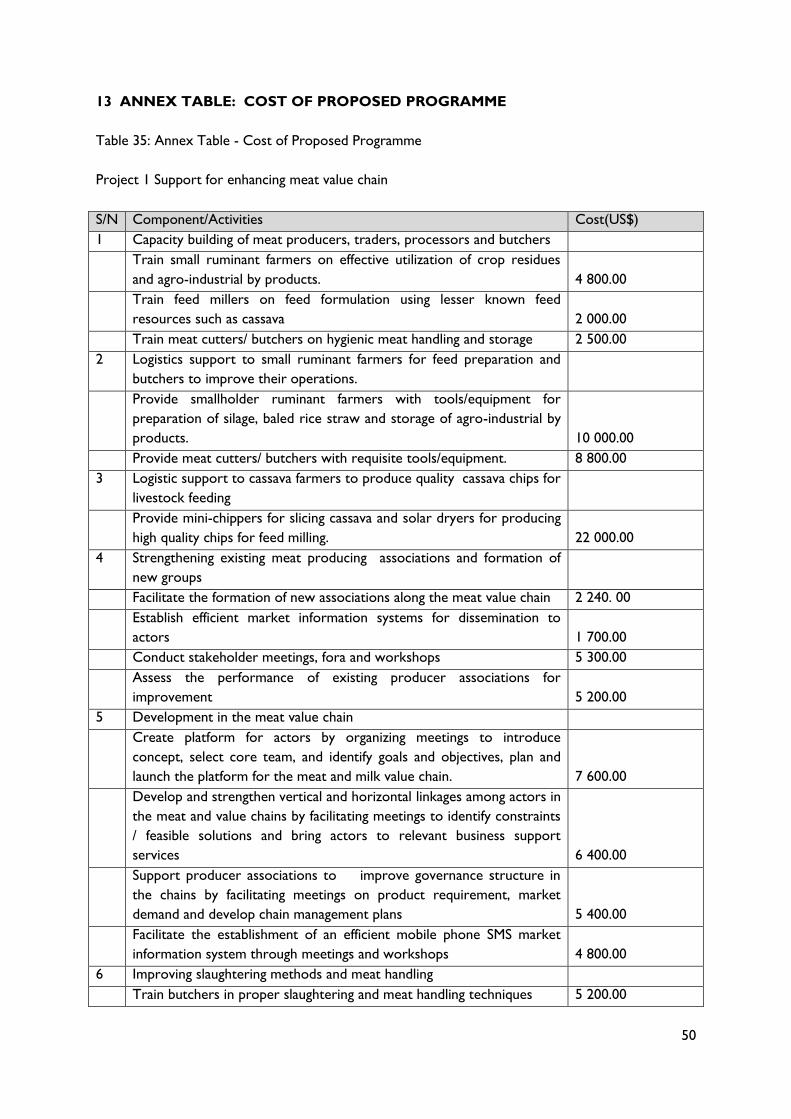
50
13 ANNEX TABLE: COST OF PROPOSED PROGRAMME
Table 35: Annex Table - Cost of Proposed Programme
Project 1 Support for enhancing meat value chain
S/N Component/Activities Cost(US$)
1 Capacity building of meat producers, traders, processors and butchers
Train small ruminant farmers on effective utilization of crop residues
and agro-industrial by products. 4 800.00
Train feed millers on feed formulation using lesser known feed
resources such as cassava 2 000.00
Train meat cutters/ butchers on hygienic meat handling and storage 2 500.00
2 Logistics support to small ruminant farmers for feed preparation and
butchers to improve their operations.
Provide smallholder ruminant farmers with tools/equipment for
preparation of silage, baled rice straw and storage of agro-industrial by
products. 10 000.00
Provide meat cutters/ butchers with requisite tools/equipment. 8 800.00
3 Logistic support to cassava farmers to produce quality cassava chips for
livestock feeding
Provide mini-chippers for slicing cassava and solar dryers for producing
high quality chips for feed milling. 22 000.00
4 Strengthening existing meat producing associations and formation of
new groups
Facilitate the formation of new associations along the meat value chain 2 240. 00
Establish efficient market information systems for dissemination to
actors 1 700.00
Conduct stakeholder meetings, fora and workshops 5 300.00
Assess the performance of existing producer associations for
improvement 5 200.00
5 Development in the meat value chain
Create platform for actors by organizing meetings to introduce
concept, select core team, and identify goals and objectives, plan and
launch the platform for the meat and milk value chain.
7 600.00
Develop and strengthen vertical and horizontal linkages among actors in
the meat and value chains by facilitating meetings to identify constraints
/ feasible solutions and bring actors to relevant business support
services
6 400.00
Support producer associations to improve governance structure in
the chains by facilitating meetings on product requirement, market
demand and develop chain management plans
5 400.00
Facilitate the establishment of an efficient mobile phone SMS market
information system through meetings and workshops 4 800.00
6 Improving slaughtering methods and meat handling
Train butchers in proper slaughtering and meat handling techniques 5 200.00
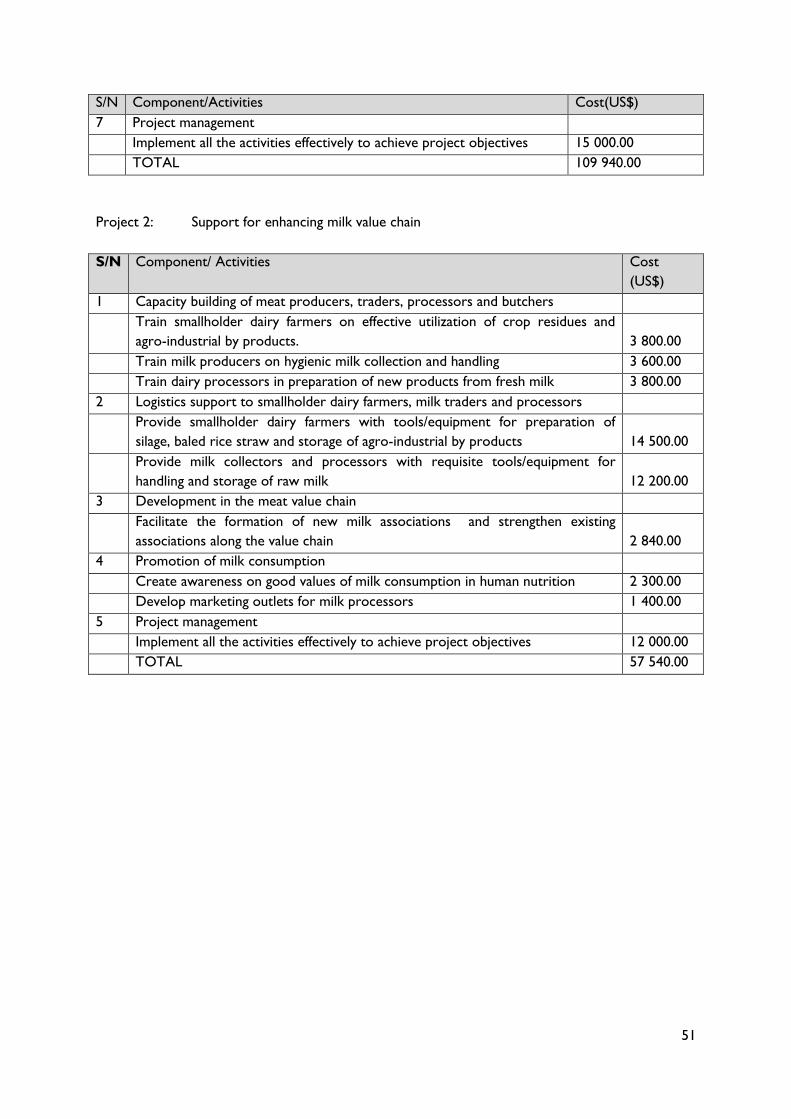
51
S/N Component/Activities Cost(US$)
7 Project management
Implement all the activities effectively to achieve project objectives 15 000.00
TOTAL 109 940.00
Project 2: Support for enhancing milk value chain
S/N Component/ Activities Cost
(US$)
1 Capacity building of meat producers, traders, processors and butchers
Train smallholder dairy farmers on effective utilization of crop residues and
agro-industrial by products. 3 800.00
Train milk producers on hygienic milk collection and handling 3 600.00
Train dairy processors in preparation of new products from fresh milk 3 800.00
2 Logistics support to smallholder dairy farmers, milk traders and processors
Provide smallholder dairy farmers with tools/equipment for preparation of
silage, baled rice straw and storage of agro-industrial by products 14 500.00
Provide milk collectors and processors with requisite tools/equipment for
handling and storage of raw milk 12 200.00
3 Development in the meat value chain
Facilitate the formation of new milk associations and strengthen existing
associations along the value chain 2 840.00
4 Promotion of milk consumption
Create awareness on good values of milk consumption in human nutrition 2 300.00
Develop marketing outlets for milk processors 1 400.00
5 Project management
Implement all the activities effectively to achieve project objectives 12 000.00
TOTAL 57 540.00

52

53

54
I5264E/1/04.16