review of the european test procedure for evaporative...
TRANSCRIPT

Report EUR 25640 EN
20 12
Authors
Giorgio Martini, Urbano Manfredi, Marta
Rocha, Alessandro Marotta
Final Report
Review of the European Test Procedure for Evaporative Emissions: Main Issues and Proposed Solutions

European Commission
Joint Research Centre
Institute for Energy and Transport
Contact information
Giorgio Martini
Address: Joint Research Centre, Via Enrico Fermi 2749, TP 441, 21027 Ispra (VA), Italy
E-mail: [email protected]
Tel.: +39 0332 78 9293
Fax: +39 0332 78 5236
http://iet.jrc.ec.europa.eu/
http://www.jrc.ec.europa.eu/
This publication is a Reference Report by the Joint Research Centre of the European Commission.
Legal Notice
Neither the European Commission nor any person acting on behalf of the Commission
is responsible for the use which might be made of this publication.
Europe Direct is a service to help you find answers to your questions about the European Union
Freephone number (*): 00 800 6 7 8 9 10 11
(*) Certain mobile telephone operators do not allow access to 00 800 numbers or these calls may be billed.
A great deal of additional information on the European Union is available on the Internet.
It can be accessed through the Europa server http://europa.eu/.
JRC77061
EUR 25640 EN
ISBN 978-92-79-27806-8 (pdf)
ISBN 978-92-79-27807-5 (print)
ISSN 1831-9424 (online)
ISSN 1018-5593 (print)
doi:10.2788/72123
Luxembourg: Publications Office of the European Union, 2012
© European Union, 2012
Reproduction is authorised provided the source is acknowledged.
Printed in Italy
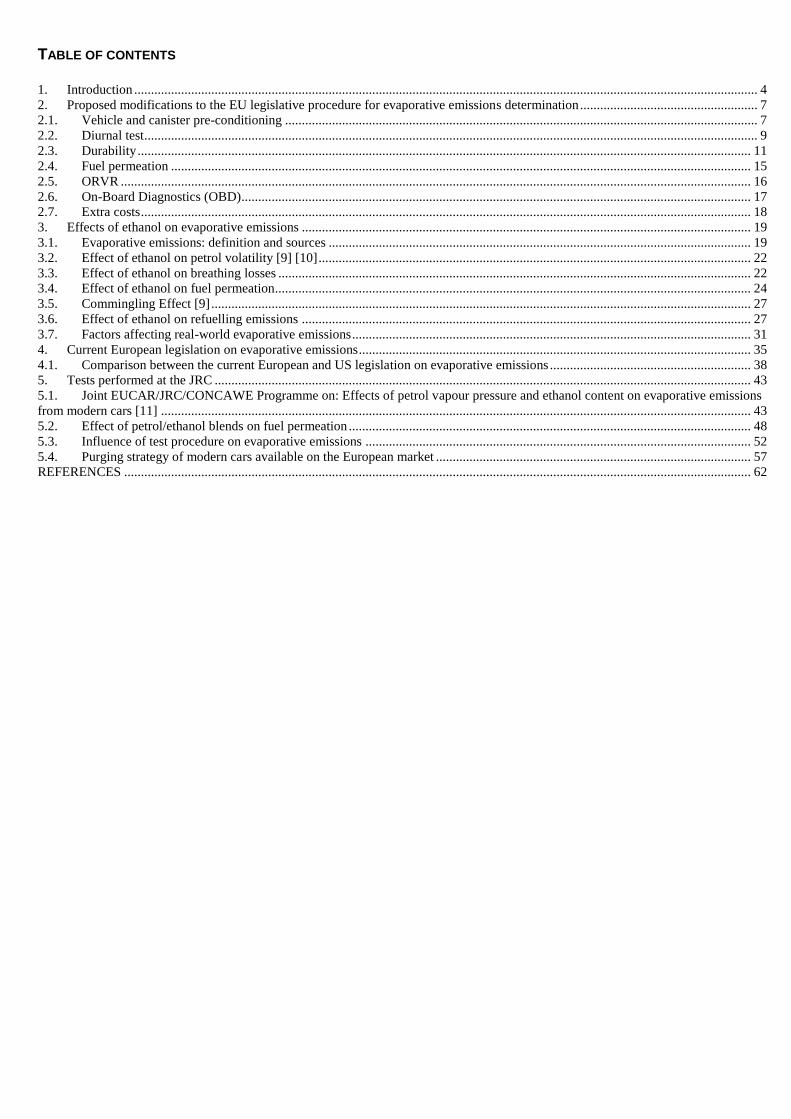
TABLE OF CONTENTS
1. Introduction .......................................................................................................................................................................................... 4 2. Proposed modifications to the EU legislative procedure for evaporative emissions determination ..................................................... 7 2.1. Vehicle and canister pre-conditioning ............................................................................................................................................. 7 2.2. Diurnal test ....................................................................................................................................................................................... 9 2.3. Durability ....................................................................................................................................................................................... 11 2.4. Fuel permeation ............................................................................................................................................................................. 15 2.5. ORVR ............................................................................................................................................................................................ 16 2.6. On-Board Diagnostics (OBD) ........................................................................................................................................................ 17 2.7. Extra costs ...................................................................................................................................................................................... 18 3. Effects of ethanol on evaporative emissions ...................................................................................................................................... 19 3.1. Evaporative emissions: definition and sources .............................................................................................................................. 19 3.2. Effect of ethanol on petrol volatility [9] [10] ................................................................................................................................. 22 3.3. Effect of ethanol on breathing losses ............................................................................................................................................. 22 3.4. Effect of ethanol on fuel permeation.............................................................................................................................................. 24 3.5. Commingling Effect [9] ................................................................................................................................................................. 27 3.6. Effect of ethanol on refuelling emissions ...................................................................................................................................... 27 3.7. Factors affecting real-world evaporative emissions ....................................................................................................................... 31 4. Current European legislation on evaporative emissions ..................................................................................................................... 35 4.1. Comparison between the current European and US legislation on evaporative emissions ............................................................ 38 5. Tests performed at the JRC ................................................................................................................................................................ 43 5.1. Joint EUCAR/JRC/CONCAWE Programme on: Effects of petrol vapour pressure and ethanol content on evaporative emissions
from modern cars [11] ................................................................................................................................................................................ 43 5.2. Effect of petrol/ethanol blends on fuel permeation ........................................................................................................................ 48 5.3. Influence of test procedure on evaporative emissions ................................................................................................................... 52 5.4. Purging strategy of modern cars available on the European market .............................................................................................. 57 REFERENCES ........................................................................................................................................................................................... 62

1. INTRODUCTION
The current European legislation on evaporative emissions dates back to the Directive 98/69/EC (Euro 3-4 standards). Since then neither the emission limits nor the test procedure have changed. As stated in several legislative documents the European Commission has now the obligation to review the evaporative emissions test procedure in order to improve control of evaporative emissions:
Regulation (EC) No 715/2007 of the European Parliament and the Council evaporative emissions Article 4 2. … In addition, the technical measures taken by the manufacturer must be such as to ensure that the tailpipe and evaporative emissions are effectively limited, pursuant to this Regulation, throughout the normal life of the vehicles under normal conditions of use. ... …In order to improve control of evaporative emissions and low ambient temperature emissions, the test procedures shall be reviewed by the Commission. Communication on the application and future development of Community legislation concerning vehicle emissions from light-duty vehicles and access to repair and maintenance information (Euro 5 and 6) - (2008/C 182/08) Evaporative emissions 9. Due to the wider introduction of biofuels, the Commission intends to review test procedures for evaporative emissions. This review should consider whether greater global harmonisation is desirable through alignment of the European test procedure with that used in the United States. In doing so, consideration may be given to introducing in-service conformity or durability requirements to control the effects of long term use of fuels containing ethanol on evaporative emissions.
According to the quoted documents, there are three different aspects that have to be addressed: A more effective control of evaporative emissions throughout the normal life of the vehicles under normal conditions of use. A first implication is that the evaporative emissions should more effectively controlled in real world driving conditions and not just in laboratory conditions. There is evidence that in many cases the evaporative emissions control systems are designed just to pass the legislative test. In particular, as described in this report, the purging strategy adopted in some models is such that the canister is not purged efficiently when the vehicle is driven at low speeds in urban areas. This can easily lead to saturated canisters that may result in uncontrolled evaporative emissions especially in hot climate conditions. In addition, in the current legislative procedure the vehicle is driven over three whole NEDC cycles after the canister loading to the breakthrough and before starting the evaporative emission diurnal test. This means that the vehicle is driven for a total of 33 km during which the canister is purged. Real world activity data shows that the typical trip length is much shorter especially in urban areas. A more effective control throughout the useful life of the vehicles implies also an improved durability of the evaporative emission control system. So far in the European legislation there is no procedure to ensure the durability of the evaporative control system over the useful life of the vehicle. In the US, in addition to specific durability requirements, the performance of the evaporative control system are also regularly checked with an in-use verification programme. The impact of ethanol on evaporative emissions. The European Directive on the promotion of renewable fuels [13] set the objective of 10% coverage of the transport fuel market with renewable fuels by 2020. Ethanol is the most popular renewable fuel at the moment and one of the main options to fulfil the target set by the Directive. However, ethanol has a significant influence on both exhaust and evaporative emissions of petrol passenger cars when added to

the fuel even at low levels (5%). Due to the oxygen content of ethanol, some exhaust emissions may be slightly reduced but some other non regulated pollutants can increase (e.g. acetaldehyde). As far as evaporative emissions are concerned, ethanol has a significant impact on emission levels as a consequence of the following effects:
Increased vapour pressure of the fuel. Increased permeation rate through the plastic material which the tank and fuel lines are made of. Reduced working capacity of the carbon canister used to control evaporative emissions. Commingling effect. Increased refuelling emissions also due to reduced effectiveness of Stage II refuelling vapour
recovery systems. All these effects are discussed in details in the Chapter 3. The EU Regulation (EC) n° 692/2008 [14] defines the new reference fuel to be used for type approval tests as far as exhaust and evaporative emissions are concerned. In particular, for petrol passenger cars a new reference fuel containing 5% ethanol has been introduced in order to reflect the likely average petrol composition in the future. However, as it is demonstrated in this report, the introduction of a new reference fuel containing ethanol may not be sufficient to solve the potential problems on evaporative emissions due to the presence of ethanol in the fuel. For example, it takes several weeks to reach a stabilized fuel permeation rate when switching from a pure hydrocarbon fuel to a petrol/ethanol blend. Moreover, the reduced working capacity of the carbon canister used to control evaporative emissions is a long term effect of ethanol. The issues related to the impact of the presence of ethanol in the fuel on evaporative emissions have been extensively addressed in the past by a large number of studies conducted in the USA. In response to this US EPA and CARB developed specific measures in order to reduce or eliminate the negative effects of ethanol on evaporative emissions of vehicles. As a results the current US legislation on evaporative emissions is much stricter than in Europe and consists of different test procedures and specific requirements on components thoroughly covering all the factors influencing evaporative emissions. The tests carried out at the JRC and in other laboratories have clearly shown that not only do vehicles designed to comply with the US legislation exhibit very low evaporative emission levels in the legislative test, but in general emissions remain low in more severe tests even using petrol/ethanol blends. These vehicles retain also very good performance in the long term as demonstrated by the in-use verification programme conducted in the USA. On the contrary, the in-use compliance programmes carried out by some EU Member States have put in evidence high failure rates of European vehicles when tested for evaporative emissions. The results of the in-service conformity programme run by the Swedish Transport Administration (formerly Swedish Road Administration) are particularly worrying; a failure rate of 30% was found while a similar in-service conformity programme run in Germany resulted in a 10% failure rate. Since Sweden is one of the European countries in which ethanol as component of transport fuel is very popular, the result obtained suggests that the higher non-compliance rate could somehow be due to ethanol. The most likely explanation is a reduced working capacity of the carbon canister due to contamination with ethanol. Another issue related to the use of ethanol, is the increased vapour pressure of the fuel when ethanol is splash blended with petrol (the maximum increase of vapour pressure corresponds to an ethanol content of about 5%). It is clear that, even if there may be no increase of evaporative emissions in the legislative test, the larger volume of vapours generated in the tank as a consequence of the higher vapour pressure leads to a faster saturation of the canister. This implies that real world evaporative emissions may increase since the canister and the purging strategy of the current vehicle generation are designed for pure

hydrocarbon fuels with a 60 kPa DVPE. A larger canister like those used in the vehicles complying with the US legislation and a more aggressive purging strategy would improve the control of evaporative emissions in real world conditions. In order to improve the capability of European petrol cars to control evaporative emissions in real world driving conditions especially in view of a wider introduction of ethanol in the fuel market, it is considered necessary to revise the European legislation regarding this kind of emissions. In the long term, a worldwide harmonized test procedure is desirable and it should be developed within UN-ECE GRPE working group for WLTP (Worldwide Harmonized Test Procedure for Light Duty Vehicles). However, a revision of the European procedure is considered necessary also on the short term since the current passenger car models will be on the roads for many years and a future worldwide harmonized procedure will result in significant benefits only after some years from its introduction depending on the car fleet renewal rate. In respect to this there are two main options that could be implemented in Europe:
To implement the US legislation on evaporative emissions adapted to the European context To modify the European test procedure in order to solve specific issues related to the introduction
of ethanol and to better control the real world evaporative emissions taking inspiration from the US legislation and experience.
From a technical point of view, both options can be easily implemented in Europe since almost all the manufacturers produce models for the US market and therefore they have already the technology and the know-how to comply with the US legislation. In some cases, vehicle models marketed both in Europe and US are even equipped with the same evaporative control system which of course is designed for the most severe requirements. In other cases the system is downgraded by reducing the activated carbon amount without significant changes to the design of the system: One of the passenger cars tested by the JRC, a European car model marketed also in the USA, was equipped with a system required to comply with the US legislation but the canister was only partially filled with carbon. However the US legislation on evaporative emissions is very complex and probably some elements are not strictly necessary for vehicles of the latest generation. For example, most modern vehicles are fuel return-less and therefore the temperature in the tank is not expected to rise very much during normal driving conditions. The potential evaporative emissions due to high temperatures in the tank when the vehicle is running, is addressed in the US legislation by the running losses test. These losses are expected to be quite limited in modern vehicles since the temperature in the tank is much more controlled. In addition, the US legislation is based on a very different approach compared to the typical EU type approval procedure. In particular self-certification based on in-house testing procedures developed by manufacturers plays a very important role in the USA while is not common in Europe. In this report, as alternative approach to adopting the US legislation on evaporative emissions, a minimum set of modifications to the current European legislation, considered indispensable to cover the ethanol related issues and to improve the control of real world evaporative emissions, is proposed. Moreover, this report provides an overview on evaporative emissions from passenger cars and on the effect of ethanol on them. A comparison between the European and US legislation is also provided. Finally, the results of experimental work conducted at the JRC on evaporative emissions are presented.

2. PROPOSED MODIFICATIONS TO THE EU LEGISLATIVE PROCEDURE FOR EVAPORATIVE EMISSIONS
DETERMINATION
2.1. VEHICLE AND CANISTER PRE-CONDITIONING
Issue Currently the EU legislative procedure prescribes the following steps before starting the actual evaporative emission test (a detailed description of the current EU legislative procedure is given in Chapter 4):
Canister loading to breakthrough. Fuel drain and refill with reference fuel Preconditioning drive: Within one hour from the completing of canister loading the vehicle has to be
placed on the chassis dynamometer and driven through one Part One and two Part Two driving cycles of Type I test (NEDC cycle).
Soaking (before Hot Soak test): Within five minutes of completing the preconditioning drive, the vehicle has to be driven off the chassis dynamometer and parked in the soak area. The vehicle has to be left parked in the soak area at a temperature between 20-30 °C for a minimum of 12 hours and a maximum of 36 hours.
Conditioning drive: After conclusion of the soak period the vehicle has to be driven through a complete Type I test drive (cold start urban and extra urban test).
Within two minutes of completing the Type I test, the vehicle has to be driven a further conditioning drive consisting of one urban test cycle (hot start) of a Type I test. Then the engine is shut off at the end of this conditioning drive.
In this procedure, after the canister loading to breakthrough, the vehicle is driven in total through three (3) complete NEDC cycles, corresponding to 33 km drive length and 59 minutes drive time. During this drive period the fuel system adapt to the new fuel and the canister is purged. This drive time is much longer than the drive time prescribed by the US two-day diurnal test (31.4 minutes). Despite this fact, the experimental work carried out in the framework of the JRC/EUCAR/CONCAWE study on evaporative emissions [11] demonstrated that repeating the test European procedure for evaporative emissions without any additional conditioning between tests above that prescribed by the legislation, resulted in an increase of the carbon canister weight and of evaporative emissions with successive tests. In other words, the current conditioning procedure is not sufficient to return the vehicle to a consistent condition at the start of each test when multiple consecutive tests are carried out. The increase of the canister weight, which is indicative of the accumulation of petrol vapours probably due to insufficient canister purging, suggests that in case of short trips, which are quite common in city driving, it is very likely that the canister is not purged sufficiently. In the same study it was found that the situation is worsened by the presence of ethanol in the fuel (see chapter 5.1). In addition, in the JRC laboratory the purging flow rate of typical European passenger car has been measured while the vehicles were driven over the legislative driving cycle (see chapter 5.45.1). In some cases the purging flow rate recorded over the urban part of the cycle resulted to be much lower than the flow rate over the extra-urban part. This can mean that the canister is not purged efficiently if the vehicle is mainly driven in urban areas at low speeds. Furthermore, real world activity data recorded with GPS systems in urban areas shows that the typical trip length is quite short. Two sets of data are available at the JRC at the moment: One set is referred to the city of Modena (Italy) and includes the activity of about 15000 vehicles recorded over one month (May 2011). The second set of data is referred to the city of Florence (Italy) and includes the activity of 12000 vehicles recorded over the same month. Both these sets of data are referred to vehicles mainly driven in the urban areas of the two cities. The distribution of the trip length and of the duration of parking events can be derived from the analysis of these sets of data.

The distribution of trip length for the city of Modena is shown in Figure 1. It can be seen that more than 60% of the trips have a length below 5 km. The 90th percentile of the trip length is close to 20 km. This is a clear indication that the conditioning drive in the current procedure is too long compared to real world driving patterns. Figure 1: Trip length distribution in the city of Modena (Italy).
0
10
20
30
40
50
60
70
0-5 5-10 10-15 15-20 20-25 25-30 30-50 50-100 100-850
Per
cen
tage
(%
)
Trip Distance (km)
Distribution of trip lenght(Modena)
Moreover, Table 1 provides the percentage of parking events lasting at least 12 hours preceded by a trip of a given distance. For example, the first column of Table 1 provides the percentage of parking events having a minimum duration of 12 hours preceded by a trip having a length below 5 km. It can be noticed that the vast majority of parking events are preceded by trips below 15-20 km and this means that most of the vehicles start a paring event with a poorly purged canister. Table 1: Percentage of parking events lasting at least 12 hours preceded by a trip of a given distance
Trip length (km) <5 10 15 20 25 30 35 40 45 50
Percentage of parking events 55% 18% 10% 6% 3% 2% 1% 1% 1% 0%
Possible solution The proposed modification to the current evaporative emissions test procedure consists in postponing the canister loading to breakthrough after the pre-conditioning drive, reflecting to a certain extent the vehicle and canister conditioning procedure prescribed for the US EPA two-day diurnal test (see chapter 4.1). In fact the purpose of the two-day diurnal test is to verify sufficient purging of the canister during the exhaust emission test (FTP 72), which simulates short trip. In addition, the US legislation requires the measurement of the exhaust emissions during the conditioning drive.

Loading the canister to breakthrough after the pre-conditioning drive means reducing the total canister purge time from 59 minutes to 32.7 minutes drive time (1 complete NEDC cycle + 1 Part One), very close to the 31.2 minutes drive time carried out in the two-day diurnal test. This will require the adoption of a more aggressive purging strategy that will regenerate more efficiently the carbon bed especially in case of short trips. The US experience demonstrates that it is possible to combine an aggressive purging strategy with low exhaust emissions. The modified procedure would be as follows:
Fuel drain and refill with reference fuel. The test sequence begins by replacing all the fuel in the vehicle with test fuel and acclimating the vehicle to laboratory conditions (e.g. ambient temperature of 20-30°C). The fuel tank is drained and refilled with test fuel to 40 percent capacity. Soaking 1 The vehicle has to be left parked in the soak area at a temperature between 20-30 °C for a minimum of 6 hours and a maximum of 36 hours. Preconditioning drive After the soak period, the vehicle has to be placed on the chassis dynamometer and driven through one Part One and two Part Two driving cycles of Type I test (NEDC cycle). The purpose of this pre-conditioning drive is to let the fuel system and the EMS to adapt to the new fuel. Soaking 2 Within five minutes of completing the preconditioning drive, the vehicle has to be driven off the chassis dynamometer and parked in the soak area. The vehicle has to be left parked in the soak area at a temperature between 20-30 °C for a minimum of 12 hours and a maximum of 36 hours. The vehicle is not allowed to be started or moved Canister loading to breakthrough. This operation is executed during the soak period. Fuel drain and refill with reference fuel. The fuel tank is drained and refilled again with test fuel to 40 percent capacity. This operation is executed during the 12-36 hours soak period. Conditioning drive: After conclusion of the second soak period the vehicle has to be driven through a complete Type I test drive (cold start urban and extra urban test). Within two minutes of completing the Type I test, the vehicle has to be driven a further conditioning drive consisting of one urban test cycle (hot start) of a Type I test. Then the engine is shut off at the end of this conditioning drive.
2.2. DIURNAL TEST
Issue The test carried out at the JRC and in other laboratories show that carbon canisters typically used in European cars are very often fully saturated after one diurnal test and from the second diurnal test onward a steep increase of evaporative emissions is quite common. This implies that a vehicle may have almost uncontrolled evaporative emissions when left parked for more than one day. Obviously the higher vapour pressure of the petrol/ethanol blends reduces the time needed to reach the complete saturation of the canister since at a given temperature the volume of vapours generated is larger. The distribution of parking duration for the city of Modena is shown in Figure 2. It can be seen that many parking events are very short but there is also a small fraction (above 2%) of parking events with a duration of more than 24 hours.

Figure 2: Distribution of parking duration in the city of Modena (Italy). Total parking events: 2642320 in the month of May 2011
0
5
10
15
20
25
30
35
40
45
50
0.5 1 1.5 2 2.5 3 6 12 24 48 168 700
Per
cen
tage
(%
)
Parking duration (hours)
Distribution of parking duration(Modena)
However, it has to be taken into account that most of the events included in the distribution shown in Figure 2 are not relevant for evaporative emissions (e.g. parking event occurring when the ambient temperature is decreasing). If the analysis is limited to the parking events having a minimum duration of 12 hours that fall totally or partially between 5:00 in the morning and 17:00 in the afternoon (hereinafter called diurnal cycle), which corresponds to the period during which the temperature predominantly rises in Modena in the month of May, the results are the following: Table 2 Diurnal cycles of consecutive parking 1 2 3 4 5 >6
Number of events 94883 18371 5678 2257 1275 2101
Events per vehicle per month (average) 5.85 1.13 0.35 0.14 0.08 0.13
Sample size: 16223 vehicles
The first column of Table 2 provides the number of parking events with a minimum duration of 12 hours that lasted without interruption from 0.5 to 1.5 diurnal cycles. The second column provides the number of even longer parking events that lasted without interruption from 1.5 to 2.5 diurnal cycles, and so on. Finally, the third row of Table 2 provides the average number of times in a month that a single vehicle is parked for the given number of diurnal cycles. In other words, within the sample considered (16223 vehicles), 1.13 is the average number of times each vehicle is left parked for 1.5-2.5 diurnal cycles. We can assume that the current legislative test procedure covers only the events falling into the first column. Possible solution The 24-hour diurnal test is replaced with a 48-hour (two-day) diurnal test.

The current European procedure for the diurnal test remains substantially unchanged and is repeated twice without interruption. More specifically, the existing EU temperature curve has to be used. The evaporative emissions are measured separately in each of the two diurnal tests. The highest value of the two measured is compared with the emission standard. Compared to the current European procedure, hourly measurements of the hydrocarbon concentration inside the SHED could be introduced. This would allow a better analysis in case of fail. The adoption of the two-day diurnal test will require the use of larger volume of activated carbon which may result in larger canisters and consequently also the total purge volume will have to be increased. This will significantly reduce the frequency of canister saturation in the real world especially in case of use of petrol/ethanol blends.
2.3. DURABILITY
Issue The in-use compliance programme run in Sweden has found an unusual high failure rate as far as evaporative emissions are concerned. Of the 132 vehicles tested over several years, 43 exhibited evaporative emissions above the current emissions standard (2.0 grams/test). Moreover, the failure rate resulted to be quite constant over the different years:
- 2003-2005: 38% - 2006.2008: 29% - 2009: 31%
In a parallel programme run in Germany the failure rate turned out to be much lower (10%). As already mentioned in the introduction, the most likely explanation of the high failure rate found in the Swedish in-use compliance programme is the reduced working capacity of the carbon canister used to control evaporative emissions due to the ethanol which is very popular in Sweden as petrol component. Ethanol, being a polar molecule, is harder to purge from the canister and in the long term can reduce the working capacity of the canister. This explanation seems to be confirmed by an experimental programme jointly conducted by the Swedish Road Administration and TÜV NORD [15]. Contrary to the European counterpart, US emission legislation requires vehicle manufacturers to demonstrate the durability of the evaporative emission control system and its components throughout the vehicles useful life. The manufacturer is responsible for developing a vehicle or components aging procedure according to good engineering judgement. The aging procedure can be based upon whole-vehicle mileage accumulation, bench ageing of individual components or a combination of these approaches. This requirement is strengthened by the in-use verification programme which is mandatory for the automakers. In case of presence of ethanol in the fuel, carbon canister is one of the most important components as far as durability is concerned. More specifically, activated carbon quality plays a very important role on the short and long term efficiency of the carbon canister used to control evaporative emissions. The size distribution of the pores and more specifically the ratio between micropores, mesopores and macropores is one of the main parameter affecting the activate carbon performances in terms of adsorption efficiency and its behaviour on the long term. Activated carbons with a high number of micropores compared to meso and macropores can be more efficient in terms of adsorption performance but may result in a worse durability in the long term. A right compromise between the adsorption efficiency and the long term durability is needed for automotive applications. Ethanol, as already explained, may reduce the working capacity of the

canister over time and therefore the carbon quality becomes more important compared to a situation in which pure hydrocarbon petrol is used. According to some charcoal manufacturers, there are products that do not show any degradation over time due to the presence of ethanol in the fuel. In the USA the durability demonstration for evaporative emissions (CFR 86.1824-08) must predict an expected in-use emission deterioration rate and emissions level that effectively represents a significant majority of the distribution of emission levels and deterioration in actual use over the full useful life of candidate in-use vehicles. Manufacturers must conduct a durability demonstration based either on whole vehicle aging or a bench aging procedure. For whole vehicles the mileage accumulation should be conducted using the Standard Road Cycle (SRC) and evaporative emissions should be at least tested at each of the five different mileage points selected using good engineering judgment. In case of bench aging, manufacturers may use bench procedures designed, using good engineering judgment, to evaluate the emission deterioration of evaporative control systems. Manufacturers usually follow this second approach and have developed specific test procedures to evaluate each single component of the evaporative control systems. As far as the carbon quality is concerned, a generally recognized procedure to demonstrate the durability performance of the activated carbon accepted by US EPA as well, is based on an aging procedure consisting of repeated loading/purging cycles. This procedure is described below (bullet point 1.) The manufacturers have to provide adequate documentation demonstrating that the working capacity of the carbon canister does not degrade more than 10% below the initial value when aging the canister with the above mentioned procedure using an E10 fuel. In addition, the manufacturers are required to demonstrate the durability of other components (tank, purge valve and fuel cap). Possible solution Four different options are proposed:
1. Requirement on carbon quality A new requirement on the activated carbon quality is introduced. This requirement would ensure the use of an activated carbon able to retain its working capacity for long time even in presence of ethanol in the fuel. However it would not guarantee the durability of the whole system. The manufacturer will have to submit to the type approval authority suitable documentation to prove that the carbon canister is filled with activated carbon having a loss of petrol working capacity less than 10% after 500 cycles of purging and loading. In addition, the manufacturer will have to provide the type approval authority with at least two canisters identical to the one installed on the vehicle. The type approval authority may decide to test a canister using a specific aging procedure like the one described here below:

Initial EPA BWC Measurement
Measure EPA BWC Every 100 GWC Cycles
Intermediate and Final EPA BWC must be ≥ 90% of
Initial EPA BWC To Pass Durability Requirement
500 Cycles Gasoline Working Capacity using E10
Initial EPA BWC Measurement
Measure EPA BWC Every 100 GWC Cycles
Intermediate and Final EPA BWC must be ≥ 90% of
Initial EPA BWC To Pass Durability Requirement
500 Cycles Gasoline Working Capacity using E10
- Initial/Final EPA BWC Evaluation Run 13 test cycles consisting of loading vapour through canister tank port, with canister vent open, canister purge capped and 10 minute soak between load and purge.
o Test temperature equals 20 to 30 °C o Load to 2.0 ± 0.1 grams breakthrough by FID reading (using a Mini SHED or direct measurement
of vent stream). Load at 15 grams per hour using 50/50 butane/nitrogen or butane/air by volume.
o Purge with air for 300 bed volumes at a rate of 22.7 L/min into the vent port, purge through purge port, tank port capped. Humidity of purge is controlled at ≤ 50% Relative Humidity.
EPA BWC equals the average of the 12th and 13th cycle load to 2 gram breakthrough ± 5% (including 2 gram breakthrough). - 500 Cycles of Gasoline Aging
o Use a E10 60 kPa fuel. o Load the canister at ambient temperature of 24 ± 2 °C through the tank tube with 50/50
mixture by volume of air nitrogen and the specific validation fuel vapour. Generate the fuel vapour at a temperature of 40 ± 2 °C with a flow rate of 40 ± 2 grams/hour. Rune test until breakthrough (5000 ppm by FID or greater)
o Let the canister sit for 5 minutes o Purge with 300 bed volumes of air at 22.7 L/min and ≤ 50% Relative Humidity through the
purge tube. Begin loading the canister again within 5 minutes of completing the purge portion of the cycle.
o Test canister for 500 cycles. o After each 100 gasoline aging cycles, interrupt the test and run an EPA BWC. o At the completion of each EPA BWC evaluation, the EPA BWC shall not degrade > 10% below the
initial EPA BWC. o ([Initial EPA BWC]-[Aged EPA BWC]) / [Initial EPA BWC] 10%
2. Certification level durability testing based on whole vehicle aging A durability demonstration vehicle is aged using the mileage accumulation procedure described in the Regulation 692/2008. In addition to the exhaust emissions measurement, which is already required by the EU legislation, also evaporative emissions are measured before and after the mileage accumulation. The Regulation requires exhaust emissions to be measured every 10000 km. Evaporative emissions might be measured every 40000 km considering the duration of the evaporative emission tests.

However, the whole vehicle aging procedures described in the Regulation 692/2008 do not guarantee that the carbon canister is adequately aged since its loading and purging are strictly depending on driving conditions, fuel quality and ambient temperatures. For examples, if the mileage accumulation is carried out during the winter season or on a chassis dynamometer at a constant temperature, the canister will be loaded to a very limited extent. Therefore, the final evaporative emission test, to be performed at the end of the mileage accumulation should at least be run using a carbon canister aged following the procedure described in the previous bullet point.
3. Certification level durability testing based on component aging The type approval procedure is modified by introducing an additional evaporative emission test performed with aged components: Run evaporative test sequence on new vehicle Age vehicle and components:
- Carbon canister o 500 cycles GWC on E10 with BWC each 100 cycles o Maximum reduction in BWC < 10% of original o Thermal cycle and vibration
- Purge valve o Cycle 150 million open close cycles at least half with fuel vapour o Thermal cycle and vibration o Measure before/after flow rates and coil resistance
- Fuel cap o 400 On-Off cycles o Pressure vacuum cycling
- Tank
o The tank is filled to 50% with reference fuel (E5), sealed and placed on an orbital shaker table
set to approximately 2 cycles per second. o 1.2 million cycles
Assemble “aged vehicle” and run test sequence; Aged vehicle must meet evaporative emission standard. The feasibility of the approach described above has to be checked since replacing some components can be a very complicated operation. 4. In-use compliance programme The durability of the evaporative emission control system of European passenger cars might be significantly improved by introducing the measurement of evaporative emissions in the in-use compliance programme currently required for exhaust emissions. There are some potential issues in the approach based on the in-use verification that need to be carefully evaluated. Evaporative emissions can be influenced to a large extent by non-fuel related factors like tyres, detergents used for vehicle interior cleaning, contamination with hydrocarbons, etc. A vehicle conditioning

procedure is probably needed; for example, the vehicle should be cleaned before testing. Other provisions should be introduced like a minimum age of the tyres, etc.
2.4. FUEL PERMEATION
Issue As explained in the following chapters, fuel permeation through plastic material which tank and fuel lines are made of represents a major source of evaporative emissions. It is well known that ethanol increases the fuel permeation rate. However permeation emissions generally approach a stabilized level in several weeks when switching from one fuel to another as shown by a study co-sponsored by the California Air Resources Board (CARB) and Georgia-based Coordinating Research Council [4]. According to other sources (US EPA, Coordinating Research Council (CRC)) it takes up to 20 weeks to stabilize a low-permeation, multi-layer tank to steady state. High temperature aging with frequent fuel replacement accelerates stabilization to 7-10 weeks. Multiple diurnal tests on two vehicles carried out with the canister vented out of the SHED in the JRC’s VELA laboratory (see chapter 5.2) showed an increase of evaporative emissions of 13% and 23% about two weeks after switching from a pure hydrocarbon fuel to petrol containing 5% ethanol. This increase can be attributed to fuel permeation. This implies that, in order to perform a test more representative of real world conditions, it is necessary to condition the fuel system with fuel containing ethanol for some time in order to correctly take into account the effect on fuel permeation. Possible solution Both in the European and US legislation fuel permeation is not directly regulated. Permeation contributes to the total evaporative emissions measured in the SHED and therefore it has to be low enough to avoid non compliances. Obviously, the lower the emission limit the lower the maximum permeation rate allowed for tank and fuel lines when performing the legislative test. As a result of the stricter emission limit applied in the USA, vehicles are typically equipped with multilayer with reduced permeation rates while in Europe about 35%1 of the vehicles sold every year are still equipped with monolayer tanks. Therefore there are three main options to keep under control the effect of ethanol on permeation: To introduce a durability procedure to ensure that the evaporative emissions standard is met throughout the useful life of the vehicle.
To lower the emission standard in order to reduce the maximum allowable permeation rate. The tests carried out at the JRC with the canister vented out of the SHED (see chapters 5.2 and 5.3) suggest that the contribution of permeation to evaporative emissions of typical European vehicles may range from 0.3 to 1.8 grams. The lowest values are obtained with vehicles equipped with metal tanks or with vehicles designed for the US market which have in general total emissions well below 1 g/day. In addition it was found that the evaporative emissions measured with the canister vented out of the SHED are only slightly below or even similar to the evaporative emissions measured in the standard procedure. This means that by simply adopting the same material needed for the fuel system to comply with the US standard (e.g. multi-layer tanks) it would be quite easy to comply with a much stricter limit (for example 1.2 g/day). In this respect, a possible option to avoid changing the emission standard in Europe that currently is 2 g/test, is to use a modified 48 hours diurnal test procedure in which the result of the test is the total
1 Data provided by PlasFuelSys, the European Plastic Fuel Tanks and Systems Manufacturers Association

evaporative emissions at the end of the two days. Currently in the USA multi-days diurnal tests, only the worst day is considered and compared to the emission limit. Introducing in Europe a 48 hours diurnal with the total emissions measured over the two days will correspond to reducing the limit to 1 g/day. To complement the evaporative emission test procedure with a conditioning procedure of the tank and of the fuel system in order to take into account the effect of ethanol on permeation. Since permeation rate reaches a stabilized level after several weeks whose number depends also on the temperature, the type approval authority will have to check that fuel containing ethanol has been in contact with the tank inner surface for an appropriate number of weeks before starting the evaporative emissions test. In order to accelerate the process, the vehicle could be left soaking for two weeks with the fuel in the tank heated at 40 °C. The fuel in the vehicle tank must be heated by a controllable source of heat; for example a heating pad of 2 000 W capacity is suitable. The heating system must apply heat evenly to the tank walls beneath the level of the fuel so as not to cause local overheating of the fuel. Heat must not be applied to the vapour in the tank above the fuel. The heating system must be capable of controlling the fuel temperature to ± 1,5 °K of the required temperature during the tank heating process.
2.5. ORVR
Issue Low petrol/ethanol blends (5-10% ethanol content) will likely increase refuelling emissions for two main reasons:
The increased vapour pressure due to the ethanol splash blending and to the commingling effect (the Directive 2009/30/EC on fuel quality introduces the possibility of a waiver for the petrol/ethanol blends in order to allow splash blending of ethanol in petrol). Stage II systems may work with a reduced efficiency due to the variability of the fuel composition and vapour pressure. This will affect the ratio of vapour displaced form the tank to the liquid dispensed into the tank which very seldom will match the calibration of the Stage II system (see chapter 3.6). In addition, the introduction in the market of flexible-fuel vehicles able to run on E85 may require the installation of a dedicated Stage II system at refuelling stations which can an important issue since no Stage II equipment certified for E85 seems to be commercially available.
There is also a potential safety issue since the gas atmosphere in an E85 system will have a compound within the explosion range more often than is the case with petrol [22]. For this reason some manufacturers producing flexible-fuel vehicles have already adopted ORVR systems. Possible solution For a number of reasons including the presence of ethanol in the fuel, in the USA there was growing concern about the effectiveness of Stage II in controlling refuelling emissions. Convinced that On-board Refuelling Vapour Recovery systems would be more effective and less costly than Stage II, US EPA required the adoption of a vehicle-based control policy in 1990 with an amendment to the Clean Air Act. The relevant regulations were finalized in 1995 and ORVR was finally introduced in 1998 with phase-in over several years. ORVR system works on the principle of forcing all vapours displaced by the dispensed liquid through the vehicle’s carbon canister.

In this case the recovery efficiency is independent of the V/L ratio. The most important modifications needed to convert a standard evaporative emission control system in an ORVR are the following (see chapter 3.6 for more details):
A larger canister and a different carbon type. The larger canister is needed to adsorb the vapours displaced by the liquid dispensed into the tank. The pressure drop of the canister has to be minimized and in any case has to be less than seal head in the filler pipe. Typically, a pelletized carbon type is used to achieve this. It is important to mention that the larger canister required by the ORVR system would also allow to pass multi-day diurnal tests. A reduced diameter filler pipe. The reduced diameter will create a petrol liquid seal preventing tank vapours from escaping through filler nozzle. A specific design of the lines connecting the tank to the canister and to the filler pipe in order to achieve the proper pressure drops to force the vapours through the canister.
The additional cost to convert a standard system in an ORVR is estimated in about 25 Euros/vehicle (on average). The US procedure to check refuelling emissions can be easily adopted considering that several manufacturers are used to it, as they export vehicle to the USA. The size of vehicles (smaller in EU) is not an issue considering that some small cars like Mini, Fiat 500, Smart and Ford Fiesta are sold in the US. However, the Directive 2009/126/EC requires the installation of Stage II vapour recovery systems in any European existing service station with a throughput > 3000 m3/year by no later than 31/12/2018 while any new and refurbished service stations have to be already equipped with Stage II systems. Any cost/benefit analysis of a possible adoption of ORVR in Europe should take into consideration the current legislative context and the level of implementation of Stage II systems.
2.6. ON-BOARD DIAGNOSTICS (OBD)
Issue Currently in Europe the OBD requirement regarding evaporative emissions simply consists in the check of the integrity of the electric circuit of the purge valve. However this does not guarantee a proper functioning of the evaporative emission control system. For example, no malfunction indication would be provided to the driver in case of a leakage in the fuel system or a blocked line. In the USA, the OBD is required to detect when the emission control system exceeds emission levels by 50% or, in case of evaporative emissions, any vapour leak in the evaporative and/or refuelling system greater than or equal in magnitude to a leak caused by a 1 mm diameter orifice. The system to be checked is defined as the system contained between the fuel filler cap, the canister purge valve and the canister vent valve. The OBD must also detect conditions where flow of fuel vapour can be leaked into the atmosphere, such as a no purge condition. In this condition, the carbon canister becomes overloaded with fuel vapour and can leak fuel vapour into the atmosphere (CFR 86.1806-05). In order to ensure a good efficiency of the evaporative emission control system and for enhanced safety, the OBD is required to:
Monitor functioning of evaporative emission control system (except carbon canister adsorption of HC)
Check system for leakage – 0.5 mm CARB, 1.0 mm US EPA Check system for blockage – entire system Establishes the presence of fuel filler cap for enhanced impact and roll over safety Check of system for enhanced evaporative control system for integrity

This can be achieved with different systems with a total cost for vehicle ranging from 12 USD to 25 USD. Possible solution The simplest and cheapest system to detect leaks and the proper functioning of the purge valve is to require the installation of a system checking the engine applied vacuum. This would require: - A pressure transducer/sensor (about 4.50 USD) - A vent valve (about 4.00 USD) - Add to PCM (Powertrain Control Module) 1 driver chip and 1 analog to digital converter chip (1.00 – 2.00 USD).
2.7. EXTRA COSTS
The proposed modifications would imply a more expensive fuel system and evaporative emission control system. The estimated extra costs per vehicle for the different options are provided in the following table: Additional cost per
vehicle Multi-day diurnal Canister*
Testing
5-6 USD 0.50 – 3.00 USD
Low fuel permeation material
Low perm. tank, hoses, etc. 50 - 70 USD
ORVR Larger canister* and other components
25 Euros
Durability requirement Aging of vehicle and components
0.50 – 3.00 USD
OBD Engine applied vacuum system
15 USD
*The larger canister required by the ORVR would allow to pass multi-day diurnal test In addition to the costs associated with new hardware or testing procedures, other costs have to be taken into account: Re-calibration of the engines in case a more aggressive purging strategy is needed. New facilities. If the two-day diurnal test is adopted, additional facilities will be needed because of the longer time needed to complete one test. Of course, the actual costs will depend on the lead time for the implementation of the revised procedure. For example, the calibration of the engine should not be considered for future models but only to adapt engines already certified according to Euro 5 standards.

3. EFFECTS OF ETHANOL ON EVAPORATIVE EMISSIONS
One of the major concerns related to the use of splash blended petrol/ethanol blends is the possible increase of evaporative emissions due to a combination of factors: - Increased vapour pressure of the petrol/ethanol blends - Increased fuel permeation through plastic and rubber components of fuel system - Commingling effect - Increased refuelling emissions
3.1. EVAPORATIVE EMISSIONS: DEFINITION AND SOURCES
Evaporative emissions from a vehicle can be defined, in a very generic way, as all the Volatile Organic Compounds (VOCs) emitted by the vehicle itself and not deriving from fuel combustion. For petrol vehicles most of evaporative emissions are due to a loss of hydrocarbons from the fuel system; more specifically the major contributions to evaporative emissions come from fuel evaporation from the tank and fuel permeation through fuel hoses, fuel tank, connectors, etc. VOC compounds may also come from materials used for vehicle construction like plastics, interior trim or from other system fluids (e.g. windshield detergent); these emissions are usually very low in modern cars and in any case do not depend on fuel quality. In the case of a modern carbon canister equipped vehicle in good general conditions, the main sources of fuel related evaporative emissions are [4]: Breathing losses Breathing losses are due to fuel vapours escaping from the tank through its vent. The fuel tank, by design, is vented to the atmosphere through a pressure relief valve, so that tank pressure is maintained slightly above atmospheric. In modern vehicles the tank is vented to atmosphere through an activated carbon canister which adsorbs and stores the hydrocarbons preventing emissions to atmosphere, as shown in Figure 1. Breathing losses and the impact of ethanol on them are discussed in details in chapter 3.3. Fuel permeation Hydrocarbons also escape the vehicle’s fuel system by permeation through the plastic and rubber components; e.g., hoses, seals, and in vehicles with a non-metallic tank, the fuel tank itself. Permeation does not occur through an identifiable opening; instead individual fuel molecules penetrate (i.e. they effectively mix with) the walls of the various components and eventually find their way to the outside. Fuel permeation is significant only for plastic or elastomeric materials. Fuel permeation and the effect of ethanol on are discussed in details in chapter 3.4. Running losses Running losses are those evaporative emissions that occur during normal driving of the vehicle and include both fuel permeation and any breathing loss from the carbon canister. In particular, the fuel return can increase significantly the temperature inside the tank and consequently the fuel evaporation rate. These emissions are not currently regulated in Europe while are the subject of a specific regulation in the USA. Most of the modern cars are return-less and this reduces the importance of the running losses. Refuelling emissions Another important source of evaporative emissions is the refuelling operation. These emissions depend mainly on the fuel vapour pressure and on the design of the nozzle of the fuel dispenser. They can be controlled in two main ways. One way is with the so-called “Stage II” vapour recovery system that recycles

emitted fuel vapours to the underground storage tank. The Directive 2009/126/EC requires the installation of Stage II vapour recovery systems in any European existing service station with a throughput > 3000 m3/year by no later than 31/12/2018 while any new and refurbished service stations have to be already equipped with Stage II systems. Member States shall bring into force the laws, regulations and administrative provisions necessary to comply with the Directive before 01 January 2012. The minimum efficiency of the Stage II system is required to be 85% and inspection and maintenance is considered a critical factor to achieve this value. The alternative is the use of an “On-board Refuelling Vapour Recovery System” (ORVR), which consists essentially in a fuel system with a specific design to convey the vapours displaced by the liquid fuel to a larger carbon canister located on the vent of the tank as usual. . ORVR systems are mandatory in US vehicles and for this reason the Stage II is no longer required in US service stations. One of the main reasons why in the USA it was decided to adopt the ORVR concept was the real world efficiency of Stage II recovery systems that turned out to be rather low (50-60%) mainly due poor maintenance. In any case the impact assessment conducted by US-EPA showed that ORVR is more cost-effective in reducing refuelling emissions than Stage II recovery systems [23]. This subject will be discussed into details in chapter 3.6. Other sources An unintended source of HC emissions may occur from leaks in the system. Leaks may occur in the vapour and/or the liquid system as a result of deterioration and/or faulty service techniques. Examples of deterioration are corrosion of metallic components (e.g., fuel lines, tanks), cracking of rubber hoses, hardening of seals, and mechanical failures. As an example, the Swedish in-use compliance programme identified a deteriorated fuel filler cap as one of the main reasons for failing the evaporative emission test. Current European legislation sets a limit for evaporative emissions of 2.0 grams/test and defines the procedure to measure them [2]. In order to comply with the relevant emission standard, modern vehicles rely on an evaporative emission control system consisting of an activated carbon canister, which adsorbs fuel vapours and prevents their release to the air.
Figure 3: Typical layout of an evaporative emission control system of European cars
C
Fuel to Injectors
Canister vent
Vapors to Canister Vapors to Engine
Fuel Pump
Fuel Tank
Fuel to InjectorsFuel to Injectors
Canister vent
Vapors to Canister Vapors to Engine
Fuel Pump
Fuel Tank
When the vehicle is parked and the engine is switched off, the carbon canister traps petrol vapours produced in the tank by petrol evaporation. When the vehicle is running, in certain operating conditions and under the control of the EMS (Engine Management System), part of the combustion air is drawn through the canister and into the engine; so that the activated carbon is purged and the fuel vapours burned in the engine. The amount of air drawn through the canister is managed by the Engine Management System (EMS) and controlled by means of a valve (purge valve) located on the line connecting the canister

with the air intake manifold. A typical layout of an evaporative emission control system is shown in Figure 3. In general, a carbon canister will trap hydrocarbons very efficiently, until it becomes saturated and canister breakthrough occurs. The “gasoline working capacity” (GWC) of a canister is defined as the amount of vapour it can absorb in normal use before breakthrough occurs. A standard “Butane Working Capacity” (BWC) is specified by ASTM D 2652 and used in the industry. In automotive application and especially for regulatory purposes, breakthrough is usually defined as the point when 2.0 grams of hydrocarbons have been emitted by the canister or when the total hydrocarbon concentration reaches 5000 ppm. When breakthrough is reached, the canister can no longer trap all hydrocarbons, so some will pass through the canister via a diffusion and convective based mechanism and be released into the air. Eventually the carbon will become saturated and can adsorb no more hydrocarbons. Usually there is a hydrocarbon concentration gradient within the carbon bed: higher concentration in the part closer to the tank, lower towards the vent of the canister. The adsorbed hydrocarbons, especially the lightest ones, tend to diffuse from the high concentration areas to the low concentration ones. In this way light hydrocarbons can reach the canister exit port and escape from it even if the canister is not saturated. These emissions are called “bleed emissions” [3] and mainly impact multi-day diurnal tests.

3.2. EFFECT OF ETHANOL ON PETROL VOLATILITY [9] [10]
One major concern with the use of ethanol as a petrol component is the alcohol’s effect on petrol front-end volatility as determined using the Reid vapour pressure (RVP) metric (DVPE in Europe legislation). It is well-known that the addition of ethanol to petrol at low ethanol concentrations (5 - 10%) results in an increase in RVP of approximately 1 psi. Higher RVP values mean that the fuel is more volatile or, in other words, the higher the RVP value, the more fuel will evaporate at a given temperature. Figure 1 shows a typical curve of RVP change in response to the addition of ethanol to petrol. As shown, due to the non-ideal behaviour of the ethanol petrol blend, RVP increases dramatically with the addition of any ethanol and then levels off at about 1 psi above the RVP of the base petrol at higher concentrations. The RVP is measured at 37.8 °C. Figure 4: Effect of ethanol on petrol vapour pressure
As a consequence of the effect above described, if a certain amount of ethanol is splash blended in a commercial petrol the RVP will increase above 60 kPa that is the maximum value during the summer period allowed by the European legislation in countries with a hot climate; on the other hand, in a refinery the volatility of a petrol/ethanol blend could be corrected to match the specification but it would require modifications to the lay-out of the refinery itself. The Directive 2009/30/EC [16] on fuel quality grants, upon request, a vapour pressure waiver for the petrol/ethanol blends in order to allow the direct blending of ethanol in petrol without corrections (splash blending).
3.3. EFFECT OF ETHANOL ON BREATHING LOSSES
Breathing losses are influenced by a number of factors [1] [5] [6], mainly fuel volatility, temperature and fuel system design in addition, of course, to the size and design of the canister. The most important fuel property affecting breathing losses is the vapour pressure which is measured according to the EN 13016-1 method. This method measures the Dry Vapour Pressure Equivalent (DVPE) of the older Reid Vapour Pressure (RVP) method. The difference between RVP and DVPE is the measuring method. DVPE is measured “dry” after removing all moisture from the test chamber prior to injection of the sample. This overcomes the unpredictability of results experienced when testing samples containing oxygenates by the conventional Reid method. The DVPE is measured at a temperature of 37.8° C. The CEN

standard EN 228:2004 sets out the petrol volatility classes applied in Europe. Class A (max. 60 kPa DVPE) is required by the EU fuels Directive during summer in Europe (1 May to 30 September). Class B (max. 70 kPa DVPE) is required for countries “with arctic conditions” from 1 June to 31 August. In general, the higher the fuel volatility the higher the evaporative emissions are. However the relationship between the volatility of the fuel and evaporative emissions is not linear, as canister breakthrough can occur when it becomes saturated. In this condition the canister is not able to trap petrol vapours any more and therefore they are released in air in an uncontrolled way. As an example, calculated evaporative emissions as a function of RVP [9] are shown in Fig. 3. Fig. 3: Calculated evaporative emissions as a function of RVP (MVEI7G and EMFAC2000 models) [9]
The European legislative procedure for certification purposes requires the use of petrol having a DVPE of 60 kPa maximum and as a consequence, the evaporative emission control systems are designed to meet the legislative standard with petrol having this vapour pressure. As shown in chapter 3.2, ethanol added to petrol at low levels (5-10%) increases the volatility of the fuel which may affect evaporative emissions to certain extent. In fact a 60 kPa summer grade petrol can reach a DVPE of 66-68 kPa when splash blended with 5-10% volume of ethanol (splash blending is allowed by the Directive 2009/30/EC which grants, upon request, a vapour pressure waiver for petrol containing up to 10% ethanol). This issue has been investigated by a large study jointly conducted by JRC, EUCAR and CONCAWE (see chapter 5.1). This experimental work has shown that the effect of vapour pressure on evaporative emissions measured according to the regulatory procedure is strongly non-linear, as expected for a process in which a vapour breakthrough effect may occur. The ethanol blends with final DVPE around 75 kPa gave considerably higher evaporative emissions than the other lower volatility fuels in most of the vehicles. Differences between fuels with DVPE in the range 60-70 kPa were small. However, as it will be discussed in chapter 3.7, the fact that petrol containing 5-10% ethanol with a vapour pressure in the range of 60-70 kPa does not increase significantly evaporative emissions in the legislative test, does not necessarily imply that the same happens in real world conditions. For example, the higher vapour pressure may lead to a faster saturation of the canister if the vehicle is parked for more than one day. Moreover, the same programme has shown that when ethanol is present in the fuel the canister is purged less efficiently. This suggests an increase of evaporative emissions in real world especially in case of short trips. In fact residual HC concentration in the canister after purging has a certain influence as well. Canister breakthrough will occur more easily when the residual HC concentration increases, because this reduces the working capacity of the canister. Polar molecules like ethanol (or water) or heavier hydrocarbons are usually harder to purge from the carbon. It has been shown that activated carbon affinity for ethanol vapours is greater than for olefins and aliphatic hydrocarbons [7]. Therefore it is possible that ethanol’s propensity to be tightly held by activated carbon [8], in conjunction with its hygroscopic nature may decrease the working capacity of the canisters used to control evaporative emissions and result in increased diurnal emissions. For these reasons, in the USA a revised vehicle certification procedure

including also the use of ethanol-containing petrol has been adopted. The effect of ethanol on the canister working capacity is considered the most likely explanation for the high failure rate (about 30%) in the evaporative emission test that has been observed in the in-use compliance programmes carried out in Sweden on passenger cars. Breathing losses depend also on the fuel temperature inside the tank. The following plot [4] shows the HC concentration in the vented vapour space above liquid petrol as a function of the temperature. For example, if temperature is increased from 70 °F to 95 °F (approximately from 20 to 35 °C), the HC concentration will increase from 20 to 50% due to evaporation. This leads to an increase of pressure and therefore some vapour must be expelled.
Temperature in the tank obviously depends on the ambient temperature but can vary significantly during vehicle operation as well. If the engine has a fuel return, part of the fuel supplied to the engine by the fuel pump is returned to the tank and can be significantly hotter than the fuel in the tank, so tank temperature can increase substantially. However most modern vehicles no longer use fuel return lines. Also the position of the tank may have some influence as its temperature can be affected by the proximity of the exhaust tailpipe. When the vehicle is parked the temperature of fuel in the tank can be either lower or higher than ambient temperature. The temperature profile over time of fuel in the tank is different from the profile of ambient temperature and this is due to the fuel thermal inertia. In particular, the fuel temperature profile is time shifted compared to the ambient temperature profile and both the maximum and the minimum temperature will be reached later compared to ambient. Furthermore, the range from minimum to maximum temperature in the tank is narrower (about 87% of the range of ambient temperature variation) [1]; in particular, maximum temperature in the tank is somewhat lower than ambient maximum temperature. Some other factors are related to the correct functioning of the evaporative emission control system: The capacity and condition of the carbon canister, the quality and condition of activated carbon, the condition of lines, connectors, the canister purging strategy and the correct functioning of the purge valve, the presence of a leak, etc.
3.4. EFFECT OF ETHANOL ON FUEL PERMEATION
Hydrocarbons also escape the vehicle’s fuel system by permeation through the plastic and rubber components; e.g., hoses, seals, and in vehicles with a non-metallic tank, the fuel tank itself. Permeation does not occur through an identifiable opening; instead individual fuel molecules penetrate (i.e. they effectively mix with) the walls of the various components and eventually find their way to the outside. Fuel permeation is significant only for plastic or elastomeric materials. Fuel permeation rate depends on the material used for the fuel system and on the chemical species contained in the petrol; in particular, alcohols like methanol and ethanol can increase significantly the

permeation rate. Ethanol is believed to lead to an increase of the permeation due to the tendency of ethanol to evaporate more readily than other fuel components and to the smaller size of the ethanol molecule. A study on fuel permeation [18] has been performed using tanks with an ethylene vinyl alcohol (EVOH) layer used to reduce permeation. It has been demonstrated that methanol contained in the fuel has a two-fold effect: It “opens” the way through the EVOH barrier layer for the hydrocarbon components (that in absence of methanol would permeate only in minimal amounts) and represents a large part of the evaporative emissions due to fuel permeation. The effect of ethanol is expected to be much less severe as diffusion of ethanol through the EVOH layer is orders of magnitude slower than methanol. Another study co-sponsored by the California Air Resources Board (CARB) and Georgia-based Coordinating Research Council [4] has been recently carried out with the objective of investigating the effect of petrol/ethanol blends on permeation. The study, found that a 5.7%-by-volume ethanol blend, which is the standard in California, increases permeation emissions by 65% compared to MTBE-blended RFG and 45% over non-oxygenated fuels, on average. "Emissions increased on all 10 vehicle fuel systems studied when ethanol replaced the MTBE in the test petrol," the study concludes. The average permeation emissions increase with ethanol petrol was 1.4 grams/day (g/d) higher than emissions with the MTBE petrol, and 1.1 g/d higher than emissions with non-oxygenated petrol. More details about the findings and the conclusions of the study are provided below:
Conclusions, Findings and Recommendations
Conclusions - Based on the results of this study, and subject to all the limitations of the project plan and scope, the following can be concluded:
1. Petrol containing ethanol at a level of 2.0 weight percent oxygen increased the permeation of the tested California vehicle systems, compared to petrol with MTBE as the oxygenate at the same oxygen content, or a similar petrol made without any oxygenate; these changes in emissions were statistically significant at the 95% level for the diurnal data. The non-oxygenated fuel did not produce a statistically significant change in permeation relative to the MTBE fuel. 2. Non-ethanol hydrocarbon permeation emissions generally increased when the ethanol containing fuel was tested. 3. The average specific reactivities of the permeate from the three test fuels were similar. The specific reactivities of the permeate of the MTBE and ethanol fuels (Fuels A and B) were not statistically different on average. The non-oxygenated fuel (Fuel C) permeate was higher than the other two with a statistically significant difference. 4. Permeation rates measured at different temperatures followed the relationship predicted in the literature, nominally doubling for a 10º C rise in temperature. 5. A consistent relationship between the 105ºF steady-state permeation rate and the variable temperature 24-hour diurnal permeation rate was observed on all three fuels. 6. Vehicles certified to the newer “enhanced” evaporative emission standards (phased in from the 1996 to 1998 model years) had lower permeation emissions, including those with non-metallic fuel tanks. 7. The non-metallic fuel tank systems of the early 1990s (Rigs 5 and 6) exhibited relatively high permeation emissions on all test fuels compared to the other systems tested. 8. Permeation rates from the two newest non-metallic fuel tank systems exhibited a sensitivity to fill level. The emissions were lower when there was less fuel in the tank. 9. Permeation emissions (105ºF steady-state) generally approached a stabilized level within 1 to 2 weeks when switching from one fuel to another. Findings -

10. The average increase of the diurnal permeation emissions was 1.40 g/day for the ethanol fuel compared to the MTBE fuel (Fuel B compared to Fuel A). The individual rig increases ranged from 0.34 to 2.71 g/day. 11. The average increase of the diurnal permeation emissions was 1.10 g/day for the ethanol fuel compared to the non-oxygenated fuel (Fuel B compared to Fuel C). The individual rig increases ranged from –0.15 to 2.90 g/day. 12. The average specific reactivities (MIR – g Potential Ozone/g VOC) of the permeate emissions from the three fuels, and the 95% multiple comparison limits about those averages were found to be (Page 49): MTBE Fuel 3.47 ± 0.107 Ethanol Fuel 3.27 ± 0.102 Non-Oxygenated Fuel 3.66 ± 0.075 13. The average 105ºF steady-state permeation rates ranged from 9.4 to 801 milligrams per hour (mg/hour) on the ten rigs and the three tested fuels. 14. The ratios between the 85 and 105ºF permeation rates, on average, were (Page 54): MTBE Fuel 0.42 Ethanol Fuel 0.46 Non-Oxygenated Fuel 0.46
Recommendations – It is recommended that this study be expanded to assess the newer California LEV II compliant vehicles. The data and understandings collected during this test program are limited to the in-use fleet vehicles that existed at the time this study was initiated. It is also recommended that a similar study be done on E10 fuel. While the data were collected at ethanol levels currently used in California (5.7%), ethanol is commonly used at 10% in other parts of the country. As follow-up of this work, the CRC began a new testing programme to investigate the influence on permeation rate of several factors and in particular of the ethanol content in the petrol [21]. Based on the previous work, four issues were identified for further study in CRC Project E-65-3:
1. Investigate the permeation characteristics of “near zero” evaporative emission control systems scheduled for
California in MY 2004 and later.
2. Determine if changes in ethanol content affect permeation levels.
3. Establish the permeation effects of E85 (85 Volume% ethanol fuel) in a flexible fuel vehicle.
4. Determine if permeation rates are sensitive to changes in aromatics content of the fuel. Six test fuels were blended for this project:
1. E0 – Non-oxygenated base fuel 2. E6 – 5.7 Volume% ethanol fuel (2 Weight% oxygen) 3. E6Hi – 5.7 Volume % ethanol fuel with increased aromatics content 4. E10 – 10 Volume% ethanol fuel 5. E20 – 20 Volume% ethanol fuel, and 6. E85 – 85 Volume% ethanol fuel
The testing for this project commenced in January of 2005, and continued through early August 2006. The main conclusions are:
1. The low-level ethanol blends (E6, E6Hi, E10 and E20) increased permeation in all the vehicle systems and technologies tested, compared to the non-ethanol fuel (E0). These increases were statistically significant. 2. The advanced technology LEV II and PZEV1 systems (2004 MY) had much lower permeation emissions than the MY 2000-2001 enhanced evaporative systems. The zero evaporative emissions system (PZEV) had the smallest increase due to ethanol of all the vehicles tested. 3. The high-level ethanol blend (E85) tested in the flexible fuel vehicle system had lower permeation emissions than the non-ethanol (E0) fuel. 4. Diurnal permeation rates do not appear to increase between E6 and E10, but do appear to increase between E6 and E20; however, this increase is not statistically significant.

5. The highest diurnal permeation rate for three of the five rigs (1, 2, and 12) tested was measured when these rigs were tested on the E20 fuel. The highest diurnal permeation rate for Rig 11 was recorded on the E6 fuel, while the highest diurnal permeation rate for Rig 14 was measured on the E10 fuel. 6. Diurnal permeation emissions were lower on all four rigs tested with the higher-level aromatics fuel (E6Hi) versus the lower aromatics fuel (E6); however, this decrease was not statistically significant. 7. Permeation rates with the E0 fuel at the start and the end of the test program were not significantly different on all five rigs, indicating that there was no shift in the permeation performance during the program. 8. The average specific reactivities of the permeates from the low-level ethanol blends were significantly lower than those measured with the non-ethanol fuel (E0). There was no significant difference in the average specific reactivities within the low-level ethanol blends.
3.5. COMMINGLING EFFECT [9]
Even if all petrol, including ethanol-petrol blends, had to comply with the same DVPE specification, the marketing of ethanol-blends in areas where non-ethanol blends are also being sold would lead to a general increase in the DVPE of petrol used in that area. This increase in DVPE is the consequence of what is referred to as the “commingling effect” that results from the mixing of ethanol-containing and non-ethanol-containing petrol in vehicle fuel tanks.
As an illustration of the commingling effect, consider a motorist who brings his car to a service station for refuelling when the tank is half full. If one assumes that the original fuel in the tank contains a 10% ethanol-blend at a given DVPE and that the fuel added to the tank at the station is a non-ethanol blend of the same DVPE, the overall effect will be to turn the non-ethanol petrol into a 5% ethanol blend by volume. Referring back to Figure 1, this will cause the DVPE of the non-oxygenated petrol to increase by about 1 psi; since that petrol represents 50% of the fuel in the tank, the average DVPE of all the fuel will increase by about half that amount, or about 0.5 psi.. The increase of the DVPE of the petrol could lead, as discussed above, to an increase of the evaporative emissions even if the DVPE of all the petrol meet the specifications. Of course the impact of the commingling effect on evaporative emission depends on a number of factors: Spatial distribution of the petrol/ethanol blends The market shares of ethanol- and non-ethanol-containing petrol. The ethanol content of the petrol/ethanol blend The amount of petrol remaining in the tank at the moment of the refuelling The DVPE levels of the petrol.
3.6. EFFECT OF ETHANOL ON REFUELLING EMISSIONS
There are currently two main technologies to control petrol refuelling emissions: 1. Dispenser based: Stage II vapour recovery systems 2. Vehicle based: On-board Refuelling Vapour Recovery (ORVR) Stage II vapour recovery systems consist of a nozzle with a specific design in order to collect vapours from the tank and a vacuum pump connected to the nozzle by means of a coaxial hose.

In the tank, liquid petrol is in equilibrium with a certain amount of evaporated petrol vapours present in the ullage space. The amount of the petrol vapours in equilibrium with the liquid depends on the temperature and on the vapour pressure of the petrol contained in the tank. During refuelling, the liquid dispensed into the tank displaces the vapours contained in the ullage space which, in absence of control systems, are released into the atmosphere through the filler pipe. When a Stage II system is present, the vapours displaced by entering liquid are collected by the nozzle and pumped into the underground storage tank (see Figure 5). Figure 5: Typical layout of a Stage II system
Interface
Tank Underground storage tank
Vapour
Liquid
Vapour
Liquid
Vacuum pump
Stage II Nozzle
Interface
Tank Underground storage tank
Vapour
Liquid
Vapour
Liquid
Vacuum pump
Stage II Nozzle
The effectiveness of the Stage II systems in controlling refuelling emissions depends on several factors of which some are linked to the system itself like the proper functioning of the pump and the integrity of the components. In addition there are external factors completely out of control of the system like the temperature and the composition of the fuel in the tank. This means that even in case of a perfectly operating system, it may happen that some vapours are released into the atmosphere either at the tank/nozzle interface or from the underground storage tank vent. In fact there are two important parameters affecting the efficiency of the Stage II vapour recovery system:
The ratio of the volume of air and vapours that vents from the tank to the volume of liquid dispensed into the tank (hereinafter V/L). This ratio equals 1.0 only in case of ideal conditions and specifically when the temperature and the DVPE of the petrol in the vehicle’s tank is the same of the petrol in the underground storage tank.
The ratio of the vapour pumped to the underground storage tank and the petrol dispensed (hereinafter A/L). This ratio is set by the operator (typically to values close to 1.0).
In ideal conditions, V/L and A/L are identical and the volume of vapours pumped to the underground storage tank perfectly matches the volume of vapours displaced by the liquid dispensed into the vehicle’s tank. In this case the efficiency of such system is very close to 100% (provided that the system is fully efficient in all its components). However, if V/L differs from A/L, the volume of vapours pumped to the underground storage tank can be either smaller or larger than the volume of vapours displaced from the vehicle’s tank. For example, if A/L is set to one and V/L is equal to 1.1, the volume of vapours pumped to the storage tank is lower than the volume displaced from the vehicle’s tank. This means that part of the vapours displaced from the tank are released into the atmosphere at the interface between the nozzle and the filler line of the tank since the seal efficiency at the interface cannot be 100%. On the contrary, if A/L is higher than V/L (e.g 1.0 vs. 0.9), the volume of vapours pumped to the storage tank is larger than the volume displaced from the tank and air is ingested in the vapour recovery line at the interface between nozzle and filler line. In all these case the efficiency of a Stage II system is well below 100%.

There are several factors causing variability in the V/L ratio which can be either below or above 1:
- Fuel temperatures: V/L is different from 1 if the temperature of the petrol dispensed into the vehicle’s tank is higher or lower than the temperature of the petrol already present in the tank. For example, if the temperature in the vehicle’s tank is higher than the petrol dispensed, V/L will be lower than 1 since the petrol entering into the tank will cool down the vapours reducing their volume.
- Vapour pressures of the fuels - Ethanol can significantly affect the efficiency of the Stage II systems especially if not all the petrol
available on the market contain ethanol. For example, if a blend of 5% ethanol is added to a pure hydrocarbon fuel V/L will be above 1. Also in case of flexible fuel vehicles V/L may be very different from 1. In fact the quality of petrol in the tank of a FFV may vary from E0 to E85 with very different possible vapour pressure. For this reason a Stage II system is not suitable for FFV that will need ORVR systems or dedicated vapour recovery systems.
In addition to the issues related to fuel quality and conditions, Stage II systems may operate inefficiently for a number of reasons:
- The interface between the vehicle and the vapour recovery boot of the refuelling nozzle is typically poorly sealed. Moreover, torn nozzle boots (quite common situation) can cause ingestion of clean air.
- Piping and storage tank fittings may be not vapour-tight. - Stage II systems can easily lose calibration (A/L settings drift and affect vapour collection
effectiveness). This can be corrected by specialized technicians who calibrate the system typically once per year.
As a consequence, Stage II systems typically provide only 55-90% recovery efficiency due to the inability to match the A/L ratio with V/L ratio and to poor maintenance. In the USA, for all the above described reasons, there was growing concern about the effectiveness of Stage II system in controlling refuelling emissions and this eventually led to the adoption of a vehicle-based control policy. US-EPA decided to introduce On-board Refuelling Vapour Recovery systems convinced that these would be more effective and less costly than Stage II. ORVR was finally introduced in 1998 with phase-in over several years. ORVR system works on the principle of forcing all vapours displaced by the dispensed liquid through the vehicle’s carbon canister. In this case the recovery efficiency is independent of the V/L ratio. Basically, the most important modifications needed to convert a standard evaporative emission control system in an ORVR are the following (see also Figure 6):
A larger canister and a different carbon type. The larger canister is needed to adsorb the vapours displaced by the liquid dispensed into the tank. The pressure drop of the canister has to be minimized and in any case has to be less than seal head in the filler pipe. Typically, a pelletized carbon type is adopted to achieve this.
A reduced diameter filler pipe. The reduced diameter will create a petrol liquid seal preventing tank vapours from escaping through filler nozzle.
A specific design of the lines connecting the tank to the canister and to the filler pipe in order to achieve the proper pressure drops to force the vapours through the canister.

Figure 6: Typical layout of an ORVR system (in red the modifications to convert a normal evap control system in ORVR)
Reduced diameter of filler pipe in order to create petrol liquid seal
Displaced air and vapours from tank to carbon canister
Vapour seal component added
Larger ORVR canister 16 mm Tube
3 mm Tube
Low pressure drop valve
Purge line to engine
Tank vent
The additional cost to convert a standard system in an ORVR is estimated in about 25 Euros/vehicle (on average). The break down of the additional cost is given in the following table (Table 3): Table 3 – Required modifications for ORVR and incremental cost Item Required modifications Incremental cost Fuel tank None -
Fill pipe Decreased diameter to 25 mm
€ 1.15 - 2.30 savings
Anti-spitback/Vapour seal valve
Modify existing with spring to form liquid seal
€ 2.30 – 3.50
Overflow/ Surge protection valve
Modify to permit high flow with little pressure drop
€ 2.30 – 4
Tank vent hose Increase diameter from 7 mm
€ 2.30 – 3
Carbon canister
Increase volume 2-3 times current, add mounting bracket, locate near fuel tank
€ 11.50 – 20
Min – max: € 16.1 – 29 Surveillance program and ORVR testing of in-use vehicles confirm reliability and durability of such system. US-EPA recognizes ORVR as 98% effective. Beyond the concerns about the Stage II effectiveness in controlling refuelling emissions, in Europe the cost per vehicle of the Stage II system implementation would be much higher than in the US due to the larger market share of diesel vehicles. This reduces the cost-effectiveness of this measure compared to the US situation where only gasoline passenger cars are currently on the market (with very few exceptions). However, the Directive 2009/126/EC requires the installation of Stage II vapour recovery systems in any European existing service station with a throughput > 3000 m3/year by no later than 31/12/2018 while any new and refurbished service stations have to be already equipped with Stage II systems. Member States shall bring into force the laws, regulations and administrative provisions necessary to comply with the Directive before 01 January 2012. The minimum efficiency of the Stage II system is required to be 85% and inspection and maintenance is considered a critical factor to achieve this value.

As usual the decision to implement the Stage II systems in Europe was preceded by an impact assessment {COM(2008) 812 final}. In this impact assessment the ORVR system was an option discarded at an early stage for the following main reasons:
European cars should be re-designed in order to accommodate the ORVR system. Concerns about small cars.
Timescale:15-20 years before the full benefit of ORVR is delivered Concerns about the cost-effectiveness of ORVR (a UK study dated back to 1994 showed a 35%
worse cost-effectiveness for ORVR compared to Stage II) However no detailed analysis of technical feasibility, performance and costs of the ORVR was undertaken for this impact assessment. Any cost/benefit analysis of a possible adoption of ORVR in Europe should take into consideration the current legislative context and the level of implementation of Stage II systems. Currently in Europe the majority of the petrol is already dispensed by service stations equipped with Stage II systems. According to data provided by CONCAWE, excluding France and the UK that did not supply data but were certainly implementing Stage II systems at the time, the percentage of service stations in the EU15 having already implemented Stage II in 2006 was about 67%, representing about 60% of total dispensed petrol. Including the UK and France stations would be expected to increase the percentage to about 75%. Being on the conservative side, it can be estimated that currently in the EU15 at least 65-75% of total service stations are equipped with Stage II recovery systems covering 60-70% of total petrol dispensed. Limited data is available for the other Member States (100% in Hungary, 54% in Czech Republic. No data for other States.). At least two different options should be evaluated in a cost benefit/analysis:
Introduction of ORVR and Stage II discontinuation Introduction of ORVR and Stage II retention
There is a potential incompatibility between Stage II systems and ORVR that has to be taken into account when evaluating the second option. In general, the efficiency of some Stage II system models is somewhat reduced when filling the tank of a vehicle equipped with ORVR. The issue of excess emissions from the underground storage due to the incompatibility between ORVR and Stage II systems has been already addressed by several studies conducted in the USA [24].
3.7. FACTORS AFFECTING REAL-WORLD EVAPORATIVE EMISSIONS
Like in the case of exhaust emissions, there may be an important difference between the evaporative emissions measured in the laboratory according to legislative procedure and the real world evaporative emissions. In fact there are several factors influencing evaporative emissions of which the main are summarized here below:
Fuel volatility and composition Canister working capacity Carbon quality and ageing Purging Strategy and vehicle use (e.g. time parked, speed/load when running, re-fuelling) Fuel System Design and Materials (e.g. plastic or metal tank) Ambient Conditions (T°, Humidity)
Fuel volatility and composition As seen before, volatility of the fuel is a key parameter for evaporative emissions since it determines the amount of vapours generated at a given temperature. The reference fuel prescribed by the current European legislation for the evaporative emission test must have a maximum DVPE of 60 kPa and therefore the systems to control evaporative emissions are designed to cope with such fuel volatility. The

large experimental programme carried out by the JRC jointly with EUCAR and CONCAWE has shown that European modern cars are in general able to comply with the evaporative emission limit of 2.0 g/test even if fuels with a higher DVPE than 60 kPa are used in the legislative test. The study showed clearly that, thanks to the engineering margin, the evaporative emission control systems can handle quite easily fuels having a DVPE up to 70 kPa in the legislative test. Only above this DVPE value clear increases of evaporative emissions were measured. Nevertheless, a fuel with a higher DVPE than the reference fuel will generate more vapours and therefore result in higher evaporative emissions in conditions not covered by the European legislative test like for example more than one day parking of the car or very short trips resulting in limited purging of the canister. In addition, the presence of ethanol in the fuel may have a major influence on evaporative emissions by increasing both the fuel volatility and the fuel permeation rate through plastic materials. The effect of ethanol may be hugely reduced by adopting appropriate countermeasures in new vehicles but on existing vehicles evaporative emissions are very likely to increase significantly especially because of the increased fuel permeation rate. The Euro 5/6 Regulation [14] has now introduced new reference fuels for the type approval tests; the reference petrol must contain 5% ethanol but this is not sufficient to ensure that the new vehicles are able to cope with this fuel component as far as evaporative emissions are concerned. In fact fuel permeation increase due to ethanol is not an instantaneous effect; permeation emissions generally approach a stabilized level within 1 to 2 weeks when switching from one fuel to another as shown by the CRC study [4]. This means that if the ethanol containing fuel is pumped into the tank only at the moment of the evaporative emission test, the effect on permeation may be so small that there is no significant influence on the test result. At least a provision to ensure an adequate conditioning of the fuel system with the ethanol containing fuel should be introduced in the evaporative emission test procedure. As already explained above, the increase of fuel volatility due to ethanol may not result in increased evaporative emissions when measured according to the legislative procedure thanks to the engineering margin of the emission control system. However this may be not the case in the long term due to the polar nature of ethanol. As already discussed in chapter 3.3, polar molecules like ethanol (or water) or heavier hydrocarbons are usually harder to purge from the carbon. Therefore it is possible that ethanol’s propensity to be tightly held by activated carbon, in conjunction with its hygroscopic nature may decrease in the long term the working capacity of the canisters used to control evaporative emissions and result in increased diurnal emissions. This effect seems to be confirmed by an experimental programme jointly conducted by the Swedish Road Administration and TÜV NORD [15]. In this programme two similar vehicles were exposed to different fuel qualities. One of the vehicles used a 5% ethanol/petrol blend while the second vehicle used fuel without ethanol. The working capacity of the canister was measured every 500 km. On the vehicle run with E5 a considerable deterioration of the canister capacity could be detected. Canister working capacity The size of the carbon canister and more specifically the amount of the activated carbon in the carbon canister determines the working capacity or, in other words, the volume of gas that can be adsorbed by the carbon. Obviously, the larger the carbon canister, the larger the volume of the gas/vapours that can be trapped by the canister. As a matter of fact, the actual volume of the canister is determined by the amount of vapours generated during the evaporative emission legislative test. In the European legislative test procedure the diurnal test lasts 24 hours and vapours are generated only during the first 12 hours corresponding to the heating phase of the test. During this phase the temperature increases from 20 to 35 °C and consequently the pressure inside the tank tend to increase and the vapours escape through the tank vent. Only during this phase breathing losses through the canister may occur. After the first 12 hours the temperature in the SHED starts decreasing and therefore also the pressure inside the tank decreases. As soon as the pressure in the tank starts decreasing, air starts flowing into the tank through the carbon canister vent and so no further evaporative emissions can occur. Longer diurnal tests like the two-day or three-day diurnal tests prescribed by the US legislation means that much larger vapour volumes are generated and therefore larger canister are required to comply with the emission standards. In the real world a larger canister reduces the possibility of high evaporative emissions due to canister saturation caused by a not sufficient canister purging in case of short trips or by a prolonged parking. The canister working capacity may be reduced by the presence of ethanol in the fuel as described above.

Carbon quality Activated carbon quality may play a very important role on the short and long term efficiency of the carbon canister used to control evaporative emissions. The size distribution of the pores and more specifically the ratio between micropores, mesopores and macropores is one of the main parameter affecting the activate carbon performances in terms of adsorption efficiency and its behaviour on the long term. Activated carbons with a high number of micropores compared to meso and macropores can mean a higher efficiency in terms of adsorption capacity but a worse durability in the long term. A right compromise between the adsorption efficiency and the long term durability is needed for automotive applications. Ethanol, as already explained, may reduce the working capacity of the canister over time and therefore the carbon quality becomes more important compared to a situation in which pure hydrocarbon petrol is used. Purging strategy and driving patterns The carbon canister can efficiently trap the vapours generated by the evaporation of the petrol contained in the tank until the activated carbon gets saturated. In order to restore the capability of the carbon canister of trapping the hydrocarbon vapours, it has to be purged. When the vehicle is running, in certain operating conditions and under the control of the EMS (Engine Management System), part of the combustion air is drawn through the canister and into the engine; so that the activated carbon is purged and the fuel vapours burned in the engine. The amount of air drawn through the canister is managed by the Engine Management System (EMS) and controlled by means of a valve (purge valve) located on the line connecting the canister with the air intake manifold. A correct purging strategy is important to ensure a good efficiency of the evaporative emission control system in all the most common driving conditions but it is important also for other aspects like driveability and exhaust emissions. For example, if after a long parking period the canister is saturated, as soon as the purge valve is opened a lot of hydrocarbons will reach the intake manifold through the canister purging line. This may result in a richer mixture (lambda<1) and consequently a reduced efficiency of the three way catalyst in oxidizing HC and CO. If this occurs during a cold start exhaust HC and CO emissions may exceed the relevant emission limit. For this reason, the US legislative test procedure for evaporative emissions requires exhaust emissions to be measured during the conditioning drive. As a consequence the purging strategy has to be carefully optimized taking into account the need of quickly purging the canister and avoiding negative impacts on driveability and exhaust emissions. However, data generated at the JRC shows that in many cases the purging rates over the urban part of the legislative driving cycle (NEDC) are very low. This will not affect negatively exhaust emissions during cold start but the canister will not be purged efficiently in these driving conditions. From the above considerations it is clear that the most critical driving pattern for real world evaporative emissions is when the vehicle is driven for very short distances at low speeds and then left parked for a few hours as can very easily happen in city driving. In this case the canister might be purged only for short periods with very low purging flow rates and therefore for most of the time the carbon canister will be very close to the saturation condition. Tank and fuel line material As explained in the previous chapters, fuel permeation represents a major source of evaporative emissions. Obviously the permeation rate strictly depends on the material used for the tank and the fuel lines. In case of petrol/ethanol blends, standard high density poly-ethylene (HDPE) tanks show too high permeation rates. For this reason in the US where there is a specific requirement of the permeation rate of the material used for the tank, vehicles are typically equipped with multilayer tanks that consist in HDPE tanks incorporating a film of ethylene-vinyl alcohol (EVOH) as one of the layers. Metal tanks appear to be those with the lowest permeation rate. In Europe about 35% of the vehicles currently sold every year are still equipped with monolayer tanks. Durability According to the European legislation the evaporative emission control systems have to maintain their efficiency for a given number of kilometres (80000 until Euro 4, 160000 from Euro 5 on). There are several factors that can reduce the efficiency of evaporative emission control systems in the long term. It is clear

that a leakage in the fuel system due for example to a worn seal may result in very high evaporative emissions. Also the malfunctioning or a blocked purge valve will lead to high evaporative emissions since the canister is not regularly purged. Obviously, in case of a vehicle exceeding the evaporative emission standard because of a system not complying with the durability requirement, the actual evaporative emissions from this vehicle will be much higher than expected. The in-use compliance programme conducted by the Swedish Road Administration has clearly shown that a large portion of vehicles circulating on the road may have too high evaporative emissions due to a reduced durability of the control system. In this case the most likely reason is the reduced working capacity due to the use of ethanol blended with petrol. On Board Diagnostics required by the US legislation monitors proper functioning of evaporative emission control systems by checking the system for leaks and blocked lines but does not check the efficiency of the canister. Ambient temperature It is clear that the higher the ambient temperature the higher the amount of the vapour generated inside the tank. The temperature profile of the diurnal test prescribed by the European legislation ranges between 22 and 35 °C. In the US three-day diurnal test the temperature varies between 22 and 35.6 °C. The stricter legislation of California picked worst case increasing the highest temperature in the three-day diurnal test to 40.6 °C.

4. CURRENT EUROPEAN LEGISLATION ON EVAPORATIVE EMISSIONS
Both the limit and the detailed measurement procedure for evaporative emissions are laid down in the Directive of the European Parliament and the Council no. 98/69/EC [2]. The evaporative emission test (Type IV) is designed to determine hydrocarbon evaporative emissions as a consequence of diurnal temperatures fluctuation and hot soaks during parking after urban driving. Hot soak emissions are usually attributed to the evaporation of the petrol in the fuel system immediately after the vehicle is shut off; diurnal emissions are instead the evaporative emissions occurring from a vehicle while it is not being operated. The test consists of the following phases (see also):
Test preparation (canister and vehicle conditioning) Hot soak loss determination (Hot Soak test). Diurnal loss determination (Diurnal test).
Evaporative emissions are measured using a gas-tight chamber (VT SHED) able to contain the vehicle under test. The VOC concentration inside the chamber is monitored by means of a FID analyzer. The mass emissions of hydrocarbons from the hot soak and the diurnal loss phases are added up to provide an overall result for the test. Before starting the measurement of the evaporative emissions, both the vehicle and carbon canister have to be properly prepared according to a specific conditioning procedure prescribed by the legislative procedure. The carbon canister has to be loaded to the breakthrough, a condition defined by the same legislative procedure. Breakthrough definition is closely connected to the loading procedure and is defined as the point when 2.0 grams of hydrocarbons have been emitted by the canister or when the total hydrocarbon concentration in the gas exiting from the canister vent reaches 5000 ppm. According to the legislation, canister load to breakthrough may be accomplished using normal fuel by means of repeated heat builds or using butane. For example, if the second option is chosen, the canister has to be loaded with a mixture composed of 50 % butane and 50 % nitrogen by volume at a rate of 40 grams butane per hour. Breakthrough can be determined using an auxiliary carbon canister connected downstream of the vehicle’s canister. In the legislative procedure the breakthrough is defined as the point corresponding to an increase of 2.0 grams of the auxiliary canister. Alternatively an FID analyzer to detect the 5000 ppm HC concentration can be used. As soon as the canister reaches the breakthrough, the nitrogen and butane lines are immediately shut off. The evaporative emission canister has then to be reconnected to the fuel system of the vehicle. As far as the vehicle is concerned, the following conditioning steps have to be carried out: Fuel drain and refill The tank of the vehicle has to be emptied taking care not to abnormally purge or abnormally load the evaporative control canister fitted to the tank. Removal of the fuel cap is normally sufficient to achieve this. After the butane loading of the canister and after it had been reconnected to the fuel system, the tank is refilled with test fuel at a temperature of about 287 °K (14 °C) to 40 ± 2 % of the tank’s normal volumetric capacity. The fuel cap of the vehicle should be fitted again at this point. Preconditioning drive Within one hour from the completing of canister loading the vehicle has to be placed on the chassis dynamometer and driven through one Part One and two Part Two driving cycles of Type I test (NEDC cycle). Exhaust emissions measurement is not requested during this operation.

Soaking (before Hot Soak test) Within five minutes of completing the preconditioning drive, the vehicle has to be driven off the chassis dynamometer and parked in the soak area. The vehicle has to be left parked in the soak area at a temperature between 20-30 °C for a minimum of 12 hours and a maximum of 36 hours (during this time the vehicle can be only pushed, not driven). Conditioning drive After conclusion of the soak period the vehicle has to be driven through a complete Type I test drive (cold start urban and extra urban test). Within two minutes of completing the Type I test, the vehicle has to be driven a further conditioning drive consisting of one urban test cycle (hot start) of a Type I test. Then the engine is shut off at the end of this conditioning drive. The Hot Soak test simulates the condition of a vehicle parked after having been driven for a certain distance. At the end of the conditioning drive (one NEDC driving cycle + one urban driving cycle) and within seven minutes the vehicle is pushed into the measuring chamber. The engine must be turned off before any part of the vehicle enters the measuring chamber. The test lasts 60 minutes and the temperature must not be less than 296 °K (23 C) and more than 304 °K (31 C) during the 60-minute hot soak period. The Diurnal test lasts instead 24 hours and simulates the situation of a vehicle parked for one full day (24 hours) in the summer period; the temperature in the VT SHED is varied according to a profile defined by the Directive to ideally reflect the fluctuations occurring during day and night time. The starting temperature is 20 C while the maximum value is 35 C, reached after 12 hours. Then, during the subsequent 12 hours the temperature decreases slowly and goes back to 20 C again (see Figure 7). The final result of the test is given by the sum of the emissions measured during the Hot Soak and the Diurnal tests. The European limit for evaporative emissions (Hot Soak + Diurnal) is currently 2 grams/test (Directive 70/220/EC and subsequent amendments). Figure 7: Temperature profile of the Diurnal test
DIURNAL TEST
TEMPERATURE PROFILE
0
5
10
15
20
25
30
35
40
0 200 400 600 800 1000 1200 1400
TIME (Minutes)
TE
MP
ER
AT
UR
E (
0C
)

Figure 8: Standard EU Evaporative Emissions Test Procedure (EU Directive 98-69-EC)

4.1. COMPARISON BETWEEN THE CURRENT EUROPEAN AND US LEGISLATION ON EVAPORATIVE EMISSIONS
Despite some similarities, the European and the US legislative requirements on evaporative emissions are very different especially in terms of severity. In general it can be said that the US legislation is more complete covering all the critical factors affecting evaporative emissions. In addition, the issues related to the use of ethanol/petrol blends have been already addressed and specific requirements have been introduced in the US legislation. One of the main differences is the duration of the diurnal test. While in Europe the diurnal test lasts 24 hours, in the US there are two different diurnal tests lasting respectively 48 (two-day) and 72 (three-day) hours. The two-day diurnal test is designed to cover driving conditions corresponding to short distance driving and two days parking. The three-day diurnal test is designed instead to cover the worst parking conditions: Canister saturated and three days parking. A detailed comparison of the US and European legislation on evaporative emissions is given in the following paragraphs: Vehicle preconditioning prior to evaporative emissions test EU Procedure US procedure Hot soak + one-day Diurnal test - The canister is loaded to 2 grams breakthrough - The canister is reconnected to the vehicle immediately - Pre-conditioning drive: The vehicle is then driven through one Part One and two Part Two driving cycles of Type I test (NEDC cycle) for a total of 1580 sec. - Soak (12 to 36 h) at ambient temperature (20-30 °C) - Conditioning drive: The vehicle is then driven through a full NEDC cycle plus one Part One of the cycle for a total of 1960 sec. - Total driving/purging time: 3540 sec for 1 hour hot soak and 24 hours diurnal - Exhaust emissions may be measured during the conditioning drive but cannot be used for the purpose of exhaust emission type approval
Hot soak + two-day Diurnal test - Pre-conditioning drive (UDDS) - The canister is loaded to 2 grams breakthrough - The canister is reconnected to the vehicle immediately - Cold start exhaust test (FTP) - Hot start exhaust test (FTP) - Total driving/purging time: 1874 sec for 1 hour hot soak and 48 hours diurnal Running losses +Hot soak + three-day Diurnal test - Pre-conditioning drive (UDDS) - The canister is loaded to 150% of Butane Working Capacity - The canister is reconnected to the vehicle immediately - Cold start exhaust test (FTP) - Hot start exhaust test (FTP) - Running losses (UDDS, 2 NYCC, UDDS) - Total driving/purging time: 6222 sec for 1 hour hot soak and 72 hours diurnal
Preconditioning driving cycle EU Procedure US procedure Hot soak + one-day Diurnal test - Total driving/purging time: 3540 sec for 1 hour hot soak and 24 hours diurnal
Hot soak + two-day Diurnal test - Total driving/purging time: 1874 sec for 1 hour hot soak and 48 hours diurnal

Running losses +Hot soak + three-day Diurnal test - Total driving/purging time: 6222 sec for 1 hour hot soak and 72 hours diurnal
Durability EU Procedure US procedure No specific requirement
General requirement: Evaporative emissions control systems have to retain their efficiency until the end of life. The durability demonstration for evaporative emissions (CFR 86.1824-08) must predict an expected in-use emission deterioration rate and emissions level that effectively represents a significant majority of the distribution of emission levels and deterioration in actual use over the full useful life of candidate in-use vehicles. Manufacturers must conduct a durability demonstration based either on whole vehicle aging or a bench aging procedure. For whole vehicles the mileage accumulation should be conducted using the Standard Road Cycle (SRC) and evaporative emissions should be at least tested at each of the five different mileage points selected using good engineering judgment. In case of bench aging, manufacturers may use bench procedures designed, using good engineering judgment, to evaluate the emission deterioration of evaporative control systems. Manufacturers usually follow this second approach and have developed specific test procedures to evaluate each single component of the evaporative control systems. Typical procedures used to demonstrate durability of evaporative emission control systems are the following: - Run evaporative test sequence on new vehicle - Age vehicle and components: - Carbon canister 500 cycles GWC on E10 with BWC each 100 cycles Maximum reduction in BWC < 10% of original Thermal cycle and vibration - Purge valve

Cycle 150 million open close cycles at least half with fuel vapour Thermal cycle and vibration Measure before/after flow rates and coil resistance - Fuel cap 400 On-Off cycles Pressure vacuum cycling - Assemble “aged vehicle” and run test sequence; aged vehicle must meet evaporative and exhaust standard
Fuel permeation EU Procedure US procedure No specific requirement. Fuel permeation contributes to the total evaporative emissions and therefore is evaluated with the standard SHED procedure.
Permeation is not specifically regulated in the US regulation and is only a contributor to full vehicle evaporative emissions. The stricter emissions standards in force the manufacturers to use low permeation material. However PZEVs, have a separate, supplemental rig test that measures the emissions from the wetted fuel system components.
In Use Verification Programme EU Procedure US procedure No specific provision.
Manufacturers must provide in use exhaust and evaporative data 1 year in service low and high mileage vehicles 4 years in service low and high mileage vehicles Typically 10 vehicles per exhaust family with a single vehicle tested for evaporative emissions - Regulatory agencies test in use vehicles
OBD EU Procedure US procedure Minimal requirement (integrity of the circuit of the purge valve)
OBD is required to detect any vapour leak in the evaporative and/or refuelling system greater than or equal in magnitude to a leak

caused by a 1 mm diameter orifice. The system to be checked is defined as the system contained between the fuel filler cap, the canister purge valve and the canister vent valve. The OBD must also detect conditions where flow of fuel vapour can be leaked into the atmosphere, such as a no purge condition. (CFR 86.1806-05). In order to achieve this target the OBD has to: - Monitor functioning of evaporative emission control system (except carbon canister adsorption of HC) - Check system for leakage – 0.5 mm CARB, 1.0 mm US EPA - Check system for blockage – entire system
The following tables summarize the main difference between EU and US test procedures: US 48 hours US 72 hours EU 24 hours Emission limit (grams/test)
1.2 (TIER II > (EPA)) 0.95 (TIER II > (EPA)) 0.5 (LEV II > (CARB))
2.0 (Euro 3>)
Canister pre-conditioning
Breakthrough 1.5 x Breakthrough Breakthrough
Test drive cycle (purge time) Purge time
Cold and hot start exhaust test (31 min)
Cold and hot start exhaust test, Running losses (97 min)
Pre-conditioning and conditioning drive (59 min)
Hot soak 60 min, 68-86 °F 60 min, 68-86 °F 60 min, 73.4-87.8 °F Pre-diurnal soak 6-36 hours 6-36 hours 6-36 hours Fuel tank fill, % 40% 40% 40% Test fuel E0 (E10 used for
vehicle run in) E0 (E10 used for vehicle run in)
E5 (from Euro 5)
Test fuel DVPE/RVP (US)
9 psi 9 psi (7 psi in California)
60 kPa
Diurnal ΔT 72-96 °F 72-96 °F (65-105 °F Californaia)
68-95 °F
Diurnal test duration
48 hours 72 hours 24 hours
Durability requirement
End of life emissions predicted via certification durability testing. Ageing with E10.
None
In use verification 10 k None OBD Leak test and purge flow test Electronic control
only Rationale
Verifies sufficient purging of the carbon canister during the exhaust test that simulates short trips
Verifies sufficient purging of a fully saturated canister and its working capacity in case of an extended parking
Simulates a very long drive followed by 24 hours parking.

EU 24 hours Canister pre-conditioning
Does not account for condition in which a vehicle is parked for more than one day or for complete saturation of the canister
Test drive cycle (purge time) Purge time
The extended drive time compared to the US 48 hours test do not promote aggressive canister purging calibration. In urban conditions, vehicles may be driven for much less than one hour.
Hot soak Pre-diurnal soak Fuel tank fill, % Test fuel Test fuel DVPE Diurnal ΔT Diurnal test duration
Does not account for extended park situation and do not require aggressive purging strategy
Durability requirement
None
In use verification None OBD Does not detect leaks or blocked lines.

5. TESTS PERFORMED AT THE JRC
5.1. JOINT EUCAR/JRC/CONCAWE PROGRAMME ON: EFFECTS OF PETROL VAPOUR PRESSURE AND
ETHANOL CONTENT ON EVAPORATIVE EMISSIONS FROM MODERN CARS [11]
CONCAWE, EUCAR and the Joint Research Centre of the European Commission jointly carried out a major test programme specifically designed to investigate the influence of petrol vapour pressure and ethanol content on evaporative emissions from modern passenger cars as determined using the current European regulatory test procedure. A range of seven petrol passenger cars representative of EURO 3-4 technology were tested for evaporative
emissions with ten different test fuels. The test fuel matrix comprised 60 (Fuel A) and 70 kPa (Fuel B)
hydrocarbon base fuels with 5 and 10% ethanol splash blends (A5S, A10S, B5S, B10S) and 5 and 10% ethanol
matched volatility blends (A5E, A10E, B5E, B10E).
The evaporative emission tests were carried out according to a test protocol agreed by the partners of the
programme and based on the European homologation test procedure.
This test procedure turned out to have a considerable influence on the results; in particular repeating the test procedure, without any additional conditioning between tests above that prescribed by the legislation, resulted in an increase of the carbon canister weight with successive tests (see Figure 9). In other words, the test protocol was not able to return the vehicle to a consistent condition at the start of each test. The increase of the canister weight, which is indicative of the accumulation of petrol/ethanol vapours probably due to insufficient canister purging, may not represent real-world operating conditions as the canister load depends on the typical driving patterns. Running at these increased canister weights is a very severe test of the evaporative control system. The canister weight problem made it more difficult both to obtain representative emission measurements from the various vehicles and to clearly determine fuel effects. However the programme has provided valuable information and several clear conclusions can still be drawn from the results. The vehicles tested differed in their level of evaporative emissions and in the extent of their response to fuel changes. All cars met the 2 g/test emission limit on the first test on fuel A, the reference fuel with DVPE of 60 kPa. Some vehicles slightly exceeded the limit on subsequent tests on fuel A, probably related to increased canister loading in later tests. The test results confirmed that vapour pressure (DVPE) is a key fuel variable for evaporative emissions; in general, increasing fuel vapour pressure above that of the 60 kPa DVPE reference fuel used for system development increased evaporative emissions. However the effect of vapour pressure is strongly non-linear, as expected for a process in which a vapour breakthrough effect may occur. The ethanol blends with final DVPE around 75 kPa gave considerably higher evaporative emissions than the other lower volatility fuels in most of the vehicles. Differences between fuels with DVPE in the range 60-70 kPa were small (see Figure 10). Furthermore, due to the combination of DVPE variations, the presence or absence of ethanol, and to significant changes of canister weight it was difficult to draw any reliable conclusions on the influence of individual parameters. The results obtained in a few tests where extra purging of the canister was carried out suggest that differences in evaporative emission measurements on fuels in this volatility range could be reduced if a more extensive canister conditioning procedure was adopted. The engineering margin built into the system may also explain the reduced fuel effect. The evaporative emission control system is designed for the DVPE of the reference fuel (60 kPa) used in the homologation test but, as for other emission control devices, the manufacturer introduces a certain margin to take into account the production variability.

Figure 9: Time series of evaporative emissions and canister weights Bars: Total Evaporative Emissions (g/test; left-hand axis) Line: Canister weight at start of test after loading to breakthrough with butane (g; right-hand axis) Note: For clarity, different scales are used for each vehicle.
Vehicle 1
0.0
0.5
1.0
1.5
2.0
2.5
3.0
3.5
4.0
4.5
A B
A5
S
B5
S A
A1
0S
B1
0S A
A1
0E
B1
0E
B1
0E A
A5
E
B5
E B BFuel
g/t
es
t
860
870
880
890
900
910
920
930
940
g
Vehicle 2
0.0
0.2
0.4
0.6
0.8
1.0
1.2
1.4
1.6
A B B A5S B5S A A A10S B10S A A10S B10S A
Fuel
g/t
es
t
860
870
880
890
900
910
920
g
Vehicle 3
0.0
1.0
2.0
3.0
4.0
5.0
6.0
A B A5S B5S A A B5S B B5S A5E B5E A A5S B5S
Fuel
g/t
es
t
600
610
620
630
640
650
660
670
gVehicle 4
0.0
1.0
2.0
3.0
4.0
5.0
6.0
7.0
8.0
9.0
A B
A5
S
B5
S
A5
S A
B5
S
B5
S
A5
E
B5
E
B1
0E
A1
0E A B
A1
0S
B1
0S
B5
S
Fuel
g/t
es
t
580
600
620
640
660
680
700
720
740
g
Ext pgExt pg Ext pg Ext pg Ext pg
Vehicle 5
0.0
1.0
2.0
3.0
4.0
5.0
6.0
7.0
8.0
9.0
A B
A5S
B5S A
A5E
B5E A
B10S
B10E A
A5S
B5S B A
Fuel
g/t
est
620
630
640
650
660
670
680
690
700
710
720
g
Intruptd FID
Vehicle 6
0.0
0.2
0.4
0.6
0.8
1.0
1.2
1.4
1.6
A B A5S A5S B5S A A5S A10S A10S B10S A5E B5E A
Fuel
g/t
est
630
640
650
660
670
680
690
700
710
720
gAborted Aborted
Vehicle 7
0.0
0.2
0.4
0.6
0.8
1.0
1.2
1.4
1.6
A A B B A5S B5S A5S B10S A
Fuel
g/t
es
t
2680
2685
2690
2695
2700
2705
2710
2715
2720
g
Key:
ExtPg: Extra purging carried out prior to test
Intruptd: Diurnal test interupted 30 mins before the
scheduled end
FID: FID analyzer saturated, result invalid
Aborted: Test aborted due to technical problems

Figure 10: Total evaporative emissions vs fuel DVPE Note: For clarity, different scales are used for each vehicle
Vehicle 1
1st
0.0
0.5
1.0
1.5
2.0
2.5
3.0
3.5
4.0
4.5
55 60 65 70 75 80
DVPE, kPa
g/t
est
A
A5E
A10E
A5S
A10S
B
B5E
B10E
B5S
B10S
Vehicle 2
1st
0.0
0.2
0.4
0.6
0.8
1.0
1.2
1.4
1.6
55 60 65 70 75 80
DVPE, kPa
g/t
es
t
A
A5S
A10S
B
B5S
B10S
Vehicle 3
1stExtPg ExtPg
ExtPg
0.0
1.0
2.0
3.0
4.0
5.0
6.0
55 60 65 70 75 80
DVPE, kPa
g/t
est
A
A5E
A5S
B
B5E
B5S
Vehicle 4
1st
ExtPg
ExtPg
0.0
1.0
2.0
3.0
4.0
5.0
6.0
7.0
8.0
9.0
55 60 65 70 75 80
DVPE, kPa
g/t
est
A
A5E
A10E
A5S
A10S
B
B5E
B10E
B5S
B10S
Vehicle 5
1st
FID
Intrupt'd
0.0
1.0
2.0
3.0
4.0
5.0
6.0
7.0
8.0
9.0
55 60 65 70 75 80
DVPE, kPa
g/t
es
t
A
A5E
A5S
B
B5E
B10E
B5S
B10S
Vehicle 6
1st
0.0
0.2
0.4
0.6
0.8
1.0
1.2
1.4
1.6
55 60 65 70 75 80
DVPE, kPa
g/t
es
t
A
A5E
A5S
A10S
B
B5E
B5S
B10S
Vehicle 7
1st
0.0
0.2
0.4
0.6
0.8
1.0
1.2
1.4
1.6
55 60 65 70 75 80
DVPE, kPa
g/t
es
t
A
A5S
B
B5S
B10S
Key:
1st: First test on fuel A
ExtPg: Extra purging carried out prior to test
Intruptd: Diurnal test interupted 30 mins before the
scheduled end
FID: FID analyzer saturated, result invalid

Ethanol might influence evaporative emissions also via different mechanisms than the increased vapour pressure of ethanol/petrol blends [8]. For example ethanol is known to be more difficult to purge from carbon canisters (as are heavy hydrocarbons), so could reduce their working capacity. To explore this possibility ethanol/petrol blends matching the vapour pressure of the pure hydrocarbon base fuel were included in the fuel matrix. The increase in canister loading noticed during the programme could be due to increased adsorption of hydrocarbons or ethanol in the canister, or both. Unfortunately the poor repeatability of the main data set does not allow us to quantify the relative size of these effects. Additional tests were performed on one vehicle to try to understand the reason for the increase in emissions with time seen in the main programme. The aim was to explore whether pure hydrocarbon fuels exhibit a different behaviour than ethanol containing fuels and to investigate whether the observed increase in emissions is due to increased canister loading, to an ethanol “memory” build up in the canister or to other possible effects. The results of these tests are illustrated in Figure 11 and show that ethanol containing fuels with matched volatility gave higher emissions than the hydrocarbon fuels. Ethanol was also found in the VT SHED vapour of tests on pure hydrocarbon fuels following use of ethanol-containing fuels. This may be explained either by an increased fuel permeation rate or by a reduced working capacity of the canister due to the fact that ethanol is harder to be purged or to a combination of these two effects. Additional work would be needed to find a definitive answer. Figure 11: Extra tests performed on Vehicle 5 (consecutive multiple tests on same fuel)
Vehicle 5 - Extra Tests After Purging the Canister to DrynessBars: total evaporative emissions - Line: canister weight before N2/butane saturation
0.00
0.50
1.00
1.50
2.00
2.50
3.00
A A A A B A A
Purgin
gA5E
A5E
A5E
B5E
Purgin
gA5S
A5S
A5S A A
Fuel
To
tal
Ev
ap
. E
mis
s.
(g/t
es
t)
500
520
540
560
580
600
620
640
660
680
700
Can
iste
r W
eig
ht
(g)
Not
valid
test
With the objective of estimating the fuel permeation contribution to total evaporative emissions, additional diurnal tests were carried out on two vehicles with the canister vented out of the VT SHED. In standard evaporative emission tests the whole vehicle is placed into the airtight measuring chamber (VT SHED) and all the hydrocarbons emitted by the vehicle itself are released into the VT SHED. Regardless of the source (tank, fuel hoses, construction materials,..), all the hydrocarbons emitted by the vehicle contribute to the total evaporative emissions and thus to the final result of the test. To try to estimate the contribution of fuel permeation through fuel hoses and tank walls a few diurnal tests were carried out on two vehicles (vehicle 5 and vehicle 6) with the canister vented out of the VT SHED via an opening in the VT SHED wall. Any breathing losses through the carbon canister are in this way released in the atmosphere outside the VT SHED and do not contribute to the VOC detected by FID in the VT SHED. Only hydrocarbons coming from fuel permeation or leaks and from other non-fuel related sources should therefore contribute to the test result.
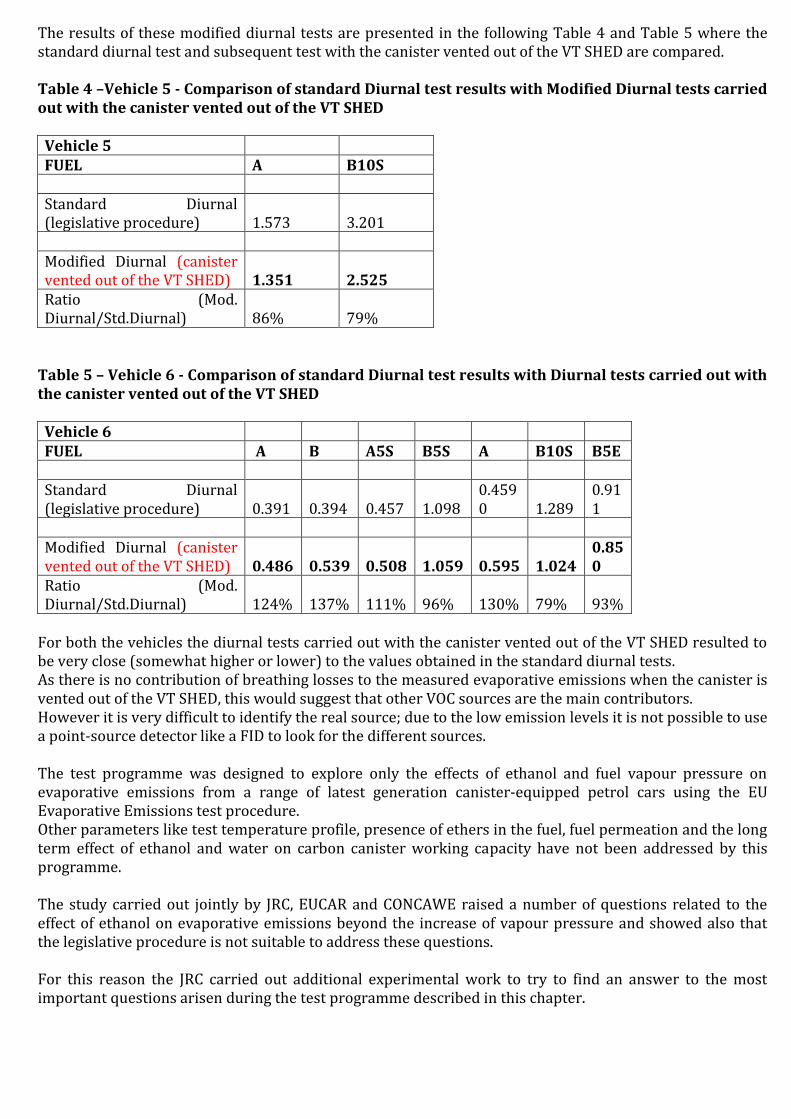
The results of these modified diurnal tests are presented in the following Table 4 and Table 5 where the standard diurnal test and subsequent test with the canister vented out of the VT SHED are compared. Table 4 –Vehicle 5 - Comparison of standard Diurnal test results with Modified Diurnal tests carried out with the canister vented out of the VT SHED Vehicle 5 FUEL A B10S Standard Diurnal (legislative procedure) 1.573 3.201 Modified Diurnal (canister vented out of the VT SHED) 1.351 2.525 Ratio (Mod. Diurnal/Std.Diurnal) 86% 79%
Table 5 – Vehicle 6 - Comparison of standard Diurnal test results with Diurnal tests carried out with the canister vented out of the VT SHED Vehicle 6 FUEL A B A5S B5S A B10S B5E Standard Diurnal (legislative procedure) 0.391 0.394 0.457 1.098
0.4590 1.289
0.911
Modified Diurnal (canister vented out of the VT SHED) 0.486 0.539 0.508 1.059 0.595 1.024
0.850
Ratio (Mod. Diurnal/Std.Diurnal) 124% 137% 111% 96% 130% 79% 93%
For both the vehicles the diurnal tests carried out with the canister vented out of the VT SHED resulted to be very close (somewhat higher or lower) to the values obtained in the standard diurnal tests. As there is no contribution of breathing losses to the measured evaporative emissions when the canister is vented out of the VT SHED, this would suggest that other VOC sources are the main contributors. However it is very difficult to identify the real source; due to the low emission levels it is not possible to use a point-source detector like a FID to look for the different sources. The test programme was designed to explore only the effects of ethanol and fuel vapour pressure on evaporative emissions from a range of latest generation canister-equipped petrol cars using the EU Evaporative Emissions test procedure. Other parameters like test temperature profile, presence of ethers in the fuel, fuel permeation and the long term effect of ethanol and water on carbon canister working capacity have not been addressed by this programme. The study carried out jointly by JRC, EUCAR and CONCAWE raised a number of questions related to the effect of ethanol on evaporative emissions beyond the increase of vapour pressure and showed also that the legislative procedure is not suitable to address these questions. For this reason the JRC carried out additional experimental work to try to find an answer to the most important questions arisen during the test programme described in this chapter.

5.2. EFFECT OF PETROL/ETHANOL BLENDS ON FUEL PERMEATION
The effect of petrol/ethanol blends of fuel permeation rate trough tanks and fuel lines of European cars was investigated on two passenger cars by running ad-hoc evaporative emission tests in which the legislative procedure was used only for the first test. In the subsequent tests only the diurnal tests were carried out with the canister vented out of the SHED via an opening in the VT SHED wall. As already described in the previous chapter, any breathing losses through the carbon canister are in this way released in the atmosphere outside the SHED and do not contribute to the VOC detected by FID in the SHED. Only hydrocarbons coming from fuel permeation or leaks and from other non-fuel related sources should therefore contribute to the test result. Two series of tests were carried out: In the first set of tests the tank of the vehicle contained a pure hydrocarbon fuel while in the second set the tank was filled with a petrol/ethanol blend (5% splash blended). The test protocol followed can be summarized as follows: The first set of tests was carried out using the pure hydrocarbon fuel. In the first test the European legislative procedure was strictly followed. At the end of the first test, the vehicle was left in the SHED without any additional operation on it (no fuel change, no canister conditioning) while the canister was vented out of the SHED. Multiple diurnal tests were then performed one after the other with the pure hydrocarbon fuel. At the end of each diurnal test the only operations executed were the purging of the SHED (the door was opened for some minutes) and the calibration of the FID. No operation was performed on the vehicle. After five tests in total performed with the pure hydrocarbon fuel, the fuel in the tank was replaced with the ethanol/petrol blend (E5S). The first test with the petrol/ethanol blend was carried out strictly following the legislative procedure. At the end of the first test, the vehicle was left in the SHED without any additional operation on it (no fuel change, no canister conditioning) while the canister was vented out of the SHED. Multiple diurnal tests were then performed one after the other with the petrol/ethanol blend. At the end of each diurnal test the only operations executed were the purging of the SHED (the door was opened for some minutes) and the calibration of the FID. No operation was performed on the vehicle. The purpose of this experimental programme was to monitor the evolution of the evaporative emissions of the vehicle due to other sources than the breathing losses from the canister. Since all the sources of VOC with the exception of fuel permeation should give a quite constant contribution to the total VOC value recorded by the FID at the end of the diurnal test, the possible changes in the evaporative emissions levels should be attributed to a change of the fuel permeation rate. The tests were carried out using two different fuels: 1. A pure hydrocarbon fuel 2. A petrol/ethanol blend containing 5% ethanol splash blended The main properties are given in the table below:

Fuel Fuel 1 Fuel 2 Name Base Fuel E5 Splash DVPE kPa 57.2 64.3 E70 % v/v 29 37.3 E100 %v/v 57.7 58.8 E150 %v/v 91.5 91.3 FBP °C 188.8 188.8 Density kg/l @15 ºC 735.9 737.9 MON 85.7 86.6 RON 95 96.9 Sulfur mg/kg <10 <10 Aromatics %v/v 28.6 26.9 Olefins %v/v 7.7 7.1 Ethanol %v/v 5.01
Two different passenger car models, among the most popular in Europe, were tested: Vehicle Vehicle A Vehicle B Emission level Euro 4 Euro 5-a Displacement (cm3)
1368 1595
Max. power (kW) 88 75 Mass (kg) 1170 1157
After-treatment TWC TWC Mileage (km) 28100 7280 Tank material Plastic Plastic Registration (year) 24/07/2008 07/07/2009
The results of the diurnal tests performed on the two vehicles are shown in Figure 12 - Figure 13. The first two bars (identified by a different shading effect) represent the two tests carried out following the legislative procedure with the two different fuels. As clearly shown by the graph, the emission levels measured in the first two tests resulted to be very close to the results of the second tests that, however, were performed with the canister vented out of the SHED. This confirms that breathing losses represent a minor source of evaporative emissions when the vehicle is tested according to the European legislative procedure. Moreover, the graph clearly shows that there is a significant difference between the pure hydrocarbon fuel and the petrol/ethanol blend. In the case of Vehicle A, the evaporative emissions measured with the pure HC fuel and the canister vented out of the SHED decreased over time while the levels measured with the petrol/ethanol blend increased. The emission level recorded in the eleventh diurnal test performed with the ethanol containing fuel was 1.23 g while in the second test the level was 0.99 g, corresponding to an increase of 24%. A similar trend was found with the Vehicle B. In this case fourteen diurnal tests were performed with the ethanol containing fuel. The value recorded in the fourteenth test was 1.28 g while in the second test was 1.14 g (13% increase).

Figure 12: Vehicle A - Evaporative emissions measured in multiple consecutive diurnal tests (from the second test on the canister was vented out of the SHED)
0.0
0.2
0.4
0.6
0.8
1.0
1.2
1.4
1st 2nd 3rd 4th 5th 6th 7th 8th 9th 10th 11th
Fuel 1 (HC)
Fuel 2 (E5S)Canister vented out of the SHED in
order to estimate fuel permeation
Tests performed following
the EU procedure
Figure 13: Vehicle B - Evaporative emissions measured in multiple consecutive diurnal tests (from the second test on the canister was vented out of the SHED)
0.0
0.2
0.4
0.6
0.8
1.0
1.2
1.4
1.6
1st 2nd 3rd 4th 5th 6th 7th 8th 9th 10th 11th 12th 13th 14th
Diu
rnal em
issio
ns (
g)
Fuel 1 (HC)
Fuel 2 (E5S)Canister vented out of the SHED in
order to estimate fuel permeation
Tests performed following
the EU procedure

Since the evaporative emission tests are very time consuming (in the case of Vehicle B the nineteen tests performed required nineteen calendar days), it was possible to carry out only a limited number of tests. Therefore it is not possible to draw from this data final conclusions on the time needed to reach a stable permeation rate after switching from a pure hydrocarbon fuel to a petrol/ethanol blend. This issue was addressed in a study co-sponsored by the California Air Resources Board (CARB) and Georgia-based Coordinating Research Council having the objective of investigating the effect of petrol/ethanol blends on permeation [4]. One of the conclusions of this study is that permeation emissions (at 105ºF = 40.6 ºC steady-state) generally approached a stabilized level within 1 to 2 weeks when switching from one fuel to another. According to other sources it takes 20 weeks to stabilize a low-permeation, multi-layer tank to steady state. High temperature aging with frequent fuel replacement accelerates stabilization to 7-10 weeks.

5.3. INFLUENCE OF TEST PROCEDURE ON EVAPORATIVE EMISSIONS
With the objective of updating the evaporative emission factors in the COPERT model, a large experimental programme was carried out jointly by the JRC, CONCAWE and the Laboratory of Applied Thermodynamics (LAT) of the Aristotle University of Thessaloniki, Greece. The specific target of this programme was to develop a model to predict evaporative emissions from modern cars [12]. In total five modern vehicles were tested, of which four were Euro 4 and one Euro 3. The selected vehicles had engine sizes ranging from 1.2 to 6.0 litres and were all equipped with a multi-point injection (MPI) fuel system. Four vehicles had plastic fuel tanks and one had a metal one. One vehicle had a pressurised fuel tank. Finally, Vehicle 5 was a SUV available on the European market but produced in the USA. Data on the selected test vehicles are listed in Table 6. Table 6 - Vehicle data
EU
RO
leve
l
En
gin
e si
ze
Mil
eage
(k
m)
Fu
el s
yste
m
Fu
el t
ank
mat
eria
l
Yea
r o
f f
irst
re
gist
rati
on
Vehicle 1 4 1.2 25 000 MPI P 2005
Vehicle 2 4 1.4 10 000 MPI P 2006
Vehicle 3 4 1.8 2 000 MPI M 2007
Vehicle 4 3 1.8 14 000 MPI P 2003
Vehicle 5 4 6.0 17740 MPI P 2008
* P=Plastic, M=Metal The test fuels were provided by CONCAWE and comprised 60, 70 and 90 kPa hydrocarbon (HC) fuels. The two HC fuels with vapour pressures of 60 (fuel A) and 70 (fuel B) kPa represent the current standard European summer grade petrol and the summer grade petrol specified in regions with “arctic conditions” respectively, while the 90 (fuel C) kPa fuel is a typical winter grade petrol. The composition of these three fuels was kept similar, the main difference being use of more butane in fuels B and C to increase the vapour pressure (Dry Vapour Pressure Equivalent – DVPE), as would be normal refinery practice. No oxygenated compounds were used to blend these fuels. A summary of key properties is given in Table 7. Table 7 - Test fuel matrix
Fuel A B C
DVPE kPa 60.0 69.7 89.5
E70 % v/v 40.0 38.0 40.0
E100 % v/v 55.0 54.2 55.0
Density kg/m3 751.4 750.7 746.4
Aromatics
% v/v 34.8 – 34.4
Olefins % v/v 9.7 – 7.9

The current European regulatory evaporative emissions test procedure was used as a basis for the measurements with some additions as described in the following. Based on experience gained from a previous programme [11], special attention was given to keeping the initial canister weight (prior to canister load to breakthrough) at a constant level. The objective of this was to avoid the accumulation of fuel vapours in the activated carbon, which may result in a reduction of canister working capacity. To this aim, after each test and before starting the next fuel–temperature combination, the vehicle was driven on the road for approximately 200 km. The carbon canister was thus allowed to be purged sufficiently and the permeation rate to be stabilised. A second diurnal test was following the first test using the same temperature profile. The purpose of the two consecutive diurnal tests was to assess the effect of canister load on evaporative emissions. While the first diurnal test was starting with an almost dry canister, at the beginning of the second one the canister was loaded to a certain level, depending on the canister size and also on fuel volatility. Finally, a third test at constant temperature (30 °C) and with the canister vented out of the SHED was conducted at the end of the second diurnal test. The aim of this test – hereafter indicated as permeation test – was to estimate the contribution to total evaporative emissions of sources other than the carbon canister, namely fuel permeation and/or leakage. The testing procedure comprises the following steps:
Vehicle driving on the road for at least 200 km Load canister to breakthrough Fuel tank drain and refill with test fuel Preconditioning drive (NEDC + EUDC) Soak for 12–36 hours Evap system conditioning drive (NEDC + UDC) Hot soak test for 1 hour at constant temperature (30 °C) Soak for 6–36 hours 1st 24 hour diurnal test with specified diurnal variation (20–35 °C) 2nd 24 hour diurnal test with specified diurnal variation (20–35 °C) Permeation test for 16 hours at constant temperature (30 °C)
The results of the tests are shown in the following charts (Figure 14 - Figure 18) Figure 14 : Evaporative emissions measured in three consecutive diurnal tests (in the third test the canister was vented out of the SHED in order to estimate the permeation)
Vehicle 1 - Evaporative emissions measured in three
consecutive diurnal test with different fuels
1.91.1 1.3
0
5
10
15
20
25
30
35
40
45
Fuel A Fuel B Fuel C Fuel A Fuel C
Diu
rnal em
issio
ns (
g)
1st Diurnal
2nd Diurnal
"Permeation"
DVPE
Fuel A= 60 kPa
Fuel B= 70 kPa
Fuel C= 90 kPa
FID saturation

Figure 15 : Evaporative emissions measured in three consecutive diurnal tests (in the third test the canister was vented out of the SHED in order to estimate the permeation)
Vehicle 2 - Evaporative emissions measured in three
consecutive diurnal test with different fuels
1.8 1.7 1.2 1.4
0
2
4
6
8
10
12
14
16
18
Fuel A Fuel C Fuel A Fuel C
Diu
rnal
em
issio
ns (
g)
1st Diurnal
2nd Diurnal
"Permeation"
DVPE
Fuel A= 60 kPa
Fuel B= 70 kPa
Fuel C= 90 kPa
Figure 16 : Evaporative emissions measured in three consecutive diurnal tests (in the third test the canister was vented out of the SHED in order to estimate the permeation)
Vehicle 3 - Evaporative emissions measured in three
consecutive diurnal test with different fuels
0.4 0.30.4
0
5
10
15
20
25
30
Fuel A Fuel C Fuel A
Diu
rnal
em
issio
ns (
g)
1st Diurnal
2nd Diurnal
"Permeation"
DVPE
Fuel A= 60 kPa
Fuel B= 70 kPa
Fuel C= 90 kPa
FID saturation

Figure 17 : Evaporative emissions measured in three consecutive diurnal tests (in the third test the canister was vented out of the SHED in order to estimate the permeation)
Vehicle 4 - Evaporative emissions measured in three
consecutive diurnal test with different fuels
0.5 0.80.5
0
5
10
15
20
25
30
Fuel A Fuel C Fuel A
Diu
rnal
em
issio
ns (
g)
1st Diurnal
2nd Diurnal
"Permeation"
DVPE
Fuel A= 60 kPa
Fuel B= 70 kPa
Fuel C= 90 kPa
FID saturation
Figure 18 : Evaporative emissions measured in three consecutive diurnal tests (in the third test the canister was vented out of the SHED in order to estimate the permeation)
Vehicle 5 - Evaporative emissions measured in three
consecutive diurnal test with different fuels
0.0
0.1
0.2
0.3
0.4
0.5
0.6
0.7
0.8
0.9
1.0
Fuel A Fuel C Fuel A Fuel B10S
Diu
rnal E
mis
sio
n (
g)
1st Diurnal test
2nd Diurnal test
"Permeation"
DVPE
Fuel A= 60 kPa
Fuel B= 70 kPa
Fuel C= 90 kPa
Fuel B10S= 76 kPa (10% Ethanol)
Vehicle 5 was further tested in order to evaluate its capability to keep evaporative emissions under control in multiple diurnal tests. The tests were carried out in a very severe condition since a fuel containing 10% ethanol and having a DVPE of 76 kPa was used. The results are shown in Figure 19.

Figure 19 : Evaporative emissions measured in multiple consecutive diurnal tests
Vehicle 5 - Multiple diurnal tests
Fuel B10S (10% Ethanol splash blended)
0.0
0.2
0.4
0.6
0.8
1.0
1.2
1.4
1st 2nd 3rd 4th 5th 6th 7th
Diu
rnal em
issio
ns (
g)
The following conclusions can be drawn from the above data: The tests conducted confirm that DVPE is a key parameter but the effect on evaporative emissions is highly non-linear and very dependent on the vehicle technology. Vehicle 5, which was designed to comply with the US legislation, exhibited an almost negligible sensitivity to fuel quality. For all the vehicles tested the emissions measured with the canister vented out of the SHED resulted to be very close to or at the same level as the emissions measured with the standard procedure. This confirms that in standard evaporative emissions breathing losses represent a minor contributor to the total evaporative emissions. On the contrary, permeation is likely to be the most important source at least provided that the canister does not reach the breakthrough. The vehicle equipped with the metal tank and the one designed for the US market, together with Vehicle 4, showed the lowest values in the “permeation” tests. All the European vehicles, with the exception of Vehicle 3, exhibited emissions well above the limit in the second diurnal test. This was clearly due to the saturation (breakthrough) of the canister. Vehicle 5, although had a much larger tank than the other vehicles (80 vs. 60-65 litres), showed a very limited increase in the emissions measured in the second diurnal test. Moreover, the carbon canister used in Vehicle 5 did not reach the breakthrough even after seven consecutive diurnal tests, thus showing a much better performance than required by the US legislation (three-day test). Finally, outside the programme above described, a Euro 5 vehicle was tested using both the European and the US procedure for evaporative emissions. The main characteristics of the vehicle are provided in the following table: Vehicle Vehicle 6 Emission level Euro 5-a Displacement (cm3)
1242
Max. power (kW) 44 Mass (kg) 1079
After-treatment TWC Mileage (km) 1909 Tank material Plastic

Registration (year) 11/02/2010
Four different evaporative emission tests were carried out using: 1. The legislative European test procedure 2. The European legislative procedure but with a reduced vehicle conditioning The conditioning drive prescribed by the EU procedure before starting the evaporative test consists in 1 NEDC cycle + 1 EUDC. In this case a shorter conditioning drive was used (only 1 NEDC cyce). 3. The US two-day diurnal test procedure 4. The US three-day diurnal test procedure The results are shown in Figure 20. Figure 20 : Vehicle 6 - Diurnal evaporative emissions measured using different test procedures
Vehicle 6: Diurnal evaporative emissions measured
using different test procedures
0.0
0.5
1.0
1.5
2.0
2.5
3.0
3.5
EU standard EU modified EPA_48 h EPA_72 h
Diu
rna
l e
mis
sio
ns
(g
)
This vehicle exhibited quite low diurnal emissions when measured according to the EU legislative procedure. However it was sufficient just to reduce the purging time during the pre-conditioning to see a significant increase of the emissions that, however, remained well below the limit. Only when the vehicle was tested according to the US procedures this did not comply with the 2.0/test limit. This further confirms that even when the evaporative emission control system works well in the EU procedure, the capacity of the canister is not sufficient to keep under control the emissions for multiple day parking.
5.4. PURGING STRATEGY OF MODERN CARS AVAILABLE ON THE EUROPEAN MARKET
The typical purging strategy of passenger cars available on the European market has been investigated at the JRC by connecting a flowmeter to the canister vent. Most of these vehicles were tested for evaporative emissions and the second-by-second purging flow rate was recorded both over the pre-conditioning (NEDC+EUDC) and the conditioning drive (NEDC+UDC) prescribed by the relevant legislative test procedure.
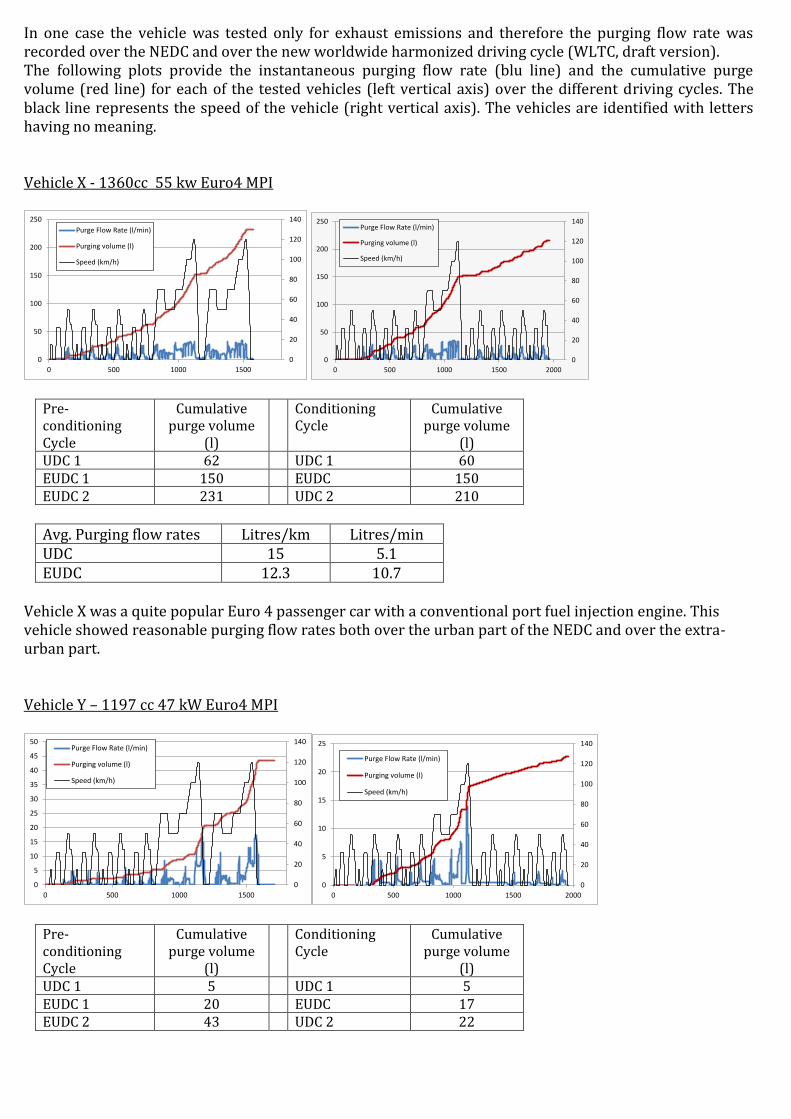
In one case the vehicle was tested only for exhaust emissions and therefore the purging flow rate was recorded over the NEDC and over the new worldwide harmonized driving cycle (WLTC, draft version). The following plots provide the instantaneous purging flow rate (blu line) and the cumulative purge volume (red line) for each of the tested vehicles (left vertical axis) over the different driving cycles. The black line represents the speed of the vehicle (right vertical axis). The vehicles are identified with letters having no meaning. Vehicle X - 1360cc 55 kw Euro4 MPI
0
20
40
60
80
100
120
140
0
50
100
150
200
250
0 500 1000 1500
Purge Flow Rate (l/min)
Purging volume (l)
Speed (km/h)
0
20
40
60
80
100
120
140
0
50
100
150
200
250
0 500 1000 1500 2000
Purge Flow Rate (l/min)
Purging volume (l)
Speed (km/h)
Pre-conditioning Cycle
Cumulative purge volume
(l)
Conditioning Cycle
Cumulative purge volume
(l) UDC 1 62 UDC 1 60 EUDC 1 150 EUDC 150 EUDC 2 231 UDC 2 210
Avg. Purging flow rates Litres/km Litres/min UDC 15 5.1 EUDC 12.3 10.7
Vehicle X was a quite popular Euro 4 passenger car with a conventional port fuel injection engine. This vehicle showed reasonable purging flow rates both over the urban part of the NEDC and over the extra-urban part. Vehicle Y – 1197 cc 47 kW Euro4 MPI
0
20
40
60
80
100
120
140
0
5
10
15
20
25
30
35
40
45
50
0 500 1000 1500
Purge Flow Rate (l/min)
Purging volume (l)
Speed (km/h)
0
20
40
60
80
100
120
140
0
5
10
15
20
25
0 500 1000 1500 2000
Purge Flow Rate (l/min)
Purging volume (l)
Speed (km/h)
Pre-conditioning Cycle
Cumulative purge volume
(l)
Conditioning Cycle
Cumulative purge volume
(l) UDC 1 5 UDC 1 5 EUDC 1 20 EUDC 17 EUDC 2 43 UDC 2 22

Avg. Purging flow rates Litres/km Litres/min UDC 1.25 0.43 EUDC 2.3 2.4
Vehicle Y was a popular Euro 4 small passenger car model equipped with a conventional port fuel injection engine. In this case the purging rates turned out to be quite low especially over the urban part of the cycle. Vehicle Z – 1794 cc 88 kW Euro4 MPI
0
20
40
60
80
100
120
140
0
20
40
60
80
100
120
140
160
0 500 1000 1500
Purge Flow rate (l/min)
Purging volume (l)
Speed (km/h)
0
20
40
60
80
100
120
140
0
10
20
30
40
50
60
70
80
90
0 500 1000 1500 2000
Purge Flow Rat (l/min)
Purging volume (l)
Speed (km/h)
Pre-conditioning Cycle
Cumulative purge volume
(l)
Conditioning Cycle
Cumulative purge volume
(l) UDC 1 0.5 UDC 1 1 EUDC 1 69 EUDC 83 EUDC 2 144 UDC 2 84
Avg. Purging flow rates Litres/km Litres/min UDC 0.25 0.0015 EUDC 10.8 9.4
Vehicle Z was a medium class Euro 4 passenger car equipped with a conventional port fuel injection engine. This vehicle exhibited a very peculiar purging strategy with a flow rate close to zero over the urban part of the cycle. The canister is basically purged only over the extra-urban part of the cycle. These results were confirmed by the tests carried out on a similar car model differing only for the engine power (the name of the model and the displacement of the engine were identical). It is clear that a purging strategy like the one adopted in this car model can easily lead to a saturated canister if the vehicle is mainly driven in urban areas resulting in uncontrolled evaporative emissions. Vehicle W – 6063cc 313kw Euro4 MPI
0
20
40
60
80
100
120
140
0
100
200
300
400
500
600
0 200 400 600 800 1000 1200 1400 1600
Purge Flow Rate (l/min)
Purging volume (l)
Speed (km/h)
0
20
40
60
80
100
120
140
0
100
200
300
400
500
600
0 500 1000 1500 2000
Purge Flow Rate (km/h)
Purging volume (l)
Speed (km/h)

Pre-conditioning Cycle
Cumulative purge volume
(l)
Conditioning Cycle
Cumulative purge volume
(l) UDC 1 205 UDC 1 180 EUDC 1 365 EUDC 335 EUDC 2 530 UDC 2 525
Avg. Purging flow rates Litres/km Litres/min UDC 45 15.4 EUDC 23.1 20.2
Vehicle W was a large SUV manufactured in the US and imported to Europe. The fuel and evaporative control systems of this vehicle are designed to comply with the US legislation and the tests carried out at the JRC confirmed the very low evaporative emissions. The purging strategy adopted in this vehicle is very aggressive and of course this is facilitated by the large engine displacement. Vehicle Y – 875cc 62.5kw Euro 5 MPI
0
20
40
60
80
100
120
140
0
10
20
30
40
50
60
0 200 400 600 800 1000 1200
Purge Flow Rate (l/min)
Purging Volume (l)
Speed (km/h)
0
20
40
60
80
100
120
140
0
10
20
30
40
50
60
70
80
90
0 500 1000 1500 2000
Purge Flow Rate (l/min)
Purging Volume (l)
Speed (km/h)
NEDC Cumulative purge volume
(l)
WLTC Cumulative purge volume
(l) UDC 20 Low 14 EUDC 49 Medium 30 High 66 X-High 85
Avg. Purging flow rates Litres/km Litres/min UDC 5 1.7 EUDC 4.1 3.6
Vehicle Y was a small Euro 5 car with a modern downsized port fuel injection engine. This vehicle was not tested for evaporative emissions and was instead used in an experimental programme having as objective the assessment of the new draft worldwide harmonized driving cycle (WLTC). For this reason the purging flow rates are available only for the NEDC and the at the time available WLTC version. Despite the low displacement, the purging flow rates are in line with those of other typical European car. It is worth mentioning that the same car model is marketed also in the US. The results presented above show that the purging strategy of typical European passenger cars can vary significantly from model to model. In general, the purging flow rates recorded over the urban part of the cycle result significantly lower compared to those measured over the extra-urban part. In some cases this

difference is very important and the flow rate over the urban driving cycle is very low or close to zero. It is clear that, in order to pass the legislative evaporative emission test, vehicles adopting such purging strategies mainly rely on the three EUDC cycles that the vehicle has to cover after the canister loading to breakthrough. At least for some of the vehicles tested, replacing the EUDC cycle with the urban cycle in the conditioning procedure would result in very low total purge volume. It seems as in these cases the purging strategy has been developed with the main objective of passing the legislative test rather than to ensure an efficient canister purging in real world driving conditions. In fact, if one of these vehicles is mainly driven in urban areas at low speed the canister will not be efficiently purged. As a consequence, in hot climate conditions the canister will be easily saturated with uncontrolled evaporative emissions from the tank. The 48-hours diurnal test required by the US legislation has been designed with the main objective of avoiding this situation. The driving time/distance available for canister purging after the canister loading to the breakthrough is in fact much shorter than the total conditioning drive prescribed by the European test procedure. The combination of the shorter driving time/distance and the longer diurnal test (48-hours vs 24-hours) requires the adoption of a much more aggressive purging strategy. From the point of view of technical feasibility, this seems to be not a major problem also for the small European cars since many of them are already marketed in the US (e.g. Mini, Smart, Fiat 500,...).

REFERENCES
1. “Relative Importance of 22 Parameters to Evaporative Emissions – A Sensitivity Analysis of EVAP 2.0”, SAE Technical Paper No. 881594
2. Directive 98/69/EC of the European Parliament and of the Council of 13 October 1998 relating to measures
to be taken against air pollution by emissions from motor vehicles and amending Council Directive
70/220/EEC
3. “Impact and Control of Canister Bleed Emissions”, SAE Technical Paper No. 2001-01-0733 4. “Fuel Permeation from Automotive Systems” - Final Report, CRC Project No. E-65, September 2004 5. “Studies on Carbon Canisters to Satisfy LEVII EVAP Regulations”, SAE Technical Paper No. 2000-01-0895
6. “Development of a Petrol-Fueled Vehicle with Zero Evaporative Emissions”, SAE Technical Paper No. 2000-01-2926
7. “Gasoline Evaporative Emissions: Ethanol Effects on Vapour Control Canister Sorbent Performance”, SAE Technical Paper No. 952748
8. “Air Quality Impacts of the Use of Ethanol in California Reformulated Petrol” – Final Report to the California Environmental Policy Council - California Environmental Protection Agency –Air Resources Board – 1999
9. Report No. SR00-01-01 “Potential Evaporative Emission Impacts Associated with the Introduction of Ethanol-Petrol Blends in California”, Sierra Research, Inc., January 11, 2000
10. “Issues Associated with the Use of Higher Ethanol Blends (E17-E24)”, National Renewable Energy Laboratory (NREL), October 2002
11. Joint EUCAR/JRC/CONCAWE Study on: Effects of Gasoline Vapour Pressure and Ethanol Content on Evaporative Emissions from Modern Cars, Institute for Environment and Sustainability, 2007, EUR 22713
12. “A vehicle testing programme for calibration and validation of an evaporative emissions model”, Giorgos Mellios, Zissis Samaras, Giorgio Martini, Urbano Manfredi, Steve McArragherc and Ken Rose, Fuel, Volume 88, Issue 8, August 2009, Pages 1504-1512
13. DIRECTIVE 2009/28/EC OF THE EUROPEAN PARLIAMENT AND OF THE COUNCIL of 23 April 2009 on the promotion of the use of energy from renewable sources and amending and subsequently repealing Directives 2001/77/EC and 2003/30/EC
14. Commission Regulation (EC) No 692/2008 of 18 July 2008 implementing and amending Regulation (EC) No 715/2007 of the European Parliament and of the Council on type-approval of motor vehicles with respect to emissions from light passenger and commercial vehicles (Euro 5 and Euro 6) and on access to vehicle repair and maintenance information.
15. “Lack of legislation causes large problems with evaporative emissions”, SAE Technical Paper no. 2009-24-0141
16. Directive 2009/30/EC of the European Parliament and of the Council of 23 April 2009 amending Directive 98/70/EC as regards the specification of petrol, diesel and gas-oil and introducing a mechanism to monitor and reduce greenhouse gas emissions and amending Council Directive 1999/32/EC as regards the specification of fuel used by inland waterway vessels and repealing Directive 93/12/EEC
17. “Development of a Gasoline-Fueled Vehicle with Zero Evaporative Emissions”, SAE Technical Paper No. 2000-01-2926
18. “Speciation of Evaporative Emissions form Plastic Fuel Tanks”, SAE Technical Paper No. 981376 19. “Effects of Gasoline Ethanol Blends on Permeation Emissions Contribution to VOC Inventory From On-
Road and Off-Road Sources” - The American Petroleum Institute -2005 20. “Proposed Determination Pursuant to Health and Safety Code Section 43830(g) of the Ozone Forming
Potential of Elevated RVP Gasoline Containing 10 Percent Ethanol”, November 1998, CEPA, CARB 21. CRC Report No. E-65-3, “FUEL PERMEATION FROM AUTOMOTIVE SYSTEMS: E0, E6, E10, E20 AND
E85”,Final Report December, 2006

22. Integrated Project no: TREN/05/FP6EN/S07.53807/019854, Project acronym: BEST (BioEthanol for Sustainable Transport), “Experiences from introduction of ethanol buses and ethanol fuel stations”, Deliverable no: D 2.1 and D 2.2
23. Final Regulatory Impact Analysis: Refueling Emissions Regulation for Light Duty Vehicles and Trucks and Heavy Duty Vehicles – US-EPA January 1994
24. Stage II Vapour Recovery Systems-Issues Paper – US-EPA August 2004

List of Special Terms and Abbreviations ACEA European Automobile Manufacturers Association ASTM American Society for Testing and Materials BWC Butane Working Capacity of activated carbon CARB California Air Resource Board CEN European Committee for Standardization CO Carbon Monoxide CO2 Carbon Dioxide CONCAWE The Oil Companies’ European Association for Environment, Health and Safety in Refining and Distribution DI Direct Injection DISI Direct Injection Spark Ignition DVPE Dry Vapour Pressure Equivalent at a temperature of 37.8 °C (kPa) EC European Commission EMS Engine Management System EN European standard issued by CEN EPA Environmental Protection Agency (USA) EPEFE European Programme on Emissions, Fuels and Engine Technologies ETBE Ethyl Tertiary Butyl Ether EU European Union EUCAR European Council for Automotive R & D EUDC Extra Urban Driving Cycle = Part 2 of the NEDC driving cycle EURO # European emission standard FID Flame ionization detector GPS Global Positioning System kPa 1 KiloPascal = 1000 N/m2 HC Hydrocarbon IES Institute of Environment and Sustainability IR Infrared red spectroscopy JRC Joint Research Centre LD Light Duty LHV Lower Heating Value MPI Multi Point Injection MTBE Methyl Tertiary Butyl Ether NEDC New European Driving Cycle = Type I test NOx Oxides of Nitrogen PC Passenger Car RVP Reid Vapour Pressure Type I Type of emission test as laid down in the Directive 70/220/CEE and subsequent amendments UDC Urban Driving Cycle= Part 1 of the NEDC driving Cycle US The United States of America VELA Vehicles Emission Laboratory VOC Volatile Organic Compound VT SHED Variable Temperature Sealed House for Evaporative Determination WLTC Worldwide Harmonized Driving Cycle for Light Duty Vehicles

European Commission
EUR 25640 – Joint Research Centre – Institute for Energy and Transport
Title: Review of the European Test Procedure for Evaporative Emissions: Main Issues and Proposed Solutions
Author(s): Giorgio Martini, Urbano Manfredi, Marta Rocha, Alessandro Marotta
Luxembourg: Publications Office of the European Union
2012 – 66 pp. – 21.0 x 29.7 cm
EUR – Scientific and Technical Research series – ISSN 1831-9424 (online), ISSN 1018-5593 (print),
ISBN 978-92-79-27806-8 (pdf)
ISBN 978-92-79-27807-5 (print)
doi:10.2788/72123
Abstract
The current European legislation on evaporative emissions dates back to the Directive 98/69/EC (Euro 3-4 standards).
Since then neither the emission limits nor the test procedure have changed. As stated in several legislative documents
the European Commission has now the obligation to review the evaporative emissions test procedure in order to
improve control of evaporative emissions. In this report the main issues related to real world evaporative emissions and
to the impact of ethanol used as transport fuel on the same emissions are addressed. In addition, modifications to the
current European legislation to improve the control of real world evaporative emissions and to minimize the impact of
ethanol are proposed.
Moreover, this report provides an overview on evaporative emissions from passenger cars and on the effect of ethanol
on them. A comparison between the European and US legislation is also provided.

z
As the Commission’s in-house science service, the Joint Research Centre’s mission is to provide
EU policies with independent, evidence-based scientific and technical support throughout the
whole policy cycle.
Working in close cooperation with policy Directorates-General, the JRC addresses key societal
challenges while stimulating innovation through developing new standards, methods and tools,
and sharing and transferring its know-how to the Member States and international community.
Key policy areas include: environment and climate change; energy and transport; agriculture
and food security; health and consumer protection; information society and digital agenda;
safety and security including nuclear; all supported through a cross-cutting and multi-
disciplinary approach.
LB
-NA
-25640-E
N-N