review of the assessments of and management advice … · review of the assessments of and...
TRANSCRIPT

1
Review of the Assessments of and Management Advice for Atlantic Large Coastal Sharks
by
André E. Punt, School of Fishery and Aquatic Sciences, University of Washington
A Report to the University of Miami
16 September 2001
EXECUTIVE SUMMARY
• The need for large reductions in the catches of large coastal sharks other than
sandbar and blacktip sharks appears to be robust to uncertainty. • The need for and magnitude of reductions in the catches of sandbar and blacktip
sharks is less clear, as the results appear to be sensitive to how the various index types are weighted.
• It was not possible to replicate the 1998 SEW base-line results for blacktip sharks adequately. Analyses conducted during this review suggest that the population of blacktip sharks is currently above the MSY level. However, the results for blacktip sharks are highly uncertain, being sensitive to assumptions regarding data set choices and weighting schemes.
• There is a need to confirm the results based on the production model using a more flexible stock assessment method (such as an age- or sized-structured model), to validate the software that implements the production model, and to evaluate this assessment approach by means of simulation.
• Sensitivity to the weighting scheme must form part of assessments in which there are multiple conflicting abundance index types.
• Key data collection needs include additional information to determine the mean weight of the catch (if assessments are to continue to be based on catch-in-numbers) and information from archivally or satellite tagged sharks (to resolve the open / closed population question).

2
A. Introduction A series of workshops has been held since 1992 to conduct assessments for the shark resources off the U.S. Atlantic and Gulf of Mexico coasts. The techniques used for these assessments have ranged from examination of raw catch and effort information to the application of a variety of methods of fisheries stock assessment. The most recent workshop (henceforth SEW 1998) based its advice related to Total Allowable Catches for the large coastal shark group, sandbar sharks and blacktip sharks, on the results from an age-aggregated production model assessment.
This review of the 1998 assessment and management advice (see Appendix A for the details of the work statement) involved overviewing pertinent background documents (Appendix B) and implementing the assessment model and projection software. A similar (but not identical) model was coded as part of this review because the assessment approach applied in 1998 is relatively new in fisheries (for example, how it treats the uncertainty in historical catches is novel) and to enable additional sensitivity tests to be conducted (see Appendix C for technical details).
The remaining sections of this report list some general points, document my responses to each of the questions posed in the work statement, and list my recommendations. The latter include recommendations for improvements both to the approaches used for assessment purposes and to the presentation of assessment results. I have re-ordered the questions for ease of presentation.
B. General comments B.1 Replicating the 1998 SEW base-line assessment It was not possible to replicate the base-line results for the 1998 SEW exactly (see Table 1 of Appendix C). The results for the base-case assessment of this review, the assumptions and data set choices for which resemble the 1998 SEW base-line assessment as closely as possible, tend to be the more optimistic. It may be possible to attribute the differences in results for sandbar sharks and large coastal sharks as a group to the differences between the Prager and discrete logistic formulation of the production model and the uncertainty associated with the Monte Carlo nature of the numerical scheme used to conduct the Bayesian integrals. As such, the base-case results in Appendix C are sufficiently similar to those obtained during the 1998 SEW to provide guidance regarding the sensitivity of the results to changes in assumptions / data set choices.
However, the differences for blacktip sharks cannot be explained by either of the factors that can explain the differences for blacktip and large coastal sharks as a group. It will be shown later that the results for blacktip sharks are highly uncertain, depending critically on the assumptions underlying the assessment. However, it is nevertheless important to understand the reasons for the differences between the ‘1998 SEW’ and the base-case results in Table C.1(c). Examination of the software used to conduct the 1998 SEW assessment of blacktip sharks suggests that the approach used to develop the importance function did not permit the posterior to be determined accurately. Identifying this problem without actually re-coding the model (as was done for this review) would, however, have been difficult as the problem is not generic but case-specific. In particular, the extremely complicated surface is very difficult to approximate using virtually any
3
importance function. Ideally, this problem could have been identified had additional model validation been conducted prior to, or after, the use of the assessment software for the 1998 SEW. Alternatively, different integration methods (e.g. the Markov Chain Monte Carlo method) or different functional forms for the importance function could be have been examined. However, this could not have been conducted during the 1998 SEW meeting owing to computational demands. Further comments on the issue of model validation are provided in Section B.4 below.
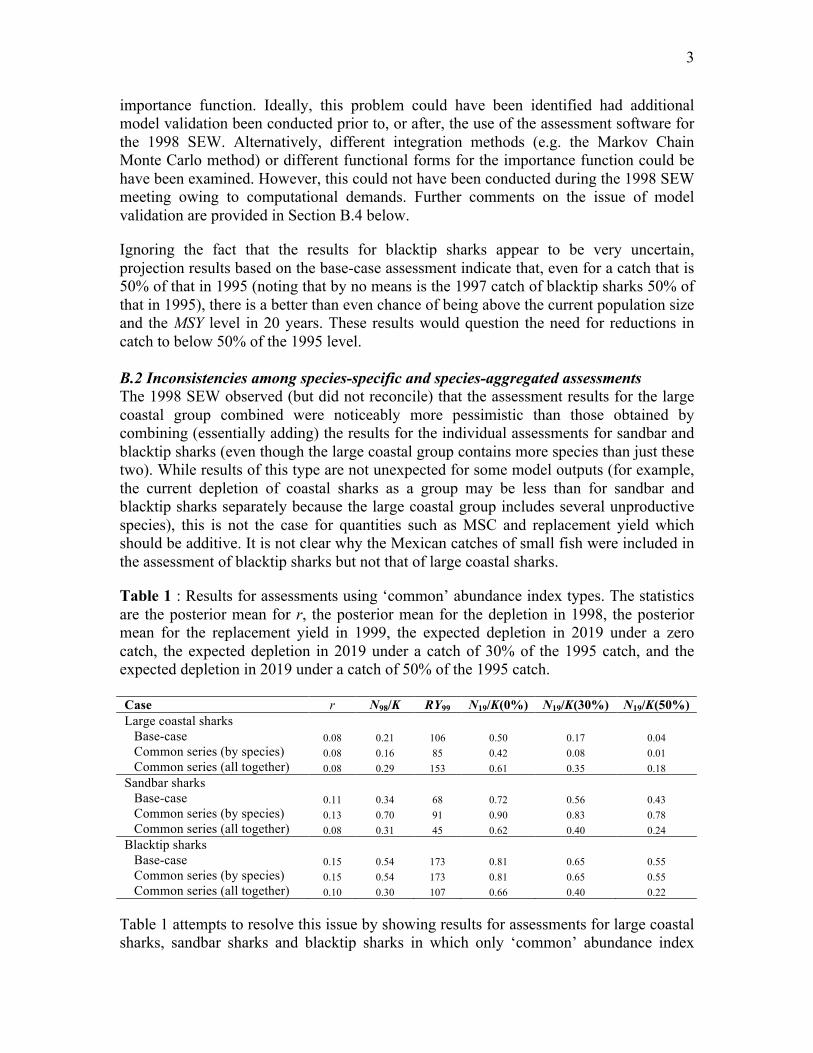
Ignoring the fact that the results for blacktip sharks appear to be very uncertain, projection results based on the base-case assessment indicate that, even for a catch that is 50% of that in 1995 (noting that by no means is the 1997 catch of blacktip sharks 50% of that in 1995), there is a better than even chance of being above the current population size and the MSY level in 20 years. These results would question the need for reductions in catch to below 50% of the 1995 level. B.2 Inconsistencies among species-specific and species-aggregated assessments The 1998 SEW observed (but did not reconcile) that the assessment results for the large coastal group combined were noticeably more pessimistic than those obtained by combining (essentially adding) the results for the individual assessments for sandbar and blacktip sharks (even though the large coastal group contains more species than just these two). While results of this type are not unexpected for some model outputs (for example, the current depletion of coastal sharks as a group may be less than for sandbar and blacktip sharks separately because the large coastal group includes several unproductive species), this is not the case for quantities such as MSC and replacement yield which should be additive. It is not clear why the Mexican catches of small fish were included in the assessment of blacktip sharks but not that of large coastal sharks.
Table 1 : Results for assessments using ‘common’ abundance index types. The statistics are the posterior mean for r, the posterior mean for the depletion in 1998, the posterior mean for the replacement yield in 1999, the expected depletion in 2019 under a zero catch, the expected depletion in 2019 under a catch of 30% of the 1995 catch, and the expected depletion in 2019 under a catch of 50% of the 1995 catch. Case N98/K RY99 N19/K(0%) N19/K(30%) N19/K(50%) Large coastal sharks
Base-case 0.08 0.21 106 0.50 0.17 0.04 Common series (by species) 0.08 0.16 85 0.42 0.08 0.01 Common series (all together) 0.08 0.29 153 0.61 0.35 0.18
Sandbar sharks
Base-case 0.11 0.34 68 0.72 0.56 0.43 Common series (by species) 0.13 0.70 91 0.90 0.83 0.78 Common series (all together) 0.08 0.31 45 0.62 0.40 0.24
Blacktip sharks
Base-case 0.15 0.54 173 0.81 0.65 0.55 Common series (by species) 0.15 0.54 173 0.81 0.65 0.55 Common series (all together) 0.10 0.30 107 0.66 0.40 0.22
Table 1 attempts to resolve this issue by showing results for assessments for large coastal sharks, sandbar sharks and blacktip sharks in which only ‘common’ abundance index

4
types (pelagic logs, early MRFSS, late MRFSS, shark observer, NMFS LL NE, NMFS LL SE) are used in the assessment. The reason for conducting these analyses is to distinguish the impact of the choice of indices for use in the assessment from that of the other choices (priors, catches). Two variants of this approach are examined: (a) using the ‘common’ abundance index types by species (i.e. the sandbar indices were used in the assessment of sandbars), and (b) using the ‘common’ abundance index types for sandbars and blacktips in each assessment (i.e. the abundance indices for each assessment were the same 12 series).
Arguably, the most notable result in Table 1 is that only when the data for large coastal sharks is replaced by those for sandbar and blacktip sharks (rows ‘Common series (all together)’ in Table 1) do the results become consistent (in the sense, for example, that the sum of the replacement yield estimates for sandbar and blacktip sharks is close to the replacement yield estimate for large coastal sharks). The decline rates inferred directly from the abundance indices for large coastal sharks as a group are more rapid than for sandbar and blacktip sharks (Table 2) suggesting that the differences in results for large coastal sharks from those for sandbar and blacktip sharks arise due to the inclusion of data for other (presumably less productive) species in the former indices. Table 2: Slope of the logarithm of six ‘common’ abundance index types on year.
Series Large coastal Sandbar Blacktip Shark Observer 0.146 0.498 -0.057 Pelagic logs* -0.128 0.277 -0.142 Early Rec -0.058 -0.127 0.096 Late Rec -0.110 0.140 -0.115 NMFS LL NE -0.076 -0.075 -0.004 NMFS LLNE -0.238 -0.009 0.044 * Series length different among species groups.
B.3 Sensitivity tests The 1998 SEW did not adequately examine the sensitivity of the results to changing the specifications of the assessment (although sensitivity to some assumptions was examined in SB-IV-26). This is surprising given the nature of the management implications of the base-line results, the fact that a new method was being applied, and the observation that the model does not fit the data well for the last years of the assessment period.
It is standard to conduct sensitivity tests as part of assessments. Such sensitivity tests would examine the implications of changing data set choices, weighting schemes and other aspects of the assessment. This review examines some aspects of this sensitivity and, generally, finds it to be relatively minor given the management implications, at least for sandbar sharks and large coastal sharks as a group. Nevertheless, the lack of sensitivity tests in the 1998 SEW should be considered to be weakness that must be rectified in future assessments.

5
B.4 Simulation analyses The use of Bayesian assessments in fisheries is becoming increasingly common while production models have formed the basis for assessments for several decades. Nevertheless, the method used for the 1998 SEW is novel in several respects. I gather than the basic approach has been used for other assessments. Nevertheless, there is a need to provide evidence that the method can, given appropriate data, provide reasonable estimates. This, along with validation of the software implementing the assessment approach, should be considered a minimum for its use.
Sometimes it is necessary to run software that has not been fully validated during assessment meetings given lack of time. However, checking the model implementation should, at least, have been conducted following the 1998 SEW. Given the fact that the computer program can be run very rapidly (far more so than for methods such as Stock Synthesis), it would seem relatively straightforward to examine the performance of the assessment approach by means of simulation. It seems likely that this would have detected the problem with the numerical integration scheme for the application to blacktip sharks.
C. Questions C.1 The analytical models applied C.1.1 The appropriateness of the Bayesian methods used in evaluating population
status Bayesian methods are being used increasingly for fisheries stock assessment. As reviewed in SB-IV-26, there are several reasons for basing management advice on the results of a Bayesian analysis. Primary among these are that the assessments can make use of ‘auxiliary’ information (in the case of this assessment, the information on intrinsic growth rate from demographic studies) and that the output from a Bayesian analysis is theoretically the ideal basis for a decision analysis to evaluate the consequences of alternative management actions. Given that there is considerable uncertainty regarding productivity, use of Bayesian methods for stock assessment in this case seems appropriate.
Although the use of Bayesian methods seems appropriate for this assessment, it is still necessary to select the priors to be used carefully and to examine sensitivity to different prior choices. Probably the most important prior is that for the rate of intrinsic growth, r. Unfortunately, the approach used to develop a prior for r for the 1998 SEW is not well documented. The mean of the prior for r appears to be the upper limit of the distribution obtained from the demographic model while the CV is taken from SB-IV-26. Sensitivity to the assumed mean of the prior for r is reported in SB-IV-26, but similar results are not provided in the 1998 SEW. This is unfortunate because the results (and hence management advice) would be sensitive to the mean of the assumed prior as the data are not very informative about the value for r (the posterior CV is usually very similar to the prior CV). Sensitivity to the width of the prior for r is also not explored in either the 1998 SEW or SB-IV-26. Table 3 shows results obtained by halving the CV of the prior for r (rows ‘lower CV for r prior’). Decreasing the width of the prior for r leads to larger values for expected replacement yield but qualitatively similar projection results.

6
Another choice when conducting a Bayesian assessment is upon which parameters should priors be placed. The 1998 SEW is based on placing priors on r, K, z and C0. This is certainly one appropriate choice of parameters on which to place priors. Table 3 shows the results of placing priors on current (1999) numbers and on the depletion in 1999 instead of on K. The priors assumed for these quantities are ‘uninformative’ following the rationale for the prior assumed for K in the 1998 SEW (see Appendix C for details). This table also lists results for the post-model-pre-data distribution (the ‘posterior distribution’ that arises when the abundance indices are ignored – essentially the combined impact of the prior, the model and the historical catches). The post-model-pre-data distribution suggests higher values for r and less depleted resources. The impact of including the abundance indices is therefore to downweight the more optimistic values for r and thus current depletion. Placing ‘uniformative’ priors on current numbers or current depletion leads to higher values for current replacement yield and to slightly more optimistic projections for sandbar and large coastal sharks as a group but to lower current replacement yield and to less optimistic projections for blacktip sharks. The results for blacktip sharks are therefore sensitive to the choice of the parameter that scales the population. NMFS should develop guidelines to ensure that adequate examination of parameter choices occurs when conducting Bayesian assessments.
Table 3 : Results (see Table 1 for details) for assessments in which the prior distributions are varied. Case N98/K RY99 N19/K(0%) N19/K(30%) N19/K(50%) Large coastal sharks
Base-case 0.08 0.21 106 0.50 0.17 0.04 Post-model-pre-data-distribution 0.13 0.52 268 0.79 0.64 0.55 Lower CV for r prior 0.10 0.21 134 0.62 0.23 0.04
Uniform prior on 0.10 0.19 112 0.53 0.18 0.04
Uniform prior on 0.10 0.21 119 0.56 0.22 0.06 Sandbar sharks
Base-case 0.11 0.34 68 0.72 0.56 0.43 Post-model-pre-data-distribution 0.12 0.73 90 0.89 0.82 0.78 Lower CV for r prior 0.12 0.35 74 0.78 0.61 0.46
Uniform prior on 0.23 0.26 102 0.79 0.65 0.54
Uniform prior on 0.28 0.30 116 0.84 0.72 0.63 Blacktip sharks
Base-case 0.15 0.54 173 0.81 0.65 0.55 Post-model-pre-data-distribution 0.15 0.63 202 0.87 0.77 0.69 Lower CV for r prior 0.14 0.55 196 0.88 0.70 0.58
Uniform prior on 0.16 0.31 122 0.74 0.46 0.27
Uniform prior on 0.16 0.36 137 0.77 0.52 0.35
It should be noted that the assumption of a lognormal prior distribution for r implies that values for r that are probably implausible for a closed population of large coastal sharks (e.g. > 0.2) are nevertheless plausible a priori. The posterior distribution for r therefore includes values that are probably implausibly high for a closed population (see Fig 2 of SB-IV-26). One way to use the demographic information in a more direct way would be

7
within an age (or stage) structured model because such a model includes the parameters used to determine the rate of increase at low population size (SB-IV-10). Such an approach has been used for the assessment of the Bering-Chukchi-Beaufort Seas stock of bowhead whales as well as that of the Eastern North Pacific stock of gray whales by the International Whaling Commission (IWC, 1998, 1999).
C.1.2 The appropriateness of the non-age-structured methods used to estimate status of shark populations;
Papers that applied several analytical frameworks were submitted to the 1998 SEW: an age-aggregated production model (based on the Prager formalism; SB-IV-26; SB-IV-27; SB-IV-41), an age-structured production model (SB-IV-21), stage-structured models (SB-IV-4; SB-IV-9), and demographic models (SB-IV-10). The demographic models formed the basis for the development of priors for the intrinsic growth rate, r, while the results of the stage-structured model confirmed that shark species are more vulnerable to overexploitation than teleosts. The reasons for not considering the age-structured production model approach (SB-IV-21) further are not given but should have been. The production model assessment approach used for the 1998 assessment is, in my opinion, a definite improvement on previous production model assessment approaches owing to the inclusion in the assessment of the information on the constraints imposed by the demographics of shark populations.
There is limited information available on the size-structure of the catches by the different sectors and consequently on the selectivity of the different fishing fleets and when conducting surveys. However, it is known for other shark fisheries that the selectivity patterns for different fleets and surveys cannot automatically be assumed to be identical (for example, Kirkwood and Walker, 1986). SB-IV-21 assumes different selectivity patterns for sandbar sharks caught commercially and recreationally. Furthermore, it seems clear that the recent increase in abundance for some abundance index-types (e.g. the Virginia longline surveys) is attributable more to increases in the number of juveniles than to that of adults (see Figure 8 of SB-IV-13). In contrast, the age-aggregated production model implicitly assumes that all the indices are representative of the component of the population that is being harvested.
The standardized residuals about the fits to the baseline model (Figure 1) are very similar among species after 1993. As also highlighted in the Industry Position paper, the model suggests a strong downward trend whereas the data are not as indicative of a decline (though many of the indices are declining over the period). This raises the question of whether the age-aggregated production model is too simple to represent the dynamics of this shark resource.
Although beyond the scope of this review, it seems that there would be merit in implementing an age- (or stage-) structured model to better capture differences in selectivity (gear-types within the fishery and survey types). This would permit indices (such as that based on the Virginia longline survey) to be partioned into ranges of ages and each of these to be fitted separately. This may enable the model to fit the trends for indices of juvenile and adult abundance separately. The use of an age- (or stage-) based model would also permit direct use of the demographic data in the analyses (see Section

8
C.1.1 of this report). Any age-structured assessment model will need to be simple (for example, perhaps simply an age-structured production model) but improved fits to the data should be possible even so. An additional advantage of an age-based model is that account can be taken of the time-lags inherent in the dynamics of long-lived species.
Figure 1 : Average standardized residuals for the base-case assessment. The average residuals are obtained by first standardizing the residuals by dividing them by them by their assumed standard errors, then averaging them across abundance index types, and finally integrating these averages over the posterior distribution.
In conclusion, the 1998 SEW had a good reason (lack of length- and age-composition data) for selecting an age-aggregated production model approach as the basis for the assessment. However, the use of an age-aggregated production model may lead to biased results (as may be suggested by Figure 1). Therefore, I believe that it is necessary to confirm that an age- (or size-) structured model, when provided with essentially the same basic data, would lead to qualitatively and quantitatively the same results and management advice as the current assessment. An assessment based on an age- (or sized-) structured model could also form the basis for the simulation evaluation of the production model assessment approach referred to in Section B.4).

9
C.1.3 The appropriateness of the weighting of the various indices of abundance for the different ages and species/stocks of shark
The weights assigned to the different abundance index types (and to years within a single time series) for assessments in which there are multiple indices, some of which appear to be in conflict, can have a large impact on the qualitative outcomes from an assessment. The impact can be at the level of the best estimates or the uncertainty about those estimates, and hence the outcomes from a risk analysis. The assessment of large coastal sharks is an instance in which there are multiple conflicting indices. Some of this conflict may be resolved by adopting a modeling framework that accounts for the age/size selectivity of the gear on which each index is based. However, it is likely that some level of conflict is inevitable.
The aim of the current weighting scheme is to give greatest weight to the index type with the lowest variance. The ‘index with the lowest variance’ is a proxy for the ‘the most reliable index’, although there is no guarantee that a precise index is necessarily a reliable index (for example, one that is related linearly to abundance). Unfortunately, there is no basis I know of to identify whether a particular abundance index is related linearly to abundance.
The 1998 SEW assessment was based on inverse variance weighting. Whether the chosen weighting scheme is particularly important in the context of the management advice depends on whether or not alternative (but nevertheless rational) weighting schemes give qualitatively different results. Table 4 therefore lists the values for six management-related quantities for the base-case weighting scheme and two alternative schemes (see Appendix C for the specifications for these schemes).
Table 4 : Results (see Table 1 for details) for the base-case and two other weighting schemes. Case N98/K RY99 N19/K(0%) N19/K(30%) N19/K(50%) Large coastal sharks
Base-case 0.08 0.21 106 0.50 0.17 0.04 Linear weights 0.15 0.28 192 0.78 0.50 0.26 Equal weights 0.11 0.21 130 0.59 0.25 0.08
Sandbar sharks
Base-case 0.11 0.34 68 0.72 0.56 0.43 Linear weights 0.07 0.03 28 0.15 0.06 0.03 Equal weights 0.11 0.29 62 0.68 0.50 0.36
Blacktip sharks
Base-case 0.15 0.54 173 0.81 0.65 0.55 Linear weights 0.12 0.51 159 0.81 0.65 0.51 Equal weights 0.20 0.78 248 0.96 0.91 0.87
The results in Table 4 (and Table 1 of Appendix C) indicate that the results are sensitive to the choice of weighting scheme. The effect of different weighting schemes (in terms of the difference in results from those for the base-case assessment) is smallest for large coastal sharks as a group. However, this effect is very large for sandbar and blacktip sharks. It is notable that, even for large coastal sharks as a group, changing the weighting scheme can have a large impact on the replacement yield estimate and the results of the

10
projections. It was not possible to examine the diagnostics for the assessments based on different weighing schemes in detail, so the results in Table 4 should be considered to be illustrative rather than definitive.
The illustrative results in Table 4 indicate that the choice of weighting scheme is important. This, combined with the lack of comment in the 1998 SEW report on the merits of alternative weighting schemes, indicates a need for additional work in this area.
C.1.4 The reliability of the estimates of current biomass, recent trends, and demographic structure
The reliability of these estimates depends on the choice of abundance index types, the model applied to those data, and the weights assigned to different index types. SEW 1998 examined recent trends in abundance explicitly using the slopes of the abundance indices regressed on year and implicitly internally to the production model. The latter trends form the basis for the risk analysis. The recent regressions (Table 6 of SEW 1998) provide equivocal evidence regarding rebuild potential (some indices showing sharp increases with others exhibiting sharp decreases). Reasons for inconsistencies among the trends vary but include whether the indices all measure the same population component and whether they are related linearly to abundance. The second assumption is difficult to assess for any species, particularly for sharks for which information is particularly sparse. The former assumption will be violated to some extent because the various indices are based on different gear-types. The data for the Virginia longline surveys have been partitioned into catch-rates by size-class. These data show clearly that the trends for different size (age)-classes cannot be assumed to be the same. In contrast to the results based on the regression through the indices, the fits of the production model indicate that there is a very high probability that the number of fish dropped from 1993 to 1998 (Appendix, Table 1).
Table 5 examines the implications of changing the assumption that the fishery started in 1974 (row ‘start in 1969’) and the assumption that MSC occurs at half of carrying capacity (row ‘µ=2.39’). Neither of these changes has a particularly marked impact on the results of the assessment.
Table 5 : Results (see Table 1 for details) for assessments in which some of the structural assumptions of the assessment are modified. Case N98/K RY99 N19/K(0%) N19/K(30%) N19/K(50%) Large coastal sharks
Base-case 0.08 0.21 106 0.50 0.17 0.04 Start in 1969 0.08 0.19 107 0.49 0.17 0.04 µ=2.39 0.07 0.21 97 0.56 0.15 0.02
Sandbar sharks
Base-case 0.11 0.34 68 0.72 0.56 0.43 Start in 1969 0.11 0.31 71 0.68 0.52 0.41 µ=2.39 0.09 0.37 75 0.80 0.64 0.50
Blacktip sharks
Base-case 0.15 0.54 173 0.81 0.65 0.55 Start in 1969 0.16 0.54 180 0.82 0.66 0.55 µ=2.39 0.15 0.65 195 0.91 0.77 0.67
11
In conclusion, the results are not sensitive to most of the factors examined but are sensitive to the scheme used to weight the abundance index types. The estimates of current biomass and trends should therefore be considered to be less reliable than implied by the 1998 SEW.
C.1.5 The reliability of population projections from the assessment results The approach used to conduct the population projections is based on standard methodology. The reliability of the projections depends on: (a) the extent to which the production model is able to capture the dynamics of the population, and (b) the reliability of the underlying assessments. Therefore, the reliability of the projections depends on the extent to which the age-aggregated model and the abundance indices are adequate. Comments on these issues are provided in other sections of this review. One aspect of the projections that should be changed in future is the implicit assumption that any reductions in catch commence immediately (1999 for the 1998 SEW). In reality, there is likely to be some delay in implementing reductions in catches. Consequently, given a particular risk criterion, the size of the reduction in catch that is needed if reductions are not implemented immediately is under-estimated.
C.2. The quantity and quality of data for assessment purposes The key data sources available for assessment purposes are the estimates of removals and the indices of abundance. Limited information is also available on the size-structure of the catch for some of the abundance index types, but this information was not used in the 1998 assessment.
The information on catches by U.S. fishers is highly uncertain, even for recent years (for example, almost 20% of the 1996 and 10% of the 1997 catch is unclassified shark – SB-IV-12), while information on Mexican catches is even more limited. In addition, there is considerable uncertainty regarding the conversion from catch-in-weight to catch-in-number. The figures in SB-IV-12 appear to have been revised so that the information on average size from the observers is weighted by the expected catch rather than being computed from the raw data. However, the estimates of average weight remain highly uncertain and based on very sparse data. I recommend that efforts be made to improve estimates of mean size if future assessments are to be based on models fitted to catch-in-numbers. It is possible to fit (age based) models to catch data where, for some fleets, the catch is reported in weight (in this case, the commercial fleet) and where for others the catch is reported in numbers (in this case, the recreational fleet). Given the uncertainty regarding the catch-in-numbers, conducting assessments where the catch data are in the form of catch-in-weight seems appropriate. For such assessments, the available estimates of the mean weight of the catch could form part of the data to which the model is fitted. The GLM approach is used to standardize the catch and effort data for some of the abundance index types (SB-IV-5, SB-IV-11). However, no attempt seems to have been made to examine whether there are significant / substantial interaction terms. In particular, no attempt seems to have been made to identify year*area interactions. Such interactions would be expected if different age-classes are found in different areas, as is the case for several other shark fisheries (e.g. Punt et al., 2000). The results of the GLM

12
standardizations also did not include standard diagnostics (for example, plots of residuals) to enable the analyses to be evaluated adequately. All of the numbers-based abundance indices have been included in the assessments. Some of these are very short. Table 6 shows results for assessments in which the abundance index types that consist of fewer than five data points are omitted from the assessment to examine the implications of making use of these very ‘short’ series. Table 6 also shows results for analyses in which the two MRFSS series are omitted from the assessment. The results for sandbar and large coastal sharks are not sensitive to inclusion (or otherwise) of these series. However, the results for blacktip sharks are sensitive to excluding ‘short’ series and particularly the MRFSS series.
The Industry Position Paper highlights some uncertainties regarding the VIMS fishery-independent survey. Table 6 therefore shows results in which the VIMS index is ignored and in which those data points for this index with an assumed CV of 1 are omitted from the analysis. The results for blacktip sharks are independent of assumptions regarding the VIMS index as this index is not included in the blacktip assessment while the results for large coastal sharks as a group are also insensitive to the treatment of this index. In contrast, the results for sandbar sharks are highly sensitivity to the inclusion of the VIMS index. Somewhat surprisingly, the results for sandbar sharks are even somewhat sensitive to how the data points for which CVs are not available are dealt with. This highlights the need for this index to be analyzed further (perhaps standardized as suggested in the Industry Position Paper).
Table 6 : Results (see Table 1 for details) for assessments in which some of the abundance index types are omitted from the assessment. Case N98/K RY99 N19/K(0%) N19/K(30%) N19/K(50%) Large coastal sharks
Base-case 0.08 0.21 106 0.50 0.17 0.04 Less ‘short’ series 0.08 0.23 118 0.53 0.22 0.07 Less MRFSS series 0.09 0.20 109 0.51 0.17 0.05 Less VIMS Survey 0.08 0.19 96 0.46 0.13 0.03 Less CV=1 VIMS data 0.08 0.21 106 0.50 0.17 0.04
Sandbar sharks
Base-case 0.11 0.34 68 0.72 0.56 0.43 Less ‘short’ series 0.11 0.35 64 0.71 0.54 0.41 Less MRFSS series 0.11 0.39 67 0.74 0.58 0.45 Less VIMS Survey 0.13 0.64 85 0.88 0.79 0.72 Less CV=1 VIMS data 0.12 0.38 70 0.75 0.60 0.48
Blacktip sharks
Base-case 0.15 0.54 173 0.81 0.65 0.55 Less ‘short’ series 0.14 0.46 147 0.75 0.53 0.42 Less MRFSS series 0.12 0.37 122 0.68 0.44 0.32 Less VIMS Survey 0.15 0.54 173 0.81 0.65 0.55 Less CV=1 VIMS data 0.15 0.54 173 0.81 0.65 0.55

13
C.3. The support for and consequences of assumptions made about whether the shark stocks represent open or closed populations. The 1998 SEW acknowledges that one of the assumptions of the production model assessment approach is that it assumes (implicitly) that the population is closed (i.e. the catches included in the assessment represent the only removals from the population and mixing is sufficiently complete among any sub-components of the population so that it behaves as a single homogenous unit). Some tagging work has been conducted (for example, SB-IV-13, SB-IV-24, SB-IV-28). However, tagging has tended to focus on juveniles so does not provide much information with which to judge the support for (or against) the assumption of a closed population. There are clearly catches of large coastal sharks off Mexico and these undoubtedly impact the status of the shark resource harvested off the U.S. Atlantic and Gulf of Mexico coasts, but it is clear that the magnitude of these catches is poorly known.
In principle, it is possible to examine the consequences of the violation of the closed population assumption by allowing the intrinsic growth rate parameter to exceed the maximum plausible value given the demographics of the population. No bounds are placed on the intrinsic growth rate parameter when conducting the base-case analyses, so this possibility is already accounted for. However, the mean of the posterior for r is not noticeably larger than the mean of its prior, suggesting that the data do not provide evidence for substantial immigration effects.
Another way to examine the open vs. closed population issue is to construct alternative models that explicitly represent alternative assumptions about population structure. Table 7 examines one such alternative model. This model assumes that the resource consists of two sub-populations, only one of which is fished. Mixing occurs between the fished and unfished populations. If the data supported higher increase rates (caused by migration of individuals into the ‘fished’ population), this speculative model should account for this. The projection results for the ‘with mixing’ sensitivity test are more optimistic that those for the base-case analyses. However, they are not qualitatively different from those for the base-case analyses, and it seems likely that the same management recommendations would have been made had the assessment been based on this more complicated model. It should be noted that the results in Table 7 are based on using an age-aggregated model – further analyses along these lines could be based on a more complicated modeling framework.

14
Table 7 : Results (see Table 1 for details) for the base-case assessment and a sensitivity test in which it is assumed that there are two shark populations linked by mixing. Case N98/K RY99 N19/K(0%) N19/K(30%) N19/K(50%) Large coastal sharks
Base-case 0.08 0.21 106 0.50 0.17 0.04 With mixing 0.08 0.21 98 0.54 0.23 0.07
Sandbar sharks
Base-case 0.11 0.34 68 0.72 0.56 0.43 With mixing 0.10 0.26 31 0.86 0.70 0.58
Blacktip sharks
Base-case 0.15 0.54 173 0.81 0.65 0.55 With mixing 0.15 0.58 156 0.85 0.70 0.61
In conclusion, there is no strong evidence in the data (given the current modelling framework) to support a severe violation of the closed population assumption. However, the direct evidence for this assumption is weak and emphasis should be placed in future on tagging large specimens to examine movement dynamics. Future tagging programmes should emphasize ‘fishery-independent’ approaches (for example, satellite / archival tagging). These approaches can be applied successfully to sharks and can provide information about movement to locations where fishing intensity may not be particularly high.
C.4. The degree to which the scientific conclusions and management recommendations in the assessment documents are supported by the analytical results I restrict my comments in this section to those management recommendations that could have been based on the analytical results rather than those (for example, prohibited species) that are primarily management issues. C.4.1 Total Allowable Catch The 1998 SEW recommended: substantial reductions in catches of large coastal species exclusive of sandbar and blacktip sharks, small reductions in the catches of sandbar sharks, and large reductions in the catches of blacktip sharks. All three of these recommendations follow naturally from the results presented in the 1998 SEW. Qualitatively, they also follow from the base-case analyses included in Appendix C, although the extent of reduction needed for sandbar sharks so that the expected depletion in 2019 equals 0.5 is smaller than would be inferred from the results for the 1998 SEW while the base-case results for blacktip sharks do not indicate a need for further reductions in catch below 50% of the 1995 catch. The last result needs, however, to be interpreted in the context of the considerable sensitivity of the results for blacktip shark to, for example, data set choices. All of the analyses reported in this review confirm the need for large reductions in the catches of species other than blacktip and sandbar sharks. It should be noted that, for several of the analyses (including the base-case), even a complete cessation of the fisheries on these other species will not guarantee recovery to 0.5K in 20 years.

15
It is generally necessary to consider a wide range of alternative models and several data set choices when conducting assessments. The current assessment is weak in this regard because the only sensitivity examined was that to the choice of catch series.
C.4.2 Minimum sizes The rationale for minimum sizes includes reduced targeting, and that younger animals are ‘more vulnerable’ (SB-IV-4 and SB-IV-9). I would prefer to see the evaluation of minimum sizes more tightly coupled with that of the impact of catch limits, which may have led to a different conclusion than that drawn in SB-IV-4 and SB-IV-9. This could have been accomplished had the assessment been based on an age- (or size-) structured model. Unfortunately, the models on which SB-IV-4 and SB-IV-9 are based may differ demographically those that would arise if an age- or size-structured model were fitted formally to the catch and abundance index information. C.5. The degree to which the assessment methods and the advice on management took account of effects of current management regulations on population trajectories The most common consequence of changed management arrangements is changed fishing practices (target species, where and when fished). This can lead to changes (unrelated to abundance) in the size-composition of the catch as well as in the relationship between catch rate and abundance. In the absence of data to quantify directly the impact of changed fishing practices, it is common to split the abundance series based on commercial and recreational fishing when the changes to the management arrangements occurred, to omit the data from commercial and recreational operators following changes in management arrangements, or to base the assessment on data from fishery-independent surveys only. The data from the MRFSS survey programme used in the SEW 1998 assessment are split in 1993 to ‘reflect that bag limits for recreational fisheries came into existence in 1993’. However, the same rationale was not used to split other series that may have been impacted by changes in management arrangements. For example, the Industry Position Paper indicates that one consequence of the 1993 management arrangements was the elimination of large vessels directing towards sharks and this would impact the commercial catch rate indices unless the effect of vessel size is corrected for. Table 8 contrasts the results for the base-case analysis with those in which the data used for management purposes are modified according to the three options listed above. The row ‘split all post-93 comm/rec data’ shows results when the commercial and recreational index types than span 1993 are split in 1993, the row ‘ignore post-93 comm/rec data’ shows results when the data for the index types based on commercial and recreational data are truncated in 1992, and the row ‘fishery-independent series only’ shows results when the assessment is based on fishery-independent data only. It should be noted when interpreting the results in Table 8 that the amount of data used in the assessment decreases as one moves from ‘base-case’ to ‘fishery-independent series only’.
The results for the large coastal group are sensitive to the selection of abundance index types and the treatment of the post-1993 data; the results for sandbar sharks become less optimistic while those for blacktip sharks and large coastal sharks as a group become more optimistic. The former occurs because two of the series showing the largest

16
increases for sandbar sharks are based on commercial data (shark observer and pelagic logs). In contrast, ignoring the recent commercial and recreational series for blacktip sharks eliminates all but the early MRFSS data and the two NMFS surveys. The trend for the former series is increasing (the fit to this series has always been very poor – see Figure 4.6 of the 1998 SEW), while the two NMFS surveys suggest trends close to zero.
Table 8: Results (see Table 1 for details) for the base-case assessment and the sensitivity tests in which the data after 1993 are treated differently. Case N98/K RY99 N19/K(0%) N19/K(30%) N19/K(50%) Large coastal sharks
Base-case 0.08 0.21 106 0.50 0.17 0.04 Split all post-93 comm/rec series 0.08 0.28 143 0.60 0.33 0.14 Ignore post-93 comm/rec data 0.09 0.31 163 0.65 0.40 0.21 Fishery-independent series only 0.09 0.23 130 0.57 0.25 0.10
Sandbar sharks
Base-case 0.11 0.34 68 0.72 0.56 0.43 Split all post-93 comm/rec series 0.11 0.34 68 0.72 0.56 0.43 Ignore post-93 comm/rec data 0.09 0.27 48 0.62 0.40 0.25 Fishery-independent series only 0.10 0.31 52 0.65 0.45 0.31
Blacktip sharks
Base-case 0.15 0.54 173 0.81 0.65 0.55 Split all post-93 comm/rec series 0.15 0.54 173 0.81 0.65 0.55 Ignore post-93 comm/rec data 0.22 0.79 252 0.97 0.92 0.88 Fishery-independent series only 0.17 0.70 220 0.92 0.83 0.77
The results in Table 8 show that use of recent commercial / recreational data may be providing a misleading impression of current status. However, the differences from the base-case analysis evident in Table 8 may also be attributable partly to the reduction in the amount of data available for assessment purposes. Nevertheless, examining sensitivity to how data are treated following changes in management actions should be a routine part of stock assessments.
C.6. The degree to which the assessment methods and the advice on management took account of the risks to the resource of maintaining status quo management versus the costs to industry of immediate reductions in permitted landings of large coastal sharks The assessment included projections based on what amounts to the current catch limit (i.e. 50% of the 1995 catch) and lower catch limits. However, no projections were conducted in which the catches were kept at current levels for some years and then reduced. The necessary extent of (further) reduction in catch needed to achieve a desired management goal could then form the basis for an evaluation of the impact of delaying (additional) management actions.
These calculations could have been conducted easily given the assessment framework. However, without a clear specification for the management goal (i.e. a risk criterion), these calculations are extremely open-ended. The risk criterion needs to include a specific year by which the management goal is to be achieved to avoid the ‘moving window’ problem, where the year in which the management goal is to be achieved changes each time a new assessment is conducted.

17
D. Recommendations 1. Reviewing this assessment was made difficult for several reasons. Consideration
should be given to making the following standard practice when reporting assessment results:
• An appendix should be included in the report detailing the assessment if the method of assessment differs in detail from that described in the background documents. Consideration should be given to adopting the common PFMC practice of including the code and data files as appendices to assessment reports.
• If the detailed derivation of an abundance index is not reported in the background documents, appendices to the assessment report should document how these were constructed from the raw data supplied.
2. The following generic stock assessment-related recommendations arise from this review:
• NMFS should consider developing guidelines for examining sensitivity to the choice of parameters on which priors are placed.
• Sensitivity should be conducted to the choice of the prior distribution, particularly when the data are relatively uninformative.
• It is necessary to clearly document the basis for the weighting scheme when assessments are based on several (possibly conflicting) abundance index types, and NMFS should provide guidelines for a standard range of weighting schemes to consider in assessments (even though an assessment team may prefer one weighting scheme over the alternatives).
• Sensitivity should be considered routinely to the treatment of data following major changes in management arrangements.
• Standards should be established for the presentation of results of GLM standardizations of catch and effort data.
• The software implementing new stock assessment methods should be validated prior to use (or, if this is not possible, as soon as possible thereafter). Such validation could include re-coding the model using a different programming language, preferably by someone other than the developer of the original software, and changing the numerical methods used, for example, for Bayesian integration (if these are not based on standard packages such as Splus, ADModel Builder and SAS). This should both improve confidence in the numerical results and check that the method is fully specified.
• New stock assessment methods should (if this is computationally feasible) be evaluated by means of simulation to determine their properties.
3. The following recommendations apply specifically to the assessment of (and management advice for) large coastal sharks.
• Consideration should be given to moving to an age- (or size-)based assessment framework because: (a) better account can be taken of the information (and uncertainty) about biological parameters, (b) the impact of gear selectivity can be assessed, and (c) indices for different population components can be included in the assessment.
• The sensitivity of the assessment to the choice of weighting scheme needs to be examined in greater detail than was possible in this review. If the weighting

18
scheme adopted by the 1998 SEW will continue to be used, it is necessary to provide reasons why it is preferable to alternative weighting schemes.
• It is almost never appropriate to present only one or two assessment scenarios. This review has highlighted a number of sensitivity tests (SB-IV-26 also considered a broader range of sensitivity tests than the 1998 SEW). Future assessments of large coastal sharks should be based on attempting to capture a fuller range of model uncertainty although this may necessitate modifying the approach used to present results (e.g. by using decision tables).
• Tagging of large individuals (perhaps using satellite or archival technology) should be considered if more resolution regarding the open versus closed population assumption is required.
• The evaluation of minimum size limits should be based on the same assessment model that is used to provide advice on catch limits to enable the interactions among the choice for catch limits and minimum sizes to be examined.
• Increased emphasis must be placed on collecting information from which the mean weight of the catch can be estimated, if models based on catch-in-number are to form the basis for future assessments. Furthermore, efforts should be made to estimate catches of large coastal sharks in other jurisdictions because, at present, it is not possible to conduct assessments that include harvesting in other jurisdictions due to a lack of catch data.
• Sensitivity should be conducted to using an assessment approach where the input data are the catches-in-weight.
E. Conclusions All of the assessments that I have been associated with are uncertain to some extent and all could be improved through additional research. All assessments are forced to make certain assumptions (e.g. that the population parameters do not change over time) that can never be validated but are accepted by the general scientific community as being appropriate when conducting stock assessments.
Even given uncertainty, there are usually conclusions from stock assessments that are robust. For the current assessment, the conclusion that large coastal sharks are overexploited and that large reductions in the catches of species other than sandbar and blacktip sharks are needed to achieve recovery to BMSY appear to be robust. However, the need for and magnitude of reductions in the catches of sandbar and blacktip sharks appear to depend on which abundance index types are used in the assessment and how these are weighted. Unfortunately, the 1998 SEW did not justify its approach to weighting nor why it included most of the available abundance index types in the assessments.
Production models are not very flexible stock assessment methods and this appears to be highlighted by the inability to mimic recent trends in the abundance indices. The impact of this in the context of the current assessment is difficult to determine. Therefore, confirmation of the conclusions of the 1998 SEW using a somewhat more flexible approach (such as an age- or sized-based model) is important.

19
The difficulties replicating the base-line results for blacktip sharks and the sensitivity to the weighting scheme and the data set choices forces me to the conclusion that at present I do not find that the scientific conclusions and scientific management arrangement recommendations contained in the 1998 SEW Report are based on scientifically reasonable uses of appropriate fisheries stock assessment techniques and the best available (at the time of the 1998 SEW Report) biological and fishery information relating to large coastal sharks.
However, I wish to emphasize that (a) I do believe the data used for the assessment reflected the best available at the time and (b) that with some additional work (in particular the validation of the stock assessment method and examination of sensitivity to alternative model structures that better fit recent trends in the data) I do believe that the results from the types of methods employed would be considered to be scientifically reasonable. This implies that had I been able to replicate the results from the 1998 SEW and had the 1998 SEW report contained a fuller justification for the weighting scheme employed, then, taking due consideration of uncertainty, I would have concluded that the scientific conclusions and scientific management arrangement recommendations contained in the 1998 SEW Report were based on scientifically reasonable uses of appropriate fisheries stock assessment techniques. F. Additional material referenced International Whaling Commission. 1998. Report of the Scientific Committee, Annex J
Report of the Sub-Committee on Aboriginal Subsistence Whaling. Reports of the International Whaling Commission 48, 237-48.
International Whaling Commission. 1999. Report of the Scientific Committee, Annex J Report of the Sub-Committee on Aboriginal Subsistence Whaling. Journal of Cetacean Research and Management 1(1), 179-94.
Kirkwood, G.P. and T.I. Walker 1986. Gill net mesh selectivities for gummy shark, Mustelus antarcticus Günther, taken in south-eastern Australian waters. Australian Journal of Marine and Freshwater Research 37, 689–697.
Punt, A.E., Walker, T.I., Taylor, B.L. and F. Pribac. 2000. Standardization of catch and effort data in a spatially-structured shark fishery. Fisheries Research 45, 129-145.

20
Appendix A : Statement of Work A. General The review, which shall analyze background material and an analytical model to assess the status of Atlantic coastal shark stocks, shall address the following issues: 1. Review the analytical model(s) used to assess the status of large shark stocks in
Atlantic coastal waters, including the modelling approaches used in recent prior shark evaluation workshops. Consider, inter alia:
• The reliability of estimates of current abundance, recent trends, and demographic structure (including uncertainties);
• The reliability of population projections from the assessment results; • The appropriateness of the weighting of the various indices of abundance for the
different ages and species/stocks of shark; • The appropriateness of the Bayesian methods used in evaluating population status; • The appropriateness of the non-age-structured methods used to estimate status of
shark populations; 2. Review the quantity and quality of data available for assessment of status of the large
coast shark stocks, particularly the data from the MRFSS, and how the data were used in assessment of the large coastal shark stocks.
3. Review the support for and consequences of assumptions made about whether the
shark stocks represent open or closed populations. 4. Consider the degree to which the scientific conclusions and management
recommendations in the assessment documents are supported by the analytical results, and if alternative conclusions would be equally consistent with the analytical results.
5. Consider the degree to which the assessment methods and the advice on management:
• took account of effects of current management regulations on population trajectories
• took account of the risks to the resource of maintaining status quo management versus the costs to industry of immediate reductions in permitted landings of large coastal sharks before evaluation of recent new management regulations could be evaluated fully.
B. Specific Products and Deadlines Reviewers may communicate among themselves as they choose. However, each reviewer will prepare an independent report addressing each of the Terms of Reference. No consensus opinion among reviewers is required. Each reviewer’s report will include a specific statement on whether or not the assessments and scientific information behind them supports the conclusions of the stock assessment. If the reviewer concludes that only some conclusions are supported by the

21
assessment and others are not, the review should point out which ones are supported, which ones are not, and why. If the model(s) used are inappropriate, the reviewer should suggest better alternatives and explain why they are more suitable for assessing large coast shark stocks. If the assessments did not consider fully all the relevant data, the reviewer should point out which data sets were treated inappropriately (either by exclusion or by weighting too heavily) and if possible suggest how more appropriate treatment of the data sets might have affected assessment results and conclusions. The reviewer should include a listing of changes that should be included in future assessments of these stocks. A set of 41 documents used in recent NMFS assessments of large coastal shark stocks will be provided to each reviewer. The documents are intended to provide full information on the background of these recent assessments and scientific advice. Reviewers are not asked to provide a detailed critique of the individual documents. Rather review should consider the information and knowledge base as a whole. as it relates to the assessments and advice based on them. In doing so, reviewers may find it helpful to reference individual documents, and are welcome to consider additional documentation as appropriate. The reviewer's duties shall not exceed a maximum total of three weeks- several days for document review and several days to produce a written report of the findings. The consultant may perform all review, analysis, and writing duties out of the consultant’s primary location, as no travel is required. The itemized tasks of the consultant include: 1. Reading and analyzing the relevant documents provided to the consultant; 2. No later than March 23, 2001, submitting a written report of findings, analysis, and
conclusions (refer to Annex 1 [attached] for report generation guidelines). The report should be addressed to the ‘UM Independent System for Peer Reviews, ‘ and sent to Manoj Shivlani, UM/RSMAS, 4600 Rickenbacker Causeway, Miami, FL 33149 (or via email to [email protected]) and to Dr. Jake Rice, DFO, Canada (via email to [email protected]).
22
Appendix B : Documents consulted SB-III-5. Scott, G.P., Phares, P.J. and B. Slater. Recreational catch, average size and
effort information for sharks in US Atlantic and Gulf of Mexico waters. SB-III-9. Ulrich, G.F. Fishery independent monitoring of large coastal sharks in South
Carolina (1993-95). SB-III-13. Scott, G. Shark landings. SB-III-14. Parrack, M.L. A simple likelihood method of estimating fish abundance. SB-III-19. Scott, G.P. and J.K. Lacey. Updated chaterboat catch rate information for
sharks through 1995. SB-III-31. Anon. Summary of tag and recapture data. SB-IV-1. Branstetter, S. and G. Burgess. Gulf and South Atlantic Fisheries Development
Foundation and University of Florida. Commercial shark fishery observer program 1996.
SB-IV-2. Branstetter, S. and G. Burgess. Gulf and South Atlantic Fisheries Development Foundation and University of Florida. Commercial shark fishery observer program 1997-1998.
SB-IV-3. Branstetter, S. and G. Burgess. Gulf and South Atlantic Fisheries Development Foundation. Monitoring the Large Coastal Shark Stock of the Western Gulf of Mexico.
SB-IV-4. Brewster-Geisz, K.K. and T.J. Miller. Management of the sandbar shark (Carcharhinus plumbeus): implications of a stage-based model.
SB-IV-5. Brown, C.A. Standardized catch rates of four shark species in the Virginia – Massachusetts (U.S.) rod and reel fishery 1986 – 1997.
SB-IV-6. Carlson, J.K. and L. Trend. An index of abundance for coastal species of sharks from the northeast Gulf of Mexico: 1996-1997.
SB-IV-7. Carlson, J.K. Occurrence of neonate and juvenile sandbar sharks, Carcharhinus plumbeus, from the northeastern Gulf of Mexico.
SB-IV-8. Castillo, J.L., Márquez, J.F., Rodriguez, M.C., Cortés, E. and A. Cid. The Mexican artisanal shark fishery in the Gulf of Mexico: Toward a regulated fishery.
SB-IV-9. Cortés, E. A stochastic stage-based population model of the sandbar shark in the western North Atlantic.
SB-IV-10. Cortés, E. and G. Scott. Rates of increase per generation for large coastal species of sharks from the U.S. Atlantic Ocean and Gulf of Mexico.
SB-IV-11. Cramer, J. Large pelagic logbook catch rates for sharks. SB-IV-12. Scott, G.P., Bennett, J., Slater, B. and P. Phares. Recent recreational and
commercial catches of sharks along the US east and Gulf of Mexico coasts. SB-IV-13. Musick, J.A., Gelsleichter, J., Grubbs, R.D. and K. Goldman. A delineation of
shark nursery grounds in Chesapeake Bay and an assessment of abundance of shark stocks.
SB-IV-14. Trent, L., Parshley, D.E. and J.K. Carlson. Catch and bycatch in the shark drift gillnet fishery off Georgina and East Florida.
SB-IV-15. Trent, L., Prescott, S., Carlson, J.K. and B. Heinisch. Relative abundance and size of juvenile and small adult sharks in St. Andrew Sound in northwest Florida.

23
SB-IV-16. Trent, L. and J. Carlson. Comparison of longline methods to estimate juvenile shark abundance indices in shallow areas of northwest Florida.
SB-IV-17. Poffenberger, J. Shark logbook data. SB-IV-18. Schirripa, M.J. Analysis of shark catch rates from the Gulf of Mexico reeffish
logbooks: 1998. SB-IV-19. O’Boyle, R.N., Fowler, G.M., Hurley, P.C.F. and M.A. Showell. Update on
the status of the NFAO SA 3-6 Porbeagle shark (Lamna nasus). SB-IV-20. Anon. NAFO Subarea 3-6 Porbeagle shark. SB-IV-21. Powers, J.E. Options for age-structured production models for large coastal
sharks. SB-IV-22. Cramer, J., Bartolino, A. and G.P. Scott. Estimates of recent shark bycatch by
U.S. vessels fishing for Atlantic tuna and tuna-like species. SB-IV-23. Hoey, J.J. and G.P. Scott. Standardized catch rates for pelagic and large
coastal sharks based on research survey, logbook, and observer data from the western North Atlantic.
SB-IV-24. Merson, R.R. and H.L. Pratt, Jr. Nursery and pupping grounds of the sandbar shark, Carcharhinus plumbeus, in Delaware Bay.
SB-IV-25. Babcock, E.A. and E.K. Pikitch. The effect of bag limits on shark mortality in the U.S. Atlantic recreational fishery.
SB-IV-26. McAllister, M.K. and E.K. Pikitch. A Bayesian approach to assessment of sharks: Fitting a production model to large coastal shark data.
SB-IV-27. McAllister, M.K. and E.K. Pikitch. Evaluating the potential for recovery of large coastal sharks: a Bayesian decision analysis.
SB-IV-28. Hueter, R.E. and C.A. Manire. Distribution, relative abundance, and migration of sharks in coastal nursery areas of the Gulf of Mexico.
SB-IV-29. Grace, M. and T. Henwood. Assessment of the distribution and abundance of coastal sharks in the U.S. Gulf of Mexico and Eastern Seaboard, 1995 and 1996.
SB-IV-30. Henwood, T. Mississippi Laboratories groundfish surveys: 1972-1997. SB-IV-31. NMFS. 1996 Report of the Shark Evaluation Workshop. SB-IV-32. NMFS. 1997 Shark Evaluation Annual Report. SB-IV-33. Cramer, J. and H.M. Adams. Pelagic longline bycatch. SB-IV-34. Jones, L.M. A preliminary report on historical and recent longline shark
catches. SB-IV-35. Jones, L.M., Grace, M.A. and T. Cody. Shark nursery areas in the major bay
systems of Texas. SB-IV-36. Bonfil, R. Status of shark resources in the Southern Gulf of Mexico and
Caribbean: implications for management. SB-IV37. Marín, R. Aspectos biológicos de los tiburones capturados en las coastas de
Tamaulipas y Veracruz, México. SB-IV-38. Castillo, L. et al. Evaluación de la pesquería de tiburón del Golfo de Mexico. SB-IV-39. NMFS. 1994 Report of the Shark Evaluation Workshop. SB-IV-40. NMFS. 1995. Shark Evaluation Annual Report. SB-IV-41. Pikitch, E.K., McAllister, M.K. and B. Babcock. WCS preliminary large
coastal shark assessment results. Atlantic Shark Industry Position Statement, January 10, 2001.

24
Appendix C: Additional model runs
The basic modeling framework The sensitivity of the assessment and projection results has been evaluated using a modeling framework that is similar (but not identical) to that described in SB-IV-26. The discrete version of the logistic model has been used instead of the Pager formalism:
(1)
where is the number of animals at the start of year y (for most of the analyses ),
r is the intrinsic growth rate parameter, K is the average pre-exploitation equilibrium size, z is the ratio ,
is a production function ‘shape’ parameter, and is the catch during year y.
The discrete form of the production function has been used here because: (a) for populations with low r, the two formalisms produce virtually identical results, (b) the discrete formalism is computationally more efficient, and (c) the discrete formalism straightforwardly permits examination of production functions that achieve their maxima at population sizes larger than 0.5K. The estimable parameters of the model are: r, K, z and (the constant catch from 1974 to the year prior to the first year for which estimates of the annual catch are available: 1981 for the large coastal group and 1986 for sandbar and blacktip sharks). The same prior distributions are assumed for r, K, z and as in the 1998 SEW for the bulk of the analyses. The maximum value for K was set to 20,000,000 fish for computational convenience – the posterior probability of higher values is negligible.
For consistency with the 1998 SEW (and SB-IV-26), the abundance indices are assumed to be independently and log-normally distributed about the model estimates:
(2)
where is the abundance index for index type s and year y, is the catchability coefficient for index type s (assigned a uniform prior on
a log-scale), is the number of animals in the middle of year y,
is a measure of the reliability of the abundance index for index type s and year y compared to other abundance indices for index type s, and

25
is the residual standard deviation for index type s (also assigned a uniform prior on a log-scale).
The values for the s are either assumed to be given by the extent of sampling variability (e.g. from the output of a GLM) or assumed equal to 1 (i.e. all indices equally reliable). The base-case analysis in this review sets the s to the sampling errors (where available) and the s are treated as estimable parameters. For the assumptions underlying the base-case analysis, the posterior probability conditional on the values for r, K, z and is given by:
(3)
where is the number of data points for index type s, is the maximum likelihood estimate of the residual standard deviation for
index type s:
(4)
is the maximum likelihood estimate of the catchability coefficient for index type s:
(5)
Two alternative prescriptions for dealing with the weighting of series are considered.
1) The values for the are assumed to be 1 and the values for the s are obtained by placing log-linear regressions through the data for each index type (referred to as ‘Linear weights’).
2) The values for the are assumed to be 1, the s are assumed to be equal, and the single is treated as an estimable parameter, with a uniform prior on a log-scale (referred to as ‘Equal weights’).
The results for each assessment are the posterior mean and coefficient of variation of K, r, C0, MSC (the MSY in numbers), , , the replacement yield for 1999, and the ratio of the population size in 1998 to that in 1993. The last two quantities are provided as the replacement yield provides an indication of the short-term ‘sustainable’ catch, while the ratio of 1998 to 1993 population size provides a basis to comment on short-term changes in abundance. The results for the projections are the expected ratio of the numbers in 2019 to K under future quotas of 0, 30%, and 50% of the 1995 catch. The

26
catch assumed for 1998 is that for 1997 (for consistency with the approach described in SB-IV-26).
The sensitivity tests The majority of the sensitivity tests involve straightforward modifications to the base-case assessment. The specifications for those sensitivity tests that involve less-than-straightforward modifications are:
1. Two sub-populations with mixing (abbreviation ‘With mixing’). This sensitivity test involves assuming that the resource consists of two components, both of which are modeled using the discrete logistic equation. The intrinsic rate of growth is assumed to be the same for the two components, but these components are permitted to differ from each other in terms of their carrying capacities. All of the catches are taken from one of the components (that for which the output statistics are provided). Movement between the two components occurs at the end of the year following removal of catches and after addition of surplus production. Mixing is modeled in terms of the rate of movement from the ‘fished’ to the ‘unfished’ component. The rate of movement from the ‘unfished’ to the ‘fished’ component is selected so that the two components remain in equilibrium in the absence of fishing. The prior for the rate of mixing is assumed to be proportional to the inverse of the mixing rate (i.e. lower values for the mixing rate are assigned highest prior probability).
2. The ‘less ‘short’ series’ sensitivity test ignores the data for the shark observer, Jax, SC LL, Late MRFSS, NMFS LL NE, and NMFS LL SE series.
3. The ‘split all post-93 comm/rec series’ sensitivity test only impacts the large coastal group assessment. For this sensitivity test, the LPS, charter boat, and pelagic log series are split in 1993.
4. The sensitivity tests in which uniform priors are placed on current numbers or on current depletion involve, for each draw from the prior, computing the value of K such that the generated current numbers equals the current numbers implied by the calculated value of K. Finding K for these sensitivity tests involved the use of a bisection method. Note that the maximum value for K was taken to be 20,000,000, which implies that some current numbers and current depletions are implausible – when this occurred another draw was made from the prior.

27
Table C.1 : Values (posterior means and CVs) for some key output statistics and values for the expected ratio of the population size in 2019 to K under catches from 1999 of zero, 30% and 50% of the 1995 catch. This table contrasts the results for the 1998 SEW base-line analysis, the base-case assessment and two sensitivity tests in which the weighting scheme is modified. (a) Large coastal sharks Quantity 1998 SEW Base-case Linear
weights Equal
weights K 9535 (0.17) 9690 (0.23) 7965 (0.30) 8612 (0.27)
0.07 (0.51) 0.08 (0.67) 0.15 (0.75) 0.11 (0.90) C1975-80 284 (0.39) 299 (0.48) 275 (0.48) 355 (0.51) MSC 149 (0.38) 168 (0.43) 241 (0.38) 197 (0.44) N(98) 1385 (0.25) 2028 (0.37) 2184 (0.30) 1794 (0.31) N(98)/K 0.15 (0.24) 0.21 (0.31) 0.28 (0.16) 0.21 (0.26) RY99 N/A 106 (0.52) 192 (0.42) 130 (0.56) N98/N93 N/A 0.61 (0.14) 0.74 (0.10) 0.63 (0.18) N/K+20(0%) 0.36 0.50 0.78 0.59 N/K+20(30%) 0.03 0.17 0.50 0.25 N/K+20(50%) 0.01 0.04 0.26 0.08 (b) Sandbar sharks Quantity 1998 SEW Base-case Linear
weights Equal
weights K 3265 (0.32) 3723 (0.49) 12136 (0.29) 3526 (0.41)
0.10 (0.70) 0.11 (0.71) 0.07 (0.48) 0.11 (0.70) C1975-85 170 (0.54) 190 (0.62) 918 (0.19) 200 (0.54) MSC 71 (0.55) 88 (0.67) 208 (0.37) 82 (0.48) N(98) 924 (0.45) 1302 (1.08) 377 (0.38) 991 (0.62) N(98)/K 0.29 (0.39) 0.34 (0.48) 0.03 (0.35) 0.29 (0.41) RY99 N/A 68 (0.54) 28 (0.78) 62 (0.49) N98/N93 N/A 0.87 (0.18)* 0.53 (0.30) 0.83 (0.17)* N/K+20(0%) 0.64 0.72 0.15 0.68 N/K+20(30%) 0.45 0.56 0.06 0.50 N/K+20(50%) 0.31 0.43 0.03 0.36 * Denotes values for which the upper 90th posterior percentile exceeds 1.

28
(c) Blacktip sharks Quantity 1998 SEW Base-case Linear
weights Equal
weights K 5527 (0.31) 9528 (0.49) 9420 (0.49) 11970 (0.35)
0.12 (0.70) 0.15 (0.82) 0.12 (0.82) 0.20 (0.76) C1975-85 229 (0.37) 268 (0.42) 229 (0.41) 300 (0.43) MSC 137 (0.43) 337 (1.00) 265 (1.00) 540 (0.75) N(98) 1383 (0.57) 6083 (0.83) 5704 (0.85) 9557 (0.46) N(98)/K 0.25 (0.43) 0.54 (0.51) 0.51 (0.47) 0.78 (0.17) RY99 N/A 173 (0.50) 159 (0.46) 248 (0.21) N98/N93 N/A 0.85 (0.23)* 0.84 (0.18)* 1.01 (0.05)* N/K+20(0%) 0.77 0.81 0.81 0.96 N/K+20(30%) 0.37 0.65 0.65 0.91 N/K+20(50%) 0.13 0.55 0.51 0.87 * Denotes values for which the upper 90th posterior percentile exceeds 1.