review of social determinants and the health divide in the who european region
DESCRIPTION
Social Determinants and the Health Divide in the WHO European RegionTRANSCRIPT

Review of social determinants and the health divide in the WHO European Region: final report


Review chair Michael Marmot
Report prepared by UCL Institute of Health Equity
Review of social determinants and the health divide in the WHO European Region: final report

Abstract
The WHO European Region has seen remarkable health gains in populations that have experienced progressive improvements in the conditions in which people are born, grow, live and work. Inequities persist, however, both between and within countries. This review of inequities in health between and within countries across the 53 Member States of the Region was commissioned to support the development of the new European policy framework for health and well-being, Health 2020. Much more is understood now about the extent and social causes of these inequities. The European review builds on the global evidence and recommends policies to ensure that progress can be made in reducing health inequities and the health divide across all countries, including those with low incomes. Action is needed on the social determinants of health, across the life-course and in wider social and economic spheres to achieve greater health equity and protect future generations.
Keywords
Health inequities Health management and planning Health status disparities Intergenerational relations Socioeconomic factors Social determinants of health
ISBN: 978 92 890 0030 7
Address requests about publications of the WHO Regional Office for Europe to:
Publications WHO Regional Office for Europe UN City Marmorvej 51 DK-2100 Copenhagen Ø Denmark
Alternatively, complete an online request form for documentation, health information, or for permission to quote or translate, on the Regional Office web site (http://www.euro.who.int/pubrequest).
© World Health Organization 2013
All rights reserved. The Regional Office for Europe of the World Health Organization welcomes requests for permission to reproduce or translate its publications, in part or in full.
The designations employed and the presentation of the material in this publication do not imply the expression of any opinion whatsoever on the part of the World Health Organization concerning the legal status of any country, territory, city or area or of its authorities, or concerning the delimitation of its frontiers or boundaries. Dotted lines on maps represent approximate border lines for which there may not yet be full agreement.
The mention of specific companies or of certain manufacturers’ products does not imply that they are endorsed or recommended by the World Health Organization in preference to others of a similar nature that are not mentioned. Errors and omissions excepted, the names of proprietary products are distinguished by initial capital letters.
All reasonable precautions have been taken by the World Health Organization to verify the information contained in this publication. However, the published material is being distributed without warranty of any kind, either express or implied. The responsibility for the interpretation and use of the material lies with the reader. In no event shall the World Health Organization be liable for damages arising from its use. The views expressed by authors, editors, or expert groups do not necessarily represent the decisions or the stated policy of the World Health Organization.

iii
Contents
v Foreword
vi Note from the Chair
vii Acknowledgements
xii List of abbreviations
xiii Executive summary
1 Part I Context
2 Chapter 1 Introduction: why the review is necessary
2 1.1 The need for action on social determinants of health to achieve health equity
4 1.2 Structure and purpose of the review
5 Chapter 2 Concepts, principles and values
5 2.1 Introduction
6 2.2 General principles
6 2.3 Conceptual approaches to understanding and promoting health equity
10 2.4 Focus on action − challenge and opportunity
11 2.5 Conceptual approach to action on policies and practice
15 Part II Evidence on the health divide and health inequities in the European Region
16 Chapter 3 Health inequities between and within countries
16 3.1 Introduction
22 3.2 The health divide
28 3.3 Macro socioeconomic conditions and health
34 3.4 Intergenerational transmission of inequity
40 3.5 Early years development, education and health
44 3.6 Other social determinants of child health
45 3.7 Work, employment and unemployment
50 3.8 Older people
51 3.9 Health-related behaviours and health risks
55 3.10 Widening health inequities
61 Part III Specific areas of action on the social determinants of health
62 Chapter 4 Life-course
62 4.1 Background
62 4.2 Perpetuation of inequities in health risks from one generation to the next
68 4.3 Childhood development
76 4.4 Employment, working conditions and health inequities
84 4.5 Older people
88 Chapter 5 Wider society
88 5.1 Background
88 5.2 Social protection policies, income and health inequities
94 5.3 Local communities
102 5.4 Social exclusion, vulnerability and disadvantage
Contents

iv Review of social determinants and the health divide in the WHO European Region: final report
109 Chapter 6 Macro-level context
109 6.1 Background
109 6.2 Social expenditure
111 6.3 The relevance of global policies
114 6.4 Economic impact of health inequities
116 6.5 Sustainable development and health
119 6.6 Intergenerational equity
123 Chapter 7 Governance, delivery and monitoring systems
123 7.1 Background
123 7.2 Governance
131 7.3 Priorities for public health, ill health prevention and treatment
141 7.4 Measurement and targets
151 Part IV Implementation and action
152 Chapter 8 Implementing action based on the social determinants of health approach
152 8.1 Introduction
152 8.2 Effective delivery systems
158 8.3 Lessons to be learned from the persistence of inequities
161 8.4 Systems for achieving health equity through action on social determinants
164 8.5 Reducing the health divide between countries in Europe
166 8.6 Role of local government in implementing action on the social determinants of health
167 8.7 Active community participation and engagement
168 Chapter 9 The recommendations
168 9.1 Background
169 9.2 Specific recommendations
171 References

v Foreword
Foreword
Health and well-being are much needed assets for us all and for the societies in which we live in today’s increasingly complex world. At first sight, overall population health indicators have certainly improved across the WHO European Region over the last decades. Yet when we look more closely, we can see that improvement in health status has not been experienced equally everywhere, or by all. There are widespread inequities in health between and within societies. They reflect different conditions in which people live and affect the magnitude and trends in health inequities in today’s Europe. Health inequities offend against the human right to health and are unnecessary and unjust.
Given our European values and know-how, we can and must do better to promote health and reduce health inequities in our continent. It is for this reason that when I took up office as WHO Regional Director for Europe I started the process of developing Health 2020. My commitment was to producing a values- and evidence-based European policy framework supporting action across government and society for health and well-being.
The promotion of population health and well-being, the reduction of health inequities and the pursuit of people-centred health systems are key to a sustainable and equitable Europe. This vision is duly reflected in the key strategic objectives of Health 2020. I am delighted that Health 2020 was adopted at the sixty-second session of the Regional Committee held in Malta in September 2012.
Behind Health 2020 lies a simple yet vital idea: health and well-being matters to human, social and economic development and the future of Europe. Health is a fundamental resource for the lives of people, families and communities. Poor health wastes potential, causes despair and drains resources. By developing this new health policy framework for Europe, the European Region and its Member States wanted to bring a focus on health and improve its distribution in societies. To achieve this, we need to tackle the root causes of health inequities within and between countries. This has to be seen as a priority within our current European context, characterized in many countries by increased or persisting health inequities, a growing burden from noncommunicable diseases and shrinking public service expenditures due to the financial crisis. In this context, there is an urgent need to promote and protect health, particularly for the most vulnerable segments of the population. The WHO Regional Office for Europe has a key role to play in addressing these challenges as a proactive leader and a partner when joint actions are needed. This is the rationale of all the efforts that brought about Health 2020.
I commissioned a number of studies and scientific reviews to inform Health 2020’s development. One of the most important is the European review of social determinants of health and the health divide, led by Professor Sir Michael Marmot and his team at the University College London Institute of Health Equity.
The review was carried out by a consortium of over 80 policy researchers and institutions and in close cooperation with technical units and programmes in the Regional Office. I am delighted that the findings and recommendations of the review informed Health 2020 and are now published and made available throughout Europe and globally. I congratulate Sir Michael and all those who contributed to accomplishing this unique piece of work.
The review has collected new evidence on the magnitude and pathways related to health inequalities in the European Region and the most effective interventions and policy approaches to address them. We now know that what makes societies flourish and sustainable also makes people healthy. We understand more of the powerful impact of the social determinants on both health and disease. We better appreciate how the conditions of everyday life affect health at individual and population levels. We know that the opportunities to be healthy are far from being equally distributed in our countries. We have more accurate evidence that today’s disease burden is rooted in our present-day societies, in the way our resources are distributed and utilized and in how we address gender and other social factors that shape current patterns of ill health and lifestyles. We know with much greater insight that our opportunities to live in healthy settings are closely linked to good upbringing and education, decent work, housing and income support throughout our life-course.
My aim in promoting the review’s findings is to generate new interest and commitment in tackling health inequities and their causes in the Region and to strengthen existing support and effective action. The review provides a “wake-up” call to action among political and professional leaders and an opportunity to actively facilitate the generation and sharing of effective practices and policy innovations among those working to improve health outcomes and narrow the health gap among and within our European Member States.
This review had an impact on the content of Health 2020 and its goal to be a powerful vehicle for collective action to seize new opportunities to enhance the health and well-being of our populations across the whole of the Region. The present often extreme health inequities across our Region must be tackled. In the end, the impact of Health 2020 will depend on successful implementation in countries. Its success will be judged by tangible improvements in health and health equity in our populations. I am sure that, informed by the findings from this most important review, we can add significant value to our collective work for the benefit of all peoples of the Region. We must act on the new evidence provided by this review for better health outcomes for present and future generations. This is both our opportunity and our challenge.
Zsuzsanna Jakab WHO Regional Director for Europe
vi Review of social determinants and the health divide in the WHO European Region: final report
Note from the Chair
Recognizing the importance of addressing health inequities globally, WHO set up the Commission on Social Determinants of Health (CSDH). Commonly, health is equated with health care and public health with disease control programmes. A different approach is needed to complement these two. The CSDH 2008 report, Closing the gap in a generation, concluded that health inequities were determined by the conditions in which people are born, grow, live, work and age, and the inequities in power, money and resources that give rise to these conditions of daily life. It said: “Social injustice is killing people on a grand scale”.
The CSDH made recommendations for action based on its synthesis of evidence. In my note from the Chair, I said that all associated with the CSDH were united by three concerns: a passion for social justice, a respect for evidence, and a frustration that there appeared to be far too little action on the social determinants of health.
Things have changed. All connected with the European review share the CSDH’s commitment to social justice and evidence. But there is now tangible, and very welcome, interest in applying understanding of social determinants of health to improving health and increasing health equity. Showing the lead in Europe, and wishing to translate her vision into practical action, Zsuzsanna Jakab, WHO Regional Director for Europe, set up this review of social determinants of health and the health divide. Building on the CSDH, our task was to synthesize the evidence and make recommendations that could be applied in the 53 countries that make up the diversity of the WHO European Region.
There are persisting and substantial health inequities across the Region. It includes countries with close to the best health and narrowest health gaps in the world. The evidence suggests that this welcome picture is related to a long and sustained period of improvement in the lives people are able to lead – socially cohesive societies, increasingly affluent, with developed welfare states and high-quality education and health services. All these have created the conditions for people to have the freedom to lead lives they have reason to value. Remarkable health gains have been the result.
However, not everyone has shared equally in this social, economic and health development. Although social and economic circumstances have improved in all countries, differences remain and health has suffered, particularly in those countries to the east of the Region. Even the more affluent countries have increasingly seen inequities in people’s life conditions and declining social mobility and social cohesion. As a likely result of these changes, health inequities are not diminishing, and are increasing in many countries.
The review set up 13 task groups to review new evidence on what can be done in diverse countries across the Region to take action on the social determinants of health. The findings of the task groups, and the work of the review teams at the University College London Institute of Health Equity and WHO, was overseen by a group of senior advisors who brought their wisdom and experience to bear on translating the evidence into recommendations ready to be implemented.
The global financial crisis has brought conditions of great hardship to parts of the Region. There is therefore an even more pressing need for action on the social determinants of health to ensure that a commitment to health equity survives and is enhanced. A central argument of this review is that social policies can be judged by their likely impact on health equity. Our aim was to provide both the evidence and the recommendations to make such a judgement possible. What is now needed is the political and social commitment of governments, civil society, transnational bodies and academic institutions to translate into reality the vision of a more equitable Europe. We are optimistic.
Michael Marmot Chair, European review of social determinants of health and the health divide

Acknowledgements
This review was carried out by a consortium chaired by Michael Marmot of the Institute of Health Equity, University College London and supported by a joint secretariat from the Institute and the WHO Regional Office for Europe. The review was informed and shaped by the work of 13 task groups and guided by a senior advisory board.
Senior advisors
Guillem Lopez Casanovas Universitat Pompeu Fabra Spain
Zsuzsa Ferge Eotvos University Hungary
Ilona Kickbusch Graduate Institute Geneva Switzerland
Johan Mackenbach Erasmus University The Netherlands
Tilek Meimanaliev Central Asia AIDS Control Project Kyrgyzstan
Amartya Sen Harvard University United States of America
Vladimir Starodubov Ministry of Health and Social Development Russian Federation
Tomris Turmen University of Ankara Turkey
Denny Vagero Centre for Health Equity Studies Sweden
Barbro Westerholm Member of Parliament Sweden
Margaret Whitehead University of Liverpool United Kingdom
Ex-officio representatives of WHO (Roberto Bertollini, Agis Tsouros and Erio Ziglio) and the European Commission (Michael Hübel and Charles Price)
Acknowledgements vii

Task group chairs/co-chairs
Task groups provided evidence on tackling the major social determinants of health and related areas. The task groups and their chairs/co-chairs were as follows.
Task group Chair/co-chair Affiliation Country
Early years, education and family
Alan Dyson University of Manchester United Kingdom
Naomi Eisenstadt University of Oxford United Kingdom
Employment and working conditions
Johannes Siegrist University of Dusseldorf Germany
Social exclusion, disadvantage and vulnerability
Jennie Popay University of Lancaster United Kingdom
GDP, taxation, income and welfare
Olle Lundberg Centre for Health Equity Studies
Sweden
Sustainability and community Anna Coote New Economics Foundation
United Kingdom
Ill health prevention and treatment
Gauden Galea Division of Noncommunicable Diseases and Life-course, WHO Regional Office for Europe
Witold Zatonski Cancer Centre & Institute of Oncology
Poland
Gender issues Maria Kopp Semmelweiss University Hungary
Older people Emily Grundy University of Cambridge United Kingdom
Economics Marc Suhrcke University of East Anglia United Kingdom
Richard Cookson University of York United Kingdom
Governance and delivery mechanisms
Harry Burns Chief Medical Officer for Scotland
United Kingdom
Erio Ziglio European Office for Investment for Health and Development, WHO Regional Office for Europe
Global influences Ronald Labonte University of Ottawa Canada
Equity, equality and human rights
Karien Stronks Academic Medical Centre, University of Amsterdam
The Netherlands
Measurement and targets Martin Bobak University College London
United Kingdom
Claudia Stein Division of Information, Evidence, Research and Innovation, WHO Regional Office for Europe
viii Review of social determinants and the health divide in the WHO European Region: final report

UCL secretariat
The writing of the report was led by Michael Marmot and coordinated by Peter Goldblatt.
Jessica Allen, Ruth Bell, Ellen Bloomer, Angela Donkin, Ilaria Geddes and Mike Grady contributed to writing and reviewing material for the report.
Ruth Bell and Peter Goldblatt coordinated production and analysis of tables and charts, assisted by David Bann, Sadie Boniface, Michael Holmes, Akanksha Katyal and Anne Scott.
The team was supported by Matilda Allen, Luke Beswick, Ria Galeote and Alex Godoy.
WHO secretariat
The WHO secretariat was led by Agis Tsouros, with Johanna Hanefeld, Piroska Ostlin, Asa Nihlen, Chris Brown, Isabel Yordi, Theadora Koller, Sarah Simpson, Erio Ziglio and Richard Alderslade.
Additional input and comments on the report were provided by Vivian Barnekow, Roberto Bertollini, Matthias Braubach, Joao Breda, Pierpaolo De Colombani, Gauden Galea, Manfred Huber, Marijan Ivanuša, Matthew Jowett, Hans Kluge, Gunta Lazadane, Enrique Loyola, Marco Martuzzi, Leen Meulenbergs, Lars Moller, Arun Nanda, Jose Maria Moreno, Dinesh Sethi, Santino Severino, Claudia Stein and Brenda van der Bergh.
In addition, many WHO staff provided invaluable support: Connie Petersen, Antonella Biasiotto, Simone Tetz, Maria Ruano, Pamela Charlton, Mary Stewart Burgher, Anita Strandsbjerg.
Editors: Alex Mathieson and David Breuer.
Design: John McGill and Lucienne Roberts.
Members of the task groups
Szilvia Adam, Semmelweis University, Hungary; Joan Benach, Universitat Pompeu Fabra, Spain; Jovanka Bislimovska, WHO collaborating centre, the former Yugoslav Republic of Macedonia; Chris Brown, WHO Regional Office for Europe; Tatjana Buzeti, Centre for Health and Development Murska Sobota and Ministry of Health, Slovenia; Candace Currie, University of St Andrews, United Kingdom; Espen Dahl, Oslo and Akershus University College of Applied Sciences, Norway; Dorly Deeg, VU University, the Netherlands; Paul Dourgnon, Institut de Recherche et Documentation en Economie de la Sante, France; Johan Fritzell, Centre for Health Equity Studies, Sweden; Dominic Harrison, Blackburn with Darwen Borough Council, United Kingdom; Aart Hendriks, Universiteit Leiden, the Netherlands; James Higgins, Youth Forum, United
Kingdom; Manfred Huber, WHO Regional Office for Europe; Martijn Huisman, VU University, the Netherlands; Umar Ikram, Academic Medical Centre, University of Amsterdam, the Netherlands; Bjarne Bruun Jensen, Steno Health Promotion Centre, Denmark; Darya Khaltourina, Russian Academy of Sciences, Russian Federation; Rohko Kim, WHO Regional Office for Europe; Katalin Kovacs, Demographic Research Institute, Hungary; Anton Kunst, University of Amsterdam, the Netherlands; Roderick Lawrence, Universite de Geneve, Switzerland; Marco Martuzzi, WHO Regional Office for Europe; Martin McKee, London School of Hygiene and Tropical Medicine, United Kingdom; Edward Melhuish, Birckbeck, University of London, United Kingdom; Michael Murphy, London School of Economics, United Kingdom; Michal Myck, Centre for Economic Analysis, Poland; Joakim Palme, Uppsala University, Sweden; Hynek Pikhart, University College London, United Kingdom; George Ploubidis, University of Cambridge, United Kingdom; Jorma Rantanen, University of Jyväskylä, Finland; Sanna Read, University of Cambridge, United Kingdom; Arne Ruckert, University of Ottawa, Canada; Gyongyver Salavecz, Semmelweis University, Hungary; Sarah Simpson, WHO Regional Office for Europe; Nicolas Sirven, Institut de Recherche et Documentation en Economie de la Sante, France; Ola Sjöberg, Stockholm University, Sweden; Selma Sogoric, University of Zagreb, Croatia; Sylvie Stachenko, WHO Regional Office for Europe; Tamara Steger, Central European University, Hungary; Urszula Sulkowska, Maria Skłodowska-Curie Memorial Cancer Centre, Poland; Gerdt Sundstrom, London School of Hygiene and Tropical Medicine, United Kingdom; Julia Szalai, Central European University, Hungary; Andras Szekely, Semmelweis University, Hungary; Jukka Takala, Tampere University of Technology, Finland; Brigit Toebes, University of Groningen, the Netherlands; Cleon Tsimbos, University of Jonkoping, Sweden; Cretien Van Campen, University of Cambridge, United Kingdom; Sridhar Venkatapuram, London School of Hygiene and Tropical Medicine, United Kingdom.
The eastern network who assisted the review
Yulia Abrosimova, St Petersburg State University, Russian Federation; Baktygul Akkazieva, WHO Country Focal Point for National Health Accounts, Kyrgyzstan; Jane Falkingham, University of Southampton, United Kingdom; Amiran Gamkrelidze, WHO Regional Office for Europe; Assomidin Latipov, CAAP project, Tajikistan; Martin McKee, London School of Hygiene and Tropical Medicine, United Kingdom.
ix Acknowledgements

Other contributors to the task groups
Baktygul Akkazieva, WHO Regional Office for Europe; Vivian Barnekow, WHO Regional Office for Europe; Mel Bartley, University College London, United Kingdom; Sanjay Basu, University of California at San Francisco, United States of America; Jenni Blomgren, Kela (social insurance institution), Finland; Carme Borrell, Public Health Agency of Barcelona, Spain; Tammy Boyce, Imperial College London, United Kingdom; Jonathan Bradshaw, University of York, United Kingdom; Harvey Brenner, University of North Texas Health Science Center, United States of America; Kristie Carter, University of Otago, New Zealand; Audrey Chapman, University of Connecticut, United States of America; Michelle Collins, Lancaster University, United Kingdom; Pierpaolo de Colombani, WHO Regional Office for Europe; Marc Mari Dell’ Olmo, Public Health Agency of Barcelona, Spain; Elia Diez, Public Health Agency of Barcelona, Spain; Mariel Droomers, National Institute for Public Health and the Environment, the Netherlands; Terje Andreas Eikemo, Norwegian University of Science and Technology, Norway; Eric Emerson, Lancaster University, United Kingdom; Sarah Escorel, Lancaster University, United Kingdom; Ingemar Farm, European Disability Forum, Belgium; Tommy Ferrarini, Institute for Social Research, Sweden; Amiran Gamkrelidze, Centre of Allergy and Immunology, Georgia; Yevgeniy Goryakin, London School of Hygiene and Tropical Medicine, United Kingdom; Merce Gotsens, CIBER Epidemiology and Public Health, Spain; Emma Halliday, Lancaster University, United Kingdom; Rachel Hammonds, Institute of Tropical Medicine, Belgium; Mario Hernandez, National University of Colombia, Bogotá, Colombia; Jennie Bacchus Hertzman, Centre for Health Equity Studies, Sweden; Heikki Hiilamo, Tampere University, Finland; Paul Hunt, University of Essex, United Kingdom; Wiking Husberg, International Labour Organization, Russian Federation; David Ingleby, University of Amsterdam, the Netherlands; Kinga Janik-Koncewicz, Maria Skłodowska-Curie Memorial Cancer Centre & Institute of Oncology, Poland; Heidi Johnston, International Centre for Diarrhoeal Disease Research, Bangladesh; Lisa Jones, University of Manchester, United Kingdom; Elena Jørgensen, WHO Regional Office for Europe; Matthew Jowett, WHO Regional Office for Europe; Florence Jusot, Universite de Rouen, France; Olli Kangas, University of Southern Denmark, Denmark; Rokho Kim, WHO Regional Office for Europe; Meri Koivusalo, National Institute for Health and Welfare, Finland; Gunta Lazdane, WHO Regional Office for Europe; Stavroula Leka,
Nottingham University, United Kingdom; Vivian Lin, La Trobe University, Australia; Marta Mańczuk, Maria Skłodowska-Curie Memorial Cancer Centre & Institute of Oncology, Poland; Jane Mathieson, Lancaster University, United Kingdom; Mari Matveinen, WHO Regional Office for Europe; Stefano Mazzuco, Padua University, Italy; Martin McKee, London School of Hygiene and Tropical Medicine, United Kingdom; Silvia Meggiolaro, University of Padova, Italy; Antony Morgan, National Institute for Health and Clinical Excellence, United Kingdom; Joana Morrison, CIBER Epidemiology and Public Health, Spain; Irma Munoz-Baell, University of Alicante, Spain; Carles Muntaner, University of Toronto, Canada; Gulgun Murzalieva, Health Policy Analysis Centre, Kyrgyzstan; Kenneth Nelson, Swedish Institute for Social Research, Stockholm University, Sweden; Aasa Nihlen, WHO Regional Office for Europe; Gorik Ooms, Institute of Tropical Medicine, Belgium; Zeynep Or, Institut de Recherche et Documentation en Economie de la Sante, France; Piroska Ostlin, WHO Regional Office for Europe; Corinne Packer, University of Ottawa, Canada; Laia Palencia, CIBER Epidemiology and Public Health, Spain; Frank Pega, University of Otago, New Zealand; Jitka Pikhartova, University College London, United Kingdom; Mariona Pons-Vigues, Public Health Agency of Barcelona, Spain; Sue Povall, University of Liverpool, United Kingdom; Susan Ramsay, London School of Hygiene and Tropical Medicine, United Kingdom; Boika Rechel, University of East Anglia, United Kingdom; Jan Reinhardt, Swiss Paraplegic Research, Switzerland; Marilyn Rice, Consultant, United States of America; Laetitia Rispel, University of the Witwatersrand, South Africa; Bayard Roberts, London School of Hygiene and Tropical Medicine, United Kingdom; Lorenzo Rocco, University of Padova, Italy; Ellen Rosskam, University of Massachusetts, United States of America; Vivien Runnels, University of Ottawa, Canada; Philip de Winter Shaw, University of Edinburgh, United Kingdom; Katja Siling, London School of Hygiene and Tropical Medicine, United Kingdom; Maria Skarphensdottir, WHO Regional Office for Europe; Jeppe Sorensen, Disabled People’s Organization, Denmark; David Stuckler, University of Cambridge, United Kingdom; Maria Stuttaford, University of Warwick, United Kingdom; Catriona Towriss, London School of Hygiene and Tropical Medicine, United Kingdom; Wim Van Damme, Institute of Tropical Medicine, Belgium; Suzanne Van De Vathorst, Erasmus University, the Netherlands; Kjetil Van Der Wel, University of Oslo, Norway; Brandon Vick, Fordham University, United States of America; Isabel Yordi Aguirre, WHO Regional Office for Europe; Mateusz Zatoński, Consultant, Poland.
x Review of social determinants and the health divide in the WHO European Region: final report
Task group report reviewers
Angela Anning, University of Leeds, United Kingdom; Mauricio Avendano, London School of Economics, United Kingdom; Fran Baum, Flinders University, Australia; Tarani Chandola, University of Manchester, United Kingdom; Finn Diderichsen, University of Copenhagen, Denmark; Arjan Gjonca, London School of Economics, United Kingdom; Myer Glickman, Office for National Statistics, United Kingdom; Sofia Gruskin, University of Southern California, United States of America; Johanna Hanefeld, WHO Regional Office for Europe; Cristina Hernandez Quevedo, London School of Economics, United Kingdom; Ken Judge, University of Bath, United Kingdom; Tord Kjellstrom, Australian National University, Australia; Hans Kluge, WHO Regional Office for Europe; Daniel La Parra Casado, Universidad de Alicante, Spain; Cecily Maller, RMIT University, Australia; Chris Naylor, The King’s Fund, United Kingdom; Kristina Orth-Gomer, Karolinska Institute, Sweden; Peter Paulus, Leuphana University, Luneburg, Germany; Hynek Pikhart, University College London, United Kingdom; Kumanan Rasthanan, UNICEF, United States of America; Jan Rigby, Nui Maynooth, Ireland; Elena Ronda, University of Alicante, Spain; Reiner Rugulies, National Research Centre for the Working Environment, Denmark; Tom Shakespeare, WHO Regional Office for Europe; Richard Smith, London School of Hygiene and Tropical Medicine, United Kingdom; Devi Sridhar, Oxford University, United Kingdom; Juan Eduardo Tello, WHO Regional Office for Europe; Marcel Verwij, Utrecht University, the Netherlands; Helen Weatherly, University of York, United Kingdom; Margaret Whitehead, University of Liverpool, United Kingdom; Gareth Williams, Cardiff University, United Kingdom.
Further support
The production of this report has been made possible with the financial support of the Ministry of Health of the Government of the Netherlands, the Health Department of the Government of Norway, the Ministry of Foreign Affairs of the Government of Spain and the Department of Health, United Kingdom (England), which provided financial support to the review process and the production of the related task group reports. Support was provided by the Ministry of Health of Italy and the Veneto Region through their support of the WHO European Office for Investment for Health and Development in Venice and the Tuscany Region of Italy. Support for meetings of senior advisors was provided by the Ministry of Health and Social Policy of Spain, Malmo Kommun and Research Council in Sweden, Universitatea de Stat de Medicina si Farmacie in the Republic of Moldova, Health Action Partnership International and the British Medical Association in the United Kingdom.
xi Acknowledgements

xii Review of social determinants and the health divide in the WHO European Region: final report
List of abbreviations
ALMP active labour-market programme
A PAR Association Aprender em Parceria [Learning in Partnership Association] [Portugal]
CBA cost−benefit analysis
CCEE countries of central and eastern Europe
CEA cost−effectiveness analysis
CIS Commonwealth of Independent States
CoE Council of Europe
CSDH Commission on Social Determinants of Health
CVD cardiovascular disease
EC European Commission
ECEC early childhood education and care
EFTA European Free Trade Association
EHIS European Health Interview Survey
EU European Union
EU10 countries joining the EU in May 2004
EU12 countries joining the EU in 2004 or 2007
EU15 countries belonging to the EU before 2004
EU25 the EU15 plus EU10
EU−SILC EU Statistics on Income and Living Conditions
FAO Food and Agriculture Organization of the United Nations
FAS [HBSC] Family Affluence Scale
FTT financial transaction tax
GDP gross domestic product
HBSC Health Behaviour in School-aged Children [study, survey]
HDI human development index
HLY healthy life years
IAH international assistance in health
ICJ International Court of Justice
ILMS Israel Longitudinal Mortality Study
ILO International Labour Organization
IMF International Monetary Fund
ISCED International Standard Classification of Education
ISO International Organization for Standardization
IVAC investigation− vision−action−change
KiGGS Studie zur Gesundheit von Kindern und Jugendlichen [National Health Interview and Examination Survey for Children and Adolescents] [Germany]
MDR-TB multidrug-resistant tuberculosis
MICS [UNICEF] Multiple Indicator Cluster Surveys
NGO nongovernmental organization
NICE National Institute for Health and Clinical Evidence [United Kingdom (England)]
ODA official development assistance
OECD Organisation for Economic Co-operation and Development
PATHS Promoting alternative thinking strategies [curriculum]
PISA Programme for International Student Assessment
ppp purchasing power parity
PRIMA−EF Psychosocial Risk Management Excellence Framework
SES socioeconomic status
SHARE Surveys of Health and Retirement in Europe
SHE Schools for Health in Europe
SWIFT Sustainable Work Initiative for a Healthier Tomorrow [Serbia]
TB tuberculosis
UNDP United Nations Development Programme
UNESCO United Nations Educational, Scientific and Cultural Organization
UNICEF United Nations Children’s Fund
VSL value of a statistical life
WHO−CHOICE CHOosing Interventions that are Cost Effective

Fig. ES.1
Life expectancy in countries in the European Region, 2010 (or latest available)
Life expectancy – quintiles:
Highest
Second
Third
Fourth
Lowest
Source: WHO Regional Office for Europe (3).
Executive summary
This study of inequities in health between and within countries across the 53 Member States of the WHO European Region was commissioned to support the development of the new European policy framework for health and well-being, Health 2020 (1). Much more is understood now about the extent, and social causes, of these inequities, particularly since the publication in 2008 of the report of the Commission on Social Determinants of Health (2). This European study builds on the global evidence.
There are good reasons for the specific European focus of this review. Health inequities across the Region are known to be high, and the Region’s great diversity creates opportunities to offer policy analysis and recommendations specific to low-, middle- and high-income countries. The results of the review are clear: with the right choice of policies, progress can be made across all countries, including those with low incomes.
The review comes at an important moment in European history. The Region includes countries with close to the best health and narrowest health inequities in the world. The evidence suggests that this welcome picture is related to a long and sustained period of improvement in the lives people are able to lead – socially cohesive societies, increasingly affluent, with developed welfare states and high-quality education and health services. All these have created the conditions for people to have the freedom to lead lives they have reason to value. Remarkable health gains have been the result.
However, not all countries have shared fully in this social, economic and health development. Although social and economic circumstances have improved in all countries, differences remain and health has suffered. Even more-affluent countries in the Region have increasingly seen inequities in people’s life
conditions and declining social mobility and social cohesion. As a likely result of these changes, health inequities are not diminishing and are increasing in many countries. The economic crisis since 2008, more profound and extended than most people predicted, has exacerbated this trend and exposed stark social and economic inequities within and between countries.
Human rights approaches support giving priority to improving health and reducing inequities. Achieving these goals requires definitive action on the social determinants of health as a major policy challenge. These inequities in health are widespread, persistent, unnecessary and unjust, and tackling them should be a high priority at all levels of governance in the Region. Necessary action is needed across the life-course and in wider social and economic spheres to protect present and future generations.
This review provides guidance on what is possible and what works, to be considered within the specific circumstances and settings of individual countries. Its recommendations are practical and focused. One response to addressing health inequities open to all is to ensure universal coverage of health care. Another is to focus on behaviour – smoking, diet and alcohol – that cause much of these health inequities but are also socially determined. The review endorses both these responses. But the review recommendations extend further – to the causes of the causes: the conditions in which people are born, grow, live, work and age and inequities in power, money and resources that give rise to them.
Fig. ES.1 shows life expectancy in countries, which is one measure of differences in health across the Region. The range between the highest and lowest figures for countries is 17 years for men and 12 years for women. Most countries in the lowest quintile are in the eastern part of the Region.
xiii Executive summary

Health inequalities that are avoidable are unjust: action is required across society
Systematic differences in health between social groups that are avoidable by reasonable means are unfair. This review therefore uses the term “health inequities” to describe these avoidable inequalities.
The analysis shows that action is required across the whole of government, on the social determinants of health, to achieve advances in health equity. Health ministers clearly have a role in ensuring universal access to high-quality health services. However, they also have a leadership role in advancing the case that health is an outcome
xiv Review of social determinants and the health divide in the WHO European Region: final report
Further, health inequities are not confined to poor health for people in poor countries and good health for everyone else. Fig. ES.2 shows how health inequities persist even in some of the most affluent countries.
To address these health inequities within and between countries, the WHO Regional Office for Europe commissioned this review of social determinants of health and the health divide. The conclusions and recommendations of this review have informed development of Health 2020 (1).
Fig. ES.2
Life expectancy trends in Sweden 2000−2010 by education level, men and women
Source: Statistics Sweden (4).
Men
Post-secondary
Upper-secondary
Compulsory
Women
Post-secondary
Upper-secondary
Compulsory
2000 2001 2002 2003 2004 2005 2006 2007 2008 2009 2010
Life expectancy at age 30
58
56
54
52
50
48
46
2000 2001 2002 2003 2004 2005 2006 2007 2008 2009 2010
Life expectancy at age 30
58
56
54
52
50
48
46

of policies pursued in other arenas. So close is the link between social policies and health equity that the magnitude of health inequity shows how well society is meeting the needs of its citizens. Health is not simply a marker of good practice but is also highly valued by individuals and society.
The review makes the moral case for action on social determinants of health – social injustice kills and causes unnecessary suffering. There is also a strong economic argument. The cost of health inequities to health services, lost productivity and lost government revenue is such that no society can afford inaction. Tackling inequities in the social determinants of health also brings other improvements in societal well-being, such as greater social cohesion, greater efforts for climate change mitigation and better education.
Areas for action – emphasizing priorities
Reviewing the experience of countries in the European Region clearly shows that they should have two clear aims: improving average health and reducing health inequities by striving to bring the health of less-advantaged people up to the level of the most-advantaged. Improving the levels and equitable distribution of the social determinants should achieve both aims. Similarly, reducing health gaps between countries requires striving to bring the level of the least healthy countries up to that of the best. To achieve this, two types of strategy are needed: within each country, action on the social determinants of health to improve average health and reduce health inequities; and action at transnational level to address the causes of inequities between countries.
The review commissioned 13 task groups that reviewed European and world literature on social determinants of health and strategies to promote health equity within and between countries. Based on the evidence assembled, the review grouped its recommendations into four themes – life-course stages, the wider society, the macro-level broader context and systems (Fig. ES.3). Action is needed on all four themes.
Within each of these themes, the highest priorities for action are as follows:
A The life-course
The highest priority is for countries to ensure a good start to life for every child. This requires, as a minimum, adequate social and health protection for women, mothers-to-be and young families and making significant progress towards a universal, high-quality, affordable early years, education and child care system.
Emphasis on a good start in life does not of course mean that actions at later stages of the life-course – working ages and older ages – are not important.
They are crucial both to reinforce the improvement in skills and individual empowerment provided by a good start but also to achieve greater health equity among the existing adult populations of each country. In particular, it is essential to reduce stress at work, reduce long-term unemployment through active labour-market programmes and address the causes of social isolation.
B Wider society
The most effective actions to achieve greater health equity at societal level are those that create or reassert societal cohesion and mutual responsibility. In particular, the most tangible and practical action is to ensure an adequate level and distribution of social protection, according to need. In many countries, this requires improving the level of provision. In all countries, it necessitates making better use of existing provision – such as making progress to increase the proportion of people who have the minimum standard of living needed to participate in society and maintaining health.
Supporting action to create cohesion and resilience at local level is essential through a whole-of-society approach that encourages the development, at local level, of partnerships with those affected by inequity and exclusionary processes – working with civil society and a range of civic partners. Central to this approach is empowerment – putting in place effective mechanisms that give those affected a real say in decisions that affect their lives and by recognizing their fundamental human rights, including the right to health.
xv
Macro-level context
Life-course stages
Wider society Systems
Prenatal Early years Working age
Family-building
Older ages
Accumulation of positive and negative effects
on health and well-being over the life-course
Perpetuation of inequities
Fig. ES.3
Broad themes
Executive summary

xvi Review of social determinants and the health divide in the WHO European Region: final report
New approaches
This European review draws on the findings and recommendations of the Commission on Social Determinants of Health (2): health inequities arise from the conditions in which people are born, grow, live, work and age and inequities in power, money and resources that give rise to these conditions of daily life. The explicit purpose of the review was to assemble new evidence and to develop new ideas that could be applied to the remarkable diversity of countries that make up the European Region; different in national income, social development, history, politics and culture.
Box ES.1 summarizes distinct approaches of the review to understanding and promoting health equity across Europe.
Several new themes emerged from the review.
�� Human rights are central to our approach to action on the social determinants of health; human rights embody fundamental freedoms and the societal action necessary to secure them.
�� In addition to addressing harmful influences, it is important to build on the resilience of individuals and communities; empowerment is central.
�� The life-course emerges as the right way to plan action on social determinants of health; although the review emphasizes early childhood, action is needed at every stage of life, and it makes strong recommendations for working and older ages.
�� Protecting future generations from the perpetuation of social and economic inequities affecting previous generations is important.
�� Intergenerational equity features strongly, in addition to intragenerational equity.
�� Strong emphasis is needed on joint action on social determinants of health, social cohesion and sustainable development; all imply a strong commitment to social justice.
�� Proportionate universalism should be used as a priority-setting strategy in taking action to address health inequity.
The Region does not need to be so divided in health, depressed by gloomy economic prospects and failing in its environmental ambitions. Instead, the review suggests, it could move towards health equity, sustainable prosperity and social cohesion across the whole Region. This requires that the 53 Member States work together and take mutual responsibility to achieve this change.
C Macro-level context
Wider influences, both within countries and transnationally, shape the lives, human rights and health of people in the European Region. In the short to medium term, the priority is to address the health effects of the current economic crisis. Recognition of the health and social consequences of economic austerity packages must be a priority in further shaping economic and fiscal policy in European countries. The views of ministers responsible for health and social affairs must be heard in the negotiations about such austerity packages. In particular, at the transnational level, WHO, the United Nations Children’s Fund and the International Labour Organization should also be given a voice.
Equity between generations – intergenerational equity – is a fundamental driver of environmental policy. So must it be for societal policies for health. It is critical that approaches to environmental, social and economic policy and practice be integrated.
D Systems
Improvements in health and its social determinants will not be achieved without significantly refocusing delivery systems to whole-of-government and whole-of-society approaches. The starting point is the health system – what it does itself and how it influences others to achieve better health and greater equity. This requires achieving greater coherence of action across all sectors (policies, investments and services) and stakeholders (public, private and voluntary) at all levels of government (transnational, national, regional and local). Universal access to health care is a priority – where this is established, it is to be protected and must progressively be extended to all countries in the Region.
Action on disease prevention must include reducing the immediate causes of inequity within and between countries – alcohol consumption, smoking and obesity. Effective strategies go beyond providing information and include taxation and regulation. Evidence suggests that addressing the “causes of the causes” is the right way to proceed on these – ensuring that people have the skills and control over their lives to be able to change behaviour.
But nothing will happen without monitoring and adequate review. It is recommended that all 53 countries in the Region establish clear strategies to redress the current patterns and magnitude of health inequities by taking action on the social determinants of health. Countries should undertake regular reviews of these strategies. These should be reported to WHO and discussed at regular regional meetings.

xvii
Box ES.1
Key issues in understanding and promoting health equity
�� Social determinants of health – we must address the conditions in which people are born, grow, live, work and age – key determinants of health equity. These conditions of daily life are, in turn, influenced by structural drivers: economic arrangements, distribution of power, gender equity, policy frameworks and the values of society.
�� Taking a life-course approach to health equity. There is an accumulation of advantage and disadvantage across the life-course. This approach begins with the important early stages of life – pregnancy and early child development – and continues with school, the transition to working life, employment and working conditions and circumstances affecting older people.
�� There is a social gradient in health – that is to say, health is progressively better the higher the socioeconomic position of people and communities. It is important to design policies that act across the whole gradient and to address the people at the bottom of the social gradient and the people who are most vulnerable. To achieve both these objectives, policies are needed that are universal but are implemented at a level and intensity of action that is proportionate to need – proportionate universalism.
�� In relation to the most excluded people, it is important to address the processes of exclusion rather than focusing simply on addressing particular characteristics of excluded groups. This approach has much potential when addressing the social and health problems of Roma and irregular migrants as well as those who suffer from less extreme forms of exclusion and dip in and out of vulnerable contexts.
�� The need to build on assets − the resilience, capabilities and strength of individuals and communities – and address the hazards and risks to which they are subject.
�� The importantance of gender equity – all the social determinants of health may affect the genders differently. In addition to biological sex differences, there are fundamental social differences in how women and men are treated and the assets and resilience they have. These gender relations affect health in all societies to varying degrees and should shape actions taken to reduce inequities.
�� Much focus has been, and will continue to be, on equity within generations. The perspectives of sustainable development and the importance of social inequity affecting future generations means that intergenerational equity must be emphasized, and the impact of action and policies for inequities on future generations must be assessed and risks mitigated.
Taking action − do something, do more, do better
This was a key message emerging from the work of the task groups set up to review what would work in the variety of countries of the Region: do something, do more, do better.
In other words, if countries have very little in place in terms of policies on social determinants of health, some action matters. Where there are some existing policies, this review shows how these can be improved to deal with large and persistent health inequities. In the richest countries in Europe, there is scope to do better on these inequities.
The review, drawing on the research evidence brought together by the task groups, provides recommendations that apply across the diversity of countries in the Region but gives many specific examples of how these can be applied in different country contexts. Empowerment, a basic tenet of the review, means not imposing solutions from outside, but that countries, regions and cities use the scientifically based recommendations in this report to develop policies and programmes specific to each of the 53 Member States and, indeed, to cities and districts within those countries.
Social determinants, human rights and freedoms
There is vibrant debate on what is sometimes portrayed as a tension between action on social determinants and individual freedoms. This review calls for social action – but individual freedoms and responsibilities feature strongly in the approach taken, drawing on Amartya Sen’s insights on freedoms to enable people to lead a life they have reason to value (5). The wider influences of society on the social determinants of individual health are of fundamental importance in enabling people to achieve the capabilities that lead to good health.
An individual’s resources and capabilities for health are influenced by social and economic arrangements, by collective resources provided by the communities of which they are part and by welfare state institutions. Human rights approaches can support these resources. The right to health entails rights to equity in the social determinants of health. In other words, as Sridhar Venkatapuram (6) has argued, the right to health should be understood as a moral claim on the “capability to be healthy”, which is determined largely by the social determinants of health.
Executive summary

Action in a cold economic climate
The review argues the moral case for action. In many areas the moral and the economic case for action come together – investment in early child development and education may meet the demands both of efficiency and justice. As a companion study for Health 2020 notes, prevention is a “good buy” (7). Further, action on social determinants of health leads to other benefits to society, which may in turn have more immediate economic benefits. For example, a more socially cohesive, educated population is likely to have lower rates of crime and civil disorder, a more highly skilled workforce and enable people to lead lives they have reason to value, as well as having better health and greater health equity.
Current economic difficulties in countries are a reason for action and not inaction on social determinants of health. The economic crisis affecting Europe provides the stark background and the urgent challenge to this work. It is often argued that coping with these severe economic difficulties requires reducing investment in health and its social determinants. Yet the evidence laid out in this review is clear: investing in early child development, active labour-market policies, social protection, housing and mitigating climate change will help protect populations from the adverse effects of the economic crisis and lay the basis for a healthier future.
Recommendations and action required
Theme A – Life-course
Perpetuation of inequities in health risks from one generation to the next
Perpetuation of health risks from one generation to the next
Children’s early development, life chances and, ultimately, health inequities are strongly influenced by the social and economic background of their parents and grandparents; location, culture and tradition; education and employment; income and wealth; lifestyle and behaviour; and genetic disposition. Further, conditions such as obesity and hypertension, and behaviour that puts health at risk, such as smoking, recur in successive generations. Achieving a sustainable reduction in health inequities requires action to prevent the relative and absolute disadvantage of parents from blighting the lives
xviii Review of social determinants and the health divide in the WHO European Region: final report
Recommendation 1(a).
Ensure that the conditions needed for good-quality parenting and family-building exist, promote gender equity and provide adequate social and health protection.
Specific actions
(i) Ensure that accessible, affordable and high-quality sexual and reproductive health services are available to all who need them (particularly women and girls and young people of both sexes). This includes access to evidence-based contraception and care in pregnancy and childbirth. Aside from safe delivery as a basic right, high-quality services help to decrease smoking rates in pregnancy, increase breastfeeding and promote skills and knowledge for effective parenting. Services should identify families at risk early and refer to appropriate services.
(ii) Ensure that strategies to reduce social and economic inequities benefit women of childbearing age and families with young children.
(iii) Encourage ministers of health to act as advocates for social policies that provide income protection, adequate benefits and progressive taxation to reduce child and pensioner poverty.
(iv) Ensure that parenting policies and services empower women with children to take control over their lives, support their children’s health and development and promote a greater parenting role for men. In particular, strengthen family- friendly employment policies by introducing more flexible working hours – without turning to insecure contracts – and make affordable child care available to help parents combine work with their parental responsibilities.

of their children, their grandchildren and subsequent generations. The strongest instruments to break such vicious circles of disadvantage lie at the start of life. The review recommendations address key factors that contribute to perpetuating health inequities.
The interaction between gender inequities and other social determinants increases women’s vulnerability and exposure to the risk of negative sexual and reproductive health outcomes. Poor maternal health, inadequate access to contraception and gender-based violence are indicators of these inequities.
As an illustration of the early effect of the perpetuation of inequity on health, Fig. ES.4 shows that the higher the average level of household deprivation in a country, the greater the chance of a child dying before the age of five years (9). Deprivation in early life is also associated with other health problems, poor diet and deficits in physical, social, emotional, cognitive and language domains of development. These have lifelong effects on life chances and subsequent health.
xix
Recommendation 1(b).
Provide universal, high-quality and affordable early years, education and child care system.
Specific actions
(i) Ensure universal access to a high-quality, affordable, early years, education and child care system as the essential bedrock in levelling social inequities in educational attainment, poverty reduction and gender equality.
(ii) Make special efforts to include in education those children most at risk of experiencing multiple exclusionary processes, particularly:
(a) those with disabilities (b) migrants (c) minority ethnic groups such as Roma.
Fig. ES.4
Mortality among under-fives and percentage of deprived households (lacking three or more essential items) in selected European Region countries
Source: WHO Regional Office for Europe (3); Bradshaw (8); Eurostat (10).
Mortality rate of children younger than five years old per 1000 live births
Percentage of households lacking three or more essential items
0 4010 20 30 50 60
Denmark
NorwaySlovenia
Iceland
Finland
Sweden
Netherlands
Czech Republic
CyprusAustria
GermanyFrance
Slovakia
EstoniaBelgium
Ireland
Hungary
Luxembourg
PolandLithuaniaUnited Kingdom
PortugalGreece
Spain
Latvia
Italy
BulgariaRomania
14
12
10
8
6
4
2
0
Childhood development
Executive summary

The systems that encourage such a good start in life include policies characterized by excellent health care before and after birth, an employment and social protection system that recognizes the risks posed by poverty and stress in early childhood, good parental leave arrangements, support for parenting and high-quality early education and care.
Reinforcing a good start throughout childhood and adolescence requires focusing on parenting skills, the employment and social protection of parents, balancing work and the family life of women and men, equitable education and social support for boys and girls throughout childhood and good systems for developing life and work skills for young people, both during adolescence and early adulthood.
Fig. ES.5 illustrates the variation in attendance of early education programmes across countries and between the richest and poorest people within each country – children of the poorest parents are less likely to attend than the richest.
Action to promote the physical, cognitive, social and emotional development of children is crucial for all children, starting from the earliest years and reinforced throughout childhood and adolescence. Children who experience a positive start are likely to do well at school, attain better-paid employment and enjoy better physical and mental health in adulthood.
A good start is characterized by the following: a mother is in a position to make reproductive choices, is healthy during pregnancy, gives birth to a baby of healthy weight, the baby experiences warm and responsive relationships in infancy, the baby has access to high-quality child care and early education and lives in a stimulating environment that allows safe access to outdoor play. Evidence shows that high-quality early years services, with effects on parenting, can compensate for the effects of social disadvantage on early child development. Given the nature of early childhood, the services that support this stage of life are intergenerational and multiprofessional, include health, education and social welfare and are aimed at parents as well as children. In most countries, this support is unlikely to be initiated through contact with the formal education sector but through health and child care services.
xx Review of social determinants and the health divide in the WHO European Region: final report
Fig. ES.5
Children aged 36−59 months in the quintiles of the population with the lowest and highest income who do not attend any form of early education programme in 12 countries in eastern Europe and central Asia, 2005/2006
Poorest 20%
Richest 20%
Source: UNICEF (11). a The former Yugoslav
Republic of Macedonia (MKD) is an abbreviation of the International Organization for Standardization.
0 20 40 60 80 100
Tajikistan
Bosnia and Herzegovina
MKD a
Kazakhstan
Uzbekistan
Montenegro
Kyrgyzstan
Serbia
Georgia
Albania
Ukraine
Belarus

Child poverty
Relative poverty in childhood strongly influences health and other outcomes throughout life and remains high in much of the Region. In the countries in the eastern part of the Region, despite 10–15 years of economic growth before the current recession, child poverty has been more or less at the same level (12). The main reason why children have not benefited from this economic growth is that the average expenditure on family benefits in this part of the Region was less than 1% of gross domestic product versus 2.25% on average in the countries of the Organisation for Economic Co-operation and Development in 2007 (13).
In the western part of the Region, despite higher average expenditure compared with the eastern part, the European Union survey of incomes and living conditions in 2009 revealed a huge range of child poverty rates across the European Union – from 10% to 33%, shown in Fig. ES.6 (12). Within countries, the rate changed between 2005 and 2009 by a percentage point or more in 20 of the countries shown, with 11 countries increasing.
xxi
Fig. ES.6
Child poverty ratesa in selected European countries in 2009 and change since 2005
2009 child poverty rate
Difference between 2005 and 2009 rates
a Based on <60% median income.
Note: solid bars represent the 2009 child poverty rate. Where arrows are to the right of the bars, this indicates that poverty rates fell between 2005 and 2009: where arrows are to the left of the end of the bar, poverty rates increased.
Source: Bradshaw (8).
Romania
Latvia
Bulgaria
Lithuania
Italy
Greece
Spain
Poland
Portugal
Luxembourg
United Kingdom
Hungary
Malta
Estonia
Switzerland
Ireland
Slovakia
France
Belgium
Netherlands
Germany
Austria
Czech Republic
Sweden
Finland
Cyprus
Slovenia
Denmark
Norway
Iceland
0 5 10 15 20 25 30 35
Executive summary

Employment and high-quality work are critically important for population health and health inequalities in several interrelated ways.
�� Participation in or exclusion from the labour market determines a wide range of life chances, mainly through regular wages and salaries and social status.
��Material deprivation resulting from unemployment or low-paid work and feelings of unfair pay – such as high levels of wage disparities within organizations – contribute to physical and mental ill health.
�� Occupational position is important for people’s social status and social identity, and threats to social status from job instability or job loss affect health and well-being.
�� An adverse psychosocial work environment defined by high demand and low control, or an imbalance between efforts spent and rewards received, is associated with an increase in stress-related conditions; such exposure follows a social gradient (Fig. ES.7).
�� Experiences of discrimination, harassment and injustice aggravate stress and conflict at work, especially in times of high competition and increasing job insecurity.
�� Exposure to physical, ergonomic and chemical hazards at the workplace, physically demanding or dangerous work, long or irregular work hours, temporary contract and shift work and prolonged sedentary work can all adversely affect the health of working people.
Levels of unemployment across the Region are high and vary substantially by country, age, sex, migrant status and educational level. They have recently risen considerably in the countries most affected by recession and the economic crisis, such as Spain and Greece. Fig. ES.8 and Fig. ES.9 illustrate the great variation across the Region.
There is comprehensive scientific evidence on increased health risks resulting from precarious employment, which carries a heightened risk of becoming unemployed, and from unemployment itself – particularly from long-term unemployment.
The review recommendations address the causes of inequities in ill health associated with work conditions and unemployment.
xxii Review of social determinants and the health divide in the WHO European Region: final report
Fig. ES.7
Psychosocial stress and occupational class in selected countries in the European Region
Effort–reward imbalance
Low control
Source: Wahrendorf et al. (15); SHARE (16).
Very low
Occupational class
Percentage
50
40
30
20
10
0
Low High Very high
Employment, working conditions and health inequities
Recommendation 1(c).
Eradicate exposure to unhealthy, unsafe work and strengthen measures to secure healthy workplaces and access to employment and good-quality work.
Specific actions
(i) Improve psychosocial conditions in workplaces characterized by unhealthy stress.
(ii) Reduce the burden of occupational injuries, diseases and other health risks by enforcing national legislation and regulations to remove health hazards at work.
(iii) Maintain or develop occupational health services that are financed publicly and are independent of employers.
(iv) At international level, intensify and extend the transfer of knowledge and skills in the area of work-related health and safety from European/international organizations, institutions and networks to national organizations.
(v) In low- and medium-income countries, prioritize measures of economic growth (in accordance with an “environmental and sustainability strategy”) that are considered most effective in reducing poverty, lack of education and high levels of unemployment. To achieve this, invest in training, improved infrastructure and technology and extend access to employment and good-quality work throughout major sectors of the workforce.
(vi) In high-income countries, ensure a high level of employment in accordance with the principles of a sustainable economy and without compromising standards of decent work and policies of basic social protection.
(vii) Protect the employment rights of, and strengthen preventive efforts among, the most vulnerable (in particular, those with insecure contracts, low-paid part-time workers, the unemployed and migrant workers).
(viii) Address rising levels of unemployment among the young by creating employment opportunities and ensuring they take up good-quality work through education, training and active labour-market policies.

xxiii
Fig. ES.8
Unemployment rates among women in selected countries in the European Region by age, 2011
Age 25–74
Age under 25
Source: Eurostat (17).
Fig. ES.9
Unemployment among 15−24-year-olds and total unemployment in countries of central and eastern Europe and the Commonwealth of Independent States, 2010 (or latest available year)
Among 15–24-year-olds
Total
a The former Yugoslav Republic of Macedonia (MKD) is an abbreviation of the International Organization for Standardization.
Note: the data for Tajikistan are for 2009 and the data for Albania are for 2008.
Source: TransMonEE (18).
Greece
Spain
Croatia
Slovakia
Italy
Portugal
Latvia
Lithuania
Poland
Bulgaria
Hungary
France
Romania
Ireland
Sweden
Cyprus
Estonia
Turkey
Luxembourg
Belgium
United Kingdom
Finland
Czech Republic
Slovenia
Malta
Denmark
Iceland
Austria
Norway
Netherlands
Germany
0 10 20 30 40 50 60
Bosnia and Herzegovina
MKDa
Serbia
Montenegro
Armenia
Georgia
Lithuania
Latvia
Slovakia
Estonia
Croatia
Albania
Hungary
Poland
Bulgaria
Romania
Czech Republic
Republic of Moldova
Ukraine
Russian Federation
Tajikistan
Kyrgyzstan
Slovenia
Azerbaijan
Kazakhstan
0 10 20 30 40 50 60
Annual average percentage unemployed
Executive summary

Older people Theme B – Wider society
Social protection policies, income and health inequities
Social protection
Social protection policies can create a buffer against income loss and can redistribute income both over the life-course and between individuals. Individuals and families can also draw on the collective resources provided by welfare state institutions. Both are important for health and well-being. For this reason, the welfare resources necessary to have an acceptable quality of life – including economic resources, working conditions, housing conditions, education and knowledge – constitute key social determinants of health.
Understanding the underlying determinants of health and inequities among older people is an important priority for the Region, the part of the world in which population ageing is most advanced. Effective strategies are required to promote healthy, active and independent lives in old age through early preventive action to delay the onset of age-related mental and physical disabilities. Proportionally more attention needs to be paid to older adults with lower incomes in designing these preventive programmes. In addition, policies aimed at tackling social and economic inequities, in general, such as redistribution schemes and those focused on tackling financial barriers in access to care should all be designed to reduce inequities among the older population.
Fig. ES.10 shows how the gender gaps in the time men and women can expect to live and be in good health vary between countries in the Region. It shows that, in every country, women live longer than men but spend more years not in good health. In Portugal, women live six years longer than men but spend eight more years not in good health. Conversely, in Estonia, women live 11 years longer than men but only 6 years longer not in good health.
In addition to focusing on the causes of shorter longevity among men in the Region, special attention should be devoted to older women, who have more health problems and are at greater risk of poverty in old age because they live longer and have a different life-course. Chronic rather than acute morbidity is the most consistent explanatory factor for differences in health and disability between men and women. Many age-related mental health problems are also more common among women. Older people may experience discrimination or disregard and social isolation because of their age. Social isolation is a powerful predictor of mortality.
xxiv Review of social determinants and the health divide in the WHO European Region: final report
Recommendation 1(d).
Introduce coherent effective intersectoral action to tackle inequities at older ages to prevent and manage the development of chronic morbidity and improve survival and well-being across the social gradient.
Specific actions
(i) Ensure action is focused on addressing ageism, the right to work, social isolation, abuse, standards of living (including living conditions, social transfers and adequacy of pensions), opportunities for physical activity and access to health and social care.
(ii) Devote particular attention and action to the social, economic and health problems of older women, who have more physical and mental health problems in old age, a greater risk of poverty and live more years with disability.
Recommendation 2(a).
Improve the level and distribution of social protection according to needs to improve health and address health inequities.
Specific actions
(i) Ensure spending on social protection is increased effectively according to need by making proportionately greater increases in countries with lower levels of spend and ambition, as follows.
�� Do something: make some programme improvements in countries characterized by low levels of spend and low ambition for social protection.
�� Do more: further increase the ambitions of social protection programmes in countries characterized by medium−high ambitions in terms of social protection policies.
�� Do better: improve levels of social protection in general and for the most vulnerable in particular among the most developed welfare states, but where the redistributive and protective capacity of the welfare state has diminished.
(ii) Make more effective use of resources already used for social protection.
(iii) An international, multidimensional and age- related framework is required to provide a standard methodology for calculation based on the specific needs of groups within the context of the society in which they live. As such, unlike poverty levels, the minimum does not have a uniform value for a country.
(iv) Adopt a gender equity approach to tackle social and economic inequities resulting from women being overrepresented in part-time work, having less pay for the same job and undertaking unpaid caring roles.

The less people achieve in terms of individual resources, the more important it is that they be able to draw on collective resources – welfare policies that provide more generous transfers and better-quality services are likely to improve public health and reduce health inequities. A major problem in the European Region is not only low income associated with unemployment but employment that pays too little to lead a healthy life.
People with low levels of education tend to benefit more from higher levels of social transfers than those with secondary and tertiary education. In both absolute and relative terms, educational inequities
in health decrease as social spending increases; and, the effect that increased spending has on these inequities is greater for women than for men.
Where existing levels of social spending and social rights are in the low-to-moderate range, even small improvements in legislated social rights and social spending are associated with improved health (Fig. ES.11). This suggests that countries with the least-developed social protection systems can make gains most easily. Even modest increases would be of importance in poorer countries in the Region.
xxv
Fig. ES.10
Differences between women and men in healthy life-years and life expectancy at birth in the European Union, 2010
Additional years lived by women
Additional years spent in good health by women
Source: Eurostat (42).
Portugal
Switzerland
Belgium
Iceland
Netherlands
Denmark
Cyprus
Sweden
Spain
Finland
Slovakia
Norway
Romania
Italy
United Kingdom
Germany
Ireland
Slovenia
Austria
Malta
Greece
France
Luxembourg
Czech Republic
Hungary
Latvia
Croatia
Poland
Bulgaria
Estonia
Lithuania
–5 0 5 10 15
Executive summary

xxvi Review of social determinants and the health divide in the WHO European Region: final report
reasons, although differences in mortality and morbidity rates between men and women are well documented, the scale of these varies widely across the Region and is changing in many countries. The appropriate response is to adopt a gender equity approach in tackling social and economic inequities.
The objective of the joint United Nations Social Protection Floor Initiative (SPF-I) is to ensure a basic level of social protection and a decent life both as a necessity and an obligation under the human rights instruments (20). A key aim of policy in the European Region should be the maintenance of minimum standards needed for healthy living.
Gender
The social and economic roles performed by men and women significantly affect the health risks to which they are exposed over the life-course. A specific source of psychosocial stress for women over the life-course is balancing the burdens of caregiving to different generations, paid work and housekeeping. Men’s health is more frequently affected by work conditions. Risk-taking and other behaviour among men, such as violence, are encouraged by gender norms and endanger the health and well-being of both men and women.
Societal and economic changes affect gender roles, but societal norms and values may limit the extent to which the people affected adapt. The combined effect of these is to alter health outcomes and the extent of the gender gap – for example, the current 13-year life expectancy gap between males and females in the Russian Federation. For these
Fig. ES.11
Social welfare spending and all-cause mortality in 18 countries, European Region, 2000
Source: Stuckler et al. (21).
Social spending per capita (purchasing power parity)
Age-standardized all-cause mortality per 100 000 population
1100
1000
900
800
700
600
500
1000 2000 3000 4000 5000 6000 7000
Slovakia
Poland
Hungary
Czech Republic
Portugal
Ireland
Greece
Spain
United KingdomNetherlands
ItalyGermany
Finland
France
Austria
Denmark
Sweden
Luxembourg

xxvii
People on low incomes are less likely to have the means and resources to mitigate the risks and effects of environmental hazards and to overcome the obstacles posed by environmental disadvantages to securing less hazardous conditions and access to opportunities.
How people experience social relationships influences health inequities. Critical factors include how much control people have over resources and decision-making and how much access people have to social resources, including social networks, and communal capabilities and resilience. Social capital has been identified as a catalyst for coordination and cooperation, serving as an essential means to achieve better social and economic outcomes. There is, however, no consistency in the factors that are associated with strong social networks and social capital. Although this argues against excessive generalization, some evidence indicates that social networks appear, in general, to be stronger in countries with higher poverty rates; social capital tends to be more easily built in countries with relatively strong democracies that have effective legal systems; and that strong civil societies contribute to building strong democracies (24).
Spatial quality – how places and spaces are planned, designed, constructed and managed – affects the distribution of environmental burdens and benefits affecting health and inequities (Table ES.1). The quality of infrastructure, including water and sanitation, are crucial to health, along with other factors. Immigrant communities and people living in slum conditions throughout the European Region often live in the most polluted areas (25). Across the central and eastern parts of the Region, especially in the former Soviet republics, hazardous waste and chemicals are major contributors to environmental injustice (26). Access to safe water has recently deteriorated in several countries in the eastern part of the Region, although the situation has been improving in this area as a whole (27). Although people living in rural areas tend to have little access to sanitation (28), the poorer groups in urban areas bear the greatest impact of droughts affecting the water supply (29). Improving the environment has been one of the rallying points of civil society in the eastern part of the Region.
Local communities
Communities are influenced and shaped by the complex interrelationships between the natural, built and social environments. The lower people are on the socioeconomic gradient, the more likely they are to live in areas where the built environment is of poorer quality and is less conducive to positive health behaviour and outcomes and where exposure to environmental factors that are detrimental to health is more likely to occur (22).
People who live in areas of higher deprivation are more likely to be affected by tobacco smoke, biological and chemical contamination, hazardous waste sites, air pollution, flooding, sanitation and water scarcity, noise pollution and road traffic (23). At the same time, they are less likely to live in decent housing and in sociable and congenial places of high social capital that feel safe from crime and disorder, provide access to green spaces and have adequate transport options and opportunities for healthy living.
Recommendation 2(b).
Ensure concerted efforts are made to reduce inequities in the local determinants of health through co-creation and partnership with those affected, civil society and a range of civic partners.
Specific actions
(i) Ensure championing of partnership and cross-sector working by local leaders.
(ii) Ensure all actions are based on informed and inclusive methods for public engagement and community participation, according to locally appropriate context, to empower communities and build resilience.
(iii) Make the use of partnership-working more extensive, including using local knowledge, resources and assets in communities and those belonging to agencies, to foster cooperation and engagement to support community action and the diversity of local people. Physical resources such as schools, health and community centres should be used as the basis for a range of other services.
(iv) Give priority in environmental policies to measures that help to improve health and apply to all population groups likely to be affected, particularly those who are excluded (such as homeless people and refugees) or vulnerable (young and elderly).
(v) Adopt strategies to improve air quality and reduce health risks from air pollutants for all groups across the social gradient.
Executive summary

xxviii Review of social determinants and the health divide in the WHO European Region: final report
a DALYs: disability-adjusted life-years b RR: relative risk c OR: odds ratio d DNS/PNS: delayed or persistent neurocognitive sequelae e COPD: chronic obstructive pulmonary disease f ALRI: acute lower respiratory infection
Table ES.1
Poor quality of the built environment affects health: summary of exposure, population-attributable fraction from inadequate housing conditions
Source: Braubach et al. (30)
Exposure Health outcomes Exposure–risk relationship
Population-attributable fraction (%)
Mould Asthma deaths and DALYsa in children (0–14 years)
RRb = 2.4 12.3
Dampness Asthma deaths and DALYs in children (0–14 years)
RR = 2.2 15.3
Lack of window guards Injury deaths and DALYs in children (0–14 years)
RR = 2.0 33–47
Lack of smoke detectors Injury deaths and DALYs (all ages) RR = 2.0 2–50
Crowding Tuberculosis RR = 1.5 4.8
Indoor cold Excess winter mortality 0.15% increased mortality per °C
30
Traffic noise Ischaemic heart disease, including myocardial infarction
RR = 1.17 per 10 dB(A)
2.9
Radon Lung cancer RR = 1.08 per 100 Bq/m3
2–12
Residential second-hand smoke Lower respiratory infections, asthma, heart disease and lung cancer
Risk estimates range from 1.2 to 2.0; ORc = 4.4
Estimates range from 0.6% to 23%
Lead Mental retardation, cardiovascular disease, behavioural problems
Case fatality rate 3% 66
Indoor carbon monoxide Headache, nausea, cardiovascular ischaemia/insufficiency, seizures, coma, loss of consciousness, death
DNS/PNSd incidence3–40%
50–64
Formaldehyde Lower respiratory symptoms in children OR = 1.4 3.7
Indoor solid fuel use COPDe, ALRIf, lung cancer RR = 1.5–3.2 6–15

Social exclusion, vulnerability and disadvantage
From the perspective of the social determinants of health, it is important to understand exclusion, vulnerability and resilience as dynamic multidimensional processes operating through relationships of power. Previously, exclusion has too often been approached by focusing on the attributes of specific excluded groups.
Recognizing that exclusionary processes and vulnerabilities vary among groups and societies over time suggests that action should be based on addressing the existence of continuums of inclusion and exclusion and vulnerability. This does not deny the existence of extreme states of exclusion, but it helps avoid the stigmatization inherent in an approach that labels particular groups as “excluded”, “disadvantaged” and/or “vulnerable”. This continuum approach should also increase understanding of the processes at work and how these might be reversed and shift the focus from passive victims towards the potential for disadvantaged groups to be resilient in the face of vulnerability. The review focused on two important examples: vulnerability among Roma and among irregular migrants – people without permission to either live or work in the country of residence.
Roma
The exposure of Europe’s Roma to powerful social, economic, political and cultural exclusionary processes, including prejudice and discrimination, adversely affects their human rights and self-determination. Progress in reducing the social inequities experienced by Roma has been limited. This situation is leading to gross inequities in health and well-being among the Roma compared with other populations in the Region.
Factors affecting progress and implementation include: the complexity of funding arrangements; lack of data for monitoring and evaluation purposes; inadequate systems of governance and accountability; insufficient participation of Roma people and civil society; and an absence of political will. These problems need to be addressed through political commitment both at national and transnational levels.
The “Decade of Roma inclusion” provides a valuable example of this – a commitment by 12 European governments to improve the socioeconomic status and social inclusion of Roma. During this initiative, no single country performed consistently well across all the policy areas. However, positive outcomes were achieved by several specific initiatives: for example, active participation of Roma in housing developments in Hungary and the establishment of recycling centres and cooperatives in Serbia.
xxix
Recommendation 2(c).
Take action to develop systems and processes within societies that are more sustainable, cohesive and inclusive, focusing particularly on groups most severely affected by exclusionary processes.
Specific actions
(i) Address the social determinants of health and well-being among people exposed to processes that lead to social exclusion:
�� avoid focusing on individual attributes and behaviours of those who are socially excluded; and
�� focus on action across the social gradient in health that is proportionate to need rather than the gap in health between the most- and least-disadvantaged groups.
(ii) Involve socially excluded individuals and groups in the development and implementation of policy and action by putting in place effective mechanisms that give them a real say in decisions that affect their lives and by recognizing their human rights (to, for example, health, education, employment and housing).
(iii) Develop strategies that:
�� focus action on releasing capacity within organizations, professional groups and disadvantaged groups to achieve long-term improvements in resilience and how those who are socially excluded are able to live their lives;
�� make a corresponding reduction in the focus on short-term spending projects;
�� empower disadvantaged groups in their relationships with societal systems with which they have contact; and
�� include cross-border action on transnational exclusionary processes (such as those affecting Roma and migrants in irregular situations).
Executive summary

xxx Review of social determinants and the health divide in the WHO European Region: final report
Fig. ES.12
Unemployment rates in selected countries in the European Region by country of birth, 2011
Nationals of that country
Foreign nationals
Source: Eurostat (31).
Irregular migrants
As an indicator of lack of participation in societal opportunities, Fig. ES.12 shows that unemployment rates are higher among migrants in many countries. Irregular migrants who are particularly exposed to additional exclusionary processes face the greatest problems – for example, those who need health care, unaccompanied minors, irregular female domestic workers and victims of trafficking, mostly women being exploited in the sex trade. States vary in the extent to which they allow irregular migrants access
to social protection, including health care. Withholding access, denying them the “right to the highest attainable health”, is seen as one important element of “internal migration control”, and detention is another. However, these measures do not seem to have much effect on the numbers of irregular migrants – their main effect is increased vulnerability to marginalization, destitution, illness and exploitation. Migration issues and the living conditions of regular and irregular migrants need to be addressed by agreements between countries in the Region that do not infringe their human rights.
Norway
Switzerland
Luxembourg
Austria
Netherlands
Germany
Belgium
Malta
Czech Republic
Iceland
Denmark
Sweden
Cyprus
Romania
Finland
United Kingdom
Italy
Slovenia
France
Poland
Estonia
Hungary
Bulgaria
Portugal
Slovakia
Croatia
Ireland
Latvia
Lithuania
Greece
Spain
0
Percentage unemployed
10 20 30

xxxi
Theme C – Macro-level context
Social expenditure
The background to the review is the global financial crisis and the related sovereign debt crisis. They are likely to have a direct, negative, lasting effect on health and its social determinants in Europe, particularly if the response to the financial and debt crises does not take health equity concerns into account. For example, the direct health effects are already becoming evident in some countries in the Region (Fig. ES.13).
Recommendation 3(a).
Promote equity through the effective use of taxes and transfers. In particular, the proportion of the budget spent on health and social protection programmes should be sustained in all countries and increased for countries below the current European average.
Specific actions
(i) Improve the balance between the overall level of social spending and:
(a) spend on other programmes; and (b) the overall level of taxation in those countries
where these indicators are below the current European average.
(ii) Promote equity effectively by adopting best practice in the design of social spending programmes, including universal provision that is proportionate to need, integrated social care and labour-market policies that incorporate active labour-market programmes.
(iii) In addressing the financial crisis, ensure priority is given to the health and social consequences of the austerity packages that are now being discussed or have already been introduced in many European countries. As a step towards ensuring that the processes are inclusive of all people, the views of ministers for health and social affairs should be heard in the negotiations about such austerity packages and, at transnational level, those of WHO, United Nations Children’s Fund, International Labour Organization and The World Bank.
(iv) Widen the discussion of financial stabilising mechanisms to prioritize socially progressive policies − such as those recommended in this review − by considering, for example, the likely impact of taxing financial transactions.
Fig. ES.13
Changes in self-reported health and access to health care in Greece between 2007 and 2009, adjusted estimates
2007
2009
Note: the odds ratio refers to the odds of ill health or unmet need in each year compared with the odds in 2007, so that the odds ratio in 2007 equals 1 for each indicator.
Source: Kentikelenis et al. (32)
0
0.2
0.4
0.6
0.8
1.0
Odds ratio
1.2
Unmet dental care needs
Unmet medical care needs
Bad or very bad self-reported health
Executive summary
This highlights the need to protect the social and health sectors from austerity-driven cuts and from some of the negative effects of financial support agreements between countries in the Region and transnational bodies by using other measures that have smaller negative effects, both economically and on health, whenever these are available.

xxxii Review of social determinants and the health divide in the WHO European Region: final report
Sustainable development and health
Recommendation 3(b).
Plan for the long term and safeguard the interests of future generations by identifying links between environmental, social and economic factors and their centrality to all policies and practice.
Specific actions
(i) Ensure that the principles of sustainable development are applied to all policies, taking account of evidence on the impact of development in the past on current and future generations.
(ii) Include health equity assessments for current and future generations in environmental policies at all levels.
(iii) Introduce fiscal policies that improve the affordability of healthy and sustainable food choices:
(1) ensure that the cost of a nutritious and sustainable diet is reflected in calculations of a minimum standard of living for all; and
(2) ground agricultural policies in equity and sustainability and ensure that they promote access to safe, affordable, nutritious food for all and sustainable and equitable food systems.
Environmental quality is linked to social equity: where environmental harm occurs, it is often linked to the unequal distribution of environmental hazards. Factors determining health and social justice are interdependent with factors determining environmental and economic sustainability. For example, excessive consumption of animal fat is associated with increased risk of preventable diet-related diseases, including several types of cancer and cardiovascular disease, while producing animal-based food to supply demand is associated with environmental costs, including water use and greenhouse gas emissions. If low-income countries seek to develop their economies by emulating industrialized economies, this may have dire consequences for the natural environment and for health and health inequities across the Region. Populations in low- and middle-income countries in the Region are likely to reap the greatest benefit from interventions that provide a healthier and safer environment, since they tend to be disproportionately exposed to inadequate environmental conditions (25). Fig. ES.14 illustrates the unequal levels of air pollution in capital cities in the Region.
Integral to facing this challenge of reducing inequitable environmental harm is an approach, endorsed in the 2011 Rio Political Declaration on Social Determinants of Health, that embraces sustainable development. Some progress has been made in the last two decades – for example, energy efficiency, in terms of energy use per dollar of gross domestic product, has improved in countries in the eastern part of the Region and in European Union countries (33) (Fig. ES.15) – but much more needs to be done.

xxxiii
Fig. ES.14
Annual average concentrations of particulate matter in the capital city in 2009 and change since 2005, selected countries, European Region
Particulate matter 2009
Difference between 2005 and 2009 concentrations
a The latest figures for Romania and Sweden are for 2008.
b The latest figures for Greece are for 2007.
Note: the solid bars represent the level of particulate matter in 2009. Where the arrows are to the right of the bars, this indicates that levels fell between 2005 and 2009. Where the arrows are to the left of the end of the solid bar, levels increased between 2005 and 2009.
Source: WHO Regional Office for Europe (3).
Fig. ES.15
GDP energy intensity in selected countries in the eastern part of the European Region, EU27a and world average
1990
2000
2007
a EU27: countries belonging to the European Union after January 2007.
Source: Olshanskaya (34).
Turkey
Bosnia and Herzegovina
Bulgaria
Romaniaa
Serbia
Albania
Poland
Greeceb
Hungary
Belgium
Slovenia
France
Portugal
Russian Federation
Germany
Netherlands
Luxembourg
Czech Republic
Austria
Slovakia
Lithuania
Spain
Latvia
Norway
United Kingdom
Switzerland
Swedena
Denmark
Finland
Ireland
Estonia
Iceland
0
Micrograms per cubic metre
10 20 30 40 50 60 70
Uzbekistan
Kazakhstan
Tajikistan
Turkmenistan
Russian Federation
Ukraine
Republic of Moldova
Belarus
Kyrgyzstan
World
Georgia
Azerbaijan
Armenia
EU27
Total primary energy supply/gross domestic product
0 0.2 0.4 0.6 0.8 1.0 1.2 1.4
Executive summary

Governance for social determinants of health and health equity seeks to strengthen the coherence of actions across sectors and stakeholders in a manner that increases resources to: (a) redress current patterns and magnitude of health inequities; and (b) reduce inequities in the distribution of the social determinants of health and of the risks and consequences of disease and premature mortality across the population.
Governance for health comprises: “the attempts of governments or other actors to steer communities, whole countries, or even groups of countries in the pursuit of health as integral to well-being through both a whole-of-society and a whole-of-government approach” (34).
At European Region level, it is necessary to develop a much stronger institutional framework for this, based on mutual agreements between countries and involving the WHO Regional Office for Europe and its partner organizations. At every level of governance, arrangements are needed that are capable of building and ensuring joint action and accountability of health and non-health sectors, public and private actors and ordinary people, with a common interest in improving health on equal terms. Fig. ES.16 illustrates the different levels of voice and accountability seen across the Region.
Key competencies that governance for health systems need to deliver strategies for addressing the social determinants of health are shown in Box ES.2.
xxxiv Review of social determinants and the health divide in the WHO European Region: final report
Theme D – Systems
Governance
Recommendation 4(a).
Improve governance for the social determinants of health and health equity. This requires greater coherence of action at all levels of government − transnational, national, regional and local – and across all sectors and stakeholders − public, private and voluntary.
Specific actions
(i) Develop partnerships at all levels of government that enable collaborative models of working, foster shared priorities between sectors and ensure accountability for equity.
(ii) Ensure that the coherence of actions across sectors and stakeholders is strengthened to achieve:
(1) sufficient intensity of action – increase the resources devoted to redressing current patterns and magnitude of health inequities;
(2) long-term investment and sustainability of actions; and
(3) levelling-up the gradient in health equity and the social determinants of health.
(iii) Ensure that the different needs, perspectives and human rights of groups at risk of marginalization and vulnerability are heard through their involvement in decision-making processes, with effective mechanisms for adequate participation, engagement and consultation with all parts of civil society.
(iv) At regional level, ensure the Regional Office and its partner United Nations organizations in Europe work together through the “United Nations collaboration mechanism” to have a voice in transnational agreements affecting the social determinants of health.
(v) Strengthen WHO’s role and capacity to better advise Member States on developing policies on the social determinants of health and advocate for health equity in other relevant sectors.
Box ES.2
Key competencies to deliver strategies for addressing the social determinants of health
�� High level of political will and commitment, globally, nationally and locally
�� Transnational mechanisms that promote health and equity
�� Accountability mechanisms�� transparent�� based on empowerment
�� Equity in all policies
�� Appropriate levers and incentives
�� Institutional readiness
�� Collaboration and action from key stakeholders
�� Rights-based appraoch
�� Involve communities�� draw on and strengthen capabilities and assets
�� Cross-sectoral and partnership working�� embedded in existing management and performance systems

A key action area is to develop new instruments and mechanisms – and strengthen those that exist – to empower people and ensure that the opinions and perspectives that are heard in decision-making processes include a better reflection of equity arguments. Empowering people includes promoting civil society, enabling unions to be formed and developing political and non-political organizations freely.
Participatory mechanisms such as citizens’ juries, consumer panels and community planning methods have the potential to engage the diversity of stakeholders with an interest in the social determinants of health and provide new ways of holding decision-makers more accountable for their actions. They also promote greater political involvement across societies and contribute to more equitable allocation of resources.
xxxv
Fig. ES.16
Voice and accountability scores of countries in the European Region according to The World Bank worldwide governance indicators
a The former Yugoslav Republic of Macedonia (MKD) is an abbreviation of the International Organization for Standardization.
Source: The World Bank (36).
NorwaySwitzerland
SwedenDenmark
LuxembourgFinland
NetherlandsAustria
BelgiumIceland
AndorraGermany
IrelandUnited Kingdom
FranceSan Marino
SpainEstonia
PortugalCyprusPoland
Czech RepublicSloveniaMonaco
ItalyHungary
LithuaniaGreece
SlovakiaLatviaIsrael
BulgariaRomania
CroatiaSerbia
MontenegroAlbania
MKDa
Republic of MoldovaBosnia and Herzegovina
UkraineGeorgiaArmenia
Russian FederationKyrgyzstan
KazakhstanAzerbaijanTajikistan
BelarusUzbekistan
Turkmenistan –2.5 –1.5 –0.5 0 0.5 1.5 2.5
Voice and accountability score
Executive summary

Priorities for public health, ill health prevention and treatment
xxxvi Review of social determinants and the health divide in the WHO European Region: final report
Recommendation 4(b).
Develop a comprehensive, intersectoral response to the long-term nature of preventing and treating ill health equitably to achieve a sustained and equitable change in the prevention and treatment of ill health and the promotion of health equity.
Specific actions
Prevention
Ensure that actions on preventable health hazards are based on addressing the substantial differences in exposure within and between countries, including:
(i) reduce harmful alcohol consumption by, for instance, introducing a tax on alcoholic beverages that is proportional to the alcohol content;
(ii) initiate wider actions to reduce fats, particularly transfats, in diet and control the growth of fast-food consumption;
(iii) take action to reduce smoking under the Framework Convention on Tobacco Control; and
(iv) encourage active living, focusing on needs across the social gradient.
Treatment
Reduce differential access to good-quality health care services within and between countries, including actions to:
(i) make health care systems more equitable − universal health coverage is required to provide a critical foundation for addressing health inequities; and
(ii) remove financial, geographic and cultural barriers to the uptake of health care services (such as copayments) and ensure adequate resource allocation that takes account of extra need in disadvantaged areas.
Strategies
(i) Ensure that strategies to address inequities within and between countries (including those related to gender):
(1) develop systems able to adequately assess, plan and deliver sustained action to reduce health inequities;
(2) improve the capacity of public health systems to address health inequities;
(3) strengthen health-promotion, health-protection and disease-prevention systems to ensure universal coverage for all social groups, and link these to policies and programmes that specifically address the determinants of lifestyles and behaviours;
(4) improve accessibility and quality of health care services; and
(5) ensure no adverse effects from transnational agreements and regulations.
(ii) Provide external support for developing and implementing these strategies to address inequities in countries where they are weakest, including a number of countries in the central and eastern parts of the Region.
(iii) Ensure a balance between strategies that have short-, medium- and longer-term results and between simpler and more complex integrated interventions. Specific areas for action are:
(1) strategies that give societies, groups and individuals greater control over their exposure to preventable hazards, such as regulation and control over the workplace and the environment, tobacco, alcohol and food content, availability and pricing and addressing societal norms and values;
(2) design screening programmes to be accessible by all, particularly the most vulnerable and disadvantaged, for cardiovascular risk factors and early detection of cancers; and
(3) ensure effective implementation of infectious disease strategies (for tuberculosis and HIV/AIDS, for example) that disproportionately affect socially disadvantaged and vulnerable people, including addressing the causes of vulnerability, gender inequities and adequate, sustainable access to screening, diagnosis and treatment services.
(iv) Monitor and assess population health equity impacts across these recommendations disaggregated by sex, age and 2−3 key socioeconomic determinants.

xxxvii Executive summary
reached. The response to this requires appropriate country-specific priorities and strategies that encompass equity issues. Where WHO strategies and framework statements exist, they provide a basis for developing this response.
Similarly, treatment strategies to tackle health inequities within countries must also be adapted to national priorities and specific health systems within a framework of equity and an aspiration of universal provision for the population as a whole – with resources allocated according to social need and provision for disadvantaged groups.
Actions can be taken now to improve population health in the short and medium term, whereas others will take longer to have an impact. Achieving sustained and equitable change in preventing and treating ill health therefore requires achieving a balance between strategies that have short-, medium- and longer-term results as well as between simpler and more complex, integrated interventions.
Between-country differences
Reasonably good evidence indicates that part of the health divide between countries in the Region is associated with: (a) differences in exposure to preventable health hazards that result from inequities in the social determinants of health and of behaviour and lifestyles – including inequities in exposure to tobacco, alcohol, unhealthy diets, high blood pressure, risk of cervical cancer, conditions leading to road injury, dangerous or stressful working conditions and air pollution; and (b) differences in the accessibility and quality of health care services.
The contribution of these factors, however, differs between countries and over time. For example, excessive alcohol consumption is relatively more important in some countries in central and eastern Europe as a determinant of poor population health, and smoking, while being one of the main downstream determinants of health inequities in northern and western parts of the Region, is not a major determinant of health inequities in the southern part. The contribution of differential access to good-quality health care services also varies between countries. Although inadequate access to effective care may make only a modest contribution to the observed health inequities in northern, western and southern Europe, it is likely to have a stronger influence on the larger inequities in mortality observed in the eastern part of the Region.
The evidence on these different contributions provides important entry-points to policies for preventing and treating ill health designed to reducing the health divide between countries. Two important strategies are: (a) strengthening health promotion, health protection and disease prevention in the central and eastern parts of the Region; and (b) making improvements that reduce differences in the accessibility and quality of health care services.
Within-country differences
The exposure to preventable health hazards that arises from social determinants, as described above, contributes to socioeconomic inequities in health within countries. This is observed, for example, in relation to levels of obesity according to education (Fig. ES.17). The contribution of such health risks as exposure to tobacco smoke, unhealthy diet, physical inactivity and misuse of alcohol differs across the Region because of local social norms and values and the stage that behaviour-related epidemics have

xxxviii Review of social determinants and the health divide in the WHO European Region: final report
Fig. ES.17
Percentage of the population that is obesea by level of education and sex, selected countries, European Region
a Body mass index ≥ 30 kg/m2. Source: Roskam et al. (37).
Men aged 25–44
Highest education
Second highest
Second lowest
Lowest education
France
Italy
Portugal
Latvia
Lithuania
Finland
Denmark
Belgium
Netherlands
Norway
Slovakia
Spain
Ireland
Czech Republic
Sweden
Estonia
Germany
Hungary
United Kingdom (England)
0 5 10 15 20 25 30
Percentage obese
Women aged 25–44
Highest education
Second highest
Second lowest
Lowest education
30
Italy
Portugal
Norway
Spain
Finland
Ireland
Latvia
Czech Republic
Belgium
France
Slovakia
Netherlands
Lithuania
Estonia
Denmark
Sweden
Hungary
Germany
United Kingdom (England)
0 5 10 15 20 25
Percentage obese

xxxix
Improving health and health equity requires an approach that is based on evidence and up-to-date information. A monitoring system that supplies information to policy-makers and other stakeholders about the distribution and trends in health outcomes, risk factors, ill health prevention and treatment and their determinants is an essential part of the social determinants approach to improving health equity.
One role of a monitoring system is to enable stakeholders to evaluate the impact of policies and interventions and whether the benefits are fairly distributed to promote a long and healthy life for all. However, the time lags between policy interventions and their effects on health status, as well as the difficulties of attributing an effect to specific policy interventions, require the use of process and output indicators rather than relying solely on indicators of outcomes. However, outcome data are necessary and, in the final analysis, the definitive criteria.
Measurement and targets
Recommendation 4(c).
Undertake regular reporting and public scrutiny of inequities in health and its social determinants at all governance levels, including transnational, country and local.
Specific actions
(i) In all countries, establish clear strategies – based on local evidence – to redress the current patterns and magnitude of health inequities by taking action on the social determinants of health.
(ii) Include in these strategies monitoring of the social determinants of health across the life-course and the social and geographic distributions of outcomes.
(iii) Undertake periodic reviews of the strategies at all governance levels, including in-depth analytical descriptions of the magnitude and trends in inequities in health and the main determinants that generate them:
(1) initiate the strategy review process in each country immediately, based on currently available information;
(2) ensure progressive improvement in the availability and access to data needed to achieve this, both in terms of monitoring trends and evaluating what actions are most effective; and
(3) develop minimum standards for the data required to achieve this, including the engagement of transnational organizations that collect or collate data.
(iv) Member States to provide regular reports on their reviews to WHO for discussion at regional meetings.
Although indicators of process, outputs and outcomes are necessary, they are not sufficient to guide policy. Effective mechanisms are needed to enable the individuals and groups who are the targets of policy to be heard and involved in a meaningful way in decisions that affect their lives.
An effective monitoring system is essential to support the setting of targets, which are identified as desirable goals. The goals in a health equity-oriented approach are ultimately improvements in health outcomes that raise the health of all groups to the level of the best in society. Currently, the main challenges to setting targets and monitoring progress on social inequities in health and, more broadly, social determinants of health, in the Region are the lack of reliable data and the plethora of existing but not standardized data. European data legislation, including the relevant European Union directives, should facilitate rather than hinder such monitoring.
The setting of equity-oriented targets needs to be the result of a political process involving all relevant stakeholders. However, targets require a monitoring framework that is accompanied by data of sufficiently good quality, is comparable over time and can be disaggregated, so that progress towards the target can be assessed effectively. Fig. ES.18 shows the iterative framework for doing this. This is designed to ensure the correct sequencing of target setting, policy intervention development, implementation and subsequent review, in the light of monitoring results.
Fig. ES.18
Indicator framework
Source: Marmot Review Team (38).
Policy objectives and mechanisms
Specific interventions and policies
Delivery processes
Outputs from interventions
Outcomes from interventions
Performance improvement
Targets
Monitoring Process indicators
Output indicators
Outcome indicators
Executive summary

Conclusions
There are persistent and widespread inequities in health across the European Region. These inequities, both between and within countries, arise from inequities in the distribution of power, money and resources. As such, they are unnecessary and unjust, and tackling them should be a high priority at all levels of governance in the Region.
Action is needed on the social determinants of health – across the life-course, in wider social and economic spheres and to protect future generations. Human rights approaches support giving political priority to improving health and reducing inequities in its social determinants.
The European economic crisis and the response to it have adversely affected the social determinants of health. Taking action to reduce inequities in the social determinants of health would both improve the prospects for health and bring wider social benefits that enable people to achieve their capabilities.
Countries can use health equity in all policies as a key commitment to inform further action to reduce inequities in health, address its social determinants and to reduce the perpetuation of inequities. Nevertheless, new systems of governance and delivery are also required. These need to operate at all levels of governance – involving both the whole of society and the whole of government. They need to give individuals, groups and communities a real say in decisions that affect their lives.
In all countries in the Region, it is recommended that reducing health inequities should become one of the main criteria used to assess health system performance and the performance of government as a whole. It should also be a principal criterion for assessing the work of WHO in the Region.
It is recommended that all 53 countries in the Region establish clear strategies to redress the current patterns and magnitude of health inequities by taking action on the social determinants of health. Countries should undertake regular reviews of these strategies. These should be reported to WHO and discussed at regular regional meetings.
It is recognized that European countries are at very different starting points in terms of health, health equity and socioeconomic development. For some countries in the Region, the recommendations are ambitious and aspirational. Although this may limit what is feasible in the short term and the time scale for addressing specific issues, it should not affect the long-term aspirations of the strategy. Progressive steps towards realizing these ambitions should be developed, covering: the life-course – perpetuation across generations, early years, working and older ages; wider societal influences – social protection, communities and social exclusion; the broader context – the economy, sustainability and the environment; and the systems needed for delivery – governance for health, prevention, treatment, the evidence base and monitoring.
This review has compiled robust evidence on what should be done and the action required for implementation. It is crucial that countries across the Region work together to reduce health differences both within and between countries by using and building on this evidence to create strategies that deliver better health for all their populations.
xl Review of social determinants and the health divide in the WHO European Region: final report

References
1. Health 2020: a European policy framework supporting actions across government and society for health and well-being. Copenhagen, WHO Regional Office for Europe, 2012 (http://www.euro.who.int/en/what-we-do/health-topics/health-policy/health-2020-the-european-policy-for-health-and-well-being, accessed 15 July 2013).
2. Commission on Social Determinants of Health. Closing the gap in a generation: health equity through action on the social determinants of health. Final report of the Commission on Social Determinants of Health. Geneva, World Health Organization, 2008 (http://www.who.int/social_determinants/thecommission/finalreport/en/index.html, accessed 15 July 2013).
3. European health for all database [online database]. Copenhagen, WHO Regional Office for Europe, 2013 (http://data.euro.who.int/hfadb/, accessed 15 July 2013).
4. Livslängden i Sverige 2001−2010. Livslängdstabeller för riket och länen [Life expectancy in Sweden 2001−2010. Life tables for the country and by county]. Stockholm, Statistics Sweden, 2011 (Demografiska rapporter [Demographic reports] 2011:2; http://www.scb.se/statistik/_publikationer/BE0701_2001I10_BR_BE51BR1102.pdf, accessed 15 July 2013).
5. Sen A. Development as freedom. New York, Alfred A. Knopf, 1999. 6. Venkatapuram S. Health justice. Cambridge, Polity, 2011. 7. Health 2020: policy framework and strategy. Copenhagen, WHO
Regional Office for Europe, 2012 (http://www.euro.who.int/__data/assets/pdf_file/0020/170093/RC62wd08-Eng.pdf, accessed 15 July 2013).
8. Bradshaw J. Social exclusion, vulnerability & disadvantage task group background paper 3: child poverty in the WHO European Region. Copenhagen, WHO Regional Office for Europe, 2012.
9. The state of the world’s children 2007. New York, UNICEF, 2007. 10. European Union Statistics on Income and Living Conditions
(EU−SILC) [online database]. Luxembourg, Eurostat, 2013 (http://epp.eurostat.ec.europa.eu/portal/page/portal/microdata/eu_silc, accessed 15 July 2013).
11. Emerging challenges for children in eastern Europe and central Asia. Multiple indicator cluster survey in 12 countries [online database]. Geneva, UNICEF, 2008 (http://www.micsinfo.org/home.aspx, accessed 15 July 2013).
12. Bradshaw J, Mayhew E, Alexander G. Minimum social protection for families with children in the CEE/CIS countries in 2009: a report for UNICEF. York, University of York, Social Policy Research Unit, 2010.
13. Innocenti social monitor 2009. Child well-being at a crossroads: evolving challenges in central and eastern Europe and the Commonwealth of Independent States. Florence, UNICEF Innocenti Research Centre, 2009.
14. Wahrendorf M, Siegrist J. Working conditions in mid-life and participation in voluntary work after labour market exit. In: Börsch-Supan A et al., eds. The individual and the welfare state. Heidelberg, Springer, 2011:179–188.
15. Wahrendorf M, Dragano N, Siegrist J. Social position, work stress, and retirement intentions: a study with older employees from 11 European countries. European Sociological Review, 2012, DOI: 10.1093/esr/jcs058.
16. Survey of health, ageing and retirement in Europe [web site]. Munich, Research Unit SHARE, 2012 (http://www.share-project.org, accessed 15 July 2013).
17. Unemployment rate by sex and age groups − annual average, % [online database]. Brussels, Eurostat, 2011 (http://appsso.eurostat.ec.europa.eu/nui/show.do?dataset=une_rt_a&lang=en, accessed 15 July 2013).
18. TransMonEE [online database]. Geneva, TransMonEE, 2004−2013 (http://www.transmonee.org/, accessed 15 July 2013).
19. Healthy life years and life expectancy at birth, by gender [online database]. Brussels, Eurostat, 2012 (http://epp.eurostat.ec.europa.eu/portal/page/portal/product_details/dataset?p_product_code=TSDPH100, accessed 15 July 2013).
20. Social protection floor initiative [web site]. Geneva, Social Protection Floor Work Group, International Labour Organization, 2010 (http://www.ilo.org/public/english/protection/secsoc/downloads/spfibrochure-en.pdf, accessed 15 July 2013).
21. Stuckler D, Basu S, McKee M. Budget crises, health, and social welfare programmes. British Medical Journal, 2010, 340:3311.
22. Environment and health risks: a review of the influence and effects of social inequalities. Copenhagen, WHO Regional Office for Europe, 2010 (http://www.euro.who.int/__data/assets/pdf_file/0003/78069/E93670.pdf, accessed 15 July 2013).
23. 2010 EPHA briefing on health inequalities. Brussels, European Public Health Alliance, 2010.
24. Putnam RD. Making democracy work: civic traditions in modern Italy. Princeton, NJ, Princeton University Press, 1993.
25. Social and gender inequalities in environment and health. Copenhagen, WHO Regional Office for Europe, 2010 (http://www.euro.who.int/__data/assets/pdf_file/0010/76519/Parma_EH_Conf_pb1.pdf, accessed 15 July 2013).
26. CEU Center for Environmental Policy and Law, Health and Environment Alliance and Coalition for Environmental Justice. Making the case for environmental justice in central and eastern Europe. Brussels, Health and Environment Alliance, 2007.
27. Health and environment in Europe: progress assessment. Copenhagen, WHO Regional Office for Europe, 2010 (http://www.euro.who.int/__data/assets/pdf_file/0010/96463/E93556.pdf, accessed 15 July 2013).
28. Access to improved sanitation and wastewater treatment. Copenhagen, WHO Regional Office for Europe, 2009 (http://www.euro.who.int/__data/assets/pdf_file/0009/96957/1.3.-Access-to-improved-sanitation-and-wastewater-treatment-EDITED_layouted.pdf, accessed 15 July 2013).
29. Castro JE. Water, power and citizenship: social struggle in the Basin of Mexico. Basingstoke, Palgrave Macmillan, 2006.
30. Braubach M, Jacobs DE, Ormandy D. Environmental burden of disease associated with inadequate housing. Copenhagen, WHO Regional Office for Europe, 2011 (http://www.euro.who.int/__data/assets/pdf_file/0017/145511/e95004sum.pdf, accessed 15 July 2013).
31. Supplementary indicators to unemployment by sex and nationality − annual average [online database]. Brussels, Eurostat, 2013 (http://appsso.eurostat.ec.europa.eu/nui/show.do?dataset=lfsi_sup_nat_a&lang=en, accessed 15 July 2013).
32. Kentikelenis A. Health effects of financial crisis: omens of a Greek tragedy. Lancet, 2011, 378:1457–1458.
33. Governance and delivery mechanisms task group report. Copenhagen, WHO Regional Office for Europe, 2012.
34. Olshanskaya M. Overheated: two decades of energy transition in the former Soviet Union. New York, United Nations Development Programme, 2009.
35. Kickbusch I, Gleicher D. Governance for health in the 21st century: a study conducted for the WHO Regional Office for Europe. Copenhagen, WHO Regional Office for Europe, 2011 (http://www.euro.who.int/__data/assets/pdf_file/0010/148951/RC61_InfDoc6.pdf, accessed 15 July 2013).
36. The Worldwide Governance Indicators, 2011 update. Washington, DC, The World Bank, 2011 (http://www.govindicators.org, accessed 15 July 2013).
37. Roskam AJ et al. Comparative appraisal of educational inequalities in overweight and obesity among adults in 19 European countries. International Journal of Epidemiology, 2010, 39:392–404.
38. Fair society, healthy lives: strategic review of health inequalities in England post-2010. London, Marmot Review Team, 2010 (www.instituteofhealthequity.org, accessed 15 July 2013).
xli Executive summary

xlii Review of social determinants and the health divide in the WHO European Region: final report
chri
stia
n al
s | p
anos
pic
ture
s

Context 1
Part I Context
The WHO European Region has seen remarkable health gains through progressive improvements in the conditions in which people are born, grow, live, work and age. Inequities between and within countries nevertheless persist.
The review of inequities in health between and within countries across the 53 Member States of the European Region reported here was commissioned to support the development of the new European policy framework for health and well-being, Health 2020 (1). Much more is now understood about the extent and social causes of these inequities, particularly since the 2008 publication of the report of the Commission on Social Determinants of Health (CSDH) (2). The European review builds on the global evidence and recommends policies to ensure progress can be made in reducing health inequities and the health divide across all countries, including those with low incomes.
Action is needed on the social determinants of health across the life-course and in wider social and economic spheres to achieve greater health equity and protect future generations.
Structure of the report
The report is presented in four parts, with nine chapters.
Part I Context
Chapter 1 provides the context and background to the review, summarizing the arguments for action on social determinants of health across the European Region.
Chapter 2 sets out the key principles underpinning the review recommendations and the rationale for grouping them into four broad themes: life-course stages, wider society, macro-level broader context, and systems.
Part II Evidence on the health divide and health inequities in the European Region
Chapter 3 provides a summary of current evidence on the magnitude of the health divide among European Region countries, inequities in health and social determinants.
Part III Specific areas of action on the social determinants of health
Chapters 4−7 focus on the themes described in Chapter 2 in more detail, setting out and discussing recommendations relating to each theme and summarizing supporting evidence provided by the review’s task groups.
Case studies and other examples are interspersed throughout Chapters 4–7 to illustrate innovative, evidence-based approaches that have been taken across Europe and beyond.
Part IV Implementation and action
Chapter 8 outlines the implementation issues relevant to a social determinants of health approach. It summarizes the framework for action, discusses reasons for failure and provides guidance on good practice.
Chapter 9 summarizes the recommendations of the review and the actions required to secure their implementation.

2 Review of social determinants and the health divide in the WHO European Region: final report
1 Introduction: why the review is necessary
1.1 The need for action on social determinants of health to achieve health equity
1.1.1 Context
The WHO European Region includes countries with close to the best health and narrowest health gaps in the world, but with substantial health inequities.
Evidence suggests that health improvement in the Region is related to a long and sustained period of improvement in people’s lives, lived in socially cohesive and increasingly affluent societies with developed welfare states and high-quality education and health services. These have created the conditions to enable people to lead lives they have reason to value, resulting in remarkable health gains.
But not everyone has shared equally in social, economic and health development. Although socioeconomic circumstances have improved in all countries, differences remain. Health has suffered as a consequence, particularly in countries to the east of the Region, but even more-affluent countries have increasingly seen inequities in people’s life conditions, with declining social mobility and cohesion. Health inequities are not diminishing, but are increasing in many countries. The economic crisis since 2008, more profound and extended than most people predicted, has exacerbated this trend and exposed stark social and economic inequities within and between countries.
1.1.2 The review
The WHO Regional Office for Europe commissioned this review of social determinants of health and the health divide to address health inequities within and between countries across the 53 Member States of the European Region. Its conclusions and recommendations informed the development of Health 2020 (1), the new European policy framework for health and well-being.
Systematic health differences between social groups that are avoidable by reasonable means are unfair. The term “health inequities” is used throughout this review to describe these avoidable inequalities. Much is understood now about the extent and social causes of inequities, particularly since the publication of the CSDH report in 2008 (2). The review builds on the CSDH report’s evidence and conclusions to make recommendations relevant to the European context.
The review’s European-specific focus is justified, as it comes at an important point in European history. The Region’s great diversity creates opportunities to offer policy analysis and make recommendations relevant to low-, middle- and high-income countries. The results of the review are clear: with the right choice of policies, progress can be made across all countries, including those with low incomes.
Human rights approaches support priority being given to improving health and reducing inequities through definitive policy action on the social determinants of health. Health inequities are widespread, persistent, unnecessary and unjust: tackling them should be a high priority at all levels of governance in the Region. Necessary action is needed across the life-course and in wider social and economic spheres to protect present and future generations.
Drawing on the findings and recommendations of the CSDH (2), this review aims to address the fundamental reasons − the “causes of the causes” – of these health differences: the conditions in which people are born, grow, live, work and age and the inequities in power, money and resources that give rise to them. It provides guidance on what is possible and what works for consideration within countries’ specific circumstances and settings. Its recommendations are practical and focused.
One response to addressing health inequities open to all countries is to ensure universal coverage of health care. Another is to focus on types of behaviour – smoking, diet and alcohol consumption – that are in part, the more immediate causes of health inequities but are themselves socially determined. The review endorses both these responses. But its recommendations extend further, to the “causes of the causes”. Without improvements in all the social determinants of health, there will be no significant reductions in health inequities.
Fig. 1.1 shows the life expectancy of countries in the Region − a measure of the health divide. Most countries in the lowest quintile are in the east. The range between the highest and lowest is 17 years for men and 12 for women.
The health inequities picture in the Region is not about poor health for people in poor countries and good health for everyone else. Fig. 1.2 provides an example of how health inequities persist between social groups within some of the most-affluent countries with high life-expectancy levels.
2 Review of social determinants and the health divide in the WHO European Region: final report

Introduction: why the review is necessary 3
Fig. 1.2
Life expectancy trends in Sweden 2000−2010 by education level, men and women
Source: Statistics Sweden (4).
Men
Post-secondary
Upper-secondary
Compulsory
Women
Post-secondary
Upper-secondary
Compulsory
2000 2001 2002 2003 2004 2005 2006 2007 2008 2009 2010
Life expectancy at age 30
58
56
54
52
50
48
46
2000 2001 2002 2003 2004 2005 2006 2007 2008 2009 2010
Life expectancy at age 30
58
56
54
52
50
48
46
Fig. 1.1
Life expectancy in countries in the European Region, 2010 (or latest available)
Life expectancy – quintiles:
Highest
Second
Third
Fourth
Lowest
Source: WHO Regional Office for Europe (3).
4 Review of social determinants and the health divide in the WHO European Region: final report
1.2 Structure and purpose of the review
The review’s explicit purpose was to assemble new evidence that could be applied to the remarkable diversity of countries that make up the European Region, drawing on the findings and recommendations of the CSDH (2). Diversity exists in relation to national income, social development, history, politics and culture, all of which are relevant to the social determinants of health.
Thirteen task groups were established to review new evidence on what action can be taken on the social determinants of health across the Region. The review draws on their findings to present recommendations and provide specific examples of how they can be applied in diverse country contexts, addressing Region-wide issues in tackling health inequity and its social determinants while tailoring solutions to meet individual Member States’ needs. Regions, countries, cities and districts can use the scientifically based recommendations to develop policies and programmes specific to their circumstances. Empowerment, a basic tenet of the review, means not imposing solutions on them from outside.
1.2.1 Health inequalities that are avoidable are unjust − action is required across society
The review’s analysis shows that whole-of-government action on the social determinants of health is necessary to achieve progress on health equity. Health ministers clearly have a role in ensuring universal access to high-quality health services but also need to provide leadership in advancing the case that health should be regarded as an “outcome” of policies pursued in other arenas. The link between health equity and social policies is close. The magnitude of health inequity is a measure of how well a society is meeting its citizens’ needs: health is not simply a marker of good practice in this respect, but is also valued highly by individuals and society. Safeguarding the interests of future generations also requires that policies aiming to reduce inequities be linked to those in areas such as addressing climate change.
The review makes the moral case for action on social determinants of health − social injustice kills and causes unnecessary suffering on a large scale across the Region – but the economic case is also strong. The cost of health inequities to health services and in lost productivity and government revenues is such that no society can afford inaction. In addition, tackling inequities in the social determinants of health brings other improvements to societal well-being, such as greater social cohesion and better education.
1.2.2 Areas for action – emphasizing priorities
European countries should have two clear health aims: improve average health, and reduce health inequities by striving to bring the health of less-advantaged people up to the level of those with greatest advantage. Improving the levels and equitable distribution of social determinants should achieve both aims. Similarly, reducing health gaps between countries requires that efforts be made to bring the level of the least healthy countries up to that of the healthiest.
Two types of strategy are needed to achieve this: action on social determinants to improve average health and reduce health inequities within each country; and action to address the causes of inequities between countries at transnational level.
Adequate monitoring and review is necessary to ensure accountability and transparency and provide evidence that action has been taken. It is recommended that all 53 countries in the European Region establish clear strategies to redress the current patterns and magnitude of health inequities by taking action on the social determinants of health. Countries should undertake regular reviews of these strategies, reporting findings to WHO for discussion at regional meetings.
The review grouped its recommendations on the strategies required into four themes – life-course stages, wider society, macro-level broader context, and systems. Action is needed on all four. The themes are described in more detail in Chapter 2.
4 Review of social determinants and the health divide in the WHO European Region: final report

Concepts, principles and values 5
2 Concepts, principles and values
2.1 Introduction
Chapter 2 summarizes the conceptual approaches, frameworks and principles that underpin and inform the recommendations for action in Part III. As indicated in Chapter 1, the socioeconomic, political, environmental and cultural factors that shape health across the Region and within countries are known as the social determinants of health (2). The review uses the conceptual framework for the social determinants approach to causation developed for the CSDH (Fig. 2.1).
Public health has focused in recent decades on proximate causes of health and health inequities. For chronic diseases, this has meant focusing on aspects of lifestyle (smoking, diet, alcohol consumption and physical activity) to chronic disease. The CSDH’s (and the review’s) perspective is that lifestyle causes of poor health reside in the social environment, broadly conceived.
The causal pathways shown in Fig. 2.1 start with the nature of society, which may be influenced by global forces acting outside a particular country (the nature of trade, aid, international agreements and environmental concerns given prominence by climate change). These wider societal-level processes influence individuals’ exposure to health-damaging (and health-promoting) conditions and
affects their vulnerabilities (and resilience). The effects accumulate throughout life, from pregnancy and early years development, through educational experiences, reproductive ages and relationship-building, to the labour market and income generation during normal working ages, and into later years. Many are transmitted across generations from grandparents and parents to children. Exposures and vulnerabilities are, in general, unequally distributed in society according to socioeconomic position and other factors such as race/ethnicity or gender.
The approach’s conceptual underpinning is the importance of empowerment: material, psychosocial and political. This means having the material requirements for a decent life, having control over one’s life, having a political voice and participating in decision-making processes. This approach to empowerment has featured in several recent comparative studies in Europe (5,6). The full realization of human rights is critical to improving health and reducing inequity.
Much of the health divide between countries may be understood as arising from the influences of social determinants of health within countries: a country that fails to meet the human needs of large swathes of its population will be a country with poor health. But, as indicated above, the social determinants of health within countries are themselves affected by influences acting beyond the country’s borders.
Fig. 2.1
CSDH conceptual framework
Source: CSDH (2).
Socioeconomic and political context
Governance Social position
Health care system
Distribution of health and well-being
Policy
Macroeconomic Social Health
Cultural and societal norms and values
Education Occupation Income Gender Ethnicity/race
Material circumstances Social cohesion Psychosocial factors Behaviours Biological factors
Social determinants of health and health inequities

6 Review of social determinants and the health divide in the WHO European Region: final report
6 Review of social determinants and the health divide in the WHO European Region: final report
2.2 General principles
Three general principles run through the review and inform its analysis and recommendations.
The first is the moral case for action. Health is highly valued by individuals and society. Health inequalities that are avoidable by reasonable means are unjust (hence the term “health equity” to describe a social goal). Actions that reduce avoidable inequalities in health should be developed and prioritized. The moral and economic cases for action come together in many areas. Investment in early child development and education, for instance, may meet the demands not only of efficiency, but also of justice. Action on social determinants of health leads to other benefits to society, which may produce economic gains: within a more cohesive, educated population there is likely to be fewer crimes and acts of civil disorder, a more highly skilled workforce and people leading lives they have reason to value and enjoying better health and greater health equity.
The second is that economic difficulties are a reason for action on social determinants of health, not inaction. The economic crisis affecting Europe provides the stark background and the urgent challenge to this work. Economic problems will have an adverse impact on the lives people are able to lead and will obstruct progress towards improving health and achieving greater health equity. It is often argued that coping with severe economic difficulties requires a reduction in investment in health and its social determinants. Yet the evidence laid out in this review is clear: investment in early child development, active labour-market policies, social protection, housing and climate change will help protect populations from the adverse effects of the economic crisis and lay the basis for a healthier future.
Third, the evidence assembled for the review shows that much can be done by all sectors of society to address the social determinants of health and promote health equity. International organizations, national and local governments and local community groups all have significant roles to play: there is a wealth of evidence and many examples of successful actions taken to reduce health inequities.
2.3 Conceptual approaches to understanding and promoting health equity
The review adopted a number of distinct approaches within the framework of general principles to develop an understanding of how the social determinants of health operate and subsequently promote action on health equity across Europe. These are summarized in Box 2.1 and explained in more detail below.
Box 2.1
Key concepts in understanding and promoting health equity
�� It is essential to address the social determinants of health, the conditions in which people are born, grow, live, work and age and which are the key determinants of health equity. These conditions of daily life are, in turn, influenced by “structural drivers”: economic arrangements, distribution of power, gender equity, policy frameworks and the values of society.
�� Taking a life-course approach to health equity recognizes the accumulation of advantage and disadvantage across the lifetime of every individual. The approach begins with the important early stages − pregnancy and early child development − and continues with school, transition to working life, employment and working conditions, and circumstances affecting older people.
�� There is a social gradient in health: people and communities have progressively better health the higher their socioeconomic position/conditions. It is important to design policies that act across the whole gradient, as well as addressing the needs of people at the bottom and those who are most vulnerable.
�� Policies that are universal but are implemented at a level and intensity of action that is proportionate to need – proportionate universalism – are required to achieve both these objectives.
�� It is important to address the processes of exclusion rather than focusing simply on addressing particular characteristics of excluded groups. This approach has much potential in addressing the social and health problems of the Roma population, irregular migrants and those who suffer from less extreme forms of exclusion but dip in and out of vulnerable contexts.
�� There is a need not only to address the hazards and risks to which individuals and communities are subjected, but also to build on their assets – resilience, capabilities and strengths.
�� Gender equity is an important consideration. The social determinants of health may affect the genders differently. In addition to biological sex differences, fundamental social differences also exist in the fairness with which women and men are treated and the assets and resilience they possess. Gender relations affect health in all societies to varying degrees and should shape actions to reduce inequities.
��Much focus has been, and will continue to be, placed on equity within generations. The perspectives of sustainable development and the importance of social inequity affecting future generations means that intergenerational equity must be emphasized. The effect of actions and policies on inequities for future generations must be assessed, with risks mitigated.

7
2.3.1 Social determinants
Social arrangements, institutions and policies
As was stated in section 2.1, societal factors – the conditions of daily life and their “structural drivers” – influence people’s exposure to health-damaging and health-promoting conditions through all stages of life. Specific socioeconomic and other influences that systematically influence individuals’ or groups’ risks of ill health can be categorized as:
�� individuals’ attributes – age, sex, height, birthplace and others factors acquired through their parents’ social conditions: most are not amenable to policy intervention, but the effect they have on social, economic and health outcomes can readily be influenced;
�� the identities society and social institutions ascribe to individuals, such as those relating to gender norms and gender relations, sexuality, ethnicity, nationality and disability;
�� the broad material and social conditions of people’s lives, including their psychosocial conditions, material wealth and assets; and
�� the specific hazards to which individuals are exposed, including the risks posed by physical, chemical and biological substances.
Addressing the causes of inequity associated with, or resulting from, these dimensions requires distinct approaches to developing policy interventions, including consideration of intergenerational transmission of health and other acquired attributes (such as gender roles). The relationship between these and the broad themes into which the review’s recommendations are grouped are discussed in section 2.5.
Social determinants and freedoms
Vibrant debate exists on what is sometimes portrayed as a tension between action on social determinants and individual freedoms. The principle of individual freedom (linked to individual responsibility) is increasingly guiding public health policy, particularly in western European countries, leading to programmes that confer responsibility on individuals rather than acting on social determinants of health. It emphasizes individuals’ right to health and views inequities in isolation from their social context and values. The review’s approach to health equity is to consider it in relation to social context and values.
The assumption that health inequities are clearly morally unjust is frequently contested on the grounds that social policies and programmes to mitigate them can conflict with, for example, individual freedoms and responsibilities, the realization of other social goals because of the costs incurred and the achievement of other aims of health policy, such as maximizing average population health gains.
The “capability approach” developed by Nussbaum (7) and Sen (8) provides a moral foundation for policies to tackle health inequities. It proposes that modern societies should help individuals pursue their diverse conceptions of the “good life”. Social institutions’ role is then to create conditions that make it possible for individuals to have real, practical possibilities to pursue diverse life plans. The focus should therefore be on what people can actually do with the resources to which they have access. This enables a collective approach to be taken to protecting individual freedoms, using a human rights perspective (9).
Society’s wider influences on the social determinants of individual health are of fundamental importance in enabling people to achieve the capabilities that lead to good health. The review calls for social action (with individual freedoms and responsibilities featuring strongly in the approach taken) by drawing on Sen’s insights on freedoms to enable people to lead a life they have reason to value (10).
An individual’s resources and capabilities for health are influenced by social and economic arrangements, “collective” resources provided by the communities of which they are part and by welfare-state institutions. Human rights approaches can support these resources. The right to health entails rights to equity in the social determinants of health. As Venkatapuram has argued, the right to health should be understood as a moral claim on the “capability to be healthy”, which is determined largely by the social determinants of health (11).
Human rights, injustice and health inequities
Human rights are central to the approach taken to action on the social determinants of health. They embody fundamental freedoms and indicate the societal action necessary to secure their enactment. Health is enshrined as a human right in WHO’s constitution (12) and is an obligation that all Member States have committed to uphold. All have ratified an international human rights treaty that commits them to promote and protect the right to health. In relation to gender equality, states have committed themselves through international human rights treaties to ensuring equal rights and non-discrimination.
Human rights are referenced in a wide range of treaties adopted at United Nations level and within the framework of regional human rights systems. Examples include the International Covenant on Civil and Political Rights (13) and the International Covenant on Economic and Social and Cultural Rights (14). The most important human rights treaties at European level are the European Convention on Human Rights and Fundamental Freedoms and the European Social Charter, both of which are adopted within the framework of the Council of Europe (CoE) (15).
Concepts, principles and values

8 Review of social determinants and the health divide in the WHO European Region: final report
8 Review of social determinants and the health divide in the WHO European Region: final report
The processes are dynamic and occur throughout life, reflecting factors that most immediately affect health and well-being, characterizing individuals and communities at points in time and influencing people’s adoption of the lifestyles and behaviours prevalent in their communities. This indicates the need for action at every stage of life, with the life-course emerging as the right way to plan action on social determinants of health: while the review emphasizes early childhood, strong recommendations are also presented relevant to people of working and older age.
A life-course perspective recognizes that influences operating at each life stage can change levels of exposure to harmful processes or help exposed people to beat the odds. Social arrangements and institutions (preschool, school, the labour market and pension systems) have a huge effect on the opportunities that empower people to choose their own course in life, but differ enormously across Europe. Their structures and effects are, to a greater or lesser extent, influenced or mitigated by national and transnational policies.
The perpetuation of social and economic inequities that have affected previous generations is an important influence on the subsequent life-course, resulting in the indefensible persistence of health inequities across generations. The predominant tendency in Europe at present is for health inequities within and between countries to grow. Unless this cycle is broken, the next generation will face a greater burden of health and other inequity than the current one inherited. This is discussed further in Chapter 4.
2.3.3 Social gradient in health
Socioeconomic processes (such as social stratification) and those that are exclusionary (unequal access to resources, capabilities and rights) apply unequally across society and give rise to a social gradient in health.
The lower a person’s social position, the worse his or her health is likely to be. People in the most disadvantaged social groups and communities, who are subject to many different types of exclusionary processes, experience much worse health than those in more advantaged circumstances, implying a gradient that increases with level of deprivation, rather than being linear. Disadvantaged groups may be in the majority in some societies and not an excluded minority, with most people living in poverty.
Socioeconomic and exclusionary processes operate without regard to national boundaries: the social gradients they produce are seen across countries and include the forces shaping irregular migration and discrimination against, for example, ethnic groups such as Roma (see Chapter 5 for further discussion of these forces).
The right to health includes the right to the determinants of health (such as water and sanitation, food and nutrition, housing and healthy occupational and environmental conditions), health-related education and information, and available, accessible, acceptable and good-quality health care services. As Chapter 3 indicates, inequities in health correspond to levels and distribution of access to these determinants, such as income, education opportunities, built environments and opportunities for social participation: equity in social determinants of health therefore supports rights relating to social and health equity. The right to health, with other human rights such as gender equality, housing, food and education, provides a framework for addressing the broad range of social determinants of health and health inequities. They provide a rights-based justification for social protection, ensuring the right to freedom from poverty (see Chapter 7).
Governments are responsible for creating conditions that make it possible for individuals to be as healthy as they can be. This requires equity in social determinants of health to improve individuals’ capability to lead a healthy life, which can mean governments need to balance rights against individual freedoms. Addressing differences in health behaviour rooted in unequal circumstances, for example, may involve placing restrictions on individual or corporate freedom of behaviour through regulating or taxing the sale or consumption of tobacco, alcohol and fatty foods.
Human rights law offers a legally binding framework for holding governments to account for violations before national and international judicial and quasijudicial bodies. Available case law indicates that the human rights framework has the capacity to effectively hold governments accountable for policies’ adverse health effects. Human rights can play a steering role in drafting new laws and policies and a political one in nongovernmental organizations’ (NGO’s) activities. A human rights approach to implementing and enforcing existing legislative frameworks relevant to social determinants of health is therefore necessary.
2.3.2 Life-course approach
The review focuses on exposure over the life-course to advantage and disadvantage (with associated hazards and vulnerabilities) and protective influences at individual and community level (empowerment, assets and resilience). These negative and positive factors and processes accumulate over time, influencing individuals’ psychosocial, physiological and behavioural attributes and families’, communities’ and groups’ social conditions. Accumulating advantage and disadvantage leads to social and economic inequities and consequent health inequities.

9
2.3.6 Individuals’ and communities’ resilience, capabilities and strength
Efforts to improve health equity have commonly tended to focus on identifying harmful effects, but individuals, communities and countries have capabilities and assets stemming from their cultural capacities, social networks and natural resources that can enhance and protect health. Their resilience can often be apparent and is related to control and inclusion at individual level and social cohesion at community level. The review recommendations reflect this by addressing not only the need to protect against damage, reduce harm and address exclusionary processes, but also to promote resilience and assets to support empowerment and encourage convergence of policy actions across sectors.
Asset-based approaches are linked to Antonovsky’s framework for explaining “how people manage stress and stay well”. They are based on concepts of salutogenesis, which focus on resources and assets that enable people to maintain and improve their health despite the stressful situations and hardships they experience (16−19). This differs from pathogenic models, which focus on obstacles and deficits, and relies on what is termed a “sense of coherence” − an ability to comprehend the whole of a stressful situation and the capacity to make use of available resources (such as money, skills and social support) to avoid or combat psychosocial stress. Antonovsky argues that it is also important to have a sense of meaning: if a person believes there is no reason to persist, survive and confront challenges, he or she will have no motivation to comprehend and manage events (16,17).
2.3.7 Gender equity
Gender refers to a set of economic, social, political and cultural attributes and opportunities associated with belonging to a particular sex.
Gender inequities arise from the processes by which gender norms and values affect women and men in relation to their roles, access to resources and opportunities. Women and men’s social and economic roles have a significant effect on the health risks to which they are exposed over the life-course. Societal and economic changes affect gender roles, but societal norms and values may limit the extent to which women and men adapt. The combined effect is to alter health outcomes and the extent of the gender gap. The scale of differences in mortality and morbidity rates between men and women varies widely across the European Region and is changing in many countries (see Chapter 3).
2.3.4 Proportionate universalism as a priority-setting strategy in addressing health inequity
The policy response to the social gradient in health should be to take action across the gradient, with an intensity proportionate to the social needs that caused the health differences. Countries should work together to tackle social-gradient determinants when socioeconomic and exclusionary processes operate across country borders.
2.3.5 Processes of exclusion
The review builds on previous analyses to focus on the equity consequences of economic, social, political and cultural processes that can combine and reinforce each other to produce varying degrees of vulnerability and exclusion.
In addition to examining harmful influences of the social environment, the review focuses on processes through which people become vulnerable to subsequent adversity and ill health and which operate throughout life, producing barriers to releasing and enhancing individual and collective capabilities and empowerment. Exclusionary processes (such as exclusion from good-quality education, living and working conditions) operate economically, socially and culturally. European history, up to the current day, demonstrates that exclusion from society has been, and continues to be, experienced by many ethnic groups and minorities.
Perceptions of identity and differences in social roles linked to gender, education and other attributes are strongly affected by societal conditions that contribute to the operation of multiple exclusionary processes. Poor, uneducated migrants, for example, are at greater risk of exclusion than rich, skilled migrants. The way other people perceive identities frequently leads to the vulnerability, exclusion and discrimination experienced. Groups such as Roma, migrants, people with disabilities and the very old become particularly vulnerable when they experience multiple exclusionary processes. This review adds further evidence that supports strengthening several existing processes, such as the “Decade of Roma inclusion”.
Vulnerability resulting from exclusionary and discriminatory processes can become entrenched and have an adverse effect on health. Of particular relevance to the review is the emergence of new forms and patterns of vulnerability arising as a result of the current financial, political and social situation in Europe. How to break these patterns of exclusion and maintain social cohesion is a key issue.
Concepts, principles and values

10 Review of social determinants and the health divide in the WHO European Region: final report
To understand and tackle socioeconomic and health inequities between women and men, a gender equity approach needs to address:
�� unequal access to education and the labour market and the effect this can have on demographic changes;
�� early education and parenting influencing gender norms and values that determine adolescent boys’ and girls’ health behaviour and society’s expectations of them and response to their needs;
�� gender norms and structures determining the use of, and access to, health resources, leading to men’s reduced access to health services and women’s health being medicalized; and
�� gender norms and values acquired through life influencing the assets and risks men and women experience in older age.
2.3.8 Intergenerational equity
Joint action on social determinants of health, social cohesion and sustainable development is necessary. A basic principle of sustainable development is that the present generation should not compromise the environment of subsequent generations: the principle that the current generation should not disadvantage the next can be applied equally to social determinants. This seems particularly pertinent in relation to the economic crisis, as current responses will have profound implications for the conditions affecting subsequent generations and the response to the financial implications of an ageing population.
The implications of intergenerational equity are discussed further in Chapter 6.
2.4 Focus on action − challenge and opportunity
These are challenging times, with political, economic and social differences across Europe on how best to address the economic crisis and consequent social problems. Well-judged and appropriate action on social determinants of health, based on solid evidence, has the potential to make a major difference to health equity in the Region.
2.4.1 Action in a cold economic climate
As indicated in section 2.2, economic difficulties in countries are a reason for action on social determinants of health, not inaction. The review argues that the current economic situation also presents a moral case for action. It highlights where continued investment is required to meet the demands of efficiency and justice − early child development, education, active labour-market
policies and social protection for those who cannot work (especially children).
2.4.2 Health equity requires a whole-of-government approach
Reducing inequities in the social determinants of health requires action across all of government, not just health ministries acting alone. Strong commitment is needed from the top of government with active engagement of education, social protection and finance ministries (20). Health ministries’ roles include:
�� ensuring equity of access to high-quality health services with greater emphasis on prevention, health promotion and “Health in all policies” approaches (21);
�� providing advocacy and leadership for action on the social determinants of health;
�� promoting cross-sectoral working; and
�� supporting monitoring, training and research.
But “Health in all policies” approaches are not sufficient to address social determinants of health: what is needed is “Health equity in all policies”. Government and political institutions have a central role to play in creating the conditions of empowerment and establishing the political and economic environment in which people thrive.
Aligning agendas across government with the primary intention of addressing outcomes relevant to other sectors frequently affects the social determinants of health and health equity, producing multiple benefits. Other ministries’ and agencies’ policies and interventions, as well as those of the health system, should be strengthened as a result in areas such as climate change, environment and employment. Alignment of policies nevertheless poses significant challenges, particularly when jobs are scarce or are only available in small business enterprises that may struggle with, or be exempt from, many policy levers. Alignment is complex and tensions between policies and the organizations that design and deliver them often emerge. Health equity in all policies must, however, remain a central principle through which to embed and deliver greater health equity across social policies.
The causal pathways for an individual’s health are complex and long term. The review sees the debate between personal responsibility on the one hand and social action on the other as being poorly focused. As indicated in section 2.3, central and local government’s role in creating the conditions for people to take control of their lives and enable communities to support social cohesion is key to taking the review’s recommendations forward.
10 Review of social determinants and the health divide in the WHO European Region: final report

11
2.4.3 Mutual responsibility
Reducing differences between countries and closing the European health divide relies to a large extent on countries’ mutual support. There is a need for solidarity and cooperation among Member States to address social and territorial inequities, with strengthening of cooperation mechanisms and governance at international level.
Channelling cooperation to influence the development of European and/or global policies is nevertheless a major problem. The United Nations, WHO, The World Bank and others operating in Europe need to be given a larger role to reflect the scale of the problems and the clear need to develop mutual support mechanisms as a governing principle. Collective human rights and equity, reinforced by human rights legislation, are central to this principle (as discussed in section 2.3).
The principle of mutual responsibility can also be applied to groups of people within a country. Social cohesion is influenced by the same types of social determinants as health and can contribute to reductions in health inequities.
The review suggests Member States could move towards achieving health equity, sustainable prosperity and social cohesion across the Region by working together and accepting mutual responsibility for effecting change.
2.4.4 Taking action − do something, do more, do better
The review, drawing on the research evidence brought together by the task groups, presents recommendations that apply across the diversity of countries in the Region. It has identified and assessed many specific examples of actions taken to tackle health inequity across the Region and illustrates how these can be applied according to different country contexts, providing practical illustrations of what can be achieved at local and national levels. A number of key examples are described in Part III, with many further cases and analyses in the task group reports and background working papers.
A key message emerging from the task groups included the idea of “Do something, do more, do better” to ensure that recommendations are tailored to the very different contexts of Member States. This principle applies as much at transnational and local levels as it does at national.
The message is summarized in Box 2.2.
2.5 Conceptual approach to action on policies and practice
Based on analysis of principles and concepts required to address health inequities and their social determinants (outlined in sections 2.2 and 2.3), the review recommendations are grouped under four broad themes (Fig. 2.2). Justification for recommendations in each area is presented in Part III.
The highest priorities for action within each theme, starting with the effect of the life-course as a central review concept, are as follows.
The life-course
The highest priority is for countries to ensure a good start to life for every child. This requires, as a minimum, adequate social and health protection for women, mothers-to-be and young families and significant progress towards a universal, high-quality, affordable early years education and child care system.
Box 2.2
Do something, do more, do better
�� If countries have very little in place in terms of policies on social determinants of health, “some” action matters.
��Where policies do exist, they can be improved to deal with large and persistent health inequities.
�� There is scope to do better on inequities in the richest countries of Europe.
Macro-level context
Life-course stages
Wider society Systems
Prenatal Early years Working age
Family-building
Older ages
Accumulation of positive and negative effects
on health and well-being over the life-course
Perpetuation of inequities
Fig. 2.2
Broad themes
Concepts, principles and values

12 Review of social determinants and the health divide in the WHO European Region: final report
Systems
Improvements in health and its social determinants will not be achieved without a significant refocusing of delivery systems to a whole-of-government and whole-of-society approach (20). What the health system does and how it influences others to achieve better health and greater equity is important, as is committed leadership from the top of government. Greater coherence of action at all levels of government (transnational, national, regional and local), across all sectors (policies, investment, services) and with all stakeholders (public, private, voluntary) is necessary. Universal access to health care is a priority: it should be protected where already established and progressively extended to all countries in the Region.
Action on prevention must include reduction in the immediate causes of inequity within and between countries − alcohol consumption, smoking and obesity. Effective strategies go beyond provision of information to include taxation and regulation. Evidence suggests that addressing the “causes of the causes” is the right way to proceed on these issues, ensuring people have the skills and control to be able to change behaviours.
An evidence-based focus is essential to understanding the nature and magnitude of the social gradients to be addressed. It enables any reduction in the gradient to be monitored, measured and interpreted and progress against targets assessed. A focus on ongoing monitoring of evidence also enables policy adaptation to ensure greater effectiveness and provides a means of auditing and evaluating policies against the aspiration of equity in all policies, assessing the gap between current levels of inequity and the achievement of health equity.
Specific actions to deliver the review’s recommendations are described in Chapters 4−7. They include actions that are applicable across the Region and those subject to development levels and regional variations in social determinants, policy and economic contexts. Some, such as provision of publicly funded universal coverage of health services, may be aspirational for many countries, but by doing something, they can take the first step. First steps in low- and middle-income countries are likely to reap significant benefits, such as improving envrionmental conditions and increasing social protection.
Emphasis on a good start in life does not mean that actions at later stages of the life-course are not important. They are crucial in reinforcing the skills improvement and individual empowerment provided by a good start and in achieving greater health equity among those adult populations who did not benefit from a good start. Actions should focus particularly on lessening workplace stress, reducing long-term unemployment through active labour-market programmes and addressing the causes of social isolation in older people.
Wider society
The most effective actions to achieve greater health equity at societal level are those that create or reassert societal cohesion and mutual responsibility and ensure an adequate level and distribution of social protection according to need (provision of the latter requires improvement in the level of provision in many countries). This means making better use of existing provision and making progress in increasing the proportion of people who have the minimum standard of living necessary for participating in society and maintaining health.
Supporting action to create cohesion and resilience at local level is essential. It requires a “whole-of-society” approach that encourages local-level partnerships between those affected by inequity and exclusionary processes and a range of civic actors − civil society and other partners. Central to this approach is empowerment – putting in place effective mechanisms that give those affected a real say in decisions that affect their lives and by recognizing their fundamental human rights, including the right to health.
Macro-level context
Wider influences within countries and transnationally shape the lives, human rights and health of people in the Region. The short-to-medium-term priority is to address health consequences of the current financial crisis. Recognition of the health and social consequences of economic austerity packages must influence countries’ economic and fiscal policies. These processes need to be inclusive of all people, with the views of ministers for health and social affairs heard in the negotiations about such austerity packages. At transnational level, those of WHO, the United Nations Children’s Fund (UNICEF), International Labour Organization (ILO) and The World Bank should also be heard on this issue.
Equity between generations is a fundamental driver of environmental policy and must also drive wider societal policies affecting health equity. Environmental, social and economic policy and practice must be brought together.


14 Review of social determinants and the health divide in the WHO European Region: final report
espe
n ra
smus
sen
| pan
os p
ictu
res

Evidence on the health divide and health inequities 15
Part II Evidence on the health divide and health inequities in the European Region
Part II presents evidence on the health divide across the Region and describes health inequities that exist within all countries and their social determinants. The evidence is presented as follows:
�� overview;
�� trends in life expectancy and cause-specific mortality of European Region countries over the last 30 years;
�� demographic pressures in countries across the Region;
�� differences in health between men and women;
��macro socioeconomic conditions across the Region;
�� conditions across the life-course and associated health outcomes;
�� selected examples of health behaviours that contribute to the health divide and to health inequities within countries; and
�� evidence on the widening of health inequities within countries.
Some of the key results presented include:
�� the gap in life expectancy between countries is 17 years for men and 12 for women;
�� social gradients in health within countries persist or have even widened;
�� large differences in income levels and income inequalities exist between countries;
�� child poverty varies across the Region and depends on levels of social transfers;
�� large differences in pre-primary attendance are found within and between countries;
�� education inequalities affect health throughout the life-course;
�� levels of unemployment vary between countries and are growing, particularly among young people; and
�� patterns of smoking, alcohol consumption and obesity vary between countries.

16 Review of social determinants and the health divide in the WHO European Region: final report
3 Health inequities between and within countries
3.1 Introduction
While overall population health has improved for the European Region, levels of health vary significantly between countries: notably, the difference in overall life expectancy between countries is about 13 years. These differences are even greater when inequities within countries, according to gender and socioeconomic position, are considered.
The gap in life expectancy between countries is 17 years for men and 12 for women (Fig. 3.1). Life expectancy for males is about 4–7 years lower in most countries in the Region, but 12 years lower in Belarus and the Russian Federation, 11 in Lithuania and 10 in Estonia, Kazakhstan, Latvia and Ukraine.
3.1.1 Social gradients within countries
Health inequities between men and women and groups with different ethnic backgrounds and socioeconomic position are often interrelated. There is typically a gradient in health according to socioeconomic status (SES): health outcomes worsen with increasing social disadvantage as measured by, for example, income, education, social position and employment (22,23). Fig. 3.2 illustrates this by comparing the gradient in self-reported health by income in Latvia and Sweden.
Despite very different levels, which reflect the countries’ perceptions of health and levels of signs and symptoms of ill health, both have a notable gradient in self-reported health. Studies show that self-reported health is a good predictor of future health (24,25).
16 Review of social determinants and the health divide in the WHO European Region: final report
Fig. 3.1
Life expectancy at birth by sex for countries in the European Region, 2010 (or latest available year)
Females
a The former Yugoslav Republic of Macedonia (MKD) is an abbreviation of the International Organization for Standardization (ISO).
Source: WHO Regional Office for Europe (3).
Spain (2009) France (2008) Italy (2008) Switzerland (2007) San Marino (2006) Andorra (2006) Israel (2009) Iceland (2009) Cyprus (2009) Sweden (2010) Luxembourg (2009) Finland (2010) Austria (2010) Malta (2010) Norway (2010) Netherlands (2010) Germany (2010) Greece (2009) Slovenia (2009) Portugal (2009) United Kingdom (2009) Belgium (2006) Ireland (2009) Czech Republic (2010) Estonia (2010) Denmark (2006) Poland (2009) Croatia (2010) Slovakia (2009) Albania (2004) Lithuania (2009) Hungary (2009) Latvia (2009) Montenegro (2009) Georgia (2009) Romania (2010) Bulgaria (2010) Armenia (2009) Serbia (2009) Belarus (2009) Tajikistan (2005) Azerbaijan (2007) MKDa (2003) Ukraine (2010) Russian Federation (2009) Turkey (2008) Kazakhstan (2009) Republic of Moldova (2010) Uzbekistan (2005) Kyrgyzstan (2009)
55 60 65 70 75 80 85

Health inequities between and within countries 17
Research on countries from the east of the Region provides further evidence of socioeconomic health inequities, which are discussed below. It is difficult in many countries to collect data on individuals’ social characteristics, but often possible to gather information on the health and social features of local neighbourhoods, which provides an indication of the presence of social variation in health. One study, the INEQcities project (26), has done this for a number of European cities. An example of the distribution of health at local level is shown in Fig. 3.3.
Socioeconomic health inequities have been shown within countries in the east and west of the Region, but no comparative analysis across all countries has been undertaken, largely because the data do not exist. Vågerö & Illsley (27) made early efforts to address this issue, but the most extensive study to date in the Region was carried out by Mackenbach et al. (23). They systematically compared social gradients in mortality among men and women
according to education level by using individual information obtained from census data from the Eurothine project of 16 European Union (EU) and European Free Trade Association (EFTA) countries. This evidence indicates considerable variation in levels of inequity in mortality (based on individuals’ level of education) across countries (Fig. 3.4). Inequity was greatest in the countries of central and eastern Europe (CCEE) and least in Italy, Spain and Sweden. Analyses of the relationship with the type of social protection system are presented in section 3.3 and Chapter 5.
Health outcomes (including mortality) follow a social gradient, as illustrated by the two EU-funded analyses depicted in Fig. 3.3 and Fig. 3.4.
Social determinants are key to health improvements in all countries in the Region. To improve country population-level outcomes, health inequities across the social gradient need to be reduced by levelling-up
Fig. 3.1 contd
Males
a The former Yugoslav Republic of Macedonia (MKD) is an abbreviation of the ISO.
Source: WHO Regional Office for Europe (3).
Israel (2009) Iceland (2009) Sweden (2010) Switzerland (2007) Malta (2010) Norway (2010) Italy (2008) Netherlands (2010) Cyprus (2009) Spain (2009) United Kingdom (2009) Luxembourg (2009) Germany (2010) Austria (2010) Greece (2009) France (2008) San Marino (2006) Ireland (2009) Andorra (2006) Finland (2010) Belgium (2006) Portugal (2009) Denmark (2006) Slovenia (2009) Czech Republic (2010) Albania (2004) Croatia (2010) Montenegro (2009) Poland (2009) Slovakia (2009) Serbia (2009) Azerbaijan (2007) Tajikistan (2005) MKDa (2003) Estonia (2010) Armenia (2009) Bulgaria (2010) Hungary (2009) Romania (2010) Turkey (2008) Georgia (2009) Uzbekistan (2005) Latvia (2009) Lithuania (2009) Ukraine (2010) Republic of Moldova (2010) Belarus (2009) Kyrgyzstan (2009) Kazakhstan (2009) Russian Federation (2009)
55 60 65 70 75 80 85

18 Review of social determinants and the health divide in the WHO European Region: final report
18 Review of social determinants and the health divide in the WHO European Region: final report
Fig. 3.3
Mortality of small areas in Kosice, Slovakia
Source: Borrell et al. (26).
Men
Smooth standardized mortality ratios
58.9–91.8
91.8–97.1
97.1–101.5
101.5–106.7
106.7–114.0
114.0–124.6
124.6–160.8
Women
Smooth standardized mortality ratios
51.6–86.4
86.4–90.5
90.5–99.2
99.2–103.8
103.8–111.0
111.0–127.1
127.1–213.5
the gradient. Fig. 3.5 shows what is meant by “levelling-up” the gradient. The lower line represents the social gradient in a health outcome across the social hierarchy, from the least to the most advantaged in society. The upper represents a situation in which health has improved for everyone in society and health inequities have reduced across the gradient. As discussed in the introduction to this report, universalist policy approaches that are proportionate to need, an approach known as proportionate universalism, are required to level-up the gradient.
The shape of the gradient varies within and between countries depending on political, social, economic and cultural factors (the social determinants of health): it is not always a smooth line.
Reducing health inequities within low- and middle-income countries will help to close the health divide across the Region by raising average population health. Health inequities within countries explain part, but not all, of the between-country health differences seen. Different social and cultural norms and values which affect, for example, patterns of tobacco smoking, alcohol use and diet are also important explanatory factors, and influences at transnational level have strong impacts on the social determinants of health within countries.
Fig. 3.2
Percentage reporting their health as being “good” or “very good” by household income quintile, Latvia and Sweden, 2011
Latvia
Sweden
Source: Emese Mayhew, Jonathan Bradshaw, University of York, United Kingdom, personal communication, 2012.
Percentage reporting good or very good health
100
90
80
70
60
50
40
30
20
10
0
1
Income quintile
2 3 4 5

Health inequities between and within countries 19
3.1.2 Demographic pressures on health systems
Ill health rates vary by factors such as age and sex. For this reason, populations’ age and sex structures contribute to differences in the burden of ill health across the Region, both in terms of how they affect the capacity of health systems to deliver and in relation to the absolute scale of health inequity.
Table 3.1 summarizes the demographic profile of the Region in 2010 and the projected profiles in 2020 and 2050. The overall size of the population is projected to increase slightly by 2020 – from 894 million to 910 million – but then to return to current levels by 2050. The number of people aged 15−64, however, will steadily decline and those of 65 and over will increase, leading to an increase in the ratio of older to younger adults.
These ratios are presented as a shorthand indicator of variations in age structure and demand on health systems, rather than an accurate guide to dependence. Many people aged 15−64 are not in paid work, while some over-65s are. Older people and others outside the labour force increasingly make important contributions in other ways, such as providing support to family members.
The number of people 85 years and older provides some indication of changing support and health care requirements. It is projected to rise from 14 million to 19 million by 2020 and to 40 million by 2050. Radical changes in the Region’s age structure will affect the ways in which inequities are addressed in the future.
They raise the possibility that inequities could increase in some areas – for example, between people who can and cannot work into older age and those who can or cannot turn to families or communities for support, and in countries where demographic pressures on health and social care budgets result in reduced welfare provision per capita.
Table 3.2 summarizes the current demographic profile of 50 countries in the Region. The child dependency ratio varies from 20 in 6 countries (Belarus, Bulgaria, Czech Republic, Germany, Latvia and Slovenia) to more than 40 in 5 (Israel, Kyrgyzstan, Tajikistan, Turkmenistan and
Fig. 3.4
Absolute differences (slope index of inequality) in male death rates by level of education in selected parts of the EU and EFTA
Source: Mackenbach et al. (28).
Spain (Basque)
Spain (Madrid)
Sweden
Italy (Turin)
Spain (Barcelona)
Denmark
England and Wales
Belgium
Norway
Switzerland
France
Finland
Europe (estimate)
Slovenia
Czech Republic
Poland
Estonia
Lithuania
Hungary
0
Slope index of inequality in male death rates
500 1000 1500 2000 2500 3000
Fig. 3.5
Levelling-up the social gradient in health
Health outcome
Social distribution

20 Review of social determinants and the health divide in the WHO European Region: final report
Age (years) 2010 population (thousands)
Percentage 2020 population (thousands)
Percentage 2050 population (thousands)
Percentage
All ages 893 700 100 910 900 100 895 651 100
0–14 155 719 17 157 682 17 140 665 16
15–64 608 960 68 600 909 66 531 218 59
65–84 115 349 13 133 370 15 183 600 20
85+ 13 672 2 18 939 2 40 168 4
Ratios of younger and older people per 100 people 15–64 years
Children: 0–14 years
26 26 26
Older people: 65 years and over
21 25 42
Ratio per 100 people aged 15–64 years
Population (millions)
Sex ratio (females per
100 males)
0–14 years 65 yearsand older
Albania 3.2 100 34 14
Armenia 3.1 115 29 16
Austria 8.4 105 22 26
Azerbaijan 9.2 102 29 9
Belarus 9.6 115 21 19
Belgium 10.7 104 26 27
Bosnia and Herzegovina 3.8 108 21 20
Bulgaria 7.5 107 20 25
Croatia 4.4 108 22 25
Cyprus 1.1 96 25 16
Czech Republic 10.5 104 20 21
Denmark 5.6 102 27 25
Estonia 1.3 117 23 25
Finland 5.4 104 25 26
France 62.8 106 28 26
Georgia 4.4 112 24 21
Germany 82.3 104 20 31
Greece 11.4 102 22 28
Table 3.1
Estimated population, percentage age distribution and age ratios, European Regiona 2010, 2020 and 2050
a Excluding Andorra, Monaco and San Marino.
Source: United Nations (29).
Table 3.2
Estimated population, sex ratio and dependency ratios for 50 countries, European Region (projected population, 2010)
a The former Yugoslav Republic of Macedonia (MKD) is an abbreviation of the ISO.
Source: United Nations (29).

Health inequities between and within countries 21
Ratio per 100 people aged 15–64 years
Population (millions)
Sex ratio (females per
100 males)
0–14 years 65 yearsand older
Hungary 10.0 111 21 24
Iceland 0.3 99 31 18
Ireland 4.5 100 32 17
Israel 7.4 103 44 17
Italy 60.6 104 21 31
Kazakhstan 16.0 108 36 10
Kyrgyzstan 5.3 103 46 7
Latvia 2.3 117 20 26
Lithuania 3.3 115 22 23
Luxembourg 0.5 101 26 20
Malta 0.4 102 21 20
Montenegro 0.6 104 28 18
Netherlands 16.6 102 26 23
Norway 4.9 100 28 22
Poland 38.3 107 21 19
Portugal 10.7 106 23 27
Republic of Moldova 3.6 111 23 15
Romania 21.5 106 22 21
Russian Federation 143.0 116 21 18
Serbia 9.9 102 26 21
Slovakia 5.5 106 21 17
Slovenia 2.0 104 20 24
Spain 46.1 103 22 25
Sweden 9.4 101 25 28
Switzerland 7.7 103 22 25
Tajikistan 6.9 103 62 6
MKDa 2.1 100 25 17
Turkey 72.8 101 39 9
Turkmenistan 5.0 103 44 6
Ukraine 45.4 117 20 22
United Kingdom 62.0 103 26 25
Uzbekistan 27.4 101 44 7
Table 3.2 contd

22 Review of social determinants and the health divide in the WHO European Region: final report
The collapse of the power of the Soviet Union led to profound societal changes in the countries affected. Life expectancy between CCEE and the CIS diverged, most likely reflecting different patterns of societal transition (31,35,36). Life expectancy in CIS countries is consequently falling behind that in CCEE and in the western part. As Fig. 3.1 shows, it remains at 65 years or less for males in six CIS countries.
Data from the Russian Federation suggest that life expectancy may have improved in the past few years, possibly reflecting political, economic and social stabilization. The most recent figure indicates that life expectancy at birth reached 63 years for males and 75 for females in 2009. The male rate was still lower than it was in 1965 (64.5), however, demonstrating the uniquely poor health outcomes in the Russian Federation compared to the rest of the Region before and after the collapse of the Soviet Union.
Mortality fluctuation in the CIS during the 1990s was the largest ever observed in a group of countries with relevant statistics. The increase among middle-aged adults between 1992 and 2001 in the Russian Federation alone has been estimated to be equivalent to 2.5−3 million deaths more than expected, based on the 1991 mortality level (37). The health catastrophe of adults in the eastern part of the Region contrasts with the stable, sustainable increase of overall child survival rates (38). As Fig. 3.7 and Fig. 3.8 illustrate, differences in survival patterns between the eastern and western parts of the Region are almost entirely a result of the very high levels of young and middle-age adult mortality due to CVD (in some cases 90%) and sudden deaths from injury (38), both often related to binge drinking of alcohol.
Fig. 3.7 compares trends in standardized mortality from CVD for men and women aged 45−64 for Finland, Poland and the Russian Federation. Rates for men in the Russian Federation have exceeded 800/100 000 population since the early 1990s and have remained high compared to Finland, where rates have been declining since the 1960s, and Poland (declining since around 1990). The Russian Federation has high rates of mortality among men aged 20−64 from injury compared to France, the United Kingdom and Poland (Fig. 3.8).
3.2.2 Gender, health expectancy and self-reported health
Differences in health outcomes between men and women are connected with issues related to sex (the biological and physiological characteristics that differentiate men and women) and gender (socially constructed roles and behaviours of men and women based on norms and values of a particular society).
Uzbekistan). The old-age dependency ratio is less than 10 in 6 countries (Azerbaijan, Kyrgyzstan, Tajikistan, Turkey, Turkmenistan and Uzbekistan) and exceeds 30 only in Germany and Italy. Several countries therefore have a very young age profile, with a high proportion of children and low of older people, while others have a more elderly profile.
The demographic situation in many countries is, however, more complex than either of these scenarios. The sex ratio (females for every 100 males) exceeded 110 in 11 countries: all were in the Commonwealth of Independent States (CIS) and central Europe, reflecting the cumulative effect of high male mortality (30). The ratio was less than 100 only in Turkey and Iceland, suggesting a combination of below-average differences in mortality and other demographic factors, such as fertility and migration.
3.2 The health divide
3.2.1 Life expectancy and healthy life expectancy
East−west differences in the Region have changed over time (31,32), with much of the widening between 1980 and 2008 taking place in the years to 1994 (Fig. 3.6). The gap in female life expectancy among Member States that joined the EU in 2004 or 2007 (EU12) and those in the EU before 2004 (EU15) rose from 3.7 to 5.4 years by 1994 and, for males, from 4.3 to 7.3. The gap between CIS countries and the EU15 increased from 4.5 to 9.2 years for females and 8.1 to 13.9 for males; that for the EU12 narrowed slightly after 1994, but it widened further for the CIS, with some countries doing markedly less well than others.
The diverging mortality trends illustrated in Fig. 3.6 reflect the broad patterns of societal transition in most countries in the three groups shown.
These changes need to be seen in a historical perspective (33). Countries in the east and west differed substantially before the Second World War. Mortality declined considerably in all parts of the Region between 1945 and the mid-1960s but did so more rapidly in the eastern part, largely because of communicable disease control and improvements in hygiene and housing. As a result, the gap in life expectancy among CCEE and those in the western part of the Region declined considerably in the 1960s. Life expectancy continued to increase in the west during the early 1970s and late 1980s but stagnated or fell in the east, mainly because of rising death rates from cardiovascular disease (CVD) (34). This led to a renewed widening of the east–west gap in life expectancy (31).

Health inequities between and within countries 23
Fig. 3.6
Trends in life expectancy in the EU15, EU12 and CIS, 1980–2010a
a Most recent values for EU12 are for 2010, and 2009 for other groups.
Source: WHO Regional Office for Europe (3).
Females
EU15
EU12
CIS
Males
EU15
EU12
CIS
85
80
75
70
65
60
55
1980 1982 1984 1986 1988 1990 1992 1994 1996 1998 2000 2002 2004 2006 2008 2010
Year
85
80
75
70
65
60
55
1980 1982 1984 1986 1988 1990 1992 1994 1996 1998 2000 2002 2004 2006 2008 2010
Year

24 Review of social determinants and the health divide in the WHO European Region: final report
Standardized mortality rate
600
500
400
300
200
100
0
Fig. 3.7
Mortalitya trends from CVD, men and women aged 45−64: Finland, Poland and the Russian Federation
a Standardized mortality rates per 100 000 population.
Source: Zatonski & Bhala (39).
a Standardized mortality rates per 100 000 population.
Source: HEM Project Team (40).
Fig. 3.8
Mortalitya trends from injury, men aged 20−64: France, United Kingdom, Poland and the Russian Federation
Standardized mortality rate
1600
1400
1200
1000
800
600
400
200
0
1958
1948
1958
1958
1968
1968
19681978
1978
19781988
1988
19881998
1998
1998
Poland
Russian Federation
Men
Women
1948 1958 1968 1978 1988 1998 2008
2008
2008
2008
Finland
Men
France Poland
Russian Federation
Men
Women
United Kingdom
Women
1948 1958 1968 1978 1988 1998 2008
Year
1958 1968 1978 1988 1998 2008
Year

Health inequities between and within countries 25
of diseases in the population than life expectancy alone. The indicator “HLY at birth”,1 shown in Fig. 3.9, is an EU Structural Indicator and one of the EU Sustainable Development Indicators. It is calculated by subtracting the expected number of years lived with long-term activity limitations (currently obtained from EU Statistics on Income and Living Conditions (EU−SILC)) from life expectancy.
When HLY are calculated as described, the variation between countries shown in Fig. 3.9 is around 18 years for males and females (52 in Slovakia to around 70 in Sweden and Malta). When the figures are used to calculate years spent in ill health, the length of time varies by 13 years for males (from 8 in Bulgaria to 21 in Germany) and by 15 for females
A key issue in comparing outcomes is the need to go beyond the relatively straightforward differences in life duration to consider individuals’ experience of health during their lifetimes. One way of summarizing this is to look at how many years were spent in good health and how many were not. Health expectancies extend the concept of life expectancy to morbidity and disability to assess the quality of years lived (41).
In particular, “healthy life years” (HLY) is a composite indicator of health that takes into account mortality and ill health, providing more information on burden
Fig. 3.9
HLY and life expectancy at birth, by sex, 2010
Source: Eurostat (42).
Females
HLY at birth
Years in ill health
1 “HLY at birth” is calculated by the Sullivan method, based on life-table data and age-specific period-prevalence data on long-term activity limitations using the Euro-REVES General Activity Limitation Indicator (GALI) (41).
Males
HLY at birth
Years in ill health
Malta
Sweden
Norway
Iceland
Greece
Italy
Bulgaria
Ireland
Luxembourg
United Kingdom
Czech Republic
Cyprus
Spain
France
Switzerland
Belgium
Lithuania
Poland
Denmark
Croatia
Austria
Netherlands
Germany
Hungary
Finland
Estonia
Romania
Latvia
Portugal
Slovenia
Slovakia
0
Expected life years at birth
10 20 30 40 50 60 70 80 90
Sweden
Malta
Norway
Iceland
Italy
Greece
Ireland
Switzerland
Cyprus
United Kingdom
Luxembourg
Spain
Belgium
Bulgaria
Denmark
Czech Republic
France
Netherlands
Austria
Portugal
Finland
Poland
Germany
Lithuania
Romania
Croatia
Hungary
Estonia
Latvia
Slovenia
Slovakia
0
Expected life years at birth
10 20 30 40 50 60 70 80 90

26 Review of social determinants and the health divide in the WHO European Region: final report
from 4 years in several of the countries in Fig. 3.10 to 11 years in Lithuania, while the gap in years in ill health varies from under 3 in the United Kingdom to more than 8 in Portugal. The gender gap in years spent in good health, which is numerically equal to the gap in life expectancy minus the gap in years in poor health, does therefore not favour either sex in every country. Women spend more years in good health in 22 of the 30 countries in Fig. 3.10, varying from a year or less in 9 to close to 4 in Poland, Estonia and Lithuania. Among countries where they spend fewer years in good health, the largest differences − over 1.5 years − are in Portugal and the Netherlands.
(12 in Bulgaria to 27 in Slovakia). It should, of course, be recognized that these comparisons may be affected by cultural factors influencing the reporting of activity limitation, which may vary by country and gender.
As these figures suggest, the extra number of years women can expect to live in good health – the gender gap in health expectancy – is very much less than the comparable gap in life expectancy. Women live longer than men in every country shown in Fig. 3.10 but spend more years in poor health.
There is no strong link between the sizes of gaps across countries, however. Life expectancy varies
Fig. 3.10
Differences between women and men in HLY and life expectancy at birth in the EU, 2010
Additional years lived by women
Additional years spent in good health by women
Source: Eurostat (42).
Portugal
Switzerland
Belgium
Iceland
Netherlands
Denmark
Cyprus
Sweden
Spain
Finland
Slovakia
Norway
Romania
Italy
United Kingdom
Germany
Ireland
Slovenia
Austria
Malta
Greece
France
Luxembourg
Czech Republic
Hungary
Latvia
Croatia
Poland
Bulgaria
Estonia
Lithuania
–5 0 5 10 15

Health inequities between and within countries 27
stomach ache and nervous feelings (all items that contribute to measurement of self-reported health). These may reflect different responses to stressors faced in adolescence (Candace Currie, University of St Andrews, United Kingdom, personal communication, 2011) or cultural differences in reporting on health issues.
Biological (“sex”) as well as psychosocial (“gender”) factors contribute to the differences between adolescent girls and boys. Biological differences (hormones, for example) may result in varying levels of exposure to injury risk and contribute to different health complaints – leading to different overall levels of reporting – but psychosocial differences are seen as more important in explaining gender differences.
Jagger et al. (43) found substantial differences in HLY at 50 years within EU countries, concluding that the target of increasing older people’s participation in the labour force will be difficult to meet without major improvements in population health.
Significant and consistent gender differences are found in various aspects of adolescent health (44). “Fair” or “poor” health, as opposed to “good” or “very good”, tends to be more commonly reported by girls at all three ages covered in the Health Behaviour in School-aged Children (HBSC) survey (11, 13 and 15 years). Figures for 15-year-olds are shown in Fig. 3.11. The differences between boys and girls were statistically significant for all but six of the countries shown. Girls were more likely to report headache,
Fig. 3.11
Self-rated health by gender and country, age 15 years
Girls
Boys
a The former Yugoslav Republic of Macedonia (MKD) is an abbreviation of the ISO.
Source: Currie et al. (44).
MKDa
Greece
Italy
Spain
Switzerland
Slovenia
Czech Republic
Sweden
Portugal
France
Austria
Slovakia
Lithuania
Ireland
Germany
Romania
Finland
Netherlands
Croatia
Luxembourg
Denmark
Turkey
Estonia
Latvia
Armenia
Norway
Poland
Iceland
Russian Federation
Ukraine
Hungary
0 10 20 30 40 50
Percentage rating their health as “fair” or “poor”
28 Review of social determinants and the health divide in the WHO European Region: final report
the 1989 level. In other countries (Latvia, Kazakhstan and Ukraine), however, the reduction in real consumption was 50% or more and lasted much longer, with no improvement seen throughout the 1990s (Fig. 3.12). The impact on living conditions of these changes is well documented in, for example, the Russian Federation (45,46). The increase in income inequity during transition differed substantially across countries (47−50). Falls in levels of consumption and GDP (and only limited improvements in some countries) (Fig. 3.12 and Fig. 3.13) suggest that many households may have fallen below the minimum needed to sustain healthy living for substantial periods (51).
Trends in GDP per person in each of the CIS countries differed significantly between 1990 and 2007. All seven countries in Fig. 3.13 experienced economic collapse immediately following 1990 and have slowly returned to positive economic growth (53,54). A decade after independence, GDP per capita was back at pre-independence levels only in Armenia; by 2007, Georgia and Kyrgyzstan were still at about four fifths of the pre-independence GDP level, the Republic of Moldova less than two thirds and Tajikistan just over half.
The current situation is that national economies vary enormously across the Region, with a range of real GDP per capita from US$ 1972 (adjusted for purchasing power parity (ppp)) in Tajikistan to US$ 83 820 in Luxembourg (Fig. 3.14). As Fig. 3.15 indicates, this makes it likely that the more disadvantaged countries will have shorter life expectancies.
Fig. 3.15 shows that life expectancy is correlated with the GDP of poorer countries in the Region, but not richer ones. Life expectancy in countries with a GDP per person of less than US$ 25 000 (ppp) is generally higher when GDP is higher, but there is considerable variation between poorer countries. Georgia, for instance, has an average life expectancy of 73.8 years with real GDP at US$ 4774 (ppp) per capita, while the respective figures in Ukraine are 70.3 years and US$ 6318. Poorer countries, however, do not necessarily have lower life expectancy: it is possible to ensure good levels of population health at low levels of national income. The policies and programmes outlined in Chapters 4−6 explain how this can be achieved.
3.3.2 Income, income inequality and health
Health outcomes and national income are related. Chronic child malnutrition, prevalence of tuberculosis (TB) and death due to external violence tend to be higher in the poorer countries of eastern Europe and the CIS. Absolute levels of poverty are important at early stages of economic development (55), but inequalities are based on relative deprivation in more advanced countries’ economies. Here, relative deprivation is defined as exclusion from participation
Gender stereotypes shape the expectations girls and boys face. They are confronted with different opportunities and obstacles and may use different coping strategies. Expectations are culturally dependent, giving rise to much of the variation between countries (45).
3.3 Macro socioeconomic conditions and health
This chapter has provided illustrations of the extent of the health divide among European countries. Relationships between the macro socioeconomic conditions that exist in countries, or regions within countries, and health outcomes will now be described. Further details are provided in Part III.
Understanding the patterns and trends in health across the Region requires consideration of the social and economic circumstances in which people live, how these are distributed within and between countries and the influence a changing political, social and economic environment has had on these distributions.
First, some of the key determinants at wider political, social, economic and cultural levels across countries are described, including macroeconomic factors (the country’s levels of economic development and child poverty and the extent to which child poverty is mitigated by social protection policies). Macro-level factors also include the extent to which society operates to ensure the human rights of all its citizens and to include (or exclude) social groups because of their ethnic or racial background, immigrant status, disability or sexual orientation. Early years, education and labour-market systems are key determinants at wider political, social, economic and cultural levels because they affect people’s education and employment opportunities throughout their lives (see Chapter 4).
3.3.1 National income and health
CCEE had relatively low income per capita at the beginning of societal transformation and creation of the CIS in the 1990s, although there were differences between countries. This was reflected in low levels of gross domestic product (GDP), which were about a quarter of that in countries in the western part of the Region. Income inequity was relatively low, however, probably as a result of explicit egalitarian policies that included equal levels of pay across sectors and occupations and extensive social welfare provision. This is discussed further in section 3.3.
Changes in national income in CCEE and the CIS in the 1990s differed by country. The reduction in real consumption in most countries – purchasing of goods and services – reached its lowest point (for a relatively short period) at about 20% below

Health inequities between and within countries 29
Real total consumption expenditure
Base year 1989 =100
180
160
140
120
100
80
60
40
1989 1990 1991 1992 1993 1994 1995 1996 1997 1998 1999 2000 2001 2002 2003
Year
Kazakhstan
Republic of Moldova
Romania
Russian Federation
Ukraine
Fig. 3.12
Real total consumption expenditure in selected CCEE and CIS countries, 1989−2003
Belarus
Bulgaria
Estonia
Latvia
Lithuania
Source: Billingsley (35).
Republic of Moldova
Tajikistan
Uzbekistan
Armenia
Azerbaijan
Georgiaa
Kyrgyzstan
Fig. 3.13
GDP per capita in constant prices (1990 = 100) in seven CIS countries, 1990–2007
a Georgia was a member of the CIS in this period.
Source: TransMonEE (52).
Year
200
180
160
140
120
100
80
60
40
20
0
1990 1991 1992 1993 1994 1995 1996 1997 1998 1999 2000 2001 2002 2003 2004 2005 2006 2007

30 Review of social determinants and the health divide in the WHO European Region: final report
in the patterns of consumption that are habitual in society because of an individual’s or a household’s limited economic resources (56,57). A correlation between levels of health and income inequalities in advanced economies has been consistently documented (58−66). Income inequality is important because, in Amartya Sen’s words, “relative deprivation in the space of incomes can yield absolute deprivation in the space of capabilities” (67).
One way relative deprivation leads to worse health is through psychosocial pathways. Geographic studies at subnational level in the Russian Federation showed that regions with higher levels of “social
stress” caused by transformation experienced steeper falls in life expectancy than less severely affected regions (68,69). These results are consistent with the large body of evidence linking inequality in income, social capital and health (58,70,71).
Macroeconomic changes in the former Soviet Union in the early 1990s were closely linked with privatization and changes in the labour market. Indeed, it has been shown that mass privatization is strongly associated with adverse changes in mortality within countries, even if any causal pathways between such government policy and its health consequences are disputed (72).
Fig. 3.14
Countries in the Region with the highest and lowest GDP (in US$, adjusted for ppp), for latest available year (2009)
a The former Yugoslav Republic of Macedonia (MKD) is an abbreviation of the ISO.
Source: WHO Regional Office for Europe (3).
LuxembourgNorway
SwitzerlandIreland
NetherlandsAustria
DenmarkSwedenIceland
GermanyBelgiumFinland
United KingdomFrance
ItalySpain
CyprusGreece
IsraelSlovenia
Czech RepublicPortugal
MaltaSlovakiaHungaryCroatiaEstonia
Russian FederationPoland
LithuaniaLatvia
RomaniaBulgaria
TurkeyMontenegro
BelarusSerbia
KazakhstanMKDa
AzerbaijanAlbania
Bosnia and HerzegovinaTurkmenistan
UkraineArmeniaGeorgia
UzbekistanRepublic of Moldova
KyrgyzstanTajikistan
0 20 000 40 000 60 000 80 000 100 000

Health inequities between and within countries 31
Differences between countries are not restricted to mortality-based indicators. An ecological analysis of national random population samples of 13 CCEE and CIS countries found that levels of self-rated health were strongly associated with country-level life expectancy (r = –0.73); in multilevel analyses, controlling for individual SES, self-rated health was associated with national-level factors such as GDP and corruption (73).
A similar pattern of self-rated health and its association with societal characteristics had previously been found in different datasets. A study of datasets combining societal and individual data on seven CCEE and the CIS found that ecological (societal) measures of income and income inequalities were associated with self-rated health, with the association being largely mediated by individual material circumstances and perceived control. Interestingly, the mean values of perceived control for each country were associated with mortality rates (74). Analysis of the World Value Survey data collected in 25 countries demonstrated a large gap in self-rated health between western and eastern Europe: people’s participation in civic activities, perceived control and economic satisfaction were associated with self-rated health in both parts of the Region, with these factors explaining up to 30% of the east−west difference in health (75).
This section now focuses on how income is distributed within countries and on the association between income inequality and health. Fig. 3.16 shows the extent of relative income distribution within EU countries based on the EU overarching indicator (76). The ratio between mean income per person in the top- and bottom-income quintiles of the population was largest in some of the countries with the lowest median incomes – more than seven in Lithuania – but this was not always the case. Some countries with income levels below the EU average – Hungary, Czech Republic and Slovenia – had the lowest ratios, ranging from 3.4 to 3.6 (similar to Nordic levels). Again, this may be related to the pattern of transition in these countries, partly reflecting their historical context. They all had a tradition of social democratic policies at some point before the Second World War and a shared history dating back to the Austrian Empire in the 17th century. Most policies during the market reforms of the 1990s included an emphasis on protecting vulnerable population groups: negotiations and consequent agreements among government, employers and the relatively powerful trade unions may have helped to halt any rise in income inequalities.
An alternative method of reflecting the breadth of income distribution is the Gini coefficient – a frequently used indicator of inequality in income. A value of 0 indicates total equality and 1 the maximum inequality possible (one person has all the income). Fig. 3.17 ranks EU countries using data from Eurostat.
Fig. 3.15
Life expectancy by real GDP in US$ (ppp) per head of population (Preston curve) for European Region countries, 2010 (or latest available year)
a The former Yugoslav Republic of Macedonia (MKD) is an abbreviation of the ISO.
Source: WHO Regional Office for Europe (3).
0
Annual gross national income per capita converted to international dollars using ppp rates
Life expectancy at birth in years
85
80
75
70
65
6010 000 20 000 30 000 40 000 50 000 60 000 70 000 80 000 90 000
Tajikistan
Kyrgyzstan
Uzbekistan
Republic of Moldova
Georgia
Turkmenistan
Armenia
Ukraine
Azerbaijan
Albania
Bosnia and Herzegovina
Kazakhstan
MKDa
Serbia
Bulgaria
Belarus
Romania
Turkey
Montenegro
Russian Federation
Latvia
Poland
HungaryLithuania
Croatia
Estonia
Portugal
Czech Republic
Iceland
Slovenia
Israel
Greece
Italy
Spain France
BelgiumFinland
GermanyUnited Kingdom
Denmark
Ireland
Austria
Sweden
NetherlandsSwitzerland
NorwayLuxembourg
Malta
Slovakia
Cyprus

32 Review of social determinants and the health divide in the WHO European Region: final report
Fig. 3.16
EU income distribution indicator: ratio of mean income per person in the top income quintile to that in the bottom quintilea in EU countries, Iceland and Norway, 2010
a Ratio of the total equivalized disposable income per person received by the population quintile with the highest income to that received by the lowest quintile.
b EU27: countries belonging to the European Union after January 2007.
Source: Eurostat (77,78).
Fig. 3.17
Inequality of income distribution (Gini coefficient) in selected countries in the European Health Programme, 2010
Source: Eurostat (77).
NorwayHungarySloveniaSweden
Czech RepublicIcelandFinland
NetherlandsAustria
SlovakiaBelgium
LuxembourgMalta
CyprusDenmarkGermany
FrancePolandEstonia
ItalyIreland
United KingdomPortugal
GreeceBulgariaRomania
LatviaSpain
Lithuania
0
Ratio of mean income in top and bottom income quintiles
Ratio of top and bottom quintile in the EU27b
2 4 6 8
LithuaniaLatviaSpain
PortugalRomania
IrelandBulgaria
United KingdomGreeceCroatiaEstonia
ItalyPolandFrance
SwitzerlandGermany
CyprusMalta
LuxembourgDenmarkBelgiumAustria
SlovakiaIceland
NetherlandsFinland
Czech RepublicSwedenHungarySloveniaNorway
0.0
Gini coefficient
0.1 0.2 0.3 0.4
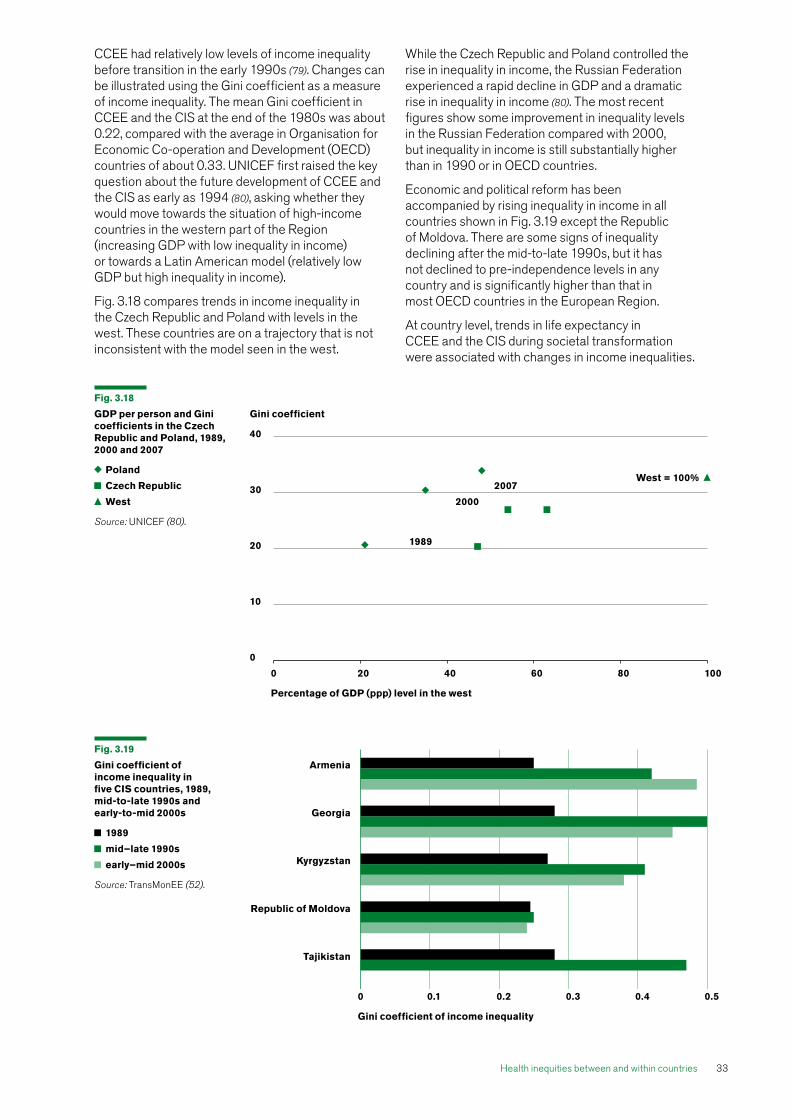
Health inequities between and within countries 33
CCEE had relatively low levels of income inequality before transition in the early 1990s (79). Changes can be illustrated using the Gini coefficient as a measure of income inequality. The mean Gini coefficient in CCEE and the CIS at the end of the 1980s was about 0.22, compared with the average in Organisation for Economic Co-operation and Development (OECD) countries of about 0.33. UNICEF first raised the key question about the future development of CCEE and the CIS as early as 1994 (80), asking whether they would move towards the situation of high-income countries in the western part of the Region (increasing GDP with low inequality in income) or towards a Latin American model (relatively low GDP but high inequality in income).
Fig. 3.18 compares trends in income inequality in the Czech Republic and Poland with levels in the west. These countries are on a trajectory that is not inconsistent with the model seen in the west.
While the Czech Republic and Poland controlled the rise in inequality in income, the Russian Federation experienced a rapid decline in GDP and a dramatic rise in inequality in income (80). The most recent figures show some improvement in inequality levels in the Russian Federation compared with 2000, but inequality in income is still substantially higher than in 1990 or in OECD countries.
Economic and political reform has been accompanied by rising inequality in income in all countries shown in Fig. 3.19 except the Republic of Moldova. There are some signs of inequality declining after the mid-to-late 1990s, but it has not declined to pre-independence levels in any country and is significantly higher than that in most OECD countries in the European Region.
At country level, trends in life expectancy in CCEE and the CIS during societal transformation were associated with changes in income inequalities.
Fig. 3.19
Gini coefficient of income inequality in five CIS countries, 1989, mid-to-late 1990s and early-to-mid 2000s
1989
mid–late 1990s
early–mid 2000s
Source: TransMonEE (52).
Fig. 3.18
GDP per person and Gini coefficients in the Czech Republic and Poland, 1989, 2000 and 2007
Poland
Czech Republic
West
Source: UNICEF (80).
Gini coefficient
West = 100%2007
2000
1989
0
Percentage of GDP (ppp) level in the west
20 40 60 80 100
40
30
20
10
0
0 0.1 0.2 0.3 0.4 0.5
Gini coefficient of income inequality
Armenia
Georgia
Kyrgyzstan
Republic of Moldova
Tajikistan

34 Review of social determinants and the health divide in the WHO European Region: final report
Experiences throughout childhood have a particularly strong relationship with future life chances and health outcomes: the poorer the circumstances in which a child is nurtured, the worse his or her outcomes are likely to be. Lower poverty rates across a number of EU countries are associated with lower mortality in children under five years (82). The relationship between lower poverty rates and child mortality rates is stronger the lower the poverty threshold is set (83).
The social protection system in a country can have a substantial impact on poverty and outcomes through various types of social transfers. This affects health across the life-course (84,85) and also affects gender differences in health (86).
Child poverty rates are particularly dependent on social transfers. Fig. 3.21 shows that the rate after social transfers, as recorded in EU−SILC, varies from 10% in Iceland to 33% in Romania. It also shows what the rates would be if there was just market income and no transfers in terms of cash benefits (this analysis includes pensions as benefit transfers).
Countries with steepest increases in the Gini coefficient showed the largest drop in life expectancy, while those that controlled income inequalities showed little deterioration (Fig. 3.20).
3.4 Intergenerational transmission of inequity
3.4.1 Poverty, social protection and child health
As indicated in Chapter 2, social and economic inequities affecting previous generations present an important influence on children’s life-course, particularly in relation to how social disadvantage in the family affects their life chances and health. Growing up in relative poverty has a strong influence on health and other outcomes throughout life, and growing up in absolute poverty produces additional immediate adverse outcomes, such as stunting and malnutrition.
Fig. 3.20
Change in life expectancy by increase in income inequality, 1989–1995
Source: Marmot & Bobak (81).
3
2
1
0
–1
–2
–3
–4
–5
–6
–7
Change in life expectancy at birth 1989–1995 (years)
Change in Gini coefficient
0 0.02 0.04 0.06 0.08 0.1 0.12 0.14 0.16 0.18
Czech Republic
Slovakia
Hungary
PolandSlovenia
BulgariaRomania
Estonia
Lithuania
Belarus
Republic of Moldova
Russian Federation

Health inequities between and within countries 35
Fig. 3.21
Child poverty ratesa before and after transfers, ranked by after-transfer rate, EU−SILC 2009b
Before social transfers
After social transfers
a Percentage of children under 18 in households with equivalent income less than 60% of median income.
b Data for EU−SILC 2009 were collected in 2008.
Source: Bradshaw (82).
Iceland
Norway
Denmark
Slovenia
Cyprus
Finland
Sweden
Czech Republic
Austria
Germany
Netherlands
Belgium
France
Slovakia
Ireland
Switzerland
Estonia
Malta
United Kingdom
Hungary
Luxembourg
Portugal
Poland
Spain
Greece
Italy
Lithuania
Bulgaria
Latvia
Romania
Poverty rate
0 10 20 30 40 50 60
It can be seen that there is much less variation in child poverty rates before transfers. Austria, Luxembourg and Lithuania, for example, have very similar pre-transfer rates (slightly over 40%), but Austria’s rate after transfers is much lower (14%): transfers are more successful in reducing child poverty in the country. Transfers in Greece reduced the rate by 14% from the pre-transfer level, but more successful transfers in Norway and Austria reduced it by 62% and 66% respectively.
The relationship between child mortality and poverty levels has long been recognized. Fig. 3.22 illustrates the strong correlation between under-five mortality rates and household deprivation levels at country level across the Region.
Deprivation in Fig. 3.22 is measured by the percentage of households lacking three or more items from the following list: ability to face unexpected expenses; take one week’s annual holiday away from home; pay for arrears such as
mortgage or rent, utility bills or hire purchase instalments; have a meal with meat, chicken or fish every second day; keep home adequately warm; and have a washing machine, a colour TV and a telephone (87). These items represent patterns of consumption considered as social norms for households in Europe in the first decade of the 21st century.
Analysis of health improvements in Nordic countries (88) for the CSDH (2) highlighted the importance of social policies that are both universal in their reach and generous. Studies have found evidence supporting a relationship between the type of welfare state and health inequities present within the population (89,90). A study of the relationship between social spending and all-cause mortality in 18 EU countries reported that the greater the government social expenditure, the lower the mortality (91). Analysis of social protection regimes that account for between-country differences are discussed further in Chapter 5.

36 Review of social determinants and the health divide in the WHO European Region: final report
Several sources of data in the Region can be used to examine how health varies according to each individual’s social conditions. Some, especially the larger EU-wide surveys (such as EU−SILC), relate health to contemporaneous social conditions (89,92−106). Other studies available in fewer countries, such as Scandinavian registry-based studies, relate long-term health outcomes to earlier social conditions, making it possible to identify which conditions are most strongly related to subsequent ill health and develop causal explanations spanning the life-course (107−113). Some have focused on individuals with specific health conditions and looked at socioeconomic differences in subsequent survival (114,115).
The focus turns first to countries in the Region in which children growing up in poverty face chronic malnutrition. Table 3.3 shows differentials in chronic malnutrition among under-fives according to household wealth quintile. There is a clear gradient in stunting (being short for age) by household wealth, with the proportion falling as household wealth rises.
Childhood stunting and overweight coexist in poorer countries of eastern Europe. Table 3.4 shows marked differences in childhood overweight by wealth quintile in these countries, with children from households with higher incomes being more likely to be overweight. The association between poverty and overweight is opposite to that commonly seen in affluent states in the Region, where childhood overweight is more often positively associated with low household income and wealth.
Fig. 3.22
Mortality among under-fives and percentage of deprived households (lacking three or more essential items) in selected European Region countries
Source: WHO Regional Office for Europe (3); Bradshaw (82); Eurostat (87).
Mortality rate of children younger than five years old per 1000 live births
Percentage of households lacking three or more essential items
0 4010 20 30 50 60
Denmark
NorwaySlovenia
Iceland
Finland
Sweden
Netherlands
Czech Republic
CyprusAustria
GermanyFrance
Slovakia
EstoniaBelgium
Ireland
Hungary
Luxembourg
PolandLithuaniaUnited Kingdom
PortugalGreece
Spain
Latvia
Italy
BulgariaRomania
14
12
10
8
6
4
2
0
Table 3.3
Percentage of under-fives with chronic malnutrition (stunting) by household wealth quintile (5 is highest) in selected European Region countries
a The former Yugoslav Republic of Macedonia (MKD) is an abbreviation of the ISO.
Source: Falkingham et al. (116).
1 2 3 4 5
Albania 31.0 23.1 25.8 18.7 14.6
Belarus 6.0 2.9 2.5 1.4 1.9
Bosnia 15.8 11.0 7.2 10.4 7.6
Georgia 19.9 14.5 13.4 11.8 7.7
Kazakhstan 18.1 16.5 17.0 13.1 10.8
Kyrgyzstan 17.6 19.4 12.7 13.3 11.7
Montenegro 10.9 3.8 6.3 2.7 4.3
Serbia 9.8 7.8 5.0 6.5 5.6
Tajikistan 33.6 30.5 32.2 25.6 21.6
MKDa 12.2 8.3 10.7 6.1 5.2
Uzbekistan 16.7 18.4 16.7 14.3 13.3

Health inequities between and within countries 37
Fig. 3.23 shows differences in self-rated health among 11-, 13- and 15-year-olds in the HBSC 2009/2010 survey according to family affluence. Levels of self-reported “fair” or “poor” health differed sharply among countries and between boys and girls. Most countries had a gradient between groups with different levels of family affluence, with the highest levels of “fair” and “poor” health being reported among those in the least-affluent families.
Table 3.4
Percentage of under-fives who are overweight by household wealth quintile (5 is highest) in selected European Region countries
a The former Yugoslav Republic of Macedonia (MKD) is an abbreviation of the ISO.
Source: Falkingham et al. (116).
1 2 3 4 5
Albania 5.6 6.2 6.8 11.7 10.9
Belarus 7.8 6.9 6.9 8.8 7.1
Bosnia 12.5 11.2 17.9 16.8 21.6
Georgia 15.3 14.9 17.8 14.5 19.6
Kazakhstan 4.4 5.4 5.5 7.3 9.3
Kyrgyzstan 4.9 2.9 4.3 4.4 5.4
Montenegro 25.6 28.1 31.5 34.0 31.6
Serbia 18.5 19.4 24.0 25.5 17.9
Tajikistan 4.1 2.4 2.3 1.5 2.0
MKDa 11.6 8.9 10.8 27.1 23.5
Uzbekistan 9.4 9.9 9.6 8.7 10.4
Fig. 3.23
Self-rated “fair” and “poor” health among 11-, 13- and 15-year-old boys and girls by family affluence in selected European Region countries, 2010
Family influence
Boys
High
Medium
Low
a The former Yugoslav Republic of Macedonia (MKD) is an abbreviation of the ISO.
Source: Unpublished data from HBSC 2009/2010 survey.
Girls
High
Medium
Low
Czech Republic
Switzerland
MKDa
Portugal
Spain
Italy
Latvia
Slovenia
Sweden
Romania
Armenia
France
Croatia
Germany
Turkey
Slovakia
Norway
Luxembourg
Greece
Russian Federation
Lithuania
Finland
Hungary
Estonia
Iceland
Poland
Ireland
Ukraine
Austria
Denmark
Netherlands
Latvia
Slovenia
Czech Republic
Switzerland
Finland
MKDa
Spain
Italy
Portugal
Slovakia
Iceland
Sweden
Greece
Hungary
Russian Federation
Luxembourg
Romania
Germany
Turkey
Estonia
Norway
Armenia
Lithuania
Ireland
Netherlands
Poland
Denmark
Ukraine
Croatia
Austria
France
Percentage rating their health as “fair” or “poor”
0 10 20 30 40 500 10 20 30

38 Review of social determinants and the health divide in the WHO European Region: final report
Large differences in prevalence of reported tooth brushing were found between countries for both genders: 16−80% for boys and 26−89% girls (119). High occupational status and family affluence were clearly related to a high prevalence of tooth brushing more than once a day. Single-parent status of the family was not associated with tooth-brushing behaviour in most countries (119).
3.4.2 Maternal education
Numerous studies have found a positive association between a mother’s education level and her child’s survival chances (120). The pathways through which this operates are varied but include high age at first birth for women with more schooling, increased birth intervals, increased awareness of good feeding practices, greater willingness to seek health care and lower financial barriers to access to health care.
The effect of mother’s education has been summarized as:
A shift from ‘fatalistic’ acceptance of health outcomes towards implementation of simple health knowledge; an increased capability to manipulate the modern world, including interaction with medical personnel; and a shift in the familial power structures, permitting the educated woman to exert greater control over health choices for her children (121).
Table 3.5 explores the association between mother’s education and child malnutrition using the UNICEF Multiple Indicator Cluster Surveys (MICS).
Children’s nutritional status differs substantially according to the mother’s education in south-eastern Europe. Children in Albania whose mother did not attend secondary school, for example, were twice as likely to experience acute malnutrition (12%) than those whose mothers did (6%) and the difference in Montenegro was almost four-fold (7.8% versus 2%).
Family affluence is associated with nutritional and health behaviours in older children. HBSC surveys provide evidence on this relationship for behaviours such as eating breakfast daily (117), fruit and soft drink consumption (118) and tooth brushing (119) in adolescents across a number of European countries.
Breakfast-skipping among adolescents is associated with a range of unhealthy diet-related outcomes such as lower intake of micronutrients, lower quality of the diet and overweight. Vereecken et al. (117) used HBSC data from 2005/2006 to study the sociodemographic pattern of breakfast-skipping across survey countries. Results varied, with more children from families of low affluence not eating breakfast daily in northern and central Europe. Few countries in southern and eastern Europe showed significant associations between family affluence and eating breakfast: adolescents from families of low affluence in Bulgaria, the former Yugoslav Republic of Macedonia and Turkey were more likely to eat breakfast daily (117).
Living in a single-parent family increased the likelihood of not eating breakfast daily in all countries except Ukraine, but while results were significant in almost all central and northern European countries, significance was only found for half of southern European and a few eastern (117).
Fruit consumption among adolescents increased with family material wealth (as measured by the HBSC Family Affluence Scale (FAS)) (Fig. 3.24) and higher parental occupational status, and soft drink consumption was lower among pupils of higher parental occupational status in northern, southern and western European countries (118). A significant increase in soft drink consumption with increasing family affluence was found in central and eastern countries (118).
Fig. 3.24
Fruit consumption among school-aged children by family affluence, 2005/2006
Western European countries
Northern European countries
Southern European countries
CCEE
Source: Currie et al. (44); Vereecken et al. (118).
2.2
2.0
1.8
1.6
1.4
1.2
1.0
0.8
Low
FAS score
Odds ratio
Middle High

Health inequities between and within countries 39
Education was less of an important differentiator than household wealth in those CIS countries in which enrolment in primary education (a legacy of the Soviet Union) remains almost universal and a high proportion progressed to complete secondary schooling. There even appeared to be a slight advantage in having a less well-educated mother in Tajikistan, although this was not statistically significant and probably reflected the fact that children with mothers with no, or only primary, education were more likely to live in rural areas with access to home-produced food.
3.4.3 Ethnicity, race and health
Several minority groups across the Region are more likely to be subject to multiple social exclusionary processes in the countries in which they live, resulting in greater levels of disadvantage. The adverse health effects on groups experiencing disadvantage are well documented (122−125).
Two examples are presented in this section to illustrate the relationships that can exist between ethnicity, exclusionary processes and health in quite different settings. The first draws on the UNICEF MICS (116), some of which collected data on ethnicity, which is often associated with exclusionary processes that lead to a higher risk of poverty and/or social exclusion.
Table 3.6 indicates the extent of stunting in under-fives in various groups. The high rates of stunting experienced by Roma children across the three countries in which Roma populations were separately identified (the former Yugoslav Republic of Macedonia, Montenegro and Serbia) clearly stands out, exceeding 17% in each. Groups differ across the countries, with some experiencing higher levels of stunting than the poorest quintiles.
Table 3.5
Percentage of under-fives who are underweight or affected by malnutritiona by mother’s education in selected European Region countriesb
a Chronic malnutrition = height for age: percentage of children severely or moderately stunted. Acute malnutrition = weight for height: percentage of children severely or moderately wasted. Underweight = percentage of children severely or moderately underweight for their age.
b The numbers of children whose mothers have less than secondary education were negligible in Belarus, Georgia, Kyrgyzstan and Uzbekistan, so have been excluded here.
c The former Yugoslav Republic of Macedonia (MKD) is an abbreviation of the ISO.
Source: Falkingham et al. (116).
Chronic malnutrition
Acute malnutrition Underweight
None or primary
Secondary or higher
None or primary
Secondary or higher
None or primary
Secondary sor higher
Albania 31.4 22.7 12.2 6.3 7.1 7.8
Bosnia 12.2 9.4 3.8 3.8 2.1 1.5
Kazakhstan 19.1 15.3 4.1 5.0 6.7 5.1
Montenegro 9.9 4.5 7.8 2.0 7.2 1.2
Serbia 10.5 5.9 5.4 3.6 4.3 1.1
Tajikistan 31.6 28.7 7.7 8.2 17.7 17.9
MKDc 10.7 6.4 3.4 1.9 3.3 1.1
Table 3.6
Percentage of under-fives chronically malnourished, by ethnicity, in selected European Region countries
a The former Yugoslav Republic of Macedonia (MKD) is an abbreviation of the ISO.
Source: Falkingham et al. (116).
Percentage chronically malnourished (stunted)
Georgia Georgian Azeri Armenian Other
11.5 25.7 17.8 5.7
Kazakhstan Kazakh Russian Other
17.3 11.0 13.0
MKDa
Macedonian Albanian Vlachs Roma Turkish Other
8.0 8.5 4.6
17.2 16.9
4.0
Montenegro Montenegrin Serbian Bosnian Roma Albanian Other
5.0 3.0
13.3 17.8 6.0
14.4
Serbia Serbian Montenegrin Hungarian Bosnian Roma Albanian Other
6.1 5.7 3.9 9.1
19.2 8.6 7.1

40 Review of social determinants and the health divide in the WHO European Region: final report
it is often children in the poorest families who miss out. The UNICEF Innocenti Research Centre (128) examined equity in three dimensions of child well-being (material, education and health), with Denmark, Finland, the Netherlands and Switzerland having greater equality in child well-being on this basis than the other 22 European countries involved.
A child’s readiness for school provides a measure of child development in the early years. This can be assessed using indicators of early development across physical, behavioural and cognitive/language domains and is influenced by a wide range of child, family and societal factors (129). Policies aimed at improving care and education in the early years have potential to improve equity in outcomes (130). Action on these policies is discussed in Chapter 4.
Fig. 3.25 (based on evidence from UNICEF) shows considerable variation in preschool attendance between CCEE and the CIS, ranging from below 20% in three countries to over 80% in four. The likelihood of not attending preschool is higher among children from the poorest wealth quintile in each country (Fig. 3.26).
The percentage of students who attended pre-primary school as young children varies greatly across the Region. Fig. 3.27 shows data for a number of countries who participate in the Programme for International Student Assessment (PISA).
The second example illustrates the relationships in a country with low overall mortality. A study of the Jewish−Arab divide in life expectancy in Israel reported differences in mortality rates in two age groups − those aged 0−10 and 45−70 – with a three-fold difference among under-fives (126).
3.5 Early years development, education and health
Substantial evidence from child development studies indicates that children need a solid basis of physical, emotional and social development in their earliest years if they are to thrive and remain healthy in later life, with loving, stable, secure and stimulating relationships with caregivers being crucial. Such relationships are universally desirable, but not equally available.
Inequalities in the conditions for good child development translate into inequities in health and development that can be identified in the earliest years of life and have lifelong repercussions. They are potentially remediable through family support, maternal care, child care and education. Evidence that it is possible to provide such provision to the highest international standards is available across the Region (127), but provision is unequally distributed:
Fig. 3.25
Pre-primary attendance in CCEE and the CIS, 2010/2011a
a Data refer to children aged 3−6 (or 3−5), depending on age for entry into primary education.
b The former Yugoslav Republic of Macedonia (MKD) is an abbreviation of the ISO.
Source: TransMonEE (52).
Belarus
Hungary
Slovenia
Estonia
Latvia
Republic of Moldova
Czech Republic
Romania
Bulgaria
Ukraine
Russian Federation
Lithuania
Slovakia
Poland
Croatia
Serbia
Kazakhstan
Albania
Montenegro
Georgia
Armenia
MKDb
Turkmenistan
Azerbaijan
Uzbekistan
Kyrgyzstan
Bosnia and Herzegovina
Tajikistan
0 20 40 60 80 100
Pre-primary enrolment
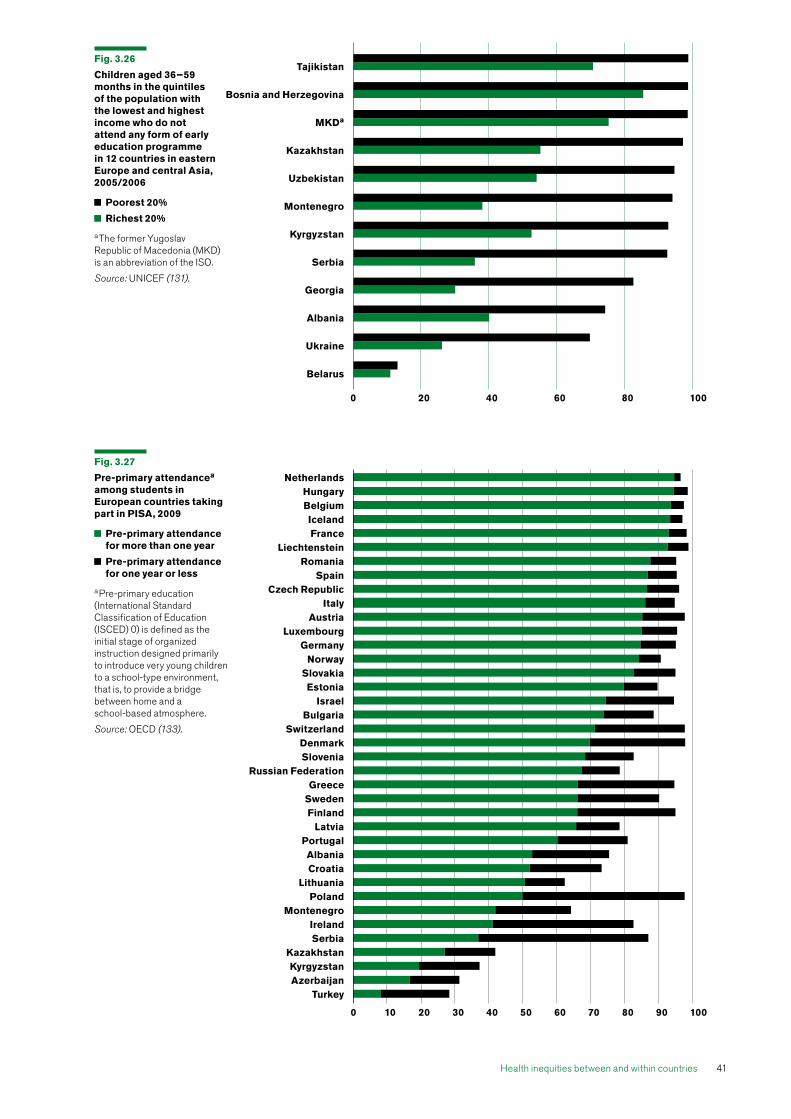
Health inequities between and within countries 41
Fig. 3.26
Children aged 36−59 months in the quintiles of the population with the lowest and highest income who do not attend any form of early education programme in 12 countries in eastern Europe and central Asia, 2005/2006
Poorest 20%
Richest 20%
a The former Yugoslav Republic of Macedonia (MKD) is an abbreviation of the ISO.
Source: UNICEF (131).
Fig. 3.27
Pre-primary attendancea among students in European countries taking part in PISA, 2009
Pre-primary attendance for more than one year
Pre-primary attendance for one year or less
a Pre-primary education (International Standard Classification of Education (ISCED) 0) is defined as the initial stage of organized instruction designed primarily to introduce very young children to a school-type environment, that is, to provide a bridge between home and a school-based atmosphere.
Source: OECD (133).
0 20 40 60 80 100
Tajikistan
Bosnia and Herzegovina
MKDa
Kazakhstan
Uzbekistan
Montenegro
Kyrgyzstan
Serbia
Georgia
Albania
Ukraine
Belarus
NetherlandsHungaryBelgiumIcelandFrance
LiechtensteinRomania
SpainCzech Republic
ItalyAustria
LuxembourgGermany
NorwaySlovakiaEstonia
IsraelBulgaria
SwitzerlandDenmarkSlovenia
Russian FederationGreece
SwedenFinland
LatviaPortugalAlbaniaCroatia
LithuaniaPoland
MontenegroIrelandSerbia
KazakhstanKyrgyzstanAzerbaijan
Turkey
0 10 20 30 40 50 60 70 80 90 100

42 Review of social determinants and the health divide in the WHO European Region: final report
Preschool attendance is one of the factors that contributes to educational attainment (134). As the PISA study shows, there is a correlation between not attending preschool and being in the lowest quintile for reading at aged 15 (Fig. 3.28). Of course, factors such as variation in the socioeconomic background of children who did not attend preschool and the quality of their subsequent schooling may have contributed to these correlations.
Amount and quality of education experience reinforces the effects of early years development on subsequent social and economic well-being, health and other outcomes. Educational attainment does not depend much on national wealth, except at
At one end of the scale, over 95% of children in the Netherlands attended preschool for more than one year, while less than 4% attended none: at the other, almost 72% attended no preschool in Turkey, with around 20% attending for less than one year and only 8% for longer. Variability is likely to be related to differing social attitudes to child care and the role of women and to differences in education systems. While preschool provision should not be equated with good child development (given cultural differences), there is strong evidence that provision of highly-trained personnel in preschool is associated with better child development, particularly in children from more deprived families (132).
Fig. 3.28
Likelihooda of a child who did not attend preschool being in the lowest reading quintile at age 15, PISA 2009
a See Fig. 3.27 for the definition of pre-primary education. In the PISA report, “likelihood” refers to the relative risk of being in the bottom performing group. A likelihood of unity indicates no increase in risk. Neither the socioeconomic background of children nor the quality of subsequent schooling is taken into account.
Source: OECD (135).
Estonia
Finland
Croatia
Montenegro
Latvia
Serbia
Norway
Slovenia
Albania
Iceland
Portugal
Ireland
Russian Federation
Azerbaijan
Kazakhstan
Lithuania
Bulgaria
Poland
Hungary
Netherlands
Romania
Czech Republic
Kyrgyzstan
Austria
Sweden
Spain
Germany
Turkey
Slovakia
Luxembourg
United Kingdom
Greece
Italy
Switzerland
Denmark
France
Belgium
Israel
0.0 0.5 1.0 1.5 2.0 2.5 3.0 3.5
Likelihood of being in bottom quarter of reading performance

Health inequities between and within countries 43
The association between level of education and health has repeatedly been observed. Limiting long-term illness becomes more common with increasing age, but its prevalence among people aged 45–54 is particularly strongly socially graded. Fig. 3.30 shows the steep gradient recorded in EU−SILC according to level of education. The gradient in limiting long-term illness is steeper at this age than at other ages.
very low levels of national income. Fig. 3.29 shows a modest correlation between average test scores among 15-year-olds in 36 countries in the Region and GDP per capita, especially at lower levels of GDP. There is no clear relationship with GDP above a figure of around US$ 15 000 in ppp.
Fig. 3.30
Percentage aged 45–54 years with a limiting long-term illness by education levela in EU countries, 2010
a Education level: ISCED classification (136): Level 0 Pre-primary education Level 1 Primary education or first stage of basic education Level 2 Lower secondary or second stage of basic Level 3 Upper-secondary Level 4 Post-secondary non-tertiary Level 5 First stage of tertiary Level 6 Second stage of tertiary leading to an advanced research qualification.
Source: Eurostat (78).
Fig. 3.29
Average test scores for 15-year-olds in PISA by GDP per capita, selected countries in the European Region, 2009
a Average of PISA reading, mathematics and science mean scores.
Source: OECD (135) [test scores]; WHO Regional Office for Europe (3) [GDP].
GDP per capita in US $, converted using ppp
Averagea of mean PISA scores
600
500
400
300
50 000 60 0000 10 000 20 000 30 000 40 000 70 000 80 000 90 000
Austria
Azerbaijan
Belgium
Bulgaria
Croatia
Czech Republic
Denmark
Estonia
Finland
France
Germany
GreeceHungary
IcelandIreland
Israel
Italy
Latvia
Lithuania
Netherlands
NorwayPolandPortugal
Romania
RussianFederationSerbia
Slovakia
Slovenia
Spain
Sweden Switzerland
Turkey
UnitedKingdom
Luxembourg
Education level
Pre-primary Primary or first stage
Lower-secondary or second stage
Upper- secondary
Post- secondary non-tertiary
First stage of tertiary education
Second stage of tertiary
Percentage with a limiting long-term illness
50
40
30
20
10
0

44 Review of social determinants and the health divide in the WHO European Region: final report
3.6 Other social determinants of child health
Many social factors other than those already outlined in this chapter affect the health and development of children in the Region. Two examples are given here to illustrate circumstances in which children may be more vulnerable.
3.6.1 Migration and health
Recent systematic reviews suggest that many European migrant groups have poorer self-reported health than the majority population (146). One on the relationship between pregnancy outcomes among immigant women and the host countries’ integration policies showed that immigrant women had a clear disadvantage for all the outcomes considered (147): risks were 43% higher for low birth weight, 24% for preterm delivery, 50% for perinatal mortality and 61% for congenital malformations. These risks were clearly and significantly reduced in countries with strong integration policies.
The processes that can lead to increased vulnerability are described in Chapter 5. Foreign-born children are first-generation immigrants, and their integration is an important marker of the integration of the whole family in the new society. Although immigration is a very common phenomenon, relatively
Fig. 3.31 shows that in every country with relevant EU−SILC figures in 2010 (except Sweden), those with primary-level education self-reported substantially more poor health than those with basic tertiary education. The extent differed considerably between countries, from near parity in Sweden to a four-fold ratio in Latvia and Lithuania.
These data and other studies have shown that education inequalities continue to influence health throughout the life-course (64,90,137−141).
The increased risk of poor self-rated health and functional limitations experienced by people with low education (lower-secondary or less) appears to be greater at ages 25−55 than in higher-age groups, though this pattern varies among countries, sexes and health indicators (142). As Fig. 3.4 showed, there is a strong social gradient in all-cause mortality by educational attainment (23). The Eurothine study of mortality data in 16 European countries found education inequalities in avoidable mortality present in every country and for all types of avoidable causes of death (143). Several studies have shown a relationship with suicide in particular, but with marked differences in the strength of the relationship between countries (144,145).
Fig. 3.31
Ratio of poor health among people with primary-level education (level 1) to poor health among those with basic tertiary education (level 5) in selected European Region countries, 2010
Source: EU−SILC (87).
Sweden
Switzerland
Luxembourg
Cyprus
Italy
Spain
Poland
Greece
France
Germany
Netherlands
Norway
Slovenia
Malta
Hungary
Slovakia
Estonia
Iceland
Romania
Belgium
Czech Republic
Croatia
Bulgaria
Ireland
Austria
Portugal
Latvia
Lithuania
0 1 2 3 4 5
Ratio

Health inequities between and within countries 45
Differences between urban and rural areas are not clear cut. Children living in urban areas have slightly better health outcomes than those in rural in most countries in this comparison, but not all. It depends on the measure used and the setting: for example, a lower proportion of rural children have acute malnutrition in CIS countries, reflecting the fact that most people outside the major cities have access to plots of land on which to grow basic foodstuffs.
Even in these countries, however, chronic malnutrition tends to be higher in rural areas, reflecting longer-term differences in living standards. Seventeen per cent of under-fives living in rural areas of Kyrgyzstan suffer from chronic malnutrition, compared with 12% in urban. A similar differential is found in Georgia (15% versus 10%) and Kazakhstan (18% versus 13%). Poverty rates in rural areas are higher than in urban areas in each of these countries (53). These examples and the extensive literature on ecological correlations between area disadvantage and health (153−159) show a health divide between countries and subnational areas within countries in the Region. Any strategy to reduce the health divide needs to address differences at every level of geography.
3.7 Work, employment and unemployment
People’s work profoundly affects their health, both when they are working and following retirement. Work-related health effects depend on whether individuals obtain secure employment when they need it and its quality in relation to, for example, the amount of control they have on the demands placed
little is known about health and integration of child immigrants in Europe, although some research has been undertaken (146-151). Immunization is a particular issue in terms of access, family perception and vaccine-related information.
Investigating and understanding these issues among immigrant children can assist in developing culturally sensitive policies that promote better integration of child immigrants in Europe. Molcho et al. (152) examined health and well-being among child migrants using data from the HBSC 2005/2006 survey. The most consistent pattern related to low family affluence: immigrant children were significantly overrepresented in the low-FAS category compared to their native peers in 10 of 12 countries that collected data on country of birth. No differences were found in the self-reported health of foreign-born children compared to their native peers across the Region (152).
3.6.2 Urban and rural differences
As a second example, differences in children’s nutritional status according to urban or rural residence can be compared using data from the UNICEF MICS. Table 3.7 presents information from this source for the countries of the Balkans (Albania, Bosnia and Herzegovina, Montenegro, Serbia and the former Yugoslav Republic of Macedonia) and selected countries in the CIS (Belarus, Georgia, Kazakhstan, Kyrgyzstan, Tajikistan and Uzbekistan).
Table 3.7
Percentage of under-fives with malnutrition, by urban and rural residence, in selected European Region countries
a SD: standard deviation. b The former Yugoslav
Republic of Macedonia (MKD) is an abbreviation of the ISO.
Source: Falkingham et al. (116).
Chronic malnutrition (<2 SDa on height for age)
Acute malnutrition (<2 SD on weight for height)
Underweight (<2 SD on weight for age)
Urban Rural Urban Rural Urban Rural
Albania 23.1 22.9 4.9 7.4 5.5 9.1
Belarus 2.0 4.5 1.6 0.9 0.7 1.8
Bosnia and Herzegovina 9.8 10.5 4.9 3.3 2.7 1.2
Georgia 10.8 15.3 2.3 2.5 2.0 2.5
Kazakhstan 13.4 17.8 5.9 4.0 4.4 6.0
Kyrgyzstan 12.1 16.7 2.9 4.6 3.9 3.8
Montenegro 5.4 6.3 2.7 4.4 3.0 1.8
Serbia 6.5 7.3 4.3 3.6 2.1 1.4
Tajikistan 27.5 29.2 8.3 8.1 17.4 18.5
MKDb 8.9 9.3 2.1 3.7 2.7 2.2
Uzbekistan 15.6 16.1 4.7 3.9 5.3 5.5

46 Review of social determinants and the health divide in the WHO European Region: final report
compared to April 2011. The seasonally adjusted unemployment rates in April 2012 were 10.3% and 11.0%, against 8.9% and 9.4% in May 2009 (164).
The lowest unemployment rates in individual countries in the first quarter of 2012 were 3.9% in Austria and 5.2% in Luxembourg and the Netherlands. The highest were 24.3% in Spain and 21.7% in Greece.
The unemployment rate across the EU among those aged 15–24 years was 22.4% in April 2012, compared to 19.5% in May 2009. Germany and Austria had the lowest rates in the first quarter of 2012 at 7.9% and 8.9% respectively and Greece and Spain had the highest (52.7% and 51.5%).
Historically in the EU, women have had higher unemployment rates than men, but as Fig. 3.33 shows, unemployment increased faster among men following the economic crisis of 2007/2008, with young people (especially young men) faring worst.
Fig. 3.34 shows levels of unemployment in selected countries in 2011 by age and gender. Women in Greece aged 15−24 had the highest rate among the countries shown (51.5%), compared with 38.5% for men in Greece in the same age group. Men of 15−24 in Spain had a slightly higher rate than women (48.2% compared to 44.4%). In contrast to these very high figures, comparable rates in the Netherlands, Germany, Austria and Norway were below 10%.
upon them. Insecure employment – temporary contracts and informal employment arrangements – has an adverse effect on health, as does the threat of unemployment and being unemployed, particularly for prolonged periods.
There is strong evidence that employment conditions and quality of work influence health (2,160). A study among manual workers in Spain showed that poor mental health was more prevalent among workers with non-fixed temporary employment and those without contracts than workers with permanent or fixed temporary-employment contracts (161). Changes in the labour market have led to increasing part-time and temporary employment within the EU since the early 1990s (162).
A study that compared two western European countries with four post-communist found poor work quality, with high work-related stress, was associated with poor self-rated health in Poland, the Russian Federation, Czech Republic, Germany and United Kingdom (England). While the size of the effects differed between countries, there was no evidence for systematic east−west differences (163) (Fig. 3.32).
Eurostat estimates indicate that 24.7 million men and women in the EU were unemployed in April 2012, of whom 17.4 million were in the Euro area. Unemployment increased by 1.9 million and 1.8 million respectively in the EU and Euro area,
Fig. 3.32
Risk of poor health by effort−reward imbalance at work: European countries
Lowest
Second
Third
Highest
Source: Salavecz et al. (163).
Risk of poor health
Czech Republic
Quartile of effort–reward inbalance
Russian Federation
Poland Hungary Germany United Kingdom
4
3
2
1
0

Health inequities between and within countries 47
Fig. 3.33
Trends in unemployment in 27 EU countries, men and women aged under 25 and 25−74, 2002−2011
Males, under 25
Males, 25–74
Females, under 25
Females, 25–74
Source: Eurostat (165).
Fig. 3.34
Unemploymenta among people aged 15−24 and 25−74 in selected countries participating in the European Health Programme, 2011
a Not seasonally adjusted. Source: Eurostat (165).
Women
Age 25–74
Age under 25
Greece
Spain
Croatia
Slovakia
Italy
Portugal
Latvia
Lithuania
Poland
Bulgaria
Hungary
France
Romania
Ireland
Sweden
Cyprus
Estonia
Turkey
Luxembourg
Belgium
United Kingdom
Finland
Czech Republic
Slovenia
Malta
Denmark
Iceland
Austria
Norway
Netherlands
Germany
0 10 20 30 50 6040
Men
Age 25–74
Age under 25
Spain
Greece
Ireland
Lithuania
Slovakia
Latvia
Portugal
Bulgaria
Hungary
Italy
Sweden
Romania
Estonia
Poland
United Kingdom
Cyprus
France
Finland
Belgium
Iceland
Czech Republic
Denmark
Slovenia
Malta
Luxembourg
Norway
Germany
Austria
Netherlands
0 10 20 30 5040
25
20
15
10
5
0
2002 2003 2004 2005 2006 2007 2008 2009 2010 2011

48 Review of social determinants and the health divide in the WHO European Region: final report
(Fig. 3.36). Those with tertiary education had an unemployment rate of 6% but the rate varied from 3% for people with parents born in the EU to 12% for those whose parents were born in a country with a low human development index (HDI). At the other end of the education spectrum, the average unemployment rate for those who had, at most, lower-secondary education was 12%: 11% for those with parents born in the EU and 19% with parents from a low-HDI country.
Long-term unemployment has particularly harmful effects on physical and mental health (169). The proportion of people who had been unemployed for more than 12 months in 2011 varied substantially across the Region (Fig. 3.37): Spain, for example, had the highest overall rates for men and women, but long-term unemployment was highest for men in Ireland and women in Greece.
The highest unemployment rates in the east of the Region in 2010 were in Bosnia and Herzegovina and the former Yugoslav Republic of Macedonia, and the lowest were in Kazakhstan and Azerbaijan (Fig. 3.35). Unemployment among 15−24-year-olds was considerably higher than the all-age rate in all countries shown, except Kazakhstan. The rate exceeded 50% in the two countries with the highest levels of total unemployment.
Routine Eurostat data indicate that unemployment for foreign nationals is higher than among the indigenous population in most of the countries on which they report (166,167). A special Eurostat data collection for 2009 shows a strong graded relationship between country of birth of parents, education level and unemployment, indicative of the negative outcomes experienced by people with lower skills levels and disadvantaged migrant status
Fig. 3.35
Employment among 15−24-year-olds and total unemployment in CCEE and CIS countries, 2010 (or latest available year)
Among 15–24-year-olds
Total
a The former Yugoslav Republic of Macedonia (MKD) is an abbreviation of the ISO.
Note: the data for Tajikistan are for 2009 and the data for Albania are for 2008.
Source: TransMonEE (52).
Bosnia and Herzegovina
MKDa
Serbia
Montenegro
Armenia
Georgia
Lithuania
Latvia
Slovakia
Estonia
Croatia
Albania
Hungary
Poland
Bulgaria
Romania
Czech Republic
Republic of Moldova
Ukraine
Russian Federation
Tajikistan
Kyrgyzstan
Slovenia
Azerbaijan
Kazakhstan
0 10 20 30 40 50 60
Annual average percentage unemployed

Health inequities between and within countries 49
Fig. 3.37
Unemployment rates by duration, selected countries in the European Region, 2011
Source: Eurostat (170).
Fig. 3.36
Unemployment rates by education and country of origin in selected countries, European Region, 2009
Country of birth of parents:
all countries of birth
EU country in which responding to survey
other EU country
non-EU, high-HDI country
non-EU, medium-HDI country
non-EU, low-HDI country
Source: Eurostat (168).
Education
All levels of education
Tertiary
Upper-secondary and post-secondary,
non-tertiary
Pre-primary, primary and lower-secondary
0 5 10 15 20
Percentage unemployed at ages 15–64
Females
Long-term unemployed
Unemployed less than 12 months
Males
Long-term unemployed
Unemployed less than 12 months
NorwayAustria
NetherlandsGermany
IcelandLuxembourg
RomaniaFinland
MaltaBelgium
United KingdomSweden
DenmarkCyprus
Czech RepublicSlovenia
ItalyBulgaria
TurkeyFrancePolandIreland
HungaryEstonia
LithuaniaLatvia
CroatiaPortugalSlovakia
GreeceSpain
0 5 10 15 2520
NorwayLuxembourg
AustriaNetherlands
Czech RepublicMalta
GermanyBelgiumSweden
ItalyDenmark
IcelandRomania
CyprusSlovenia
TurkeyFinland
United KingdomPolandFrance
HungaryBulgariaPortugalEstonia
SlovakiaCroatiaGreeceIrelandLatvia
LithuaniaSpain
0 5 10 15 2520
Percentage unemployed

50 Review of social determinants and the health divide in the WHO European Region: final report
3.8 Older people
Inequities in older people’s health and well-being relate to a considerable extent to differences in conditions experienced earlier in their lives – the accumulation of advantage and disadvantage that takes place across the life-course. Current living conditions in older age also contribute to health inequities (see Chapter 4).
Many studies show an association between SES, measured in different ways, and mortality in older age (171−175). Issues such as housing tenure (176) and car ownership (177) have been associated with all-cause mortality in men and women (178). Employment status (never having been in paid employment) was found to be associated with all-cause and cardiovascular mortality in older people (179,180). Further details about these associations and variations by gender are contained in the task group report on older people (181).
Several studies show that social gradients in relative levels of mortality not only decrease with age (171;182−189), but also tend to be weaker among women than men at older ages (175,183,190−193). This is in part a reflection of the large absolute differences due to the high proportion of deaths that occur in older age, particularly among women.
Most studies report higher mortality risk at lower education levels, with abundant evidence from northern European countries and from some southern (Spain, Italy and Israel). Associations between level of education and mortality in older age groups have been reported in Scandinavian countries (173−176,179,188,194−198), the United Kingdom generally or England, Scotland, Northern Ireland or Wales specifically (178,182,184,188,189, 199−203), most western and central European countries (171,180,185,187,191,204,205), southern European countries, specifically Spain and Italy (188,192,193,206−211), and in Israel (177,212,213). Information on education inequities in mortality in older populations from eastern Europe is more scarce, although several reports point to education mortality differences in Lithuania (214), Poland (215) and the Russian Federation (216). No association was found among older primary care patients in Germany (217) or in a study of nursing home residents in northern Spain (218), but the populations in both studies comprised very specific and selective subgroups.
The Eurothine analysis showed consistent education inequities in mortality in Europe, with particularly large differences in the Baltic states and CCEE. While the magnitude of relative differences is often smaller in the oldest old (aged 75+ years) than in younger olds (60−74 years), they are still substantial and favour those with higher education levels. This has been reported for several European countries
in studies other than Eurothine (188) and in research relating to women in Madrid, Spain (211). Educational gradients in further life expectancy were substantial in a Swiss study, particularly among “young-old” men, but tended to decrease at older ages (219). As education differences diminish with age, some studies that only include older-old people, including from Denmark (196,198), Switzerland (204) and Spain (207), have not found an association between education and mortality.
The largest cause-of-death contributor to mortality differences by education in men and women was CVD. Most other causes are also related to level of education, with higher mortality associated with lower education status. One notable exception to consistent gradients for men and women is that highly educated older women are more likely to die from lung cancer. This relates to higher rates of smoking in wealthier women over 65, reflecting large variability among different cohorts in patterns of smoking uptake and cessation.
Older people’s self-reported health has been associated with a number of indicators of socioeconomic position, such as income level (220−235), receipt of income support (236), wealth and assets (237,238), occupational class (220−222,239−244), house or car ownership or housing amenities (222,228,236,245), self-assessed financial position and financial strain (245−248) and area-based measures of socioeconomic position (221). The strength of these relationships seem to vary among European countries, with some inconsistencies in results (66,187,222,228,237,239,245,249,250). The association between relative levels weakens with increasing age (251,252), as ill-health reporting becomes more prevalent with increasing age and, as suggested above, absolute differences increase.
Disability is associated with several aspects of poorer socioeconomic position: income (187,196,216,220,237,253−257), wealth and assets (237,254−261), occupational class (220,240,254,258, 260−263), house or car ownership (196,221,255,262) and self-perceived financial hardship (263). The strength of association varies according to the indicator used. Generally, studies indicate that current circumstances (current income, wealth and housing) are more strongly associated with disability than positions in past life (education, work income, occupation) (255,258−261). Associations have been consistently found in the United Kingdom (258,260,263), western continental (255) and southern European countries (237,258,259,261), while they appear weaker and less consistent in studies from Nordic countries (196,240,241,264) and Turkey (265).
Findings on the relationship between disability and education status vary between countries and the type of study. Higher rates of disability among the least-well educated has been reported in research

Health inequities between and within countries 51
3.9.1 Smoking
Current smoking levels differ substantially across the Region (Fig. 3.38), reflecting wide differences in the progression of smoking habits (whether the number of smokers is continuing to increase or has started to decrease) and the impact social determinants (such as those described above) have on the levels at which numbers of smokers peak. For these reasons, interpreting current levels of smoking in terms of likely future trends and health effects requires a more detailed understanding of past trends in different age cohorts and social groups in each country. It should also be noted that passive exposure to smoke affects a larger number of people than active smoking, with a potentially broader social and demographic profile depending, for example, on the existence and coverage of smoking bans (see, for example, the recently published environmental health inequality assessment report (271)).
Over half of men were regular daily smokers in six of the countries shown in Fig. 3.38 − the Russian Federation, Albania, Georgia, Armenia, Republic of Moldova and Belarus – while the figure was less than one in five in Norway, Bosnia and Herzegovina, Iceland and Sweden. Smoking rates were generally lower for women, ranging from 2% or less in Armenia, Kyrgyzstan, Uzbekistan and Azerbaijan to 30% or more in the former Yugoslav Republic of Macedonia, Germany and Andorra.
The genders also differ significantly in smoking prevalence in many countries. For example, the living conditions, lifestyles and health study of eight CIS countries – Armenia, Belarus, Georgia, Kazakhstan, Kyrgyzstan, Republic of Moldova, Russian Federation and Ukraine – found prevalence rates among men varying between 50% and 65% and among women from 2% to 16% (272), although the latter are increasing in many of these countries. Countries with low female smoking rates often see a higher prevalence among more-affluent women: for example, 1% of women in the lowest quintile of wealth in the Republic of Moldova smoke, but so do 17% in the highest quintile (273). In contrast, the highest proportion of smokers in countries with large percentages of men who smoke is often among the least wealthy. Sixty per cent of the least wealthy men in the Republic of Moldova smoke, against 45% in the wealthiest quintile. Recent papers have looked at emerging patterns across some of the other countries in Europe (274−277).
The Eurothine study found an inverse relationship between smoking prevalence and education level, occupational class and household assets across countries. Variations were found by region and age group in the relative importance of education level versus other indicators of socioeconomic position in smoking prevalence, reflecting the progress of the smoking epidemic (278).
relating to Scandinavian countries (195,266), United Kingdom (England) (252,260), central and western Europe (220), southern Europe (99,237,258,259,267−269) and Israel (270). One comparative study using data from the Surveys of Health and Retirement in Europe (SHARE) longitudinal surveys found that education level was associated with functional limitations in western and southern Europe, but not in northern Europe (141). Years of schooling were also associated with recovery from disability (as estimated by transition from having at least one limitation to none) in southern, but not northern or western, Europe.
The association between educational attainment and disability weakens with increasing age as disability becomes more prevalent at older ages. In this situation, smaller relative indices of association may be associated with large absolute differences in numbers of cases.
3.9 Health-related behaviours and health risks
The conceptual framework that underpins the social determinants of health (Fig. 2.1) reinforces the review’s perspective that it is the “causes of the causes” of health behaviours that are most important in shaping health. These include factors described earlier in this chapter − income (including social protection systems), experiences in the early years, education and employment. It is important to address the ways in which social determinants influence health, including the effects that lack of control, stress and reduced capabilities have on health-related behaviours such as smoking, unhealthy diet, physical inactivity, harmful use of alcohol, unsafe sexual behaviour and compliance with offered medical interventions such as immunization.
The effect of behaviours on inequities in ill health and premature death depends on the social distribution of the behaviour and the extent to which the risk of ill health or death is increased in individuals who adopt the behaviour. The extent to which health behaviours are distributed across society varies between countries. The next section illustrates the distribution of health-related behaviours between and within countries with reference to comparative data and evidence for smoking and alcohol consumption. Evidence on the distribution of obesity, a condition that increases the risk of adverse health outcomes and is linked to socially patterned lifestyles and behaviours (dietary intake and physical activity), is included as it reflects an imbalance between energy consumption and expenditure. As levels of obesity have increased across the Region, the relationship with social determinants of health has become stronger.

52 Review of social determinants and the health divide in the WHO European Region: final report
3.9.2 Alcohol consumption
Alcohol intake in the Region is the highest in the world. On average, 10.8 litres of pure alcohol were consumed per person aged 15 and over in 2007. Fig. 3.39 shows the latest figures for each country on the WHO European health for all database (3).
There is a close relationship between a country’s total per capita alcohol consumption and its prevalence of alcohol-related harm and dependence. Excessive consumption damages physical and psychosocial health and contributes to physical injury to self and others. Not surprisingly, the Region has the highest proportion of total morbidity and premature death due to alcohol (280−283). Both the pattern of alcohol consumption and the harmful effects on health of a particular level of drinking
The HBSC survey provides information on adolescent smoking for 31 countries in the Region. Analysis of data from the 1997/1998 survey showed adolescent smokers were more likely to be female, have higher-than-average personal income, live in a stepfamily, have a parent who smokes and live with other smokers (279). Smoking was often higher in low-affluence families, but this was only significant in three countries (279).
Fig. 3.38
Percentage of the population 15 years and older who are regular daily smokers, 2010 (or latest available year)
Males
a The former Yugoslav Republic of Macedonia (MKD) is an abbreviation of the ISO.
Source: WHO Regional Office for Europe (3).
0 10 20 30 40 50 60 70
Percentage regular daily smokers at ages 15 and over
Sweden (2010) Iceland (2010) Bosnia and Herzegovina (2010) Norway (2010) Denmark (2010) United Kingdom (2009) Sloveia (2007) Switzerland (2007) Netherlands (2010) Finland (2010) Belgium (2008) Uzbekistan (2002) Malta (2009) Slovakia (2009) Austria (2006) San Marino (1994) Luxembourg (2009) Ireland (2008) Israel (2009) Czech Republic (2010) Italy (2010) France (2003) Serbia (2006) Portugal (2006) Spain (2009) Romania (2008) Poland (2009) Croatia (2003) Lithuania (2010) Azerbaijan (2010) Montenegro (2008) Hungary (2009) Estonia (2010) Germany (2003) Turkey (2010) Greece (2009) Cyprus (2008) MKDa (1999) Kazakhstan (2004) Kyrgyzstan (2005) Ukraine (2008) Andorra (2002) Bulgaria (2001) Latvia (2010) Belarus (2010) Republic of Moldova (2006) Armenia (2010) Georgia (2001) Albania (2000) Russian Federation (2004)

Health inequities between and within countries 53
alcohol (such as methylated spirits and antifreeze) contribute to differences in alcohol-related mortality (286,287).
An extensive literature provides evidence that misuse of alcohol among adult men contributes to between-country and within-country differences in mortality (23,288). The Eurothine study evaluated the difference in alcohol-related mortality by education level in 13 EU Member States and found that socioeconomic differences made a substantial contribution to overall mortality variation in men (289). Alcohol has been linked with high mortality in CCEE and the CIS, and heavy drinking (particularly among men) probably contributed substantially to fluctuations in mortality during the countries’ economic transition. Long-term unemployment can be linked to excessive drinking (290).
are related to socioeconomic position: the health problems are, for example, greater among the unemployed (284).
Average alcohol consumption varies considerably across the Region (Fig. 3.39). The caveat here is that accurate estimations of alcohol consumption are notoriously hard to derive, not least because of the tendency to underreport. Taking the Russian Federation as an example, the most authoritative study suggests that the true estimate might be 1.5 times higher than that routinely reported (285). The health effects of alcohol depend partly on patterns of alcohol consumption in each country, which are influenced by material and psychosocial factors, local drinking cultures and price and availability. The practices of heavy drinking, binge drinking, drinking home-made alcoholic beverages and non-beverage
Fig. 3.38 contd
Females
a The former Yugoslav Republic of Macedonia (MKD) is an abbreviation of the ISO.
Source: WHO Regional Office for Europe (3).
Azerbaijan (2010) Uzbekistan (2002) Kyrgyzstan (2005) Armenia (2010) Ukraine (2008) Georgia (2001) Republic of Moldova (2006) Kazakhstan (2004) Romania (2008) Belarus (2010) Bosnia and Herzegovina (2010) Turkey (2010) Portugal (2006) Slovakia (2009) Iceland (2010) Cyprus (2008) Lithuania (2010) Israel (2009) Sweden (2010) Russian Federation (2004) Slovenia (2007) Finland (2010) Malta (2009) Czech Republic (2010) San Marino (1994) Italy (2010) Switzerland (2007) Belgium (2008) Albania (2000) Estonia (2010) Netherlands (2010) Norway (2010) Austria (2006) United KIngdom (2009) Denmark (2010) Latvia (2010) Poland (2009) Luxembourg (2009) France (2003) Spain (2009) Croatia (2003) Serbia (2006) Bulgaria (2001) Ireland (2008) Greece (2009) Hungary (2009) Montenegro (2008) Andorra (2002) Germany (2003) MKDa (1999)
0 10 20 30 40 50
Percentage regular daily smokers at ages 15 and over

54 Review of social determinants and the health divide in the WHO European Region: final report
Alcohol consumption continues to contribute to high levels of mortality and morbidity among young and middle-aged adults in the eastern part of the Region. As tobacco control improves in European countries, alcohol is becoming the most important proximal cause of premature mortality in young adults not only in eastern Europe, but also in some western countries such as the United Kingdom and Ireland. This calls for a coordinated European policy response.
3.9.3 Obesity and nutritional status
Sections 3.4 and 3.5 presented evidence about the relationships between poverty, chronic malnutrition and overweight among children, in the context of child health and development. This section summarizes the obesity epidemic’s progress across Europe.
Robertson et al. (291) reviewed evidence about the current distribution of obesity across Europe, finding a consistent and profound social gradient in prevalence in western European countries with data available. Women and children in lower socioeconomic groups were especially likely to show high levels of obesity compared with the rest of the population. The gradient was less pronounced for men.
Fig. 3.39
Alcohol consumption in litres per person aged 15 years and older, 2010 (or latest available year)
a The former Yugoslav Republic of Macedonia (MKD) is an abbreviation of the ISO.
Source: WHO Regional Office for Europe (3).
0 5 10 15 20 25
Pure alcohol consumption, litres per capita aged 15+
Tajikistan (2008) Turkey (2007) Azerbaijan (2007) Uzbekistan (2005) Turkmenistan (2007) Israel (2007) Armenia (2007) Albania (2007) Kyrgyzstan (2007) MKDa (2005) Georgia (2009) Norway (2009) Iceland (2009) Italy (2009) Kazakhstan (2007) Serbia (2009) Sweden (2009) Malta (2007) Greece (2009) Netherlands (2008) Cyprus (2007) Belgium (2006) Ukraine (2007) Finland (2009) Spain (2006) Bulgaria (2009) Poland (2009) United Kingdom (2010) Switzerland (2009) Denmark (2009) Slovakia (2009) Croatia (2007) Portugal (2007) Russian Federation (2008) France (2007) Germany (2009) Andorra (2006) Hungary (2008) Slovenia (2009) Austria (2009) Estonia (2010) Lithuania (2010) Romania (2009) Latvia (2008) Ireland (2006) Bosnia and Herzegovina (2010) Belarus (2007) Czech Republic (2009) Luxembourg (2007) Republic of Moldova (2008)

Health inequities between and within countries 55
3.10 Widening health inequities
Data, either cross-sectional or longitudinal, are being used to monitor temporal changes in health inequities within European countries (295). All too often, the trend has been for a widening.
A wealth of data show a socioeconomic gradient in various health outcomes in CCEE and the CIS (28,166,296). The first study reporting empirical data on trends came from the Russian Federation. Shkolnikov et al. (297) compared the educational gradient in mortality from the 1989 census with mortality around a microcensus in 1993. Mortality among men and women with lower education increased by 57% and 30% respectively over only 4 calendar years: the respective figures for those with secondary and higher education were 35% and 8%. The relative risk of death for lower versus higher education consequently increased from 1.6 to 1.9 in men and 1.4 to 1.8 in women over the 4-year period.
Studies in different countries have replicated the finding on patterns of increasing education differentials in mortality (298). A diverging educational gradient in all-cause mortality has been demonstrated in the St Petersburg Lipid Research Clinic cohort (299) and in national data from the Russian Federation using an indirect cohort approach (Fig. 3.41).
The relative mortality ratio of people with primary versus university education in Estonia increased from 1.7 to 2.4 among men and from 1.4 to 2.2 among women between 1989 and 2000 (Fig. 3.42).
Two population-based cohort studies in the Czech Republic during the 1980s and 2000s showed that the educational gradient in mortality during the first five years of follow up widened considerably in both men and women (Fig. 3.43).
A comparison of four central European and Baltic states showed very different trends in patterns of inequity between countries. Low-education groups in Hungary and Latvia were losing life expectancy over time; those in Poland and the Czech Republic were gaining life expectancy, but at a slower pace than middle- and high-education groups (304). The first pattern, which was also evident in the Russian Federation, should be alarming for any government.
Research in Israel using national data from longitudinal mortality studies showed widening inequities in overall and CVD mortality by socioeconomic position between 1983 and 1992 and 1995 and 2004 (305). Socioeconomic position was assessed by ownership of six household items, reflecting each time period. Fig. 3.44 shows that relative increases in CVD mortality occurred in both sexes, most notably in women (305).
Robertson et al. concluded that patterns in eastern Europe are less clear during an evolving period of social transition, with better-off men and better-off older women traditionally showing higher levels. There may be a concurrent underweight problem among younger women in some areas. From the evidence reviewed, they suggested that about 20–25% of the risk of obesity among men and 40–50% among women can be attributed to differences in SES in the Region as a whole. Evidence suggests the difference between socioeconomic groups is widening, with faster growth among less-advantaged groups resulting in a steepening gradient (292,293). This reflects a range of changes in the level and distribution of the obesogenic environment (such as the availability and composition of fast food and ready meals, changes in employment and working patterns and changes in factors affecting physical activity).
Robertson et al. noted that countries with higher levels of social inequality (in relation to, for instance, income or the proportion of the population living in relative poverty) tend to have the highest prevalence of obesity, especially among adolescents and children, in whom it is also positively associated with parents’ SES (291).
Roskam et al. (294) examined how obesity varied in the parts of Europe covered by the Eurothine study according to educational attainment and gender (Fig. 3.40). The overall prevalence was 11%, ranging from 6% in France to 22% in United Kingdom (England).
Roskam et al. (294) found considerable differences in the extent to which male obesity varied by education level within countries. Based on a summary indicator of variability of the rates shown in Fig. 3.40 (the relative index of inequality), they concluded that in most countries, the higher the level of education, the lower the prevalence of obesity. Sweden, the Czech Republic and the Netherlands showed the greatest education inequalities in obesity in this analysis. Latvia and Lithuania, where men were more likely to be obese with higher education level, were exceptions: taking into account the relatively low level of obesity, this suggests an early stage in the obesity epidemic in these Baltic states.
Results for men were correlated with GDP. A €10 000 increase in GDP per person was associated with a 3% increase in overweight and obesity for those with low levels of education but a 4% decrease for men with high levels. GDP was not associated with obesity among women (294).
The overall prevalence among women was 11%, ranging from 5% in Italy to 23% in United Kingdom (England). Analysis using the relative index of obesity suggested that women with lower levels of education had a higher prevalence in every area covered by the study. The relationship was weakest in Latvia, Finland and Norway and strongest among Mediterranean women, particularly those in Portugal (294).

56 Review of social determinants and the health divide in the WHO European Region: final report
Fig. 3.40
Percentage of the population that is obesea by level of education and sex, selected countries, European Region
a Body mass index ≥ 30 kg/m2. Source: Roskam et al. (37).
Men aged 25–44
Highest education
Second highest
Second lowest
Lowest education
France
Italy
Portugal
Latvia
Lithuania
Finland
Denmark
Belgium
Netherlands
Norway
Slovakia
Spain
Ireland
Czech Republic
Sweden
Estonia
Germany
Hungary
United Kingdom (England)
0 5 10 15 20 25 30
Percentage obese
Women aged 25–44
Highest education
Second highest
Second lowest
Lowest education
30
Italy
Portugal
Norway
Spain
Finland
Ireland
Latvia
Czech Republic
Belgium
France
Slovakia
Netherlands
Lithuania
Estonia
Denmark
Sweden
Hungary
Germany
United Kingdom (England)
0 5 10 15 20 25
Percentage obese

Health inequities between and within countries 57
Fig. 3.41
Probability of survival among men by education, the Russian Federation, 1989−2001
University
Below secondary
Source: Murphy et al. (300).
Survival probability
Year
0.8
0.7
0.6
0.5
0.4
0.3
0.2
0.1
0
1990 1991 1992 1993 1994 1995 1996 1997 1998 1999 2000 20011989
Fig. 3.42
Mortality by sex and highest level of education in Estonia, 1989 and 2000
Men
University
Secondary
Primary
Women
University
Secondary
Primary
Source: Leinsalu et al. (301).
Age-standardized mortality per 100 000
1989 19892000 2000
3000
2500
2000
1500
1000
500
0

58 Review of social determinants and the health divide in the WHO European Region: final report
In addition, Jaffe & Manor (305) reported that inequities in cardiovascular mortality for the period 1995−2004 were much greater among resident women than resident men, immigrant men and immigrant women.
Nordic countries are considered to be among the most egalitarian societies in the world. Despite overall health improvements, Shkolnikov et al (306) showed a constant increase in educational differences in (absolute and relative) mortality among men and women between 1970 and 2000 in Sweden, Norway and Finland. Fig. 3.45 shows life expectancy for 2000−2010. Overall, it appears that mortality differences between educational groups in Sweden increased continually from at least 1970 until 2010, suggesting 40 years of widening health inequities. The challenges presented by new global economic forces (such as increases in immigration levels) have had an impact on Nordic countries’ welfare systems, which are now being scaled back.
Widening inequities in health documented for a number of countries over the past 20−30 years and the challenges presented by the current economic crisis make a compelling case for action based on the social determinants of health. Policy recommendations are presented in Part III.
Fig. 3.44
CVD mortality by household wealth, Israel, 1983–1992 and 1995–2004
Men
Women
a Odds ratio for CVD mortality associated with 1 standard deviation change in household amenities for men and women aged 45−64 of the Israel Longitudinal Mortality Study (ILMS) 1 (1983−1992) and ILMS II (1995−2004).
Source: Jaffe & Manor (305).
Odds ratioa
1983–1992 1983–19921995–2004 1995–2004
2.0
1.5
1.0
0.5
0.0
Fig. 3.43
Mortality rate ratios by education (compared with primary education only) among men and women aged 45–64 years in the Czech Republic, 5-year averages, 1980s and 2000s
Men
University
Secondary
Primary
Women
University
Secondary
Primary
Source: Cífková et al. (302); Peasey et al. (303).
Mortality rate ratio
1980s 1980s2000s 2000s
1.0
0.8
0.6
0.4
0.2
0.0

Health inequities between and within countries 59
Fig. 3.45
Life expectancy trends in Sweden 2000−2010 by education level, men and women
Source: Statistics Sweden (4).
Men
Post-secondary
Upper-secondary
Compulsory
Women
Post-secondary
Upper-secondary
Compulsory
2000 2001 2002 2003 2004 2005 2006 2007 2008 2009 2010
Life expectancy at age 30
58
56
54
52
50
48
46
2000 2001 2002 2003 2004 2005 2006 2007 2008 2009 2010
Life expectancy at age 30
58
56
54
52
50
48
46

stef
an b
ones
s | p
anos
pic
ture
s

Specific areas of action on the social determinants of health 61
Part III Specific areas of action on the social determinants of health
The gradient in health experience between and within countries identified in Part II will persist and in many cases increase unless urgent action is taken to control and challenge inequities in the social determinants of health − the conditions of daily life and their structural drivers (2).
Part III presents recommendations on interventions and policies that would most effectively lead to reductions in health inequities in short, medium and long terms. They are based on the best available evidence gathered by task groups on the factors that lead to inequities across the Region and the actions that are most effective in different contexts for tackling the causes of health inequities. Where possible, they are illustrated by case studies, interspersed throughout the text, to illustrate innovative approaches with a focus on the most recent research available.
The systems and governance arrangements that need to be established or strengthened to ensure the recommendations are implemented in a synergetic and systematic manner are also summarized. A distinction between contexts − the implementation issues relevant at different levels of government, sectors and income levels of the countries concerned − is made where appropriate.
The recommendations and supporting evidence are organized in four chapters that reflect the dimensions summarized in Fig. 2.2:
�� Chapter 4: life-course
�� Chapter 5: wider society
�� Chapter 6: macro level
�� Chapter 7: systems.

4 Life-course
4.1 Background
As indicated in Chapter 2, a life-course approach is fundamental to identifying the cumulative effect of social determinants on health and reducing resulting inequities. The stages of life and influences identified in this chapter comprise:
�� the early years
�� the parenting a child receives
�� preschool and school-age education experiences
�� transitions into employment, unemployment and training
�� family-building
�� positive and negative influences on health during normal working ages and into older ages.
4.2 Perpetuation of inequities in health risks from one generation to the next
4.2.1 Introduction
The chapter begins with a description of how inequities which accumulate through life are passed on through generations, perpetuating inequities. In light of the evidence, it is recommended that policies and strategies are assessed for their likely effect on equity for future generations. Disrupting the perpetuation of health inequity from one generation to the next requires investment and emphasis on particular life stages, particularly pregnancy and early life, when many of the trajectories for future life are built.
62 Review of social determinants and the health divide in the WHO European Region: final report
Recommendation 1(a).
Ensure that the conditions needed for good-quality parenting and family-building exist, promote gender equity and provide adequate social and health protection.
Specific actions
(i) Ensure that accessible, affordable and high-quality sexual and reproductive health services are available to all who need them (particularly women and girls and young people of both sexes). This includes access to evidence-based contraception and care in pregnancy and childbirth. Aside from safe delivery as a basic right, high-quality services help to decrease smoking rates in pregnancy, increase breastfeeding and promote skills and knowledge for effective parenting. Services should identify families at risk early and refer to appropriate services.
(ii) Ensure that strategies to reduce social and economic inequities benefit women of childbearing age and families with young children.
(iii) Encourage ministers of health to act as advocates for social policies that provide income protection, adequate benefits and progressive taxation to reduce child and pensioner poverty.
(iv) Ensure that parenting policies and services empower women with children to take control over their lives, support their children’s health and development and promote a greater parenting role for men. In particular, strengthen family-friendly employment policies by introducing more flexible working hours − without turning to insecure contracts − and make affordable child care available to help parents combine work with their parental responsibilities.

The early years environment, including parenting and the home environment, affects children’s later life chances. Developments during childhood lay the foundation for physiological and psychosocial health and well-being outcomes throughout the life-course. While problems encountered early in life are not immutable, they are difficult and expensive to shift with increasing age (307). How children develop and what they experience during childhood has a long-term effect on health in adulthood, with overwhelming evidence that individuals who do well during childhood go on to enjoy better health and other outcomes throughout their lives (see Chapter 3 and the report of the task group on early years (307)).
Long-term health trajectories are set very early, including risks of obesity, CVD and mental illness (308), and there is an association between breastfeeding and cognitive outcomes (309). Long-term cognitive, language and social development are influenced by the quality of the early years home-learning environment (310,311). Doing well in childhood encompasses a range of development: educational attainment, physical development, social and emotional capacity for sustained relationships and work-related capabilities like persistence, team working and reliability. The development of these capabilities and traits are reliant on family, community, national and regional contexts. Some families are more nurturing than others, some communities safer than others, and some political systems more supportive than others.
It is important to have the following in place for all families to achieve improved equity in children’s development and in a range of outcomes, including health in later life:
�� women are in a position to make reproductive choices
�� good maternal health and education
�� enhanced parenting skills
�� good-quality early years services for all children
�� good-quality employment
�� sufficient income to lead a healthy life
�� a balance of work and family life for women and men.
There are many avenues through which risks of adverse outcomes can be passed from parents to their children. The first is through direct physiological effects resulting from the parents’ activity: children with poor mothers, for example, are more likely to be disadvantaged in the womb, with an increased likelihood of poor nutrition during pregnancy and low birth weight (51,312−316). The second is through the effect the parents’ circumstances will have on the child after birth, such as the influence of low levels of parental education on language acquisition and comprehension (317−320). The third is through the
interaction between the child’s social environment and genetic predispositions, including the influence of observing severe parental conflict on the child’s ability to develop appropriate behavioural control strategies (321). Much brain architecture is established early in life through dynamic interactions between genetic and environmental influences (see Fox et al. (322) for a review of these issues).
Parental influences can, of course, provide resilience against the occurrence of some of these adverse outcomes even in the most disadvantaged circumstances. Parenting practices are powerful environmental influences on children. Interaction with the primary carer in the first few months of life can set the journey towards healthy social and emotional development throughout life (323,324). Much of the evidence on parenting practices has focused on the quality of the child’s attachment to key caregivers (324−327). Parental mental health therefore plays a key role in outcomes for children, with, for example, children of mothers with mental ill health being five times more likely to have mental health problems themselves, including emotional and behavioural difficulties (328). Poverty, and particularly debt, can increase maternal stress (329). Conflict between parents also carries risks for children (321). Extended family ties, particularly grandparents, can enrich children’s lives, providing support for parents and additional stimulation and care for children.
Morbidities such as obesity and hypertension and behaviours that put health at risk, including smoking, recur in successive generations (330). It is of particular concern that not only can certain health determinants such as poverty and poor education pass from one generation to the next, but also that they can intensify if the child is exposed to multiple processes of deprivation or vulnerability (331). Contributing factors include socioeconomic background, location, culture and tradition, education and employment, income and wealth, and lifestyle and behaviour (330). All these factors affect health and can be mutually reinforcing (330). They may, over time, influence genetic disposition to some diseases, although genetic inheritance of many types of ill health has not been traced to these determinants (330).
Clearly, social policy and action can have greatest impact on environmental influences. The Marmot review in United Kingdom (England) established evidence that progress could be made in reducing lifelong health inequities if all children had the start in life typical of the most advantaged (51).
Sustainable reduction of health inequities requires action to prevent parents’ relative and absolute disadvantage blighting the lives of their children, grandchildren and subsequent generations. The next two sections provide more detail on vulnerable mothers and child poverty. Action on both could help to minimize intergenerational transfers of inequity in the Region.
Life-course 63

64 Review of social determinants and the health divide in the WHO European Region: final report
Differences in maternal mortality are related to the level of service provision, gender norms and values and other social determinants that prevent some women from accessing the health services they need, resulting in delays in seeking appropriate medical care for an obstetric emergency, reaching an appropriate facility and receiving adequate care when a facility is accessed. There are several reasons for these delays: cost, lack of information and education, physical barriers (distance, infrastructure and transport), administrative barriers (insurance, lack of papers for illegal migrants, cultural sensitivity, language barriers), lack of qualified staff and shortages of water, electricity and medicines. High-quality sexual and reproductive health services help to decrease smoking rates in pregnancy, increase breastfeeding, provide support for effective parenting and enable early identification of families at risk.
Data on contraceptive prevalence are not available for all countries, but evidence from surveys suggests that the use of modern contraception has increased across the Region since 1990. There is still a particular need for family planning in CCEE, in rural populations and among women with secondary education or less and women of ethnic origin or who belong to migrant populations.
Several studies show that gender shapes risk- taking attitudes and use and access to information and health services. Gender inequities reduce the autonomy of young women to use contraception. Pregnancy following early marriage puts women at increased risk of dying of pregnancy-related complications as these are twice as high for women aged 15−19 years compared to 20−29. In addition, younger mothers are more likely to have low birth weight.
4.2.3 Child poverty
Poverty in childhood has a strong influence on health and other outcomes throughout life. Living in poverty reduces the amount of money available to ensure that basic needs are met, making the ability to secure a healthy life more difficult. In addition, poverty, and particularly debt, are linked to higher rates of maternal mental ill health (51,329), which can have a negative impact on the quality of parenting, a particularly important factor in child development (337).
Poverty in childhood is determined partly by the labour market and partly by social policies. Areas with high unemployment and/or low wages are likely to have high child poverty rates, unless poverty in households with children is mitigated by social protection policies. Government policy can also influence incomes through minimum wage and equal pay legislation and improve employment prospects with active labour-market policies (Chapter 6), all of which will have an effect on child poverty.
4.2.2 Sexual and reproductive health
Ensuring that women of reproductive age are supported before, during and after pregnancy is important to ensuring their own health, improving outcomes for babies and mitigating against the intergenerational transfer of disadvantage. Interactions among gender inequities, other social determinants of health (most notably poverty, ethnicity and lower levels of education) and factors like age and disability increase women’s vulnerability and exposure to risk of adverse sexual and reproductive health outcomes, such as unwanted pregnancies, sexually transmitted infections, maternal mortality and morbidity, low birth weight and infant mortality (332). Lack of access to contraception and gender-based violence have a direct effect on maternal physical and mental health, which results in the transfer of disadvantage to the child. Reproductive and maternal health outcomes, in particular maternal mortality, are indicative of the extent to which women’s reproductive health is prioritized. Maternal mortality is an important indicator of the effect of inequities that intersect across gender, race/ethnicity, socioeconomic background and geographic area of residence.
Maternal health is linked to several social determinants, such as the status of women and girls in society, a particularly important social determinant of health (332). The level of a woman’s empowerment, reflecting her autonomy and decision-making power, and her ability to make healthy choices are important for optimal child development. An analysis of demographic health surveys in Albania, Armenia and Azerbaijan showed that women’s decision-making power and roles appear to be stronger predictors of maternal health service utilization than their education and employment status.
Maternal mortality is declining in Europe, but the average reduction in the Region between 1990 and 2010 (3.8% according to the 2012 edition of Trends in maternal mortality (333)) is below the 5.5% estimated to be needed to reach the United Nations Millennium Development Goal targets by 2015. Disparities among countries remained wide. It was estimated that the rate exceeded 50 deaths per 100 000 live births in Georgia, Kazakhstan, Kyrgyzstan, Tajikistan and Turkmenistan in 2010 and to have been 5 or fewer in 8 countries with at least 3 deaths recorded. Fewer than 3 deaths were recorded in 2010 in a further 12 countries. Rates of maternal mortality were higher in 2010 than in 1990 in 4 countries that recorded 3 or more deaths (Croatia, Georgia, Switzerland and the United Kingdom). Numbers of deaths have increased in vulnerable immigrant or ethnic groups in several countries with low overall levels of maternal mortality since 1990, including the Netherlands (334), Switzerland and the United Kingdom (335,336).

Life-course 65
associated with differences in government policies on, for example, eligibility and payment of social transfers (see Chapter 5). In particular, children in lone-parent families, which are likely to be headed by women, are more likely to live in poverty than children in couple families in every country covered by the EU−SILC survey. Again, there is variability between countries. Fig. 4.2, for example, compares child poverty rates in single-parent households with child poverty for all households in countries taking part in EU−SILC, with the former being higher in all countries. The rate in single-parent households was less than 20% in Denmark, Sweden and Norway but over 40% in 13 countries (82).
Variations in poverty rates across the EU were illustrated in Fig. 3.21 (Chapter 3), which shows that countries differ in the extent to which they reduce child poverty rates by social transfers, from as little as a 14% reduction in Greece to 66% in Austria.
There are very little comparable data on child poverty for non-EU countries in the Region, but UNICEF and others have compared it in CCEE and CIS countries using social indicators to measure material deprivation, revealing great variability between countries by these measures. Social protection policies for families with children in CCEE and CIS countries are discussed below.
The interaction between gendered division of labour, gender-based wage inequity, the distribution of women-headed lone households and availability of affordable child care also have an influence.
Relative poverty in childhood remains high in much of the Region. Despite 10−15 years of economic growth prior to the current recession, child poverty has remained more or less at the same level in CCEE and central Asia (79). The main reason children have not benefited from economic growth is that the average spend on family benefits in this part of the Region was less than 1% of GDP, compared to 2.25% in the OECD in 2007 (80).
The EU survey of incomes and living conditions in 2009 revealed a huge range of child-poverty rates across the EU (10−33% (Fig. 4.1) (82,87)), despite higher average income levels in the western and central parts of the Region compared with CCEE and CIS countries. The rate within countries changed between 2005 and 2009 by a percentage point or more in 20 of the countries shown in Fig. 4.1, 11 of which were increases.
The range of child poverty across the EU is, to some extent, hidden by the use of headline relative poverty measures. Variations between countries in the risk of poverty in children and the way this links to the composition of poor households with children is
Fig. 4.1
Child poverty ratesa in selected European countries in 2009 and change since 2005
2009 child poverty rate
Difference between 2005 and 2009 rates
a Based on <60% median income.
Note: solid bars represent the 2009 child poverty rate. Where arrows are to the right of the bars, this indicates that poverty rates fell between 2005 and 2009: where arrows are to the left of the end of the bar, poverty rates increased.
Source: Bradshaw (82).
Romania
Latvia
Bulgaria
Lithuania
Italy
Greece
Spain
Poland
Portugal
Luxembourg
United Kingdom
Hungary
Malta
Estonia
Switzerland
Ireland
Slovakia
France
Belgium
Netherlands
Germany
Austria
Czech Republic
Sweden
Finland
Cyprus
Slovenia
Denmark
Norway
Iceland
0 5 10 15 20 25 30 35

66 Review of social determinants and the health divide in the WHO European Region: final report
exceptions of Belarus, which has a quite generous benefit for children under three, and Ukraine. The cost of taxes and charges to families in most countries exceeds the value of cash benefits, indicating that the net value of support provided by the state (cash benefits minus service charges) is negative for these low-income families with children.
The result of current social assistance policies is that children have not benefited sufficiently from the transition. Governments in the CCEE and CIS do not have appropriate institutional mechanisms in place to address child poverty and are not spending enough on cash transfers to families with children to achieve a reduction. The average spend on families with children in the OECD in 2007 was 2.25% GDP: the average spend on family benefits in the CCEE and CIS was less than 1% (339), much less in many countries.
This indicates that many children have been adversely affected by the transition and, subsequently, by increases in food and oil prices and the recession. UNICEF has articulated this concern for decades. There is now an urgent need to support the arguments for a social protection floor, leading to the recommendation that every family should have a minimum standard required for healthy living, particularly in low- and middle-income countries (Recommendation 2(a)(iii)).
4.2.4 Social protection for families with children in CCEE and CIS countries
Before the collapse of the Soviet Union and the other communist regimes in CCEE and the CIS, social protection policies gave children a level of security against extreme poverty. Generally, there was free health care, free education and a system of state preschool child nurseries, full employment and universal child cash benefits (82).
These systems largely disappeared during transition. User charges were introduced for health and education, state nurseries were closed and parents needing preschool provision were forced to pay. Unemployment grew and while some countries (re)introduced contributory unemployment insurance, it only protected those in the formal economy. Parents in many countries in the region travelled abroad to work. Family incomes fell, with a shift from two-earner to one-earner and no-earner households. Cash transfers to families with children became means tested in most countries. No country in the CIS and CCEE region now has a genuinely universal child benefit, with the only cash benefit available to families with children in most being so-called “targeted” social assistance schemes, supported by The World Bank (82).
Typically, targeted social assistance schemes use a (highly complicated) quasi-means test. Consequently, they only help the target group, who are generally the very poor, meaning many poor families do not receive assistance either because they are excluded by the quasi-means test or do not claim. Low-paid working families are also often excluded and, because the majority of poor children live in low-income families in employment, targeted assistance has a limited impact on child poverty (82). Where assistance is provided, it is commonly insufficient to lift families out of poverty. Targeted schemes are often expensive and complicated to administer and are open to corruption. Quasi-means testing and restrictions on employment undermine incentives to work and receiving or reporting remittances from relatives abroad; they can also affect marriage and household sharing arrangements. The numbers of children affected as a result of the recession is increasing as levels of unemployment rise and benefits and services are reduced (82).
Bradshaw et al. (338) undertook a comparison of the structure and level of tax and benefit packages in the CCEE and CIS. Fig. 4.3 shows the income of a two-child family with one earner on half-national average earnings – a poor working family – in each country. Earnings and cash benefits are shown as positive values and income tax, social security contributions and charges for services, such as health and education, as negative values.
Fig. 4.3 shows that cash benefits make a very small contribution to the net income of families on low levels of earnings in every country shown, with the

Life-course 67
Fig. 4.2
Child poverty rates: percentage of children in households lacking at least three deprivation items,a comparing child poverty in single-parent households with all households
All households
Single-parent households
a The household material deprivation indicator used here is that employed by the European Commission (EC). It is constructed from responses to questions on the ability to afford: (i) to pay rent or utility bills; (ii) to keep the home adequately warm; (iii) to face unexpected expenses; (iv) to eat meat, fish or a protein equivalent every second day; (v) to have a week’s holiday away from home; (vi) a car; (vii) a washing machine; (viii) a colour TV; (ix) a telephone.
Source: Bradshaw (82); Eurostat (87).
Fig. 4.3
Earnings, charges and benefits for a couple with 2 children (aged 2 years 11 months and 7 years) on half-average earnings, CCEE and CIS, June 2009, in 2007 US$ ppp, per year
Earnings
Benefits
Charges
a The former Yugoslav Republic of Macedonia (MKD) is an abbreviation of the ISO.
b Kosovo (in accordance with Security Council resolution 1244 (1999)).
Source: Bradshaw (82).
Romania
Bulgaria
Hungary
Latvia
Poland
Slovakia
Lithuania
Portugal
Cyprus
Italy
Czech Republic
Greece
Ireland
United Kingdom
Germany
Austria
France
Belgium
Slovenia
Estonia
Spain
Finland
Netherlands
Sweden
Norway
Denmark
Luxembourg
0 10 20 30 40 50 60 70 80
10 000
8 000
6 000
4 000
2 000
0
–2 000
–4 000
–6 000
–8 000
US$ ppp
Bo
snia
MK
Da
Mo
nten
egro
Turk
ey
Ser
bia
Rus
sian
Fed
erat
ion
Ro
man
ia
Bel
arus
Bul
gari
a
Kaz
akhs
tan
Alb
ania
Geo
rgia
Ko
sovo
b
Aze
rbai
jan
Ukr
aine
Uzb
ekis
tan
Arm
enia
Rep
ublic
of M
old
ova
Kyr
gyzs
tan
Turk
men
ista
n
Tajik
ista
n

for families and mothers throughout pregnancy and in the early years of the child’s life. This is important in families where early support is needed, as indicated in section 4.2, because there is unlikely to be contact in many countries, particularly low-income countries and/or those with a more traditional attitude to women and child-raising, with the formal education sector before school or kindergarten commencing at age three or four (see figures 3.25−3.28).
Reducing inequities in child development requires the creation of systems that enable all children to have a good start in life. As indicated in section 4.2, systems
68 Review of social determinants and the health divide in the WHO European Region: final report
4.3 Childhood development
4.3.1 Introduction
As indicated in section 4.2, developments during childhood lay the foundation for health and well-being outcomes throughout the life-course. Actions to promote physical, cognitive, social and emotional development are crucial for all children, starting from the earliest years and reinforced throughout childhood and adolescence.
The definition of early years varies widely across the Region. “Early years” or “early childhood” refers to children’s experiences from conception to the start of statutory school, the age of which varies among countries. International evidence has consistently supported the proposition that the earliest years of a child’s life, including antenatal experiences, set the foundations for future adult success. Given the nature of early childhood, services that support this stage of life are intergenerational and multiprofessional, include health, education and social welfare, and are aimed at parents as well as children (307).
4.3.2 Early child development
Evidence presented in Chapter 3 shows that the first three years are the time when most gains in improving life chances can be made. A loving, responsive, nurturing and stimulating environment supports good child development in the early years. The health system is often an important entry point for families who need support to provide such conditions, offering an opportunity to advance and make progress in the early years through, for example, programmes that provide nurse-led support
Recommendation 1(b).
Provide universal, high-quality and affordable early years, education and child care system.
Specific actions
(i) Ensure universal access to a high-quality, affordable, early years, education and child care system as the essential bedrock in levelling social inequities in educational attainment, poverty reduction and gender equality.
(ii) Make special efforts to include in education those children most at risk of experiencing multiple exclusionary processes, particularly:
(a) those with disabilities (b) migrants (c) minority ethnic groups such as Roma.
Examples: parenting/family support
Baby and toddler health centres, the Netherlands
These have three main tasks: vaccination, screening of health and physical development problems, and educating young parents on nutrition, hygiene and family health care. They are free and neighbourhood-located. Initiatives launched to set up a system of family support culminated in the creation of centres for youth and family, which include the baby and toddler health centres.
Sure Start children’s centres, United Kingdom
Sure Start provides a universal free service with more targeted help for those most at risk. The services tailor responses to all families with children from pregnancy through to starting school. All provide interventions not codified in specific programmes through outreach, group work and individual interactions. Some make use of formal programmes in their work.
Association Aprender em Parceria (A PAR) [Learning in Partnership Association] programme, Portugal
A PAR is an early childhood primary intervention that aims to support and help parents of young children living in disadvantaged communities by combining individual and community-level approaches. It seeks to promote: bonding between parents and children; development of self-esteem; dispositions towards learning, curiosity and confidence; children’s educational achievement; school attendance; and social support among families within their community. Evaluation has shown evidence of positive effects.
Other examples
A number of systematic manualized individual interventions, such as “Incredible years” and the nurse–family partnership developed in the United States, are also being utilized in European countries.
Source: Currie et al. (307).

Life-course 69
prospects, the general population also gains (307). There is a strong case for recommending that preschool services are universally provided, with a tailored service proportionate to need.
Participation in ECEC has grown substantially over recent decades, but progress towards the model of the Nordic countries is slow (it is also likely to be negatively affected by the European financial crisis). European Council Member States agreed in 2002 to provide by 2010 full-day places in formal child care for at least 90% of those aged between three and compulsory school age and to at least a third of children under three. Progress to this target has been uneven: 5 countries have exceeded the 33% target for 0−3-year-olds and 5 more are approaching it, but most fall behind; 8 have exceeded the 90% target for over-3s but coverage is below 70% for a third of the Member States. EU education ministers reinforced this approach in 2009 by setting a new European benchmark of at least 95% of children between age 4 and the start of compulsory education to participate in ECEC by 2020 (348).
As discussed in Chapter 3, while data from non-EU European Region countries are less widely available than for EU countries, evidence from UNICEF illustrates large variability in the proportion of children in the CIS and CCEE who attend preschool (Fig. 3.25). Children from the poorest quintile of household wealth are less likely to attend any form of early education programme than those in the richest (Fig. 3.26).
that do this include policies that promote excellent health care in pre- and postnatal periods, an employment and social protection system that recognizes the risks posed by poverty and stress in early childhood, good parental leave arrangements, support for parenting and high-quality early education and care.
The European context of early childhood services
Early childhood services are made up of two main categories: parenting and family support, and early childhood education and care (ECEC). Delivery is dependent on sociocultural context and affordability, itself largely dependent on the strength of the national economy. Attitudes towards female employment, out-of-home care for young children and the extent to which the state has a role in advising on parenting practices vary widely. Southern cultures have traditionally tended to favour a male breadwinner, have lower social assistance schemes and support strong family independence (340). Other countries see support for child care within the context of gender equality and therefore have strong systems in place to ensure women are not disadvantaged in the workplace. Child care subsidies, generous parental leave arrangements and flexible working are particular features of Nordic countries.
As discussed in Chapter 3, provision of early years support and services varies widely, with clear inequities in access and use of services in many countries (see, for example, Fig. 3.26).
ECEC
Most European countries have some form of publicly subsidized and accredited ECEC for children below compulsory school age, with two models of care:
�� a two-stage model (0−3 years and 3−6); and
�� a unified model that sees all age groups from birth to school as a single phase.
Available research evidence on the impact of ECEC shows that while there are some very small risks associated with long hours of group care for very young children, all children benefit socially and cognitively from early years provision by the time they are 2−3 years (134,310,341−343). Disadvantaged children have the most to gain (344,345), particularly from high-quality provision (346).
Evidence of the benefits of preschool experience, particularly for high-quality ECEC, is substantial and is replicated in many countries. Such evidence was instrumental in the expansion of early years provision in the United Kingdom. Quality can be directly linked to better child outcomes (346) and cost−benefit analysis (CBA) has also shown positive results. While the benefits are greater for disadvantaged populations, through reductions in crime and antisocial behaviour and better future employment
Examples: the positive influence of ECEC
United Kingdom
The Effective Preschool and Primary Education and Effective Preschool Provision in Northern Ireland projects demonstrated strong evidence of ECEC’s long-term benefits for all children (134,311,347).
France
Free preschool education for children aged 3−6 during the 1960s and 1970s resulted in a significant increase in preschool attendance. Evidence showed this led to higher income in later life and reduced income inequalities, as those from less-advantaged backgrounds benefited more (344).
Switzerland
Evidence showed that expanded preschool education improved children’s intergenerational education mobility and that is was more beneficial for children from disadvantaged backgrounds (345).
Norway
Preschool education for 3−6-year-olds was expanded in the 1970s, with children attending preschool having higher education levels and better job outcomes later in life (342).

70 Review of social determinants and the health divide in the WHO European Region: final report
Family, peer group and community therefore need to be considered in policy development for later childhood.
Overall well-being
The early years have foundational influences on the brain’s development, but adolescence brings further neurological and biological changes. These mean that adolescents and young adults are more likely to engage in risky behaviours than adults over 25 (with a link to substance misuse and sexual behaviours) (349). The most frequently used neural pathways are strengthened through a process called synaptic pruning, with infrequently used connections being eliminated (350). The recognition of continuing neurological development in adolescence underscores the importance of close and careful nurturing of teenagers, particularly by parents, to promote positive aspects of behaviour and ensure continuation of stimulation through experience and opportunity (351).
Those in later childhood from poorer backgrounds, similar to children in the early years, are more likely than their affluent peers to experience ineffective
Realizing ECEC’s potential to address the challenges of inequity, particularly for traditionally excluded groups like Roma and migrant communities, depends on the design of the ECEC system. Universal provision makes it more likely that the inequities characterized by the gradient of disadvantage will be addressed. Family support services are also critical but can only ameliorate the effects of wider issues of poverty and disadvantage in the short term. They do not address the underlying causes of poverty within the family at that point in time, although effective interventions will lead to higher incomes for the children when they are of childbearing age (307).
Comparative analysis of pre-primary education provision in CCEE and the CIS shows that countries with higher per capita income (GDP per capita) have higher rates of pre-primary enrolment (Fig. 4.4).
Fig. 4.5 shows that some countries continue to have enrolment rates below 50%, despite evidence that enrolment in pre-primary education has been increasing since 2000 in a number of countries.
Given the evidence on the benefits of preschool education for all children, universal good-quality early years services should be available whether parents are working or not. There needs to be an emphasis on developing support proportionate to need. Family support and parenting programmes, along with health and well-being support based in early years settings, are valued additions and help to ensure the widest possible usage of services from priority groups. The review recommendations aim to achieve this.
4.3.3 Later childhood
Later childhood begins with the start of statutory school and finishes at the beginning of young adulthood. It is a period when the influences of peers, school and community grow. Policy-makers tend to look to schools as the principal means of making a difference to children and young people. Health provision can be partial in poorer countries, but virtually all countries in the Region have universal primary-school provision, and most also have universal secondary provision.
ECEC’s importance is predicated on the assumption of a universal, high-quality, free primary and secondary education system. Most countries in the Region have well-established systems, but access to secondary education for girls may be restricted in some. This not only has lifelong effects on gender inequity, but also reduces countries’ potential for economic development and growth. Ensuring admissions procedures are inclusive and reducing differences in quality of outcomes between schools within countries will also improve outcomes for all.
Children and young people nevertheless spend far more time out-of than in school, and many young people leave once statutory schooling is finished.
Case studies: coordinated health action programmes
Features of coordinated health action programmes include:
�� a strategic approach with leadership at national level;
�� identification of clear priorities, perhaps supported by quantifiable targets;
�� data collection;
�� mobilization of a range of resources at all levels; and
�� use of school as primary context, but with an understanding of other contexts.
National strategy for child and adolescent health, 2005, Armenia
This involved collaboration among the Ministry of Health, UNICEF, NGOs and professional institutions and included staff training and development of national standards of care, approved through pilot districts. The aims included compulsory screening.
National nutritional health programme, France
The programme aimed to reduce obesity in young people through nutritional prevention measures for the whole population and specific subgroups and by screening children during medical examinations. It improved approaches to nutritional problems and obesity management. A multidisciplinary obesity management approach was recommended, with the cooperation of medical and nonmedical professionals.

Life-course 71
Fig. 4.4
Pre-primary enrolment rate in relation to GDP in CCEE and the CIS, 2008
a The former Yugoslav
Republic of Macedonia (MKD) is an abbreviation of the ISO.
Source: TransMonEE (52).
Fig. 4.5
Pre-primary enrolments (net rates, percentage of population aged 3−6), selected countries, 2000 and 2010
2000
2010
Source: TransMonEE (52).
Pre-primary education (ISCED 0) enrolments (net rates, percentage of population aged 3–6)
Percentage enrolled
100
80
60
40
20
0
0 5 000 10 000 15 000 20 000 25 000 30 000
Albania
Armenia
Azerbaijan
Belarus
Bosnia and Herzegovina
Bulgaria
Croatia
Czech Republic
Estonia
Georgia
Hungary
Kazakhstan
Kyrgyzstan
Latvia
Lithuania
Montenegro
Poland
Republic of MoldovaRomania
Russian Federation
Serbia
Slovakia
Slovenia
Tajikistan
MKDaTurkmenistan
Ukraine
Uzbekistan
Tajikistan Kyrgyzstan Azerbaijan Kazakhstan Russian Federation
Republic of Moldova
Estonia Belarus
100
90
80
70
60
50
40
30
20
10
0

72 Review of social determinants and the health divide in the WHO European Region: final report
all; and addressing inequities of outcomes by providing compensatory services to ensure learners receive adequate support to overcome disadvantages.
Social determinants affect education and health outcomes. Efforts to improve one set are likely to influence the other. Strategies that address each simultaneously are therefore likely to be more effective on both. Whole-of-government approaches are discussed further in Chapter 7.
The European context of later childhood
The European Region is relatively affluent in global terms, but significant differences exist between countries. This has implications for the services provided for children and the outcomes children achieve (see Chapter 3).
There are also significant inequities within countries, between areas and social groups. Inequities among young people are associated with patterns of migration in Europe. The affluence of many countries makes them a magnet for migration. Children who migrate with their parents may find themselves uprooted, receiving inadequate services and becoming relatively isolated in their host countries. Some promising strategies, developed by different services and drawn from various countries, are outlined below, but not all have been rigorously evaluated, and those that have may have been used with a very narrow group of children and young people.
The examples of school-based programmes lead to a rethinking of schools’ role. While the primary purpose is education, many countries are looking to models of full-service or extended schools in which the school becomes a base for a wide range of community activities and services that have the potential to improve educational, health and other outcomes.
Full-service schools aiming to achieve these objectives need to be more than just a venue for extended child care services throughout the day. They also need to, for instance, interact with services that intervene to reduce antisocial behaviour, either within schools or through signposting to programmes such as functional family therapy that are known to lead to a reduction in crime, among other outcomes (358).
Schools can also extend their curriculum to improve social skills. For example, “Promoting alternative thinking strategies” (PATHS) is a primary-school curriculum designed to develop self-control, self-esteem, emotional awareness and interpersonal problem-solving skills. Evaluations of PATHS have found positive impacts in relation to reducing sadness and depression, lowering peer aggression and disruptive behaviour, and improving classroom atmosphere. Life-skills training for 9–15-year-olds within the United Kingdom led to reductions in use of tobacco, drugs and alcohol (359).
parenting, attend inadequate schools and live in poor environments. Consequently, they are more likely to have worse outcomes later in life (352,353). Poverty makes it more difficult to provide home environments conducive to learning – as a result of overcrowding and unhealthy conditions, for example − and socially segregated schools reinforce disadvantage. Parents’ access to employment not only reduces poverty, but also improves family routines and ensures children grow up understanding employment’s role in adult lives. Schools can play a key part in working directly with children and services to provide parents with support and advice on parenting strategies.
Schools can usefully help to promote positive life choices to adolescents to help prevent unsafe sexual behaviour and the use of tobacco, alcohol, marijuana and other drugs. This helps young people to develop self-management skills, including decision-making and coping with anxiety, and social skills such as communication. Evaluations of a life-skills training programme showed that it cut tobacco, alcohol and marijuana use by between 50% and 75%. Results were sustained for about six years, meaning there were also decreases in use of substances more commonly used in late adolescence − inhalants, narcotics and hallucinogens (351,354−357).
More generally, the right support in schools and from parents can help to build confidence, self-esteem and resilience, all of which will help children feel confident in making decisions that are right for them and protect them against mental ill health in later life.
Educational outcomes
Emphasis on quality and equity are essential to improving educational outcomes (307). Ensuring sufficient school places is critical, but what happens in school beyond the numbers can also make a difference in addressing inequity.
The education system produces young people with the skills and knowledge to enable them to compete in a globalized economy and jobs market. Three features are critical to such a system:
�� young people’s opportunities to learn are extended;
�� well-trained teachers deliver opportunities by using effective pedagogy in well-organized schools; and
�� all aspects of the school system − curriculum, assessment, staff incentives and transitions between phases of education − are aligned towards learning.
Quality and equity need to be seen together. Inequities in every education system relate to social differences, which may include social class, gender and migrant or ethnic minority status. They are not confined to poorer countries: similar patterns are also seen within richer.
Two strategies have been used to address inequities of outcome: addressing inequities in opportunities by ensuring the same quality of opportunity is open to

Life-course 73
Case studies: school-based programmes
Schools for Health in Europe
Schools for Health in Europe (SHE) promotes health-promoting schools that include pupil-participation principles and whole-school approaches, with an explicit focus on inequity. The “Shape-up” programme provides an example of the SHE approach. It aimed to address overweight and obesity among children and young people (aged 4−16 years) across 19 EU countries by promoting healthy diet and physical activity through focusing on determinants at school, family, community and societal levels. “Shape-up” sought to activate a range of agencies in pursuit of its goal, with each participating city having a local promoting group made up of professionals and policy-makers in place to coordinate action across different areas. Involvement of young people through their schools was key to the programme’s success. They worked with the programme to investigate the social determinants of obesity and formulate proposals for action to address them using the investigation–vision−action−change (IVAC) approach.
Health promotion/social determinants programmes, Cyprus
Funding has been made available to support health promotion/social determinants programmes in zones of educational priority or with targeted high-risk groups. Some projects fund activities outside school hours for disadvantaged children, while work with parents has also been supported, with parents deciding what activities they’d like to be able to access.
“Learning to live better together”, France
This health promotion programme on social climate was implemented in 115 primary schools. It aimed to develop sustainable health promotion projects in school settings through empowering local actors and using a comprehensive approach that included not only teaching, but also the schools’ social and physical environment and links with families and communities. Evaluation showed that inequities reduced following implementation.
School canteen project, Denmark
Children of ethnicities other than Danish living in a deprived area of Copenhagen have been actively involved in developing a new school canteen, which has improved healthy eating among students and promoted social capital at the school.
Source: Currie et al. (307).
Case studies: extending the role of schools
The OECD has reported a wide range of initiatives in Europe and elsewhere linking schools and community services. Examples include:
�� brede scholen [community schools] offering a range of services in the Netherlands;
�� schools in Sweden commonly offering services such as counselling, study support and leisure activities to children; and
�� efforts to link schools and communities, usually sponsored by NGOs, in parts of eastern Europe (360).
State schools in United Kingdom (England) offer access to locally determined “extended services” which include: out-of-hours activities, learning and child care; family support; adult education; community access to school facilities; and close partnership with specialist services such as health and social care. Opportunities are presented on an open-access or targeted basis. Schools in deprived communities often offer most services. Evaluation has shown significant effects on educational and other (including health) outcomes for children and adults at greatest risk, though evidence for overall attainment and long-term differences to areas is less convincing (361).
Another approach that aims to tackle the gap in achievement between more- and less-advantaged children is priority policies in education. Typically, these target additional resources at points of greatest need, either by individual risk or by particular
groups at high risk of low attainment and reduced life chances. Roma children have often been targeted in this way (362). Overall, the success of priority policies has been mixed.
Area-based initiatives, which are similar to priority policies, target extra resources to particular disadvantaged neighbourhoods through a range of interventions, including physical regeneration, community development, school improvement and child care provision. The distinctive contribution of an area-based focus is its ability to bring partners together to develop coordinated strategies and attract new resources into the area, but its drawback is failure to reach children who may have similar levels of disadvantage but do not live in a poor area and the significant numbers of better-off families who often do live in poor areas.
Inclusive education policies were originally designed to ensure children with disabilities were not marginalized and were enabled to attend mainstream schools with adjustments and support relevant to their disabilities. It began to take on wider issues such as poverty and ethnic minority status with the aim of reducing the number of processes of social exclusion leading to greater vulnerability (see Chapter 5). Efforts to introduce the approach in Poland were hampered by parents’ resistance to inclusion strategies. Poland’s experience was not atypical, in that better-off parents fear the impact on education quality if groups are mixed.

74 Review of social determinants and the health divide in the WHO European Region: final report
Overarching integrated approaches to services for children and families
Many of the strategies and approaches described above rely on bringing together a range of services and tackling issues simultaneously and in a coordinated way. There is a history in Europe and elsewhere of ambitious attempts involving the development of long-term, wide-ranging strategies and/or formal integration of services for children and families. The “Every child matters” initiative in United Kingdom (England) (364) was an ambitious example of efforts to integrate services for children and families at all levels and across professional boundaries. It promoted cross-service collaboration and promoted greater unity of approach throughout the system by creating a shared set of aims and parallel structures from government to local and delivery levels. The partnership-working the initiative fostered remains in place in many local areas, despite a change in emphasis nationally by central government.
While short-term interventions can be effective, they are often limited in scope and are never transformative. More sustained, wide-ranging, integrated and powerful strategies are needed to make a substantial difference. A social determinants
Case studies: priority policies in education
Roma education programme, Greece
Carried out by the University of Ioannina in the late 1990s and early 2000s, this programme focused on living and education conditions for Roma. It provided follow up and teaching support for Roma children and included mediation between schools and families to build relationships and inform the latter about the importance of school. Support for school integration was offered and music laboratories developed to reflect value in cultural capital and language. Other activities included a database to monitor schooling and media interventions to provide information and increase public awareness of the programme. Positive outcomes were reported in terms of increased enrolment and reduced drop-out and extended staying-on rates.
Measures for Roma children, Romania
A range of measures aimed at improving outcomes for Roma children were introduced, including:
�� “second chance” (intensive remediation) classes for children who had failed to complete primary or secondary school;
�� reservation of places for Roma students in high schools and universities;
�� enhancement of teaching and learning in Romani language;
�� employment of Roma mediators between schools and communities; and
�� training of non-Roma teachers in intercultural education.
Source: Currie et al. (307).
Case studies: area-based initiatives
Ballymun initiative, Ireland
This poor area of Dublin was once notorious for social problems. A government-funded but locally governed partnership worked on physically regenerating the area, focusing on improving the availability of high-quality child care, promoting community development, supporting residents into employment, developing a coordinated school and lifelong learning strategy and promoting the area’s economic development. The distinctive contribution, resulting from an area-based focus, was to bring local partners together, develop coordinated strategies and attract new resources into the area.
Harlem Children’s Zone, New York
Part of the “Promise neighborhoods” initiative in the United States, this idea is also becoming influential in some European countries. It aims to address a wide range of family and community issues simultaneously and support children’s development in a coordinated way by bringing together clear education pathways from early childhood to adulthood, school improvement and reform strategies, social and health interventions for children and families, and community development strategies.
Source: Currie et al. (307).
Case studies: inclusive education
Poland
Efforts to tackle structural exclusion (caused by education, income and place of living), physical exclusion (such as health- or disability-related) and normative exclusion (alcohol, substance abuse and delinquency) involved schools, NGOs, foundations and media campaigns. Barriers included reluctance from parents about the inclusion of children with special educational needs in mainstream classes, excessive bureaucracy and lack of funding hindering NGOs.
Roma Education Fund, central and south-eastern Europe
Founded in 2005, the fund is a key player in expanding educational opportunities for Roma communities. The goal is to close the gap in educational outcomes between Roma and non-Roma children through a variety of policies and programmes, including the desegregation of education systems (363).

Life-course 75
�� Service integration and collaboration This aims to: ensure momentum of combined efforts; reduce duplication; ensure knowledge and experience of what works on the ground is shared; and improve the quality of service experience for families and children. It is reflected in many promising approaches, such as those highlighted in the case studies above.
�� High-quality monitoring and evaluation data These are important here, as in other areas of policy (see Chapter 7). Data are needed to establish what services are most important for which groups, whether current practices and systems are working effectively (who is using the service and whether it is having the intended effect) and whether they are cost−effective.
A more detailed discussion of effective delivery practices can be found in the task group report (307) and Chapter 8.
approach will typically require coordinated strategies across systems and possibly structural reform, but appropriate delivery mechanisms are also needed to deliver change (see Chapter 8). Local action can make a difference, particularly if teachers, primary care staff and local policy-makers work together for common goals. Schools have a particular and critical role to play in addressing unequal outcomes with focused efforts on learning and in welcoming the contributions local partners can make to family support. Schools also have a crucial role in fostering self-efficacy and self-agency in children and young people.
4.3.4 Issues for all children
Section 4.3 described a range of settings − family, home, school and community − and principles that can be used to deliver services to ensure better outcomes for children in their early years and later childhood. These include:
�� extending schools’ role as a base for other child and family services to ensure a more efficient use of scarce community capital resources;
�� mobilizing and coordinating civic partners’ contributions, which are highly valuable in the effort to reduce inequities; and
�� involving children as agents in their own right in making sense of their worlds and developing the capacity to make sensible life decisions.
These participatory and action-oriented teaching and learning approaches seem to work in communities with fewer resources.
It is important that the wider context in which a child lives is conducive to his or her development. Crucially, as indicated in section 4.2, children need to grow up with adequate material resources, in families capable of offering effective support, and with access to real education opportunities. Guaranteeing these conditions contributes greatly to increasing equity and improving outcomes. Without adequate material resources, we can only ameliorate the impact of poverty, rather than have significant effects on inequity. Social systems that provide income protection, adequate benefits and progressive taxation inevitably have a shallower gradient on child outcomes and are therefore essential to reducing inequities in health outcomes over the lifespan. This is discussed further in Chapter 5.
Other factors that should be in place to ensure effective service delivery including the following.
�� Political will and leadership These play a crucial role in getting systems to change. Signals from the top give all players license to work together on stated aims and reforms to make change happen. Leadership is important at every level, from head of state to local school headteachers. It galvanizes action and isolates change resisters.

4.4 Employment, working conditions and health inequities
4.4.1 Introduction
Employment and good-quality work are critically important to population health and health equity in several interrelated ways. Participation in, or exclusion from, the labour market determines a wide range of life chances, mainly through regular wages and salaries, social status and psychosocial well-being (160). Material deprivation from unemployment or low-paid work and feelings of unfair pay in organizations with high levels of wage disparity contribute to physical and mental ill health. Occupational position is important for people’s social status and social identity, and threats of job instability or loss affect health and well-being (160).
4.4.2 Work conditions
An adverse psychosocial work environment, defined by high demand and low control (365,366) or an imbalance between efforts spent and rewards received (367), is associated with an increase in stress-related conditions. Such exposures follow a social gradient, as demonstrated in Fig. 4.6.
Experiences of discrimination, harassment and procedural injustice aggravate stress and conflict at work, particularly in times of high competition and increasing job insecurity (160). The health effects are not isolated to stress: at least 30 reports document increased fatal and non-fatal cardiovascular events among those who report job strain, effort−reward imbalance or organizational injustice (369−372). Overall, these studies indicate that risks were 50% higher among those suffering psychosocial stress at work compared to those who were free of work stress. It is also associated with elevated risks
76 Review of social determinants and the health divide in the WHO European Region: final report
Recommendation 1(c).
Eradicate exposure to unhealthy, unsafe work and strengthen measures to secure healthy workplaces and access to employment and good-quality work.
Specific actions
(i) Improve psychosocial conditions in workplaces characterized by unhealthy stress.
(ii) Reduce the burden of occupational injuries, diseases and other health risks by enforcing national legislation and regulations to remove health hazards at work.
(iii) Maintain or develop occupational health services that are financed publicly and are independent of employers.
(iv) At international level, intensify and extend the transfer of knowledge and skills in the area of work-related health and safety from European/international organizations, institutions and networks to national organizations.
(v) In low- and medium-income countries, prioritize measures of economic growth (in accordance with an “environmental and sustainability strategy”) that are considered most effective in reducing poverty, lack of education and high levels of unemployment. To achieve this, invest in training, improved infrastructure and technology and extend access to employment and good-quality work throughout major sectors of the workforce.
(vi) In high-income countries, ensure a high level of employment in accordance with the principles of a sustainable economy and without compromising standards of decent work and policies of basic social protection.
(vii) Protect the employment rights of, and strengthen preventive efforts among, the most vulnerable (in particular, those with insecure contracts, low-paid part-time workers, the unemployed and migrant workers).
(viii) Address rising levels of unemployment among the young by creating employment opportunities and ensuring they take up good-quality work through education, training and active labour-market policies.
Fig. 4.6
Psychosocial stress and occupational class: SHARE, 2004/2005
Effort–reward imbalance
Low control
Source: Wahrendorf et al. (368).
Very low
Occupational class
Percentage
50
40
30
20
10
0
Low High Very high

of depression (373,374), reduced physical and mental functioning (375) and musculoskeletal disorders (376−378). Psychosocial factors related to the organization of work play an important role in explaining occupational class differences in CVD.
Trends have not been moving in the right direction to support improvements in health. One contributory factor is the rise in earnings inequality in Europe: lower-paid people have not seen their wages increase in line with their productivity and many workers in Europe have seen their total income, made up of wages and social benefits, decline (379).
Exposure to physical, ergonomic and chemical hazards at the workplace, physically demanding or dangerous work, long or irregular work hours, temporary contract and shift working, and prolonged sedentary work can all adversely affect working people’s health (160). The European-wide panel survey on working conditions indicated that in 2005, every sixth worker was exposed to toxic substances at their workplace and many were subject to noise, at least intermittently (380). Twenty-four per cent reported exposure to vibrations, 45% were working in painful, tiring conditions and 50% were confined to repetitive hand or arm movements, mainly due to computer work. Clear social gradients were observed in these adverse conditions (380).
Health-adverse material and psychosocial work and employment conditions are unequally distributed across society. Work and employment conditions become more favourable with each step up the social ladder (as measured by education level, income and labour-market or occupational position), and the better one’s health becomes (160). Workers at particular risk of unsafe and unhealthy working conditions include unskilled manual workers, agricultural labourers, migrant workers and recent immigrants.
International research has produced comprehensive scientific evidence on increased health risks resulting from precarious employment (which carries a heightened risk of becoming unemployed, chronic exposure to occupational hazards and stressful psychosocial work environments) and from unemployment itself, particularly long-term. A more comprehensive summary of this evidence is incorporated in the report of the task group on employment and work conditions (160), with details provided in an appendix to the report.
Employment and working conditions in European countries
Major variations in employment and working conditions are observed in European Region countries. Generally, higher employment levels and good-quality work are seen in high-income countries, associated with better availability of national labour and social policies, including provision of occupational health and safety services (160).
Physical and psychosocial health hazards at work are still important determinants of poor health and injuries in the Region, but there is great variation between countries in the proportion of the total disease burden caused by work-related risk factors, which contributes to the observed health divide. Further details on work injuries can be found in the WHO report on environmental health inequality (271).
The review’s Recommendation 1(c)(viii) calls for appropriate efforts and investment to be made to protect the employment rights of, and strengthen preventive efforts among, the most vulnerable. Entry points for such efforts are available from existing scientific knowledge, posing a major challenge for policy (see the task group report (160)).
Prevention and rehabilitation of limiting illness and disability is becoming an issue of high priority in occupational health policies in societies with growing populations of older workers (381). According to an ILO estimate, 79% of disabled people worldwide are of what is currently defined as “working age” (382). More people at older ages will inhabit the workforce as life longevity and pension ages increase, suggesting a greater preponderance of limiting illnesses and disabilities. Societies will need to ensure that these workers have access to the infrastructure they need (policies and adaptations to their daily living environments) to remain in, or be able to return to, work.
Interventions and policies that aim to reduce health inequalities
Intensified efforts to improve working environments overall (particularly the unhealthiest workplaces) are of critical importance in any strategy for reducing social inequities in health within countries. They are also likely to contribute to a reduction in the health divide between European countries.
Various types of initiatives to improve quality of work and employment exist at macrostructural and microstructural levels. Impressive progress has been made despite the methodological difficulties of evaluating their contribution to reducing health inequities. At macrostructural level, for instance, WHO, ILO and the EC were – and continue to be – proactive in setting standards for improving healthy working conditions, either through legal regulations or voluntary agreements, by developing guidance, training and monitoring tools and by supporting service provision. Injury prevention, occupational safety measures, monitoring and surveillance of occupational diseases and psychosocial risk management are examples described in the task group report (160). The same holds true for national policies tackling health-adverse working conditions through innovative approaches.
Prominent examples of the variety of national policies tackling health-adverse working conditions through innovative approaches are described in the case
Life-course 77

78 Review of social determinants and the health divide in the WHO European Region: final report
are requisite. Nielsen et al. (391) also found that concurrent changes, such as mergers and downsizing, may hinder an intervention’s effectiveness and should be integrated within intervention designs. Employees should join forces and use their day-to-day autonomy to take responsibility for ensuring a healthy organization, they argued.
Microsocial policies may have effects at national level through diffusion processes, but many interventions to date have been directed at individual or interpersonal level: structural−organizational changes have not been so well studied. The EC launched a number of initiatives following the European year of disabled persons in 2003 to ensure measures to address disability issues were incorporated into policy fields, including labour-market participation. Some EU Member States, including Sweden, the Netherlands, Italy and the Czech Republic, have national regulatory occupational safety and health frameworks that are more specific than key EC directives.
studies below. Yet the effects of macrosocial policies on quality of work and workers’ health have rarely been evaluated in systematic ways.
Available methods for implementing interventions in organizations include the risk-management approach (383), management standards (384), the health circles method (385) and the Prevenlab method (386).
Health promotion programmes at microstructural (work-site) level have been successfully implemented in different types of organizations, providing models of good practice. Topics evaluated in the task group report include improved individual work-time control, restriction of overtime work, flexible work schedules, improved work−life balance, increased task autonomy and self-direction at work, availability of supportive leadership and a balance between efforts spent and rewards received at work (160).
The job redesign initiative at AB Volvo in Sweden in the early 1970s, favouring team work in the production of automobiles, provides a classic case study (365). Another trial with relevance to injury prevention, conducted in the United States, concerned increased autonomy at work. A study of this intervention − particularly relevant for manual workers − found that greater control over the pace of work had a protective effect on the risk of occupational injury (387). Importantly, organizational commitment (mainly from managers) and self-managing work teams (where feasible) reinforced this effect (389).
The recent evaluation of the “choices for well-being” project in the United Kingdom, which combined job-skills training with improvements in self-efficacy, self-esteem, locus of control and automatic thoughts (Nick Maguire et al., University of Southamption, United Kingdom, unpublished data, 2012), is particularly interesting. The programme was effective in improving mental health and job-seeking efficacy after five weeks. Although the subgroup recruited for the programme was characterized by a high level of psychological distress, a healthier population could also benefit.
Nielsen et al. (390) examined key European workplace interventions on improving employee health and well-being by changing the way work is designed, organized and managed. Methods included the United Kingdom risk-management approach and management standards, the German health circles approach, “work positive” from Ireland and Prevenlab from Spain, all of which share several core elements based on organizational and psychosocial factors. Their overall aim is to improve employees’ working conditions by, for example, including aspects that encourage fairness in compensation/pay for effort and organizational justice.
The authors concluded that national and EU initiatives may increase organizations’ motivation and ability to conduct organizational-level occupational health interventions, and that formal procedures
Case studies: national policies tackling health-adverse working conditions through innovative approaches
Innovative approaches include:
�� the management standard approach developed by the Health & Safety Executive in the United Kingdom to help reduce the levels of work-related stress reported by workers;
�� activities evolving from a renewed Working Conditions Act in the Netherlands which feature work and health covenants (agreements between employers and employee representatives defining specific goals to be reached) reinforcing sector-specific activities to reduce psychosocial and physical risks at work;
�� promoting healthy work through shared monitoring tools and networks of support in Denmark, involving work inspectors in monitoring work-related stress;
�� pioneering occupational health initiatives in Finland and other Scandinavian countries;
�� use of validated self-report questionnaires as part of comprehensive approaches to assessing quality of work – examples from Denmark, the United Kingdom, France and Germany document the utility of this new information for tailored workplace health promotion activities; and
�� macrosocial policies influencing microsocial policies – the “open method of coordination” among EU Member States may promote local workplace health promotion initiatives in some countries or initiate competition among firms and companies to develop models of good practice in risk management at work (387).

Life-course 79
The systematic monitoring and prevention of occupational health risks are crucial tasks for responsible stakeholders and prerequisites for effective reduction of health disparities at work. This is discussed further in section 4.4.
In summary, a substantial amount of information is now available from the literature reviewed by the task group (160) on how to identify the work- and employment-related burden of disease within European Region Member States.
The main challenge is in applying monitoring tools in a systematic and comparable way and in reducing the gap between knowledge and action. It is clear from the available evidence that every country should aspire to reduce exposure to unhealthy, unsafe work and strengthen measures to secure healthy workplaces.
Specific actions within countries will depend on available national resources, but should be based on:
�� maintaining or developing publicly financed occupational health services that are independent of employers to give the highest possible priority to primary prevention, including early warning systems for health hazards at work and psychosocial risk factors;
�� improving psychosocial conditions and increasing possibilities for employees to influence how work is to be performed, particularly in workplaces characterized by unhealthy stress;
�� ensuring interventions improve job security, offer adequate social protection and provide workers with rewards and status commensurate with their effort (this may require a more equal distribution of income from gains in productivity); and
�� analysing the total workload (at work and at home) and exploring opportunities for introducing more flexible working hours (without turning to insecure short-term contracts) to make it easier to avoid unhealthy stress.
The last bullet point is particularly important for low-income families with small children, as the opportunities for them to buy time are more limited than those for families in more-affluent circumstances. Low-income groups are also likely to have less flexible working hours and more shift work, which increase work-related stress. Governments and employers have a role to play in addressing this.
Case studies: occupational health and safety
Harmonizing and promoting occupational health and safety
The Regional Office has launched a number of initiatives to improve occupational health and safety and address regional variations. The initiatives, which reflect EU policies and the WHO global plan of action on workers’ health (392), include the network of WHO collaborating centres and national focal points and the development of regional networks, such as the Baltic Sea Network, the Northern Dimension Partnership for Public Health and Social Well-being and the Southeast European Network on Workers’ Health. Relevant policy initiatives are elaborated and implemented, framed by continuous exchange with occupational health researchers.
European Psychosocial Risk Management Excellence Framework (PRIMA−EF) programme
This policy-oriented project focused on the development of a European framework for psychosocial risk management in the workplace and has been ongoing since 2004 through the WHO network of collaborating centres in occupational health. PRIMA−EF has particular reference to the fundamental WHO global plan of action on workers’ health (392) and incorporates best-practice principles and existing validated psychosocial risk-management approaches across Europe.
Prevention of injuries and accidents at work
Legal and organizational measures undertaken by occupational cooperatives in Germany over the last century have been particularly successful. The number of work-related accidents from 1960 to 1986 reduced from 140 per 1000 employees to 40 (393). Main measures included improved monitoring and recording of accidents, systematic implementation of safety measures (such as instruction and technological innovation) performed by a well-trained new professional group (safety experts) and comprehensive legal regulations protecting vulnerable groups. Low-status occupations at increased risk (construction, wood and sawmill, and farm and agricultural workers) had the largest health gain. More recently, a nationwide campaign against falls at work, in which public personalities from sport and entertainment acted as role models to reinforce appropriate behaviour, was launched. This approach had previously been effective among low-education occupational groups. Falls were reduced by 15% during the two-year campaign among members of occupations involving frequent physical mobility (such as using stairs frequently or heavy lifting or dragging) (394).

80 Review of social determinants and the health divide in the WHO European Region: final report
4.4.3 Employment and economic change
Threats resulting from economic changes can affect large population segments, or even the country’s entire workforce (395). Examples include the dramatic economic and social upheaval in the Russian Federation and other post-communist societies following the collapse of the Soviet Union , with its harmful effects on population health (see Chapter 3) (284,396), and the anticipated worldwide adverse health effects of the current financial crisis (397,398). The effects of sociopolitical and economic changes on employment security are illustrated in the following examples.
Atypical work in eastern Europe and the CIS: the case of health care workers
The ILO and Public Services International conducted in 2002 and 2005 two major studies of health workers in eastern Europe, including countries of the former Soviet Union (399−401). The studies illustrate the impact of sociopolitical and economic change on work and health, particularly in the context of atypical (temporary) work, and the effect of neoliberal policies, health-sector privatization, changes in health workers’ working conditions and social and economic security since the collapse of the Soviet Union. They indicate that threats to secure employment and decent work can be substantial, even for a relatively trained workforce, and call for far-reaching policy changes.
New forms of atypical employment in Italy
Partial and targeted deregulation was established progressively from the mid-1980s (402). Measures included introduction of “work and training contracts”, promotion of new forms of self-employment, subcontracting and other forms of marginal employment that had a major effect on labour-market entrants (young adults). Atypical employment grew from about 6% in 1970 to around 18% in 2000 (402), replacing more typical forms of employment rather than reducing unemployment in young adults during years when employment was at historically high levels. Young labour-market entrants found themselves more exposed to unstable and vulnerable career courses than previous generations (402). Proponents argued that it had increased their chances of integration to later standard employment, but empirical evaluation of longitudinal data up to 2005 did not support this (402). Unemployment levels in more recent years have increased substantially with the economic crisis (see Chapter 3), particularly among young adults.
4.4.4 Unemployment
This section presents evidence on the effects of unemployment on health inequities, the sociopolitical and economic changes that increase levels of unemployment, what this means for health and the actions that can be taken to ameliorate the effects.
Unemployment as a cause of ill health and contributor to inequities in health
Unemployment causes ill health, premature death (395,403−415), deterioration in mental health (416,417) and an increased risk of suicide (418,419). Levels of unemployment across the Region are high and vary substantially by country, age, migrant status and education level (Chapter 3). Foreign nationals are more likely to be unemployed than nationals (Fig. 4.7) (see also Fig. 3.36).
Levels of unemployment have risen dramatically in some parts of Europe since 2008, particularly among younger workers (aged under 25), as a consequence of the economic crisis (see Fig. 3.33). Unemployment in the early 2000s was higher among women aged 25−74 than men, and while it declined for both sexes between 2004 and 2007, it increased faster among men following the economic crisis in 2007/2008 (see Fig. 3.33).
Work plays a central role in society in Europe. It provides the means of acquiring income, prestige and a sense of worth and a way of participating in, and being included as, a full member in the life of the community. Being unemployed effectively excludes people from this participation and the benefits employment brings. It is difficult, however, to study the relationship between unemployment and health in European countries with a very large informal economy, where official unemployment rates are unlikely to be a true reflection of labour-market realities.
Unemployment can also have a negative health effect on children in households with unemployed adults: 10.7% of children aged 0−17 in EU countries lived in jobless households in 2011, with proportions varying from 4.0% in Slovenia to 24.8% in the former Yugoslav Republic of Macedonia (421).
The perceived threat of unemployment is a source of unhealthy stress. A substantial literature reflects what happens under restructuring, with adverse psychosocial outcomes when job uncertainties become apparent. In addition to the effects of being unemployed, the increasing share of the workforce working on temporary contracts indicates an emerging risk to health. An adequate social protection safety net appears to mitigate some of these health risks (see Chapter 5).
The main mechanisms by which unemployment damages health for these groups include: increased poverty from loss of earnings; social exclusion and resulting isolation from social support; and changes

Life-course 81
unemployment rates for a number of countries in the Region). There is strong evidence of elevated mortality effects of job loss from data matched to administrative levels (395,403,404) and from individual-level analyses, particularly for CVD and stroke (405−415). As was mentioned above, unemployment is also associated with an increased risk of depression (416,417) and suicide (418,419) although, as Fig. 4.8 illustrates, the effect of unemployment on suicide appears to be mitigated by more generous social protection schemes (284) (see Chapter 5).
in health-related behaviours such as smoking, drinking and the lack of exercise brought on by stress or boredom. There can also be life-course effects, as a spell of unemployment increases the risk of unemployment in the future and damages long-term career prospects (203,422). Adverse outcomes are relatively short-lived where re-employment or other forms of adaptation take place rapidly, but long-term unemployment is particularly harmful to prospects of stable re-employment and subsequent health (see Fig. 3.37 for long-term (over 12 months)
Fig. 4.7
Unemployment rates in selected countries in the European Region by country of birth, 2011
Nationals of that country
Foreign nationals
Source: Eurostat (420).
Norway
Switzerland
Luxembourg
Austria
Netherlands
Germany
Belgium
Malta
Czech Republic
Iceland
Denmark
Sweden
Cyprus
Romania
Finland
United Kingdom
Italy
Slovenia
France
Poland
Estonia
Hungary
Bulgaria
Portugal
Slovakia
Croatia
Ireland
Latvia
Lithuania
Greece
Spain
0
Percentage unemployed
10 20 30

82 Review of social determinants and the health divide in the WHO European Region: final report
Fig. 4.8
Suicide rates and unemployment rates in Spain and Sweden, 1980−2005
Source: Stuckler et al. (284).
Spain
Male suicides
Unemployment rate
Male suicide rate per 100 000
Unemployment rate (%)
Year
30
25
20
15
10
5
0
25
20
15
10
5
0
1982 1984 1986 1988 1990 1992 1994 1996 1998 2000 2002 20041980
Male suicide rate per 100 000
Unemployment rate (%)
Year
30
25
20
15
10
5
0
25
20
15
10
5
0
1982 1984 1986 1988 1990 1992 1994 1996 1998 2000 2002 20041980
Sweden
Male suicides
Unemployment rate

Life-course 83
�� improving health sector competence and capacity to prevent health decline due to unemployment through, for example, outreach mental health services and provision of adequate treatment for those suffering from the negative health effects of unemployment; and
�� carrying out assessments of the health impact of unemployment due to economic policies and responses to economic crises.
4.4.5 Actions needed on work conditions and employment
Countries’ aspiration should be to achieve and maintain a high level of employment, in accordance with the principles of a sustainable economy, without compromising decent work standards and basic social protection policies. Necessary actions are summarized in Recommendation 1(c)(v−viii). Specific actions will depend on the labour-market situation in each country but would include:
�� adopting operational targets at national and international levels for reducing unemployment and gradually securing full employment;
�� promoting economic policies and legal frameworks that stimulate or further promote full employment, including special efforts to ensure they also benefit those in the weakest position in the labour market;
�� strengthening family-friendly employment policies to help parents combine work with their parental responsibilities as an integral part of a broader equity strategy to promote early years development;
�� increasing high-quality training and education opportunities for people most at risk, particularly the long-term unemployed;
�� intensifying the introduction of active labour-market policies, including employment creation and maintenance;
�� promoting opportunities for lifelong learning and retraining to help reduce unemployment among people with low education levels;
�� prevent drastic reductions in income or increases in poverty among unemployed people by developing or maintaining adequate financial support or unemployment benefits and ensuring effective links between social protection, lifelong learning and labour-market reforms;
�� improving pathways that lead from unemployment back to work, including active systems for job-seeking, training schemes and special resources such as subsidized wages and tax rebates for employers to take on long-term unemployed, people with disabilities, the chronically ill and unemployed youth;
�� ensuring that those who are in work do not unnecessarily lose their position as a result of an adverse health event through access to timely high-quality physical and mental health services, phased return-to-work programmes and good psychosocial conditions at work (as set out in the recommendations above);
�� improving parents’ access to affordable high-quality child care to facilitate their participation in the labour market;

84 Review of social determinants and the health divide in the WHO European Region: final report
(see Chapter 5 for a description of the concept and research to quantify the standard for different types of household).
Recent research in the United Kingdom (423) has explored whether different needs of older pensioners may alter significantly the income they need for an acceptable standard of living. Similar work is required in each country in the Region to identify the minimum living standard requirements of older people across a wide range of household types, including, for example, those engaged in agriculture for personal consumption and multigeneration family households.
Of central importance to the living conditions of older people is the degree to which they are valued by society and the extent they are able to live their lives with dignity and to participate. Interventions exist to increase and foster older people’s social connectedness and well-being and reduce prejudice (424).
Significant increases in the numbers of older people in the Region (see Table 3.1 and Table 3.2) mean that investigating and understanding the underlying determinants of health and inequities among them is an important priority for Europe, the region of the world with the largest older population for its overall population size. People in Europe will be expected to work longer, given increases in pension ages. Maintaining and improving the health of this age group will be critical if the expected savings of pension-age increases to the public purse are to be realized.
Set alongside the costs of pensions is the immense value that older people contribute to society, both in terms of economic contributions through taxes and consumption and in social benefits, including social care for relatives and neighbours, volunteering and active participation in community-based organizations (425).
4.5.2 Inequities in health and access to health care in older age
Inequities in health and access to health care are important issues for the growing older populations of Europe (181). The evidence on health inequities was outlined in Chapter 3: in summary, lower socioeconomic position is associated with higher mortality and disability and poorer subjective health among older people (181). Level of educational attainment, itself closely related to socioeconomic position, is also associated with health status. Notably, relative health inequities by SES tend to decrease with age (171,181−189) as absolute levels of ill health increase. This is often associated with higher absolute inequalities in rates of ill health (173). There are also differences between men and women, with levels changing with increasing age (175,183,190−193). Women have lower premature mortality (see Fig. 3.10) but higher disability (96,195, 199,237,241,256,264,266,270,426−433).
4.5 Older people
4.5.1 Introduction
Fewer analyses have been undertaken of health inequities among older people than in younger age groups. Reasons for this include an assumption that illness and disability are inevitable in older age and that they are relatively impervious to action. The task group on older people carried out a systematic literature review that demonstrated persistent inequities in older people’s experience of health, particularly related to SES, education level and gender (181) (see Chapter 3 for more detail), and that actions can reduce them.
People aged over 65 were the primary focus of the systematic review, but it also included research on people over 50 if the total study sample also included over 65s. Inequities in older people’s health and well-being relate to differences in conditions experienced earlier in life connected to their educational attainment, occupational status, wealth, income and gender, and also living conditions and experiences in older age. Evidence suggests that experiences in older life can be moderated by actions to change people’s current circumstances: improvements can be made and inequities reduced. One example is variability in poverty rates (below 60% median income) after social transfers among people aged 65 and over in Europe (see Fig. 5.2), which are partly dependent on the level of social transfers and partly on demography. A more meaningful measure of economic resources among the elderly for policy purposes would be the development of a minimum standard for healthy living in each country, as proposed by this review
Recommendation 1(d).
Introduce coherent effective intersectoral action to tackle inequities at older ages to prevent and manage the development of chronic morbidity and improve survival and well-being across the social gradient.
Specific actions
(i) Ensure action is focused on addressing ageism, the right to work, social isolation, abuse, standards of living (including living conditions, social transfers and adequacy of pensions), opportunities for physical activity and access to health and social care.
(ii) Devote particular attention and action to the social, economic and health problems of older women, who have more physical and mental health problems in old age, a greater risk of poverty and live more years with disability.

Life-course 85
Studies of inequities among older people examining changes over time generally show increases: an Austrian study, for instance, reported a widening gap in educational differentials in relative and absolute mortality among men aged 50−74 (180) and one in United Kingdom (Scotland) demonstrated that the association of area-level deprivation with mortality increased between the early 1980s and early 2000s (183). There is little or no evidence, however, in other parts of Europe.
Many studies of adult populations do not report results separately for older age groups, possibly due to relatively small sample sizes. The task group’s review showed that although needs for health care services increase with age, older people, especially those aged 75 and over, generally receive less and lower-quality treatment (see, for example, 434−438). Not all studies reviewed found evidence of poorer treatment for those in older age, however, and patterns varied according to health care outcomes considered (439−459).
There are significant and widely documented differences in mortality and morbidity among older people related to gender, with the association holding for physical and mental health (460). The SHARE study of 9 European countries (237,239) and research in Poland (222) and United Kingdom (England) (242) found better self-rated health among men compared to women, and men in 14 European countries reported a better quality of life (223). The task group report describes in detail the numerous studies showing that generally (but not always), men report better quality of life in Poland (222), the Netherlands (461), Sweden (241), United Kingdom (463) and the Greek archipelago (464), as do male Israeli new immigrants (246). Men reported higher life satisfaction among Arab Israelis (229) and in Italy (227) and less loneliness in Finland (231). Better self-rated health was found among older men compared to older women in a Spanish study (465), even after adjusting for social support.
4.5.3 Health behaviours
The available evidence suggests that health behaviours in older people, especially walking and exercise, were more often associated with positive health indicators in men, but tended to play a weaker role in women, for whom social factors were more prominent (466). Maintaining a healthy diet is important at older, as well as younger, ages: having adequate resources to provide this should be considered part of the requirements for a minimum standard for healthy living among older people (see Chapter 5 for further information on minimum standards for healthy living). A study among men and women aged 70−90 years in 11 European countries (Belgium, Denmark, France, Greece, Hungary, Italy, the Netherlands, Portugal, Spain, Switzerland
and Finland) showed that a combination of 4 behaviours − adherence to a Mediterranean diet (characterized by ratio of monounsaturated to saturated fat, relatively high intake of legumes, nuts, seeds, grains, fruits, vegetables and fish and relatively low intakes of meat, meat products and dairy products), moderation in alcohol use, being physically active and non-smoking − was associated with a mortality rate during the 10-year follow-up period that was two thirds lower than for people who did not practise these behaviours (467). A community-based longitudinal study in Sweden examined the relationship between modifiable factors and survival among people who were aged 75 and older at the start of the study over 18 years (468). It found that physical activity was strongly associated with survival at ages over 75, with participants who regularly swam, walked or visited the gym being on average 2 years older at death than those who did not. A “low-risk” profile (having a healthy lifestyle, participating in at least one leisure activity and having a good social network) added 5 years to women’s lives and 6 to men’s, after controlling for years of education, and was associated with longer survival even among those aged 85 and older. The study did not include quality of diet in the analysis.
Programmes aimed at changing behaviour, such as reducing alcohol consumption, stopping smoking, reducing consumption of high-fat foods or increasing physical activity, are prominent in attempts to close the gap in health inequities for older people in many European countries. The task group’s analyses, however, suggest that out of these behavioural factors, only exercise emerged as a determinant of health inequities in older people (466). It is more likely that older people will adopt healthy behaviour patterns, including exercise, if they have adequate income to participate in society, if the built environment is safe and conducive to exercise, and if they have good mental health and a good social network.
4.5.4 Social relations
People are social beings and the quality and quantity of their social relationships are associated with mental and physical health and mortality (30,469). Social relations may not always have positive effects (470), but supportive relations that offer emotional support, caring or information may act as buffers against stress (471). Older people’s role and contribution as caregivers for their partners and families (children and other older people) is key here. Women are the predominant caregivers in this respect.
People tend to conform to norms and values dominant in their social networks. Where these include unhealthy behaviours – smoking or poor diet, for instance – the effect will damage health: where

86 Review of social determinants and the health divide in the WHO European Region: final report
4.5.5 Inequitable access to health care and inequitable quality of treatment
Many studies have shown that although needs for health care services increase with age, older people, especially those aged 75 and over, receive less and lower-quality treatment. Older people are overrepresented in groups considered low priority for treatment (434), receive less costly treatments than younger patients with the same illness (435) and are provided with a lower level of therapeutic activity in intensive care units than younger patients (436).
The role of health services and health care system organization in creating or ameliorating health inequities in older people was examined using data from SHARE (478). It showed significant social inequities in the regular utilization of health care services for early detection and prevention. Individuals with higher levels of education and SES had a higher propensity to regularly access blood tests, vision tests, gynaecological visits and mammograms. Education has a significant effect even after controlling for income and occupation. Inequities are stronger for services provided by specialists. Evidence about health care use and treatment quality is mixed: not all studies have found poorer treatment for those in older ages, with patterns varying according to health condition and health care outcome considered (this is described in more detail in the task group report (181)).
Some studies found that older women were more often assessed as being in a low-priority group compared to older men (434) and that women patients received less costly treatments than men with the same illness (435). Evidence of variations in the mortality, disability and subjective health of older people in the Region by social factors, including education level and other indicators of SES, is extensive, although extent varies from study to study, partly due to the range of measures of social determinants and outcome indicators used. Generally, the less advantaged have poorer outcomes, and some interactions with age and gender have been found. In terms of access to health care, which might be one mechanism through which social factors influence health, there is evidence of unequal access to various therapies and services by age, gender, education level and other indicators of SES.
Evidence also suggests that once individual effects have been isolated, cross-cohort and country differences in the prevalence of regular care use are partly associated with national health policies. Results indicate that physician density has a significant impact on utilization of most health services over the life-course. Propensity for regular blood pressure measurement, blood tests, vision tests and gynaecological visits is significantly higher in countries/cohorts where the number of physicians per capita is higher. Controlling for GDP growth,
they favour healthy behaviours, the effects are positive for health. Good social relations may give a sense of belonging and self-esteem which enables people to feel in control of their lives. A meta-analysis of 148 studies showed that adequate social relationships were associated with a 50% greater likelihood of survival during a follow-up period of 7.5 years (472). This figure was consistent for different ages and for men and women. The size of the univariate effect of social relations on risk of death was comparable with that of smoking and alcohol consumption and greater than for obesity and physical exercise (472). However, there are strong associations between social relationships and behaviours and, as indicated in section 4.5, the risk of death is mediated by behaviours. Further discussion on social capital, a construct characterized by various dimensions of social relationships, is provided in Chapter 5.
Social isolation and loneliness are problematic for some older people (473) and loneliness is associated with depression (474). Factors that affect older people’s ability to develop and maintain social relationships include income (see Chapter 5), access to affordable public transport and the quality of the built environment (safe and pleasant public spaces in which to socialize) (see “Local communities” in Chapter 5). Approaches that tackle exclusionary processes that lead to vulnerability among older people, as described in Chapter 2, are central to improvements in health and well-being and include ageism (age discrimination). Exclusionary processes are described in more detail in Chapter 5.
The importance of maintaining health and well-being in older age has been recognized by the European Council and European Parliament through its designation of 2012 as the “European year of active ageing and solidarity between generations”. As discussed in section 4.2, older people have an important role to play in intergenerational transmission of inequity.
Case studies: European year of active ageing and solidarity between generations
This was held in 2012 (475). EuroHealthNet has produced a document that provides descriptions of a range of initiatives on healthy ageing in the EU, with explanatory text (476).
The WHO European strategy and action plan for healthy ageing recommends (as a priority intervention) that all countries put in place a national minimum package of publicly funded support for home care of older people (477). This should reduce inequities and contribute to healthy ageing. For younger caregivers, employability should be increased through better reconciliation between work and care responsibilities.

Life-course 87
individuals in countries and cohorts where the average growth rate in health expenditure was higher have a greater tendency to access regular health check ups of blood pressure, blood and vision.
4.5.6 Strategies to reduce inequities at older ages
As indicated in previous sections of this chapter, reducing health inequities at every stage in life requires action across the life-course. Inequities in health in older age are to a considerable extent a consequence of social determinants earlier in life, but older people’s social and physical environment, health-related behaviours and the growing need for health and social care with increasing age also contribute. Strategies to reduce inequities should address all these dimensions.
Evidence-based interventions for addressing health inequities in older age groups are nevertheless scarce. Lack of data presents a significant challenge in addressing inequity (51). This review clearly shows that data on health inequities in old age are incomplete. In particular, very little is known about the health of older people in the eastern part of the Region: better data from countries are urgently needed.
A second observation is that older women with low SES comprise an at-risk group. Special attention should be devoted to older women, who have more health problems in old age due to living longer lives and following a different life-course. Chronic morbidity was the most consistent explanatory factor for differences in health and disability between men and women, meaning that tertiary prevention and treatment of morbidity are strong factors in closing the gap in health inequities.
The analysis undertaken by the review’s task group indicates that health inequities among older people are not the same as those among younger. Inequities in health outcomes and in their causes differ in some ways across the life-course. Specific prevention strategies are needed for older people whose needs reflect the health and socioeconomic consequences of cumulative disadvantage (or advantage) throughout their life and their particular current circumstances.
Action is needed across the social determinants of health, particularly in relation to social protection, neighbourhood context, housing conditions and communities. Action to support social networks and family contact is particularly important, but health care system activity to ensure greater equity in access and treatment with regard to SES, educational attainment and gender is also needed. Health systems must take action to ensure that older people are not discriminated against within the system, compared with other age groups. Health care system regulation also appears to be of foremost importance.

5 Wider society
5.1 Background
People’s lives and health are shaped by the norms, values and structures of society: processes of inclusion, exclusion, vulnerability and disadvantage; the physical environment in which they live and work; and the economic and social support society and government provide. Previous chapters have described some of these social determinants of health. This chapter focuses on social protection systems and the physical and social arrangements in communities that shape people’s lives and health.
The chapter begins with a review of social protection systems across Europe (section 5.2). Different types and levels of social protection are assessed and recommendations made on what best protects those who are vulnerable and what has the greatest effect on their health and that of the wider population.
Next, the communities in which people live are considered (section 5.3), with a focus on how the physical and social arrangements of communities affect the health of people and the wider environment.
Finally, processes that lead to exclusion (see Chapter 2) and the consequences these have for inequity, disadvantage and vulnerability are considered (section 5.4), with a particular focus on Roma and irregular migrants as groups often facing multiple exclusionary processes. Recommendations are made for action to create systems that are more sustainable, cohesive and inclusive.
5.2 Social protection policies, income and health inequities
5.2.1 Introduction
Having the resources necessary to achieve a decent quality of life is a main social determinant of health and a major ambition for social protection systems. They include those deemed acceptable by current social norms and standards, including sufficient economic resources, good working and housing conditions, and access to education and knowledge, among others. An individual’s resources may be
88 Review of social determinants and the health divide in the WHO European Region: final report
Recommendation 2(a).
Improve the level and distribution of social protection according to needs to improve health and address health inequities.
Specific actions
(i) Ensure spending on social protection is increased effectively according to need by making proportionately greater increases in countries with lower levels of spend and ambition, as follows.
�� Do something: make some programme improvements in countries characterized by low levels of spend and low ambition for social protection.
�� Do more: further increase the ambitions of social protection programmes in countries characterized by medium−high ambitions in terms of social protection policies.
�� Do better: improve levels of social protection in general and for the most vulnerable in particular among the most developed welfare states, but where the redistributive and protective capacity of the welfare state has diminished.
(ii) Make more effective use of resources already used for social protection.
(iii) An international, multidimensional and age-related framework is required to provide a standard methodology for calculation based on the specific needs of groups within the context of the society in which they live. As such, unlike poverty levels, the minimum does not have a uniform value for a country.
(iv) Adopt a gender equity approach to tackle social and economic inequities resulting from women being overrepresented in part-time work, having less pay for the same job and undertaking unpaid caring roles.

WIder society 89
vulnerability operate across social, political, economic and cultural dimensions (481). Poverty may result from, and contribute to, the processes of social exclusion.
Poverty is multidimensional. At least three dimensions of poverty can be measured: having relatively low income, lacking items or services that are socially understood as necessities, and perceiving oneself to be poor (482). Each of these ways of measuring assesses different dimensions of poverty that are important to health through a combination of material and psychosocial pathways and lead to the social-class gradient in health. Groups of people identified as poor by one of the measures may not be the same as those identified as poor by others. Relying on just one way of measuring poverty − income below 60% of median income, for example − may not be sufficient for policy purposes (482). From the perspective of designing policy to reduce health inequities, a combined approach is needed to capture the constituents of what people at different stages of life require as a minimum standard for healthy living.
5.2.3 Minimum standard for healthy living
This approach was developed through research on minimum incomes in the United Kingdom (483). Studies on what members of the public think people need to achieve a socially acceptable standard of living, based on the goods and services required by different types of household to meet those needs and participate fully in society, have been carried out (484) and frameworks proposing a methodology for calculating minimum standards for healthy living based on these definitions of need, an understanding of poverty as multidimensional and age-related factors have been developed.
The material and social living conditions of those in poverty vary between countries across the Region, depending on a range of individual, community and country-specific contextual factors. A minimum standard for healthy living should be determined country by country, based on developing national criteria using a standard international framework. Minimum-standard approaches need to be regularly renewed and updated to capture changes in what it means to be poor as societies develop. The standard provides an indication of how well a country is meeting the material and social needs of its citizens and makes it possible to monitor the proportion of the population who are unable to maintain a minimum standard as societies change and develop.
The approach has the potential to make an important contribution to policy-making for health and health equity within countries across the Region and facilitate greater understanding of levels and dimensions of poverty, including the extent to which living conditions may be improved through government policies. Policies to support minimum incomes could focus on a range of mechanisms:
strictly personal (knowledge or psychological energy, for example), be generated by the individual in his or her social economic spheres (income or prestige), or be accessed through the family (family income, possessions or social relations). All “individual” resources – personal, market or familial – are important for health and well-being, but individuals can also draw on the “collective” resources provided by state institutions that provide for their welfare.
“Collective” resources include social insurances designed to cover income loss due to illness, unemployment and old age (the “cash” side of the welfare state) and welfare services supplied free of charge or heavily subsidized, such as education, health care and care for the old and disabled (the “care” side). The supply and quality of such resources are likely to influence people’s ability to sustain their health and well-being. The less people have in terms of individual resources, the more important it is that they can draw on collective resources. To improve public health and reduce health inequities, it is important that welfare policies provide sufficiently generous transfers and equitable, good-quality services (83).
Of all resources important for health and well-being, those that are economic occupy a special position, as they can easily be transformed into other types (16). Income in general, and poverty in particular, are clearly linked with a range of health outcomes through material, social and psychological factors. Policies that reduce risks of poverty or, more generally, contribute to better family incomes are therefore likely to contribute to better public health. A key aim of welfare (and other) policy should be the development and maintenance of minimum standards needed for healthy living.
This section addresses two key issues on the basis of a strategic review of the literature and analyses of European data: the relationships between poverty and health, and the role of social protection policies in improving health and health inequities. Both relate to minimum standards for healthy living, building on the discussion of child poverty as a key determinant of health throughout life in Chapter 3 and Chapter 4.
5.2.2 Income, poverty and health
The relationships between income, wealth and health goes beyond simply poor health for the poorest: they are graded. At each level of income or wealth, better-off people have better health than those who are less well-off (see Chapter 3 for more evidence and discussion). Income and other economic resources, such as food production and benefits from services and other assets, are likely to influence health through material, social and psychological pathways (see Chapter 3 and 479,480).
Individuals’ location on the income scale relates to discussions on exclusionary processes later in the chapter. Processes that lead to poverty and

90 Review of social determinants and the health divide in the WHO European Region: final report
social protection policies respond to the needs of different types of households, such as those without, or with different numbers of, children.
Social transfers mitigate risk of poverty in older age. Examination of poverty rates (at 60% median income) among men and women aged 65 and older in EU countries reveals great variability (Fig. 5.1). The poverty rate was higher among women in every country except Malta. In Sweden and Norway, countries considered among the most egalitarian, the rate after social transfers was much higher among women aged 65 and over than men in the same age group (22% compared to 8% in Sweden and 19% and 4% in Norway). Older people’s poverty rates after social transfers depend on the level of social transfers and their demographic characteristics.
Level and type of social protection
The amount of social spending, a crude indicator of the generosity of social protection programmes, appears to be important for health by reducing poverty risks and increasing individuals’ and families’ resources (487). A study across 18 EU countries showed an inverse relationship between age-specific mortality from all causes and social welfare spending: the greater the spending, the lower the age-specific mortality rate (72,91). Depending on their design, social welfare programmes may also be effective income stabilizers and contributors to improved labour-force participation. Implementing active labour-market policies is one approach developed to improve labour-market participation (see Chapter 4 and Chapter 6).
Spending on welfare has the potential to reduce health inequity by having greater effects on groups of lower socioeconomic position. Fig. 5.2 shows the association between increases in the level of social spending in a country (defined as the ratio of social spending levels to the size of the non-employed population) and the decline in the probability of non-employment for those with and without limiting longstanding illness (left- and right-hand graphs, respectively). Higher levels of welfare spending, based on this index, benefit all groups, but the effect is greatest among those with only primary-level education and least for those with tertiary-level education (488,489). People with lower education levels are more likely to be unemployed (see Chapter 3). Fig. 5.2 shows that increases in this index of welfare spending act to reduce social inequities in non-employment and therefore have a clear potential to contribute to the reduction of health inequities.
The social protection task group report (487) looked at polices in relation to legislated social rights and social spending. On the whole, the analyses support the idea that more extensive social rights in a country are related to improved self-rated health at individual level, after controlling for other factors included in the analysis. Positive impacts of extensive social rights on health outcomes are shown for all vulnerable
legislation and enforcement of a minimum wage is key to those who are in work, and social protection is key to those out of work.
5.2.4 Income inequality
Income inequality can affect the amount of money available to pay a minimum standard for healthy living. If those at the higher end of the socioeconomic distribution take an overly large share of the rewards from production, less is available for others. Financial support for those in work is still needed in many circumstances, as wages for many are not set at a sufficiently high level. The level of income inequality affects the ability to buy goods and has other negative repercussions. Evidence on income inequality’s effects on mortality outcomes (after adjustments for individual incomes) is mixed (58,485), but there is increasing interest in its impact on self-esteem and general levels of well-being.
Governments can alter their taxation regimes to ensure wages are sufficiently high. They could enforce maximum wage differentials within companies to increase the money available to pay workers, or limit bonuses. Similarly, government contracts could be awarded only to companies meeting a minimum wage and wage ratio. Legislation is not always needed, of course, and responsibility deals could be struck if found to be effective.
5.2.5 The role of social protection policies
Social protection policies are critically important in shielding populations from the health effects of poverty and financial insecurity and have the potential to mitigate inequities. They must be considered in the context of all other policy options available to governments for improving health and tackling health inequities discussed in this review. Government policy choices determine the size and composition of the groups defined as poor at any one time in countries across the Region.
Make more effective use of social protection spend: protecting specific population groups
Protecting children from poverty is particularly important for their current and future health and other life chances, as described in Chapter 3 and Chapter 4. A comparison of child poverty rates before and after social transfers shows that some countries in the Region are much more effective at tackling it (82) (see Fig. 3.21). Households in EU countries headed by lone parents, for example, are more likely to be poor than couple-headed households, and children growing up in lone-parent households are more likely to experience poverty (82) (see Fig. 4.2). As Chapter 4 describes, women at older ages who have been in low-wage or part-time employment are likely to be at risk of poverty (234). Well-designed

WIder society 91
Fig. 5.1
At-risk-of-poverty ratea of people aged 65 or over after social transfers, 2010
a Percentage population aged 65 or over with an equivalized disposable income below the risk-of-poverty threshold, which is set at 60% of the national median equivalized disposable income after social transfers.
Source: Eurostat (486).
Fig. 5.2
Amount of social spendinga and non-employmentb by education in 26 European countries: predicted probabilities from multilevel regression analysesc
a Amount of social spending, as a crude indicator of “welfare generosity”, is defined as social expenditure − in purchasing-power standards per capita − divided by the non-employment rate.
b Non-employment covers all those in the age group 15−64 years who are not included in the Eurostat definition of employment. The category includes unemployed, early retirement/given up business, permanently disabled or unfit for work, fulfilling domestic tasks and care responsibilities and other inactive.
c The regression model controls for GDP and business cycle in addition to individual-level variables.
Source: van der Wel et al. (488); Eurostat (87).
Cyprus
Bulgaria
Croatia
Switzerland
Spain
United Kingdom
Greece
Portugal
Slovenia
Belgium
Malta
Latvia
Finland
Denmark
Romania
Italy
Sweden
Austria
Estonia
Poland
Germany
Norway
France
Ireland
Lithuania
Slovakia
Czech Republic
Netherlands
Luxembourg
Iceland
Hungary
0 5 10 15 20 25 30 35 40 45
Percentage with disposable income below the risk-of-poverty threshold
0.8
0.7
0.6
0.5
0.4
0.3
0.2
0.1
0.0
Maximum
Predicted probabilities of non-employment
Amount of social spending
Minimum
Long-standing limiting illness
Primary
Secondary
Tertiary
0.8
0.7
0.6
0.5
0.4
0.3
0.2
0.1
0.0
Minimum Maximum
No long-standing limiting illness
Primary
Secondary
Tertiary

92 Review of social determinants and the health divide in the WHO European Region: final report
simply investing in more social protection is probably not the only solution: social protection policies in place in each country need to be reviewed. Universal programmes and systems that include most of the population are linked to higher levels of the “social spending” index. Welfare systems should aim to ensure, as a minimum, a social protection floor to protect against financial loss due to ill health, unemployment, low wages or non-employment. Countries should work towards achieving a level of social protection that enables all to reach the minimum standard for healthy living described in section 5.2.2.
National experiences and available data show that much can be done. To illustrate, a 2009 comparison of the social assistance payable to a couple with two children and no earnings showed a large range, from very low or non-existent in Greece, Turkey, Tajikistan and Georgia to over €20 000 (adjusted for ppp) in Denmark and Luxembourg (82) (Fig. 5.4). Methods used in CCEE/CIS and EU countries were slightly different.
At least two arguments have been raised in opposition to the provision of social welfare. One relates to the Nordic countries, where health inequities persist despite universal welfare provision and lower poverty rates. A broad evidence base, however, shows that more extensive universal welfare policies, including social protection policies, are important tools in tackling key social determinants of health and health inequities in all countries (487). It is evident, too, that a number of forces generate inequalities in welfare resources and health and that inequities in health would have been much wider without the welfare states in place in Nordic and other European countries. In particular, social safety nets and labour-market policies can mitigate the negative health effects of financial and economic crises and health policy responses make a difference to health outcomes, access to care and the financial burden on the population (492).
The second argument is that welfare states undermine productivity, efficiency and economic growth. The contention that there is a trade-off between efficiency and equality is often used to capture this view. Recent empirical and historical research contradicts this assertion, however. Indeed, new findings indicate that large welfare states do not hamper economic growth: on the contrary, welfare provision may even increase economic wealth (493,494). This evidence suggests that comprehensive welfare arrangements may simultaneously foster economic growth, human well-being and social equality. Social protection and welfare state policies should therefore be viewed as important investments that provide the social infrastructure necessary for high employment rates (495). The review recommendations on social protection issues derive both from this conclusion and from the evidence presented here to support it.
socioeconomic groups. Social rights in the form of cash transfers may therefore be viewed as a collective resource with important external benefits to society over and above those to the unemployed, who are the direct recipients (489). While specific programmes have a measurable, positive effect, it appears the combination of more extensive social rights in various fields (labour market, family, old age) is important for population-wide public health.
Analysis of the association between social spending and self-reported health across 18 EU countries showed differential effects for groups by levels of education (Fig. 5.3). In particular, looking at the probability of reporting poor health among men and women, those with primary education appeared to benefit more from high social transfers than those with secondary and tertiary education. The probability of reporting poor health also declined among men and women with secondary education as social expenditure increased, but the pattern was different for men and women with tertiary education: the probability of reporting poor health among women increased as social spending increased, while it decreased for men.
The study found that education inequities in self- reported health decrease in absolute and relative terms as social spending increases.
Proportionate social protection: do something, do more, do better
The relationship between social spending (and social rights) and self-reported health is curvilinear, with diminishing health returns at high levels of social spending and social rights (487). A similar relationship between social spending and age-specific mortality was observed (91). This suggests that the easiest gains can be made in countries with the smallest social protection systems. Even small improvements in legislated social rights and social spending are associated with improved health, as health gains from social policy programmes per euro spent is generally higher at lower levels of existing spend.
A general conclusion from these studies is to spend more on social protection to improve health and reduce inequities, particularly in countries in the Region with the lowest levels of social spending. Doing something in terms of social protection policies is better than doing nothing, and even a small increase in social spending is likely to result in health gains.
Even countries with the most extensive welfare states have nevertheless seen increases in income inequalities and health inequities (487) (see section 5.2.4 for a discussion of income inequality). There is scope for improvement where the redistributive and protective capacity of the welfare state has actually diminished the levels of social protection in general and for the most vulnerable in particular, with room for a more strategic approach to social protection spending in countries that already spend the most. Given the diminishing returns previously discussed,

WIder society 93
Fig. 5.3
Associations between social expenditure and poor self-reported health, by education group, men
Primary
Secondary
Tertiary
a Predicted probabilities estimated from Model 2, Table 3 in Dahl & van der Wel (490) for net total social expenditure (ppp).
Source: Dahl & van der Wel (491); Bradshaw (82).
Fig. 5.4
Social assistance payable to a couple with two children and no earnings: € ppp per year, June 2009
a The former Yugoslav Republic of Macedonia (MKD) is an abbreviation of the ISO.
Source: Bradshaw (82).
0.25
0.20
0.15
0.10
0.05
0.00
Maximum
Predicted probabilitiesa of poor health
Net total social expenditures in ppp
Minimum
LuxembourgDenmark
AustriaIreland
NetherlandsUnited Kingdom
GermanyFinland
ItalySwedenBelgiumNorway
SloveniaFrance
PortugalLithuania
UkraineHungary
PolandBelarus
UzbekistanAzerbaijan
Republic of MoldovaSlovakia
Czech RepublicSpain
EstoniaLatviaSerbia
Russian FederationKazakhstan
BulgariaMKDa
TurkmenistanRomania
Bosnia and HerzegovinaKyrgyzstan
MontenegroArmeniaAlbaniaGeorgia
TajikistanTurkey
Greece0 5 000 10 000 15 000 20 000 25 000
ppp (€)

94 Review of social determinants and the health divide in the WHO European Region: final report
a political voice and participating in decision-making processes are as necessary as having the material requirements for a decent life.
Recognizing these influences, and in focusing on the role of local communities in improving health equity, this section reviews a number of factors: harmful effects of poor-quality environments on individuals and communities; processes of exclusion; and capabilities and assets that can enhance and protect health and well-being.
Social relationships are profoundly influenced by historical and cultural factors and by power relations. Changing one’s social environment is therefore not simply a matter of choosing to do so: it depends on entrenched external circumstances, including material resources, and the resilience and capability to take greater control over one’s life. These factors affecting health and well-being also relate, to a considerable extent, to conditions experienced earlier in one’s life – the accumulation of influences across the life-course rather than simply current circumstances.
People who are poor and powerless are more likely than those who are better off to live in a poor-quality built environment. Their lack of control over where they live exposes them to conditions of daily living that further reduce the control they can exercise over their lives, consequently posing increased risks to their health. They are more likely to live in poor-quality locations − high-rise flats, poorly insulated, damp homes and in buildings that are more vulnerable to storm damage and disrepair. They are likely to have insecure tenure and to have little control over what happens to the places where they live.
People who live in areas with high levels of deprivation are more likely to be affected by tobacco smoke, biological and chemical contamination, air pollution, flooding, sanitation and water scarcity, noise pollution and road traffic (496). They are more likely to live close to hazardous waste sites, in locations where public places feel unsafe, unwelcoming and uncongenial, have less access to green spaces and fewer opportunities for healthy activities, and are less likely to have access to safe transport or be able to reach family and friends who live at a distance. People living in extreme poverty and in slum conditions are more likely to be downwind of ambient air polluters and downstream of water polluters, as well as being more vulnerable to other health risks associated with built environments.
These harmful influences have direct effects on health and well-being, both directly and through increasing levels of stress and further reduction of control. Where individuals and communities have capabilities and assets stemming from their cultural capacities and social networks, however, these can serve to mitigate the effects of external adversity and act to protect health and well-being.
5.3 Local communities
5.3.1 Introduction
The ways in which people experience social relationships influence health and health inequities. Critical factors include: how safe people feel in their locality; how much control they have over resources and decision-making; whether communities are able to participate in local decision-making and actions that could make a difference to their lives; how far there are clear, enforceable freedoms and entitlements (civil liberties); and access to social resources, including social networks, capabilities and degrees of resilience (the ability to respond positively to adversity). As discussed in Chapter 2, these factors are critical in influencing the effect of individuals’ exposure to health-damaging and health-promoting conditions and vulnerabilities. They underline the importance of empowerment (material, psychosocial and political). Having control over one’s life, having
Recommendation 2(b).
Ensure concerted efforts are made to reduce inequities in the local determinants of health through co-creation and partnership with those affected, civil society and a range of civic partners.
Specific actions
(i) Ensure championing of partnership and cross-sector working by local leaders.
(ii) Ensure all actions are based on informed and inclusive methods for public engagement and community participation, according to locally appropriate context, to empower communities and build resilience.
(iii) Make the use of partnership-working more extensive, including using local knowledge, resources and assets in communities and those belonging to agencies, to foster cooperation and engagement to support community action and the diversity of local people. Physical resources such as schools, health and community centres should be used as the basis for a range of other services.
(iv) Give priority in environmental policies to measures that help to improve health and apply to all population groups likely to be affected, particularly those who are excluded (such as homeless people and refugees) or vulnerable (young and elderly).
(v) Adopt strategies to improve air quality and reduce health risks from air pollutants for all groups across the social gradient.

WIder society 95
(as discussed in Chapter 2), is a related concept. It is context dependent: where individuals are exposed to significant adversity, resilience depends not only on their capacity to navigate their way to health-sustaining resources, but also on how far the individual’s social context can provide these resources and experiences in culturally meaningful ways (503).
Levels of participation and social capital tend to be lower among those who are economically disadvantaged and disempowered, but the links are not straightforward (504,505). Strong social networks and a sense of cohesion, belonging and trust are assets associated with some low-income communities (469,504,506,507). Where people are uprooted and forced to move frequently, they will probably find it harder to develop capabilities; where close-knit groups move together, they may bond together but not connect strongly with others. Those who are poor and powerless may be less resilient to health-related hazards, although this may vary according to the nature of the risk.
Some authors (508−510) point to social capital’s role as a catalyst of coordination and cooperation, serving as an essential tool for achieving better social and economic outcomes. Cooperation, either within or between communities, can reduce difficulties and costs that are due to incomplete or one-sided information and time-consuming, complex procedures (511).
By favouring cooperation, social capital could also benefit individual health indirectly through the following mechanisms.
Easier access to health-relevant information
The more an individual is involved in continuous social interaction, the easier and cheaper access to information on diseases, remedies, past experiences with hospitals, health personnel, doctors or drugs tends to be. Beyond health care, the influence of social networks may also affect the extent to which (more or less) healthy behaviours within a community have been adopted (512).
Mechanisms related to the provision of informal health care and/or psychological support in case of illness
A substantial demand for informal assistance, housing services and child care in the event of temporary illness exists even in developed countries, where formal health care is ubiquitous. Financial support may occasionally be required to cover the out-of-pocket costs of health care. The market or the public health system are usually unable to provide such services, either because of the short duration of the illness periods, which makes organization difficult, or because the costs of provision might exceed available budgets. People therefore tend to agree on informal and tacit rules that supplement formal health insurance, such as reciprocal
Excluded and marginalized groups, some minority ethnic groups and people from immigrant backgrounds are more likely to experience their social environments as unsafe and to feel they have insufficient control over their lives. Immigrant communities throughout Europe often live in the most polluted areas – alongside motorways or rail tracks, near power lines or under flight paths (497): examples include Turkish “guest workers” in Germany and Moroccan farm workers in Spain (498,499). The extent of exclusion and marginalization differs across countries and also between ethnic groups.
People with few resources often lack the means to protect themselves against the negative effects of environmental damage. Those on low incomes are less likely to be able to afford insurance against the effects of environmental hazards or the extra costs of securing less hazardous conditions (such as wholesome, uncontaminated food or homes on higher ground). Poor groups are also more likely to settle on urban floodplains, so they are more exposed to flooding as sea levels rise. Paradoxically, however, those who suffer most from the effects of climate change and resource depletion bear least responsibility for the changes. Low-income households generally have much smaller ecological footprints than those with higher incomes: indeed, the gradient in household emissions is closely aligned with the income gradient (500). Climate mitigation will consequently have proportionately greater beneficial effects in reducing these inequities. Similarly, populations in low- and middle-income countries are more likely to benefit from interventions that provide a healthier and safer environment, as they are more often exposed to inadequate environmental conditions (271).
5.3.2 Social environments
One way of examining the relationship between social environments and health is by describing the former in terms of social capital. The concept of social capital is commonly understood to comprise the “norms, trust and social support that smooth the social interactions of individuals in a community, and thus contribute to economic growth and development” (501). Three dimensions of social capital have been studied in relationship to health: bonding – the ties between people with similar social identities; bridging – connections between people with dissimilar social identities of broadly equivalent social status; and linking – connections between groups with different power and status (501). Social capital is relatively strong when it is generally associated with better health and vice versa (30,71,502) (see also Chapter 4).
Resilience, which describes individuals’ and groups’ ability to respond positively to threats, shocks, crises and other forms of adversity in ways that minimize harm to themselves and maximize benefits

96 Review of social determinants and the health divide in the WHO European Region: final report
trust and live in communities with higher aggregate level of trust were even less likely to experience good health than people who lacked trust and lived in communities that had lower levels than their own. Interventions to strengthen social capital can therefore potentially cause some unintended negative consequences for people who do not “belong” to the community in which they live (515).
Differential impacts across Europe
Social environments are inevitably more complex than natural and built environments, varying between places and over time due to the influence of shifting and interconnected political, economic and cultural factors. This leads to more diverse health effects across Europe, yet there is insufficient evidence to allow a detailed understanding of the differences. Concepts of resilience and social capital reflect a region’s or nation’s context (517). Social capital has been found to be more easily built in countries with relatively strong democracies that have effective legal systems (as discussed in Chapter 2).
A study of the benefits of social capital in former Soviet Union countries found most social capital indicators in most countries were associated with better health, but the magnitude and significance of the impact differed between countries (517).
Large cultural differences in frequency of social contacts account for much of the differences between countries. Lower income is linked in many advanced economies in Europe with fewer social contacts and more social isolation. Data from the 2006 EU−SILC show that about 15% of people in Poland and 12% in Portugal below 60% median income claim to see friends less than once a month, compared to 10% in Spain, 4% in Sweden, the Czech Republic, Iceland, Italy and Luxembourg, 3% in Latvia and 2% in Bulgaria. These data show that the percentage in most countries claiming they see friends less than once a month is higher among the poor than among the non-poor: the reverse was seen in Latvia, Denmark, Malta and Hungary.
5.3.3 Environmental conditions
Environmental quality has become inextricably linked to human equality; where environmental harm occurs, it is almost always linked to questions of social justice, equity, rights and people’s quality of life in its widest sense (518). The EU endorsed the right to environmental protection in 2000 through the EU Charter of Fundamental Rights and the Regional Office published an assessment of environmental health inequities in Europe in 2012 (271).
Considerable differences within and between countries exist in how natural and built environments affect health and health inequities across the Region and how this is influenced by the social environment. Significant factors that contribute to variations
assistance among neighbours or friends. This tends to occur only in a context of reciprocal trust, as there is no enforceable contract guaranteeing obligations. It has been suggested that individuals from disadvantaged socioeconomic backgrounds stand to reap greater health benefits from social capital compared to wealthier individuals, because the former tend to be less able to acquire and understand social capital-relevant health information and obtain social support on their own (513).
Lobbying and coordination
Social capital may facilitate people’s lobbying efforts and coordination to obtain health-enhancing goods and services from public authorities, including health infrastructure, traffic regulations and sport facilities.
Social isolation
Social capital may be associated with a reduction in social isolation, which can damage health through various psychosocial mechanisms, such as loneliness (474).
Not all the effects of social capital on health are unambiguously positive, however. Social relationships may increase susceptibility to infectious diseases or to the adoption of unhealthy behaviours, driven by existing norms among peers (514).
While the bulk of these potential mechanisms suggest a health-improving effect of social capital, the actual net impact remains to be empirically assessed. Overcoming the potential bias resulting from mutually dependency has presented a major challenge to assessing the health impact of social capital.
Analytical work undertaken by Goryakin et al. (501) for the economics task group (515) using data from household surveys carried out in 2010 in Armenia, Azerbaijan, Belarus, Georgia, Kazakhstan, Kyrgyzstan, the Republic of Moldova, Russian Federation and Ukraine used various techniques to overcome mutual dependency. The analysis found a fairly robust causal influence between several dimensions of social capital (especially trust, lack of social isolation and membership of organizations) and general and mental health (515). This is consistent with earlier results from a similar set of countries and with related research (using slightly different methods) in more economically developed European states (516) and suggests that policies promoting social capital in the Region may contribute to improved health, strengthened communities and reduced corruption and social isolation.
There are nevertheless nuances in the economic task group’s findings that call for caution in implementing social capital interventions. For instance, the analysis found that being trustful of others is not more strongly related to general health for all groups living in communities with higher aggregate levels of trust. People who lack

WIder society 97
include: geographic terrain and climate; stages of economic development; degrees of poverty and socioeconomic inequality; patterns of power and ownership; current systems of politics and governance; urban and rural settings; different histories, cultures and traditions; levels of knowledge and understanding of the issues; and the willingness and ability to monitor, evaluate and build the evidence base.
These differences profoundly affect local populations’ degrees of exposure and vulnerability to different health risks and strongly influence perceptions of risk and attitudes to change. Most people will consider it more important to get a job and a place to live, feed their family or find ways of travelling than reduce greenhouse gas emissions. The drive to catch up with richer countries takes precedence in some low- and middle-income countries over concerns about the effects of growth on the natural environment.
Hazardous waste and chemicals are major contributors to environmental injustice in CCEE (519), particularly in former Soviet republics. A study of the world’s 10 most-polluted places identifies 4 areas in Europe. All are in the former Soviet Union: Sumgayit (Azerbaijan); Dzerzhinsk (Russian Federation); Norilsk (Russian Federation); and Chernobyl (Ukraine) (520).
While access to safe water in eastern Europe has been improving, availability still ranges from 58% to 80% of the population and access has deteriorated recently in Bosnia and Herzegovina, Kazakhstan, Serbia, Montenegro, Slovakia, Tajikistan and Uzbekistan (521). In Romania, 68.8% of people in the lowest income quartile report having no flush toilets, compared with 11.2% in the highest (496). Those in rural areas tend to have poorer access to quality sanitation: in rural areas of eastern Europe, for example, only 20% − and sometimes less − have access to wastewater treatment facilities (522). Poor groups are most likely to suffer when drought affects water supplies in urban areas (523).
Young girls in parts of eastern Europe, the Caucasus region and central Asia are less likely to attend school because they have to spend time collecting drinking water, or they do not attend school at all because water shortages and poor sanitation mean local schools lack suitable hygiene facilities (499). The WHO Parma Declaration recommends “ensuring public health by improving access to safe water and sanitation” and developing integrated policies on water resource management and health to address the challenges of climate change and reduce health inequities (524). The review recommendations point to the importance of ensuring that priority is given to measures that help to improve health and apply to all population groups likely to be affected.
Case study: understanding the effect of chemical poisoning on human health and the environment in Hungary and Romania
An open-air sludge reservoir broke in the Tisza River in Romania and Hungary in 2000, spilling cyanide into the river. Cyanide is used in Romania for gold mining (as in many other areas). On 31 January 2000, a dam of an open cyanide retention pound used by the Aurul Company in Baia Maire broke, emptying a huge quantity of water containing cyanide into the Zazar and Lapos streams, which flow into the Szamos and Tisza rivers in Romania and Hungary, then into the Danube in Hungary and Serbia, finally arriving at the Black Sea via the Danube delta in Romania and Bulgaria. This environmental catastrophe affected many nations and communities living alongside the Szamos, Tisza and Danube rivers. Romanian communities, living closest to the source of contamination, were vulnerable to its effects.
Globalization in the last 30 years has brought gold mining to many less-developed regions of the world, especially where it had historical roots, such as the Baia Mare region of Romania. The Romanian government called for investment worth $28.5 million in 1995 in the plant where the spillage originated. This was partly motivated by high unemployment: the new mine offered 150 permanent jobs and 200 more during construction.
Area-based analysis suggests there may have been negative effects on life expectancy in lower-income areas most affected by the spillage, yet more than 10 years after the event, there has been no proper evaluation of health impact. Environmental safety and human health often rank behind the urgent need for financial investment, especially in poorer countries. Banks seldom assume responsibility for examining the potential environmental effects of their investments (525).
Less than 10 years later, a similar chemical accident occurred in Hungary. A reservoir at an alumina factory broke in October 2010, and toxic red sludge containing high concentrations of heavy metals, including arsenic, cadmium and mercury, was spilled into two tributaries of the Danube. The initial accident killed 10, injured more than 200, killed all wildlife in the River Marcal and required more than 20 houses to be bulldozed. Longer-term effects on health have not been assessed, although Greenpeace confirmed in November 2010 that tap water and air were free from toxic pollution (526). This indicates that lessons have yet to be learned on the need for health impact assessments and monitoring of both legacy and new industrial infrastructure in these countries.
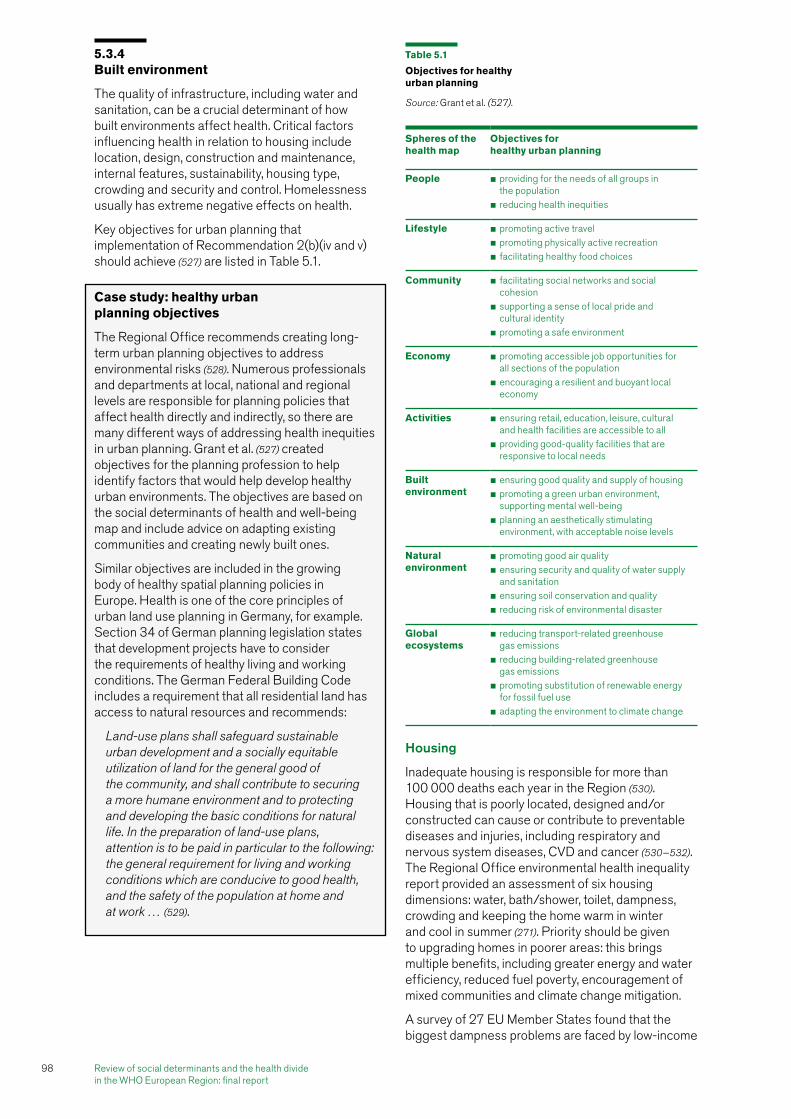
98 Review of social determinants and the health divide in the WHO European Region: final report
Housing
Inadequate housing is responsible for more than 100 000 deaths each year in the Region (530). Housing that is poorly located, designed and/or constructed can cause or contribute to preventable diseases and injuries, including respiratory and nervous system diseases, CVD and cancer (530−532). The Regional Office environmental health inequality report provided an assessment of six housing dimensions: water, bath/shower, toilet, dampness, crowding and keeping the home warm in winter and cool in summer (271). Priority should be given to upgrading homes in poorer areas: this brings multiple benefits, including greater energy and water efficiency, reduced fuel poverty, encouragement of mixed communities and climate change mitigation.
A survey of 27 EU Member States found that the biggest dampness problems are faced by low-income
5.3.4 Built environment
The quality of infrastructure, including water and sanitation, can be a crucial determinant of how built environments affect health. Critical factors influencing health in relation to housing include location, design, construction and maintenance, internal features, sustainability, housing type, crowding and security and control. Homelessness usually has extreme negative effects on health.
Key objectives for urban planning that implementation of Recommendation 2(b)(iv and v) should achieve (527) are listed in Table 5.1.
Case study: healthy urban planning objectives
The Regional Office recommends creating long-term urban planning objectives to address environmental risks (528). Numerous professionals and departments at local, national and regional levels are responsible for planning policies that affect health directly and indirectly, so there are many different ways of addressing health inequities in urban planning. Grant et al. (527) created objectives for the planning profession to help identify factors that would help develop healthy urban environments. The objectives are based on the social determinants of health and well-being map and include advice on adapting existing communities and creating newly built ones.
Similar objectives are included in the growing body of healthy spatial planning policies in Europe. Health is one of the core principles of urban land use planning in Germany, for example. Section 34 of German planning legislation states that development projects have to consider the requirements of healthy living and working conditions. The German Federal Building Code includes a requirement that all residential land has access to natural resources and recommends:
Land-use plans shall safeguard sustainable urban development and a socially equitable utilization of land for the general good of the community, and shall contribute to securing a more humane environment and to protecting and developing the basic conditions for natural life. In the preparation of land-use plans, attention is to be paid in particular to the following: the general requirement for living and working conditions which are conducive to good health, and the safety of the population at home and at work … (529).
Table 5.1
Objectives for healthy urban planning
Source: Grant et al. (527).
Spheres of the health map
Objectives for healthy urban planning
People �� providing for the needs of all groups in the population�� reducing health inequities
Lifestyle �� promoting active travel�� promoting physically active recreation�� facilitating healthy food choices
Community �� facilitating social networks and social cohesion�� supporting a sense of local pride and cultural identity�� promoting a safe environment
Economy �� promoting accessible job opportunities for all sections of the population�� encouraging a resilient and buoyant local economy
Activities �� ensuring retail, education, leisure, cultural and health facilities are accessible to all�� providing good-quality facilities that are responsive to local needs
Built environment
�� ensuring good quality and supply of housing�� promoting a green urban environment, supporting mental well-being�� planning an aesthetically stimulating environment, with acceptable noise levels
Natural environment
�� promoting good air quality�� ensuring security and quality of water supply and sanitation�� ensuring soil conservation and quality�� reducing risk of environmental disaster
Global ecosystems
�� reducing transport-related greenhouse gas emissions�� reducing building-related greenhouse gas emissions�� promoting substitution of renewable energy for fossil fuel use�� adapting the environment to climate change

WIder society 99
properties by 2020 (540). This approach has been found to create jobs and, as renovations require more labour than materials, brings the combined benefits of improved housing and job creation to deprived neighbourhoods (540). A review of systematic reviews found that general housing improvement policies, such as home visits to carry out risk assessments, removal of hazards to reduce risks of injury and installing insulation, were associated with positive change in social outcomes, including reductions in fear of crime and improvements in social participation, but none of the studies differentiated results by SES (541). A cross-country analysis identified key risk factors for excess winter mortality in Europe, particularly the relationship with housing energy-efficiency levels (542).
households in Poland and Romania (where 57% and 45% respectively reported dampness or leaks) (533). The problem of dampness in Serbia and Montenegro is strongly related to affordability of heating: 48% of households using coal and wood for heating reported dampness problems, compared with 14% linked with district heating systems (528). A real effort should be made to improve the energy efficiency, ventilation and indoor air quality of all new and existing homes and workplaces across Europe. This would also help to reduce the number of households living in fuel poverty. More generally, women have been shown to be more susceptible to the effects of air pollution (499) and a review of the health effects of urban spaces found urban disadvantaged populations (including teenagers) were less likely to report participation in outdoor recreation activities (534).
The quality of housing for certain groups, notably Roma, is often particularly poor, with homes made from nondurable material (tin, cardboard, mud) and without sanitation or sewage disposal facilities. There are approximately 600 Roma settlements in Serbia and half have been defined as unsanitary slums; 15% of Roma settlements in Hungary have been found to be within one kilometre of an illegal waste dump and 11% within one kilometre of animal carcass disposal sites (339,499).
Poverty has a strong spatial dimension in the former countries of the Soviet Union. For example, areas where the collapse of state-socialist heavy industry left behind very high rates of unemployment contain particularly high concentrations of poverty (535). The same areas had been severely exploited for their natural resources and still present extreme health hazards for people living there (536). These areas have not attracted capital investment during the past two decades and have been neglected by governments. There are now clusters of severely impoverished settlements in each of the former Soviet Union countries in which the estimated morbidity and mortality rates are far worse than respective national averages. More generally, all aspects of spatial inequity have increased dramatically where areas have experienced neglect.
The legacy of the Soviet system of distributing housing on a socially mixed basis means that in some areas, people in different income groups still live side by side and there are fewer marginalized and/or criminalized housing ghettos than elsewhere. These positive effects, however, are diminishing over time and tend to be offset by the poor quality of the housing stock. There is some evidence that socially mixed housing can be helpful in reducing the effects of social and economic inequalities. In most respects, however, there is a consistent pattern across the Region, with low-income groups living in poorer-built environments with greater risks to their health.
Germany reduced energy use by 80% in pilot retrofit housing schemes, with plans to retrofit all pre-1983
Case study: managing heat waves
One of the main recommendations arising from the many lessons learned from the 2003 heat wave in Europe was to improve intersectoral planning. This would include:
�� improving urban planning and architecture;
�� developing energy and transport policies;
�� collaborating with weather services to provide accurate and timely weather-related health alerts;
�� developing strategies to reduce individuals’ and groups’ exposure to heat, especially among vulnerable populations;
�� planning health and social services and infrastructure; and
�� providing timely information to the population (537).
Vandentorren et al. provide odds ratios for the impact of housing-related risk factors on elderly mortality during heat waves based on the August 2003 event in France (538).
The 2003 heat wave also taught Europe that the health sector alone cannot effectively prevent deaths, compared to working in partnership across sectors. A similar finding was made in the 2002 heat wave in Moscow, when extreme heat, low precipitation and humidity and high concentrations of toxic air pollutants from industrial and vehicle emissions led to increased levels of carbon monoxide, ozone, nitrogen dioxide and other pollutants, causing close to 600 deaths. Subsequent research found the most effective measures to communicate risks and prevention were the efficient interaction between environmental and medical organizations and public authorities (539).
High death rates in the 2010 heat wave in the Russian Federation suggest these lessons were neither learned nor implemented.

100 Review of social determinants and the health divide in the WHO European Region: final report
dependency, or mental illness” (551). The rising number of “non-nationals” sleeping rough in many European countries exacerbates the increase in homelessness (547). Roma are often overrepresented among homeless populations, as are long-resident ethnic Russians in some Baltic states (552). Greater emphasis should be placed on reducing homelessness and housing exclusion across the Region.
Transport
Transport can affect health directly through air pollution, noise and road traffic injuries, and indirectly by creating environments that discourage healthy activities (528) and increasing greenhouse gas emissions, contributing to climate change. Healthier and more sustainable options include walking and cycling, public transport and vehicles fuelled by electricity or other low-carbon alternatives, and should be equitably accessible to all.
Air pollution, injuries, noise, discouraging healthy lifestyles, damage to natural environments
A health impact assessment in Sweden made a first attempt to bring together the different hazards associated with road transport. It analysed fatalities and injuries, disease cases due to exposure to road transport and the likely future health effects of greenhouse gas emissions from motor vehicles, finding the total health impact in Sweden, as measured in disability-adjusted life years, could be four times greater than the injury effect. It also found that the health repercussions in developing countries as a consequence of emissions of greenhouse gases from the Swedish road transport system
Homelessness
Being homeless or excluded from housing is associated with increased rates of physical and mental morbidity, translating into excess premature mortality. This applies for those with insecure accommodation even in countries with good welfare systems (543−545). A study of people living in homeless shelters in Denmark found that most (62.4% of men and 58.2% of women) were registered with at least one psychiatric disorder (543). Asthma and TB are common among homeless people, and a drug-resistant form of TB has emerged among homeless and other marginalized populations across Europe (546). Drug and alcohol use has a strong effect on their mental and physical health (546).
Relatively little research has been done on homelessness and housing exclusion in south, central and eastern Europe (547), but there has been an increase in homelessness, especially in eastern and central Europe, where the elimination of job security and security of tenure, explosion of public utility prices, disappearance of workers’ hostels and decrease in hospital beds have led to an increase in larger cities (548,549). The fact that 6% of male deaths among 25−54-year-olds in the Russian Federation are of unidentified men provides an indication of the seriousness of the homelessness problem in that country (550).
There is often a large homeless population in weak welfare states with low levels of affordable housing. These people face “access and affordability problems, rather than particular personal needs arising, for example, from alcohol or drug
Case study: youth homelessness in Serbia
An estimated 1000 homeless children and teenagers live and work in Belgrade’s streets. Many are from Roma communities or are internally displaced children and young people from Kosovo.1 Discrimination against young people living on the street is high and life for them is often dangerous.
The Centre for Youth Integration (553) was established in 2005 in response to the violence against these vulnerable young people. It is a non-political, nongovernmental, not-for-profit centre offering a range of programmes to socially excluded children and young people. The main objective is to fend off the physical and psychological dangers they are exposed to every day.
The centre offers outreach work and visits children who live on the streets, providing information on health issues and developing supportive relationships with them. It launched a drop-in centre in August 2006 as a safe haven in which children can get help. A nurse, social worker and psychologist work at the centre and take care of about 40 children a day.
The qualified nurse monitors the health care of users and fieldworkers accompany children to hospitals and social work centres. Children are provided with medical care when necessary and the centre helps them navigate Serbian government procedures to enable them to qualify for government health care and access to medical treatment.
The Centre for Youth Integration deals with a range of social, physical and psychosocial problems. Services range from offering basic supplies of food, goods and clothing, advice on sexual and reproductive health, drugs and alcohol and support for those who are physically ill or suffering from addiction. A nurse offers health advice and information directly to young people and refers them to health services. A psychologist works on detecting risks and empowering young people in relation to the risks they face, such as peer pressure, resolving conflicts and improving motivation. A programme to prevent HIV and hepatitis C was recently introduced, with more than 200 young people enrolling.
1 Kosovo (in accordance with Security Council resolution 1244 (1999)).

WIder society 101
There is likely to be a positive health effect when the quality of spaces and places encourages people to come out of their homes, take exercise, meet up with others, breathe clean air and buy (or grow) nutritious food. Green and open spaces reduce the risk of ill health, particularly in relation to anxiety, depression and respiratory disease, and help to promote recovery from illness.
Policies across the Region should maintain and improve the spatial quality of neighbourhoods, while making an effort to develop and support sustainable and equitable urban design. More and better-quality green space should be introduced to urban areas.
Regional differences
Research into the links between health inequities and natural, built and social environments has been conducted only in some parts of the Region: there are widely varying degrees of capacity for gathering evidence and monitoring developments. Some countries have more experience than others in thinking about sustainable development and citizen participation and responding through policy and practice. Broadly speaking, governments and civil society in richer western countries are more attuned to this agenda and better able to take appropriate action than those in poorer CCEE, but richer countries rarely acknowledge their disproportionate responsibility for damaging the natural environment or any consequent obligation to poorer countries.
Owning a car has become a symbol of economic progress for many people in eastern Europe: few people could afford cars in the Soviet era. Where walking and cycling used to be the only options for most, patterns of transport have changed with increased affluence, becoming less healthy and less sustainable. This means that some countries will require more support than others to switch to less carbon-intensive transport. Bucharest, for example, a city of 2 million people, has just 28 miles of cycle lanes, compared to 310 in Amsterdam (559).
It is important to identify factors that affect people in all parts of the Region and to understand where differences and conflicts of interest lie, take account of stages of development and envisage different pathways for developed and less-developed areas. If the primary aim is to reduce health inequities, this has implications for economic development and environmental policies. There will be dire consequences for the natural environment and for health and health inequities across the Region if poor countries seek to develop their economies by copying the rich west. The best hope is for lessons to be learned from the west about what not to do, and for poorer countries to forge new patterns of sustainable economic and social development.
may be three times greater than the mortality from road traffic accidents in Sweden itself (based on estimated disease burden related to global climate change). The study emphasizes the need for a new approach to CBA of transport and other investments that take into account all health costs and the implications for health equity (554).
Bus and train schedules in the Netherlands, Germany, Denmark and Switzerland are synchronized to make it easier to travel and commute in rural areas (555). A health impact assessment in Edinburgh, United Kingdom (Scotland), compared how three transport scenarios would impact differentially on deprived and affluent populations in terms of accidents, pollution, physical activity, access to goods and services and community networks. The study found that disadvantaged groups would bear the heaviest burden of negative impacts of the scenarios and would have most to gain from positive effects. It concluded that greater investment in public transport and support for sustainable modes of transport were beneficial to health and offered scope to reduce inequities (556).
Spatial quality
Physical and mental health can be strongly influenced by spatial quality, which reflects how places and spaces within the built environment are planned, designed, constructed and managed. Significant components of public places and spaces include accessibility, connectedness and safety, cleanliness and maintenance, whether they feel welcoming and congenial, availability of facilities for play, exercise, sport and leisure, access to healthy food, and access to green spaces.
Case study: cycling in Copenhagen
Copenhagen is a model city for sustainable travel, with large numbers of trips made by bicycle or on foot. Interventions began in 1962 and include car-free streets, eliminating parking spaces, creating pedestrian streets, creating public spaces, increasing the numbers of people living in the city centre and developing bicycle lanes and crossings, contributing to reducing greenhouse gas emissions and improving social capital. The measures led to a three-fold increase of car-free space and a similar increase in people in public spaces between 1968 and 1986, with one third of residents commuting by bicycle (557). Interventions that make cycling attractive include easy-to-buy bicycles and accessories, including locks, lights and child seats, good infrastructure, easy connections to public transport, bicycle lanes and safe parking places.
Cycling policies have improved health. The Copenhagen heart study examined 13 375 women and 17 265 men aged 20–93 years and found that those who did not cycle to work experienced a 39% higher mortality rate than those who did (558).

102 Review of social determinants and the health divide in the WHO European Region: final report
It is important to understand exclusion, vulnerability and disadvantage as dynamic, multidimensional, historical and social processes operating through relationships of power, rather than individual “states of being”.
Exclusion, disadvantage and vulnerability have too often been approached by focusing on the attributes of specific excluded groups. They have been understood as individual “inadequacies” and used as a euphemism for poverty. This ignores the wider causes and multiple interacting dimensions of disadvantage, with resulting implications for the design of appropriate and effective actions. Actions to address the social determinants of health of those who are socially excluded should focus on addressing the processes of social exclusion across the social gradient of health in a way that is proportionate to need, rather than the gap in health between the most- and least-disadvantaged groups.
Processes of exclusion, disadvantage and vulnerability might be active or passive. Active processes are the direct and intended result of policy or discriminatory action including, for example, withholding political, economic and social rights from migrant groups or deliberate discrimination on the basis of gender, caste, disability or age. Passive processes, in contrast, arise indirectly, as for example when fiscal or trade policies result in an economic downturn that leads to increased unemployment.
5.4.2 Taking action on exclusion and vulnerability
Recognizing that exclusion is not an all-or-nothing phenomenon, but that exclusionary processes and vulnerabilities have an effect to differing degrees and vary among groups, societies and times, suggests that action should be based on addressing continuums of inclusion/exclusion and vulnerabilities. This does not deny the existence of extreme states but helps avoid the stigmatization inherent in an approach that labels particular groups as “excluded”, “disadvantaged” and/or “vulnerable”, allowing for the possibility of inequitable or adverse inclusion and extreme exclusion.
The continuum approach should also increase understanding of the processes at work (and how they might be reversed) and help to shift the focus from apparently passive victims towards the potential for disadvantaged groups to actively resist exclusionary processes and be resilient in the face of vulnerabilities. Informed by experiential wisdom, people bearing the brunt of exclusionary processes are resilient in a myriad of small ways that enable them to cope with difficult circumstances on a daily basis, as discussed in Chapter 2. This “everyday” resilience can be nurtured by supportive environments, but it can also be undermined and/or underwhelmed by inappropriate action, policy or
5.4 Social exclusion, vulnerability and disadvantage
5.4.1 Introduction
This section discusses the processes of social exclusion, disadvantage and vulnerability using examples of Roma and irregular migrants as groups facing multiple exclusionary processes. Principles for acting to create systems in society that are more sustainable, cohesive and inclusive have emerged.
Recommendation 2(c).
Take action to develop systems and processes within societies that are more sustainable, cohesive and inclusive, focusing particularly on groups most severely affected by exclusionary processes.
Specific actions
(i) Address the social determinants of health and well-being among people exposed to processes that lead to social exclusion:
�� avoid focusing on individual attributes and behaviours of those who are socially excluded; and
�� focus on action across the social gradient in health that is proportionate to need rather than the gap in health between the most- and least-disadvantaged groups.
(ii) Involve socially excluded individuals and groups in the development and implementation of policy and action by putting in place effective mechanisms that give them a real say in decisions that affect their lives and by recognizing their human rights (to, for example, health, education, employment and housing).
(iii) Develop strategies that:
�� focus action on releasing capacity within organizations, professional groups and disadvantaged groups to achieve long-term improvements in resilience and how those who are socially excluded are able to live their lives;
�� make a corresponding reduction in the focus on short-term spending projects;
�� empower disadvantaged groups in their relationships with societal systems with which they have contact; and
�� include cross-border action on transnational exclusionary processes (such as those affecting Roma and migrants in irregular situations).

WIder society 103
of Roma and reports from the United Nations and the CoE describing progress in Europe, including those involved in the “Decade of Roma inclusion” and new and older EU Member States. A recent survey by the EU Agency for Fundamental Rights and the United Nations Development Programme (UNDP) in 11 EU Member States revealed that 15% of young Roma adults surveyed completed upper-secondary general education, compared to more than 70% of the remaining population living nearby. On average, less than 30% of Roma were in paid employment, 90% lived in households with incomes below national poverty levels and about 45% lacked at least one basic amenity; 20% were not covered by medical insurance (561). A UNICEF report on the situation of Roma children in southeast Europe indicates that they are the most vulnerable to poverty, deprivation and lack of access to health care and education in each country. Consequently, each generation is at risk of being left out, perpetuating the cycle of poverty and social exclusion (562).
Many factors have repeatedly been shown to affect progress and implementation, including funding-arrangement complexity, lack of monitoring and evaluation data, inadequate governance and accountability systems, insufficient participation of Roma people in civil society and, perhaps most importantly, an absence of political will. These problems need to be addressed through political commitment at national and transnational levels.
The “Decade of Roma inclusion” provides an important example of action. Eight countries (Bulgaria, Croatia, Czech Republic, Hungary, the former Yugoslav Republic of Macedonia, Romania, the former state union of Serbia and Montenegro, and Slovakia) signed up to a declaration in 2005 that called for the elimination of discrimination and “closing the unacceptable gaps between Roma and the rest of society”. A further three countries have signed up to the “Decade of Roma inclusion” (Albania, Bosnia and Herzegovina and Spain) and Slovenia has observer status.
Each participating country prepared an action plan addressing four policy areas of education, health, housing and employment and was required to take into account poverty, discrimination and equal opportunities as cross-cutting themes. Participation of Roma civil society in drafting and monitoring the plans was expected.
The task group on disadvantage, social exclusion and vulnerability (481) assessed the effect of the “Decade of Roma inclusion”, revealing that no single country performed consistently well across all policy areas (Table 5.2). Table 5.2 provides further evidence supporting perceptions that the actions had limited effects on bringing about desired change or in meeting objectives.
professional practices. Importantly, socially excluded individuals and groups should be involved in developing and implementing policy and action by putting in place effective mechanisms that give them a real say in decisions that affect their lives and by recognizing their fundamental rights to, for example, health, education, employment and housing.
Strategies that focus action on releasing capacity within organizations, professional groups and disadvantaged groups should be developed to achieve long-term improvements in resilience and in how socially excluded people are able to live their lives. This would enable communities to steer governments and other agencies to pursue health and well-being as collective goals and empower disadvantaged groups in their relationships with societal systems. People need to experience power being redistributed and see their participation having real effects. Long-term dialogues about how life is to be lived are more helpful than a focus on short-term spending projects.
The perspective taken in this report recognizes diversity, rejecting the implication that inclusion requires compliance with dominant political, social, cultural and/or economic norms and that vulnerabilities reflect individual weaknesses. A relational perspective highlights the salience of “identity” and “recognition” as an aspect of the processes that generate differential exclusion/inclusion and vulnerabilities in social systems (such as caste systems, gender, ethnicity, disablism and stigmatizing illness).
5.4.3 Roma
The term Roma is used widely to describe highly heterogeneous groups of people who may describe themselves as Roma, Gypsies, Travellers, Manouches, Ashkali, Sinti and other titles. Recent estimates from the CoE suggest there are between 10 and 12 million Roma in Europe (560), making them the biggest minority ethnic group within the 47-member CoE Region, which includes all Member States of the European Region except the five central Asian republics and Israel.
Roma across the Region are exposed to powerful social, economic, political and cultural exclusionary processes (including prejudice and discrimination) that negatively affect their human rights and restrict their self-determination. Progress in reducing the social inequalities experienced by Roma has been limited.
This situation is leading to gross inequities in health and well-being among Roma compared to other populations. Evidence of this is found in a number of transnational reports, including European reviews of policies to improve health and well-being

104 Review of social determinants and the health divide in the WHO European Region: final report
Case study: “Decade of Roma inclusion” − aspects of employment policy
Skills and education
Most, if not all, countries describe actions that fall within this theme. A commonly cited objective is improving education, training and qualifications and providing support for job-seeking. The target group generally is Roma unemployed, though some priorities are highlighted (including young people and women and the long-term unemployed). Actions include training programmes for Roma people at risk of exclusion or with special educational needs or difficulties (Spain), access to training for young people, including “second-chance” and evening schools, nonconventional forms of training (Hungary), improved training standards and programmes for youth (Albania) and courses for unemployed people and vocational training (Bulgaria).
A smaller number of countries are prioritizing support for employed workers to progress in the labour market, involving opportunities for public workers to take part in professional training (Hungary) and encouraging employers to improve labour-force qualifications (Bulgaria). Spain refers to the promotion of Roma workers’ access to ongoing training to retain employment and informing Roma about the possibility of achieving academic degrees and professional certificates.
Most countries have a range of general actions in place to support job-seeking, including training in job-searching skills, intermediate labour-market schemes and projects for the long-term unemployed. The mechanisms adopted are typically fairly general and include training.
Albania and Spain refer to raising awareness about employment schemes or opportunities. The former Yugoslav Republic of Macedonia highlights raising awareness of “rights and obligations of employment and benefits of having qualifications”. Increasing awareness of Roma rights and entitlements (in relation to, for example, workplace exploitation, social security and work-related benefits and trade union membership) is cited by Albania and Serbia.
Enterprise and self-employment
Skilling-up Roma individuals/families and communities in entrepreneurship, self-employment and more specialized or traditional skills is frequently cited within action plans alongside a drive to support more traditional crafts, industries and agricultural activities among the Roma population. Mechanisms include training in traditional skills, development programmes, consultancy services (for agriculture), benefits for employers and foreign investment programmes.
Roma participation
Bulgaria refers to the employment of Roma community representatives in local employment structures and Bosnia and Herzegovina to the promotion of positive role models to Roma communities as part of a more general awareness-raising campaign.
Service infrastructure/capacity
Other actions described imply an expansion of existing services to increase capacity for providing training/advice in employability and skills development. This includes, for instance, “second-chance” schools, teams to support job-seekers and work-experience programmes.
Table 5.2
“Decade of Roma inclusion”: overall impact of government programmes in each policy area – best and worst assessmentsa
a Scores from Decade Watch (563) based on answers to questions in surveys that aim to assess the impact of programmes in relevant policy fields as follows: very positive–5; positive–4; neutral–3; negative–2; very negative–1; don’t know–0.
b The former Yugoslav Republic of Macedonia (MKD) is an abbreviation of the ISO.
Source: Social exclusion, vulnerability and exclusion task group (481).
Policy area Highest 3 assessments of impact Lowest 3 assessments of impact
Education Romania (3.51) Slovakia (2.26)
Serbia (3.42) Bulgaria (2.51)
Bosnia and Herzegovina (3.33) Spain (2.65)
Employment Serbia (3.28) Slovakia (1.88)
MKDb (3.27) Hungary (2.57)
Albania (3.20) Bulgaria (2.63)
Health MKDb (3.41) Slovakia (1.84)
Romania (3.22) Czech Republic (2.08)
Spain (3.10 Montenegro (2.73)
Housing Bosnia and Herzegovina (3.34) Bulgaria (1.68)
Czech Republic (2.98) Slovakia (1.87)
Albania (2.82) Hungary (2.12)

WIder society 105
Case study: “Decade of Roma inclusion” − education policy
Raising awareness
Countries have made attempts to raise Roma awareness of the importance of education and literacy and have encouraged parents not to withdraw their children from school (Hungary) in an effort to increase Roma participation in the education system.
Financial and material support
Some countries (Albania, Bosnia and Herzegovina and Serbia) propose providing financial or material support for Roma to increase their participation in education through scholarships (Albania, Hungary and Serbia), school books and meals (Albania, Bosnia and Herzegovina and Serbia) and transport (Bosnia and Herzegovina and Serbia).
Roma participation
Some countries propose increasing parental participation. Four have actions aimed at increasing the number of Roma education workers as teachers (Bosnia and Herzegovina and the former Yugoslav Republic of Macedonia), assistants (Serbia) or in nonspecific education posts (Hungary). Montenegro specifies that there should be more Roma to work with Roma children. Bosnia and Herzegovina and the former Yugoslav Republic of Macedonia want to provide scholarships to Roma to increase access to teacher training to support an increase in the number of Roma education workers. Albania, Bulgaria, Croatia, the Czech Republic, Slovakia and Spain, however, appear to have no comparable actions.
Cultural understanding and public attitudes
Some countries are preparing for increased integration by proposing a range of actions to reduce prejudice and discrimination. Albania and Hungary, for example, have actions that aim to remove discriminatory material from teaching resources. Hungary and Serbia aim to address prejudice and discrimination through the curriculum
and Albania, Croatia and the former Yugoslav Republic of Macedonia are focusing on providing training for teachers and students.
Roma identity/culture
Slovakia does not propose any actions that promote or celebrate Roma identity or culture. Most of the actions suggested by the remaining countries indicate that they are adopting a sustainable approach to ensuring Roma identity and/or culture becomes embedded in the culture of the mainstream school system. Many of the actions, however, are aimed at promoting change at school or at teacher level, such as teacher training and raising teacher awareness (Albania, Croatia, Hungary, the former Yugoslav Republic of Macedonia and Serbia) and incorporating Roma culture into the mainstream school curriculum (Albania, Bosnia and Herzegovina, Croatia, Serbia and Spain). Some countries (Albania, Bosnia and Herzegovina, Hungary and Serbia) propose to increase the amount, significance or quality of Roma language teaching, with Hungary suggesting that parents should be empowered to demand it, but Bosnia and Herzegovina appears to be proposing that Roma culture be celebrated more widely through a “Roma day”.
Integration and desegregation
Increased participation is mainly achieved through increasing school enrolment. Some countries have no actions aimed at reducing drop-out, although it is sometimes included as an indicator. The Czech Republic (alone) proposes offering financial incentives to primary schools to ensure increased enrolment of Roma.
Structural change (macroeconomic)
Some countries are attempting to address systemic barriers that may prevent Roma access to education, mostly by amending legislation to, for example, increase schools’ capacity or willingness to enrol Roma (Bosnia and Herzegovina, the Czech Republic, the former Yugoslav Republic of Macedonia and Serbia).
The task group’s report (481) reviewed a number of other policy and action initiatives, providing examples of the need to act simultaneously across social, political, economic and cultural domains and at different levels – local, national and pan-European. More effective actions to tackle stigma and discrimination against Roma, promote their participation and representation in political systems and build a wider appreciation of Roma culture are urgently needed as prerequisites for securing equal rights for Europe’s Roma, including their right to highest attainable health.
Despite the overall lack of substantial progress, it is important to emphasize that a number of initiatives have achieved positive outcomes. The task group’s report provides examples of positive action at different levels aiming to promote greater equity for Roma, including actions involving Roma participation in housing developments in Hungary and the Sustainable Work Initiative for a Healthier Tomorrow (SWIFT) initiative in Serbia. SWIFT, which is led by WHO with support from national and international partners, aims to improve access to health, promote social inclusion and develop sustainable employment

106 Review of social determinants and the health divide in the WHO European Region: final report
How will non-EU countries with significant Roma populations be held accountable within a wider European Region?
Underlying all of this, there is an urgent need to identify ways of protecting Roma and other populations most exposed to multifaceted exclusionary processes during a period of economic crisis in which those most at risk of vulnerability and closest to poverty are likely to be hit hardest.
Action
Effective actions to tackle stigma and discrimination, promote participation and representation in political systems and build a wider appreciation of Roma culture are prerequisites of sustainable integration of Roma into the mainstream of European societies and their health, education and social protection systems. Roma should be authentically involved in the design, implementation, monitoring and governance of policies intended to improve their living and working conditions. Simultaneous action at all levels of government and across social, political, economic and cultural domains is essential if greater inclusion and equity for Roma is to be achieved.
5.4.4 Migrants in irregular situations
“Migrants in irregular situations” are foreign-born persons lacking authorization to reside in the country in which they live or work. Irregular residence status can result either from unauthorized entry or from infringement of the conditions on which entry was originally authorized.
Figures on total numbers are by their nature unreliable, and there are regional differences in the nature and volume of irregular migration. It is estimated that about 3 million, or 0.6% of the EU population, are in this situation (567), with the total declining since 2002 (568) largely by regularization through, for example, the “Bossi-Fini Law” in Italy, the 2005 immigration law in Germany and four revisions of legislation in the United Kingdom. The Russian Federation, on the other hand, is thought to have the second highest percentage worldwide after South Africa, though estimates of total numbers vary widely between 7 and 15 million (569,570). Most are citizens of CIS countries who have entered the country legally but have not registered their residence and/or obtained a work permit (569).
Problems faced by these migrants are greatest among those particularly exposed to additional exclusionary processes of the type discussed in Chapter 2. To illustrate the specific processes that operate and the problems faced as a result, four groups particularly exposed to exclusionary processes are described here. This is by no means an exhaustive list − there are many others, such as irregular migrant workers in agriculture and low-paid manufacturing or processing industries, in some cases involving even larger numbers.
plans among the Roma community in Belgrade (564). It involves converting current informal waste “scavenging” into an effective and credible means of income through the establishment of SWIFT recycling centres and cooperatives.
Focusing initially on income generation and employment for Roma, SWIFT has also addressed exclusionary processes operating at social, cultural and political levels. The local Roma community participated in developing and implementing SWIFT and cooperative members can gain assistance for themselves and family members through accessing citizenship rights and health, education, registration, employment and social services. The original pilot cooperative has 82 members, with a waiting list of close to 100. Funding from the EC and Swedish International Development Cooperation Agency will support an additional six centres and cooperatives in Serbia: the former Yugoslav Republic of Macedonia is also seeking funding for pilot implementation in Skopje. Roma activists have achieved much in terms of increasing political awareness of the need for action to promote Roma rights.
The “Decade of Roma inclusion” is widely viewed as a positive development upon which to build future initiatives, particularly in the links it provides across the Region (and beyond the EU), its wealth of international partners and in the knowledge and lessons gained from the first five years of implementation.
Roma human rights and inclusion have been increasingly prominent on the agendas of the CoE, EU and the Organization for Security and Co-operation in Europe and important EC communications have been issued (565,566).
Much work on Roma is now guided by the common basic principles of Roma inclusion introduced at the first meeting of the EU Platform for Roma Inclusion and later endorsed by the Council of the EU. They aim to provide guidance and orientation to the various actors with a major stake in the implementation of policies and measures in fields relevant to social inclusion. Some, notably principles 2 on explicit but not exclusive targeting, 4 on aiming for the mainstream and 7 on use of community instruments, have been explicitly mentioned by European institutions in several documents and policy declarations.
The EU framework represents a significant achievement in securing a future commitment to Roma inclusion (at least at EU level), but it is imperative that policy commitment translates into comprehensive and tangible action. The main challenge the framework is likely to face is in levering transformational change in political will in countries where there is entrenched discrimination and prejudice against Roma populations in public and political spheres. The answers to other questions are also uncertain. How will the EU respond if Member States do not comply with the EU framework?

WIder society 107
The four groups are as follows.
�� Those in need of health care These people encounter considerable barriers to obtaining care, with entitlement to use health services showing large and inexplicable variations between countries (571). Apart from the issue of entitlement, migrants’ and health workers’ lack of information impedes their access to care. There may also be a fear of being reported to authorities. Current health provision for these migrants is neither equitable nor cost−effective (572).
�� Unaccompanied minors While in some respects enjoying more protection than adults through, for example, adherence to the United Nations Convention on the Rights of the Child (573), they also have special needs for psychological and education support that are often not met (574). They may be particularly vulnerable to processes of exploitation.
�� Victims of trafficking Trafficking necessarily involves coercion or deceit. It is also characterized by exploitation of the trafficked person in, for example, the sex industry or in forced labour (575). Estimates for Europe suggest that about 80% of women trafficked enter the sex industry (576). Existing policies are poorly coordinated and often subordinate the interests of victims to considerations of migration control.
�� Irregular female domestic workers These women comprise a large proportion of migrants in irregular situations. Numbers are rising through continuing demand (577). Migrant labour is necessary to care for the increasing numbers of elderly people in the EU (578) and to increase women’s labour-market participation: much of the demand has to be met though irregular migration because of immigration restrictions. This category of migrants is especially vulnerable to exploitation and ill treatment.
Countries with a large informal sector are more attractive to those in irregular situations because work is easier to find in, for example, the construction industry, street trading and sweat shops. They provide an attractive source of labour for employers, making few demands and having few rights; fear of deportation means they seldom exploit the few rights remaining to them.
States vary in the extent to which they balance working to eliminate discrimination, poor living and working conditions and poor health service access for migrants in irregular situations and taking a managed approach to migration, employment and access to social protection. The managed approach may include policies to reduce regular and irregular migration and increase regulatory compliance of the informal sector more generally through, for example, health and safety at work, employment law and social protection rules. As a result, migrants’ access to social protection, including health care, is very
variable (579). Withholding access to social protection, denying them the “right to the highest attainable health”, is seen as an important element of “internal migration control”, on the assumption that the fewer rights irregular migrants are given, the fewer will come. Detention is another internal control measure increasingly used, but measures such as these do not seem to have much effect on the numbers of irregular migrants (572). Their main effect is to increase the vulnerability of irregular migrants to marginalization, destitution, illness and exploitation. “External migration control” has also intensified, but borders are hard to seal off completely. Increasingly severe restrictions on regular immigration and work by migrants, against a background of intensifying push-and-pull factors and reduced costs of long-distance transport, are factors that increase levels of irregular migration.
There are regional differences in the nature and volume of, and attitudes towards, irregular migration in Europe. Tolerance of irregular migrants varies considerably. Legislation regulating migration in the Russian Federation, for example, is highly restrictive (580), dating back to a time when the control of movement and immigration was a national priority. The situations in Scandinavian countries, the United Kingdom, Spain, the Czech Republic, Poland and Greece are examined in more detail in the case studies.
Remedial measures
It is clear that many migrants in irregular situations are affected by diverse and severe exclusionary processes and are extremely vulnerable in countries across the Region. As already indicated, country remedies vary (568).
The managed approach aims to reduce irregular migration. Two methods are commonly proposed or adopted.
The conservative method involves a “zero-tolerance” attitude, with even stricter external and internal migration controls and removal of existing irregular migrants to their country of origin. This strategy is generally unrealistic and unjust. Controls are hard to implement, easy to circumvent and at risk of breaching human rights conventions. The vulnerability and exclusion of irregular migrants is intensified, even where numbers are reduced.
The liberal method for reducing numbers involves removing some of the legal restrictions on migration in two possible ways: either temporarily and retrospectively by carrying out regularizations, or permanently and proactively by relaxing immigration regulations. Reduction of numbers by regularization is generally agreed to be an ad hoc remedy that conflicts with the principle that the law should not be subject to arbitrary exceptions. The other option, relaxing immigration restrictions, is recommended by many human rights groups. The EU is often cited as an example of how it is possible to abolish

108 Review of social determinants and the health divide in the WHO European Region: final report
migration restrictions even between countries with a moderate degree of economic disparity. Abolishing restrictions on all types of migration is, however, likely to be politically quite unacceptable in view of the economic pressures for migration in many low-income countries.
Less restrictive policies would not necessarily be against national economic interests: they could bring labour supply and demand into better harmony. Demand for certain types of labour that apparently cannot be met by regular migration under existing regulations exists in many European countries. The approach, however, would involve a drastic change in attitudes to migration and the long-term costs and benefits of altering labour supply and demand.
The second strategy for improving irregular migrants’ position is to improve their rights and strengthen social protection. This entails a weakening of “internal” migration control measures, which work by making the life of irregular migrants intolerable by demonizing and criminalizing them and denying them a decent level of social protection. At the same time, their rights can be improved through managed controls on the informal economy to ensure the health and safety of workers in the sector and the wider public who purchase products and services. Again, such measures would require changes in political attitudes.
A third approach is short term and immediate, rather than offering a strategic solution: improving aid to migrants in need. This requires efforts from civil society and government. Migrants in irregular situations are already the focus of initiatives by NGOs in all countries, providing legal aid, shelter, health care (or advice) and other kinds of support. This needs to be coordinated and strengthened to ensure that no one is denied a minimum standard of healthy living and basic human rights. It is not, however, a substitute for a more strategic approach to achieving these goals.
Strategies adopted need to reflect the constraints of each particular situation. It is clear, however, that migration issues and improving the living conditions of all migrants should be addressed through agreements between countries in Europe that support their human rights and a minimum standard of healthy living.
Case study: irregular migration policies
Scandinavia
Reliance on “internal” migration controls (defined below) is particularly strong in Scandinavian countries (581). Welfare provision is generous, so the difference between the protected and the unprotected is great. They have sophisticated national databases that can easily be linked, making it easy to implement internal controls. Broders & Engberson (582) characterize “internal” control strategies as follows:
When it comes to irregular migrants, exclusion is now the stated aim of policy. For those illegal aliens who cannot be discouraged or deterred to come, exclusion is meant to complicate and frustrate living and working conditions to such a degree that they will leave. The goal of discouraging irregular migrants has led to a shift toward internal migration control, which comprises a wide array of policy measures such as employer sanctions, exclusion from public services, surveillance by the police, incarceration, and expulsion.
Voluntary organizations provide health care to irregular migrants on a large scale. They have pushed for new legislation giving “paperless” people the right to access medical care services.
Greece
More than half of the foreign population of Greece is made up of Albanians, who arrived from 1990 onwards and are now estimated to form about 4−5% of the total population. Around 20% of Albanians are in irregular situations, comprising one third of the total number of migrants in irregular situations in the country (according to estimates by Triandafyllidou & Maroukis (583)).
The next largest groups are from Bulgaria, Ukraine, Georgia and Romania (Bulgaria and Romania, of course, became EU Member States in 2007). There are no data on the origin of the two thirds of migrants in irregular situations who are not Albanians, but most immigrants from African, Middle Eastern and Asian countries probably fall into this category. Detention in substandard conditions is applied on a large scale to these migrants and asylum seekers, including minors. The EU Agency for Fundamental Rights has heavily criticized Greece’s treatment of apprehended irregular migrants. Migrants (in regular and irregular situations) are currently bearing the brunt of rage about the country’s economic misfortunes, and the street violence organised by Golden Dawn (a highly active neofascist party) has involved attacks against migrants on a level uncommon in the EU.

6 Macro-level context
6.1 Background
Individuals and societies are affected by the broader macro-level context of country and global influences. Economic and social forces, environmental factors and regulatory frameworks provide the wider scenario in which people’s lives are lived and systems and institutions operate. They influence and constrain the actions of national governments and affect individuals and communities, increasingly crossing national boundaries. This chapter reviews wider influences and their effects on health inequities. A fuller discussion of each is available from the relevant task group reports.
This review has been written at a time of global financial crisis in which national, regional and global policies are closely intertwined. The financial crisis represents a formidable challenge to health equity as it undermines the resource base for redistributive social policies, with lasting effects on the social determinants of health. Mitigating the impact on the system of social expenditure in place in each country is central. The discussion in section 6.2 draws on the analysis of poverty, income, social protection and employment in previous chapters to focus on social protection and labour-market policies that reduce the effect of the crisis on health inequities.
Wider global factors affect the social determinants of health in the Region in two ways: first, their inwards effects on social determinants of health in Europe; and second, the outwards impact of European foreign policies on global factors, with knock-on effects for other countries. The principal influences for the first are considered to be the ongoing global financial crisis with attendant economic recession and migration pressures and counterpressures. For the second, it is trade and development/aid policies. These influences are reviewed in section 6.3, followed by an analysis in section 6.4 of the economic effect of health inequities themselves, focusing on their costs, the potential benefits of reduction and the policy trade-offs this would entail.
Sustainability is central to reducing health inequities. The accumulation of advantage and disadvantage over the life-course and between generations can only be addressed through long-term, sustainable strategies. This point is emphasized in section 6.5 by a discussion of the relevance of sustainable development to health inequities – looking at the role of policies on the natural environment, food and agriculture and the legal framework for ensuring equitable sustainability. The review of sustainability concludes with a discussion of issues in ensuring equity between generations in section 6.6.
6.2 Social expenditure
6.2.1 Introduction
This section reviews the impact of macroeconomic policies on health inequities with a particular focus on the effect on social expenditure of the economic downturn and austerity measures put in place to manage fiscal deficits. Evidence of effects on health and the social determinants of health is already emerging in Europe (584): analysis of data from
Macro-level context 109
Recommendation 3(a).
Promote equity through the effective use of taxes and transfers. In particular, the proportion of the budget spent on health and social protection programmes should be sustained in all countries and increased for countries below the current European average.
Specific actions
(i) Improve the balance between the overall level of social spending and:
(a) spend on other programmes; and (b) the overall level of taxation in those countries
where these indicators are below the current European average.
(ii) Promote equity effectively by adopting best practice in the design of social spending programmes, including universal provision that is proportionate to need, integrated social care and labour-market policies that incorporate active labour-market programmes.
(iii) In addressing the financial crisis, ensure priority is given to the health and social consequences of the austerity packages that are now being discussed or have already been introduced in many European countries. As a step towards ensuring that the processes are inclusive of all people, the views of ministers for health and social affairs should be heard in the negotiations about such austerity packages and, at transnational level, those of WHO, United Nations Children’s Fund, International Labour Organization and The World Bank.
(iv) Widen the discussion of financial stabilising mechanisms to prioritize socially progressive policies − such as those recommended in this review − by considering, for example, the likely impact of taxing financial transactions.

110 Review of social determinants and the health divide in the WHO European Region: final report
actually diminished to some extent over the past two decades or so (585), at least in the Nordic countries. Social assistance and minimum income benefits, for example, have become less generous and less adequate in terms of poverty alleviation in these countries since the early 1990s (586), indicating that social protection levels for the most vulnerable need to increase to ensure a minimum standard required for healthy living. It is important in countries in the Region in which social protection expenditure is below the current EU average that there is a long-term aspiration to raise levels and that levels are not reduced in countries where they are above average.
In the present economic downturn, it is also necessary to ensure that labour-market polices maintain people in employment and help them access employment opportunities. This has the potential to mitigate the health risks from unemployment. Where active labour-market programmes are based on evidence of effectiveness, the discussion below highlights their importance as part of macro-level policy.
6.2.3 Active labour-market policies
Active labour-market programmes (ALMPs) are a feature of social protection systems across many European countries. They are aimed at improving recipients’ prospects of finding employment or to otherwise increase their earnings capacity. Unemployment is often associated with poor health because it is associated with low income and lack of feelings of self-esteem and control (see Chapter 4). Reducing unemployment through ALMPs should therefore be expected to have positive health gains in the short and long term.
Evidence on the effectiveness of ALMPs in improving health outcomes comes mainly from cross-sectional studies (587). ALMPs and the training programmes and interventions used to deliver them have been shown to have positive and negative effects on psychological health and well-being of those they are intended to help during the period of participation (587). Health benefits include improved general psychological health, social adjustment, self-esteem, life satisfaction and role and emotional functioning, and reduced distress, depression, anxiety and sense of helplessness (588−601). Negative health outcomes will result from poorly designed programmes that create stress or place individuals in unsafe environments (see Chapter 4). Some benefits have been found to be maintained up to four months beyond participation in the training programme (590,596), though others appear to disappear or decline after participation (588,601,602). More research into the longer-term health impacts of ALMPs is required in relation to health benefits of returning people to employment and the longer-term benefits of participation in the programme.
Greece, for example, shows evidence of an increase in poor self-reported health and unmet medical and dental needs between 2007 and 2009 (Fig. 6.1).
6.2.2 Level of social protection expenditure
As indicated in Chapter 5, there is evidence that higher social expenditure in 18 countries is associated with lower inequalities in self-reported health (491) and lower age-standardized mortality (91). Studies reported in Chapter 5 also indicate that these relationships are curvilinear, with apparently diminishing returns to increasing investment.
There are two ways of looking at this: first, that social expenditure in richer countries is already sufficient; and second, that beyond a certain level of expenditure, the relationship between overall spending and mortality in a country depends to a greater extent on how the money is spent − is social spending proportionate to need, for example? Growing health inequities in several affluent west European countries resulting from less favourable mortality trends in population groups with fewer resources of their own indicate that existing social protection may be inadequate. The redistributive and protective capacity of the welfare state has
Fig. 6.1
Changes in self-reported health and access to health care in Greece between 2007 and 2009, adjusted estimates
2007
2009
Note: the odds ratio refers to the odds of ill health or unmet need in each year compared with the odds in 2007, so that the odds ratio in 2007 equals 1 for each indicator.
Source: Kentikelenis et al. (398).
0
0.2
0.4
0.6
0.8
1.0
Odds ratio
1.2
Unmet dental care needs
Unmet medical care needs
Bad or very bad self-reported health

Macro-level context 111
the pathways between macroeconomic conditions and population health are complex, evidence indicates health trends such as an increase in suicides and fall in road traffic fatalities following an economic crisis (284). The report also documents how health effects of the financial crisis are already becoming evident in some countries in the Region (398).
Government responses to the economic crisis can have a huge influence on resulting social and health effects. Those that have introduced fiscal austerity measures have undermined the social protection mechanisms that are imperative for improving social determinants of health in the Region. There is a need to protect social sectors from budget cuts to protect population health (605). Investing in economic growth is a preferable option to deep austerity measures for managing soaring debt levels, both in terms of reducing debt effectively and in achieving better health outcomes. The bailout of the international banking system, followed by austerity measures involving cuts to social spending that affect the poorest sections of society the most, highlights the inequitable effects of government action. International Monetary Fund (IMF) agreements with Region Member States can also have a negative impact on their health systems, as detailed in the country case studies below (606). Analysis of IMF agreements in place in nine countries in the Region in 2011 (607) shows that the large majority are contractionary, meaning they result in decreased government spending (Table 6.1).
The unequal pattern of recovery and concentration of wealth in the financial sector suggest very little has been done to address the conditions that gave rise to the financial crisis. These are some of the conditions most closely associated with the causes of the crisis in the first place. If the current pattern of finance-driven growth is not redressed, there
As indicated, health outcomes are dependent on the type and quality of the ALMP. Certainly, the transition to employment resulting from an ALMP is insufficient to bring about health benefits: the job must be of good quality. The evidence suggests that ALMPs should be based on enhancing personal development rather than a singular focus on “getting individuals into any job as quickly as possible” if health benefits are to be realized (587).
The task group on employment and working conditions (160) considered two categories of ALMP: training programmes aiming at increasing working skills (such as workplace training or further education) and supported employment and rehabilitative services for people with limited working capacity. The task group used country-level data from the OECD database 1985−2005 to observe associations between training programmes and rehabilitative services and the psychosocial working environment. As described in Chapter 4, a high level of control at work (365) and reward for work done (603) contribute to a good psychosocial work environment, which is an important determinant of health. Those who experience a good-quality work environment are on average likely to enjoy better health outcomes than those in poor, stressful and dangerous working conditions.
Evidence shows that higher participation rates in lifelong learning and higher investments in rehabilitative services at country level are associated with better quality of work (higher levels of control and reward at work (160)). The task group analysis suggests that greater investment in ALMPs can have a positive impact not only on employment and short-term health outcomes, but also on working conditions, which should lead to improved health outcomes and reduced health inequities.
6.3 The relevance of global policies
6.3.1 Introduction
The global financial crisis of 2008 and the related ongoing sovereign debt crisis in Europe are powerful factors that will have lasting effects on social determinants of health, particularly if responses do not take health equity concerns into account.
6.3.2 Global financial crisis
The report of the task group on global factors (604) focuses on the effects of the global financial crisis on the social determinants of health in Europe, studying the evidence linking financial collapse to health risk factors through three main channels: income, labour-market and social welfare effects. Although
Case study: countries’ experiences of financial crisis − Ireland
Ireland was one of the first countries in Europe to experience financial problems. It nationalized some of its failing private banks, leaving a substantial budget deficit, and undertook deep public sector cuts, including in the health sector. Following financial bailout by the IMF and the European Central Bank, the Irish Government no longer enjoys full financial autonomy, as it must comply with IMF demands. In addition to already comprehensive cuts to public services in 2010 and 2011, a recent study notes that the health service budget is expected to be cut by a further €1 billion in 2012 (608). The study also points out that cost overruns in excess of €200 million in the first six months of 2011 have led to the recent closure of hospital beds.

112 Review of social determinants and the health divide in the WHO European Region: final report
is a risk of continued cycles of debt accumulation and risks to population health in Europe. Options include more meaningful reregulation of the financial system, including more realistic capital cushions, lower leverage ratios and better regulation of the shadow banking system, and the introduction of a financial transaction tax (FTT), of which a specified percentage could be used to finance social spending that would support global health initiatives. Examples are a currency exchange tax (0.005%), which analysts have suggested would yield US$ 40 billion annually, or a FTT (0.05%), US$ 600−700 billion (613). The task group report includes estimates of applying the 0.05% FTT on foreign exchange on all currency trades, including those involved
Table 6.1
Expansionary (E) and contractionary (C) elements of current IMF agreements
Note: policies are indicated as contractionary (C) or expansionary (E) where data were available to enable a judgement to be reached.
Source: Weisbrot et al. (607).
Country Fiscal policy
Monetary policy
Public-sectorwage bill
Liquidity andmoney-supply growth
Interestrates
Belarus C C C C C
Georgia E
Hungary C C C C C
Kyrgyzstan E C C C C
Latvia C C C C C
Romania C C C C
Serbia C E C E
Tajikistan C E C
Ukraine C C C C
Case study: countries’ experiences of financial crisis − Greece
The economy has continued to decline despite deep spending cutbacks, while budget deficits have remained high. It is now estimated that Greece will be running a 9% deficit in 2011, roughly 3% above target, as the economy continues to contract. This negative feedback loop from spending cuts to economic decline and growing budget deficits has long been predicted by the Center for Economic and Policy Research (609).
Suicides rose by 17% between 2007 and 2009 and to 25% in 2010, according to unofficial 2010 data (398). The Minister of Health reported a further 40% rise in the first half of 2011 compared with the same period in 2010. Suicide attempts have also increased, particularly among people reporting economic distress (610). Homicide and theft rates have doubled. HIV rates and heroin use have risen significantly, with about half of new HIV infections being self-inflicted to enable people to receive benefits of €700 per month and faster admission on to drug-substitution programmes. Prostitution has also risen, probably as a response to economic hardship. Health care access has declined as hospital budgets have been cut by about 40% (398) and it is estimated that 26 000 public health workers (9100 doctors) will lose their jobs (611). Further cuts are expected as a result of recent negotiations with the IMF and European Central Bank.
An analysis of the EU survey of income and living conditions in Greece found a 15% increase between 2007 and 2009 in the likelihood of people reporting that they did not go to a doctor or dentist despite feeling it was necessary (Fig. 6.1).
These adverse trends in Greece pose a warning to other countries undergoing significant fiscal austerity, including Spain, Ireland and Italy. It also suggests that ways need to be found for cash-strapped governments to consolidate finances without undermining much-needed investments in health.
Case study: countries’ experiences of financial crisis − Latvia
Latvia is the first country to “successfully” graduate from an IMF post-crisis programme. It received a €7.5 billion bailout at the height of the credit crisis in 2008 in exchange for committing to a mix of deep spending cuts and tax increases. Findings from a study conducted by the Center for Economic and Policy Research show that Latvia suffered the largest decline in economic output of anywhere in the world during the implementation phase, with a 24% drop in GDP between 2008 and 2010. Unemployment increased from 5% in late 2007 to more than 20% in early 2010. The study also notes that the unemployment rate remains high at 14.4% even after more than a year of recovery, with currently 3% GDP growth. But the official unemployment rate does not reflect the full cost of the recession and weak recovery to Latvia’s labour force. If account is taken of people involuntarily working part time and those who have given up looking for work, the peak unemployment/underemployment rate in 2010 was over 30%, declining only to 21.1% in the third quarter of 2011 (612).

Macro-level context 113
�� how governments can regulate mixed health care systems with commercial service providers and/or insurers (particularly with respect to investment treaties);
�� whether they can return to public provision where services have been contracted out or there has been a change in the terms of privatized services (“lock-in” effect);
�� how and where public services provision or public “monopolies” can operate within the sector;
�� how governments can ensure that the impacts of public health policies and regulations are not undermined by trade agreements;
�� how governments can subsidize and finance services at regional and local level; and
�� how governments can regulate entry of foreign professional-services providers and how qualifications are recognized within a country.
The most globally discussed and perhaps most controversial issues with respect to trade and health are related to intellectual property rights, innovation and health. Trade agreements often include provisions that apply to intellectual property rights. It is important that ministries of health are aware of the indirect consequences from trade-related measures in relation to intellectual property rights and the scope for, and nature of, generic markets in their particular country.
6.3.5 Development assistance
While the global financial crisis and trade agreements have a very visible and direct impact on social determinants of health in Europe, international development assistance creates indirect (feedback) effects on social determinants of health in Europe but direct effects on them in recipient countries. In this area, the Task Group report (606) assesses the coherence of international assistance in health (IAH) by focusing on five of the key European players: Germany, the United Kingdom, France, Spain and the EC.
The main finding is that Europe’s potential impact on social determinants of health in the rest of the world is greatly and negatively affected by the lack of a common sense of purpose and lack of coherence in the development policies promoted by individual countries. Another central concern of the report is that IAH is not predictable enough to allow recipient countries to make the necessary long-term investments into national health systems. Given the tremendous importance of IAH, donor alignment with national priorities is identified as a key issue. The report notes that while IAH has been rapidly increasing over the last decade, the task force on innovative financing of health systems has recently noted that an additional US$ 36−45 billion (US$ 24−29 per capita) is required to ensure rapid
in derivatives and over-the-counter trading, and therefore gives a considerably higher estimate that the FTT would raise $8.63 trillion (606). This tax would provide a disincentive to speculative transactions and a source of finance to rebuild social and financial infrastructure.
6.3.3 Migration
Migration relates directly and indirectly with social determinants of health in the Region. Migrants in irregular situations were considered in the previous chapter. Two aspects of migration are considered here: the general cross-border flow of people from outside the Region and the intra-European migration of health workers. Migration flows are strongly linked to economic opportunity, so the global financial crisis of 2008 will probably have a lasting effect on patterns and on the life chances of immigrants, who are likely to experience particular hardship as they are disproportionally low-skilled and are more likely to lose employment (614). The crisis is also likely to slow down migration flows towards Europe, in light of the “jobless” recovery which is not producing sufficient employment opportunities for immigrants and policy-makers’ potential hesitancy to admit as many immigrants as they did during the economic boom years. The emergence of anti-immigrant sentiments in many European countries presents growing concern in most migration policy debates (572).
Institutional environments play a key role in determining anti-immigration sentiment, with levels of social protection and employment being key factors in public attitudes to migration. Education is also considered a key intervening variable. Higher education and higher skills across Europe mean more support for all types of immigrants and less anti-immigrant sentiment. These findings suggest that responses could include investing in strong governmental services for migrant populations at local and national levels, such as universal programmes to help settlement, language classes and access to health care, and launching campaigns targeting existing resident populations to encourage a more integrated policy.
6.3.4 Trade
This section focuses on the direct impact of trade regulations on social determinants of health, health and health systems. The potential impact on health equity remains elusive. Ministries of health need to be aware of the wide-ranging effects of trade negotiations on health, especially in relation to policy and resources for health. Inclusion of health and health services as part of trade agreements is likely to influence:

114 Review of social determinants and the health divide in the WHO European Region: final report
Some research from high-income countries in the OECD and eastern European and central Asian states points to significant economic benefits (in the form of faster economic growth) from reducing health inequities between countries. Scientific debate about the extent to which the health and growth nexus truly reflects a causal relationship nevertheless continues. Work that focuses on developing countries cautions against – and, indeed, reverses – the expectation of major growth dividends from improved health, arguing that most work on the subject has not properly addressed the complexity of the relationship between health and economic growth (616,617). Some studies that looked at health expenditure in OECD countries rather than health itself found a positive association between expenditure and economic growth or income levels (618−620).
However, two studies that looked at a sample of 22 developed countries between 1960 and 1985 found that health – measured by life expectancy – had no significant effect on economic growth or on per capita income levels (621,622). This poses the question of whether, above a certain level of economic development, further health gains may either have no effect or even reduce subsequent economic growth. There is no answer to this question at present.
Research that took considerable care to overcome the inherent problem of complexity in the relationship between health and growth found a robust causal effect on per capita growth rates in a sample of 26 high-income countries over the period 1960−2000 (623). A 10% reduction in cardiovascular mortality was associated in one representative estimate with a one percentage point increase in growth of per capita income, a seemingly small amount but one that has a large effect when summed over the long term. Inherent methodological problems mean the debate on the true impact of health on economic growth is nevertheless far from settled.
Evidence of adverse economic consequences of ill health is far more conclusive when looking at the microeconomic (individual) level. Lower socioeconomic groups suffer worse health and should therefore incur greater economic losses (in the form of earnings loss and labour supply); this provides a basis for arguing that health inequities are likely to impose a substantial economic burden on society.
A substantive body of research examines the microeconomic consequences of adult health on labour-market outcomes. It shows ill health reducing labour productivity, measured by earnings, in several cases (624) and documents the importance of health in shaping labour supply (625). Good health, for instance, raises the probability of working in the first place, and health emerges as the main, if not sole, determinant of labour supply among older workers in some studies (626).
progress towards the health Millennium Development Goals. Since it is unlikely that such an amount could be mobilized domestically in low-income countries, it is crucial that donor countries live up to their long-standing commitment of providing 0.7% of gross national income as official development assistance (ODA). If, at such a level, 15% of all ODA would be allocated to health, an additional US$ 40 billion could be raised to fill the gap identified by the task force.
Since social determinants of health are not only affected directly by how much aid money is allocated to health, but also by the wider social environment in low-income countries, the report suggests that an essential step in improving social determinants of health is to promote social protection mechanisms that extend beyond the health sector. Considering only health systems as a key element in social protection programmes, the inability of many developing countries to self-finance a sufficient level of health system capacity, coupled with obligations under international human rights treaties, implies the necessity of international assistance for health, and further suggests that any attempt to tackle the social determinants of health will have to resort to global redistributive action.
6.4 Economic impact of health inequities
6.4.1 Introduction
The review takes the position that health inequities are unjust and unfair. This section reviews the evidence to suggest that an economic case for tackling health inequities can be made, in addition to the moral argument. Health inequities may hamper the achievement of policy goals in other sectors, such as sustainable economic growth, public expenditure control, public service performance and quality of life. While studies of the economic burden that results from the human costs of health inequities can help bring the issue of health inequity to the attention of policy-makers outside the health sector, they cannot be used to provide cost justifications in every situation. They cannot, for example, support the case for or against specific policy actions.
6.4.2 Economic benefits of reducing health inequities
There are economic benefits in reducing health inequities both between and within countries in the Region. The WHO Commission on Macroeconomics and Health made the point that there may be a considerable cost in terms of foregone economic growth as a result of some countries having a much lower level of overall health than others (615). Much of this work, however, is related to developing countries outside the Region.

Macro-level context 115
be deferred if there were no differences in mortality by income quintile. While this does not imply that all these deaths are avoidable by reasonable means – that is to say, reflect inequities in health – it does provide an indication of the human cost of differential levels of mortality. Much of this mortality burden is associated with the whole social gradient rather than being concentrated among the most disadvantaged group. For example, if the mortality level of the poorest quintile was equal to that of the second poorest, there would be only 1% fewer deaths recorded in the countries studied; based on VSL calculations of years of life saved, however, even this lower figure represents a substantial monetary cost saving – €88 billion – in the countries included in the analysis. The equivalent monetary figure for the cost of removing mortality differences between all income quintiles is over €3800 billion.
6.4.3 Economic evidence on trade-offs between costs and benefits
There are two main types of economic evidence to support the case for action to tackle health inequities:
�� economic burden studies about the human and financial costs of health inequity, as discussed above; and
�� economic evaluation studies about the costs and benefits of specific actions to tackle health inequity.
Studies that focus on financial burdens of health inequity may distract from more important concerns about human suffering, but provide a realistic method for quantifying “equity-efficiency trade-offs” in comparing specific actions to tackle health inequities. Cost−effectiveness analysis (CEA) and CBA studies of specific options can provide a balanced and more evidence-informed understanding about the nature, size and importance of any policy trade-offs.
One feasible method of estimating economic burden of health inequities for this purpose lies in the value people attribute to the lives lost as a result of socioeconomic differences, as discussed above. That value is hard to measure, but normally considerably exceeds estimates of economic gains in the form of additional earnings (modest for the most disadvantaged) or health care cost savings (which are also difficult to quantify).
Economic burden evidence about the human and financial costs of health inequity can be used to address the initial question: “why should we care about health inequity?” but not the follow-up question: “what should be done about health inequity?” Addressing this important follow-up question requires credible evidence about the costs and benefits of specific policy actions. Standard CEA and CBA evidence focuses on overall
Suhrcke et al. (627) summarized work documenting the economic impact of ill health on labour-market outcomes (and on economic growth) in eastern Europe and central Asia. While the latter microeconomic body of evidence does not directly measure the economic consequences of health inequities, it nevertheless provides a basis for arguing that there is likely to be a substantial cost, because people from lower socioeconomic backgrounds are at higher risk of worse health and are therefore more likely to incur economic losses.
Human cost of inequities in mortality
Few studies have, however, carried out a full economic valuation of the costs of health inequities because, among other reasons, it is not clear what reduction could be achieved “by reasonable means”. Two relevant studies are those of Mackenbach et al. (628) on the EU25 (the EU15 plus the EU10 (countries joining the EU in May 2004)) and Dow & Schoeni (629) on the United States. Mackenbach et al. pursued two approaches in measuring economic costs of health inequities in one year (2004). Estimates of inequities-related losses to health as a “capital good” (leading to less labour productivity) for the EU25 as a whole seem to be modest in relative terms (1.4% of GDP) but large in absolute terms (€141 billion). They also valued health as a “consumption good”, which involves the application of the concept of the value of a statistical life (VSL). From this more comprehensive perspective, the economic impact of socioeconomic inequities in health may well be large, in the order of about €1000 billion or 9.5% of GDP in these countries.
A third study (630) carried out for the strategic review of health inequalities in United Kingdom (England) (51) also used estimates of the VSL to convert health inequities into monetary values. Assuming that only part of the mortality gradient would be reduced, the study found that for the adult population of the country as a whole, the economic gains would be on average between about £98 billion and £118 billion (in 2002 prices), depending on the extend of the assumed reduction (515). The estimates excluded parts of the population and ignored any non-fatal conditions or diseases, so represent a lower bound on the true benefits that could result.
Replicating these analyses across the whole Region is made difficult by the absence of an appropriate Region-wide cross-country survey. SHARE has at least some coverage of European states: despite issues with small sample sizes in some countries, validation against other cross-national samples suggests that SHARE is the best available source.
Comparable longitudinal data from a single source, the SHARE survey, are available to estimate age- and sex-specific mortality rates by indicators of SES for 11 European countries, enabling an estimation of the mortality burden of unequal levels of mortality. It is estimated that 19% of male and 16% of female deaths at ages 50 and over in these countries would

116 Review of social determinants and the health divide in the WHO European Region: final report
6.5.1 Introduction
Efforts to reduce inequities in the social determinants of health, promote sustainable development and mitigate climate change are interrelated. Policies on issues such as provision of more and better quality green space, active travel and housing insulation influence one another and are often mutually reinforcing.
The objectives of climate change mitigation and tackling health inequities often require similar actions. As discussed in section 6.1, they are both for the long term. Reducing health inequities and reducing the effect of climate change require long-term, sustained action aiming not only to improve the health of some people in the immediate future, but also to achieve substantial and enduring results over time across the Region.
The review supports the principles of sustainable development, which are about living within environmental limits, ensuring a strong, healthy and just society, achieving a sustainable economy, using sound science responsibly and promoting good governance (632). A further approach from sustainable development is that the claims and needs of future generations are vitally important and there is a need to develop and enhance intergenerational equity, explored further in section 6.6.
6.5 Sustainable development and health
population health and well-being (or “efficiency”) and does not incorporate concern for fairness in its distribution (or “equity”), but can nevertheless be used to support action to tackle health inequity by addressing concerns about potential trade-offs between equity and efficiency. Credible CEA and CBA evidence can help to counter misleading claims about the harmful opportunity costs of action to tackle health inequity by offering a clearer, more balanced and more evidence-informed picture.
Credible CEA evidence about ill health prevention policies is increasingly easy to access via quality-controlled online repositories, such as WHO−CHOICE (CHOosing Interventions that are Cost Effective) (631) (global), the National Institute for Health and Clinical Evidence (NICE) (United Kingdom (England)) and the Preventive Services Task Force (United States). Credible CBA evidence about policies outside the health sector is less easy to access, but the Washington State Institute for Public Policy is a useful online public repository of United States-oriented studies. There is a need to develop such repositories for the European Region as part of a system of evidence-based policy development and monitoring (see Chapter 7).
Recommendation 3(b).
Plan for the long term and safeguard the interests of future generations by identifying links between environmental, social and economic factors and their centrality to all policies and practice.
Specific actions
(i) Ensure that the principles of sustainable development are applied to all policies, taking account of evidence on the impact of development in the past on current and future generations.
(ii) Include health equity assessments for current and future generations in environmental policies at all levels.
(iii) Introduce fiscal policies that improve the affordability of healthy and sustainable food choices:
(1) ensure that the cost of a nutritious and sustainable diet is reflected in calculations of a minimum standard of living for all; and
(2) ground agricultural policies in equity and sustainability and ensure that they promote access to safe, affordable, nutritious food for all and sustainable and equitable food systems.

Macro-level context 117
6.5.2 Impact of natural environments
Rising levels of greenhouse gas emissions, climate change and the depletion of natural resources are likely to have negative and potentially catastrophic effects on human health. These are global, but different parts of the world – and Europe – are affected differently, some sooner and more acutely than others. Some health effects are a direct consequence of changes to the natural environment, while others arise indirectly as a result of efforts to mitigate climate change by reducing greenhouse gas emissions. Mitigation is needed to reduce average emissions per capita from 11−12 tonnes (current in Europe) to no more than 2 tonnes (633). This will require intensive and sustained action by governments at all levels. Without such action, it may be impossible for human societies to survive in recognizable form, let alone improve health or reduce health inequities.
Health impacts of changes to the natural environment
The condition of the earth’s natural environment can be a powerful determinant of health, directly and indirectly. Global warming, loss of biodiversity, pollution of air, land and water and depletion of natural resources may all have a negative effect on health now and – increasingly – in the future. The effects may be cumulative and, in some cases, irreversible.
Direct health effects of climate change may result from more extreme weather events leading, for example, to flooding and drought and extreme heat and cold. The health consequences are consequently diverse: drowning, injuries, respiratory diseases, shock, hypothermia, cardiac arrest, wound infections, allergies, gastrointestinal illnesses, ear, nose and throat infections, waterborne and vector-borne diseases, malnutrition, economic insecurity and impoverishment, disrupted family ties and other social connections, stress, anxiety, dislocation and increased susceptibility to other psychosocial disturbances, and disrupted access to health and other essential services.
Indirect impacts on health may result from higher prices for food, water, domestic energy and motorized transport, colder homes and reduced mobility (especially among low-income groups), reduced consumption of some goods and increased anxiety, poverty, immobility and unemployment.
The effects of climate change and diminishing natural resources will inevitably affect different parts of Europe in different ways (537). Northern areas, for example, may benefit from needing less energy for winter heating, higher crop yields and increased tourism, but run higher risks of extreme weather events, reduced fish stocks and new vector-borne diseases.
Inequities
Experience from the West Midlands shows that those who are relatively poor and powerless are likely to suffer first and most (635). Where the aim is to tackle health inequities, a priority must be to safeguard natural resources and to minimize the negative effects of environmental damage – especially for those who are poor and powerless – and to avoid reaching a “tipping point” where some or all aspects of environmental damage spiral into irreversible decline. Global warming can, for example, precipitate droughts and subsequent crop failures in some locations, leading to loss of livelihoods, poverty and poor nutrition for the people who live there, which in turn can weaken the health of pregnant women and result in children being more likely to be sickly in infancy and childhood and less likely to grow up to be healthy and robust parents.
Responsibility for climate change and other forms of environmental damage lies principally with rich countries and with higher-income groups within countries, but sustainable pathways should be adopted in low- and middle-income countries in the Region to achieve economic well-being and a reduction in health inequities as an alternative to the carbon-intensive, growth-driven routes followed by high-income countries. The negative effects of environmental damage fall most heavily upon poorer countries and on lower-income groups within countries (who bear least responsibility for the changes) and more heavily still upon future generations (who bear no responsibility at all). Low-income households generally have much smaller ecological footprints; indeed, the gradient in household emissions is closely aligned with the income gradient (500). Different levels of vulnerability to health risks associated with environmental damage are linked to location and time and to economic, political and cultural conditions.
Case study: anticipating the effects of climate change
The West Midlands Public Health Observatory in the United Kingdom published a local assessment of tackling climate change. It concluded that the most deprived areas of the West Midlands would be the worst affected by climate change and identified the following problems: increased risks of CVD incidence (due to greater prolonged extremes of temperature), respiratory disease incidence (due to increased ozone pollution) and heat stroke (especially for residents in poorly ventilated high-rise buildings); increased risks of flooding in certain areas; increases in food and fuel prices potentially leading to decreases in the consumption of nutritious foods, as the poorer population are less able to afford them; and higher fuel prices, which could increase financial pressure on those living in rural areas with limited local amenities (634).

118 Review of social determinants and the health divide in the WHO European Region: final report
The EC has estimated that 43 million people in the EU were at risk of food poverty in 2009 (645) with numbers rising due to higher and more volatile food prices, consequently exacerbating diet-related health inequities. Low-incomes families are only able to purchase the cheapest sources of calories and poor
6.5.3 Agriculture, food and health
Food systems have complex interrelations with health and the environment that vary between and within countries. Climate change and resource depletion will increasingly affect the yield and nutritional quality of food crops and food’s accessibility and affordability (633,636), with disproportionate harm to socially disadvantaged populations (637). Access to affordable, nutritious food is an important determinant of health, just as unequal access is a key determinant of health inequities. Many parts of eastern Europe have inadequate supply systems to make affordable fresh foods available out of season, meaning people consume vegetables as pickles and meat in highly processed forms: both use large amounts of salt and saltpetre (40).
What people eat can affect the natural environment as well as their health. Reducing meat and dairy consumption, eliminating food waste and cutting fatty and sugary foods would make the biggest contribution towards improving health and reducing the environmental impacts of food systems. Cutting consumption of saturated fat – particularly from meat and dairy products – is well-established health advice to reduce diet-related preventable disease, as long as other factors such as iron consumption are taken into account.
Agricultural policies and practices, including patterns of land use and ownership, can have a strong influence on food systems and health. In Poland, reductions in subsidies for animal products such as butter and lard led to a switch from saturated to polyunsaturated fats (638,639), mainly through consumption of rapeseed- and soybean-based oils. This in turn contributed to a reduction in mortality due to CVD of more than 25% (638,639) between 1991 and 2002 that could not be explained by increased fruit consumption or declines in smoking (640). Policies may, however, have unintended consequences that exacerbate health inequities.
Inequities
Low-income households spend a greater proportion of their income on food and are hardest hit by food-price fluctuations, which are partly influenced by environmental factors. This often leads to a less-nutritious diet, with negative impacts on health.
In general, richer countries tend to have more carbon-intensive diets with more packaging, which uses energy in production and creates more waste. While richer groups generally consume more, consumption by poorer social groups within richer countries is often less energy-efficient: they tend to eat more processed foods, which have a larger carbon footprint as well as more fats, sugars and artificial additives, and pursue consumption patterns that are harmful to health (by increasing the risks of obesity and diabetes (637)) and the environment.
Case study: biofuels
Biofuels (crops grown as energy sources) can reduce greenhouse gas emissions but may also increase health inequities by diverting agricultural production away from food production. Biofuels have already led to food commodity instability (641). The Food and Agriculture Organization of the United Nations (FAO) has estimated that biofuel production (under current public policies) will drive up average wheat, maize and vegetable oil prices by 5%, 7% and 19% respectively between 2013 and 2017 (642,643). By using crops such as corn as biofuels, the industry is positioned “against the interests of people who want food” (644). These price increases are likely to exacerbate diet-related health inequities with more people only able to purchase the cheapest sources of calories, which are often energy-dense, highly processed products that increase the risk of obesity and diabetes (637). Germany, France and Italy lead in the production of biodiesel in Europe. Some countries, notably the United States, use domestic subsidies and tariffs to make certain biofuels profitable (644).
Case study: climate food labelling in Sweden
Despite the evidence and media attention around climate change, there is mixed evidence that consumers are influenced by sustainability issues when shopping for food. KRAV, a Swedish organization that develops organic food standards, initiated a project in 2006 to introduce climate labelling on food. The certification system was created in collaboration with partners from the Federation of Swedish Farmers and several major Swedish food companies. The label is voluntary and standards were introduced in 2009. The climate certification covers the food chain from farm to store and includes distribution and packaging. It is applied to a limited range of grocery items, including meat, fish, milk and greenhouse vegetables, and selected restaurants. The labelling initiative was accompanied by an information and education campaign and new dietary guidelines that also include carbon dioxide emissions. As an example, the guidelines recommend carrots over cucumbers and tomatoes as the latter are grown in heated greenhouses and result in more greenhouse gas emissions. The initiative also works with the industry to implement measures to reduce the greenhouse gas emissions of food production.

Macro-level context 119
neighbourhoods often have little or no access to nutritious, affordable food (646). Energy-dense, highly processed products are readily available in many European countries. A study of 13 European states attributed more than 40% of obesity in women and over 20% in men to differences in SES (291). Obesity and overweight among children in Europe is also associated with lower parental SES, especially of mothers (291).
Patterns of development in countries in transition
Different kinds of land reform in post-Soviet countries are having varied effects on rural livelihoods and on agricultural and welfare systems. Land has been distributed in small plots in some of the poorest transition countries, including Albania, Armenia, Tajikistan and the Republic of Moldova. There is evidence that this has led to a shift to self-employed labour-intensive agriculture where there are few alternative employment opportunities, with a “relatively young and dynamic labour force turning to family farming on the newly acquired land” (647). By contrast, higher-income countries in central Europe, such as the Czech Republic, Slovakia and Hungary, have consolidated large-scale capital-intensive privatized farming. This has led to heavy flows of labour out of the agricultural sector, but job losses have to some extent been offset by welfare provision. Lower-income countries in eastern Europe, such as Bulgaria and Lithuania, have developed large capital-intensive farming but have much less social protection for workers who are laid off. In these situations, faced with competition from the big farms, household-level subsistence farming has held little appeal to young people: they have left in droves for the cities, leaving a diminishing, ageing and impoverished rural population (647).
These patterns of development influence the extent to which people in different countries can build healthy and sustainable food systems and how far they are able to be self-sufficient in food production. Creative approaches to locally controlled food are more likely to emerge by building on good practice in parts of the CCEE than by trying to replicate western European food systems.
6.6 Intergenerational equity
6.6.1 Introduction
“Intergenerational” refers to relationships and transactions between different generations. These include not only today’s younger and older generations, but also future generations. Sen argues that future generations, no less than present ones, should be able to enjoy capabilities to lead lives they deem worth living (648). Sustaining deprivation is not an acceptable goal, but anxieties over the prospects
of future generations should not cause the pressing claims of today’s less-privileged to be overlooked. Universalism requires that both are given attention. This review emphasizes the importance of policy and actions taking account of within- and between-generational equity.
There are three reasons for giving prominence to the principle of intergenerational equity in this review:
�� first, there is a strong grounding in international treaties and case law that endorses this approach;
�� second, it is impossible in practical terms to address the underlying causes of health inequity without tackling the transmission of health risks between generations: this will inevitably include transmission between present and future generations (see discussion in Chapter 4); and
�� third, the potentially catastrophic nature of environmental threats to human health and well-being place the question of intergenerational equity at the heart of any endeavour to improve health and reduce health inequities.
In Chapter 4, intergenerational transmission of inequities from parents and grandparents to children and the need for action across the life-course to address the needs of successive generations in Europe today were highlighted. What remains for clarification is whether this extends to future generations, as yet unborn, so that they too can achieve “their full health potential and well-being” and, if so, how – and how far – potential conflicts between the interests of different generations can be reconciled.
To address this question it is first necessary to examine the immediate rationale and its legal and philosophical underpinnings before considering some of the main arguments against intergenerational equity and finding a balance between the conflicting arguments.
6.6.2 Legal underpinnings: international treaties and case law
The Preamble to the Universal Declaration of Human Rights (649) asserts that “recognition of the inherent dignity and of the equal and inalienable rights of all members of the human family is the foundation of freedom, justice and peace in the world”. The reference to “all members of the human family” has a temporal dimension that brings all generations within its scope and that to “equal and inalienable rights” affirms the basic equality of these generations in the human family. The Charter of the United Nations (650), the International Covenant on Civil and Political Rights (13) and the Convention on the Rights of the Child (573) endorse this approach.
The Declaration on the Responsibilities of the Present Generations toward Future Generations (651) states: “The present generations have the responsibility

120 Review of social determinants and the health divide in the WHO European Region: final report
The concept of intergenerational equity implies that different generations’ claims and interests may conflict or compete with one another. Deciding how to reach a fair balance between them involves taking all relevant factors into account and judging them according to chosen criteria. It does not mean treating generations in exactly the same way. It is a matter of judgement rather than science.
The case for a human rights-based approach to tackling the social determinants of health was discussed in Chapter 2 and in the task group report (9). If human rights extend to future generations, the principle of intergenerational equity holds that ways must be found to uphold the rights of current generations without jeopardizing those of the future and vice versa.
A body of legal theory and practice relating to intergenerational equity is emerging, mainly focusing on safeguarding the natural environment for future generations. A paper prepared for the human rights clinic at Harvard Law School in 2008 provides a useful summary of legal and quasilegal mechanisms (654). The authors point out that numerous legal sources establish a duty for present generations to act. Some specifically recognize the existence of rights of future generations. Legal systems also advance intergenerational equity through the concepts of guardianships or trusteeships, which partly overlap with the duty/rights framework (654).
Legal mechanisms that offer opportunities to protect the interests of future generations are summarized as follows:
�� courts can interpret the law to recognize the importance of intergenerational equity, grant standing to sue to those seeking to represent future generations and provide a check on the actions of governments with regard to future generations;
�� ombudsmen can review and advise on environmental policies with intergenerational equity in mind and can serve as mediators between governments and representatives of future generations; and
�� guardians can be appointed to represent future generations as they represent other voiceless people in specific situations, such as negotiations and litigation.
6.6.3 Mechanisms for realizing intergenerational equity: working examples
This section describes some working mechanisms for realizing intergenerational equity, with appropriate reference being made to constitutional declarations and judgements of the International Court of Justice (ICJ) and institutions designed for this purpose currently operating in the Region. Although the
of ensuring that the needs and interests of present and future generations are fully safeguarded”. The Declaration of the Principles of International Cultural Co-operation (652) provides that “each culture has a dignity and value which must be respected and preserved” and that “all cultures form part of the common heritage belonging to mankind”. If current generations assume the right to exploit natural and cultural resources at the expense of the well-being of future generations, this would contradict the purposes of the Charter of the United Nations (650).
Opposition to the notion of ensuring intergenerational equity includes the following arguments.
�� Market-based approaches Exponents of a free-market approach assert that freely functioning markets unconstrained by international law or government action will produce outcomes that are inherently fair. What is required, therefore, is not to have state interventions aimed at promoting intergenerational equity, but extended property rights over land and other natural resources so that individuals can take self-interested actions to safeguard the value of what they own.
�� Future uncertainties Difficulties inherent in predicting the future mean that it is not possible to “plan” for equity of future generations.
�� Future rights Unborn generations cannot be held to have rights to equitable treatment now, because they cannot claim them or vote to change them in the present (653); nor can they seek restitution from past generations. Some conclude that in the absence of enforceable rights, duties and obligations towards future generations are weak and inconsequential, rendering the concept of equity meaningless.
While these arguments are worth some consideration, they must be weighed against those set out earlier in this report – most notably:
�� international treaties that already commit to fairness between generations;
�� the review’s emphasis on sustainability;
�� the equal distribution of social determinants of health, which includes preventing the transmission of health risks between generations;
�� the long-term, global and potentially catastrophic effects of climate change and environmental degradation;
�� the case for temporal neutrality in understanding justice; and
�� the need for a standard of living that supports health.
How to deal with conflicts of interest between generations remains a challenge. This brings us to the second area (identified above) where clarification is needed.
Macro-level context 121
mechanisms apply mainly to environmental intergenerational equity, the principles apply more widely to intergenerational equity in the social determinants of health, as they are mutually supportive and reinforcing.
Constitutional safeguards
Norway, Japan and the Plurinational State of Bolivia are examples of nations whose constitutions recognize the need to safeguard rights of future generations in relation to environment and climate. Norway’s constitution declares:
Every person has a right to an environment that is conducive to health and to a natural environment whose productivity and diversity are maintained. Natural resources should be managed on the basis of comprehensive long term considerations whereby this right will be safeguarded for future generations as well.
ICJ
Several ICJ judgements have acknowledged that present generations should safeguard the interests of future generations. In the case of Denmark v. Norway decided in 1993, for example, Judge Christopher Weeramantry wrote in his concurring opinion that respect for “elemental constituents of the inheritance of succeeding generations dictated rules and attitudes based upon a concept of an equitable sharing which was both horizontal in regard to the present generation and vertical for the benefit of generations yet to come”.
Three years later, the ICJ applied these precepts in its Advisory Opinion on the Legality of the Threat or Use of Nuclear Weapons, whose impact on future generations it considered to be an important factor. The majority recognized that: “[t]he destructive power of nuclear weapons cannot be contained in either space or time … Further, the use of nuclear weapons could be a serious danger to future generations” (655).
In 1997, in a case before the ICJ concerning the Gabcíkovo-Nagymaros Project of locks and dams on the River Danube, Judge Weeramantry chronicled the concern for future generations across several continents: “... land is never the subject of human ownership, but is only held in trust, with all the connotations that follow of due care, wise management and custody for future generations” (654).
EC communication on the precautionary principle
The precautionary principle states that if it is suspected that an action or policy risks causing harm to the public or to the environment, in the absence of a scientific consensus that the action or policy is harmful, the burden of proof that it is not harmful falls on those taking the action. The EC issued a
communication on the precautionary principle (656) in which it adopted a procedure for applying the concept without providing a detailed definition. Paragraph 2 of Article 191 of the Lisbon Treaty (657) states that:
Union policy on the environment shall aim at a high level of protection taking into account the diversity of situations in the various regions of the Union. It shall be based on the precautionary principle and on the principles that preventive action should be taken, that environmental damage should as a priority be rectified at source and that the polluter should pay.
After the adoption of the EC’s communication on the precautionary principle, the principle has come to inform much EU policy, including areas beyond that of environmental policy.
Finland’s Committee for the Future
The Committee for the Future was established in 1992 when the Eduskunta, the Finnish parliament, adopted a resolution requiring the government to provide it with a report on long-term developments and options for the country and that a similar “futures report” be submitted at least once each electoral cycle. The committee was made permanent in 2000 with an overall task of “[conducting] an active and initiative-generating dialogue with the government on major future problems and means of solving them” (658).
The committee claims to hold debating forums across Finland, employ iterative research methods, new data technologies and comparative international studies, and listen to “young people as well as older and experienced individuals in the public discussion”. Specific tasks include:
�� preparing documents for parliament, including its response to the government’s futures reports;
�� debating future development factors and development models;
�� analysing research regarding the future, including methodologies; and
�� serving as the parliamentary body responsible for assessing technological development and the impact of science and technology on society.
Future reports have included major global, environmental and other structural challenges, the effects on Finland of European development, factors in Finland’s competitiveness and success, and regional development (659). The theme of the futures report for the 2007−2011 electoral cycle is climate and energy.
The committee has also assumed an active role in generating independent initiatives and drafts its own reports on Finland’s future. A key aim is to revitalize democracy, for which it has produced a range of proposals (660).

122 Review of social determinants and the health divide in the WHO European Region: final report
Hungary’s Parliamentary Commissioner for Future Generations
Hungary instituted a Parliamentary Commissioner for Future Generations in 2007. By the beginning of 2010, the commissioner had received more than 400 petitions from the public and completed 97 investigations, many of which focused on planning, noise and air pollution. The commissioner’s reports, following investigation, are submitted to the relevant public bodies; he is also involved in legislative consultations and proposals.
The commissioner’s task is “to ensure the protection of the fundamental right to [a] healthy environment” (661). Defending the interests of future generations is an important focus of his mandated advocacy and investigative powers.
Israel’s Commission for Future Generations
The Knesset, Israel’s parliament, established a Commission for Future Generations in March 2001 to defend the needs and the rights of future generations, with a specific focus on creating “a dimension of the future that would be included in the primary and secondary legislation of the State of Israel” (662).
The commission’s scope included natural resources, education, health, technology, law, development, demography and any other matter of special concern to future generations as determined by the Israeli Constitution, Law and Justice Committee.
Subcommittee on the Future Development of Latvia
The Subcommittee on the Future Development of Latvia was established in 2003, comprising 13 members representing all groups in Latvia’s parliament. The submission from the parliament describes its tasks as follows:
�� to draft a single document for Latvia’s future development, including the formulation of the vision of Latvia in 15−20 years, which would facilitate Latvia’s sustainable development and improve the social welfare and safety of each member of society;
�� to develop cooperation with different public institutions, scientists, youth and other members of society, and work together to seek out opportunities to ensure Latvia’s more rapid development and competitiveness; and
�� to organize and listen to lectures on various themes that are important in science and economics and therefore to serve as a useful source of information for achieving goals set by the members of parliament (659).
The mechanisms described above were principally developed to ensure intergenerational equity and sustainability on environmental issues, but the principles can be applied more widely to include, for example, the social determinants of health more generally.

7 Governance, delivery and monitoring systems
7.1 Background
Addressing the social determinants of health requires the development and implementation of policies, practices and regulatory frameworks capable of influencing the norms, values and behaviours of nations, communities and individuals. These are partly situated in governance structures and systems at each level of governance − local, regional, national and transnational. While a whole-of-government approach is needed to bring actions on the social determinants of health together, there is much that can be done by individual sectors such as health, social protection, finance and environment and at different geographic levels.
Systems need to be capable of generating and using evidence and monitoring effects to ensure the effectiveness of actions. Evaluation and assessment evidence about the effects of existing policies is needed to allow policy refinement and knowledge development about other actions and the impacts they might yield.
This section is focused on the governance required to improve health equity, the type of health systems needed for the prevention and treatment of unequal health burdens and the evidence, data and monitoring systems required to support action on inequities in health and its social determinants.
7.2 Governance
7.2.1 Introduction
“Governance” typically describes the institutions, rules and norms by which policies are prioritized, developed and implemented and through which accountability is enforced. This review sees governance as encompassing more than simply
Governance, delivery and monitoring systems 123
Recommendation 4(a).
Improve governance for the social determinants of health and health equity. This requires greater coherence of action at all levels of government − transnational, national, regional and local – and across all sectors and stakeholders − public, private and voluntary.
Specific actions
(i) Develop partnerships at all levels of government that enable collaborative models of working, foster shared priorities between sectors and ensure accountability for equity.
(ii) Ensure that the coherence of actions across sectors and stakeholders is strengthened to achieve:
(1) sufficient intensity of action – increase the resources devoted to redressing current patterns and magnitude of health inequities;
(2) long-term investment and sustainability of actions; and
(3) levelling-up the gradient in health equity and the social determinants of health.
(iii) Ensure that the different needs, perspectives and human rights of groups at risk of marginalization and vulnerability are heard through their involvement in decision-making processes, with effective mechanisms for adequate participation, engagement and consultation with all parts of civil society.
(iv) At regional level, ensure the Regional Office and its partner United Nations organizations in Europe work together through the “United Nations collaboration mechanism” to have a voice in transnational agreements affecting the social determinants of health.
(v) Strengthen WHO’s role and capacity to better advise Member States on developing policies on the social determinants of health and advocate for health equity in other relevant sectors.

124 Review of social determinants and the health divide in the WHO European Region: final report
7.2.2 Governance for health
Governance for health comprises:
… the attempts of governments or other actors to steer communities, whole countries, or even groups of countries in the pursuit of health as integral to well-being through both a whole-of-society and a whole-of-government approach (20).
The whole-of-government approach outlined in this review integrates equity within the “Health in all policies” approach as:
�� providing a way of achieving the multiple benefits that accrue to sectors through the shared priorities outlined above; and
�� ensuring equity is integrated into policy across all parts of government and society.
“Governance for health” concerns policies, expenditure and decision-making related to responsibility for health outcomes (both intended and unintended) across the whole of government and society at all levels, including those that result from activities outside the health sector. This is a broader concept than governance of the health sector. Reducing inequities through action on social determinants needs to be embedded in an even broader approach that governs for health equity, reflecting the conceptual approach to health in society outlined in Chapter 2 and in the governance for health in the 21st century study (20), which can be summarized as follows.
�� “Governance for health and well-being” is a central building block of good governance; it is guided by a value framework that includes health as a human right, a global public good, a component of well-being and a matter of social justice.
�� The expanded understanding of health includes considering it as an emergent property of many societal systems: it therefore requires action in many systems, sometimes with and sometimes without the involvement of the health sector.
�� Whole-of-government and whole-of-society approaches reflect this reality and are grounded in strategies that enhance joined-up government, improved coordination and integration, and diffusion of responsibility for health throughout government and society.
�� “Governance for health” builds on the experiences gained in the health arena with intersectoral action, healthy public policy and “Health in all policies”.
a set of regulations or bureaucratic mechanisms. As the United Nations Educational, Scientific and Cultural Organization (UNESCO) states, governance is also about creating and reinforcing power relationships in society (663). Fundamentally, governance systems define who develops policies, how resources are distributed across society, how governments are held accountable, and by whom.
Governance systems should strengthen accountability and coherent action across sectors and stakeholders at all levels if they are to reduce inequities in health through action on social determinants. The aim is to prioritize actions to tackle inequities in health and social determinants of health, increase resources and make better use of what is available so as to redress the current patterns and magnitudes of health inequities and improve the distribution of determinants across the population. Governance arrangements to achieve health equity that are capable of building and ensuring joint action and accountability of health and non-health sectors, public and private actors and citizens need to be in place if this is to happen.
As described in Chapter 2, many of the determinants of health equity are also shared priorities for other sectors – climate change mitigation, education, social inclusion/cohesion, poverty reduction and community resilience and well-being, for example. Governance matters not only to prevent and mitigate the effects of actions that are likely to produce inequity in health, but also to enhance the opportunity to position and sustain health and health equity as important assets that contribute to achieving other societal goals and values (shared societal goods). These links enable more effective concerted action across sectors which, with due attention to their distribution, will produce benefits for health and health equity but also other desirable outcomes, such as community resilience, mitigation of climate change and improved education.
The review does not seek to prescribe an ideal or “best” governance structure that countries should adopt. Instead, based on evidence from research literature and operational case study material presented in the task group report on governance and delivery (664), it draws out a set of general functions that need to be embedded in a country’s governance arrangements to deliver improved equity in health through action on social determinants. Recommendations are therefore deliberately generic, in recognition that further debate and work in this area is needed to enable appropriate adaptation of recommendations to different policy-making levels across diverse cultures, traditions and development conditions of Member States.

Governance, delivery and monitoring systems 125
These trends and examples highlight the increasing connection between domestic and foreign decision-making processes and affect social determinants. Kickbusch & Gleicher (20) indicate how decisions and effects are increasingly interdependent and complex and identify where solutions need to be coproduced. This is highly relevant to governance for health equity, where many of the factors that shape the patterns and magnitude of health inequities within a country (including nature and type of employment, housing and environmental conditions, income level and security, education and community resources) lie outside the direct control of ministries of health. The manner in which these factors are distributed in a given society can be positively influenced by ministries of health, the actions of other government sectors and other stakeholders (public and private) that influence each country’s decision-making processes and outcomes. Health equity needs to be pursued as a coproduct of the actions of multiple stakeholders, shaped by decisions made in many different arenas of government and in corporate and public life.
7.2.4 Approaches to governing for social determinants of health and health equity
Kickbusch & Gleicher (20) highlighted five important features of “governance for health” that should be considered when embarking on whole- of-government/whole-of-society approaches. They are governing through:
1) collaboration
2) citizen engagement
3) a mix of regulation and persuasion
4) independent agencies and expert bodies
5) adaptive policies, resilient structures and foresight.
These features highlight new roles and ways of governing for health using partnership models and engaging diverse stakeholders to create and sustain:
�� a moral case and political support for equity in health and its social determinants;
�� the necessary legislation, regulations and working practices to strengthen joint accountability for equity across sectors;
�� mechanisms and resources that enable regular joint review of progress;
�� guidance and intelligence to inform decisions and to improve the design and assessment of policies, interventions and indicators;
�� The actions needed to improve health and reduce health inequities require new systems-based governance and delivery mechanisms that take account of interdependencies, complexity and the need for whole-of-government and whole- of-society coproduction of population health.
�� New health governance and delivery systems capable of delivering improvements in social determinants of health are multilayered and multidimensional and require increasing empowerment of local citizens to create shared health value.
�� Health is increasingly recognized as a critical economic and social asset, the realization of which can add value to existing economic investments, business efficiency, effectiveness and performance. Government has a critical role in determining the conditions through which health governance and delivery of improvements in the social determinants of health and health equity are achieved (20).
7.2.3 Global governance systems
A wide range of social, technological, political and cultural factors is making effective governance a more complex task at global and country levels as the “locus of control” for governance dissipates across societies.
At global level, as discussed in Chapter 6, governments have ceded national control and sovereignty of some policies to international trade agreements, multinational companies and wider legislative frameworks established on the basis of political and legislative unions. This highlights how national policy commitment to equity in health and the social determinants is shaped by factors and agencies beyond local and national borders. These agencies include external bodies that influence national policy priorities and commitment, such as United Nations agencies, the EC, development banks, unilateral and multilateral donors and foundations. Some of these influences can be positive for sustaining a health-equity agenda and increasing understanding and support for acting on social determinants and their distribution in society. They are able to give political imperative and weight to the issue in national and local decision-making processes through incentivizing commitment. Examples include use of the open method of coordination by the EU in relation to Roma integration, social protection and social inclusion and the use of common development frameworks. Influences from beyond national borders can also, however, have negative and unintended consequences on social determinants (see Chapter 6)

126 Review of social determinants and the health divide in the WHO European Region: final report
Legislation: human rights law
Human rights law has a key role in governance for the social determinants of health, including providing a route to promoting social action to tackle health inequities and for holding governments and other actors to account for failing to act. Human rights generate state accountability for the values they protect, which can provide the basis for justifying the implementation of policies to tackle health inequities. There is much in the social determinants of health that human rights law is not intended to achieve, however, such as levelling the gradient in social conditions that affects everyone.
Human rights law consists of a legally binding international value system that addresses matters of social (in)justice and can provide a useful supplementary tool for addressing some specific inequities in the social determinants of health.
Human rights principles
The International Covenant on Economic, Social and Cultural Rights (667,668) identifies a set of principles covering the provision of different types of service. For health-related services, these are availability, accessibility, acceptability and quality, and for education they are available, accessible, acceptable and adaptable (667). It is increasingly recognized that the principles of accountability and participation are important conditions underlying the right to health (669,670).
Participation
Governance for health needs public support and participation, including prioritizing opportunities for the most vulnerable to have a say in how their specific vulnerabilities should be addressed. Potts stresses that an important purpose of participation in the context of the right to health is to recognize and respect difference and diversity within the population and ensure inclusiveness in the development of health (670). This is also important in the context of health inequities: a participatory decision-making process can promote the prioritization of health inequities and their underlying causes.
Obligations
There is a distinction between three types of state obligations (667,668). The right to health, like all human rights, imposes three types or levels of obligations on states: the obligations “to respect”, “to protect” and “to fulfil”. This is a useful tool for identifying states’ legal obligations in relation to a right to health (671).
When it comes to the underlying determinants of health, “obligation” implies a duty on the part of governments to refrain from denying or limiting equal access to all health-related services and to abstain from enforcing discriminatory practices as state policy (672).
�� a means of capturing learning and strengthening the evidence base so that policy and governance responses can be designed and adapted to achieve a scale and intensity that will ensure some levelling-up of the gradient; and
�� use of evidence to sustain effective action on health equity over time and secure policy alignment.
This framework would give strong legitimacy to ministers, ministries of health and public health agencies to reach out and perform new roles in shaping policies to systematically address inequities in health and its social determinants. Important approaches include human rights and legislation (see Chapter 2), public and community participation, and engagement (see Chapter 5). The key reasons for failure in governance for health equity can be categorized as failure at conceptual, delivery-chain, control-strategy or public health system levels. These are described in detail in the task group report (664) and are discussed further in Chapter 8 (particularly Table 8.1).
7.2.5 Human rights injustice and health inequities
Adopting a human rights approach to tackling health inequity is an important component of governance for health. It will help to build the moral case for action and political support for equity in health and its social determinants and shape the necessary legislation, regulations and working practices to strengthen prioritization and accountability for equity.
Moral arguments
Moral arguments can be translated into effective action on the social determinants of health. History and experience show that social commitment to the values of equity, fairness and social justice in the political arena is insufficient to guarantee equitable, fair and just outcomes, but there are examples where moral arguments, based on the capability approach, have been translated into health policies.
The Swedish Government, for example, argues that the objective of public health policy is to create social conditions to ensure good health on equal terms for the entire population (665). The national committee that advised the government of the Netherlands in 2001 started from the assumption that existing differences in health at least partly rank as unjust and that the government is responsible for achieving a reduction of health inequities. This was based on the argument that health should be seen as a prerequisite for individuals forming the options needed to structure their lives as far as possible according to their own ideas (666) (see discussion of the capabilities approach in Chapter 2).

Governance, delivery and monitoring systems 127
staff working as demographers and community outreach service providers. This powerful group of stakeholders were able to access diverse data, discuss ideas and identify challenges through informal contacts with stakeholders within and outside of government. Engaging with and drawing on local knowledge of communities and the intended beneficiaries of the policy was a key factor in shaping priorities for action. External agencies were engaged to broker dialogue between stakeholders and support use of best available evidence and practice from across Europe and internationally. Specifically, this involved WHO collaborating centres and technical units with expertise in social determinants and cross-sectoral investment for health and equity.
Local and community engagement
As indicated in Chapter 6 and section 7.2.5, local people and communities need to be involved in defining the problem and agreeing solutions and implementation approaches. This is an important aspect of governing for equity in health through action on social determinants for two main reasons.
First, it is common in transition economies for unregulated for-profit private provision to increase. Where governance capacity and mechanisms for regulation, guidance and enforcement are generally weak, providers are not driven by considering need, but by who can pay. Results in health care include rising basic health and medical care costs and profit-driven criteria for access to, and availability of, services (673). The impact is borne by the whole of society, but with more catastrophic effects on those with poor resources. Those who can’t afford to pay for health care delay seeking medical help and spend proportionately more of their household income on treatment and care. Studies show how these impacts are not only bad for those affected and the performance of the health sector, but also have a direct and indirect knock-on effect for the achievement of poverty-reduction strategies through lowering human development potential. The costs are therefore shared by governments and the international donor community. In this way, health equity impacts are the responsibility of all stakeholders in society.
A second reason stems from studies evaluating country experiences of implementing inequity-reduction policies, strategies and programmes, which indicate a need to place more emphasis on local solutions to tackle stubborn patterns of inequities, including health inequities. Despite good intentions, findings suggest that policy design often fails to reflect the realities of the social, cultural and economic factors affecting the lives and assets of people who have poor resources and are hard to reach. The result is interventions with limited impact or, even worse, those that unintentionally benefit some groups more than others, widening health gaps within countries (481).
7.2.6 Horizontal and vertical integration of actions
Differences in governance structures and capacity levels
European Region countries differ significantly in their subnational governance structures. This may seem self-evident, but the complexities and vastly different structures and levels of power need to be explicitly acknowledged and incorporated into policies and interventions. Regions and local areas that have tax-collecting powers have considerable autonomy from national governments. This heterogeneity leads to the development of very different levels of capacity to build strong action programmes to tackle the social determinants of health and inequities in health across systems and countries. In some instances, the legal and financial context is even significantly different across tiers that have similar names and appear to operate at the same levels within the wider system, such as differences in role and scope of control between municipalities in Spain and the Netherlands despite their apparently similar position in the system. All these factors strongly influence the autonomy with which various forms of local government can act on the social determinants of health.
Decentralization of responsibilities and, consequently, accountability for policy (results) is a strong feature of governance systems in Europe. Subnational level (county, oblast, region) has increasing autonomy in relation to social and economic decisions and investment, many of which relate to the social determinants of health and health equity (housing, environment, water and sanitation, community safety and urban and rural development, including employment and business development). At the same time, health is frequently a centrally managed and organized function. This creates challenges and opportunities for ensuring that health and equity are considered in subnational-level policy-making and investment frameworks.
Examples such as that from Košice, the largest self-governing region in the south-eastern part of Slovakia, illustrate subnational-level opportunities and responses to inequities in the social determinants of health. The regional parliament formally adopted a health chapter into its regional development plan in 2009. Goals for addressing the determinants of health of those with fewer social and economic resources and with poorest health status have been included as priorities across sectors. Implementation actions are reflected in regional investment frameworks and funding flows. While mechanisms to advance the work are mainly formal and embedded in core planning, accounting and monitoring systems at regional level, the process was coordinated by a multistakeholder group including the regional institute of public health, chair of the Košice regional government, researchers working on social and economic inequities and regional authority

128 Review of social determinants and the health divide in the WHO European Region: final report
challenges, however, in taking practical action on improving the social determinants of health and tackling inequities in health. Although local government may be better placed to respond to local needs, a wider legislative context creates the conditions that shape its ability to act.
Localization, decentralization and delegated powers may bring tension between different levels of government (vertical conflicts) or among local government agencies (horizontal conflicts). Problems in securing alignment of overall national policy objectives with subnational interventions and local project objectives may undermine coherence and synergy.
It cannot necessarily be assumed that subnational government has sufficient capacity and resources to maximize health gain through the social determinants of health and to implement policies for social determinants for which they are responsible: a well-established organizational development programme is necessary (677−679).
Grady et al. (680) identified four important themes in local implementation of a social determinants of health approach to inequities in health: differences in governance structures and capacity levels, expenditure levels and identifying funding, the wider legislative framework and accountability.
Strategic focus
All the above factors affect disadvantaged people more than others. They compound the effects of social and economic determinants of health and reflect the wider policy context in which land use, transport and development policies are shaped. Strategic decisions determining local areas affect the proximity of facilities, access to employment and income, and access to high-quality green spaces and viable modes of transport, therefore determining where people live and work and their mental well-being and physical health. People with better access to these resources, services and life chances enjoy better health proportionately across that gradient.
A strategic and concerted focus on the social determinants of health requires action across the life-course to improve the conditions of daily life. Shifting to a more asset-based approach to achieve this means engaging with communities and developing robust local partnerships orchestrated by local authorities with timely strategies to deliver health equity.
Health and equity in health need to be assessed for strategic plans and detailed neighbourhood decisions to ensure that they address, and do not introduce or further exacerbate, inequities in health. Greater focus on the social determinants of health could be incorporated into strategic environmental assessments and health and equity impact assessments.
7.2.7 Role of subnational government in tackling the social determinants of health
Subnational government’s role, particularly at local level, is being increasingly recognized. The EU has acknowledged that subnational government can make a vital contribution by fostering exchange of good practice and measuring progress (674), while other international actors, including WHO and the CSDH (675), have highlighted its importance in taking action and interplaying with national government in tackling the social determinants of health.
The types of interventions that are possible differ significantly across local authorities. Local authorities in CCEE, in particular, have a big role in providing social services and tackling poverty, but resources depend on the national economic situation and, currently, on the effects of the economic downturn.
Two key reasons underpin this recognition. First, the social model of health is being given increased attention. It emphasizes good health results from positive socioeconomic and environmental factors, with health largely being socially determined (676). In contrast to the curative, medical model of health, many of whose determinants lie within the purview of the health care sector (which may or may not be controlled by local government), local government usually has primary responsibility for planning and/or delivering many services that are crucial to addressing the social determinants of health, such as education, transport, housing and urban planning. The literature highlights the fact that local authorities are also often in a strong position to orchestrate a wide range of local actors to stimulate action in a way the health care sector alone cannot.
Second, some commentators argue that the structures underpinning subnational government, especially decentralization, have inherent potential to stimulate change by reducing central influence and promoting local autonomy. As Litvack et al. (677) have shown, reducing central influences and promoting local autonomy may lead to more flexible and efficient policies, as local authorities are better able to respond to local needs and may have greater knowledge of, and sensitivity to, local problems. De Vries (678) has argued that centralized systems are tempted to impose decisional overload as decision-makers try to overrule the complexity of local problems. In turn, devolution to subnational government must be accompanied by further devolution to individuals and communities to extend participative democracy.
Local authorities can play an important role in making decisions and implementing policy on the social determinants of health and have the potential to be key actors in reducing inequities in health and improving social welfare for citizens in the Region. Government at subnational level also faces several

Governance, delivery and monitoring systems 129
Equity-in-all-policies approaches will strengthen action coherence across sectors (policies, investments and services) and among stakeholders (public, private and voluntary), increasing resource flows to redress the current patterns and magnitude of health inequities and improving the distribution of determinants of opportunities to be healthy across the whole population.
Examples of good practice
A review by the task group on governance of published and unpublished meeting reports and national strategy documents for countries across Europe (664) describes actions to create and sustain political support for (health) equity as a societal good and strengthen coherence of actions among stakeholders and across policy sectors to achieve inequity-reduction goals. The delivery and implementation of these is discussed in Chapter 8.
Policy coherence
Local government is central in meeting the needs of specific communities, but proliferation of local actions makes evaluation difficult and policy coherence challenging. Coherence becomes more difficult when operating in partnership within a complex, adaptive system to address the social determinants of health in which outcomes are unpredictable and unintended (681). Assessing impact also requires a high level of understanding about, and monitoring of, local actions to enable wider dissemination if something is seen to be working but also to determine whether a change in focus is needed if an intervention is not delivering the expected outcome. The search for coherence therefore raises important questions, particularly about the effectiveness of scaling-up small interventions and the transferability of locally based interventions into different contexts.
Denmark, the Netherlands and Sweden developed national programmes or targets to enforce policy coherence, but they often refer to a specific group (such as children) or a social determinant of health (physical environment or working conditions, for instance). The success of this approach is unclear, but what is clear is that positive alignment of policy at all levels is critical in achieving the synergy and impact needed to address inequities in health and level-up the social gradient (2). This can be considered for local government at two levels. First, there is the task of achieving policy-making coherence at national, regional and local levels; then there is achieving strategic fit and coherence between local strategic plans and objectives involving partner agencies and the role and remit of discrete projects to deliver these objectives (682).
Accountability
Lack of accountability for addressing social determinants of health at executive level in local authorities raises important questions if they are to work effectively on the social determinants of health. Accountability alone is not a panacea, however – where it exists, it is often notional or spread so widely across the executive as to be ineffectual. Clear leadership is also required.
7.2.8 Equity in all policies
As discussed above and in Chapter 1, improving health equity is a cross-sector and cross-government endeavour. Governing for equity in health therefore involves a commitment not only to valuing health, but also to the concept of “Equity in all policies”, which provides a way of achieving mutual benefits that accrue to multiple sectors and a public good that produces benefits for the whole of society (10).
Case study: whole-of-government approach to social inclusion in Poland
The social inclusion strategy led by the Ministry of Labour and Social Affairs, reporting directly to the Prime Minister’s office, provides an illustration of the mix of characteristics of smart governance needed to build a whole-of-government approach to improve social inclusion. It involved a highly collaborative policy-development process that included a mix of formal and informal mechanisms across government, NGOs, community-based organizations and regional and municipal stakeholders and organizations. The 18-month process included a joint review of current and past policies and data on impact and trends in social inclusion. Appraisal of promising practices from across Europe using participatory methods (including stakeholder fora and roundtable events) helped to stimulate debate and inform options by building on stakeholders’ perspectives. Emphasis was given to informal meetings and discussions with the aim of exploring how stakeholders viewed social inclusion and how it could be better included in government policies and decision-making processes (budgets, reporting, resource allocation and local action). Further incentives for the approach came in the form of compliance with the EU cohesion strategy and the opportunity to access support through the EU Structural Funds mechanism.

130 Review of social determinants and the health divide in the WHO European Region: final report
Case study: whole-of-government approach to improving health in Kazakhstan
Kazakhstan has recognized the need to involve the entire government in activities that address root influencers of health and invest effort and resource into improving and modernizing the health system. Goals to improve health, with specific reference to the rural poor, are set out in the overall national development strategy (by 2030), the mid-term national development strategy (2020) and the health development strategy (2011−2015). Funding follows the priorities and is directed from the central core government budget to the ministry, sector or NGO responsible for delivering activities. Funding therefore matches priorities and is used to incentivize stakeholders’ involvement in contributing to common goals to improve health.
A clear accountability system is based on formal written agreements between the responsible ministries and an agreed and formal reporting system for recording health achievements. Kazakhstan therefore provides an example not only of planning and defining the role of other sectors in health, but also of developing budgetary and governance (accountability) mechanisms in which all other ministries and sectors have direct budgets and accountabilities and report to the government.
Kazakhstan has another mechanism through which it invests effort to promote participation and
involvement of the entire society and government in issues important to health. The “Public council”, co-chaired by the Deputy Prime Minister and Minister of Health, has representatives from all ministries, key national institutions, academia, civil society and the media. It discusses specific topics of importance for the health of the entire population that are either difficult or controversial among the public or propose the introduction of new technologies. It ensures the government and health ministry can access wide consultation and public discussion on these matters and make decisions based on the council’s conclusions.
The approach also involves strong partnerships with local authority “akim” [oblast governors] to ensure full subnational-level involvement in decision-making, priority setting and developing knowledge to enabled a better understanding of action options. For example, akim in the South Kazakhstan oblast, which has the country’s highest birth rate/infant mortality (maternal and infant mortality are recognized as key national priorities), coordinated action involving several international donor-supported projects, implemented a capacity-building programme for primary-to-tertiary-level health service providers and introduced an accountability scheme for every maternal death. Supportive supervision has been introduced for staff and the oblast has recently become a quasi-resource centre for neighbouring oblasts.
Case study: whole-of-government/ whole-of-society approach to reduce inequities in United Kingdom (Scotland)
Concerns about poor indicators of social and economic progress, including inequities in life chances and outcomes, and the related shortfall in human development potential across society was the impetus for a whole-of-government approach to reducing inequities under the national framework “Scotland performs”. Addressing the social and economic costs to society of poor health and inequities in health between social groups resulted in the development of the “Equally well” framework. A ministerial task force with clear terms of reference was established to guide the work, reporting to the First Minister (equivalent of the Prime Minister) and working for 12 months to review evidence, model policy options and debate priorities for action.
Methods included expert panels, seminars and public consultations to ensure involvement of a wide range of stakeholders from national and local authorities, NGOs, academia, business and public service providers. This enabled many perspectives and areas of knowledge to inform policy options and generated testing of solutions. A review of delivery capacity and systems was carried out after priorities had been formulated to ensure the
goals could be delivered successfully. This served to identify where delivery systems needed to be strengthened and/or adjusted prior to launching the “Equally well” framework.
Implementation has been under way for five years and includes formal agreements on priorities, responsibilities and relationships and an accountability framework for action at national and local levels. A clear and joint process for review and ongoing assessment has been established using instruments such as single outcome agreements between the Scottish Government and local-level planning units called community planning partnerships. These set out how each partner will work towards improving outcomes for local people in a way that reflects local circumstances and priorities.
Public reports are published regularly, with debates on progress and independent reviews held to inform policy adaptation over time. An important feature of the approach was the introduction of test sites, which enabled policy to be examined in a structured way and informed scaling-up of effective actions to tackle critical problems. Capacity building for public sector staff and other partners has been ongoing to ensure policy is mainstreamed across government and that human resource capacity to reduce inequities is strengthened.

Governance, delivery and monitoring systems 131
7.3 Priorities for public health, ill health prevention and treatment
Recommendation 4(b).
Develop a comprehensive, intersectoral response to the long-term nature of preventing and treating ill health equitably to achieve a sustained and equitable change in the prevention and treatment of ill health and the promotion of health equity.
Specific actions
Prevention
Ensure that actions on preventable health hazards are based on addressing the substantial differences in exposure within and between countries, including:
(i) reduce harmful alcohol consumption by, for instance, introducing a tax on alcoholic beverages that is proportional to the alcohol content;
(ii) initiate wider actions to reduce fats, particularly transfats, in diet and control the growth of fast-food consumption;
(iii) take action to reduce smoking under the Framework Convention on Tobacco Control; and
(iv) encourage active living, focusing on needs across the social gradient.
Treatment
Reduce differential access to good-quality health care services within and between countries, including actions to:
(i) make health care systems more equitable − universal health coverage is required to provide a critical foundation for addressing health inequities; and
(ii) remove financial, geographic and cultural barriers to the uptake of health care services (such as copayments) and ensure adequate resource allocation that takes account of extra need in disadvantaged areas.
Strategies
(i) Ensure that strategies to address inequities within and between countries (including those related to gender):
(1) develop systems able to adequately assess, plan and deliver sustained action to reduce health inequities;
(2) improve the capacity of public health systems to address health inequities;
(3) strengthen health-promotion, health-protection and disease-prevention systems to ensure universal coverage for all social groups, and link these to policies and programmes that specifically address the determinants of lifestyles and behaviours;
(4) improve accessibility and quality of health care services; and
(5) ensure no adverse effects from transnational agreements and regulations.
(ii) Provide external support for developing and implementing these strategies to address inequities in countries where they are weakest, including a number of countries in the central and eastern parts of the Region.
(iii) Ensure a balance between strategies that have short-, medium- and longer-term results and between simpler and more complex integrated interventions. Specific areas for action are:
(1) strategies that give societies, groups and individuals greater control over their exposure to preventable hazards, such as regulation and control over the workplace and the environment, tobacco, alcohol and food content, availability and pricing and addressing societal norms and values;
(2) design screening programmes to be accessible by all, particularly the most vulnerable and disadvantaged, for cardiovascular risk factors and early detection of cancers; and
(3) ensure effective implementation of infectious disease strategies (for tuberculosis and HIV/AIDS, for example) that disproportionately affect socially disadvantaged and vulnerable people, including addressing the causes of vulnerability, gender inequities and adequate, sustainable access to screening, diagnosis and treatment services.
(iv) Monitor and assess population health equity impacts across these recommendations disaggregated by sex, age and 2−3 key socioeconomic determinants.

132 Review of social determinants and the health divide in the WHO European Region: final report
Status and trends in alcohol intake and alcohol-related harm vary among countries and different parts of the Region. For example, about 25% of the difference in life expectancy between western and eastern Europe for men aged 20–64 years in 2002 was attributed to alcohol (281). Alcohol also contributes significantly to the gender gap in life expectancy in many countries, especially in the eastern part of the Region (687). Socioeconomically disadvantaged people suffer more from alcohol-related ill health than those who are affluent, even if their overall consumption is lower, because of the pattern of consumption, the quality of alcohol consumed and factors that make them more susceptible to the ill effects (683).
Multilevel analyses from various studies suggest that the groups most prone to high-risk alcohol consumption are men, single persons and people with low levels of education. These groups seem to be even more at risk when it comes to binge drinking, with single and unemployed men at highest risk (688−693).
SES and alcohol consumption
A 2005 review (694) of CCEE and the CIS concluded that a poor economic situation is strongly associated with higher levels of alcohol intake and more risky drinking behaviour. Psychosocial factors were seen as playing a crucial role in generating social inequities in health. The review stated: “alcohol may be one of the major conduits through which psychosocial stress is translated into poorer health and higher mortality”.
Binge-drinking is far more common among lower socioeconomic groups, as illustrated in country studies in Armenia, Belarus, Georgia, Kazakhstan, Kyrgyzstan, the Republic of Moldova and the Russian Federation (695) and in Nordic and western European countries (295). As a result, those with lower SES for a given level of overconsumption tend to have problematic drinking patterns and dependence, whereas those with higher SES are likely to drink more often but to consume smaller amounts (696,697). The health damage alcohol causes may be greater for manual workers than for professionals (698). In Sweden, for example, alcohol-related diseases and injuries in men were two to three times greater among manual workers than among civil servants, even when their level of alcohol consumption was similar (699).
Gender and alcohol consumption
The EU multinational study on gender, culture and alcohol problems found clear and large differences between men and women throughout Europe in all aspects measuring involvement with alcohol (abstinence, frequency, volume), quantities drunk and heavy episodic drinking. This accords with what has been observed previously and a typical male/female ratio in behaviour was 2−3, although there was significant variation by country and measure of drinking (698).
7.3.1 Introduction
This section examines the health system’s role in tackling inequity in ill health across Europe. Differences in survival patterns between the eastern and western parts of the Region are almost entirely a result of the very high levels of young and middle-age adult mortality due to CVD (in some cases 90%) and sudden deaths from injury (see section 3.2). Cancer mortality also contributes to these differences, although to a much smaller degree. Wide inequities in ill health related to socioeconomic circumstances exist across the whole Region (see Chapter 3) resulting from the social determinants of health, the “causes of the causes”. They are often mediated through health behaviours (smoking, alcohol use, obesity) and result in inequities in the risk and distribution of diseases (see Chapter 2).
The section focuses on some key illustrative examples of strategies that need to be developed to take effective action on the links between behaviours, diseases and their social distribution. The exemplars chosen are for behaviour-based interventions (the harmful use of alcohol), a common life-threatening disease (CVD) and a transnational public health threat (TB). Guidance is provided on the key features of strategies to reduce inequity.
7.3.2 Prevention of alcohol-related ill health
Alcohol use
Harmful use of alcohol is a major risk factor for many noncommunicable diseases such as CVD and cancer. It is also associated with communicable diseases like TB and HIV/AIDS and significantly contributes to unintentional and intentional injuries. This leads to a significant disease burden, premature death and social and economic consequences such as unemployment and stigmatization (281,683−685).
Rates of alcohol consumption across the Region and their effects were described in Chapter 3. In summary:
�� alcohol intake in the Region is the highest in the world, with an average of 10.8 litres of pure alcohol consumed per person aged 15 and over in 2007 (3);
�� alcohol has been linked with high mortality in CCEE and the CIS and heavy drinking, particularly among men, has probably contributed substantially to fluctuations in mortality during the economic transition in these countries;
�� there is a close relationship between a country’s total per capita alcohol consumption and its prevalence of alcohol-related harm and alcohol dependence; and
�� the European Region has the highest proportion of total morbidity and premature death due to alcohol (280−283,686).

Governance, delivery and monitoring systems 133
Impact of policies for reducing alcohol consumption
Much of the literature describing studies of policy-level interventions to reduce alcohol consumption, such as increasing taxes on alcohol or restricting hours of sale, draw from a narrow contextual evidence base (usually the Nordic countries and/or United Kingdom (England)) (700,701). One that presented a policy appraisal for the United Kingdom Government of options in reducing harm among different population subgroups (701) made the case for appraisal of policy options for reducing alcohol-related harm to account for population heterogeneity and complexity. The only subgroups considered in the study, however, were defined by age, sex and level of drinking (moderate, hazardous, harmful). They modelled the impact of the policy options and their differential effects on health, crime and other societal outcomes. A 50 pence minimum price per unit of alcohol showed the greatest employment and health savings over a 10-year period. There was a 6.9% reduction in total population consumption (5.6% among males, 9.3% among females, 10.3% in harmful drinkers and 5.9% in hazardous drinkers). The report indicated:
Accounting for heterogeneity shows more clearly the trade-offs between groups and stakeholder interests that are being made when a decision is taken … Health savings are proportionately smallest in options setting minimum prices at a very low level and highest for a ban on off-trade discounting, higher minimum pricing options (50p and higher) and general price increases (701).
It is important to go beyond disaggregation by age, sex and harmful levels of drinking, particularly given the different patterning of the social determinants in relation to alcohol-related harm.
The task group on prevention and treatment proposed several actions that should form part of an effective alcohol prevention and treatment strategy.
ALC1.1. Develop a comprehensive alcohol strategy based on the recommendations of the global WHO Expert Committee on Problems Related to Alcohol Consumption (685). They identified seven effective strategies and interventions to decrease alcohol-related harm, including taking an equity focus (specific initiatives to tackle the disproportionate and inequitable impacts and consequences of alcohol-related harm for less-privileged groups in the population). Where a Member State has an existing alcohol strategy, it should be reviewed to identify social groups most likely to be disproportionately affected by alcohol-related harm and interventions developed in line with the committee’s seven effective strategies.
Case study: developing good practice in primary care management of hazardous and harmful alcohol consumption in the EU
The Primary Health Care European Project on Alcohol was funded by the EU health programme and the Department of Health of the Autonomous Government of Catalonia. This European project aims to integrate health-promotion interventions for hazardous and harmful alcohol consumption into primary health care professionals’ daily clinical work by preparing:
�� European recommendations and clinical guidelines on best practice for health care purchasers and providers;
�� a training programme for primary health care professionals;
�� a comprehensive Internet database on good practice; and
�� a series of country-specific dissemination strategies. Source: Primary Health Care European Project on Alcohol (702).
Case study: equity focus in policy to reduce harmful use of alcohol in Estonia
Estonia is a country with high alcohol consumption and where alcohol dependence and other alcohol-related harms pose major public health and social concerns. Per capita consumption in 2010 was estimated to be 12.52 litres in absolute alcohol per capita (3), decreasing from 15.96 litres in 2007.
Noting that the WHO global strategy recommended the inclusion of an equity focus in policies and approaches to reduce the harmful use of alcohol, the National Institute for Public Health and Ministry of Health undertook an analysis of social inequalities in alcohol consumption patterns. Data from two recent surveys of health behaviour among the adult population and school-aged children (HBSC) and alcohol-control policies in Estonia were reviewed (703).
The analysis was informed by global work on social determinants and equity in alcohol use (683,704) and focused on examining differentials in patterns of alcohol consumption according to different social and sociodemographic determinants – sex, age, place of residence, income, nationality, family structure, level of education and economic activity (FAS among adolescents) – and risk behaviours such as smoking among adolescents. It also analysed the extent to which these are socially determined.
The analysis provides an overview not only of the patterns of alcohol consumption and their impact, but also of what alcohol interventions have been implemented in Estonia in the past and how far policy responses and structures have lessened or increased inequities. It will be used to inform policy development to reduce harmful use of alcohol with a view to lessening inequities and tackling key social determinants of harmful alcohol use (703).

134 Review of social determinants and the health divide in the WHO European Region: final report
ALC5.1. Expand and enhance current routine data collection on alcohol-related harm to include sex- and age-disaggregated data and indicators of SES, such as place of residence, level of income, employment status or level of education (see minimum criteria for health equity surveillance). Data currently available are largely disaggregated only by age, sex and patterns of drinking.
ALC5.2. Include a health, socioeconomic and gender-equity analysis in routine monitoring, reports and/or evaluations of the national alcohol strategy, including identification of key gaps in data collection and/or analysis.
ALC6.1. Develop an awareness-raising education campaign that changes and challenges understandings about:
(a) public perceptions and stigma about alcohol use;
(b) the nature of the social gradient in alcohol-related harm (the impact of harmful or hazardous alcohol use is disproportionately high among those of lower SES); and
(c) gender-related behaviours, perceptions of harm and stigma about alcohol.
This should include innovative ways of making drinking less alcohol more attractive (particularly to young people) and more socioculturally acceptable.
7.3.3 Prevention of smoking-related ill health
Chapter 3 describes levels of smoking across Europe. An estimated 1.6 million deaths from smoking occurred in the Region in 2011. Despite this high level of mortality, the reduction in smoking in Europe is a major public health success facilitated by progressive tobacco control policies that include health education and structural initiatives, such as high taxes. The effect, however, has been far less successful from an equity-and-health perspective, as the main positive effects have been achieved among middle- and high-income groups, resulting in a substantial widening of social inequities in health (38).
SES and smoking
Social differentials in smoking in the United Kingdom now explain much of the observed differences between social classes in mortality from CVD (51). A study of adult mortality rates across different social strata in England and Wales found the risk of dying from smoking was significantly higher in the lowest social strata than in the highest: it was four times more in Poland.
ALC2.1. Review and strengthen existing health system responses and services for those people with hazardous and harmful levels of drinking and/or already experiencing alcohol-related harm. From an equity perspective, there is significant room for improvement in how those who are most at risk of experiencing disproportionate harm from hazardous and harmful alcohol use are identified and treated and to improve responsiveness along the spectrum of care. This includes primary and preventive action, action for those who need more intensive interventions and the need for joined-up action with the social care and protection systems for, for example, homeless people.
ALC2.2. Implement the key actions for health services’ response as set out in the WHO European action plan to reduce the harmful use of alcohol 2012−2020 (280). This includes ensuring early identification and screening of people with hazardous and harmful drinking patterns and, through targeted implementation, ensuring that groups in the population least likely to use and receive primary care services (such as those who are homeless or without health insurance or a general practitioner) are able to access and benefit from them.
ALC3.1. Work with other sectors to implement population-based strategies for reducing the availability of alcohol. This could include regulation of opening hours, age of buyers and location of providers, increasing the price of (and taxes on) alcohol, mandatory restrictions on advertising and marketing, and monitoring the distribution of impact on different socioeconomic groups in the population (see ALC5.1).
ALC4.1. Develop tailored prevention, harm-reduction and treatment services and make them more accessible, appropriate and available for people with harmful and hazardous alcohol use who are more likely to experience disproportionate harm and consequences due to their socioeconomic circumstances. Those affected by alcohol use should be involved in the design and development of services such as sobering-up shelters for homeless people so they are not imprisoned for being drunk and disorderly. An incremental approach to tackling equity issues in alcohol use should be taken, beginning with a focus on remedying the health disadvantage and consequences by, for instance, focusing on those in lower socioeconomic groups, with lower levels of education and/or from ethnic groups exposed to disadvantage.

Governance, delivery and monitoring systems 135
A global-level review of social determinants and CVD identified the availability of healthy food and community infrastructure development as important upstream determinants for tackling the social determinants of CVD and its distribution (716,717).
7.3.5 Examples of disease-specific strategies
CVD
CVD causes more than half of all annual deaths in the Region, but the western part has seen one of the world’s biggest improvements in control over the past 50 years. Deaths from CVD have nevertheless reached the highest levels ever recorded in adults in the eastern part, especially the Russian Federation, where they are primarily recorded as sudden cardiac deaths. Rates in this part of the Region are characterized by dramatic changes through time (see Fig. 3.7).
The main modifiable behavioural risk factors for CVD are smoking, physical inactivity, unhealthy diets (high in saturated fats, sugars and salt and low in fruit and vegetables), excess alcohol consumption and obesity. People in the most disadvantaged groups are at greater risk of developing CVD (716,719), reflecting the distribution of risk factors such as alcohol, smoking and obesity associated with the social determinants of health and access to health services (716,720,721). There is also concern that CVD risk factors are increasingly affecting younger age groups, with long-term consequences for public health globally and across the Region (282,283,722,723). Legislative changes and taxation policies addressing these risk factors can often lead to short-term gains.
Between-country inequities are widening, with tobacco use growing fastest in low-income countries due to steady population growth coupled with industry targeting.
Studies have shown that a 10% price increase reduces smoking by as much as 8% in low- or middle-income countries, compared with about 4% in high-income countries (705). Not enough is known about the differential effects of indirect taxation on women and men and on low- and high-income consumers.
7.3.4 Prevention of obesity-related ill health
Obesity levels across Europe were described in Chapter 3 and the relationships with socioeconomic position, education levels and gender discussed.
Inequities in diet quality are common: in the EU, for example, low-income households have the lowest consumption of fruits and vegetables. The level of differential exposure to healthy food has been addressed by some interventions that aim to improve access to healthy food. Examples include offering free fruits at schools nationwide (706) and establishing places to buy and grow fresh, healthy food (707−709). Access to healthy food can also be facilitated through improved knowledge of nutrition and cooking skills (710−714) but, as discussed in Chapter 6, availability is affected by wider social and global determinants. Food systems have complex interrelations with health, the environment and trade agreements that influence factors such as cost and the ability to grow food.
Case study: OptimaH1 60plus − improving nutrition and physical activity among older people of low SES and migrant backgrounds
This was a preventive intervention among older people (60+ years) who were able to care for themselves, with a special focus on recruitment from those of lower SES or who were migrants (of Russian Federation or Turkish origin). It was implemented in several districts of the city of Bremen in Germany and aimed to improve nutrition and physical activity by providing health information, education materials and counselling. A template was used for recording individual nutrition and physical activity behaviour.
Strategies used to recruit older people to the study included community partner involvement, providing materials at places where older people met and/or lived, holding focus groups, using translated intervention materials and bilingual focal persons during meetings, and involving the media.
There was a significant positive change in nutritional behaviour (increased weekly fish intake) among the group with a migration background but no significant improvement in their physical activity. There were no significant improvements among older people with low SES. The study identified important barriers in reaching this group: older people did not see the topics as of relevance to them − they perceived themselves as being too old to change or felt their current lifestyle was healthy enough, given they had reached their current age.
Women had a greater interest in nutrition and were more positive about healthy eating habits. The counselling aid was seen as very useful in helping primary care providers to discuss behavioural habits with patients and provide recommendations. A recommendation of the study was for health insurance companies to support the establishment of similar prevention programmes, given the potential health benefits for older people.
Source: Keimer et al. (715).

136 Review of social determinants and the health divide in the WHO European Region: final report
The task group on prevention and treatment proposed a number of actions that should form part of an effective CVD strategy as an illustration of a prevention and treatment strategy for a disease that accounts for a large part of the health divide and health inequities.
CVD1.1. Develop population-wide approaches to CVD complemented by health care for individuals at high risk due to their physiological characteristics and socioeconomic circumstances.
CVD1.2. Establish tailored health information programmes for healthy diets and physical activity for specific target groups, complemented by structural changes to facilitate behavioural change, such as higher taxes and regulation of the tobacco industry, building urban environments that promote and enable safe and accessible physical activity by all groups, and investing in safe, affordable and accessible public transport.
These recommendations are consistent with, and build on, the global and European evidence for interventions for noncommunicable diseases.
CVD2.1. Ensure a person-centred primary care approach to cardiovascular care to respond to the multiple areas of need and comorbidity in men and women from groups disadvantaged by their socioeconomic circumstances. This may involve reviewing and assessing equity of access and distribution of outcome from existing primary health care and prevention services to identify how they can be strengthened to provide improved and more effective coverage for more population groups.
CVD2.2. Support tailored, gender-responsive and free tobacco-cessation services in disadvantaged areas.
CVD3.1. Raise the financial support given to low-income families with children to make it possible to choose a healthier diet and link it to costings for a healthy food basket (see recommendation CVD6.1).
CVD3.2. Prioritize public investment in recreational facilities for disadvantaged areas.
CVD3.3. Provide free (where possible) or subsidized school lunches of a good quality and restrict access to less healthy foods and sweets on school premises.
Inequities in CVD can be exacerbated by health systems that do not provide essential CVD services through primary health care. Even where such an approach is in place and equity of access is (in principle) assured for all groups in the population, it is important to monitor the situation to ensure universal coverage. CCEE have seen a shift to increasing unequal access to health care resulting from factors such as service design, accessibility, affordability and financing mechanisms (32–34).
Case study: Romsås in motion, Oslo
This initiative started in 2000 as a low-cost, three-year community-based intervention programme implemented in a multiethnic district with low education levels and high total and CVD mortality rates. Romsås district had the highest mortality rates of all 25 administrative districts in Oslo. At baseline there was also a high prevalence of diabetes, obesity and physical inactivity. The aim was to increase physical activity in the district, with Furuset in Oslo the comparison control area.
There was a 9.5% increase in physical activity following the programme and the proportion who increased their body mass was 50% lower in the intervention district compared with the control. Beneficial effects were also seen for cholesterol/high-density lipoprotein cholesterol ratio, triglyceride levels, glucose, systolic blood pressure and daily smoking (718). The results were comparable for those with high and low education, but lower follow-up response rates by non-western people indicates caution in generalizing the results to this population. Overall, however, the target group, including those usually seen as “hard to reach”, evaluated the intervention and its effects positively. The project group continues to meet five years after the intervention (718).
Jenum et al. (718) identify four key lessons from the intervention for clinicians aiming to encourage increased physical activity:
1. there is value in using a theoretically informed multilevel and targeted intervention with a community-based and high-risk approach to improve physical activity;
2. people with low levels of education and ethnic minority groups will adopt physical activity behaviours when provided with a culturally sensitive intervention that changes their psychological readiness;
3. a strong partnership is needed between researchers and local people to promote local ownership of the intervention; and
4. clinicians should continue to advocate for geographic/location-targeted health promotion in disadvantaged areas as part of the overall national policy to reduce health inequities in the social gradient (718).

Governance, delivery and monitoring systems 137
have the highest rates of multidrug-resistant TB (MDR-TB) (727). High TB and MDR-TB incidence rates arise from poorly developed, ineffective TB control measures, a large penitentiary system with poor TB services, coexistence with the HIV epidemic and large socially vulnerable groups.
TB particularly occurs in, and spreads among, homeless people, in urban contexts, in overcrowded areas with migrants from countries with high TB incidence and among those with compromised immune systems as a result of pre-existing conditions such as HIV. Upstream social determinants, such as limited economic and employment opportunities leading to labour migration, play an important role. Lower socioeconomic position and poor living circumstances increase exposure to TB infection, which is often compounded by no or incomplete treatment due to the potential consequences for those concerned (loss of earnings due to lost time at work, the cost of treatment, loss of employment and stigmatization) (728,729). Inequities in TB mortality are consistently larger than for other infectious diseases in nearly every country in the Region (145).
TB in the Region is becoming more and more difficult to treat. Treatment success rates over the last five years have continued to decrease, falling among new and previously treated cases respectively from 72% and 50% in 2005 to 69% and 48% in 2010. The rate among MDR-TB patients was 56% in 2010. Around 8000 people in the Region fall sick with MDR-TB each year, but only 29 000 were diagnosed in 2010 due to limited access to diagnostic facilities. Five of the 27 high MDR-TB burden countries in the world are in the European Region: a recent study shows the Region has the highest rate of MDR-TB documented in the world among new cases (32%) and previously treated cases (76%) (725).
TB is twice as common among men in the Region (726), although the difference between sexes is smaller among cases of foreign origin. The increasing numbers of women experiencing social marginalization are not yet “visible” in national statistics (730).
The Roma population in Romania has a higher incidence of TB and MDR-TB as a result of living in disadvantaged circumstances (731). The Russian Federation has an increasing gap between TB levels in the general population and among the disadvantaged, particularly those with a history of incarceration (732).
Spots of social marginalization and immigration have resulted in increasing incidence in western Europe, especially in major cities such as London, Paris, Barcelona and Milan (733).
The task group on priority public health conditions provided examples of interventions from areas across the world with high rates of TB that might be transferrable to areas of Europe (38). Most of the
CVD3.4. Increase the availability and accessibility of fruit, vegetable and other low-fat products, particularly in low-income areas, through initiatives such as community gardens and cooperatives.
CVD4.1. Prioritize investment of available resources in interventions that will provide a good return and will also reduce inequities, and ensure equitable resource allocation from health budgets to the prevention and control of CVD. This should begin with the use of available evidence of gaps/differences in health outcomes for different population groups in accessing universal CVD programmes, from which initiatives that at a minimum seek to remedy existing health disadvantage (that is, improve CVD outcomes for specific groups currently disadvantaged by their socioeconomic circumstances in receiving preventive and treatment services for CVD and related risk factors) can be put in place.
CVD5.1. Incorporate a social determinants and equity focus into surveillance and monitoring systems to enable equity-sensitive design of universal and targeted CVD prevention and treatment services and for assessing the distribution of impact of structural measures such as a tobacco tax, reducing salt in processed foods and the elimination of transfatty acids. This is consistent with commitments in the WHO European action plan on noncommunicable diseases.
CVD5.2. Formulate tobacco control, nutrition and physical activity targets that specify desired changes by socioeconomic group (see minimum criteria for health equity surveillance), age and sex, and put systems in place for routine collection and monitoring of the targets. This is consistent with the WHO European action plan on noncommunicable diseases.
CVD6.1. Use available data to create evidence about the absolute and relative costs of a healthy food basket for different groups in the population. From this, support can be generated across all levels for structural policy changes to enable more people in the population to purchase and consume a healthy food basket.
TB
Levels of TB incidence in the Region were presented in the interim report of the review (724). In 2010, they ranged between less than 1 new case per 100 000 population in Monaco to 206 in Tajikistan (722−726). The Russian Federation has the thirteenth highest TB burden (in absolute number of cases) in the world (726,727) and 15 countries of the former Soviet Union

138 Review of social determinants and the health divide in the WHO European Region: final report
TB1.1. Ensure that the “Stop TB” strategy takes into account the social determinants that increase exposure and vulnerability to TB risk factors (such as labour migration, poor living conditions, overcrowding and being in prison). It should include strategies to support “treatment as prevention”, enable increased compliance with treatment completion and change the determinants of exposure (for instance, addressing rates of incarceration for minor crimes and the risk of unemployment or loss of work due to the need to attend for treatment and complete the full course).
TB2.1. Ensure effective implementation of the strategy, including not only diagnosis, treatment and monitoring, but also addressing uptake among risk groups and those in special situations and settings, strengthening health systems, engaging care providers and empowering people with TB and their communities.
TB2.2. Ensure effective collaboration and coordination between different health programmes (TB, HIV, tobacco, alcohol and primary health care) at all levels of health care and within the health sector.
TB3.1. Ensure effective collaboration between the health sector and other sectors relevant for interventions on social determinants. In particular, programmes should be in place to provide incentives and enablers for completion of TB treatment by addressing the social and economic barriers that usually affect compliance. This would include ensuring job security while receiving treatment or putting in place food and nutrition support programmes similar to that provided by the FAO to ensure nutritional recovery and treatment success through food assistance.
TB3.2. Sponsor joint projects with other sectors to improve knowledge about the situation regarding upstream social determinants, such as labour migration, that affect transmission. This would include piloting approaches to remedy the consequences of increased transmission for certain groups, such as a memorandum of understanding or joint agreements between countries for the treatment and care of labour migrants with TB.
TB4.1. Review existing TB treatment and coverage using an equity lens to identify potential gaps and differences in the population. Knowledge generated can then be used to ensure that treatment is directed first to those most likely to be exposed and vulnerable due to their socioeconomic and living circumstances and who are likely to be undiagnosed or untreated. This uses the concept of “treatment as prevention” as a premise.
interventions they assessed targeted specific groups who were vulnerable through their socioeconomic and living circumstances, sought to remedy health disadvantage and focused on people who already had TB. A TB strategy, however, needs to focus not only on treatment, but also on prevention: it should aim to enable access to treatment and adherence to treatment regimens (see examples below) and reduce poverty and social marginalization, the underlying social determinants of TB. Prevention efforts were seen in some interventions in relation to preventing other family and community members from becoming infected (734,735). An agreement or memorandum of understanding with recipient Member States, including all relevant agencies, is important in ensuring labour migrants have access to screening, diagnosis and treatment services.
The task group on prevention and treatment proposed a number of actions to illustrate how an effective TB strategy can provide a response to a major public health threat that is unequally distributed within and between countries in the Region.
Case study: supporting TB treatment in Tomsk, Russian Federation
Directly observed therapy was provided for all MDR-TB patients in Tomsk oblast. Access to treatment for the most disadvantaged was facilitated with public transportation vouchers and home delivery. There was also a specific focus on improving the care of TB patients in prisons and among those with a prisoner background.
Source: Keshavjee et al. (732).
Case study: enabling completion of TB treatment in Tajikistan
The FAO’s specific food and nutrition support programme for people with HIV/AIDS and TB seeks to ensure nutritional recovery and treatment success through food assistance. The World Food Programme in Tajikistan is multipurpose and seeks to:
�� help patients gain weight and have the nutritional status required to absorb the drugs given as part of directly observed therapy;
�� provide financial security to the family while the main income earner is receiving treatment; and
�� provide an incentive for TB patients to keep taking their medication through to the end of the six-month regimen.

Governance, delivery and monitoring systems 139
Health behaviours (such as alcohol consumption, smoking or car-driving behaviour) also show very strong gender patterning. Smoking-related deaths account for 40% to 60% of the current gender gap, with alcohol-related mortality typically 20−30% in the east and 10−20% elsewhere in Europe (743). The causes of these widening differences were discussed in Chapter 3.
Extensive statistical evidence shows that young males exhibit behaviours that result in higher probabilities of being involved in road traffic accidents as drivers. Rates of other accidents and homicides are also substantially higher among men (744,745).
Gender-based violence is one of the most sensitive indicators of gender inequity. It can severely affect reproductive and sexual health, including miscarriages, low birth weight and pelvic inflammatory diseases, and also psychological health by causing post-traumatic stress disorder. No comparable data exist across European countries, but in those in which surveys have been undertaken, experience of partner violence varies between 10% and 60% of women. The 2010 demographic health survey revealed a substantial proportion of women in some countries who considered wife-beating to be justifiable in some circumstances. Research shows that the proportion experiencing violence varies according to factors such as poverty, levels of education, disability and ethnicity (see, for example, demographic and health survey reports (746)).
The dual burden of caregiving to different generations and housekeeping is a source of psychosocial stress for women at specific stages in the life-course. Family-friendly practices and enterprises, flexible child care and family kindergarten and day-care centres can ameliorate these pressures (see Chapter 4). There are several examples of good practice:
�� family support programmes (safe motherhood education and counselling programme and fathers’ support programme involving men in postpartum family planning in Turkey);
�� young fathers’ project in United Kingdom (England);
�� child-care supports in Denmark and Sweden; and
�� day-care centre in Poland.
7.3.7 Strategies to achieve equitable health systems
The long-term nature of preventing and treating ill health equitably requires a comprehensive health system response that can build long-term preventive strategies and short-term responses to illness. The diversity of culture, history and development in the Region means that an incremental approach
TB5.1. Ensure that the strategy includes collection of sex- and age-disaggregated data and data on socioeconomic determinants (see criteria for minimum health equity surveillance) as part of routine data collection and monitoring.
TB5.2. Include a health and gender equity analysis in routine monitoring, reports and evaluations of the strategy, including identification of key gaps in data collection and analysis.
TB6.1. Raise policy-makers’ awareness and understanding (in a nonstigmatizing way) of the important role played by social determinants and intermediate risk factors of TB and MDR-TB.
TB6.2. Raise doctors’ and the general public’s awareness of TB symptoms (in a nonstigmatizing way) in countries where TB is no longer seen as a significant risk. Awareness-raising activities should include engagement of, and participation from, those directly affected by TB (such as patients and their families).
7.3.6 Implications of gender norms and roles for prevention and treatment
Men’s poorer survival rates were discussed in Chapter 3. They reflect several factors – greater levels of occupational exposure to physical and chemical hazards, risk behaviours associated with male lifestyles, health behaviour paradigms related to masculinity and the fact that “men are less likely to visit a doctor when they are ill and are less likely to report on the symptoms of disease or illness” (736). Women’s higher rates of seeking help cannot be explained by psychosocial differences, but could be related to their greater readiness to articulate and communicate distress and discomfort. Myocardial infarction mortality rates differ significantly because of each gender’s responses to pain and symptoms. While men have higher rates of myocardial infarction than women when younger than 55 years, women who have had an infarction experience higher fatality rates (737−740).
Men are more likely to be admitted to psychiatric hospitals for schizophrenia and alcoholic disorders, while women are more likely to be admitted for depression (741,742). Male suicides are a particularly important issue in CCEE, but no western European countries are in the top 10 in the Region. Female suicide rates do not differ as much between west and east: 3 western countries are in the top 10 for female suicide.

140 Review of social determinants and the health divide in the WHO European Region: final report
�� reorient the health system to improve health equity by realizing the full potential of what the health sector can do for everyone;
�� reorient the health system to improve health equity by working with other sectors;
�� take an incremental approach to improving health equity;
�� develop knowledge for action, monitoring and ensuring progress towards improving health equity in the prevention and treatment of ill health; and
�� communicate, engage and act to improve health equity.
Every country, however, must also adapt to local priorities. As indicated in Chapter 6, governments need to be in a position to ensure that the local effects of their public health policies and regulations are not undermined by international agreements to which they sign up. Examples of specific actions, to be adapted to the situation in each country, are:
�� implementing comprehensive tobacco, alcohol and dietary salt and fat control policies that have intervention and implementation intensities and methods designed to ensure greater effectiveness in proportion to the level of socioeconomic disadvantage (this includes making optimal use of price instruments);
�� focusing environmental health programmes on reducing the social gradient in risks due to factors such as work-related stress and pollution of the built environment (as discussed in Chapter 4 and Chapter 6);
�� implementing evidence-based screening and management programmes for cardiovascular risk factors and detectable cancers that make use of active outreach and population-based approaches to ensure proportionately greater uptake and continued participation based on social need; and
�� removing financial, geographic and cultural barriers to uptake of health care services by lower socioeconomic groups by, for instance, avoiding copayments/user fees and promoting adequate resource allocation to disadvantaged areas.
to achieving universal health system equity in prevention and treatment is recommended, with universal health care as an ambition across Europe.
There is little evidence that inequity of access to health services is a major contributor to health inequities in the north, west and south of Europe, but it quite likely makes a significant contribution to larger inequities in mortality in many countries to the east. As this review recommends, building an equitable universal health care system should therefore be a priority ambition for all countries in the Region. Neither cost nor social exclusion should be a barrier to treatment.
Effect of health worker migration on delivery of treatment
Much health care delivery in Europe is sustained through migration of health workers. This presents challenges to, and opportunities for, health system performance. Health worker migration is driven by inequities in resources and opportunities. Actions to reduce these are only possible through financial transfers that “level the (professional) playing field”: bilateral tax agreements, direct forms of training-cost compensation and those that target retention of health workers.
While individual governments have started to take action to stem the emigration of health workers through, for example, improving work conditions and providing better financial incentives, it is clear that further policy interventions are needed to improve management flow.
Equity-focused health systems
Effective preventive systems require equity monitoring and evaluation and equity-focused actions, such as:
�� monitoring the social distribution of exposures (risk factors), outcomes and health system responses and the impact of population-based interventions, such as raising taxes on tobacco, restricting access to retailed alcohol and reducing salt intake and salt content of food;
�� ensuring strategies respond to the different ways health and prevention and treatment services are experienced by men, women and groups and that policies and interventions are responsive to gender and disadvantaged groups; and
�� ensuring appropriateness, uptake and sustainability of initiatives through active community and disadvantaged group participation and engagement.
There are some universal features of a health system equipped to tackle inequity. It should:
�� develop a systemic, sustained and balanced approach to reducing inequities in health, incorporating a balanced portfolio of actions and maintaining a balance between the state and individual;

Governance, delivery and monitoring systems 141
approaches and joint working between individuals and civil society. In particular, as indicated in section 7.2, whole-of-government approaches are critical for policy-making and the implementation of policies to achieve health equity. This requires policy areas to work together across sectoral boundaries within government at different levels – national, regional and local – and with other stakeholders. The level of partnership and joint working needs to be monitored where responsibilities for a wide range of the social determinants of health or the health system are devolved to, for example, regional and local levels. The contribution of all actors to health and its social determinants should also be included in any monitoring framework.
Because governance for health and its social determinants usually involves multiple stakeholders − the state, private sector, NGOs and other members of civil society such as charitable foundations (20) − significant conflicts of interest frequently arise. It is therefore important to monitor how stakeholders are working together, but it is particularly difficult to identify and get agreement on how to monitor their shared contribution.
The first part of this section describes the need for, and requirements of, monitoring systems to review progress in tackling health inequities and the inequitable distribution of social determinants. The second discusses monitoring’s role in the policy-review cycle, including choice of indicators of processes, outputs, outcomes and their use in performance management. Commonly used indicators and social stratifiers and the use of quantitative and qualitative assessments are examined in this context. The third part discusses the use of targets and the choice of target indicators, the fourth summarizes how information for monitoring can be improved in countries in which data are often not available or not reliable, and the final part proposes a summary of actions on monitoring and target-setting that is applicable to all countries in the Region.
7.4.2 Monitoring systems
Taking a social determinants approach to health equity requires monitoring systems that recognize that health is produced and maintained through complex interactions between individuals and their environment (747), as outlined in Chapter 2. An approach to monitoring that highlights the wider social and economic environment within which individuals live their lives, while taking account of individual risk factors that arise over the life-course as a result of this wider context, is therefore required.
There is no simple, single action that will be extremely effective in delivering a social determinant-based strategy and no purpose is served by monitoring single factors in isolation. Similarly, monitoring systems that focus on performance in delivering
7.4.1 Introduction
Improving health and health equity requires an approach based on evidence and up-to-date information. A monitoring system that supplies information to policy-makers and other stakeholders about levels and trends in the social distribution of health outcomes, risk factors, determinants, ill health prevention and treatment is required. This is an essential part of the social determinants approach to action on improving health equity.
From a public health perspective, the first question to be asked of any new governance arrangements is whether they produce better and more equitable health outcomes: do they have the capacity to deliver? As Kickbusch & Gleicher (20) indicate, achieving this requires engagement from many actors and cannot be achieved without collaborative
7.4 Measurement and targets
Recommendation 4(c).
Undertake regular reporting and public scrutiny of inequities in health and its social determinants at all governance levels, including transnational, country and local.
Specific actions
(i) In all countries, establish clear strategies – based on local evidence – to redress the current patterns and magnitude of health inequities by taking action on the social determinants of health.
(ii) Include in these strategies monitoring of the social determinants of health across the life-course and the social and geographic distributions of outcomes.
(iii) Undertake periodic reviews of the strategies at all governance levels, including in-depth analytical descriptions of the magnitude and trends in inequities in health and the main determinants that generate them:
(1) initiate the strategy review process in each country immediately, based on currently available information;
(2) ensure progressive improvement in the availability and access to data needed to achieve this, both in terms of monitoring trends and evaluating what actions are most effective; and
(3) develop minimum standards for the data required to achieve this, including the engagement of transnational organizations that collect or collate data.
(iv) Member States to provide regular reports on their reviews to WHO for discussion at regional meetings.

142 Review of social determinants and the health divide in the WHO European Region: final report
delivered by these processes are of sufficient magnitude to have an impact on causal pathways. Outcome indicators are needed to measure the changes taking place in each of the areas of action. The time lags between policy interventions and their effects on health status, and the difficulties of attributing an effect to specific policy interventions, makes it necessary to use process and output indicators rather than relying solely on outcome indicators.
A coherent system of process, output and outcome indicators is central to effective monitoring. All need to be measured to ensure that progress is being made in each of the processes that generate inequities in health and well-being and need to be reviewed in a dynamic fashion: for example, if process and output indicators improve, when can an improvement in outcome indicators be reasonably expected? Are improvements being seen within that time scale? What level of outcome can realistically be expected, based on accumulated experience and evidence?
The framework needs to aid policy development, be publicly visible and contribute explicitly to accountability. To maintain credibility in these tasks, it is important to ensure the correct sequencing of target-setting, policy-intervention development, implementation and subsequent review in the light of monitoring results. This monitoring and review cycle is shown in Fig. 7.1.
These observations have a number of implications:
�� different indicators are, in general, required to support and measure performance improvement in the short, medium and long term;
�� while some desirable indicators may not currently be measurable, there needs to be a realistic prospect that measurement tools can be put in place to fit with the time scales for which they are required;
�� performance indicators need to be defined in a way that would make it possible for the stakeholders concerned to achieve the improvements being sought;
�� detailed indicators should be reviewed periodically to ensure relevance and specificity over time and will need to be changed when this is indicated by the review;
�� aspirational targets should be set at the highest levels of accountability and supported by a framework of locally measurable indicators at national level and below;
�� governments and local agencies should select framework targets that match national and local needs and provide a basis for performance improvement to be assessed; and
�� implicit in this use of targets and indicators is the need for comparability across countries or between areas within countries to ensure that fair and valid assessments of performance improvements can be made.
solutions using only one dimension of inequity (such as education, employment or spatial environment) may lead to the neglect of other dimensions. A whole-system approach that includes a monitoring and outcome framework incorporating interdependencies between the systems on which society is built and which determine the health of individuals (see Fig. 2.1) is required.
Monitoring systems also need to be designed to take account of different levels of governance and delivery of policies and interventions, from transnational through to local and community organizations. They should be designed to avoid incentivizing achievements that are short term or localized to one part of the system but have negative wider consequences. This is often referred to as “hitting the target but missing the goal”: for example, setting a target of achieving a reduction in the life expectancy gap but achieving it through a reduction in life expectancy among the most advantaged.
Ideally, indicators and targets should be jointly owned by the sectors that need to be involved in successful delivery. This requires agreement on their formulation and how responsibility for delivery is shared. Actions in sectors other than health, such as education, social welfare and the environment, that have the primary intention of addressing outcomes relevant to those sectors frequently also affect the social determinants of health and health equity. A monitoring system for health equity needs to capture the multiple benefits that result from other ministries’ and agencies’ effective policies and interventions, as well as those of the health system. For example, efforts to mitigate climate change and conserve natural resources may well have an effect on health and on health inequities through the promotion of more active travel, more open spaces and better-insulated homes. Similarly, reducing unemployment through the provision of jobs with good working conditions should have multiple benefits, including effects on health inequities, improving social integration and cohesion, and reducing poverty.
7.4.3 Performance indicators and the policy-review cycle
Based on the approach described above and analysis in previous chapters, monitoring systems for health equity need to adequately reflect the complexity of causal factors, the sectors that contribute to these and the coproduction of action across sectors and between levels of governance. Different types of indicator are required to measure processes, outputs and outcomes. Process indicators are needed to monitor that delivery processes at each level and stage of the causal pathways are in place and are capable of producing changes of sufficient scale and intensity to make a difference. Output indicators are needed to ensure that the products

Governance, delivery and monitoring systems 143
Commonly used indicators
The task group on measurement and targets for the review (748) summarized some of the most commonly used indicators of health status, lifestyle and social, psychosocial and societal factors that may be useful in studying and monitoring social inequities in health (Table 7.1). Each indicator was further classified into three categories reflecting their priority and feasibility for monitoring of health inequities: first, those of the highest priority; second, those that are desirable but unlikely to be widely available; and third, those that may be promising but are currently unavailable in most countries and/or insufficiently validated. An aspiration must be to develop the availability of all indicators that are considered desirable or promising: as a step towards meeting this, they should be used (where available) to demonstrate what is possible. Indicators of SES are indicators per se but are also commonly used as stratifiers for health outcomes (that is, they are used to assess the extent of social inequities in health).
Fig. 7.1
Indicator framework
Source: Marmot Review Team (51).
Policy objectives and mechanisms
Specific interventions and policies
Delivery processes
Outputs from interventions
Outcomes from interventions
Performance improvement
Targets
Monitoring Process indicators
Output indicators
Outcome indicators
Table 7.1
Potential key indicators of health, socioeconomic disadvantage and wider social determinants of health
Priority Desirable Less widely available for monitoring and/or recent
Health Total mortalityCause-specific mortalityPerinatal/maternal mortalitySelf-rated healthHypertension ObesityBirth weightFunctional outcomes Reproductive healthMental health
Cause-specific morbiditySurvival (CVD events, cancer)Metabolic syndromeMedication useOther objective functional measuresCognitive functionsChild growthSensory functionsDental health indicators
Novel risk factors or biomarkers (C-reactive protein, vitamins)
Behaviours and risk factors
SmokingAlcohol consumptionSubstance usePhysical activityDiet/food consumption indicatorHealth care usage
Detailed information on: �� drinking patterns�� nutrient intake�� blood lipids�� anthropometry
Biological risk factorsGenetic factors (as effect modifiers)
Socioeconomic and psychosocial
EducationMarital status/living arrangementsOccupational classEconomic activityReal incomeIncome distribution Ethnicity/migrant statusArea-based deprivation
Material assets/amenities (such as car/house ownership)CrowdingLife-course SES indicatorsSocial capitalSocial networksSocial exclusion/participationControl and related measuresWelfare regime Receipt of benefitsFamily size/number of childrenQuality of local environment
Self-assessed: �� deprivation�� economic satisfaction�� well-being

144 Review of social determinants and the health divide in the WHO European Region: final report
the index include levels of consumption, household facilities and neighbourhood environment. The index is intended to shed light on the structure, distribution and consequences of material deprivation at national and EU levels.
A relative wealth index is calculated to measure disparities in 11 CCEE and CIS countries with a demographic and health survey (751), although the set does not include the Russian Federation. The United States, on the other hand, uses a measure of poverty based on the proportion of income spent on food, and The World Bank employs an absolute level of income of $1 per day. Direct comparisons of poverty/deprivation are difficult, with results dependent on whether poverty is defined absolutely or relatively. It is crucial that suitable data have been, and will continue to be, available in consistent form; it is also important that standard definitions and methodologies should be applied where possible.
Income information may also be obtained directly in some countries from censuses or from administrative registers such as those used in Finland, which include birth, death, employment and address information. The difference between methodologies and data sources can be substantial (752). Comparisons using social stratifiers in different countries and between sources in a particular country must take full account of the various definitional and practical issues discussed here.
Qualitative techniques for capturing knowledge
The main data sources for monitoring key health indicators (vital registration system, census and national surveys) are often not sufficient for health planning, especially at local level. Traditional quantitative and aggregated data do not include community input (opinion and attitude) and participation. Programmes such as the WHO Healthy Cities project (753) have suggested over the last decade that health needs assessment should be reoriented from pure monitoring towards identifying
Mortality-based indicators (all-cause, cause-specific, infant and child, life expectancy) are the most commonly used, mainly because they are available in all countries with functioning vital registration systems and represent objective events. Indicators of non-fatal health conditions and risk factors, although highly desirable, depend on the availability of representative health surveys or a functional system of population health registers, neither of which is available in many European countries. Data on socioeconomic factors (less so on psychosocial factors) are often available from routine statistical data collections (and, of course, from health surveys), but routine data typically only allow linkage with health data at aggregate geographic level; even in this case, the aggregation may be at a relatively high geographic level. The greater the level of aggregation, the greater the disconnect between area averages and individuals’ experiences and characteristics. As a result, the plausibility of a causal link between area averages and individual outcomes is likely to be weaker the greater the level of aggregation.
Social stratifiers
The wider social determinants of health and health behaviours discussed in this review include early years, education, living conditions (such as housing), employment and working conditions, income, social protection and health care. As discussed in Chapter 2, social determinants act across the life-course, so measurement of socioeconomic conditions at only one stage of life is likely to be inadequate.
It must be possible to tabulate health data by social indicators (stratifiers) to assess the distribution of health outcomes by at least some of these factors. Social stratifiers are commonly defined by their socioeconomic or demographic attributes, such those listed in Table 7.2.
Except for age and sex, the measurement of each stratifier needs to be developed from a theoretical concept through to a validated operational tool and harmonized for comparison with different data sources. Some measures, such as poverty, have numerous measurement approaches: it can be measured in absolute terms to set a comparable standard of measurement across time and between populations, or measured relative to the social context that allows the comparison of income (pre- or post-tax) or wealth of one group relative to that of another, but without comparability across time. Eurostat uses a relative measure to monitor EU Member States that defines the at-risk-of-poverty rate using a cut-off point of 60% of the mean (or median) equivalised income, a measure of relative poverty (see section 5.2.2). The rate in EU countries is measured using data from EU−SILC (87) population surveys (749). Another measure for monitoring poverty in Europe, the index of material deprivation, is based on data from 26 countries with EU−SILC (750). The three dimensions of deprivation used to construct
Table 7.2
Commonly used socioeconomic and demographic stratifiers used to analyse health inequities
Socioeconomic attributes
Demographic attributes
Income/wealth status/ poverty status
Geographic location
Education Place of residence
Occupational class Race/ethnicity
Economic activity Proportion of widowed
Family composition and social support
Age

Governance, delivery and monitoring systems 145
An important gain from using qualitative analytical approaches and participatory methods is a higher degree of participation in planning and managing resources for health from community and county to national level.
7.4.4 The use of targets
Targets are desired goals decided by political processes. They provide a focus for achieving broader aims.
The processes leading to a decision on what, if any, targets should be set should involve wide consultation among stakeholders, so that those with responsibility for achieving the target and those affected by its achievement share ownership. Ultimately, in the context of this review, the desired goal is improvement in health for everyone and a reduction in health inequities. Specific outcome targets would be drafted in these terms based on,
and solving community health problems using applied research. The introduction of qualitative and consensus-building techniques in the policy-formulation process can improve mutual understanding and collaboration among “policy stakeholders” (politicians, administration, public health professionals and communities).
As discussed in Chapter 5, the neglect of lay knowledge in health inequities policy and practice limits the range of evidence to knowledge disconnected from the context in which people live and undermines potentially creative interplay between different forms of knowledge. As a result, policy and practice may focus on the wrong problems, prioritize inappropriate solutions and widen inequities.
Interest in the relationship between science, policy/practice and civil society is increasing. Ways to create more inclusive spaces in which different types of knowledge can be brought together to develop collective intelligence to inform action (481) need to be found.
Various types of participative, qualitative methodologies oriented towards subgroups have been developed over the last 20 years, but they remain underused in monitoring systems. Combining quantitative and qualitative information is an effective approach to the policy-review process at local level. A good example is the rapid appraisal to assess community health needs used by the WHO Healthy Cities project in Croatia.
Rapid appraisal can be used in assessing the effect of an intervention over a short period of time (within a time frame of 1−5 years from the beginning of the intervention) by measuring several aspects of success. These will generally focus on intervention outputs because of the limited time frame, but the following outcome assessments may be available in some cases:
�� effect on political environment (macroenvironment) – assessment of the achieved degree of change;
�� effect on a project user – an individual, group or community, within the meaning of empowering users and influencing health;
�� effect on a project manager – an organization, institution, association or group (microenvironment); and
�� monitoring the effectiveness of an intervention’s implementation process.
One of the advantages of applying qualitative techniques such as interviews, observations or focus groups is that they can provide the views of the “hard to reach” or underserved segments of the population, including those who are subject to exclusionary processes (see Chapter 5). Including these views in the review process enables the design and implementation of interventions to be improved accordingly.
Case study: rapid appraisal to assess community health needs in Croatia
This method combined three information sources:
�� existing quantitative health indicators
�� participants’ essays
�� participant observations.
Combined with a two-day consensus conference, the approach allows those involved to:
�� assess health in the city (and serve as the base for creating the city health profile);
�� select (Healthy City project) priority areas;
�� establish working groups on priority areas; and
�� build on the previous steps to contribute to the development of a city action plan for health.
The advantages of this method are that it is rapid, inexpensive, scientific, sensitive, participative (involving all major interested parties, such as politicians, experts and citizens) and able to produce immediate action and sustain benefits gained.
The rapid appraisal was applied in 12 Croatian cities between 1996 and 2011. It provided a scientifically based account of health in each city and identified future targets by using health-related measures and citizens’ observations about the community, its problems and potentials. Academic credibility was strengthened by the establishment of strict selection rules for participants and panels and by the process of triangulation of information sources (essays, observations and collected quantitative indicators) and researchers (experts from different backgrounds, including public health, epidemiology and medical information science).

146 Review of social determinants and the health divide in the WHO European Region: final report
While targets based on aspirational goals, rather than those that are readily achievable, can be set at national level and higher, they need to be supported by a framework of locally measurable indicators. Local agencies should select framework targets that match local needs and priorities and provide a basis for performance improvement to be assessed as part of their accountability arrangements. Implicit in this use of indicators is the need for comparability across areas on a national basis to ensure that fair and valid assessments of performance improvements can be made. Where these are to be used to set objectives and hold delivery organizations to account, they need to be SMART, that is:
�� specific
�� measurable
�� achievable
�� relevant
�� time-bound.
Following Fryers (754) and Dahlgren & Whitehead (755), the issues to be considered are as follows.
�� There is a clear distinction between aspirational targets based on health outcomes and performance targets based on the social determinants of health and/or interventions/action processes.
�� Targets and indicators used to measure the performance of countries and organizations must be based on achievements that can, to a large extent, be influenced by the actions of agencies responsible for the targets in the time frame selected.
�� There should be a clear logical framework providing the evidence to link measurable interventions and actions to the desired intermediate and final outcomes.
�� Targets intended to be monitored locally must be set in ways that allow consistent and robust measurement and give as many local organizations as possible a stake and a role in achieving them.
��Which measures of health inequity should be used − absolute or relative values?
��What dimensions of inequity should be measured − socioeconomic deprivation, area of residence, ethnicity and/or gender?
��Measuring differences in outcomes between geographically defined populations as a proxy for other characteristics (such as deprivation) offers increased data availability but introduces potential measurement errors. These should be considered fully when defining area-based targets and efforts should be made to minimize them.
�� A decision must be made for dimensions of inequity that are continuous variables rather than being based on discrete groups (such as deprivation) on whether to define a target group or try to reduce the overall social gradient across the range of inequality.
for example, measures of mortality or morbidity. Targets can also legitimately be drafted in input, process or output terms where improvements in health can be linked to processes or outputs with adequate scientific evidence (Fig. 7.1), including, for example, increases in public health expenditure or the introduction of legislation fostering public health (748). Targets in policy areas other than health, including child poverty, early child education and housing, to name but three, are highly relevant to a strategy based on the social determinants of health.
Arguments for the use of targets are that they:
�� raise awareness and facilitate political and organizational support;
�� ensure political prioritization of an issue;
�� reflect a scientific view of the future in terms of achievable improvements in population health;
�� provide a learning experience for stakeholders;
�� offer a tool for strengthening political accountability and public communication;
�� provide a common goal for partnership-working; and
�� motivate action and act as a reference point on a day-to-day basis.
Target use can nevertheless have unintended consequences, including:
�� they may not align with policy goals – what is measurable is not necessarily a good indicator of the intended achievement aim (for instance, the use of proxy indicators when well-being indicators are not readily available);
�� priority may be given to targets that can be measured easily rather than to the most important issues;
�� target indicators are particularly susceptible to political manipulation of measurement tools or their interpretation;
�� bureaucracies may justify their existence purely in terms of a target;
�� targets are subject to a “law of diminishing returns” − achieving the last few percentage points of a target may require disproportionately large resources;
�� those responsible for delivery may focus on actions needed to achieve the target (such as short-term disease control) rather than the inequities that drive unequal outcomes (the social determinants of health);
�� they may be seen as burdensome and demotivating if too many in number or too complex; and
�� targets are often expressed in terms of population-wide averages and not distributions or levels of health equity.

Governance, delivery and monitoring systems 147
7.4.5 Improving information for monitoring
As described above, target-setting and monitoring require measurable indicators of health, health behaviours, biological risk factors, socioeconomic and psychosocial factors and wider social determinants. Data on a wide range of indicators are already being collected in many countries, often on a periodic basis. In others, however, data are often not available, or are not reliable. It is mainly for this second group of countries that some guidance is needed (see, for example, Dahlgren & Whitehead (755)).
Ensure a minimal set of variables
It is unrealistic to expect that countries with sparse data would be able to collect information on very long lists of indicators. A limited but focused list of measurements is likely to be more successful for routine data collections and health surveys.
Pointers for measurement and monitoring inequalities in health
Countries should use income, occupation or education to measure social position. These function reasonably well as indicators of social position in European societies, though they all have their drawbacks. In practice, the choice is often limited to what is most readily available in a country’s routine information systems.
They should use the health status in affluent areas compared with disadvantaged areas as a proxy for social inequalities in health when individual-level data on the health of different socioeconomic groups is lacking. In this way, it should always be possible to do an equity analysis, even in data-poor countries.
Some task groups identified illustrative sources of information in their areas. Examples were also identified of gaps in data, research and evaluation. These are shown in the case studies below.
Data on vital statistics must not only ensure completeness and reliability of ascertainment of cause of death, but also be collected in a way that allows classification by geographic unit and by some socioeconomic stratifiers, such as occupation or education. Data on numerators (census, population registers) should be capable of being broken down by the same geographic and socioeconomic code.
Expanding existing health survey programmes conducted periodically in large parts of Europe (such as the European Health Interview Survey (EHIS), European Health Examination Survey, EU−SILC and SHARE) to eastern Europe and former Soviet countries would be extremely valuable, as it would provide directly comparable information across countries. It would be equally valuable to reach consensus on a minimal set of measurements (health, risk factors and social determinants) to be included in new or ad hoc surveys.
�� Health inequity targets should be consistent and not be in conflict with overall health improvement targets.
�� Targets and indicators should use valid statistical methodology.
��Methods of presenting the indicators or targets should be clear and transparent.
Choice of target indicators
Indicators of targets that are set in terms of improving health outcomes of the worst-off compared to either the best-off or the average need to reflect the policy goal as closely as possible. Observed improvements in health must be greater among disadvantaged groups than among the rest of the population for a reduction in inequities in health within countries to be identified. Equity targets should therefore not only be expressed as improved health for disadvantaged groups, but also in terms of differences between the most- and least-privileged.
Inequities in health exist not only between the most- and least-privileged groups, but also across the social gradient. Ambitious targets for reducing this social gradient could be considered by selecting the level of health already achieved by the most-privileged group as an achievable standard in a particular country and then aiming to make up the shortfall in health of each group in turn in relation to the standard.
A key issue often discussed in the literature – see, for example, Harper et al. (756) – is the question of choosing relative or absolute comparisons in these cases. Some care needs to be taken in this – when overall rates are changing (that is, the health of all is improving or worsening), relative and absolute comparisons will point to different rates of progress towards a target, or even to opposite directions of travel (756). This arises from some very basic mathematics. For example, if a disease rate for the best-off group is getting very small, perhaps moving towards eradication, the rate for the worst-off will increase in relative terms even if there is a modest absolute decrease. Both absolute and relative differences should therefore be monitored whenever possible to measure health inequities within countries and monitor progress towards targets. This is important when checking whether trends in absolute and relative differences are moving in discrepant directions and also from a policy perspective: general welfare strategies are aimed at changing absolute inequalities in health, while general and equity-oriented strategies are needed to reduce relative differences in health.
The principles to be considered in target-setting were described above. Guidance on specific methodologies can be found in the report of the task group on measurements and targets (748).

148 Review of social determinants and the health divide in the WHO European Region: final report
Health information systems should provide information about the distribution of causes of death and perceived health problems not only by age and sex, but also by social background. Whenever possible, social position and gender should be considered together, as the magnitude and causes of observed social inequalities in health often differ by gender. The differences between poor women and rich women, for instance, and between poor boys and rich boys should be analysed.
Encourage individual data linkages
The association between health and social determinants is usually assessed at ecological (aggregate) level. As shown above, this may introduce the numerator−denominator bias and can lead to distorted and unreliable results. Since most (not all) European countries have systems by which citizens are assigned individual identity numbers, linking data at individual level should be technically possible in large parts of the Region. Obstacles presented by data protection legislation are not insurmountable. In other instances, data collection may need to be expanded to include the individual identity number.
Multinational surveys (expansion towards non-EU countries)
Multinational surveys are conducted regularly in industrialized countries in Europe but not in the east and in central Asian republics, which often lack the infrastructure to collect high-quality routine data.
Case study: examples of childhood data collections that enable equity analyses
�� HBSC, the WHO collaborative cross-national study, covers many countries in the Region. Data are gathered every four years on a wide range of health and social indicators among 11-, 13- and 15-year-olds (44,758).
�� Comprehensive and detailed data on school outcomes containing socioeconomic variables are available in countries such as United Kingdom (England) (307).
�� Ireland has developed a set of children’s well-being indicators within the national children’s strategy, which involved children in its development, and draws explicitly on a rights perspective. The indicators are broken down by age, gender and geographic location and are monitored regularly (759).
�� Germany’s Studie zur Gesundheit von Kindern und Jugendlichen [National health interview and examination survey for children and adolescents] (KIGGS) surveys a sample of children aged 0−17 supplemented by a series of targeted modules, such as the BELLA study, which collects information on mental health. The data contain socioeconomic variables that inform equity analyses (760).
Case study: monitoring social determinants of health to inform policies to improve workers’ health
The employment and working conditions task group report (160) describes several promising international, national and local initiatives to improve the availability, quality and comparability of data on health and work.
�� The work security index proposed by the ILO is a new way for governments to determine how well they protect the health, safety and well-being of their working population. It aims to create a benchmarking system for identifying how well a country is performing at national level relative to other countries (757) and includes input, process and outcome indicators. Monitoring indicators of working conditions should have the biggest impact on those most exposed to risks to health and well-being associated with employment.
�� Participatory action research, extensively used in industry and management, has been applied to policies that aim to improve work and health among civil aviation workers. A study initiated by the International Transport Workers’ Federation looked at the role of stress and fatigue. It identified a growing workload among workers, combined with a decline in their working conditions. The study has been valuable in describing changes in working conditions and social and economic security conditions among civil aviation workers worldwide, and highlighted the potential for modifying these conditions (160).
�� The French project CONSTANCES is planned as an epidemiological population-based open laboratory encompassing a population of some 20 000 insured people who will be offered a comprehensive health examination and consultation irrespective of whether they are employed in the formal or informal labour market or whether they are unemployed. A pilot exploring the feasibility of the approach is currently under way. One of the project’s aims is to identify people who are more at risk because of employment (160).
�� A German initiative aims to evaluate a legislation-based nationwide campaign of workplace health promotion. Sickness funds have the right through legislation to spend a certain amount of their money on worksite health-promotion activities in collaboration with stakeholders. Priority has to be put on activities that contribute to a reduction of social inequalities in health. There is no uniform intervention approach, and health-behaviour-related programmes still prevail, but a recent evaluation suggests that many of those benefiting from the programmes are workers exposed to heavy workloads in small and medium enterprises with little previous experience of implementing such programmes, though older workers and working women are still underrepresented. No validated data on health effects among participants are available so far (160).

Governance, delivery and monitoring systems 149
�� ensure that at least basic socioeconomic measures are collected;
�� continue data collections where they exist;
�� encourage adoption of standardized national health survey protocols (such as EHIS) in all countries in the Region;
�� develop effective mechanisms to enable individuals and groups who are the targets of policy to have a real voice and to be involved in a meaningful way in decisions that affect their lives (481);
�� consider using rapid health needs assessment tools;
�� support and create capacity for monitoring, research and evaluation into social determinants of health and health equity in their country contexts;
�� conduct projections of lives saved or health improved when alternative policies for a particular determinant of health are being considered: prospective health impact assessments should cover all the social determinants of health, including an equity perspective obtained by assessing differential impacts across socioeconomic groups in the population, and methodological research is needed to incorporate health inequity impacts within economic evaluations of policies that may influence social gradients in health;
�� publish regular reviews of progress that include in-depth analytical descriptions of magnitude and trends in health inequities and the main determinants that generate them.
Demographic and health surveys and MICS are carried out periodically but usually focus only on particular causes of mortality and morbidity.
A potential option that merits further exploration is surveys conducted regularly (at times, annually) by Gallup International. Gallup’s “world poll” conducts self-reported health and well-being surveys in almost all countries of the world and its infrastructure may be used to collect new information in particular areas. The Regional Office has recently opened discussions with Gallup Europe to explore this possibility further.
Whichever option is selected, the aim should always be to level-up by improving the health of the worst-off in society, and never to level-down by reducing the health status of groups that are better-off.
7.4.6 Key requirements of a monitoring system
Monitoring should cover the central aims of any strategy − overall improvements in health and reductions in inequities in health and its social determinants. This requires measuring improvements in health for all, checking that indicators for less-privileged groups are being levelled-up towards those of the better-off and that specific interventions are successful in contributing to these improvements.
To improve their capacity to undertake this monitoring, European Region countries should:
�� ensure that collected data achieve the minimum required in the health equity surveillance approach recommended by the CSDH (2);
�� prioritize data for routine collection;
Case study: gaps in data and research on older people and inequalities
�� Further research on recording the extent of inequities in health in older age is needed, especially in CCEE.
�� Studies of health inequities in adults should be encouraged to report results separately by age group and consider differences.
�� Urgent attention is needed to research interventions for addressing health inequities in older age. Promising areas for investigation include promotion of physical exercise, either through community or individual-based interventions, rehabilitation and tertiary prevention interventions for those with chronic diseases and interventions designed to reduce inequities in using preventive services.
��More fundamentally, further research is required into the role of underlying determinants, such as income level, quality of housing, opportunities for work and social engagement and identification of minimum income and living standards needed to maintain health in later life.
Case study: gaps in data and research on sustainability and inequalities
Research is lacking in many areas, particularly in relation to evidence of problems in CCEE and the former Soviet republics. Approaches that will integrate epidemiological understanding of environmental and other long-term risks to sustainable health for the wider population and marginalized groups are needed.
Deficiencies in current surveillance systems for chronic disease factors prevent analysis of comparable causes of death in Europe (38). Effective indicators should be comparable across Europe, but locally developed. Some may be specific to a particular country yet highly effective at teasing out health inequity issues in that country. By allowing for local development of such indicators, it is intended that use should be made of these even if there is no comparable equivalent in other countries. A better understanding of the causal links between sustainability and health inequities calls for the collection of more detailed statistics that are more relevant to these links to inform the creation of effective interventions.

greg
ory
wro
na | p
anos
pic
ture
s

Implementation and action 151
Part IV Implementation and action
Action on the health divide, health inequities and the social determinants of health must be systematic and sustained.
Addressing political, social, economic and institutional environments is essential in achieving this and is vital for advancing the health of the population. Intersectoral policies are both necessary and indispensable.
Part IV provides practical guidance on implementing policies to achieve reductions in inequities in health, based on these principles.

8 Implementing action based on the social determinants of health approach
8.1 Introduction
This chapter summarizes key messages on the principles underpinning implementation of the review’s recommendations, based on evidence presented in earlier chapters. The focus is on approaches that currently show most promise in governing for equity in health through action on social determinants.
As indicated in Chapter 7, these need engagement from the many stakeholders involved in each of the social determinants, use of instruments to encourage collaboration among stakeholders and the capacity to hold decision-makers to account. Participation of local people and the intended beneficiaries of policies are important (as was highlighted in Chapter 7) in improving not only the transparency of decisions, but also the efficacy of actions (policies and investments) to improve equity in health. Recognizing the interdependence between different levels of governance, the chapter looks in detail at two key examples of transnational action to address the health divide and local government’s role.
8.2 Effective delivery systems
Approaches to addressing the social determinants of health and health inequities need to meet the criteria of efficiency, effectiveness, fairness and sustainability. A “systems checklist” designed to ensure that actions cover the whole of government and whole of society is provided for those developing governance and delivery systems to address inequities in health and its social determinants. This contrasts with the tendency to develop issue-specific programmes and policies aimed at narrowly defined target groups, discussed in more detail in section 8.2.2.
The checklist identifies the characteristics of systems that are likely to be effective in addressing inequities in health and its social determinants. It is deliberately framed in generic terms to allow for adaptation within policy-making levels reflecting different cultures, traditions and perspectives in the Region.
Systems and sectors at different levels need to collaborate to create values- and evidence-based governance and delivery systems competent to address the social determinants of health and health inequities and deliver improved and equitable health outcomes. This should build on the evidence collected for this review and the monitoring systems outlined in Chapter 7.
Governing for equity needs to develop new and/or strengthened instruments and mechanisms that ensure equitable participation and input in decision-making processes. Specifically, emphasis should be placed on ensuring that the needs of marginalized and at-risk groups are recognized and incorporated into resource allocations and the design, monitoring and review of policies, services and interventions. In doing so, health equity governance could also contribute to promoting and supporting increased inclusion and social justice.
Against this backdrop, governance for health equity has an important role in:
�� developing the necessary legislation and regulations to strengthen joint accountability for equity across sectors and involving decision-makers within and outside of government;
�� using mechanisms that actively promote involvement of local people and stakeholders in defining problems and developing solutions and which ensure equity of voice and perspectives in decision-making processes;
�� ensuring regular joint reviews of progress, which fosters common understandings and sustains commitment to deliver shared results over time; and
�� drawing on different forms of evidence to ensure policies address main causal pathways and are capable of adapting over time.
Kickbusch & Gleicher (20) have described these as (some of the) features of smart governance for health in the 21st century (see section 7.2.2).
Key governance principles (20) were presented in section 7.2. Governance and delivery systems should involve processes that are supported by innovation in modernized and strengthened public health systems, governing through a combination of collaboration, engagement, regulation, persuasion, use of independent agencies and expert bodies, adaptive policies, resilient structures and foresight.
Competent “governance for health” systems should include characteristics that demonstrate:
�� political commitment
�� evidence, metrics and research
�� legislative structures and systems
�� cross-government policy
�� policy alignment and coherence
�� population empowerment
�� data transparency
�� capability development
152 Review of social determinants and the health divide in the WHO European Region: final report

Implementing action based on the social determinants of health approach 153
This approach can be implemented through the use of joint assessments in partnership with other sectors and stakeholders within and outside of government, including local communities. All reports on the effects of specific policies and societal progress and development more generally should include equity impact assessments of policies on health and its social determinants.
8.2.2 Integrated policies capable of delivering action on the social determinants of health
Recognition of the need to develop integrated policies and solutions that can act on underlying determinants of health and health equity is increasing (see the task group report on governance (664)). They include comprehensive health inequity reduction strategies covering the whole population, but with an intensity of action that is proportionate to need across a broad range of the social determinants. The case studies for Norway and United Kingdom (Scotland) in Chapter 7 provide examples of comprehensive strategies.
It is nevertheless more common for governments to develop issue-specific programmes and policies aimed at narrowly defined target groups. Initiatives of this type can be seen in almost all countries in the Region, with examples including various Roma inclusion strategies in central, southern and eastern European countries (see Chapter 5). The limitations of policies that lack a universal base are discussed below.
The inclusion of health improvement goals and objectives in national poverty-reduction strategies provides a focus for integrated policies in CIS countries, but indicators to measure improvements in health among different population groups are often generic, with equity more commonly being implicit rather than explicit. It is often reflected in value statements rather than defined as a performance criterion for integrated action.
Another approach is to include specific health equity targets in national development plans. National and local approaches to tackling inequities in Slovenia have been scaled up in recent years, with the Ministry of Health pursuing common equity goals with other sectors and using health equity measures (at the level of determinants) as one of the initiators for joint policy action to increase the equity of public policies.
Health equity in all policies – working across sectors
The review recommendations are based on evidence that policy in every sector of government can potentially affect health and inequities in health. Health may not be the explicit focus in many policy areas, but unless their potential effects on health and equity in health are considered, opportunities for reducing gradients in health and creating side
�� modernized public health
�� governance boards
�� formal roles
�� multilevel governance
�� institutional capacity
�� learning and innovation systems.
Delivery systems should include systems characteristics that demonstrate evidence of:
�� a defined delivery chain
�� ownership and active management
�� levers and incentives
�� performance management
�� strong civic, executive and political leadership
�� sustainable financing and training
�� political support and statutory responsibilities
�� high public visibility and engagement.
These characteristics and their implications for implementation are described in more detail below.
8.2.1 Political commitment
Strong political commitment within and across government is necessary to reduce inequities in health through action on social determinants, extending from clear leadership (either at national or local level) through to political authority to pursue the agenda. Much work has been undertaken in many European countries to get the social determinants of health and inequities in health onto the political agenda (761).
There is a clear opportunity to learn from countries that have been successful in increasing political commitment (see relevant case studies in Chapter 7). Identifying factors that might be developed and adapted for use in achieving commitment in different settings could potentially support the rapid development of the agenda across settings.
Ministries of health and the public health community should create and support a compelling narrative on why improving equity is a priority not only for health, but also for the attainment of other societal goals and aspirations, recognizing that the social determinants of health are also the social determinants of many other outcomes. By tackling inequities and ensuring that efforts to do so are focused on achieving particular outcomes, several societal goals and aspirations can be achieved: as indicated in Chapter 4, early childhood interventions, for example, tackle fundamental inequities with the expectation of positive outcomes in terms of health, education and personal development and life chances. This provides a more compelling argument than, for instance, asking education ministers to support health outcomes per se.

154 Review of social determinants and the health divide in the WHO European Region: final report
inability to separately identify the total money spent on the social determinants of health, which appears to be a common feature across countries and needs to be addressed systematically. Overall, although partnership working is generally a feature of many strategies, little systematic evaluation has established whether partnerships deliver better health outcomes. There are, however, some pointers to developing mature partnerships that are capable of delivering positive outputs.
A key requirement is a new and different model of leadership focused on a whole-system approach and grounded in active community participation. It needs to be based on coproduction of health and well-being in a delivery model that shifts the balance of power towards local people and communities and away from professionals and formal institutions (as set out in Chapter 7). This requires a recognition of local assets that build wider capabilities and an infrastructure of peer support that breaks down barriers between professionals and the public.
Implementation evidence suggests that when it is linked with clarity of strategic direction between agencies and explicit agreement on joint priorities, with targets limited to those necessary to drive strategic goals, this approach frees local policy-makers, citizens and communities to tailor specific solutions to local problems and creates more explicit local accountability. Achieving the synergy needed to sustain progress requires coherence of strategy, policy and delivery across the whole system, consistent with the values and principles of social justice (763). Formal and informal partnership structures are a part of the total picture and need to be refined to maximize their effects in facilitation, rather than delivery.
Proportionate universalism
As indicated in Chapter 2, proportionate universal policies are central to reducing inequity in social determinants. The universal element is needed to ensure that these policies are sustainable, achieve social buy-in and political will, reduce stigmatization and avoid marginalization to attract sufficient investment. Those targeted at specific groups are less effective socially than actions that include the whole of society.
To be cost−effective, the approach requires that investment and intensity of activity are proportionate to social need to ensure the population coverage necessary to achieve a levelling-up of the social gradient. Although initial investment may be high, returns are higher and waste, duplication, short-termism and premature abandonment of programmes are avoided: Sure Start in United Kingdom (England), for example (see Chapter 4), is universal but needed greater effort to ensure participation from, and effective impact for, more-deprived communities and greater investment in parental education and training for those who require it.
benefits for other outcomes will probably be missed. Coordinated action between sectors has the potential to contribute to significant health gains. As indicated in section 8.2.1, health equity impact assessments of all policies and programmes need to become routine in policy-development processes.
Intersectoral action requires that effective partnerships be built nationally and locally across government departments, agencies and institutions, the third sector and, where appropriate, the private sector. Local-level activities that facilitate active public participation in community planning and programme development are crucial to addressing inequities in health. They need to be supported by a funding mechanism and accountability structure that respond to local needs. Framing this issue in terms that bring together the interests of all partners is important in initiating partnerships across sectors with differing organizational cultures and practices (Box 8.1).
Partnership working is a key prerequisite to taking action on the social determinants of health, which requires comprehensive action from a range of stakeholders working in a concerted and sustained way to address the issues. This calls for shared measurement, targets, budgets and accountability systems.
Significant barriers to developing mature partnership working can nevertheless be identified, including lack of understanding of, and a will to take action on, the key drivers of the social determinants of health and artificially separating health policy from other relevant policies, leading to displacement of responsibility. The latter can be compounded by an
Box 8.1 Building the case for intersectoral action
�� Build on public concern for the health and well-being of a disadvantaged group.
�� Use political champions to advocate for intersectoral action.
�� Frame the issue in a way that all sectors can recognize.
�� Build on international leadership.
�� Create a platform for researchers.
�� Build on concerns about the need to use scarce resources more efficiently.
�� Acknowledge the limitations of previous approaches, especially those involving sectors working alone.
�� Take advantage of political transitions to reassess roles and begin to work better together.
�� Build consensus via shared gatherings, such as conferences or community meetings.

Implementing action based on the social determinants of health approach 155
also need to relate to their communities. Chapter 5 suggests that members of communities are best able to identify their needs and aspirations: structures that enable individuals to participate fully in decision-making about their communities require transparency of information and a genuine effort to build capacity across all sectors.
A combination of hard and soft mechanisms is required to ensure effective accountability. These include laws and regulation, parliamentary resolutions, formal memoranda of understanding (including concordats and contracts) and financial and reward systems linked to team results (such as pooled or shared budgets). The effectiveness of policies should be audited through structured impact assessments and a process of continuous system improvement should be set up to underpin local and national activity. The recommendation of this review is that there should be regular reporting and public scrutiny of inequities in health and its social determinants at all governance levels, including transnational, country and local.
Europe-wide information exchanges should be put in place to support effectiveness, covering issues such as innovative approaches, trends and effective interventions for improving health equity through action on social determinants.
Instruments for achieving accountability and incentivizing collaboration
Instruments that commonly feature in country “toolkits” for governing integrated policies and improving distributional equity include impact assessment methodologies, guidance and specialist units such as those used in Romania, regular cross-sectoral spending reviews on inequities (764) and benefit incidence analysis techniques used in the Serbian Roma inclusion strategy (see Chapter 7). Governance instruments such as these are increasingly being used by joint working groups and teams involving multiple policy sectors. Some NGOs and independent academic and policy support units also use them: examples include the “Equally well” framework in United Kingdom (Scotland) and the Roma action plan in the former Yugoslav Republic of Macedonia.
These developments in joint accounting for impacts vary across the Region. Fostering cooperative ways of working and performance management, while acknowledged as being necessary to address social determinants and reduce inequities in health, has also been found to be time-consuming, incurring significant opportunity costs (loss of personal/sectoral influence, resources and status) and, in some cases, running counter to decision-makers’ and managers’ existing cultural norms and values. It is for these reasons that it is recommended that joint and “softer” instruments need to be combined with more hierarchical or “hard” instruments to ensure coproduction and joint accountability in achieving equity across policy domains.
Universal health systems and coverage provide a critical foundation for addressing health inequities, with a shift towards comprehensive and multisectoral approaches that target the population as a whole as well as disadvantaged groups.
Putting a proportionate approach based on social gradients into practice requires that certain building blocks, such as universal health and social protection systems, a systemic and sustained approach and effective mechanisms for whole-of-government working, are in place. The diversity of culture, history and development in the Region mean that an incremental approach to achieving equity in prevention and treatment is required. Every country has a journey to undertake, but they are starting it from very different places. Universal health systems may be an ambition for all countries, but the steps needed to achieve it will differ.
Intersectoral cooperation
Action on the social determinants of health and inequities in health needs to be taken across organizational, sectoral and geographic boundaries. The difficulties and resource implications of working across multiple boundaries leads to poorly coordinated action that risks contradicting or duplicating core objectives. Too often, similar programmes are repeated across different areas and with different disciplines.
The breadth of the social determinants agenda and the need for broad-based intersectoral action in most countries leads to complex partnership arrangements and makes reaching consensus on priorities difficult. A clearly identified implementation challenge is therefore to build and strengthen leadership roles in working across sectors, coordinating initiatives and developing partnerships.
Expenditure levels and identifying funding
Expenditure levels, especially the ability to define the budget for social determinants of health, are crucial. Identifying money designated for specific programmes is relatively simple, but defining the total budget spent on improving the social determinants of health and inequities in health is difficult. A particular problem is the need to include closely linked policy areas such as education, public transport, public safety and departments in charge of spatial planning.
8.2.3 Accountability
Accountability mechanisms, backed up by supportive incentives, should be put in place to ensure cross-sectoral policy development, implementation and review. As discussed in Chapter 7, a clear accountability institution with transparent reporting is essential, as are governance boards that can hold all stakeholders to account for progress. Boards should have access to competent and well-trained experts in health and its social determinants but

156 Review of social determinants and the health divide in the WHO European Region: final report
Where evidence exists, it is often not widely disseminated. Even basic data and indicators are frequently not available or not reliable in many countries (see Chapter 7). More collection and sharing of learning on measuring social determinants of health and inequities in health and on how to effectively implement programmes to tackle them is needed. Task groups working on this review collated the evidence they were able to identify on what is available: this is presented in their reports and supporting papers.
More dynamic processes for sharing best practice are being developed through projects linked to WHO and EU networks, but the knowledge base of what works needs to be strengthened and good practices disseminated nationally and internationally. This requires more systematic evaluation of activity on the social determinants of health and the creation of structures capable of ensuring effective dissemination among all key stakeholders.
Regional and multicountry know-how and learning exchange should be established through networks and partnerships with the aim of increasing capacity, generating solutions and accelerating systematic action to reduce inequities. Support for policy research alliances on the social determinants of health between the east and west and the north and south of the Region is a priority.
As indicated in Chapter 7, the collection and analysis of data drawn from a variety of qualitative and quantitative sources and disaggregated by social and economic factors needs to be included as part of routine intelligence systems. They should draw on and use a range of data sources to inform analysis, reporting and implementation of action on social determinants, including household surveys, censuses, vital registration, institution-based data (individual, service or resource records) and quantitative and qualitative case studies. International and European agencies need to increase efforts and provide assistance to support countries to strengthen systems and capacity for collecting and using data disaggregated by SES, including coordination across agencies.
8.2.5 Policy and legal instruments
The legislative framework is critical for action on the social determinants of health and inequities in health. Tackling inequities in health is part of many countries’ governments’ larger responsibility for the well-being of their citizens but is marked by vague and unfunded commitments. Legislation often includes terms such as health promotion and well-being for all, but commitments or quantification of what is required to bridge the gradient are seldom made (766).
Many countries within the Region are currently reviewing their national and local development plans and evaluating or reforming health policies and services. Many have a direct intention of − or at least an expressed interest in − strengthening accountability mechanisms with the aim of incentivizing actions on social determinants. For example, a new public health act was passed in Norway in 2011 (operative from 1 January 2012) which aims to “contribute to societal development that promotes public health and reduces social inequities in health” (765). One of the main features of the act is that it specifies public health work as being a whole-of-government and whole-of-municipality responsibility, rather than for the health sector alone. It stipulates that Norwegian municipalities must involve all sectors in promoting public health. Additional tools such as a national system of providing public health indicators to local government (including indicators of social determinants of health) complement the new law and support stakeholder action in meeting their responsibilities at different government levels.
Similarly, Kyrgyzstan has elaborated and implemented an intersectoral action plan for promoting population health within the framework of the Manas Taalimi health care reform process. The action plan was formally adopted by parliament following its inclusion in the law on health care reform in 2006 and is ongoing. It requires coordinated action across health and other sectors to improve living conditions (such as water supply and housing), prevent hygiene-related diseases, improve health behaviours and increase access to primary care services. It also serves as a framework to coordinate bilateral and unilateral agency support around common objectives for improving health for all at community level.
8.2.4 Evidence and measurement
Evidence on the effectiveness of specific interventions is lacking. This is manifested in the difficulty of evaluating existing programmes and, consequently, the lack of available evidence to inform future work.
Lack of firm evidence on the economic effects of interventions, outlined in Chapter 6, creates particular problems in making the case for “bending” mainstream budgets such as those for housing, education and transport to the agenda of improving health and reducing inequities in health. The evidence base needs to include not only examples of effective work but also sufficient information to allow authorities to focus their efforts and, as far as possible, to scope any additional capacity needed. There is often little capacity to evaluate what is done, however, and actions are commonly not designed to facilitate evaluation.

Implementing action based on the social determinants of health approach 157
issues of human welfare and dignity, given its legal status, and is a powerful means of drawing attention to these issues.
European health and human rights law
The right to health is set out in a number of European human rights instruments (see Chapter 2), but their powers are limited. The European Convention on Human Rights, for instance, only contains civil and political rights, meaning the right to health cannot be addressed before the European Court of Human Rights in Strasbourg. The Court nevertheless is increasingly dealing with health-related matters such as environmental pollution and the question of whether a denial of access to health care can affect people’s “right to life” (769). It is also worth noting that the right to education, a key social determinant, is included in the European Convention on Human Rights.
8.2.6 Capacity building
The health sector is critical to successful implementation of strategies to reduce inequities in health and its social determinants. The sector needs to act as advocates and leaders by making health equity its priority, levering change across government at all levels and promoting and influencing the focus of intersectoral action. It has a key role in leading and influencing public opinion.
But there are capacity issues within and outside the health sector, particularly in relation to the consequences of the wider policy and legislative context for addressing the social determinants of health − the internal organizational capacity needed to develop cross-sectoral strategies and limited flexibility in planning and delivering the services needed. Section 8.3 discusses the reasons why these capacity issues matter.
Ensuring wider recognition of the scale and intensity of action necessary to have an impact on health inequities is a key area of capacity development. This requires an assessment of the relative effectiveness of targeting vulnerable groups and working across the whole social gradient. As discussed in Chapter 7, solutions based on focused work are commonly sought, such as targeting small geographic areas with interventions for the most vulnerable communities without any assessment of whether the scale and intensity of action is sufficient to achieve any discernible population-wide effect on the social gradient.
Some social determinants of health, such as town planning and safety in the workplace, have their own field of legislation beyond the general legislative framework. Legislation and strategic papers more often set targets for tackling the problem when this is the case. Legislation directly linked to inequities in health or the social determinants of health is often vague, whereas that linked to specific determinants of health tends to be clearer, as is the case in Norway (765) and United Kingdom (England) (767).
Regulation
Action across sectors requires a specific enabling legislative framework. Legislation is needed, for instance, to reduce exposure to unhealthy work and the associated risks of disease and injury. Managing health risks also requires enforcement of national regulations and the provision of good occupational health services, as illustrated in Chapter 4. Similar levels are needed to manage environmental hazards (see Chapter 5). The framework needed at local government level is described in more detail in section 8.6.
Meaningful regulation of the financial system (adequate capital cushions, lower leverage ratios and better regulation of shadow banking, for instance) are needed to mitigate the effect of global financial systems on national and local populations (see Chapter 6). EU policies are particularly relevant: specific attention should be given to how trade treaties and investment agreements affect the regulation of, and policies for, health.
The human rights framework
As discussed in Chapters 2 and Chapter 7, human rights set out in international ratified treaties imply legal requirements on ratifiers. This means that the human rights framework in these treaties should be the inspiration for national legislation, with governments being held legally accountable before national and international courts and other (quasijudicial) bodies for not meeting their obligations.
Sen emphasizes, however, that from a broader perspective, human rights are also articulations of ethical demands (768), implying that they can be employed in various ways, even when they are (strictly speaking) not legally binding (768).
It is also important to note that human rights law can offer a normative framework in a non-legal context. For example, it can provide normative tools for implementing new health policies, be used to hold private actors morally accountable for violations and help NGOs to draw attention to the issues they seek to address (669,670). It can be a tool for holding governments accountable for important

158 Review of social determinants and the health divide in the WHO European Region: final report
8.3.1 Conceptual failure
The main drivers of health inequities are viewed very differently across the Region, reflecting wide variation in sociopolitical factors and history (see Chapter 3). A small number of conceptual frameworks have influenced recent thinking on health inequities, determinants and interventions that feature in policies and practice. These include Dahlgren & Whitehead, often referred to as the “rainbow model” (770), Graham (771) and CSDH (2).
A common feature across these conceptual frameworks is the interaction between a range of determinants that shape the causal pathways to equity and inequity between population groups. Despite reference to the conceptual frameworks, the connections among social position, social structures, material factors and individual behaviours are not generally clearly conceptualized or articulated in frameworks underpinning action to reduce inequities across many European countries. Recent reviews by the WHO European Office for Investment for Health and Development (772−774) found that explanations for how health inequities occur and persist in society varied, but overall there was a tendency across many countries that participated in the reviews to focus on intermediate or proximal determinants such as access to health services, lifestyle or behaviour, living conditions (housing, water and sanitation) and social cohesion.
Collecting and disseminating more information on targeting versus working across the gradient is therefore an important area of capacity development and one that will materially affect implementation. Without a clear understanding of the cause of the causes of inequities in health, action is likely to be ineffective, project-driven and inappropriately targeted at the bottom of the social gradient. Proportionate universal policies and action focused on the social determinants of health across the life-course require clarity of understanding, a defined strategy and concerted leadership across key agencies to be effective.
Locally, this means building partnerships with communities and promoting activities within local government. Local government’s role and activities required at local level are discussed in more detail below. The health system also needs to be exemplary in its own practices in employment practices and reducing inequities in access through attention to issues such as CVD, TB, alcohol and health worker migration (see Chapter 6).
8.3 Lessons to be learned from the persistence of inequities
The previous section outlined key requirements for effective governance for equity in health. Case studies and other examples presented in earlier chapters included efforts made to achieve social inclusion, poverty reduction, balanced development, rural development, universal social and health protection, sustainable communities and the right to health. All of these aim to improve the daily living conditions, working life, income opportunities and safety and security of the population. In this way, social determinants of health and equity are observed in almost all current policy goals and values of countries across the Region. Significant progress has been made and several common instruments and approaches developed to improve governing for equity in health through action on social determinants, but despite these efforts and good intentions, inequities persist and are often on the increase.
This section identifies possible reasons for failure and the persistence of inequities, drawing on information gathered by the task group on governance and delivery (664). The framework required to govern for health equity was described in Chapter 7 and characteristics of effective systems in the previous section.
Reasons for failure have been clustered into four main categories. These are set out in Table 8.1 and are explored in more detail in the remainder of this section. Understanding the reasons previous efforts did not succeed makes it more likely that strategies described in this chapter will be implemented successfully.
Table 8.1
Reasons for failure in governing for health equity through action on social determinants
Type of failure Explanation
Conceptual failure Failure to conceptualize the full “causal pathway” leading to the desired equity goals/outcomes
Delivery-chain failure Failure to understand, construct or gain political commitment to an effective “delivery chain” capable of acting on multiple determinants to reduce inequities/increase equity in health over time
Control-strategy failure Failure to develop an effective “control strategy” capable of holding stakeholders and policies to account for equity results
Public health system failure Failure to develop competencies needed to govern for health as a societal objective, not only a health sector objective

Implementing action based on the social determinants of health approach 159
8.3.2 Delivery-chain failure
Diverse and independent social systems (transport, housing, welfare and so on) usually operate in accountability and delivery silos (that is, systems that are not cross-governmental), but health inequities are the result of the combined impact of numerous systems (see Chapter 2). To be effective, action on the social determinants of health needs to be delivered across the chain of systems creating inequities. Failure to analyse how this dispersed chain works is a key cause of ineffective management in delivering action on inequities in health and its social determinants.
Delivery systems need to be organized to provide incentives for coherent action by stakeholders and decision-makers, hold decision-makers to account for their effect on determinants and have the institutional capacity, instruments and processes in place to enable policy to be sustained and adapted over time, with corrective action taken where necessary. These essential functions of a delivery system capable of improving equity in health reflect the principles of good governance set out by UNDP and reflected in Box 8.2.
Evidence compiled by the task group on governance and delivery suggests the following common reasons for systems’ reduced performance in delivering improvement in health equity through action on social determinants.
Reliance on small-scale project and pilots
Most interventions, while well-meaning, are often of a pilot nature or limited to small-scale, time-limited projects. Many have limited success in leveraging action across the range of determinants needed to reduce the gradient. Even those that act on a range of determinants underperform, as they are not able to deliver the scale, duration and intensity of action required to sustain impact and produce real improvements in the medium term.
A recent study (775) hypothesized that the persistence of health inequities in modern European welfare states can be seen partly as a conceptual failure, in that these states did not implement more radical redistribution measures, and partly as a form of “bad luck” related to concurrent developments that have changed the composition of socioeconomic groups and made health inequities more sensitive to immaterial factors (personal, psychosocial and cultural determinants). The study suggested that inequities in parts of Europe persist due to a failure to conceptualize and act on the optimal mix of determinants and intervene with the magnitude and intensity necessary to affect their distribution.
This reason for failure was reflected in findings from the National Audit Office in the United Kingdom in reviewing why England was failing to achieve its national health inequities targets for 2010. It reported that an important issue was the failure to sufficiently acknowledge, conceptualize and effectively address the full causal chain of poor health outcomes. Evidence compiled by the task group on governance and delivery suggests this is a likely reason for poorer-than-expected results for health inequity strategies, policies and interventions in many countries across Europe.
Explanations of how health inequities arise and persist over time are not only shaped by scientific evidence and models, but also by political ideology and the interests of different stakeholders influencing decision-making. These drivers are not insignificant and currently include a resurgence of the trickle-down effect and a focus on individual responsibilities and behaviour change, such as “nudge” strategies that use positive reinforcement and/or suggestion to influence behaviour (776).
A further influence is pragmatic − what is deemed possible to change? Decisions are sometimes made on the basis of what it is possible to achieve, while acknowledging the many socioeconomic factors and interactions between them. This is more evident in countries with a high level of silo working, where delivering shared goals is not prioritized (this issue is picked up in more detail below). Another source of pragmatism relates to timing – what can be achieved in a fixed time period – resulting from a conceptual failure to understand the length of time it takes to change health outcomes across the life-course and intergenerationally (see Chapter 2).
Improvements in early detection and treatment of existing undiagnosed illness in primary care show the fastest results, so are prioritized over long-term investment in the “causes of the causes”. As a result, the demand for rapid downstream interventions continues to rise (or is sustained).
Box 8.2
The principles of good governance
�� Legitimacy and voice: that all stakeholders be included in a legitimate process of development.
�� Direction: that a clear vision is set.
�� Performance: that a measurable process and outcomes are set.
�� Accountability: that all relevant sectors are accountable for shared goals.
�� Fairness: that the governance systems proposed involve equitable processes backed by legislation
Source: Graham et al. (777).

160 Review of social determinants and the health divide in the WHO European Region: final report
Measurement of trends is also needed to track the consequences of policy decisions on the magnitude of inequities in health. Infrastructure support for information technology and capacity building is required for this to be sustainable. An independent expert report commissioned through the Spanish Presidency of the EU highlighted how many countries across the EU community face major challenges in this regard (778). This is also true for other subregions of Europe (664). The simple consequence is that countries cannot improve what they do not measure, as indicated in Chapter 7.
8.3.3 Control-strategy failure
Many systems established by government have failed to deliver sustained and systematic improvements in health equity. Conceptual failure and delivery-chain failure have been discussed above; a third reason arises from failure to develop an effective “control strategy” capable of holding all stakeholders to account for delivery of actions necessary to reduce inequities.
An effective control strategy sets out the actions required by all sectors to improve equity. It also specifies the instruments appropriate to achieving this − sanctions and rewards that are important to mitigate failure and sustain action on social determinants over time. To be effective, a control strategy should be designed to control the actions taken (inputs) and ensure they achieve the intended results (outputs). As indicated in Chapter 7, reducing inequities in health requires coherence of action across a range of stakeholders, many of whom are not in formal government. As such, many instruments embedded within different sectors of society are needed to make a control strategy effective. National and local government has the primary role in ensuring that these are in place and operating effectively.
8.3.4 Public health system failure
Governing for equity in health through action on social determinants demands new leadership and delivery roles for ministries of health and the health community, as discussed in Chapter 7. The whole-of-government and whole-of-society approaches needed to improve and sustain equity require that governments and health professionals take on a greater diversity of roles. In developing the new public health strategy for Europe, the Regional Office (in partnership with Member States) has identified a mismatch between current public health practice and that required to be effective in protecting and promoting health and health equity. Many of the causes of ill health and health lie in social determinants and social and cultural factors that are outside the direct control of ministries of health.
Lack of appropriate incentives and mechanisms for acting across sectors and determinants
Failure to act across the causal chain of determinants with sufficient effort to produce changes of the magnitude needed to reduce gradients has also been observed, even when national targets and inequity strategies and plans are in place. Reasons for failure in these cases commonly arise from a lack of appropriate incentives and supporting mechanisms to achieve action across a range of sectors and determinants, such as the absence of shared targets and reporting linked to core budgets and processes for joint review. This can often be traced back to a design failure when strategies and policies were being developed.
While much effort is placed on strategic development, policy development seldom includes assessments of human and institutional capacity to deliver and the incentives and mechanisms critical to success. Many well-meaning and clearly written policies and strategies are consequently only partially implemented. Partial implementation tends to be the case where there are already good relationships with other sectors or stakeholders, where there is existing capacity within systems or where capacity can be controlled through the influence of a single sector on other sectors and stakeholders outside government. This situation can be compounded by failure in the early stages of policy development to build a shared understanding and commitment to address inequities through action on social determinants, which in turn can lead to an absence of shared targets and budgets and appropriate accountability systems.
Lack of investment in ongoing assessment of trends in inequities and social determinants
Emerging evidence suggests that social determinants interact in different ways over time to produce the pathways that sustain or alter the nature and magnitude of inequities in health. If there is inadequate investment in assessment of recent trends in inequities in health and its social determinants, understanding of current pathways lags behind reality. This can contribute to path dependency, where ways of doing things stay the same in a changing world: it is often referred to as “inherited wisdom” and may play a significant role in explaining why interventions are not delivering intended results.
Gaps in quality and type of data/intelligence
Reliable data on demographic trends and morbidity and mortality are available in many countries, but most lack information broken down by SES, such as income, employment status and education. This is a significant weakness in addressing health inequities. It limits monitoring of interventions and assessments of non-health sector policies on health and the capacity to advocate, implement and evaluate effective policies and interventions targeting the underlying social and economic causes of health and health inequities.

Implementing action based on the social determinants of health approach 161
8.4 Systems for achieving health equity through action on social determinants
This section sets out systems checklists for governance and delivery of health equity as a whole-of-government and whole-of-society approach. It builds on the issues set out in the previous sections, based on the evidence and analysis presented in the report of the task group on governance and delivery (664).
8.4.1 Governance checklist
Approaches to governance for health equity were outlined in Chapter 7, based on the whole-of-government and whole-of-society principles set out by Kickbusch & Gleicher (20) and human rights and other equity principles identified in Chapter 2. This section focuses on implementing these approaches. It summarizes a draft framework to support practical advice on implementing governance for health equity through action on social determinants and, building on the discussion in Chapter 7, draws on other evidence-informed frameworks and governance tools, including the work of the Public Health Agency of Canada, on necessary steps for implementing intersectoral action for health (779), the work of Valentine et al. on translating the social determinants of health agenda in action at country level (780) and that of Brown et al. in developing the social determinants of health governance appraisal tool and companion resource guide (781).
On this basis, and drawing on the analyses presented in Chapter 7 and this chapter, Table 8.2 brings together the system characteristics (or functions) that need to be implemented to ensure that governance for health equity is effective in addressing social determinants and reducing inequities in health. The checklist does not seek to prescribe an ideal or “best” governance structure that countries should adopt. Instead, it draws out a set of general functions that need to be embedded in a country’s governance arrangements to deliver improved equity in health through action on social determinants. The functions are generic – this is deliberate, as further debate and work in this area is needed to enable appropriate adaptation of recommendations to different policy-making levels across diverse cultures, traditions and development conditions of Member States.
Progress towards developing public health systems and capacities capable of delivering the critical actions and recommendations outlined in this report is weak and uneven.
Redesigning public health programmes to address health equity
There is a clear role for public health governance in tackling social determinants to reduce health inequities. While addressing inequities is central to a population health approach, it requires focused efforts in the analysis of health issues and in the funding, planning, delivery and evaluation of interventions. Public health needs to perform new roles in shaping policies that promote health equity and systematically addressing underlying social determinants through approaches that create specific incentives for collaboration. The following example from Spain provides an important illustration of how to enhance governance for health equity by building capacity for redesigning public health programmes to better tackle the social determinants.
Case study: building capacity to integrate the social determinants of health and an equity focus into health strategies, programmes and activities in Spain
The health promotion area of the Ministry of Health, Social Services and Equality coordinated a training process to “integrate a focus on social determinants of health and equity into health strategies, programmes and activities” based on the experience of the Chilean Ministry of Health in 2008/2009. The Spanish training was carried out with teaching support and advice from experts in health equity from Chile and the main leaders of the Chilean process and was technically supported by the Regional Office and Virtual Public Health Campus of the Pan American Health Organization. It forms part of the national strategy on health equity and encouraged cross-sector working and the concept of “Health and equity in all policies”. The final goal was to mainstream health equity as an explicit, cross-cutting and practical axis in all plans and activities in public health, health care and other policies that affect social determinants of health.
Nine working teams were formed during the training process, each focusing on a specific strategy, programme or activity in the following areas: childhood, HIV, cancer prevention, healthy eating and physical activity, vulnerable groups, tobacco and school, colorectal cancer, youth and healthy cities. Each team carried out an equity analysis of the topic selected, identifying which social determinants were the main influences and proposing alternative options for intervening with an equity lens. Some working teams went further and developed a proposal for redesigning their topic based on equity considerations.

162 Review of social determinants and the health divide in the WHO European Region: final report
Table 8.2
Functions and characteristics important in governing for equity in health through action on social determinants
Domain Systems’ characteristics Exemplified by
1. Political commitment �� Clear political commitment 1.1. Ministerial accountability for governance and delivery of social determinants/health inequities 1.2. Specific political roles for social determinants/health inequities at national, regional and local levels1.3. Cross-government committee for social determinants and equity 1.4. Explicit budget for social determinants/health inequities management1.5. Institutional and legislative framework for equity in health and development
2. Intelligence �� Evidence and information to: a) inform policy and investment decisions b) monitor progressc) hold stakeholders to account
�� Research and intelligence on social determinants/health inequities trends and policies
�� The effectiveness of governance and delivery systems
�� Metrics (targets/indicators for improvement in health equity and distribution of social determinants at European, national and local levels)
2.1. Social determinants/health inequities as a core work and funding stream in research budgets2.2. Social determinants/health inequities evidence systematically reviewed and publicly reported2.3. Dedicated health intelligence and analysis services producing open-access data 2.4. Input, output and outcomes data published on social determinants/health inequities at local, national and European levels2.5. Agreed minimum data sets/reporting requirements on social determinants, equity and health inequity for national and local levels
3. Accountability structures and systems
�� Legislative structures and systems enabling intersectoral action on social determinants/health inequities at European, national and local levels
�� Statutory “governance boards” capable of holding all stakeholders to account
�� Legislative structures and systems enabling formation and action of NGOs and civil society groups as partners in action to reduce inequities and monitoring progress
3.1. A legal framework involving a duty placed on all health and non-health stakeholders to collaborate and report on social determinants/health inequities actions and outcomes3.2. Community health status/outcome (social determinants/health inequities) boards, established with explicit powers to review data/progress of policies, review options/solutions for improving health equity and hold all stakeholders to account3.3. Statutory roles with formal duty to reduce inequities through action on social determinants, empowered to publicly mandate action at European, national and local levels (public health ministers, chair of parliamentary development committees, prime ministers, ombudsman)
4. Policy coherence across government sectors and levels
�� A formal and explicit framework setting out stakeholders and policy action for improving equity in health and development (social determinants)
�� Framework linked to ministerial portfolios and budgets nationally and locally
�� Government policy audited through health impact assessment and equity impact assessment instruments that institutionalize collaboration across sectors and levels of government
4.1. Coherence of sectoral actions (national and local) on agreed social determinants and equity targets.4.2. Outcomes explicitly defined for all government and sectoral spending nationally and locally4.3. Specific agreements with the private sector (industry/commerce) on their contribution to delivering equity targets 4.4. Outcomes assessed and published by all ministries/directorates at all levels of governance 4.5. Impact assessments, which should be public domain documents, challengeable through accountability mechanisms4.6. Systems for joint accounting for results in place, including pooled budgets, shared targets, joint review and reporting of progress and integrated intelligence systems

Implementing action based on the social determinants of health approach 163
Domain Systems’ characteristics Exemplified by
5. Involving local people �� Commitment to participation of local people and subnational authorities in policy design and review
�� Instruments and systems securing community involvement in solutions
�� Intelligence and data on health, equity and social determinants made accessible within the public domain – locally, nationally and European
5.1. Mechanisms, organizational design and capacity building to enable a diversity of voices and perspectives from the community and local level in local decision-making and solutions5.2. Representatives at all levels of social determinants/health inequities governance, who should be equal members alongside professional members of decision-making committees5.3. Tools, instruments and support to local level to define local problems and solutions, informed by local data 5.4. Public reporting of actions and progress to allow access and debate of results and new challenges by and with community/third parties
6. Institutional and human resource capacity
�� Capacity development, including:– the development of competent and trained social determinants/health inequities staff– institutional processes– formal accountability, annual publishing of progress results
6.1. Programmes supporting political, civic and professional leadership of social determinants/health inequities within different institutional and social systems of society locally and nationally (and in Europe)6.2. Curriculum modules on equity, health and social determinants in professional and vocational training, within and outside the health sector6.3. Formal protocols defining institutional arrangements and expectations related to social determinants/health inequities in all sectors
7. Modernized public health
�� Public health training and practice reviewed and modernized
7.1. Develop revised descriptors and competencies for national public health practice7.2. Develop revised descriptors for domains of public health intervention (with an increased focus on the use of new social media technology, management of social change and citizen mobilization)7.3. Develop new/update training for public health professionals
8. Learning and innovation systems
�� Commitment to continuous improvement in understanding of social determinants/health inequities and the efficacy of policies and interventions to reduce inequities �� Commitment to ongoing performance review/improvements in governing for equity in health through action on social determinants
8.1. Strengthen learning transfer systems within and between countries to accelerate uptake of promising policies and governance instruments8.2. Enrich national and European capacity to tackle inequities in health through establishing multicountry innovation programmes, live demonstration sites/exchanges and documenting and disseminating learning 8.3. Establish European registry of policies and governance systems addressing inequities through action on social determinants
Table 8.2 contd

164 Review of social determinants and the health divide in the WHO European Region: final report
8.5 Reducing the health divide between countries in Europe
As indicated in Chapter 1, there is a major health divide between countries in the Region, with poorer health outcomes and larger health inequities in the east. A reduction of health inequities in these countries, based on actions summarized in section 8.4, therefore has the potential to reduce differences between countries. The 10-year gap in life expectancy between high- and low-educated people in Lithuania, for instance, contributes markedly to the low life expectancy compared to other EU countries.
8.4.2 Delivery system characteristics
Identifying the characteristics of effective governance for health is crucial, but it needs to be accompanied by a delivery system that enables action to be taken across the levels, systems and sectors that are the subject of the governance arrangements. Table 8.3 draws on the discussion in this and the previous chapter to summarize the key delivery systems characteristics. As these functions complement those of an effective governance system, there is some necessary overlap.
Table 8.3
Summary of key delivery systems characteristics
Delivery function Delivery systems characteristics
1. Defined delivery chain The delivery chain for social determinants/health inequities is explicit, understood, described, owned, supported or managed by the relevant stakeholders
2. Ownership and active management The delivery system has an explicit control loop managed by a defined owner (governance system/minister/professional) with positional authority whose aim is to identify and correct risks to delivery and outcome failures
3. Levers and incentives The system has defined levers and incentives available to both the manager and system stakeholders
4. Performance management The system has a performance management system with appropriate metrics and systems for research, data collection, monitoring and evaluation related to input/output processes and outcomes
5. Strong leadership The delivery system has strong leadership that is politically accountable to the community it serves through clear governance structures at all levels of the delivery chain
6. Sustainable financing and training The system is adequately and sustainably financed within a statutory institutional framework and has staff that are appropriately trained
7. Political support and statutory responsibilities The delivery system has both political support and functional independence and has the statutory responsibilities and authority necessary to require delivery action from all relevant stakeholders in the delivery chain
8. High public visibility and engagement The system has high public and political visibility with a strong media (and electronic) presence and is capable of mobilizing wider society to use the data it controls to support change from delivery-chain stakeholders (that is, to generate popular demand for change through mechanisms of monitory democracy (see section 5.3))
9. Annual reporting The system reports annually to the public it serves, identifying obstacles to progress and proposed corrective actions attributable to named individuals and institutions
10. Development support and public scrutiny The system works through prospective developmental interventions (working with stakeholders to improve their functional performance in the delivery chain) and through methods involving corrective scrutiny (publicly identifying culpable failure and its consequences)
11. Metrics, research and evaluation The delivery system commissions relevant research and evaluation and has clear metrics and mechanisms for regular process input, output and outcome reviews and continuous reflective learning (an internal improvement control loop (see Chapter 6)); this is to be captured and reported on an annual basis

Implementing action based on the social determinants of health approach 165
United Nations organizations, particularly WHO, need to be able to stand up to major donors and powers. The Regional Office presently gets most of its financing through earmarked money, conditional on being used for specific purposes. There is an urgent need for a different system of financing, one that would allow the organization to set its own priorities, such as a strong focus on the reduction of inequities in health and its social determinants and the improvement of human development and health in all parts of Europe, concentrating in particular on where they are currently worst.
A reduction in the large and growing gap between high- and low-educated individuals in the Russian Federation could break the decades-long stagnation of life expectancy and improve the country’s position versus the rest of Europe. Some of the tools for reducing country differences therefore lie in the hands of national governments, based on the systems summarized in section 8.4: but as indicated in Chapter 6, not all do. Money, power and resources in Europe are tied to international and European power centres. They shape the “causes of the causes” behind health trends in the Region.
Europe demonstrates uniquely strong elements of inter-regional dynamics. Bilateral and multilateral relations among the 53 Member States, rooted in history, are very important for their economic as well as social and health development. This has not always led to positive improvements, however. As indicated in Chapter 3, the political division between countries of western Europe and those of the former Soviet Union after the Second World War became reflected in what remains a “European health divide”.
European countries have built regional collaborations with more-or-less far-reaching ambitions. Some have the potential to contribute to reductions in the health divide between engaged countries by influencing public health competence and the macro determinants of health (Box 8.3).
How to design international institutions that are able to channel mutual responsibilities into new global or regional policies is a major issue. The 53 countries in the Region have built a number of organizations to deal with their common problems. Many already have a commitment to improving health, education or the social determinants of health in general, although this is not always of primary interest. It should nevertheless be possible to raise the importance of health equity in these organizations and to engage them for health equity, particularly in relation to closing the European health divide. This is most likely to come about if individual countries make it their business to raise the issue, but stronger transnational governance structures and organizations are needed to give focus and channel these concerns towards action.
Above all, the United Nations and WHO need to be given a larger role to match the scale of the problems across Europe. The Regional Office does not have the resources or levers, particularly in using its influence to reduce differences in health and its social determinants between countries. Its partners in the United Nations family in Europe can make it a little stronger through greater use of the “United Nations collaboration mechanism”, an interagency dialogue around common problems. This mechanism actually works in Europe, but the issue of equity needs to be higher up the agenda of participating agencies at its regular meetings.
Box 8.3
Regional collaborations, Europe
�� The EU, originally 6 countries, today embraces 27, with another 12 or more on line to enter. Accession talks have profound effects on social and economic arrangements in countries wishing to join. The 10 countries that joined the EU in 2004 have seen improved population health, partly as a result of complying with detailed European legislation, the so-called “aquis-communitaire”. The EU has a “public health competence” since the Maastricht Treaty in 1993. Accession talks provide an opportunity for the EU to strengthen the public health competence of countries who want to join. EU Structural Funds represent another opportunity to reduce country differences. Their purpose is to strengthen economic and social cohesion within the EU. It would be natural to extend the use of accession funds to strengthen the public health competence of countries applying for membership.
�� The Russian Federation, Belarus and Kazakhstan formed a customs union in 2010 and the Eurasian Economic Community in 2000 with Kyrgyzstan and Tajikistan, with Armenia, the Republic of Moldova and Ukraine as observers. Among its aims is to “give the citizens of community states equal rights in receiving education and medical assistance throughout its territory”.
�� Turkey was instrumental in setting up the Organization of the Black Sea Economic Cooperation, effective from 1992 and now with 12 member countries, primarily from the Black Sea area and the Caucasus, plus 11 observer countries. Its purpose is to “ensure peace, stability and prosperity and encourage friendly and good-neighbourly relations in the Black Sea region”.
��While the above organizations cover parts of Europe, the aim of the CoE is to cover all of it. Forty-seven countries are members, representing a population of 800 million. The CoE has a strong focus on human rights and hosts the Court of Human Rights in Strasbourg. It also explicitly embraces social rights, such as the right to protection of health: “Membership of the Council of Europe presupposes the obligation for states to ensure their people’s prerogative to basic human rights, and among such rights is the right to health protection.” The CoE’s public health commitment could be improved to embrace health equity. Its credo, “47 countries − one Europe”, seems to imply that the ambition for public health should be to reduce health inequities between and within Member States.

166 Review of social determinants and the health divide in the WHO European Region: final report
Capacity building
Local governments across Europe vary significantly in their capacity to take action on the social determinants of health and inequities in health.
Understanding of local government’s role and the potential range of actions available is more developed in themes traditionally associated with inequities in health, such as services for, and prevention work with, children and young people and with vulnerable communities. Relatively little evidence indicates that this agenda has significantly penetrated into more mainstream local government work, such as urban development or antipoverty initiatives. In transport, for example, the focus appears to be mainly on encouraging and facilitating walking and cycling. The rhetoric of “bending mainstream budgets to tackle inequities in health” requires greater understanding and evidence on what it might mean in practice. Practical examples of how authorities have managed to build action on social determinants into mainstream agendas are needed.
Managing the political context
Political commitment is essential to successful policy implementation. The central importance of local political leadership should therefore be explicitly recognized and supported in developing tools to promote the progression of this agenda within local government.
Knowledge transfer
Local governments across the Region are at very different stages in tackling inequities in the social determinants of health. There seems to be a strong, but often underused, opportunity for international learning and exchange. This is not to underestimate the potential complexity of transferring knowledge across different local government contexts: transferring learning in a country between similar tiers of government might be relatively straightforward, but doing so where there are substantial differences in settings requires a nuanced approach. The challenges local government faces nevertheless resonate across many countries, despite differences in political climate, financing mechanisms and system culture.
Cooperation and partnership
To stimulate addressing the social determinants of health, “adequate inclusive and empowering policy responses should be directed at combating the polarising mechanisms in central arenas such as the labour market, the housing market, social services and education” (782). Local government is quite often successful in bring together actors on issues with one common goal to address the needs of specific groups (such as children and young people or young adults), but partnership working sometimes lags behind in more diffuse areas, such as spatial planning.
In summary, countries whose health levels lag behind most western European states have got some of the tools for health improvement in their own hands. By reducing health internally, they would improve their position compared to countries with the best levels of health. But this is not enough. It is also necessary to raise the issue of health equity and the health divide through the various multilateral organizations in Europe. Countries are mutually dependent, so international institutions can channel joint efforts towards solving common problems. Strengthening the United Nations system of regional and global institutions, particularly WHO, should be undertaken as a contribution, but ultimately, pragmatic solutions need to be underpinned by a social movement that embraces demands for health equity and addresses the unequal distribution of power, money and resources in Europe, as proposed in the CSDH report (2).
8.6 Role of local government in implementing action on the social determinants of health
As indicated in Chapter 7, local government is increasingly recognized as having a key role in reducing inequities in the social determinants of health by:
�� planning or delivering services that are crucial to addressing them;
�� promoting local autonomy;
�� responding to local need;
�� developing local strategic planning; and
�� providing local accountability and leadership.
Although the political and fiscal context of local government and ongoing local authority initiatives in the Region are important, the practicalities of how to implement change is key to action on reducing inequities in the social determinants of health. Existing literature on implementing action is relatively weak. From interviews, Grady et al. (680) highlighted six key implementation factors:
�� the level of intersectoral cooperation;
�� policy coherence;
�� the strength and communication of the evidence base;
�� capacity building;
�� managing the political context; and
�� knowledge transfer.

Implementing action based on the social determinants of health approach 167
Empowerment, assets and control over one’s life
In drawing up its recommendations for action, the review has focused on resilience and assets that protect against damage, reduce harm or alter processes that lead to vulnerability and exclusion (see Chapter 5). Examples include action on postnatal depression and bonding, maternity leave and active home visiting (through, for example, family−nurse partnerships), coproduced decisions and inclusion, raising levels of effective civic participation in building conditions in which women and men are able to take control of their own lives, and ensuring appropriateness, uptake and sustainability of initiatives through active participation and engagement of the community and disadvantaged groups.
Interest in developing partnerships to address root causes of health inequities based on bottom−up planning and drawing knowledge from communities to inform interventions and assess policies is increasing. Examples of this in formal institutional arrangements within countries include the community health partnership in Florence, Italy, municipality health-promotion management groups in Finland, health and well-being boards in United Kingdom (England) and The World Bank-supported village investment project in Kyrgyzstan, whose aim is to strengthen local capacity and infrastructure for social and economic development in rural areas and to alleviate poverty. Sixty-five per cent of the 5.1 million population of Kyrgyzstan live in rural areas, with the rural population accounting for about 80% of the extremely poor. The village investment project promotes good governance at the level closest to local people, providing the impetus for sustained economic development and contributing to employment generation. Mechanisms that foster participation and ensure transparency in decision-making over priority setting, resource allocation and review include open public budgeting and planning meetings, community hearings to support participation and capacity building for local people and community organizations in budgeting, and participatory planning and implementation.
Engagement in this agenda by stakeholders, including employers, social partners, professional organizations, interest groups and NGOs, is essential. Action is ultimately about the values and principles outlined in Chapter 2: it is through a social movement – built up by individuals, organizations and communities – that these will be articulated and promoted. This needs to happen locally in organizations’ areas of influence and responsibility and by influencing other sectors through effective communication of values and messages.
This has been recognized since the early 1990s and is the reason that countries like Denmark and the Netherlands introduced models in which social housing agencies, schools, municipalities and local entrepreneurs work together to improve deprived neighbourhoods. Whether this approach is successful or not has yet to be determined.
Building policy and legislative structures and frameworks that enable action
The political and fiscal structures in which local authorities are embedded shape opportunities for tackling inequities in health and the social determinants of health.
Structures need to be enabling, providing, at a minimum, a legal basis for carrying out the tasks required. One area where enabling instruments and structures are particularly important is in the question of coordination. Partnership is inherent to successfully tackling inequities in health, as many social determinants have a major non-health aspect. Multiple departments or actors often work on the same subject, almost in the same way, but are not enabled to cooperate. Supportive instruments for coordination, both legal and fiscal, are required.
8.7 Active community participation and engagement
Involving communities
Coproduced decisions and inclusion are required, as outlined in Chapter 5. Raising levels of effective civic participation is important in building conditions in which individuals are able to take control of their own life throughout the life-course.
Specific issues are to ensure appropriateness, uptake and sustainability of initiatives through active participation and engagement of the community and disadvantaged groups. This requires smarter governance that enables communities to steer governments and other agencies to pursue health and well-being as collective goals. New structures for governance and leadership are needed to do this. Rather than building capacity from outside, empowering social, political and economic systems that release capacity within organizations, professional groups and disadvantaged groups should be created. Different types of knowledge and evidence are needed, built on the experience and interpretation of people in the groups and communities affected. Professionals engaged in frontline services may often be able to provide community leadership in taking action. Action taken locally outside formal policy imperatives can provide a rich resource for promoting innovation and informing future policy. Mechanisms for capturing and learning from local innovations should be incorporated in smart governance processes.

health needs – proportionate universalism –underpinned by recognition of:
�� health and its social determinants as basic human rights;
�� acceptance of mutual responsibilities between countries and groups within countries;
�� the need for equity within and between generations;
�� the role played by national and transnational economic, social, political and cultural processes operating through the life-course in determining social position and leading, to a greater or lesser degree, to exclusion and vulnerability;
�� the importance of empowerment and control for individuals and communities, based on their assets and rights; and
�� the need to ensure a minimum standard of healthy living for everyone.
“Governance for health” systems that are competent to deliver these strategies will include characteristics that demonstrate:
�� a high level of political will and commitment to reducing health inequities at international, national and local levels;
�� institutional readiness, involving private, public and NGO sectors, focused on policy development and capacity to deliver;
�� equity (including intergenerational equity) in all policies;
�� a rights-based approach to health and its social determinants with structures and systems that require collaboration and action from key stakeholders;
�� transparency in how resources are used and decisions are taken, combined with active policies against corruption;
�� accountability mechanisms that are transparent and based on empowerment and involvement of individuals and communities, with metrics in the public domain showing: �� the extent of inequities and progress in addressing them; �� evaluation of interventions; �� the equity impact of all policies; �� the social and economic costs of inequities and the benefits of reducing them for health and for wider societal goals such as cohesion, sustainable development and economic recovery; and�� the extent of assets and resilience in society;
168 Review of social determinants and the health divide in the WHO European Region: final report
9 The recommendations
9.1 Background
It is not possible to reduce inequities in health without addressing inequities in the causes of ill health – social divisions, unequal exposure to harm and differential levels of resilience. Countries can utilize “Health equity in all policies” as a key commitment to inform further action to reduce health inequity and address the social determinants of health, but new systems of governance and delivery are also required. These need to operate at all levels of governance, involving the whole of society and whole of government. It is recommended that reduction of health inequities should become one of the principal criteria used to assess health system and government performance in all countries in Europe. It should also be a principal criterion for assessing the work of the Regional Office.
But nothing will happen without monitoring and adequate review to ensure accountability and transparency. It is recommended that all 53 Member States of the European Region establish clear strategies to redress the current patterns and magnitude of health inequities by taking action on the social determinants of health. The review’s recommendations provide the framework for doing this, supporting the development and implementation of the new European policy framework for health and well-being, Health 2020 (1).
It is recognized that countries are at very different starting points in terms of health, health equity and socioeconomic development. While this may limit what is feasible in the short term and the timescale for addressing specific issues, it should not affect the long-term aspirations of the strategy.
Priorities in a broad and wide-ranging strategy should include the following:
�� early child development and education;
�� employment and working conditions;
�� intersectoral action at older ages;
�� social protection;
�� sustainability and communities;
�� prevention and treatment;
�� reducing exclusion and vulnerability;
�� reducing gender inequity; and
�� helping to shape European and global policies for health equity.
Action should be taken on a universal basis but in recognition of the social gradient in health and be delivered with an intensity that relates to social and
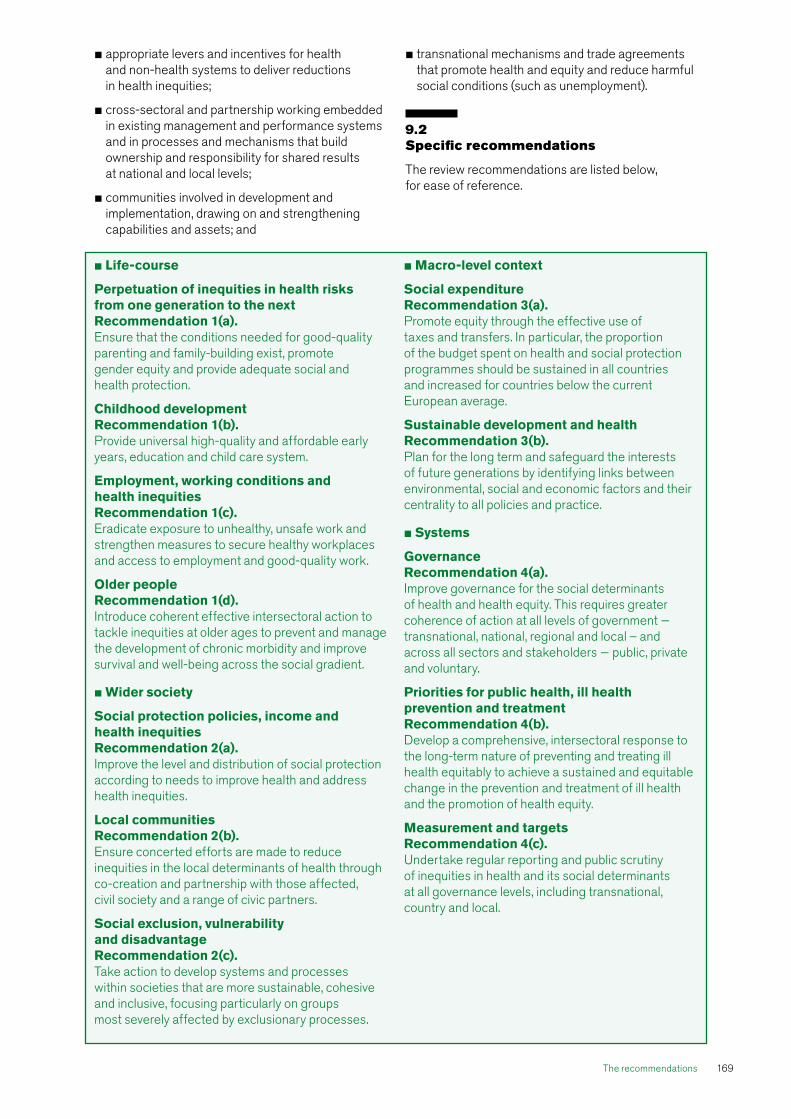
�� appropriate levers and incentives for health and non-health systems to deliver reductions in health inequities;
�� cross-sectoral and partnership working embedded in existing management and performance systems and in processes and mechanisms that build ownership and responsibility for shared results at national and local levels;
�� communities involved in development and implementation, drawing on and strengthening capabilities and assets; and
�� transnational mechanisms and trade agreements that promote health and equity and reduce harmful social conditions (such as unemployment).
9.2 Specific recommendations
The review recommendations are listed below, for ease of reference.
The recommendations 169
�� Life-course
Perpetuation of inequities in health risks from one generation to the next Recommendation 1(a).
Ensure that the conditions needed for good-quality parenting and family-building exist, promote gender equity and provide adequate social and health protection.
Childhood development Recommendation 1(b).
Provide universal high-quality and affordable early years, education and child care system.
Employment, working conditions and health inequities Recommendation 1(c).
Eradicate exposure to unhealthy, unsafe work and strengthen measures to secure healthy workplaces and access to employment and good-quality work.
Older people Recommendation 1(d).
Introduce coherent effective intersectoral action to tackle inequities at older ages to prevent and manage the development of chronic morbidity and improve survival and well-being across the social gradient.
�� Wider society
Social protection policies, income and health inequities Recommendation 2(a).
Improve the level and distribution of social protection according to needs to improve health and address health inequities.
Local communities Recommendation 2(b).
Ensure concerted efforts are made to reduce inequities in the local determinants of health through co-creation and partnership with those affected, civil society and a range of civic partners.
Social exclusion, vulnerability and disadvantage Recommendation 2(c).
Take action to develop systems and processes within societies that are more sustainable, cohesive and inclusive, focusing particularly on groups most severely affected by exclusionary processes.
��Macro-level context
Social expenditure Recommendation 3(a).
Promote equity through the effective use of taxes and transfers. In particular, the proportion of the budget spent on health and social protection programmes should be sustained in all countries and increased for countries below the current European average.
Sustainable development and health Recommendation 3(b).
Plan for the long term and safeguard the interests of future generations by identifying links between environmental, social and economic factors and their centrality to all policies and practice.
�� Systems
Governance Recommendation 4(a).
Improve governance for the social determinants of health and health equity. This requires greater coherence of action at all levels of government − transnational, national, regional and local – and across all sectors and stakeholders − public, private and voluntary.
Priorities for public health, ill health prevention and treatment Recommendation 4(b).
Develop a comprehensive, intersectoral response to the long-term nature of preventing and treating ill health equitably to achieve a sustained and equitable change in the prevention and treatment of ill health and the promotion of health equity.
Measurement and targets Recommendation 4(c).
Undertake regular reporting and public scrutiny of inequities in health and its social determinants at all governance levels, including transnational, country and local.


References
1. Health 2020: a European policy framework supporting actions across government and society for health and well-being. Copenhagen, WHO Regional Office for Europe, 2012 (http://www.euro.who.int/en/what-we-do/health-topics/health-policy/health-2020-the-european-policy-for-health-and-well-being, accessed 15 July 2013).
2. Commission on Social Determinants of Health. Closing the gap in a generation: health equity through action on the social determinants of health. Final report of the Commission on Social Determinants of Health. Geneva, World Health Organization, 2008 (http://www.who.int/social_determinants/thecommission/finalreport/en/index.html, accessed 15 July 2013).
3. European health for all database [online database]. Copenhagen, WHO Regional Office for Europe, 2013 (http://data.euro.who.int/hfadb/, accessed 15 July 2013).
4. Livslängden i Sverige 2001−2010. Livslängdstabeller för riket och länen [Life expectancy in Sweden 2001−2010. Life tables for the country and by county]. Stockholm, Statistics Sweden, 2011 (Demografiska rapporter [Demographic reports] 2011:2; http://www.scb.se/statistik/_publikationer/BE0701_2001I10_BR_BE51BR1102.pdf, accessed 15 July 2013).
5. Aldabe B et al. Contribution of material, occupational, and psychosocial factors in the explanation of social inequalities in health in 28 countries in Europe. Journal of Epidemiology & Community Health, 2011, 65(12):1123−1131.
6. Schneider S. The social gradient in morbidity and mortality: a proposed theoretical explanation for health inequalities. Osterreichische Zeitschrift fur Soziologie, 2008, 33(1):43−66.
7. Nussbaum MC. Women and human development: the capabilities approach. Cambridge, Cambridge University Press, 2001.
8. Sen A. The idea of justice. London, Allen Lane, 2009. 9. Stronks K et al. Equity, equality and human rights task group report.
Copenhagen, WHO Regional Office for Europe, 2012. 10. Sen A. Development as freedom. New York, Alfred A. Knopf,
Inc., 1999. 11. Venkatapuram S. Health justice. Cambridge, Polity, 2011. 12. Constitution of the World Health Organization. Geneva, World
Health Organization, 1946 (http://apps.who.int/gb/bd/PDF/bd47/EN/constitution-en.pdf, accessed 15 July 2013).
13. International Covenant on Civil and Political Rights. New York, United Nations, 1966 (http://www.ohchr.org/EN/ProfessionalInterest/Pages/CCPR.aspx, accessed 15 July 2013).
14. International Covenant on Economic and Social and Cultural Rights. New York, United Nations, 1966 (http://www.ohchr.org/EN/ProfessionalInterest/Pages/CESCR.aspx, accessed 15 July 2013).
15. Human rights [web site]. Strasbourg, Council of Europe, 2012 (http://hub.coe.int/web/coe-portal/navigation/human-rights, accessed 15 July 2013).
16. Antonovsky A. Health, stress, and coping. San Francisco, Jossey Bass, 1979.
17. Antonovsky A. Unraveling the mystery of health: how people manage stress and stay well. San Francisco, Jossey Bass, 1987.
18. Morgan A, Ziglio E, Davies M. Health assets in a global context: theory, methods, action. Investing in assets of individuals, communities and organizations. London, Springer, 2010.
19. Morgan A, Ziglio E. Revitalising the evidence base for public health: an assets model. Promotion & Education, 2007, 14(17) (Suppl.):17−22.
20. Kickbusch I, Gleicher D. Governance for health in the 21st century: a study conducted for the WHO Regional Office for Europe. Copenhagen, WHO Regional Office for Europe, 2011 (http://www.euro.who.int/__data/assets/pdf_file/0010/148951/RC61_InfDoc6.pdf, accessed 15 July 2013).
21. Ståhl T et al., eds. Health in all policies: prospects and potentials. Helsinki, Finnish Ministry of Social Affairs and Health, 2006 (http://www.euro.who.int/__data/assets/pdf_file/0003/109146/E89260.pdf, accessed 15 July 2013).
22. Kunst A. Describing socioeconomic inequalities in health in European countries: an overview of recent studies. Revue d’Epidemiologie et Sante Publique, 2007, 55(1):3−11.
23. Mackenbach J et al. Socioeconomic inequalities in health in 22 European countries. New England Journal of Medicine, 2008, 358:2468−2481.
24. Idler EL, Benyamini Y. Self-rated health and mortality: a review of twenty-seven community studies. Journal of Health and Social Behavior, 1997, 38:21−37.
25. Burstrom B, Fredlund P. Self-rated health: is it as good a predictor of subsequent mortality among adults in lower as well as in higher social classes? Journal of Epidemiology & Community Health, 2001, 55:836−840.
26. Borrell C et al. Social exclusion, vulnerability and disadvantage task group background report 6. Socio-economic inequalities in health in cities of Europe: from evidence to actions. Copenhagen, WHO Regional Office for Europe, 2011.
27. Vagero D, Illsley R. Inequality, health and policy in east and west Europe. International Journal of Health Services, 1992, 3:225−239.
28. Mackenbach JP et al. Final Eurothine report. Rotterdam, Department of Public Health, University Medical Centre, 2008.
29. World population prospects: the 2010 revision. New York, United Nations Department of Economic and Social Affairs, 2011 (http://esa.un.org/wpp/Documentation/WPP%202010%20publications.htm, accessed 11 May 2013).
30. Marmot M. Status syndrome: how your social standing directly affects your health and life expectancy. London, Bloomsbury Publishing Plc., 2004.
31. Bobak M, Marmot M. East−west health divide and its potential explanations: proposed research agenda. British Medical Journal, 1996, 312:421−425.
32. The European health report 2012. Charting the way to well-being. Copenhagen, WHO Regional Office for Europe, 2013 (http://www.euro.who.int/__data/assets/pdf_file/0003/184161/The-European-Health-Report-2012,-FULL-REPORT-w-cover.pdf, accessed 15 July 2013).
33. Vagero D. The east−west health divide in Europe: growing and shifting eastwards. European Review, 2010, 18(1):23−34.
34. Bobak M, Marmot M. Coronary heart disease in central and eastern Europe and the former Soviet Union. In: Marmot M, Elliot P, eds. Coronary heart disease epidemiology, 2nd ed. Oxford, Oxford University Press, 2005.
35. Billingsley S. Casualties of turbulent economic transition. Premature mortality and foregone fertility in the post-communist countries [doctoral dissertation]. Barcelona, Universitat Pompeu Fabra, 2009.
36. A decade of transition. Regional monitoring report 8. Florence, UNICEF Innocenti Research Centre, 2001.
37. Men T et al. Russian mortality trends for 1991−2001: analysis by cause and region. British Medical Journal, 2003, 327:964.
38. Ill health prevention and treatment task group final report: review of social determinants of health and the health divide in the WHO EURO Region. Copenhagen, WHO Regional Office for Europe, 2012.
39. Zatonski WA, Bhala N. Changing trends of diseases in eastern Europe: closing the gap. Public Health, 2012, 126(3):248−252.
40. The HEM Project Team. Closing the health gap in European Union. Warsaw, Cancer Epidemiology and Prevention Division, the Maria Skłodowska-Curie Memorial Cancer Centre and Institute of Oncology, 2008.
41. European Community Health Indicators Monitoring (ECHIM) [web site]. Helsinki, ECHIM, 2012 (http://www.echim.org/, accessed 15 July 2013).
42. Healthy life years and life expectancy at birth, by sex [web site]. Luxembourg, Eurostat, 2013 (http://epp.eurostat.ec.europa.eu/portal/page/portal/product_details/dataset?p_product_code=TSDPH100, accessed 15 July 2013).
43. Jagger C et al. Inequalities in healthy life years in the 25 countries of the European Union in 2005: a cross-national meta-regression analysis. Lancet, 2008, 372(9656):2124−2131.
44. Currie C et al., eds. Social determinants of health and well-being among young people. Health Behaviour in School-aged Children (HBSC) study: international report from the 2009/2010 survey. Copenhagen, WHO Regional Office for Europe, 2012 (Health Policy for Children and Adolescents, No. 6; http://www.hbsc.org/publications/international/, accessed 15 July 2013).
171 References

172 Review of social determinants and the health divide in the WHO European Region: final report
69. Walberg P et al. Economic change, crime, and the Russian mortality crisis: a regional analysis. British Medical Journal, 1998, 317:312−318.
70. Kawachi I et al. Social capital, income inequality, and mortality. American Journal of Public Health, 1997, 87(9):1491−1498.
71. Wilkinson R. Unhealthy societies. The afflictions of inequality. London, Routledge, 1996.
72. Stuckler D, King L, McKee M. Mass privatisation and the post-communist mortality crisis: a cross-national analysis. Lancet, 2009, 31;373(9661):399−407.
73. Bobak M et al. Societal characteristics and health in the former communist countries of central and eastern Europe and the former Soviet Union: a multilevel analysis. Journal of Epidemiology & Community Health, 2007, 61(11):990−996.
74. Pikhart H. Social and psychosocial determinants of self-rated health in central and eastern Europe. Boston, Kluwer Academic Publishers, 2002.
75. Carlson P. Self-perceived health in east and west Europe. Another European health divide. Social Science & Medicine, 1998, 46:1355−1366.
76. Portfolio of indicators for the monitoring of the European strategy for social protection and social inclusion – 2009 update. Brussels, European Commission Employment, Social Affairs and Equal Opportunities Directorate-General, 2009 (http://ec.europa.eu/social/main.jsp?catid=756&langid=en, accessed 15 July 2013).
77. Eurostat databases [online database]. Luxembourg, Eurostat, 2013 (http://epp.eurostat.ec.europa.eu/portal/page/portal/statistics/search_database, accessed 15 July 2013).
78. Eurostat. Living conditions and social protection [online database]. Luxembourg, Eurostat, 2010 (http://epp.eurostat.ec.europa.eu/portal/page/portal/income_social_inclusion_living_conditions/data/database, accessed 15 July 2013).
79. Atkinson AB, Micklewright J. Economic transformation in eastern Europe and the distribution of income. Cambridge, Cambridge University Press, 1992.
80. Crisis in mortality, health and nutrition. Regional monitoring report 2. Florence, UNICEF International Child Development Centre, 1994.
81. Marmot M, Bobak M. International comparators and poverty and health in Europe. British Medical Journal, 2000, 321:1124−1128.
82. Bradshaw J. Social exclusion, vulnerability & disadvantage task group background paper 3: child poverty in the WHO European Region. Copenhagen, WHO Regional Office for Europe, 2012.
83. Lundberg O et al. Social protection policies, income and health inequalities. GDP, taxes, income and welfare task group final report. Copenhagen, WHO Regional Office for Europe, 2012.
84. Zambon A et al. Do welfare regimes mediate the effect of socioeconomic position on health in adolescence? A cross-national comparison in Europe, North America, and Israel. International Journal of Health Services, 2006, 36(2):309−329.
85. Aberg Yngwe M et al. Social policy and public health across the lifecourse. International Journal of Social Welfare, 2010, 19(Suppl. 1):S1.
86. Bambra C et al. Gender, health inequalities and welfare state regimes: a cross-national study of 13 European countries. Journal of Epidemiology & Community Health, 2009, 63(1):38−44.
87. European Union statistics on income and living conditions (EU−SILC) [online database]. Luxembourg, Eurostat, 2013 (http://epp.eurostat.ec.europa.eu/portal/page/portal/microdata/eu_silc, accessed 15 July 2013).
88. Lundberg O et al. The Nordic experience: welfare states and public health (NEWS). Stockholm, Centre for Health Equity Studies, Stockholm University/Karolinska Institutet, 2008 (Health Equity Studies No. 12; http://www.chess.su.se/polopoly_fs/1.54170.1321266667!/menu/standard/file/NEWS_Rapport_080819.pdf, accessed 15 July 2013).
89. Kunst A et al. Trends in socioeconomic inequalities in self-assessed health in 10 European countries. International Journal of Epidemiology, 2005, 34(2):295−305.
90. Bambra C, Netuveli G, Eikemo TA. Welfare state regime life courses: the development of western European welfare state regimes and age related patterns of educational inequalities in self-reported health. International Journal of Health Services, 2010, 40(3):399−420.
45. Kortchagina I, Ovtcharova L. Conditions de vie et pauvrete en Russie. Economie et Statistique, 2005, 383−384−385:219−244.
46. Stillman S. Health and nutrition in eastern Europe and the former Soviet Union during the decade of transition: a review of the literature. Economics and Human Biology, 2006, 4(1):104−146.
47. Mitra P, Yemtsiv R. Increasing inequality in transition economies: is there more to come? Washington, DC, The World Bank, 2006 (World Bank Policy Research Working Paper 4007; http://elibrary.worldbank.org/content/workingpaper/10.1596/1813-9450-4007, accessed 15 July 2013).
48. Bandelj N, Mahutga M. The changing patterns of income inequality in postsocialist Europe. Durban, International Sociological Association, 2006.
49. Holscher J. Income distribution and convergence in the transition process − a cross-country comparison. Comparative Economic Studies, 2006, 48(2):302−325.
50. Karaman Aksentijevic N, Denona Bogovic N. Tendencies and causes of economic inequaity in the Republic of Croatia and CEE countries. Transformations in Business and Economics, 2005, 4(1):37−54.
51. Fair society, healthy lives: strategic review of health inequalities in England post-2010. London, Marmot Review Team, 2010 (www.instituteofhealthequity.org, accessed 15 July 2013).
52. TransMonEE [online database]. Geneva, TransMonEE, 2004−2013 (http://www.transmonee.org/, accessed 15 July 2013).
53. Alam A, Murthi M, Yemtsov R. Growth, poverty and inequality in eastern Europe and the former Soviet Union. Washington DC, The World Bank, 2005.
54. Falkingham J. The end of the rollercoaster? Growth, inequality and poverty in central Asia and the Caucasus. Social Policy and Administration, 2005, 39:340−360.
55. Sen A. Poor, relatively speaking. Oxford Economic Papers, 1983, 35(2):153−169.
56. Townsend P. A sociological approach to the measurement of poverty − a rejoinder to Professor Amartya Sen. Oxford Economic Papers, 1985, 37(4):659−668.
57. Karaman Aksentijevic N, Denona Bogovic N, Jezic Z. Education, poverty and income inequality in the Republic of Croatia. Journal of Economics and Business, 2006, 24(1):19−37.
58. Wilkinson R, Pickett K. The spirit level: why more equal societies almost always do better. London, Allen Lane, 2009.
59. van Ourti T, van Doorslaer E, Koolman X. The effect of income growth and inequality on health inequality: theory and empirical evidence from the European Panel. Journal of Health Economics, 2009, 28(3):525−539.
60. Leu RE, Schellhorn M. The evolution of income-related health inequalities in Switzerland over time. CESifo Economic Studies, 2006, 52(4):666−690.
61. Allanson P, Gerdtham U-G, Petrie D. Longitudinal analysis of income-related health inequality. Journal of Health Economics, 2010, 29(1):78−86.
62. Cantanero D, Pascual M, Sarabia JM. Effects of income inequality on population health: new evidence from the European Community Household Panel. Applied Economics, 2005, 7(1):87−91.
63. Dalstra JA et al. A comparative appraisal of the relationship of education, income and housing tenure with less than good health among the elderly in Europe. Social Science & Medicine, 2006, 62(8):2046−2060.
64. Jurges H. Health inequalities by education, income and wealth: a comparison of 11 European countries and the US. Applied Economics Letters, 2010, 17(1−3):87−91.
65. Lillard D, Burkhauser RV. Income inequality and health: a cross-country analysis. Schomllers Jahrbuch: Zeischrift fur Wirtschafts- und Socialwissenschaften/Journal of Applied Social Science Studies, 2005, 125(1):109−118.
66. van Kippersluis H et al. Health and income across the life cycle and generations in Europe. Journal of Health Economics, 2009, 28(4):818−830.
67. Sen A. Inequality reexamined. Oxford, Oxford University Press, 1992.
68. Cornia GA. Labour market shocks, psychosocial stress and the transition’s mortality crisis. Helsinki, United Nations University and World Institute for Development, 1997.

References 173
114. Perna L et al. Socio-economic differences in life expectancy among persons with diabetes mellitus or myocardial infarction: results from the German MONICA/KORA study. BMC Public Health, 2010, 10:135.
115. Quaglia A et al. Socio-economic factors and health care system characteristics related to cancer survival in the elderly. A population-based analysis in 16 European countries (ELDCARE project). Critical Reviews in Oncology/Hematology, 2005, 54(2):117−128.
116. Falkingham J, Evandrou M, Lyons-Amos M. Inequalities in child and maternal health outcomes in CEE and the CIS. Swindon, Economic and Social Research Council, 2012.
117. Vereecken C et al. Breakfast consumption and its socio-demographic and lifestyle correlates in schoolchildren in 41 countries participating in the HBSC study. International Journal of Public Health, 2009, 54(Suppl. 2):180−190.
118. Vereecken CA et al. The relative influence of individual and contextual socio-economic status on consumption of fruit and soft drinks among adolescents in Europe. European Journal of Public Health, 2005, 15(3):224−232.
119. Maes L et al. Tooth brushing and social characteristics of families in 32 countries. International Journal of Dentistry, 2006, 56(3):159−167.
120. Caldwell JC. Education as a factor in mortality decline: an examination of Nigerian data. Population Studies, 1979, 33(3):395−413.
121. Hobcraft J. Women’s education, child welfare and child survival: a review of the evidence. Health Transition Review, 1993, 3(2):159−173.
122. Tolsma J, Coenders M, Lubbers M. Trends in ethnic educational inequalities in the Netherlands: a cohort design. European Sociological Review, 2007, 23(3):325−340.
123. Kolarcik P et al. To what extent does socioeconomic status explain differences in health between Roma and non-Roma adolescents in Slovakia? Social Science & Medicine, 2009, 68(7):1279−1284.
124. Masseria C, Mladovsky P, Hernandez-Quevedo C. The socio-economic determinants of the health status of Roma in comparison with non-Roma in Bulgaria, Hungary and Romania. European Journal of Public Health, 2010, 20(5):549−554.
125. Missine S, Levecque K, Bracke P. Discrimination and ethnic inequalities in depression: a multilevel analysis for the European population. Gothenburg, International Sociological Association, 2010.
126. Chernichovsky D, Anson J. The Jewish−Arab divide in life expectancy in Israel. Economics and Human Biology, 2005, 3:123−137.
127. Adamson P. The childcare transition: a league table on early childhood education and care in advanced countries. Innocenti report card 2. Florence, UNICEF Innocenti Research Centre, 2008.
128. Adamson P. The children left behind: a league table of inequality in child well-being in the world’s richest countries. Innocenti report card 9. Florence, UNICEF Innocenti Research Centre, 2010.
129. Doyle O, McEntee L, McNamara K. Skills, capabilities and inequalities at school entry in a disadvantaged community. Dublin, Gear Institute, University College Dublin, 2010.
130. Causa O, Chapuis C. Equity in student achievement across OECD countries: an investigation of the role of policies. Paris, OECD, 2009.
131. Emerging challenges for children in eastern Europe and central Asia. Multiple indicator cluster survey in 12 countries [online database]. Geneva, UNICEF, 2008 (http://www.micsinfo.org/home.aspx, accessed 15 July 2013).
132. An equal start: improving outcomes in children’s centres. London, Institute of Health Equity, 2012.
133. PISA 2009 results: overcoming social background − equity learning opportunities and outcomes. Vol. 2. Paris, OECD, 2010.
134. Melhuish EC et al. The early years − preschool influences on mathematics achievement. Science, 2008, 321(5893):1161−1162.
135. Database. PISA 2006 database [online database]. Paris, OECD, 2007 (http://pisa2006.acer.edu.au/downloads.php, accessed 15 July 2013).
136. International standard classification of education. Paris, United Nations Educational, Scientific and Cultural Organization, 1997.
137. Eikemo TA et al. Health inequalities according to educational level in different welfare regimes: a comparison of 23 European countries. Sociology of Health and Illness, 2008, 30(4):565−582.
91. Stuckler D, Basu S, McKee M. Budget crises, health, and social welfare programmes. British Medical Journal, 2010, 340:3311.
92. Dalstra JA et al. Socioeconomic differences in the prevalence of common chronic diseases: an overview of eight European countries. International Journal of Epidemiology, 2005, 34(2):316−326.
93. Melchior M et al. Socioeconomic position in childhood and in adulthood and functional limitations in midlife: data from a nationally-representative survey of French men and women. Social Science & Medicine, 2006, 63(11):2813−2824.
94. Regidor E, Ronda E. Decreasing socioeconomic inequalities and increasing health inequalities in Spain: a case study. American Journal of Public Health, 2006, 96(1):102−108.
95. Nicholson A et al. Socio-economic status over the life-course and depressive symptoms in men and women in eastern Europe. Journal of Affective Disorders, 2008, 105(1−3):125−136.
96. Rueda S, Artazcoz L, Navarro V. Health inequalities among the elderly in western Europe. Journal of Epidemiology & Community Health, 2008, 62(6):492−498.
97. Vikhireva O et al. Non-fatal injuries in three central and eastern European urban population samples: the HAPIEE study. European Journal of Public Health, 2010, 20(6):695−701.
98. Mol GD et al. A widening health gap in general practice? Socio-economic differences in morbidity between 1975 and 2000 in the Netherlands. Public Health, 2005, 119(7):616−625.
99. Espelt A et al. Socioeconomic inequalities in diabetes mellitus across Europe at the beginning of the 21st century. Diabetologia, 2008, 51(11):1971−1979.
100. Holstein BE et al. Socio-economic inequality in multiple health complaints among adolescents: international comparative study in 37 countries. International Journal of Public Health, 2009, 54(Suppl. 2):260−270.
101. Borrell C et al. Analyzing differences in the magnitude of socioeconomic inequalities in self-perceived health by countries of different political tradition in Europe. International Journal of Health Services, 2009, 39(2):321−341.
102. Hildebrand V, Van KP. Income inequality and self-rated health status: evidence from the European Community Household Panel. Demography, 2009, 46(4):805−825.
103. Hyde M et al. Comparison of the effects of low childhood socioeconomic position and low adulthood socioeconomic position on self rated health in four European studies. Journal of Epidemiology & Community Health, 2006, 60(10):882−886.
104. Ravens-Sieberer U et al. Subjective health, symptom load and quality of life of children and adolescents in Europe. International Journal of Public Health, 2009, 54(Suppl. 2):151−159.
105. Sucur Z, Zrinscak S. Differences that hurt: self-perceived health inequalities in Croatia and the European Union. Croatian Medical Journal, 2007, 48(5):653−666.
106. Espelt A et al. Disability among older people in a southern European city in 2006: trends in gender and socioeconomic inequalities. Journal of Women’s Health, 2010, 19(5):927−933.
107. Leclerc A et al. Socioeconomic inequalities in premature mortality in France: have they widened in redent decades? Social Science & Medicine, 2010, 62(8):2035−2045.
108. Lecluyse A. Income-related health inequality in Belgium: a longitudinal perspective. European Journal of Health Economics, 2007, 8(3):237−243.
109. Klotz J, Doblhammer G. Trends in educational mortality differentials in Austria between 1981/82 and 2001/2002: a study based on a linkage of census data and death certificates. Demographic Research, 2008, 19:1959−1980.
110. Jasilionis D et al. Sociocultural mortality differentials in Lithuania: results obtained by matching vital records with the 2001 census data. Population (English Edition), 2007, 62(4):597−646.
111. Kristensen PL et al. Tracking and prevalence of cardiovascular disease risk factors across socio-economic classes: a longitudinal substudy of the European Youth Heart Study. BMC Public Health, 2006, 6:20.
112. Hernandez-Quevedo C et al. Socioeconomic inequalities in health: a comparative longitudinal analysis using the European Community Household Panel. Social Science & Medicine, 2006, 63(5):1246−1261.
113. Soskolne V, Manor O. Health inequalities in Israel: explanatory factors of socio-economic inequalities in self-related health and limiting longstanding illness. Health and Place, 2010, 16(2):242−251.
174 Review of social determinants and the health divide in the WHO European Region: final report
162. Parent-Thirion A et al. Fourth European working conditions survey. Dublin, European Foundation for the Improvement of Living and Working Conditions, 2011.
163. Salavecz G et al. Work stress and health in western European and post-communist countries: an east−west comparison study. Journal of Epidemiology & Community Health, 2010, 64:57−62.
164. Euro area unemployment rate at 11.0%. EU27 at 10.3%. Eurostat News Release, 1 June 2012, 81/2012 (http://epp.eurostat.ec.europa.eu/cache/ITY_PUBLIC/3-01062012-AP/EN/3-01062012-AP-EN.PDF, accessed 15 July 2013).
165. Unemployment rate by sex and age groups − annual average, % [online database]. Luxembourg, Eurostat, 2011 (http://appsso.eurostat.ec.europa.eu/nui/show.do?dataset=une_rt_a&lang=en, accessed 15 July 2013).
166. Marmot M et al. Interim first report on social determinants of health and the health divide in the WHO European Region − executive summary. Copenhagen, WHO Regional Office for Europe, 2010 (http://www.euro.who.int/__data/assets/pdf_file/0003/124464/E94370.pdf, accessed 15 July 2013).
167. Employment rates by sex, age and nationality (%). Luxembourg, Eurostat, 2010 (http://appsso.eurostat.ec.europa.eu/nui/show.do?dataset=lfsa_ergan&lang=en, accessed 13 July 2013).
168. Unemployment rates by education. Luxembourg, Eurostat, 2010. 169. Bartley M, Plewis I. Accumulated labour market disadvantage
and limiting long-term illness: data from the 1971−1991 Office for National Statistics’ longitudinal study. International Journal of Epidemiology, 2002, 31(2):336−341.
170. Unemployment rates by duration [online database]. Luxembourg, Eurostat, 2012 (http://epp.eurostat.ec.europa.eu/statistics_explained/images/7/7f/Unemployment_rates_by_duration.PNG, accessed 15 July 2013).
171. von Gaudecker HM, Scholz RD. Differential mortality by lifetime earnings in Germany. Demographic Research, 2007, 17:83−108.
172. Chaix B, Rosvall M, Merlo J. Neighbourhood socioeconomic deprivation and residential instability: effects of ischemic heart disease and survival after myocardial infarction. Epidemiology, 2007, 18:104−111.
173. Chaix B et al. Income change at retirement, neighbourhood-based social support and ischaemic heart disease: results from the prospective cohort study “Men born in 1914”. Social Science & Medicine, 2007, 64:818−829.
174. Martikainen P, Nihtila E, Moustgaard H. The effects of socioeconomic status and health on transitions in living arrangements and mortality: a longitudinal analysis of elderly Finnish men and women from 1997 to 2002. The Journals of Gerontology. Series B, Psychological Sciences and Social Sciences, 2008, 63:S99−S109.
175. Martikainen P, Valkonen T, Moustgaard H. The effects of individual taxable income, household taxable income, and household disposable income on mortality in Finland, 1998−2004. Population Studies, 2009, 19(2):147−162.
176. Sundquist J, Johansson SE. Self reported poor health and low educational level predictors for mortality: a population based follow up study of 39 156 people in Sweden. Journal of Epidemiology & Community Health, 1997, 51(1):35−40.
177. Manor O et al. Educational differentials in mortality from cardiovascular disease among men and women: the Israel Longitudinal Mortality Study. Annals of Epidemiology, 2004, 14(7):453−460.
178. Grundy EM, Tomassini C. Marital history, health and mortality among older men and women in England and Wales. BMC Public Health, 2010, 10:554.
179. Rostad B, Schei B, Lund Nilsen TI. Social inequalities in mortality in older women cannot be explained by biological and health behavioural factors − results from a Norwegian health survey (the HUNT Study). Scandinavian Journal of Public Health, 2009, (4):401−408.
180. Doblhammer G, Rau R, Kytir J. Trends in educational and occupational differentials in all-cause mortality in Austria between 1981/82 and 1991/92. Wiener klinische Wochenschrift, 2005, 117(13−14):468−479.
181. Task group on older people. Health inequalities and the health divide among older people in the WHO European Region. Copenhagen, WHO Regional Office for Europe, 2012.
182. Capewell S et al. Age, sex, and social trends in out-of-hospital cardiac deaths in Scotland 1986-95: a retrospective cohort study. Lancet, 2001, 358:1213−1217.
138. Jurges H. Healthy minds in healthy bodies: an international comparison of education-related inequality in physical health among older adults. Scottish Journal of Political Economy, 2009, 56(3):296−320.
139. van Zanten A. New modes of reproducing social inequality in education: the changing role of parents, teachers, schools and educational policies. European Educational Research Journal, 2005, 4(3):155−169.
140. Grosse Frie K, Eikemo TA, von dem Knesebeck O. Education and self-reported health care seeking behaviour in European welfare regimes: results from the European Social Survey. International Journal of Public Health, 2010, 55(3):217−220.
141. Avendano M, Jurges H, Mackenbach JP. Educational level and changes in health across Europe: longitudinal results from SHARE. European Journal of Social Policy, 2009, 19:301−316.
142. von dem Knesebeck O, Verde PE, Dragano N. Education and health in 22 European countries. Social Science & Medicine, 2006, 63(5):1344−1351.
143. Stirbu I et al. Educational inequalities in avoidable mortality in Europe. Journal of Epidemiology & Community Health, 2010, 64(10):913−920.
144. Lorant V et al. Socio-economic inequalities in suicide: a European comparative study. British Journal of Psychiatry, 2005, 187:49−54.
145. Ferretti F, Coluccia A. Socio-economic factors and suicide rates in European Union countries. Legal Medicine, 2009, 11(Suppl. 1):92−94.
146. Nielsen S, Krasnik A. Poorer self-perceived health among migrants and ethnic minorities versus the majority population in Europe: a systematic review. International Journal of Public Health, 2010, 55(5):357−371.
147. Bollini P et al. Pregnancy outcome of migrant women and integration policy: a systematic review of the international literature. Social Science & Medicine, 2009, 68(3):452−461.
148. Vieno A et al. Health status in immigrants and native early adolescents in Italy. Journal of Community Health, 2009, 34(3):181−187.
149. Pikhart H, Drbohlav D, Dzurova D. The self-reported health of legal and illegal/irregular immigrants in the Czech Republic. International Journal of Public Health, 2010, 55(5):401−411.
150. Jusot F, Silva J, Sermet C. Inegalites de sante liees a l’immigration en France: effet des conditions de vie ou selection a la migration? Revue Economique, 2009, 60(2):385−411.
151. Borrell C et al. Perceived discrimination and health by gender, social class, and country of birth in a southern European country. Preventive Medicine, 2010, 50(1−2):86−92.
152. Molcho M et al. Health and well-being among child migrants in Europe. Eurohealth, 2010, 16(1):20−23.
153. Dominguez-Berjon F et al. The usefulness of area-based socioeconomic measures to monitor social inequalities in health in southern Europe. European Journal of Public Health, 2006, 16(1):54−61.
154. Franzini L, Giannoni M. Determinants of health disparities between Italian regions. BMC Public Health, 2010, 10:296.
155. Ezcurra R, Pascual P, Rapun M. The spatial distribution of income inequality in the European Union. Environment and Planning A, 2007, 39(4):869−890.
156. Dragano N et al. Neighbourhood socioeconomic status and cardiovascular risk factors: a multilevel analysis of nine cities in the Czech Republic and Germany. BMC Public Health, 2007, 7:255.
157. Shucksmith M et al. Urban–rural differences in quality of life across the European Union. Journal of Regional Studies, 2009, 43(10):1275−1289.
158. Heidenreich M, Wunder C. Patterns of regional inequality in the enlarged Europe. European Sociological Review, 2008, 24(1):19−36.
159. Rodriguez-Pose A, Tselios V. Education and income inequality in the regions of the European Union. Journal of Regional Studies, 2009, 49(3):411−437.
160. Siegrist J, Rosskam E, Leka S. Report of task group 2: employment and working conditions including occupation, unemployment and migrant workers. Copenhagen, WHO Regional Office for Europe, 2012.
161. Artazcoz L et al. Social inequalities in the impact of flexible employment on different domains of psychosocial health. Journal of Epidemiology & Community Health, 2005, 59:761−767.

References 175
206. Benach J, Yasui Y. Geographical patterns of excess mortality in Spain explained by two indices of deprivation. Journal of Epidemiology & Community Health, 1999, 53:423−431.
207. Orfila F et al. Evolution of self-rated health status in the elderly: cross-sectional vs. longitudinal estimates. Journal of Clinical Epidemiology, 2000, 53(6):563−570.
208. Marinacci C et al. The role of individual and contextual socioeconomic circumstances on mortality: analysis of time variations in a city of north west Italy. Journal of Epidemiology & Community Health, 2004, 58(3):199−207.
209. Borrell C et al. Socioeconomic position and excess mortality during the heat wave of 2003 in Barcelona. European Journal of Epidemiology, 2006, 21:633−640.
210. Cesaroni G et al. Socioeconomic differentials in premature mortality in Rome: changes from 1990 to 2001. BMC Public Health, 2006, 6:270.
211. Martinez C. Heterogeneity by age in educational inequalities in cause-specific mortality in women in the Region of Madrid. Journal of Epidemiology & Community Health, 2009, 63(10):832−838.
212. Ben-Ezra M, Shmotkin D. Physical versus mental predictors of mortality among the old-old in Israel: the CALAS study. Research on Aging, 2010, 32:595−617.
213. Jaffe DH et al. Does one’s own and one’s spouse’s education affect overall and cause-specific mortality in the elderly? International Journal of Epidemiology, 2005, 34(6):1409−1416.
214. Kalediene R, Starkuviene S, Petrauskiene J. Inequalities in life expectancy by education and socioeconomic transition in Lithuania. Medicina (Kaunas, Lithuania), 2008, 44(9):713−722.
215. Tobiasz-Adamczyk B et al. Long-term consequences of education, working conditions, and health-related behaviors on mortality patterns in older age. A 17-year observational study in Krakow, Poland. International Journal of Occupational Medicine and Environmental Health, 2007, 20(3):247−256.
216. Jensen RT, Richter K. The health implications of social security failure: evidence from the Russian pension crisis. Journal of Public Economics, 2004, 88:209−236.
217. Endres HG et al. Prevalence of anemia in elderly patients in primary care: impact on 5-year mortality risk and differences between men and women. Current Medical Research and Opinion, 2009, 25:1143−1158.
218. Sonia G et al. Differences in overall mortality in the elderly may be explained by diet. Journal of Epidemiology & Community Health, 2008, 54:232−237.
219. Spoerri A et al. Educational inequalities in life expectancy in German speaking part of Switzerland 1990–1997: Swiss National Cohort. Swiss Medical Weekly, 2006, 136(9−10):145−148.
220. von dem Knesebeck O. The importance of social relationships for the association between social inequality and health among the aged. Soz Praventivme, 2005, 50(5):311−318.
221. Grundy E, Holt G. Adult life experiences and health in early old age in Great Britain. Social Science & Medicine, 2000, 21:1061−1074.
222. Knurowski T et al. Socio-economic health differences among the elderly population in Krakow, Poland. Sozial-und Praventivmedizin, 2005, 50(3):177−185.
223. Siegrist J, Wahrendorf M. Participation in socially productive activities and quality of life in early old age: findings from SHARE. Journal of European Social Policy, 2009, 19:317−326.
224. de Belvis AG et al. Social relationships and HRQL: a cross-sectional survey among older Italian adults. BMC Public Health, 2008, 8:348.
225. Amit K, Litwin H. The subjective well-being of immigrants aged 50 and older in Israel. Social Indicators Research, 2010, 98:89−104.
226. Litwin H. Social networks and self-rated health − a cross-cultural examination among older Israelis. Journal of Aging and Health, 2006, 8:335−358.
227. Lucchetti M, Corsonello A, Gattaceca R. Environmental and social determinants of aging perception in metropolitan and rural areas of southern Italy. Archives of Gerontology and Geriatrics, 2008, 46(3):349−357.
228. Gaymu J, Springer S. Living conditions and life satisfaction of older Europeans living alone: a gender and cross-country analysis. Ageing & Society, 2010, 30:1153−1175.
229. Litwin H. Correlates of successful aging: are they universal? International Journal of Aging & Human Development, 2005, 61:313−333.
183. Levin KA, Leyland AH. A comparison of health inequalities in urban and rural Scotland. Social Science & Medicine, 2006, 62:1457−1464.
184. Connolly S, O’Reilly D, Rosato M. House value as indicator of cumulative wealth is strongly related to morbidity and mortality risk in older people: a census-based cross-sectional and longitudinal study. International Journal of Epidemiology, 2010, 39:383−391.
185. Rey G et al. Ecological association between a deprivation index and mortality in France over the period 1997−2001: variations with spatial scale, degree of urbanicity, age, gender and cause of death. BMC Public Health, 2009, 9:33.
186. Merlo J et al. Social inequalities in health − do they diminish with age? Revisiting the question in Sweden 1999. International Journal for Equity in Health, 2003, 2(1):2.
187. Huisman M, Kunst AE, Mackenbach JP. Socioeconomic inequalities in morbidity among the elderly; a European overview. Social Science & Medicine, 2003, 57(5):861−873.
188. Huisman M et al. Socioeconomic inequalities in mortality among elderly people in 11 European populations. Journal of Epidemiology & Community Health, 2004, 58:468−475.
189. O’Reilly D. Standard indicators of deprivation: do they disadvantage older people? Age and Ageing, 2002, 31(3):197−202.
190. Chaix B et al. Disentangling contextual effects on cause-specific mortality in a longitudinal 23-year follow-up study: impact of population density or socioeconomic environment? International Journal of Epidemiology, 2006, 35(3):633−643.
191. van Rossum CT et al. Socioeconomic status and mortality in Dutch elderly people − the Rotterdam study. European Journal of Public Health, 2000, 10:255−261.
192. Antunes JL et al. Sex and socioeconomic inequalities of lung cancer mortality in Barcelona, Spain and Sao Paulo, Brazil. European Journal of Cancer Prevention, 2008, 17:399−405.
193. Materia E et al. Income inequality and mortality in Italy. European Journal of Public Health, 2005, 15(4):411−417.
194. Catalano R. Economic antecedents of mortality among the very old. Epidemiology, 2002, 13:133−137.
195. Pudaric S, Sundquist J, Johansson SE. Country of birth, instrumental activities of daily living, self-rated health and mortality: a Swedish population-based survey of people aged 55−74. Social Science & Medicine, 2003, 56(12):2493−2503.
196. Avlund K, Damsgaard MT, Osler M. Social position and functional decline among non-disabled old men and women. European Journal of Public Health, 2004, 14:212−216.
197. Noale M et al. Predictors of mortality: an international comparison of socio-demographic and health characteristics from six longitudinal studies on aging: the CLESA project. Experimental Gerontology, 2005, 40(1−2):89−99.
198. Nybo H et al. Predictors of mortality in 2249 nonagenarians − the Danish 1905 Cohort Survey. Journal of the American Geriatrics Society, 2003, 51(10):1365−1373.
199. Melzer D et al. Socioeconomic status and the expectation of disability in old age: estimates for England. Journal of Epidemiology & Community Health, 2000, 54(4):286−292.
200. van Rossum CT et al. Employment grade differences in cause specific mortality. A 25-year follow up of civil servants from the first Whitehall study. Journal of Epidemiology & Community Health, 2000, 54(3):178–184.
201. Ishigami A et al. An ecological time-series study of heat-related mortality in three European cities. Environmental Health, 2008, 7:5.
202. Ramsay SE. Are social inequalities in mortality in Britain narrowing? Time trends from 1978 to 2005 in a population-based study of older men. Journal of Epidemiology & Community Health, 2008, 62(1):75−80.
203. Stringhini S et al. Association of socioeconomic position with health behaviors and mortality. Journal of the American Medical Association, 2010, 303(12):1159−1166.
204. Bopp M, Minder CE. Mortality by education in German speaking Switzerland, 1990−1997: results from the Swiss National Cohort. International Journal of Epidemiology, 2003, 32:346−354.
205. Benach J, Muntaner C, Santana V. Employment conditions and health inequalities: final report to the WHO Commission on Social Determinants of Health of the Employment Conditions Knowledge Network (EMCONET). Barcelona/Toronto/Salvador, EMCONET, 2007.

176 Review of social determinants and the health divide in the WHO European Region: final report
254. Mohd Hairi F et al. Does socio-economic status predict grip strength in older Europeans? Results from the SHARE study in non-institutionalised men and women aged 50+. Journal of Epidemiology and Community Health, 2010, 64(9):829−837.
255. von dem Knesebeck O et al. Socioeconomic status and health among the aged in the United States and Germany: a comparative cross-sectional study. Social Science & Medicine, 2003, 57(9):1643−1652.
256. Schollgen I, Huxhold O, Tesch-Romer C. Socioeconomic status and health in the second half of life: findings from the German Ageing Survey. European Journal of Ageing, 2010, 7:17−28.
257. Avendano M et al. Health disadvantage in US adults aged 50 to 74 years: a comparison of the health of rich and poor Americans with that of Europeans. American Journal of Public Health, 2009, 90(3):540−548.
258. Tabassum F et al. Socio-economic inequalities in physical functioning: a comparative study of English and Greek elderly men. Ageing & Society, 2009, 29:1123−1140.
259. Costa-Font J. Housing assets and the socio-economic determinants of health and disability in old age. Health & Place, 2008, 14(3):478−491.
260. Gjonca E, Tabassum F, Breeze E. Socioeconomic differences in physical disability at older age. Epidemiology & Community Health, 2009, 63:928−935.
261. Russo A et al. Lifetime occupation and physical function: a prospective cohort study on persons aged 80 years and older living in a community. Occupational and Environmental Medicine, 2006, 63(7):438−442.
262. Ebrahim S et al. Social inequalities and disability in older men: prospective findings from the British regional heart study. Social Science & Medicine, 2004, 59(10):2109−2120.
263. Adamson JA, Ebrahim S, Hunt K. The psychosocial versus material hypothesis to explain observed inequality in disability among older adults: data from the West of Scotland Twenty-07 Study. Journal of Epidemiology & Community Health, 2006, 60(11):974−980.
264. Halleröd B. Ill, worried or worried sick? Inter-relationships among indicators of wellbeing among older people in Sweden. Ageing & Society, 2009, 29:563−584.
265. Akin B et al. Reproductive history, socioeconomic status and disability in the women aged 65 years or older in Turkey. Archives of Gerontolgy and Geriatrics, 2010, 50(1):11−15.
266. Moe JO, Hagen TP. Trends and variation in mild disability and functional limitations among older adults in Norway, 1986−2008. European Journal of Ageing, 2011, 8(1):49−61.
267. Coppin AK et al. Low socioeconomic status and disability in old age: evidence from the InChianti study for the mediating role of physiological impairments. The Journals of Gerontology. Series A, Biological Sciences and Medical Sciences, 2006, 61(1):86−91.
268. Graciani A et al. Prevalence of disability and associated social and health-related factors among the elderly in Spain: a population-based study. Maturitas, 2004, 48(4):381−392.
269. Sagardui-Villamor J et al. Trends in disability and disability-free life expectancy among elderly people in Spain: 1986−1999. The Journals of Gerontology. Series A, Biological Sciences and Medical Sciences, 2005, 60(8):1028−1034.
270. Fuchs Z et al. Morbidity, comorbidity, and their association with disability among community-dwelling oldest-old in Israel. The Journals of Gerontology. Series A, Biological Sciences and Medical Sciences, 1998, 50(6):M447-M455.
271. Environmental health inequalities in Europe. Copenhagen, WHO Regional Office for Europe, 2012 (http://www.euro.who.int/__data/assets/pdf_file/0010/157969/e96194.pdf, accessed 15 July 2013).
272. Pomerleau J et al. Determinants of smoking in eight countries of the former Soviet Union: results from the Living Conditions, Lifestyles and Health Study. Addiction, 2004, 99:1577−1185.
273. Falkingham J, Akkazieva B, Baschieri A. Trends in out-of-pocket payments for health care in Kyrgyzstan, 2001−2007. Health Policy and Planning, 2010, 25(5):427−436.
274. Huisman M, Kunst A, Mackenbach J. Educational inequalities in smoking among men and women aged 16 years and older in 11 European countries. Tobacco Control, 2005, 14(2):106−113.
275. Idris B et al. Higher smoking prevalence in urban compared to non-urban areas: time trends in six European countries. Health and Place, 2007, 13(3):702−712.
230. Drennan J et al. The experience of social and emotional loneliness among older people in Ireland. Ageing & Society, 2008, 28:1113−1132.
231. Savikko N et al. Predictors and subjective causes of loneliness in an aged population. Archives of Gerontology and Geriatrics, 2005, 41(3):223−233.
232. Nummela OP et al. Self-rated health and indicators of SES among the ageing in three types of communities. Scandinavian Journal of Public Health, 2007, 35(1):39−47.
233. Christelis D et al. Income, wealth and financial fragility in Europe. Journal of European Social Policy, 2009, 19:359−376.
234. Carmel S, Lazar A. Health and well-being among elderly persons in Israel: the role of social class and immigration status. Ethnicity & Health, 1998, 3(1−2):31−43.
235. Pavlovic M. Perception of health among the mobile aged population (part of the study on chronic disease in Croatia). Drustvena Istrazivanja, 2010, 19:1079−1092.
236. Grundy E, Sloggett A. Health inequalities in the older population: the role of personal capital, social resources and socio-economic circumstances. Social Science & Medicine, 2003, 56(5):935−947.
237. Tsimbos C. An assessment of socio-economic inequalities in health among elderly in Greece, Italy and Spain. International Journal of Public Health, 2010, 55(1):5−15.
238. Wroblewska W. Women’s health status in Poland in the transition to a market economy. Social Science & Medicine, 2002, 54(5):707−726.
239. Espelt A et al. Inequalities in health by social class dimensions in European countries of different political traditions. International Journal of Epidemiology, 2008, 37(5):1095−1105.
240. Fors S, Lennartsson C, Lundberg O. Health inequalities among older adults in Sweden 1991–2002. European Journal of Public Health, 2008, 18:138−143.
241. Stenzelius K et al. Patterns of health complaints among people 75+ in relation to quality of life and need of help. Archives of Gerontology and Geriatrics, 2005, 40(1):85–102.
242. Chandola T et al. Social inequalities in self reported health in early old age: follow-up of prospective cohort study. British Medical Journal, 2007, 334:990−993B.
243. Ricoy Lorenzo MC, Pino Juste MR. Perception of quality of life and the use of social welfare resources for the elderly in non-institutionalized elders. Revista Espanola Geriatria Gerontologia, 2008, 43(6):362−365.
244. Gonzalo E, Pasarin MI. Health among the elderly. Gaceta Sanitaria, 2004, 18(Suppl. 1):69−80.
245. Oswald F et al. Housing and life satisfaction of older adults in two rural regions in Germany. Research on Aging, 2003, 25:122−143.
246. Carmel S. Subjective evaluation of health in old age: the role of immigration status and social environment. International Journal of Aging & Human Development, 2001, 53:91−105.
247. Groffen DA et al. Material deprivation and health-related dysfunction in older Dutch people: findings from the SMILE study. European Journal of Public Health, 2008, 18(3):258−263.
248. Perula de Torres LA et al. Health status of the over 60 years of age population and its relationship with sociodemographic factors (ANCO Project). Aten Primaria, 2012, 20(8):425−434.
249. von dem Knesebeck O et al. Socio-economic position and quality of life among older people in 10 European countires: results of the SHARE study. Ageing & Society, 2007, 27:269−284.
250. Huijts T, Eikemo TA, Skalicka V. Income-related health inequalities in the Nordic countries: examining the role of education, occupational class, and age. Social Science & Medicine, 2010, 71(11):1964−1972.
251. Alwan N et al. Do standard measures of deprivation reflect health inequalities in older people? Journal of Public Health Policy, 2007, 28(3):356−362.
252. Asthana S et al. The demographic and social class basis of inequality in self-reported morbidity: an exploration using the Health Survey for England. Journal of Epidemiology & Community Health, 2004, 58(4):303−307.
253. Rautio N, Heikkinen E, Ebrahim S. Socio-economic position and its relationship to physical capacity among elderly people living in Jyvaskyla, Finland: five- and ten-year follow-up studies. Social Science & Medicine, 2005, 60(11):2405−2416.

References 177
298. Shkolnikov VM et al. The changing relation between education and life expectancy in central and eastern Europe in the 1990s. Journal of Epidemiology & Community Health, 2006, 60(10):875−881.
299. Plavinski SL, Plavinskaya SI, Klimov AN. Social factors and increase in mortality in Russia in the 1990s: prospective cohort study. British Medical Journal, 2003, 326(7401):1240−1242.
300. Murphy M et al. The widening gap in mortality by educational level in the Russian Federation, 1980−2001. American Journal of Public Health, 2006, 96(7):1293−1299.
301. Leinsalu M, Vagero D, Kunst A. Estonia 1989−2000: enormous increase in mortality differences by education. International Journal of Epidemiology, 2003, 32:1081−1087.
302. Cifkova R et al. Longitudinal trends in major cardiovascular risk factors in the Czech population between 1985 and 2007/8. Czech MONICA and Czech post-MONICA. Atherosclerosis, 2010, 211:676−681.
303. Peasey A et al. Determinants of cardiovascular disease and other non-communicable diseases in central and eastern Europe: rationale and design of the HAPIEE study. BMC Public Health, 2006, 6:255.
304. Leinsalu M et al. Educational inequalities in mortality in four eastern European countries: divergence in trends during the post-communist transition from 1990 to 2000. International Journal of Epidemiology, 2009, 38(2):512−525.
305. Jaffe DH, Manor O. Assessing changes in mortality inequalities in Israel using a period-specific measure of socio-economic position, 1983−92 and 1995−2004. European Journal of Public Health, 2009, 19(2):175−177.
306. Shkolnikov VM et al. Increasing absolute mortality disparities by education in Finland, Norway and Sweden, 1971−2000. Journal of Epidemiology & Community Health, 2012, 66(4):372−378.
307. Currie C et al. Early years, family and education task group final report. Copenhagen, WHO Regional Office for Europe, 2012.
308. Dyson A et al. Childhood development, education and health inequalities. London, Marmot Review Task Group, 2009 (https://www.instituteofhealthequity.org/projects/early-years-and-education-task-group-report, accessed 15 July 2013).
309. Iacovou M, Sevilla-Sanz A. The effect of breastfeeding on children’s cognitive development. Colchester, Institute for Social and Economic Research, University of Essex, 2010 (https://www.iser.essex.ac.uk/files/iser_working_papers/2010-40.pdf, accessed 15 July 2013).
310. Melhuish EC et al. Effects of the home learning environment and preschool center experience upon literacy and numeracy development. Journal of Social Issues, 2008, 64:95−114.
311. Sylva K et al. Early childhood matters. Evidence from the effective pre-school and primary education project. London, Routledge, 2010.
312. Jefferis BJMH, Power C, Hertzman C. Birth weight, childhood socioeconomic environment, and cognitive development in the 1958 British birth cohort study. British Medical Journal, 2002, 325(7359):305−308.
313. Spencer N. Health consequences of poverty for children. London, End Child Poverty, 2008 (http://www.endchildpoverty.org.uk/files/Health_consequences_of_Poverty_for_children.pdf, accessed 15 July 2013).
314. Bradley RH, Corwyn RF. Socioeconomic status and child development. Annual Review of Psychology, 2002, 53:371−399.
315. Brooks-Gunn J, Duncan GJ, Maritato N. Poor families, poor outcomes: the well-being of children and youth. In: Duncan GJ, Brooks-Gunn J, eds. Consequences of growing up poor. New York, Russell Sage Foundation, 1997:1−17.
316. Korenman S, Miller JE, Sjaastad JE. Long-term poverty and child development in the United States. Results from the NLSY. Children and Youth Services Review, 1995, 17(1−2):127−155.
317. Dearden L, Sibieta L, Sylva K. The socio-economic gradient in early child outcomes: evidence from the Millenium Cohort Study. Longitudinal and Life Course Studies, 2011, 2(1):19−40.
318. U.S. adult literacy programs: making a difference. A review of research on positive outcomes achieved by literacy programs and the people they serve. Syracuse, ProLiteracy America, 2003 (http://literacyconnects.org/img/2011/11/US-Adult-Lit-Programs-Making-a-Difference-Research-review.pdf, accessed 15 July 2013).
276. Layte R, Whelan CT. Explaining social class inequalities in smoking: the role of education, self-efficacy, and deprivation. European Sociological Review, 2009, 25(4):399−410.
277. Schaap MM et al. Female ever-smoking, education, emancipation, and economic development in 19 European countries. Social Science & Medicine, 2009, 68(7):1271−1278.
278. Schaap MM, van Agt HME, Kunst AE. Identification of socio-economic groups at increased risk of smoking in European countries looking beyond educational level. In: Tackling health inequalities in Europe: an integrated approach. EUROTHINE final report. Rotterdam, Department of Public Health, Erasmus University Medical Centre, 2007.
279. Griesbach D, Amos A, Currie C. Adolescent smoking and family structure in Europe. Social Science & Medicine, 2003, 56(1):41−52.
280. European action plan to reduce the harmful use of alcohol 2012−2020. Copenhagen, WHO Regional Office for Europe, 2012 (http://www.euro.who.int/__data/assets/pdf_file/0008/178163/E96726.pdf, accessed 15 July 2013).
281. European status report on alcohol and health 2010. Copenhagen, WHO Regional Office for Europe, 2010 (http://www.euro.who.int/__data/assets/pdf_file/0004/128065/e94533.pdf, accessed 15 July 2013).
282. Beaglehole R et al. NCDs: celebrating success, moving forward. Lancet, 2011, 378(9799):1283−1284
283. Noncommunicable diseases [web site]. Copenhagen, WHO Regional Office for Europe, 2013 (http://www.euro.who.int/en/what-we-do/health-topics/noncommunicable-diseases, accessed 15 July 2013).
284. Stuckler D et al. The public health effect of economic crises and alternative policy responses in Europe: an empirical analysis. Lancet, 2009, 374(9686):315−323.
285. Nemtsov A. A Contemporary history of alcohol in Russia. Huddinge, Sodertorn Academic Studies, 2011 (http://sh.diva-portal.org/smash/get/diva2:425342/FULLTEXT01, accessed 15 July 2013).
286. Leon DA et al. Hazardous alcohol drinking and premature mortality in Russia: a population based case-control study. Lancet, 2007, 369(9578):2001−2009.
287. Rehm J et al. Alcohol accounts for a high proportion of premature mortality in central and eastern Europe. International Journal of Epidemiology, 2007, 36(2):458−467.
288. Stickley A et al. Alcohol poisoning in Russia and the countries in the European part of the former Soviet Union, 1970−2002. European Journal of Public Health, 2007, 17:444−449.
289. van Oyen H et al. Inequalities in alcohol-related mortality by educational level in 16 European countries. In: Tackling health inequalities in Europe: an integrated approach. EUROTHINE final report. Rotterdam, Department of Public Health, Erasmus University Medical Centre, 2007.
290. Garcy AM, Vagero D. The length of unemployment predicts mortality, differently in men and women, and by cause of death: a six year mortality follow-up of the Swedish 1992−1996 recession. Social Science & Medicine, 2012, 74(12):1911−1920.
291. Robertson A, Lobstein T, Knai C. Obesity and socio-economic groups in Europe: evidence review and implications for action. Brussels, European Commission, 2007.
292. Lobstein T, Millstone E. Context for the PorGrow study: Europe’s obesity crisis. Obesity Review, 2007, 8(Suppl. 2):7−16.
293. Costa-Font J, Gil J. What lies behind socio-economic inequalities in obesity in Spain? A decomposition approach. Food Policy, 2008, 33(1):61−73.
294. Roskam AJ et al. Comparative appraisal of educational inequalities in overweight and obesity among adults in 19 European countries. International Journal of Epidemiology, 2010, 39(2):392−404.
295. Mackenbach JP. Health inequalities: Europe in profile. An independent expert report commissioned by the UK Presidency of the EU. London, The Stationery Office, 2005.
296. Bobak M, Powles J. Poverty and non-communicable diseases in central and eastern Europe and the former Soviet Union. London, University College London, 2001.
297. Shkolnikov VM et al. Educational level and adult mortality in Russia: an analysis of routine data 1979 to 1994. Social Science & Medicine, 1998, 47(3):357−369.

178 Review of social determinants and the health divide in the WHO European Region: final report
341. Melhuish EC. Preschool matters. Science, 2011, 333(6040):299−300.
342. Haynes T, Mogstad M. No child left behind: universal child care and children’s long-run outcomes. Oslo, Research Department of Statistics Norway, 2009.
343. Sammons P et al. Effective pre-school and primary education 3−11 project (EPPE 3−11). Influences on children’s attainment and progress in key stage 2: cognitive outcomes in year 6. London, Department for Children, Schools and Families, 2008.
344. Dumas C, Lefranc A. Early schooling and later outcomes: evidence from pre-school extension in France. Thema working paper no. 2010−07. Pontoise, Université de Cergy, 2010.
345. Bauer PC, Riphahn RT. Age at school entry and intergenerational educational mobility. Economics Letters, 2009, 103(2):87−90.
346. Sheridan S et al. A cross-cultural study of preschool quality in South Korea and Sweden: ECERS evaluations. Early Childhood Research Quarterly, 2009, 24(2):142−156.
347. Sammons P et al. Influences on children’s attainment and progress in key stage 2: cognitive outcomes in year 6. London, Department for Children, Schools and Families, 2008.
348. Communication from the Commission. Early childhood education and care: providing all our children with the best start for the world of tomorrow. Brussels, European Commisson, 2011 (http://eur-lex.europa.eu/LexUriServ/LexUriServ.do?uri=COM:2011:0066:FIN:EN:HTML, accessed 15 July 2013).
349. Steinberg L. A social neuroscience perspective on adolescent risk-taking. Developmental Review, 2008, 28(1):78−106.
350. Huttenlocher PR. Synaptic density in human frontal cortex − developmental changes and effects of aging. Brain Research, 1979, 163(2):195−205.
351. Allen G. Early intervention: the next steps. An independent report to Her Majesty’s Government. London, Cabinet Office, 2011.
352. Crawford C et al. Young people’s education and labour market choices aged 16/17 to 18/19. London, Department for Education, 2011.
353. Duckworth K. The influence of context on attainment in primary school: interactions between children, family and school contexts. London, Centre for Research on the Wider Benefits of Learning, 2008 (Report no. 28).
354. Botvin GJ et al. Preventing adolescent drug abuse through a multimodal cognitive behavioral approach − results of a 3-year study. Journal of Consulting and Clinical Psychology, 1990, 58(4):437−446.
355. Botvin GJ et al. Long-term follow-up results of a randomized drug abuse prevention trial in a white middle-class population. Journal of the American Medical Association, 1995, 273(14):1106−1112.
356. Botvin GJ, Mihalic SF, Grotpeter JK. Lifeskills training: blueprints for violence prevention, book five. Boulder, Center for the Study and Prevention of Violence, Institute of Science, University of Colorado, 1998.
357. Botvin GJ. The effectiveness of multicomponent skills training approach to substance abuse prevention. New York, Cornell University Medical College, Laboratory of Health Behaviour Research, 1989.
358. Aos S et al. Benefits and costs of prevention and early intervention programs for youth. Olympia, WA, Washington State Institute for Public Policy, 2004 (http://www.wsipp.wa.gov/rptfiles/04-07-3901.pdf, accessed 15 July 2013).
359. Jones L et al. A review of the effectiveness and cost−effectiveness of interventions delivered in primary and secondary schools to prevent and/or reduce alcohol use by young people under 18 years old. Liverpool, John Moores University, Centre for Public Health, 2007 (http://www.nice.org.uk/nicemedia/pdf/AlcoholSchoolsConsReview.pdf, accessed 15 July 2013).
360. Under one roof: the integration of schools and community services in OECD countries. Paris, OECD, 1998.
361. Cummings C, Dyson A, Todd L. Beyond the school gates: can full service and extended school overcome disadvantage? London, Routledge, 2011.
362. Demeuse M et al. Education policies and inequalities in Europe. Basingstoke, Palgrave Macmillan, 2012.
363. Education. Addressing exclusion [web site]. Paris, United Nations Educational, Scientific and Cultural Organization (UNESCO), 1995−2012 (http://www.unesco.org/new/en/education/themes/strengthening-education-systems/inclusive-education/, accessed 15 July 2013).
319. Engendering development through gender equality in rights, resources, and voice. Washington, DC, The World Bank, 2001 (http://www-wds.worldbank.org/external/default/WDSContentServer/WDSP/IB/2001/03/01/000094946_01020805393496/Rendered/PDF/multi_page.pdf, accessed 15 July 2013).
320. Mikulecky L, Lloyd P, Brannon D. Evaluating parent/child interactions in family literacy programs. Louisville, KY, National Center on Family Literacy, 1995.
321. Coleman L, Glenn F. When couples part: understanding the consequences for adults and children. London, One Plus One, 2009.
322. Fox SE, Levitt P, Nelson CA. How the timing and quality of early experiences influence the development of brain architecture. Child Development, 2010, 81(1):28−40.
323. Goodman A, Sianesi B. Early education and children’s outcomes: how long do the impacts last? Fiscal Studies, 2005, 26(4):513−548.
324. Dutton DG, Corvo K. Transforming a flawed policy: a call to revive psychology and science in domestic violence research and practice. Aggression and Violent Behavior, 2006, 11(5):457−483.
325. Walsh A. Drug use and sexual behavior − users, experimenters, and abstainers. Journal of Social Psychology, 1992, 132(5):691−693.
326. Brennan KA, Shaver PR. Dimensions of adult attachment, affect regulation, and romantic relationship functioning. Personality and Social Psychology Bulletin, 1995, 21(3):267−283.
327. Huntsinger ET, Luecken LJ. Attachment relationships and health behavior: the mediational role of self-esteem. Psychology & Health, 2004, 19(4):515−526.
328. Meltzer H et al. The mental health of young people looked after by local authorities in England. London, Department of Health, 2003 (http://www.dh.gov.uk/en/Publicationsandstatistics/Publications/PublicationsStatistics/DH_4019442, accessed 15 July 2013).
329. Taylor MP, Pevalin DJ, Todd J. The psychological costs of unsustainable housing commitments. Psychological Medicine, 2007, 37(7):1027−1236.
330. Coote A. Intergenerational equity. A briefing paper for the WHO review of health inequalities in Europe. Copenhagen, WHO Regional Office for Europe, 2012.
331. Hirsch D, Spencer N. Unhealthy lives. London, End Child Poverty, 2008.
332. Unequal, unfair, ineffective and inefficient. Gender inequity in health: why it exists and how we can change it. Final report to the WHO Commission on Social Determinants of Health. Geneva, World Health Organization, 2007 (http://www.who.int/social_determinants/resources/csdh_media/wgekn_final_report_07.pdf, accessed 15 July 2013).
333. Trends in maternal mortality: 1990 to 2010. WHO, UNICEF, UNFPA and The World Bank estimates. Geneva, World Health Organization, 2012 (http://www.unfpa.org/webdav/site/global/shared/documents/publications/2012/Trends_in_maternal_mortality_A4-1.pdf, accessed 15 July 2013).
334. van Roosmalen J et al. Substandard care in immigrant versus indigenous maternal deaths in the Netherlands. BJOG: an International Journal of Obstetrics and Gynaecology, 2002, 109(2):212−213.
335. Knight M et al. Inequalities in maternal health: national cohort study of ethnic variation in severe maternal morbidities. British Medical Journal, 2009, 338:b542.
336. CMACE. Saving mother’s lives. Reviewing maternal deaths to make motherhood safer: 2006−2008. The eighth report of the confidential enquiries into maternal deaths in the United Kingdom. BJOG: an International Journal of Obstetrics and Gynaecology, 2011, 118 (Suppl. 1).
337. Bosquet M, Egeland B. Associations among maternal depressive symptomology, state of mind and parent and child behaviors: implications for attachment-based interventions. Attachment and Human Development, 2001, 3(2):173−199.
338. Bradshaw J, Mayhew E, Alexander G. Minimum social protection for families with children in the CEE/CIS countries in 2009: a report for UNICEF. York, University of York, Social Policy Research Unit, 2010.
339. Innocenti social monitor 2009. Child well-being at a crossroads: evolving challenges in central and eastern Europe and the Commonwealth of Independent States. Florence, UNICEF Innocenti Research Centre, 2009.
340. Karamessini M. Continuity and change in the southern European social model. International Labour Review, 2008, 147(1):43−70.

References 179
387. Leka S et al. Policy-level interventions and work-related psychosocial risk management in the European Union. Work and Stress, 2010 24(3):298−307.
388. Harrell WA. Perceived risk of occupational injury − control over pace of work and blue-collar versus white-collar work. Perceptual and Motor Skills, 1990, 70(3):1351−1359.
389. Clarke S. Accidents and safety in the workplace. In: Cartwright S, Cooper CL, eds. The Oxford handbook of organizational well-being. Oxford, Oxford University Press, 2009:31−54.
390. Nielsen K et al. Conducting organizational-level occupational health interventions: what works? Work and Stress, 2010, 24(3):234−259.
391. Nielsen K, Taris TW, Cox T. The future of organizational interventions: addressing the challenges of today’s organizations. Work and Stress, 2010, 24(3):219−233.
392. Workers’ health: global plan of action. Sixtieth World Health Assembly. Agenda item 12.13. WHA60.26, 23 May 2007. Geneva, World Health Organization, 2007 (http://www.who.int/occupational_health/WHO_health_assembly_en_web.pdf, accessed 15 July 2013).
393. Perrin D et al. Jurisdiction: Germany. Comparative Review of Workers’ Compensation Systems in Select Jurisdictions, 1999, 22 February:1−14 (http://www.qp.gov.bc.ca/rcwc/research/perrin-thorau-germany.pdf, accessed 15 July 2013).
394. Seifert J et al. Arbeits- und wegeunfälle. In: Lob G, Richter M, eds. Prävention von Verletzungen. Stuttgart, Schattauer, 2008:79−85.
395. Tausig M, Fenwick R. Work and mental health in social context. New York, Springer, 2011.
396. Leon DA. Trends in European life expectancy: a salutary view. International Journal of Epidemiology, 2011, 40(2):271−277.
397. Marmot M, Bell R. How will the financial crisis affect health? British Medical Journal, 2009, 338:b1314.
398. Kentikelenis A et al. Health effects of financial crisis: omens of a Greek tragedy. Lancet, 2011, 378(9801):1457−1458.
399. Afford C. Corrosive reform: failing health systems in eastern Europe. Geneva, International Labour Organization, 2003.
400. Rosskam E, Leather A, eds. Failing health systems in eastern Europe. Ferney-Voltaire, Public Services International, 2006.
401. Rosskam E, ed. Winners or losers? Liberalizing public services. Geneva, International Labour Organization, 2006.
402. Barbieri P, Scherer S. Labour market flexibilization and its consequences in Italy. European Sociological Review, 2009, 25(6):677−692.
403. Sullivan D, von Wachter T. Job displacement and mortality. An analysis using administrative data. The Quarterly Journal of Economics, 2009, 124:1265−1306.
404. Gallo WT et al. Health effects of involuntary job loss among older workers: findings from the health and retirement survey. Journals of Gerontology Series B: Psychological Sciences and Social Sciences, 2000, 55(3):S131−S140.
405. Morris JK, Cook DG, Shaper AG. Loss of employment and mortality. British Medical Journal, 1994, 308(6937):1135−1139.
406. Moser KA et al. Unemployment and mortality: comparison of the 1971 and 1981 longitudinal study census samples. British Medical Journal (Clinical Research Edition), 1987, 294(6564):86−90.
407. Bethune A. Unemployment and mortality. In: Drever F, Whitehead M, eds. Health inequalities. London, The Stationery Office, 1997.
408. Mitchell R, Shaw M, Dorling D. Inequalities in life and death: what if Britain were more equal? Bristol, The Policy Press, 2000 (http://www.jrf.org.uk/sites/files/jrf/jr086-inequalities-life-death.pdf, accessed 15 July 2013).
409. Martikainen PT, Valkonen T. Excess mortality of unemployed men and women during a period of rapidly increasing unemployment. Lancet, 1996, 348(9032):909−912.
410. Iversen L et al. Unemployment and mortality in Denmark, 1970−80. British Medical Journal (Clinical Research Edition), 1987, 295(6603):879−884.
411. Pensola T, Martikainen P. Life-course experiences and mortality by adult social class among young men. Social Science & Medicine, 2004, 58(11):2149−2170.
412. Voss M et al. Unemployment and early cause-specific mortality: a study based on the Swedish twin registry. American Journal of Public Health, 2004, 94(12):2155−2161.
364. Every child matters. Presented to Parliament by the Chief Secretary to the Treasury by Command of Her Majesty. London, The Stationery Office, 2003 (https://www.education.gov.uk/publications/eOrderingDownload/CM5860.pdf, accessed 15 July 2013).
365. Karasek RA, Theorell T. Healthy work: productivity and the reconstruction of working life. New York, Basic Books, 1990.
366. Karasek RA. Job demands, job decision latitude, and mental strain: implications for job redesign. Administrative Science Quarterly, 1979, 24:285−307.
367. Siegrist J. Adverse health effects of high-effort/low-reward conditions. Journal of Occupational Health Psychology, 1996, 1:27−41.
368. Wahrendorf M, Dragano N, Siegrist J. Social position, work stress, and retirement intentions: a study with older employees from 11 European countries. European Sociological Review, 2012, DOI: 10.1093/esr/jcs058.
369. Tsutsumi A, Kawakami NA. A review of empirical studies on the model of effort reward imbalance at work: reducing occupational stress by implementing a new theory. Social Science & Medicine, 2004, 59:2335−2359.
370. Eller NH, Netterstrom B, Gyntelberg F. Work-related psychosocial factors and the development of ischemic heart disease. Cardiology in Review, 2009, 17:83−97.
371. Kivimaki M, Virtanen M, Elovainio M. Work stress in the etiology of coronary heart disease − a meta-analysis. Scandinavian Journal of Work, Environment & Health, 2006, 32:431−442.
372. Marmot M, Siegrist J, Theorell T. Health and the psychosocial environment at work. In: Marmot M, Wilkinson R, eds. Social determinants of health. Oxford, Oxford University Press, 2006:97−130.
373. Bonde JPE. Psychosocial factors at work and risk of depression: a systematic review of the epidemiological evidence. Occupational and Environmental Medicine, 2008, 65:438−445.
374. Ndjaboué R, Brisson C, Vézina M. Organisational justice and mental health: a systematic review of prospective studies. Occupational and Environmental Medicine, 2012, 69(10):694−700.
375. Stansfeld SA, Bosma H, Hemingway H. Psychosocial work characteristics and social support as predictors of SF−36 functioning: the Whitehall II Study. Psychosomatic Medicine, 1998, 60:247−255.
376. Bongers PM, Kremer AM, ter Laak J. Are psychosocial factors, risk factors for symptoms and signs of the shoulder, elbow, or hand/wrist? A review of the epidemiological literature. American Journal of Industrial Medicine, 2002, 41:315−342.
377. Gillen M, Yen IH, Trupin L. The association of socioeconomic status and psycho-social and physical workplace factors with musculoskeletal injury in hospital workers. American Journal of Industrial Medicine, 2007, 50:245−260.
378. Rugulies R, Krause N. Effort−reward imbalance and incidence of low back and neck injuries in San Francisco transit operators. Occupational & Environmental Medicine, 2008, 65(8):525−533.
379. European Commission. Why do socio-economic inequalities increase? Facts and policy responses in Europe. Luxembourg, Publications Office of the European Union, 2010.
380. Eurofound. Fifth European working conditions survey. Luxembourg, Publications Office of the European Union, 2012.
381. Allaire S et al. Contemporary prevalence and incidence of work disability associated with rheumatoid arthritis in the US. Arthritis & Rheumatism, 2008, 59(4):474−480.
382. Employers make the case for hiring people with disabilities (19 June 2012) [web site]. Geneva, International Labour Organization, 1996−2012 (http://www.ilo.org/skills/pubs/WCMS_183673/lang--en/index.htm, accessed 15 July 2013).
383. Cox T et al. Organizational interventions for work stress: a risk management approach. Sudbury, HSE Books, 2000.
384. Mackay CJ et al. “Management standards” and work-related stress in the UK: policy background and science. Work and Stress, 2004, 18(2):91−112.
385. Aust B, Ducki A. Comprehensive health promotion interventions at the workplace: experiences with health circles in Germany. Journal of Occupational Health Psychology, 2004, 9(3):258−270.
386. Peiró JM, Martínez-Tur V. Organizational development and change. In: Chmiel N, ed. An introduction to work and organizational psychology, 2nd ed. London, Blackwell, 2008:351−376.

180 Review of social determinants and the health divide in the WHO European Region: final report
437. Andersson KA et al. Influence of mandatory generic substitution on pharmaceutical sales patterns: a national study over five years. BMC Health Services Research, 2008, 8:50.
438. Haider SI et al. Patient educational level and use of newly marketed drugs: a register-based study of over 600 000 older people. European Journal of Clinical Pharmacology, 2008, 64(12):1215−1222.
439. Damiani G et al. The impact of socioeconomic level on influenza vaccination among Italian adults and elderly: a cross-sectional study. Preventive Medicine, 2007, 45(5):373−379.
440. Firmann M et al. Prevalence, treatment and control of dyslipidaemia in Switzerland: still a long way to go. European Journal of Cardiovascular Prevention and Rehabilitation, 2010, 17(6):682−687.
441. Harraf F et al. A multicentre observational study of presentation and early assessment of acute stroke. British Medical Journal, 2002, 325(7354):17.
442. Lawlor DA et al. Geographical variation in cardiovascular disease, risk factors, and their control in older women: British Women’s Heart and Health Study. Journal of Epidemiology and Community Health, 2003, 57(2):134−140.
443. Erne P et al. Early drug therapy and in-hospital mortality following acute myocardial infarction. Heart Drug, 2003, 3(3):134−140.
444. Bennett KE, Williams D, Feely J. Inequalities in prescribing of secondary preventative therapies for ischaemic heart disease in Ireland. Irish Medical Journal, 2002, 95(6):169−172.
445. Williams D, Bennett K, Feely J. Evidence for an age and gender bias in the secondary prevention of ischaemic heart disease in primary care. British Journal of Clinical Pharmacology, 2003, 55(6):604−608.
446. Cortez-Dias N et al. Prevalence and management of hypertension in primary care in Portugal. Insights from the VALSIM study. Revista Portuguesa de Cardiologia [Portuguese Journal of Cardiology], 2009, 28(5):499−523.
447. Blank PR, Schwenkglenks M, Szucs TD. Disparities in influenza vaccination coverage rates by target group in five European countries: trends over seven consecutive seasons. Infection, 2009, 37(5):390−400.
448. Blank PR et al. Influenza vaccination coverage rates in Austria in 2006/07 − a representative cross-sectional telephone survey. Wiener Medizinische Wochenschrift, 2008, 158(19−20):583−588.
449. Endrich MM, Blank PR, Szucs TD. Influenza vaccination uptake and socioeconomic determinants in 11 European countries. Vaccine, 2009, 27(30):4018−4024.
450. Chiatti C et al. Influenza vaccine uptake among community-dwelling Italian elderly: results from a large cross-sectional study. BMC Public Health, 2011, 11:207.
451. Chiatti C et al. Socioeconomic determinants of influenza vaccination among older adults in Italy. Preventive Medicine, 2010, 51(3−4):332−333.
452. La Torre G et al. Influence of sociodemographic inequalities and chronic conditions on influenza vaccination coverage in Italy: results from a survey in the general population. Public Health, 2010, 51(12):690−697.
453. Jimenez-Garcia R et al. Evolution of anti-influenza vaccination coverage in Spain from 1993 to 2001. Vaccine, 2005, 51(22):2844−2850.
454. Jimenez-Garcia R et al. Gender influence in influenza vaccine uptake in Spain: time trends analysis (1995−2006). Vaccine, 2010; 28(38):6169−6175.
455. Pena-Rey I, Perez-Farinos N, Sarria-Santamera A. Factors associated with influenza vaccination among elderly Spanish women. Public Health, 2004, 118(8):582−587.
456. Sarria-Santamera A, Timoner J. Influenza vaccination in old adults in Spain. European Journal of Public Health, 2003, 13(2):133−137.
457. Crawford VL, O’Hanlon A, McGee H. The effect of patient characteristics upon uptake of the influenza vaccination: a study comparing community-based older adults in two healthcare systems. Age & Ageing, 2011, 40(1):35−41.
458. Bovier PA et al. Importance of patients’ perceptions and general practitioners’ recommendations in understanding missed opportunities for immunisations in Swiss adults. Vaccine, 2001, 19(32):4760−4767.
459. de Andres AL et al. Influenza vaccination among the elderly Spanish population: trend from 1993 to 2003 and vaccination-related factors. European Journal of Public Health, 2007, 17(3):272−277.
413. Ahs A, Westerling R. Self-rated health in relation to employment status during periods of high and of low levels of unemployment. European Journal of Public Health, 2006, 16(3):295−305.
414. Kivimaki M et al. Temporary employment and risk of overall and cause-specific mortality. American Journal of Epidemiology, 2003, 158(7):663−668.
415. Gallo WT et al. Involuntary job loss as a risk factor for subsequent myocardial infarction and stroke: findings from the Health and Retirement Survey. American Journal of Industrial Medicine, 2004, 45(5):408−416.
416. Kasl SV, Jones BA. The impact of job loss and retirement on health. In: Berkman LF, Kawachi I, eds. Social epidemiology. Oxford, Oxford University Press, 2000:118−136.
417. Kaplan GA et al. Psychosocial predictors of depression. Prospective evidence from the human population laboratory studies. American Journal of Epidemiology, 1987, 125(2):206−220.
418. Dorling D. Unemployment and health. British Medical Journal, 2009, 338:b829.
419. Moser KA, Fox AJ, Jones DR. Unemployment and mortality in the OPCS Longitudinal Study. Lancet, 1984, 2(8415):1324−1329.
420. Supplementary indicators to unemployment by sex and nationality − annual average [online database]. Luxembourg, Eurostat, 2013 (http://appsso.eurostat.ec.europa.eu/nui/show.do?dataset=lfsi_sup_nat_a&lang=en, accessed 15 July 2013).
421. Population in jobless households − annual data. Luxembourg, Eurostat, 2013 (http://appsso.eurostat.ec.europa.eu/nui/show.do?dataset=lfsi_ jhh_a&lang=en, accessed 15 July 2013).
422. Crawford C et al. Young people’s education and labour market choices aged 16/17 to 18/19. London, Department for Education, 2011.
423. Hartfree Y, Hirsch D, Sutton L. Minimum income standards and older pensioner’s needs. York, Joseph Rowntree Foundation, 2013 (http://www.jrf.org.uk/sites/files/jrf/pensioner-income-standards-full.pdf, accessed 15 July 2013).
424. Opportunity age. Meeting the challenges of ageing in the 21st century. London, Department for Work and Pensions, 2005.
425. Gold age pensioners: valuing the socio-economic contribution of older people in the UK. Cardiff, WRVS, 2011.
426. Jagger C, Matthews F. Gender differences in life expectancy free of impairment at older ages. Journal of Women & Aging, 2002, 14(1−2):85−97.
427. Carmel S, Bernstein JH. Gender differences in physical health and psychosocial well being among four age-groups of elderly people in Israel. International Journal of Aging & Human Development, 2003, 56(2):113−131.
428. Walter-Ginzburg A et al. A gender-based dynamic multidimensional longitudinal analysis of resilience and mortality in the old-old in Israel: the cross-sectional and longitudinal aging study (CALAS). Social Science & Medicine, 2005, 60(8):1705−1715.
429. Dirik A, Cavlak U, Akdag B. Identifying the relationship among mental status, functional independence and mobility level in Turkish institutionalized elderly: gender differences. Archives of Gerontology and Geriatrics, 2006, 42(3):339−350.
430. Oksuzyan A, Brønnum-Hansen H, Jeune B. Gender gap in health expectancy. European Journal of Ageing, 2010, 7(4):213−218.
431. Espelt A et al. Disability among older people in a southern European city in 2006: trends in gender and socioeconomic inequalities. Journal of Women’s Health (Larchmt), 2010, 19(5):927−933.
432. Beland F, Zunzunegui MV. Predictors of functional status in older people living at home. Age & Ageing, 1999, 28(2):153−159.
433. Lahelma E et al. Socioeconomic health inequalities: causes and explanatory models. In: Palosuo H, ed. Health inequalities in Finland. Helsinki, Ministry of Social Affairs and Health, 2009:21−37.
434. Carlsen F, Kaarboe OM. Norwegian priority guidelines: estimating the distributional implications across age, gender and SES. Health Policy, 2010, 95(2−3):264−270.
435. Brockmann H. Why is less money spent on health care for the elderly than for the rest of the population? Health care rationing in German hospitals. Social Science & Medicine, 2002, 55(4):593−608.
436. Castillo-Lorente E, Rivera-Fernandez R, Vazquez-Mata G. Limitation of therapeutic activity in elderly critically ill patients. Project for the epidemiological analysis of critical care patients. Critical Care Medicine, 1997, 25(10):1643−1648.

References 181
485. Lynch JW et al. Income inequality and mortality: importance to health of individual income, psychosocial environment, or material conditions. British Medical Journal, 2000, 320:1200−1204.
486. At-risk-of-poverty rate of elderly people, by sex [online database]. Luxembourg, Eurostat, 2012 (http://epp.eurostat.ec.europa.eu/tgm/table.do?tab=table&init=1&language=en&pcode=tsdde320&plugin=1, accessed 15 July 2013).
487. Lundberg O et al. Social protection policies, income and health inequalities. A task group report. Copenhagen, WHO Regional Office for Europe, 2012.
488. van der Wel KA, Dahl E, Thielen K. Social inequalities in “sickness”: European welfare states and non-employment among the chronically ill. Social Science & Medicine, 2011, 73(11):1608−1617.
489. Sjöberg O. Social insurance as a collective resource: unemployment benefits, job insecurity and subjective well-being in a comparative perspective. Social Forces, 2012, 88(3):1281−1304.
490. Dahl E, van der Wel K. Health inequalities across Europe: do welfare arrangements make a difference? Background paper for the task group on social protection policies, income and health inequalities. Copenhagen, WHO Regional Office for Europe, 2012.
491. Dahl E, van der Wel KA. Educational inequalities in health in European welfare states: a social expenditure approach. Social Science & Medicine, 2012, 81:60−69.
492. Health systems in times of global economic crisis: an update of the situation in the WHO European Region. Copenhagen, WHO Regional Office For Europe, 2013 (http://www.euro.who.int/__ data/assets/pdf_file/0007/190456/Health-systems-in-times-of-global-economic-crisis,-an-update-of-the-situation-in-the-WHO-European-Region.pdf, accessed 15 July 2013).
493. Lindert PH. Growing public: social spending and economic growth since the eighteenth century. Vol. 1. Cambridge, Cambridge University Press, 2004.
494. Garfinkel I, Rainwater L, Smeeding T. Wealth and welfare states: is America a laggard or leader? Oxford, Oxford Univerty Press, 2010.
495. Morel N, Palier B, Palme J. Towards a social investment welfare state? Bristol, The Policy Press, 2012.
496. 2010 EPHA briefing on health inequalities. Brussels, European Public Health Alliance, 2010.
497. Coote A, Boyce T. Task group on sustainability and community. Final report. Copenhagen, WHO Regional Office for Europe, 2012.
498. Schwarte C, Adebowale M. Environmental justice and race equality in the European Union. London, Capacity Global, 2007.
499. Social and gender inequalities in environment and health. Copenhagen, WHO Regional Office for Europe, 2010 (http://www.euro.who.int/en/what-we-do/health-topics/health-determinants/gender/publications/social-and-gender-inequalities-in-environment-and-health, accessed 15 July 2013).
500. Gough I et al. The distribution of total greenhouse gas emissions by households in the UK, and some implications for social policy. London, Centre for Analysis of Social Exclusion, 2011 (http://sticerd.lse.ac.uk/dps/case/cp/CASEpaper152.pdf, accessed 15 July 2013).
501. Goryakin Y et al. Economics task group background paper. Social capital as a determinant of health: a case study in nine former Soviet Union countries. Copenhagen, WHO Regional Office for Europe, 2012.
502. Rose R. How much does social capital add to individual health? A survey study of Russians. Social Science & Medicine, 2000, 51(9):1421−1435.
503. Ungar M. Resilience across cultures. British Journal of Social Work, 2008, 38(2):218−235.
504. Poortinga W. Social capital: an individual or collective resource for health? Social Science & Medicine, 2006, 62(2):292−302.
505. van Hooijdonk C et al. The diversity in associations between outcome social capital and health per health outcome, population group and location studied. International Journal of Epidemiology, 2008, 37(6):1384−1392.
506. Szreter S, Woolcock M. Health by association? Social capital, social theory, and the political economy of public health. International Journal of Epidemiology, 2004, 33(4):650−667.
507. Gele AA, Harsløf I. Types of social capital resources and self-rated health among the Norwegian adult population. International Journal for Equity in Health, 2010, 9:8.
508. Putnam RD. Making democracy work: civic traditions in modern Italy. Princeton, NJ, Princeton University Press, 1993.
460. Ploubidis GB, Grundy E. Later-life mental health in Europe: a country-level comparison. Journals of Gerontology Series B: Psychological Sciences and Social Sciences, 2009, 64(5):666−676.
461. Oksuzyan A et al. Cross-national comparison of sex differences in health and mortality in Denmark, Japan and the US. European Journal of Epidemiology, 2010, 25(7):471−480.
462. Kempen GI et al. Morbidity and quality of life and the moderating effects of level of education in the elderly. Social Science & Medicine, 1999, 49(1):143−149.
463. Bowling A et al. A multidimensional model of the quality of life in older age. Aging & Mental Health, 2002, 6:355−371.
464. Papadopoulos AA et al. Predictors of health-related quality of life in type II diabetic patients in Greece. BMC Public Health, 2007, 7:186.
465. Rueda S, Artazcoz L. Gender inequality in health among elderly people in a combined framework of socioeconomic position, family characteristics and social support. Ageing and Society, 2009, 29(4):625−647.
466. Deeg DJH. Gender-specific differences in physical and mental health across European countries: variation in levels and explanatory factors at older age. In: Task group on older people. Health inequalities and the health divide among older people in the WHO European region. Copenhagen, WHO Regional Office for Europe, 2012:59−102.
467. Knoops KTB et al. Mediterranean diet, lifestyle factors, and 10-year mortality in elderly European men and women − the HALE project. Journal of the American Medical Association, 2004, 292(12):1433−1439.
468. Rizzuto D et al. Lifestyle, social factors, and survival after age 75: population based study. Britias Medical Journal, 2012, 345:e5568.
469. Berkman LF, Glass T. Social integration, social networks, social support and health. In: Berkman LF, Kawachi I, eds. Social epidemiology. Oxford, Oxford University Press, 2000:137−190.
470. Antonucci TC, Akiyama H, Lansford JE. Negative effects of close social relations. Family Relations, 1998, 47(4):379−384.
471. Cohen S, Wills TA. Stress, social support, and the buffering hypothesis. Psychological Bulletin, 1985, 98(2):310−357.
472. Holt-Lunstad J, Smith TB, Layton JB. Social relationships and mortality risk: a meta-analytic review. PLoS Medicine, 2010, 7(7).
473. Victor C, Scambler S, Bond J. The social world of older people. Understanding loneliness and social isolation in later life. New York, Open University Publishing, 2009.
474. Cacioppo JT et al. Loneliness as a specific risk factor for depressive symptoms: cross-sectional and longitudinal analyses. Psychology and Aging, 2006, 21(1):140−151.
475. Brus M. 2012: European year of active ageing and solidarity between generations [web site]. Brussels, Library of the European Parliament, 2012 (http://libraryeuroparl.wordpress.com/2012/05/14/2012-european-year-of-active-ageing-and-solidarity-between-generations/, accessed 15 July 2013).
476. Stegeman I et al. Healthy and active ageing. Brussels, EuroHealthNet, 2012.
477. Strategy and action plan for healthy ageing in Europe, 2012−2020. Copenhagen, WHO Regional Office for Europe, 2012 (http://www.euro.who.int/__data/assets/pdf_file/0008/175544/RC62wd10Rev1-Eng.pdf, accessed 15 July 2013).
478. SHARE − survey of health, ageing and retirement in Europe. Munich, SHARE, 2012 (http://www.share-project.org/, accessed 15 July 2013).
479. Marmot M. Social determinants of health inequalities. Lancet, 2005, 365(9464):1099−1104.
480. Marmot M. Social causes of social inequalities in health. In: Anand S, Peter F, Sen A, eds. Public health, ethics and equity. Oxford, Oxford University Press, 2004.
481. Social exclusion, vulnerability and exclusion task group final report: review of social determinants of health and the health divide in the WHO EURO region. Copenhagen, WHO Regional Office for Europe, 2012.
482. Bradshaw J, Finch N. Overlaps in dimensions of poverty. Journal of Social Policy, 2003, 32(4):513−525.
483. Morris JN et al. A minimum income for healthy living. Journal of Epidemiology and Community Health, 2000, 54:885−889.
484. Davis A et al. A minimum income standard for the UK in 2012. York, Joseph Rowntree Foundation, 2012.

182 Review of social determinants and the health divide in the WHO European Region: final report
531. Fredouille J, Laporte E, Mesbah M. Housing and mental health. In: Ormandy D, ed. Housing and health in Europe. The WHO LARES project. Abingdon and New York, Routledge, 2009:184−199.
532. Thomson H et al. The health impacts of housing improvement: a systematic review of intervention studies from 1887−2007. American Journal of Public Health, 2009, 99(Suppl. 3):S681−S692.
533. European Foundation for the Improvement of Living and Working Conditions. Second European quality of life survey − overview. Luxembourg, Office for the Official Publications of the European Communities, 2009.
534. Lee ACK, Maheswaran R. The health benefits of urban green spaces: a review of the evidence. Journal of Public Health, 2011, 33(2):212−222.
535. Lintz G, Muller B, Schmude K. The future of industrial cities and regions in central and eastern Europe. Geoforum, 2007, 38(3):512−519.
536. Simai M. Poverty and inequality in eastern Europe and the CIS transition economies. New York, United Nations Department of Economic and Social Affairs, 2006.
537. Matthies F et al. Heat-health action plans. Guidance. Copenhagen, WHO Regional Office for Europe, 2008 (http://www.euro.who.int/__data/assets/pdf_file/0006/95919/E91347.pdf, accessed 15 July 2013).
538. Vandentorren S et al. August 2003 heat wave in France: risk factors for death of elderly people living at home. European Journal of Public Health, 2006, 16(6):583−591.
539. Meusel D et al. The Bratislava Collaborating Group. Public health responses to extreme weather and climate events − a brief summary of the WHO meeting on this topic in Bratislava on 9−10 February 2004. Journal of Public Health, 2004, 12(6):371−381.
540. Lee M. Ecologist. LSE’s Anne Power: my recipe for 80 per cent savings in your home [web site]. London, The Ecologist, 2010 (http://www.theecologist.org/Interviews/432382/lses_anne_power_my_recipe_for_80_per_cent_energy_savings_in_your_home.html, accessed 15 July 2013).
541. Bambra C et al. Tackling the wider social determinants of health and health inequalities: evidence from systematic reviews. Journal of Epidemiology and Community Health, 2010, 64(4):284−291.
542. Healy JD. Excess winter mortality in Europe: a cross country analysis identifying key risk factors. Journal of Epidemiology and Community Health, 2003, 57(10):784−789.
543. Nielsen SF et al. Psychiatric disorders and mortality among people in homeless shelters in Denmark: a nationwide register-based cohort study. Lancet, 2011, 377(9784):2205−2214.
544. Geddes JR, Fazel S. Extreme health inequalities: mortality in homeless people. Lancet, 2011, 377(9784):2156−2157.
545. Shaw M, Dorling D, Brimblecombe N. Life chances in Britain by housing wealth and for the homeless and vulnerably housed. Environment and Planning A, 1999, 31(12):2239−2248.
546. FEANTSA policy statement. Meeting the health needs of homeless people. Brussels, European Federation of National Organisations Working with the Homeless, 2005.
547. Homelessness and homeless policies in Europe: lessons from research. Brussels, European Federation of National Organisations Working with the Homeless, 2010.
548. Hertting N et al. Strategies to combat homelessness in western and eastern Europe. Brussels, Federation of National Organisations Working with the Homeless, 1999.
549. Hradecky I. Building capacity of homeless services in the Czech Republic. European Journal of Homelessness, 2008, 2:177−190.
550. Andreev E et al. An investigation of the growing number of deaths of unidentified people in Russia. European Journal of Public Health, 2008, 18(3):252−257.
551. Stephens M, Fitzpatrick S. Welfare regimes, housing systems and homelessness: how are they linked? European Journal of Homelessness, 2007, 1:200−214.
552. The role of housing in pathways into and out of homelessness. Brussels, Federation of National Organisations Working with the Homeless, 2008.
553. Centar Za Integraciju Mladih [Centre for Youth Integration] [web site]. Belgrade, Centar Za Integraciju Mladih, 2013 (http://www.cim.org.rs/?lang=en/, accessed 15 July 2013).
554. Lindström K. Health impact assessment and public sector health costs of the road transport sector − results from two projects. Borlänge, Swedish Road Administration, 2009.
509. Guiso L, Sapienza P, Zingales L. Alfred Marshall lecture: social capital as good culture. Journal of the European Economic Association, 2008, 6(2−3):295−320.
510. Guiso L, Sapienza P, Zingales L. Civic capital as the missing link. Cambridge, MA, National Bureau of Economic Research, 2010 (Report no. 1005; http://www.nber.org/papers/w15845, accessed 15 July 2013).
511. Alesina A, La Ferrara E. Who trusts others? Journal of Public Economics, 2002, 85:207−234.
512. Christakis NA, Fowler JH. The spread of obesity in a large social network over 32 years. New England Journal of Medicine, 2007, 357(4):370−379.
513. Scheffler RM, Brown TT. Social capital, economics, and health: new evidence. Health Economics Policy and Law, 2008, 3(4):321−331.
514. Kawachi I, Berkman LF. Social ties and mental health. Journal of Urban Health−Bulletin of the New York Academy of Medicine, 2001, 78(3):458−467.
515. Suhrcke M, Cookson R. Economic task group final report. Copenhagen, WHO Regional Office for Europe, 2012.
516. Rocco L, Fumagalli E, Suhrcke M. From social capital to health − and back. York, University of York, 2011.
517. D’Hombres B et al. The influence of social capital on health in eight former Soviet countries: why does it differ? Journal of Epidemiology and Community Health, 2011, 65(1):44−50.
518. Agyeman J, Bullard RD, Evans B. Just sustainabilities: development in an unequal world. Cambridge, MA, MIT Press, 2003.
519. CEU Center for Environmental Policy and Law, Health and Environment Alliance, Coalition for Environmental Justice. Making the case for environmental justice in central & eastern Europe. Brussels, Health and Environment Alliance, 2007.
520. The world’s worst polluted places: the top ten of the dirty thirty. New York, The Blacksmith Institute, 2007.
521. Health and environment in Europe: progress assessment. Copenhagen, WHO Regional Office for Europe, 2010 (http://www.euro.who.int/__data/assets/pdf_file/0010/96463/E93556.pdf, accessed 15 July 2013).
522. Access to improved sanitation and wastewater treatment. Copenhagen, WHO Regional Office for Europe, 2009 (http://www.euro.who.int/en/what-we-do/conferences/fifth-ministerial-conference-on-environment-and-health/sections/news/2010/02/besserer-zugang-zu-sicherem-wasser-in-europa/access-to-improved-sanitation-and-wastewater-treatment, accessed 15 July 2013).
523. Castro JE. Water, power and citizenship: social struggle in the Basin of Mexico. Basingstoke, Palgrave Macmillan, 2006.
524. Parma Declaration on Environment and Health, Parma, Italy, 10−12 March 2010. Copenhagen, WHO Regional Office for Europe, 2010 (http://www.euro.who.int/__data/assets/pdf_file/0011/78608/E93618.pdf, accessed 15 July 2013).
525. Toth JI. Social responsibility in pollution: the case of the Tisza River. In: Susanne C, ed. Societal responsibilities in life science. Delhi, Kamla-Raj Enterprises, 2004:143−147.
526. Schiermeier Q et al. Whatever happened to ... . Nature, 2010, DOI:10.1038 (http://www.nature.com/news/2010/101223/full/news.2010.690.html, accessed 15 July 2013).
527. Grant M et al. Masterclass briefing. Evidence review on the spatial determinants of health in urban settings. Bristol, University of the West of England, 2010.
528. Environment and health risks: a review of the influence and effects of social inequalities. Copenhagen, WHO Regional Office for Europe, 2010 (http://www.euro.who.int/en/what-we-do/health-topics/environment-and-health/social-inequalities-in-environment-and-health/environment-and-health-risks-a-review-of-the-influence-and-effects-of-social-inequalities, accessed 15 July 2013).
529. Federal building code (Baugesetzbuch, BauGB). Berlin, Federal Ministry for Transport, Construction and Housing, 2000 (http://www.iuscomp.org/gla/statutes/BauGB.htm#I, accessed 15 July 2013).
530. Braubach M, Jacobs D, Ormandy D. Environmental burden of diease associated with inadequate housing. A method guide to the quantification of health effects of selected housing risks in the WHO European Region. Copenhagen, WHO Regional Office for Europe, 2011 (http://www.euro.who.int/__data/assets/pdf_file/0003/142077/e95004.pdf, accessed 15 July 2013).

References 183
576. Kofman E. Women migrants and refugees in the EU. Paris, Organisation for Economic Co-operation and Development, 2003.
577. Schwenken H. “Domestic slavery” versus “workers rights”: political mobilizations of migrant domestic workers in the European Union. San Diego, Center for Comparative Immigration Studies, University of California, 2005.
578. Oso Casas L, Garson JP. The feminisation of international migration. Geneva, International Labour Organization, 2005.
579. Zincone G, Caponio T. The multilevel governance of migration. State of the art report Cluster C9. Amsterdam, International Migration, Integration and Social Cohesion in Europe, 2005 (http://dare.uva.nl/document/39847, accessed 15 July 2013).
580. Vishnevsky AG, Bobylev SN. National human development report, Russian Federation, 2008. Russia facing demographic challenges. Moscow, UNDP Russia, 2009 (http://hdr.undp.org/en/reports/nationalreports/europethecis/russia/NHDR_Russia_2008_Eng.pdf, accessed 15 July 2013).
581. Dommernik J, Jandl M. Modes of migration regulation and control in Europe. IMISCOE reports. Amsterdam, Amsterdam University Press, 2008.
582. Broders D, Engerson G. The fight aganst illegal migration: identification policies and immigrants’ counterstrategies. American Behavioral Scientist, 2007, 50:1592−1609.
583. Triandafyllidou A, Maroukis T. Irregular migration in Greece. Counting the uncountable. Data and trends across Europe. Athens, Clandestino, 2009.
584. Bloomer E et al. The impact of the economic downturn and policy changes on health inequalities in London. London, UCL Institute of Health Equity, 2012 (https://www.instituteofhealthequity.org/projects/demographics-finance-and-policy-london-2011-15-effects-on-housing-employment-and-income-and-strategies-to-reduce-health-inequalities, accessed 15 July 2013).
585. Kvist J et al. Changing social equality: the Nordic welfare model in the 21st century. Bristol, Policy Press, 2012.
586. Kuivalainen S, Nelson K. Eroding minimum income protection in the Nordic countries? Reassessing the Nordic model of social assistance. In: Kvist J et al., eds. Changing social equality: the Nordic welfare model in the 21st century. Bristol, Policy Press, 2012:69−88.
587. ALMPs and health: overview of the evidence. In: Pan-European macro-drivers that impact on work, worklessness, social protection and health inequalities: main issues, themes and futures scanning. London, Health Action Partnership International, 2012 (http://www.hapi.org.uk/what-we-do/working-for-equity-in-health/publications/, accessed 15 July 2013).
588. Andersen SH. The short- and long-term effects of government training on subjective well-being. European Sociological Review, 2008, 24(4):451−462.
589. Hagquist C, Starrin B. Youth unemployment and mental health − gender differences and economic stress. Scandinavian Journal of Social Welfare, 1996, 5(4):215−228.
590. Harry JM, Tiggemann M. The psychological impact of work reentry training for female unemployed sole parents. Australian Journal of Social Issues, 1992, 27(2):75−91.
591. Oddy M, Donovan A, Pardoe R. Do government training schemes for unemployed school leavers achieve their objectives − a psychological perspective. Journal of Adolescence, 1984, 7(4):377−385.
592. Vuori J, Silvonen J. The benefits of a preventive job search program on re-employment and mental health at 2-year follow-up. Journal of Occupational and Organizational Psychology, 2005, 78:43−52.
593. Strandh M. Different exit routes from unemployment and their impact on mental well-being: the role of the economic situation and the predictability of the life course. Work Employment and Society, 2000, 14(3):459−479.
594. Stafford EM. The effectiveness of the Youth Opportunities Programme on young people’s employment prospects and psychological well-being. British Journal of Guidance and Counselling, 1982, 10:12−21.
595. Lakey J, Bonjour D. Health and youth unemployment: a health impact assessment of the new deal for young people. London, Policy Studies Institute, 2001.
596. Vinokur AD et al. Two years after a job loss: long-term impact of the JOBS program on reemployment and mental health. Journal of Occupational Health Psychology, 2000, 5(1):32−47.
555. Rural transport futures. Summary. London, Transport 2000, 2003.
556. Gorman D et al. Transport policy and health inequalities: a health impact assessment of Edinburgh’s transport policy. Public Health, 2003, 117(1):15−24.
557. Building health: creating and enhancing places for healthy, active lives. London, National Heart Forum, 2007.
558. Racioppi F, Dora C, Krech R. A physically active life through everyday transport. Copenhagen, WHO Regional Office for Europe, 2002 (http://www.euro.who.int/__data/assets/pdf_file/0011/87572/E75662.pdf, accessed 15 July 2013).
559. Macmichael S. Bucharest cyclists lead fight against “Apocalypse on Wheels” [web site]. Bath, road.cc, 2010 (http://road.cc/content/news/17088-video-bucharest-cyclists-lead-fight-against-apocalypse-wheels, accessed 15 July 2013).
560. Roma [web site]. Strasbourg, Council of Europe, 2012 (http://www.coe.int/lportal/web/coe-portal/roma, accessed 15 July 2013).
561. EU Agency for Fundamental Rights, United Nations Development Programme, European Commission. The situation of Roma in 11 EU Member States. Survey results at a glance. Luxembourg, Publications Office of the European Union, 2012.
562. Hoelscher P. Romani children in south east Europe. The challenge of overcoming centuries of distrust and discrimination. Social and economic policy for children. Discussion paper issue #7. Geneva, UNICEF Regional Office for CEE/CIS, 2007.
563. Decade watch: results of the 2009 survey. Budapest, Decade Watch, 2010.
564. Mental health. United Nations Secretary-General visits sustainable development project in Serbia [web site]. Copenhagen, WHO Regional Office for Europe, 2012 (http://www.euro.who.int/en/what-we-do/health-topics/noncommunicable-diseases/mental-health/news/news/2012/8/united-nations-secretary-general-visits-sustainable-development-project-in-serbia, accessed 15 July 2013).
565. Communication from the Commission to the European Parliament, the Council, the European Economic and Social Committee and the Committee of the Regions. An EU framework for national Roma integration strategies up to 2020. Brussels, European Commission, 2011 (http://ec.europa.eu/justice/ policies/discrimination/docs/com_2011_173_en.pdf, accessed 15 July 2013).
566. Communication from the Commission to the European Parliament, the Council, the European Economic and Social Committee and the Committee of the Regions. National Roma integration strategies: a first step in the implementation of the EU framework. Brussels, European Commission, 2012 (http://ec.europa.eu/justice/discrimination/files/com2012_226_en.pdf, accessed 15 July 2013).
567. Kovacheva V, Vogel D. The size of the irregular foreign resident population in the European Union in 2002, 2005 and 2008: aggregated estimates. Hamburg, Hamburg Institute of International Economics, 2009.
568. Stock estimates for the EU [online database]. Hamburg, Database on Irregular Migration, 2012 (http://irregular-migration.net/index.php?id=217, accessed 15 July 2013).
569. Laruelle M. Central Asian labor migrants in Russia: the “diasporization” of the central Asian states? China and Eurasia Forum Quarterly, 2007, 5(3):101−119.
570. Russia cracking down on illegal migrants − Europe − International Heral Tribune. The New York Times, 15 January 2007 (http://www.nytimes.com/2007/01/15/world/europe/15iht-migrate.4211072.html?_r=1, accessed 15 July 2013).
571. Bjorngren Cuadra C. Right of access to health care for undocumented migrants in EU: a comparative study of national policies. European Journal of Public Health, 2012, 22(2):267−271.
572. Ingleby D. Social exclusion, vulnerability & disadvantage task group background paper 4: irregular migrants in the WHO European Region. Copenhagen, WHO Regional Office for Europe, 2012.
573. Convention on the Rights of the Child. New York, United Nations, 1989.
574. Separated, asylum-seeking children in European Union Member States. Vienna, European Union Agency for Fundamental Rights, 2010 (http://fra.europa.eu/fraWebsite/attachments/FRA-fullreport-sep-asylum-conference-2010_EN.pdf, accessed 15 July 2013).
575. Ayres R, Barber T. Statistical analysis of female migration and labour market integration in the EU. Oxford, Oxford Brookes University, 2006.

184 Review of social determinants and the health divide in the WHO European Region: final report
620. Rivera B, Currais L. Income variation and health expenditure: evidence for OECD countries. Review of Development Economics, 1999, 3(3):258−267.
621. Knowles S, Owen PD. Health capital in cross-country variation in income per capita in the Mankiw-Romer-Weil model. Economics Letters, 1995, 48:99−106.
622. Knowles S, Owen PD. Education and health in an effective-labour empirical growth model. Economic Record, 1997, 73(223):314−328.
623. Suhrcke M, Urban D. Are cardiovascular diseases bad for economic growth? Health Economics, 2010, 19(12):1478−1496.
624. Contoyannis P, Rice N. The impact of health on wages: evidence from the British Household Panel Survey. Empirical Economies, 2001, 26:599−622.
625. Gannon B. A dynamic analysis of disability and labour force participation in Ireland. Health Economics, 2005, 14:925−938.
626. Currie J, Madrian BC. Health, health insurance and the labour market. In: Ashenfelter O, Card D, eds. Handbook of labour economics. Vol. 3. Amsterdam, Elsevier Science, 1999.
627. Suhrcke M et al. Economic consequences of noncommunicable diseases and injuries in the Russian Federation. Copenhagen, WHO Regional Office for Europe, 2007 (http://www.euro.who.int/__data/assets/pdf_file/0005/74741/E89992.pdf, accessed 15 July 2013).
628. Mackenbach JP, Meerding WJ, Kunst AE. Economic implications of socio-economic inequalities in health in the European Union. Luxembourg, European Commission, 2007.
629. Dow W, Schoeni RF. Economic value of improving the health of disadvantaged Americans. Princeton, NJ, The Robert Wood Johnson Foundation to the Commission to Build a Healthier America, 2008.
630. Mazzuco S, Meggiolaro S, Suhrcke M. The economic benefits of reducing health inequalities in England and Wales. Marmot Review task group report. London, Marmot Review Team, 2010.
631. CHOosing Interventions that are Cost Effective (WHO−CHOICE) [web site]. Geneva, World Health Organization, 2013 (http://www.who.int/choice/en/, accessed 15 July 2013).
632. HM Government. Securing the future: delivering UK sustainable devlopment strategy. Norwich, The Stationery Office, 2005.
633. Solomon S et al., eds. Climate change 2007. The physical science basis. Contribution of working group I to the fourth assessment report of the Intergovernmental Panel on Climate Change. Cambridge, Cambridge University Press, 2007.
634. May E et al. Health effects of climate change in the West Midlands: technical report. Birmingham, West Midlands Public Health Observatory, 2010 (http://www.wmpho.org.uk/publications/item.aspx?id=3276, accessed 15 July 2013).
635. Stern N. The Stern review: the economics of climate change. Cambridge, Cambridge University Press, 2006.
636. Food 2030. London, Department for Environment, Food and Rural Affairs, 2010 (http://archive.defra.gov.uk/foodfarm/food/pdf/food2030strategy.pdf, accessed 15 July 2013).
637. Friel S et al. Global health equity and climate stabilisation: a common agenda. Lancet, 2008, 372(9650):1677−1683.
638. Zatonski WA, Willett W. Changes in dietary fat and declining coronary heart disease in Poland: population based study. British Medical Journal, 2005, 331(7510):187−188.
639. Zatonski WA, McMichael AJ, Powles JW. Ecological study of reasons for sharp decline in mortality from ischaemic heart disease in Poland since 1991. British Medical Journal, 1998, 316(7137):1047−1051.
640. Gaziano TA, Galea G, Reddy KS. Chronic diseases 2 − scaling up interventions for chronic disease prevention: the evidence. Lancet, 2007, 370(9603):1939−1946.
641. Lang T. From “value-for-money” to “values-for-money”? Ethical food and policy in Europe. Environment and Planning A, 2010, 42(8):1814−1832.
642. The state of food and agriculture 2008. Biofuels: prospects, risks and opportunities. Rome, FAO Publishing, 2008.
643. Lobstein T, Friel S, Dowler E. Food, fuel and NCDs. Lancet, 2008, 372(9639):628.
644. The post-alcohol world. Economist, 30 October 2010. 645. Free food for Europe’s poor [web site]. Brussels, European
Commision Agriculture and Rural Development, 2010 (http://ec.europa.eu/agriculture/markets/freefood/index_en.htm, accessed 15 July 2013).
597. Vinokur AD, Schul Y. The web of coping resources and pathways to reemployment following a job loss. Journal of Occupational Health Psychology, 2002, 7(1):68−83.
598. Coutts A, Stuckler D, Cann D. The health and wellbeing effects of active labour market programmes. In: Huppert F, Cooper C, eds. Interventions and policies to enhance wellbeing. Oxford, Wiley-Blackwell, 2013.
599. Vuori J et al. The Työhön job search program in Finland: benefits for the unemployed with risk of depression or discouragement. Journal of Occupational Health Psychology, 2002, 7(1):5−19.
600. Creed PA, Muller J, Machin MA. The role satisfaction with occupational status, neuroticism, financial strain and categories of experience in predicting mental health in the unemployed. Personality and Individual Differences, 2001, 30:413−447.
601. Creed PA, Hicks RE, Machin MA. Behavioural plasticity and mental health outcomes for long-term unemployed attending occupational training programmes. Journal of Occupational and Organizational Psychology, 1998, 71:171−191.
602. Vesalainen J, Vuori J. Job-seeking, adaptation and re-employment experiences of the unemployed: a 3-year follow-up. Journal of Community & Applied Social Psychology, 1999, 9(5):383−394.
603. Siegrist J, Marmot M. Health inequalities and the psychosocial environment − two scientific challenges. Social Science & Medicine, 2004, 58(8):1463−1473.
604. Labonte R, Ruckert A. Global influences task group final report. Copenhagen, WHO Regional Office for Europe, 2012.
605. Stuckler D, Basu S, McKee M. The impact of global finance policy on public health and health inequality: crises and policy responses in the European Union. A global influences task group background report. Copenhagen, WHO Regional Office for Europe, 2012.
606. Global factors task group. Global factors task group final report. Copenhagen, WHO Regional Office for Europe, 2012.
607. Weisbrot M et al. IMF-supported macroeconomic policies and the world recession: a look at forty-one borrowing countries. Washington, DC, Center for Economic and Policy Research, 2009 (http://www.cepr.net/documents/publications/imf-2009-10.pdf, accessed 15 July 2013).
608. Houston M et al. Health services across Europe face cuts as debt crisis begins to bite. British Medical Journal, 2011, 343.
609. Janssen R. Greece and the IMF: who exactly is being saved? Washington, DC, Center for Economic and Policy Research, 2010 (http://www.cepr.net/documents/publications/greece-imf-2010-07.pdf, accessed 15 July 2013).
610. Economou M et al. Increased suicidality amid economic crisis in Greece. Lancet, 2011, 378(9801):1459.
611. Triantafyllou K, Angeletopoulou C. IMF and European co-workers attack public health in Greece. Lancet, 2011, 378(9801):1459−1460.
612. Weisbrot M, Ray R. Latvia’s internal devaluation: a success story? Washington, DC, Center for Economic and Policy Research, 2011.
613. United Nations Development Programme. Human development report 2011. Sustainabilitiy and equity: a better future for all. New York, Palgrave Macmillan, 2011.
614. Papademetriou DG, Sumption M, Somerville W. Migration and the economic downturn: what to expect in the European Union. Washington, DC, Migration Policy Institute, 2009.
615. Sachs J. Macroeconomics and health: investing in health for economic development. Report of the Commission on Macroeconomics and Health. Geneva, World Health Organization, 2001.
616. Acemoglu D, Johnson S. Disease and development: the effect of life expectancy on economic growth. Journal of Political Economy, 2007, 115(6):925−985.
617. Ashraf Q, Lester A, Weil DN. When does improving health raise GDP? Rhode Island, Brown University, 2008.
618. Beraldo S, Montolio D, Turati G. Healthy, educated and wealthy: is the welfare state really harmful for growth. Working paper in economics No. 127. Barcelona, Espai de Reverca en Economia, University of Barcelona, 2005.
619. Rivera B, Currais L. Economic growth and health: direct impact or reverse causation? Applied Economics Letters, 1999, 6(11):761−764.

References 185
670. Potts H. Participation and the right to the highest attainable standard of health. Colchester, University of Essex Human Rights Centre, 2008.
671. Hunt P, Backman G. Health systems and the right to the highest attainable standard of health. Colchester, University of Essex Human Rights Centre, 2008.
672. The right to the highest attainable standard of health. Geneva, Office of the United Nations High Commissioner for Human Rights, 2000 (http://www.unhchr.ch/tbs/doc.nsf/%28symbol%29/E.C.12.2000.4.En, accessed 15 July 2013).
673. Braveman P, Tarimo E. Social inequalities in health within countries: not only an issue for affluent nations. Social Science & Medicine, 2002, 54(11):1621−1635.
674. Together for health: a strategic approach for the EU 2008−2013. Brussels, EU, 2007 (http://ec.europa.eu/health/ph_overview/Documents/strategy_wp_en.pdf, accessed 15 July 2013).
675. Kjellstrom T. Our cities, our health, our future. Acting on social determinants for health equity in urban settings. Kobe City, WHO Centre for Health Development, 2008 (http://www.who.int/social_determinants/resources/knus_final_report_052008.pdf, accessed 15 July 2013).
676. Barton H, Tsourou C. Healthy urban planning: a WHO guide to planning for people. London, Spon, 2000.
677. Litvack J, Ahmad J, Bird R. Rethinking decentralization in developing countries. Washington, DC, The World Bank, 1998.
678. De Vries MS. The rise and fall of decentralization: a comparative analysis of arguments and practices in European countries. European Journal of Political Research, 2000, 38(2):193−224.
679. Bankauskaite V, Saltman RB. Central issues in the decentralization debate. In: Saltman RB, Bankauskaite V, Vrangbaek K, eds. Decentralization in health care. Berkshire, Open University Press, 2007.
680. Grady M et al. Addressing the social determinants of health: the urban dimension and the role of local government. Second Annual Business and Technical Conference of the WHO European Healthy Cities Network and the Network of European National Healthy Cities Networks, Liège, Belgium, 15–18 June 2011 (https://www.instituteofhealthequity.org/projects/addressing-the-social-determinants-of-health-the-urban-dimension-and-the-role-of-local-government, accessed 15 July 2013).
681. Stokke O, Foster J. Policy coherence in developmental cooperation. London, Frank Cass, 1999.
682. Smithies J, Hampson S. Review of good practice in community particpation and health projects. Howarth, Labyrinth Consultancy and Training, 1999.
683. Schmidt LA et al. Alcohol: equity and social determinants. In: Blas E, ed. Equity, social determinants and public health programmes. Geneva, World Health Organization, 2010:11−29.
684. Jernigan D. Alcohol in developing societies: a public health approach. Summary. Geneva, World Health Organization, 2002.
685. WHO Expert Committee on Problems related to Alcohol Consumption. Second report. Geneva, World Health Organization, 2007.
686. Questions and answers on solidarity in health: reducing health inequalities in the EU [web site]. Brussels, European Commission, 2009 (http://europa.eu/rapid/pressReleasesAction.do?reference=MEMO/09/467&format=HTML&aged=1&language=EN&guiLanguage=en, accessed 15 July 2013).
687. Mladovsky P et al. Health in the European Union. Trends and analysis. Copenhagen, WHO Regional Office for Europe, 2009 (http://www.euro.who.int/__data/assets/pdf_file/0003/98391/E93348.pdf, accessed 15 July 2013).
688. Dzurova D, Spilkova J, Pikhart H. Social inequalities in alcohol consumption in the Czech Republic: a multilevel analysis. Health and Place, 2010, 16(3):590−597.
689. Tomkins S et al. Prevalence and socio-economic distribution of hazardous patterns of alcohol drinking: study of alcohol consumption in men aged 25−54 years in Izhevsk, Russia. Addiction, 2007, 102(4):544−553.
690. Forcier M. Unemployment and alcohol abuse: a review. Journal of Occupational Medicine, 1988, 30(3):246−251.
691. Montgomery SM et al. Unemployment, cigarette smoking, alcohol consumption and body weight in young British men. European Journal of Public Health, 1998, 8(1):21−27.
646. Friel S, Walsh O, McCarthy D. The irony of a rich country: issues of financial access to and availability of healthy food in the Republic of Ireland. Journal of Epidemiology and Community Health, 2006, 60(12):1013−1019.
647. Macours K, Swinnen JFM. Rural–urban poverty differences in transition countries. World Development, 2008, 36(11):2170−2187.
648. Anand S, Sen A. Human development and economic sustainability. World Development, 2000, 28(12):2029−2049.
649. Universal Declaration of Human Rights. New York, United Nations, 1948 (http://www.un.org/en/documents/udhr/, accessed 15 July 2013).
650. Charter of the United Nations. New York, United Nations, 1945 (http://www.un.org/en/documents/charter/, accessed 15 July 2013).
651. Declaration on the Responsibilities of the Present Generations toward Future Generations. Paris, UNESCO, 1997 (http://www.unesco.org/cpp/uk/declarations/generations.pdf, accessed 15 July 2013).
652. Declaration of the Principles of International Cultural Co-operation. Paris, UNESCO, 1966 (http://portal.unesco.org/ en/ev.php-URL_ID=13147&URL_DO=DO_TOPIC&URL_SECTION=201.html, accessed 15 July 2013).
653. Read R. Guardians of the future. A consitutional case for representing and protecting future people. Dorset, Green House, 2012.
654. Raffensperger C, Giannini T, Docherty B. Models for protecting the environment for future generations. Science and Environmental Health Network. Cambridge, MA, International Human RIghts Clinic at Harvard Law School, 2008.
655. International Court of Justice. Legality of the threat or use of nuclear weapons. Reports of Judgments, Advisory Opinions and Orders, 1996, 243−244.
656. Communication from the Commission on the precautionary principle. COM/2000/0001 final. Brussels, European Commission, 2000 (http://eur-lex.europa.eu/LexUriServ/LexUriServ.do?uri=CELEX:52000DC0001:EN:NOT, accessed 15 July 2013).
657. The consolidated version of the treaty on the functioning of the European Union. Article 191, paragraph 2. Official Journal of the European Union, 2010, 30 March: C83/47−C83/199 (http://eur-lex.europa.eu/LexUriServ/LexUriServ.do?uri=OJ:C:2010:083:0047:0200:EN:PDF, accessed 15 July 2013).
658. The committee for the future [web site]. Helsinki, Parliament of Finland, 2013 (http://web.eduskunta.fi/Resource.phx/parliament/committees/future.htx, accessed 15 July 2013).
659. Beetham D. Parliament and democracy in the twenty-first century. A guide to good practice. Geneva, Inter-Parliamentary Union, 2006.
660. Tiihoen P. Revamping the work of the committee for the future. Helsinki, Parliament of Finland, 2011 (http://web.eduskunta.fi/dman/Document.phx?documentId=yf14511143357746&cmd=download, accessed 15 July 2013).
661. Act LIX of 1993 on the Parliamentary Commissioner for Civil Rights (Ombudsman), Article 27/A. Budapest, Parliament of Hungary, 2012.
662. Amendment no. 14 −5761/2001. Tel Aviv, The Knesset, 2001. 663. Overcoming inequality: why governance matters. Paris, UNESCO
Publishing, 2009. 664. Governance and delivery mechanisms task group report.
Copenhagen, WHO Regional Office for Europe, 2012. 665. Ministry of Health and Social Affairs. Objectives and priorities
for public health. Stockholm, Government Offices of Sweden, 2012 (http://www.government.se/sb/d/15472/a/184237, accessed 15 July 2013).
666. Mackenbach JP, Stronks K. A strategy for tackling health inequalities in the Netherlands. British Medical Journal, 2002, 325(7371):1029−1032.
667. International Covenant on Economic, Social and Cultural Rights. New York, United Nations, 1966 (http://www.ohchr.org/EN/ProfessionalInterest/Pages/CESCR.aspx, accessed 15 July 2013).
668. Committee on economic, social and cultural rights − general comments [web site]. New York, United Nations, 2009. (http://www2.ohchr.org/english/bodies/cescr/comments.htm, accessed 15 July 2013).
669. Potts H. Accountability and the right to the highest attainable standard of health. Colchester, University of Essex Human Rights Centre, 2008.

186 Review of social determinants and the health divide in the WHO European Region: final report
711. European portal for action on health inequalities. Gesund essen mit Freude [web site]. Brussels, the Equity Action, 2011 (http://www.health-inequalities.eu/HEALTHEQUITY/EN/good_practice_database/, accessed 15 July 2013).
712. European portal for action on health inequalities. Decent food for all (DFfA) [web site]. Brussels, the Equity Action, 2011 (http://www.health-inequalities.eu/HEALTHEQUITY/EN/good_practice_database/, accessed 15 July 2013).
713. European portal for action on health inequalities. The food and health project [web site]. Brussels, the Equity Action, 2011 (http://www.health-inequalities.eu/HEALTHEQUITY/EN/good_practice_database/, accessed 15 July 2013).
714. European portal for action on health inequalities. Romsas in motion [web site]. Brussels, the Equity Action, 2011 (http://www.health-inequalities.eu/HEALTHEQUITY/EN/good_practice_database/, accessed 15 July 2013).
715. Keimer KM, Dreas JA, Hassel H. Recruiting elderly with a migration and/or low socioeconomic status in the prevention study OptimaHl 60plus. Journal of Primary Prevention, 2011, 32(1):53−63.
716. Mendis S, Banerjee A. Cardiovascular disease: equity and social determinants. In: Blas E, Sivasankara Kurup A, eds. Equity, social determinants and public health programmes. Geneva, World Health Organization, 2010:31−48.
717. NACCHO. Youth Health and Wellness Clinic, Grand Traverse County Health Department, Michigan [web site]. Washington, DC, National Association of County and City Officials, 2011 (http://www.naccho.org/toolbox/, accessed 15 July 2013).
718. Jenum AK, Lorentzen CAN, Ommundsen Y. Targeting physical activity in a low socioeconomic status population: observations from the Norwegian “Romsas in motion” study. British Journal of Sports Medicine, 2009, 43(1):64−69.
719. Bambra C, Joyce K, Maryon-Davis A. Strategic review of health inequalities in England post-2010. Marmot Review. Task group 8: priority public health conditions. Final report. London, Marmot Review, 2009.
720. Cardiovascular disease. Facts and figures [online database]. Luxembourg, Eurostat, 2012 (http://www.euro.who.int/en/what-we-do/health-topics/noncommunicable-diseases/cardiovascular-diseases/facts-and-figures, accessed 15 July 2013).
721. Action plan for implementation of the European strategy for the prevention and control of noncommunicable diseases 2012−2016. Regional Committee for Europe, sixty-first session, EUR/RC61/12. Copenhagen, WHO Regional Office for Europe, 2011 (http://www.euro.who.int/__data/assets/pdf_file/0003/147729/wd12E_NCDs_111360_revision.pdf, accessed 15 July 2013).
722. Noncommunicable diseases: what gets measured, gets done. Concept note. New York, United Nations, 2011.
723. Beaglehole R et al. Priority actions for the non-communicable disease crisis. Lancet, 2011, 377(9775):1438−1447.
724. Interim first report on social determinants of health and the health divide in the WHO European Region. Copenhagen, WHO Regional Office for Europe, 2010 (http://www.euro.who.int/en/what-we-do/health-topics/health-determinants/social-determinants/publications/2010/interim-first-report-on-social-determinants-of-health-and-the-health-divide-in-the-who-european-region, accessed 15 July 2013).
725. Tuberculosis in the WHO European Region. Fact sheet 2012. Copenhagen, WHO Regional Office for Europe, 2012 (http://www.euro.who.int/__data/assets/pdf_file/0006/160683/TB-facts-sheet-for-WTBD_English_2012_final.pdf, accessed 15 July 2013).
726. Tuberculosis surveillance in Europe 2009. Stockholm, European Centre for Disease Prevention and Control, 2011.
727. Tuberculosis (TB). Multidrug-resistant tuberculosis (MDR-TB) [web site]. Geneva, World Health Organization, 2012 (http://www.who.int/tb/challenges/mdr/en/index.html, accessed 15 July 2013).
728. Lönnroth K et al. Drivers of tuberculosis epidemics: the role of risk factors and social determinants. Social Science & Medicine, 2009, 68(12):2240−2246.
729. Rasanathan K et al. The social determinants of health: key to global tuberculosis control. International Journal of Tuberculosis and Lung Disease, 2011, 15(Suppl. 2):S30−36.
730. Tuberculosis and gender. Copenhagen, WHO Regional Office for Europe, 2007 (http://www.euro.who.int/__data/assets/pdf_file/0020/69014/fs05E_TBgender.pdf, accessed 15 July 2013).
692. Zagozdzon P, Zaborski L, Ejsmont J. Survival and cause-specific mortality among unemployed individuals in Poland during economic transition. Journal of Public Health, 2009, 31(1):138−146.
693. Virtanen P et al. Employment trajectory as determinant of change in health-related lifestyle: the prospective HeSSup study. European Journal of Public Health, 2008, 18(5):504−558.
694. Walters S, Suhrcke M. Socioeconomic inequalities in health and health care access in central and eastern Europe and CIS: a review of the recent literature. Copenhagen, WHO Regional Office for Europe, 2005 (Working paper 2005/1; http:// www.euro.who.int/en/what-we-do/health-topics/health-determinants/social-determinants/publications/pre- 2007/socioeconomic-inequalities-in-health-and-health-care-access-in-central-and-eastern-europe-and-the-cis-a-review- of-the-recent-literature, accessed 15 July 2013).
695. Pomerleau J et al. Hazardous alcohol drinking in the former Soviet Union: a cross-sectional study of eight countries. Alcohol and Alcoholism, 2008, 43(3):351−359.
696. Van Oers JAM et al. Alcohol consumption, alcohol-related problems, problem drinking, and socioeconomic status. Alcohol and Alcoholism, 1999, 34(1):78−88.
697. Rickards L et al. Living in Britain no. 31. Results from the 2002 general household survey. London, The Stationery Office, 2004 (http://www.ons.gov.uk/ons/rel/ghs/general-household-survey/2002-edition/living-in-britain--full-report.pdf, accessed 15 July 2013).
698. Bloomfield K et al. Social inequalities in alcohol consumption and alcohol-related problems in the study countries of the EU concerted action “Gender, culture and alcohol problems: a multi-national study”. Alcohol and Alcoholism, 2006, 41(1):26−36.
699. Hemmingsson T et al. Explanations of social class differences in alcoholism among young men. Social Science & Medicine, 1998, 47(10):1399−1405.
700. Olsson BA, Olafsdottir H, Room R. Introduction: Nordic traditions of studying the impact of alcohol policies. In: Room R, ed. The effects of Nordic alcohol policies. What happens to drinking and harm when alcohol controls change. Helsinki, Nordic Council for Alcohol and Drug Research, 2002:5−12.
701. Meier PS, Purshouse R, Brennan A. Policy options for alcohol price regulation: the importance of modelling population heterogeneity. Addiction, 2010, 105(3):383−393.
702. Primary Health Care European Project on Alcohol [web site]. Barcelona, PHCEPA, 2012 (http://www.phepa.net/units/phepa/html/en/Du9/index.html, accessed 15 July 2013).
703. Reinap M, Tael M, Jesse M. Case study on socially determined inequities in alcohol consumption patterns in Estonia. Copenhagen, WHO Regional Office for Europe, 2013 (http://www.euro.who.int/en/where-we-work/member-states/estonia/publications3/case-study-on-socially-determined-inequities-in-alcohol-consumption-patterns-in-estonia, accessed 15 July 2013).
704. Blas E, Kurup AS. Equity, social determinants and public health programmes. Geneva, World Health Organization, 2010 (http://whqlibdocwhoint/publications/2010/9789241563970_eng pdf, accessed 15 July 2013).
705. Tobacco fact sheet no. 339. Geneva, World Health Organization, 2012 (http://www.who.int/mediacentre/factsheets/fs339/en/index.html, accessed 15 July 2013).
706. Bere E, Hilsen M, Klepp KI. Effect of the nationwide free school fruit scheme in Norway. British Journal of Nutrition, 2010, 104(4):589−594.
707. Plescia M, Herrick H, Chavis L. Improving health behaviors in an African American community: the Charlotte Racial and Ethnic Approaches to Community Health project. American Journal of Public Health, 2008, 98(9):1678−1684.
708. Wall M et al. Evaluation of community level interventions to address social and structural determinants of health: a cluster randomised controlled trial. BMC Public Health, 2009, 9:207.
709. Vaid I et al. WISEWOMAN: addressing the needs of women at high risk for cardiovascular disease. Journal of Women’s Health, 2011, 20(7):977−982.
710. Wilcox S et al. The faith, activity, and nutrition (FAN) program: design of a participatory research intervention to increase physical activity and improve dietary habits in African American churches. Contemporary Clinical Trials, 2010, 31(4):323−335.

References 187
753. Urban health: Healthy Cities [web site]. Copenhagen, WHO Regional Office for Europe, 2013 (http://www.euro.who.int/en/what-we-do/health-topics/environment-and-health/urban-health/activities/healthy-cities, accessed 15 July 2013).
754. Fryers P. Technical issues in measuring and monitoring targets to reduce health inequalities. Discussion paper for the Marmot Review, Committee 2. London, UCL Institute of Health Equity, 2009 (http://www.instituteofhealthequity.org/Content/FileManager/pdf/technical-issues-in-measuring-and-monitoring-targets-14.6.9.pdf, accessed 15 July 2013).
755. Dahlgren GA, Whitehead M. A discussion paper on European strategies for tackling social inequities in health: levelling up part 2. Copenhagen, WHO Regional Office for Europe, 2007 (http://www.euro.who.int/__data/assets/pdf_file/0018/103824/E89384.pdf, accessed 15 July 2013).
756. Harper S et al. Implicit value judgments in the measurement of health inequalities. Milbank Quarterly, 2010, 88(1):4−29.
757. Annycke P et al. Economic security for a better world. Geneva, International Labour Organization, 2004.
758. Currie C et al., eds. Health Behaviour in School-aged Children: international report from the 2005/2006 survey. Copenhagen, WHO Regional Office for Europe, 2008 (Health policy for children and adolescents no. 5; http://www.euro.who.int/en/what- we-do/health-topics/Life-stages/child-and-adolescent- health/publications/2008/inequalities-in-young-peoples-health.-hbsc-international-report-from-the-20052006-survey, accessed 15 July 2013).
759. Brooks A et al. State of the nation’s children. Ireland 2010. Dublin, Office of the Minister for Childern and Youth Affairs, 2010.
760. Kleiser C et al. Potential determinants of obesity among children and adolescents in Germany: results from the cross-sectional KiGGS study. BMC Public Health, 2009, 2:9.
761. Communication from the Commission on solidarity in health: reducing health inequalities in the EU. Brussels, European Commission, 2009 (http://ec.europa.eu/health/social_determinants/policy/commission_communication/index_en.htm, accessed 15 July 2013).
762. Peake S et al. Health equity through intersectoral action: an analysis of 18 country case studies. Geneva, World Health Organization, 2008.
763. Cook B. Health inequalities. Belfast, Southern Health Board, 2009.
764. Spending review 2010. London, HM Treasury, 2010 (http://www.hm-treasury.gov.uk/spend_index.htm, accessed 15 July 2013).
765. The Norwegian Public Health Act. Oslo, Ministry of Health and Care Services, 2012 (http://www.regjeringen.no/upload/HOD/Hoeringer%20FHA_FOS/123.pdf, accessed 15 July 2013).
766. Judge K et al. Health inequalities: a challenge for Europe. An independent, expert report commissioned by the UK Presidency of the EU (February 2006). London, Department of Health, 2006 (http://ec.europa.eu/health/ph_determinants/socio_economics/documents/ev_060302_rd05_en.pdf, accessed 15 July 2013).
767. The Health and Social Care Act 2012 fact sheet. London, Department of Health, 2012 (http://www.dh.gov.uk/health/files/2012/06/A1.-Factsheet-Overview-240412.pdf, accessed 15 July 2013).
768. Sen A. Elements of a theory of human rights. Philosophy & Public Affairs, 2004, 32(4):315−356.
769. Hendriks AC. De betekenis van het EVRM voor het gezondheidrecht. Gezondheidszorg en Europees recht. Preadvies 2009 [The implications of the ECHR for health law. Health care and European law. Preliminary 2009]. The Hague, SDU, 2009.
770. Dahlgren GA, Whitehead M. Policies and strategies to promote social equity in health. Stockholm, Institute of Future Studies, 1991.
771. Graham H. Tackling inequalities in health in England: remedying health disadvantages, narrowing health gaps or reducing health gradients? Journal of Social Policy, 2004, 33:115−131.
772. Key informant interviews on approaches to tackling health inequities. Copenhagen, WHO Regional Office for Europe, 2010.
773. Opportunities for scaling up and strengthening health in all policies in south-eastern Europe. Copenhagen, WHO Regional Office for Europe, 2012.
774. Policy review of the resource guide on governance for social determinants of health and health inequities. Copenhagen, WHO Regional Office for Europe, 2011.
731. Controlling TB among the Roma − a community approach [web site]. Copenhagen, WHO Regional Office for Europe, 2010 (http://data.euro.who.int/Equity/hidb/Resources/Details.aspx?id=8, accessed 15 July 2013).
732. Keshavjee S et al. Treating multidrug-resistant tuberculosis in Tomsk, Russia: developing programs that address the linkage between poverty and disease. Annals of the New York Academy of Science, 2008, 1136:1−11.
733. Hayward AC et al. Epidemiology and control of tuberculosis in western European cities. International Journal of Tuberculosis and Lung Disease, 2003, 7(8):751−757.
734. Dick J et al. Primary health care nurses implement and evaluate a community outreach approach to health care in the South African agricultural sector. International Nursing Review, 2007, 54(4):383−390.
735. Rocha C et al. The Innovative Socio-economic Interventions Against Tuberculosis (ISIAT) project: an operational assessment. International Journal of Tuberculosis and Lung Disease, 2011, 15(Suppl.2):S50−57.
736. Press release: reference 2000/0187. London, Department of Health, 2000.
737. Canto JG et al. Association of age and sex with myocardial infarction symptom presentation and in-hospital mortality. Journal of the American Medical Association, 2012, 307(8):813−822.
738. Rosengren A et al. Sex differences in survival after myocardial infarction in Sweden − data from the Swedish national acute myocardial infarction register. European Heart Journal, 2001, 22(4):314−322.
739. Vaccarino V et al. Sex differences in 2-year mortality after hospital discharge for myocardial infarction. Annals of Internal Medicine, 2001, 134(3):173−181.
740. Marrugat J et al. Role of age and sex in short-term and long-term mortality after a first Q-wave myocardial infarction. Journal of Epidemiology & Community Health, 2001, 55(7):487−493.
741. Mental health atlas 2005. Geneva, World Health Organization, 2005.
742. Women and men in Ireland. Dublin, Central Statistical Office Ireland, 2011.
743. McCartney G et al. Contribution of smoking-related and alcohol-related deaths to the gender gap in mortality: evidence from 30 European countries. Tobacco Control, 2011, 20(2):166−168.
744. Ulfarsson GF, Mannering FL. Differences in male and female injury severities in sport-utility vehicle, minivan, pickup and passenger car accidents. Accident Analysis and Prevention, 2004, 36(2):135−147.
745. Sex differences in driving and insurance risk. Oxford, Social Issues Research Centre, 2004.
746. Albania demographic and health survey 2008−09. Tirana, Institute of Statistics, Institute of Public Health and ICF Macro, 2010 (http://www.measuredhs.com/pubs/pdf/FR230/FR230.pdf, accessed 15 July 2013).
747. Glouberman S et al. A toolbox for improving health in cities: a discussion paper. Ontario, The Caledon Institute of Social Policy, 2003.
748. Measurements and targets task group final report: review of the social determinants of health and the health divide in the WHO European Region. Copenhagen, WHO Regional Office for Europe, 2012.
749. Living conditions in 2008. 17% of EU27 population at risk of poverty. Higher risk of poverty among children and elderly [online news release]. Luxembourg, Eurostat, 2010 (http://epp.eurostat.ec.europa.eu/cache/ITY_PUBLIC/3-18012010-AP/EN/3-18012010-AP-EN.PDF, accessed 15 July 2013).
750. Whelan CT, Nolan B, Maitre B. Measuring material deprivation in the enlarged EU. Washington, DC, Economic and Social Research Institute, 2008 (Working paper no. 249; http://www.esri.ie/UserFiles/publications/20090129121820/WP249.pdf, accessed 15 July 2013).
751. Rutstein S, Johnson K. The DHS wealth index, DHS comparative reports no. 6. Calverton, MD, ORC Macro, 2004.
752. Penttilä I, Nordberg L. Objective and subjective measures of poverty in the European Community Household Panel. Helsinki, Statistics Finland, 1999 (http://www stat fi/isi99/proceedings/arkisto/varasto/nord0702 pdf, accessed 15 July 2013).

188 Review of social determinants and the health divide in the WHO European Region: final report
775. Mackenbach JP. The persistence of health inequalities in modern welfare states: the explanation of a paradox. Social Science & Medicine, 2012, 75(4):761−769.
776. Thaler RH, Sunstein CR. Nudge: improving decisions about health, wealth and happiness. New Haven, Yale University, 2008.
777. Graham J, Amos B, Plumptre T. Principles for good governance in the 21st century. Toronto, Institute on Governance, 2003 (Policy brief no. 15; http://unpan1.un.org/intradoc/groups/public/documents/UNPAN/UNPAN011842.pdf, accessed 15 July 2013).
778. Moving forward equity in health – monitoring and analysis of social determinants. An independent expert report commissioned through the Spanish Presidency of the EU. Madrid, Ministry of Health and Social Policy, 2010 (http://www.msssi.gob.es/profesionales/saludPublica/prevPromocion/promocion/desigualdadSalud/PresidenciaUE_2010/conferenciaExpertos/docs/haciaLaEquidadEnSalud_en.pdf, accessed 15 July 2013).
779. Crossing sectors − experiences in intersectoral action, public policy and health. Ottawa, Public Health Agency of Canada, 2007. Cited in: World health. Closing the gap: policy into practice on social determinants of health. Discussion paper. Geneva, World Health Organization, 2012:15 (http://www.who.int/sdhconference/Discussion-Paper-EN.pdf, accessed 15 July 2013).
780. Valentine N et al. Health equity at the country level: building capacities and momentum for action. A report on the country stream of work in the Commission on Social Determinants of Health. Geneva, World Health Organization, 2008.
781. The Venice appraisal and development tool for governance to address the social determinants of health and the reduction of socially caused health inequalities (SDH/HI). Venice, WHO European Office for Investment in Health and Development, 2009 (http://www.who.int/nationalpolicies/resources/resources_tools/en/index.html, accessed 15 July 2013).
782. Andersen J, Larsen JE. Social inclusion and spatial inequality in the city − the Danish case. Australian Social Policy Conference, “Social Inclusion”, Sydney, 9−11 July 2003.

Executive summary 189

190 Review of social determinants and the health divide in the WHO European Region: final report
The World Health Organization (WHO) is a specialized agency of the United Nations created in 1948 with the primary responsibility for international health matters and public health. The WHO Regional Office for Europe is one of six regional offices throughout the world, each with its own programme geared to the particular health conditions of the countries it serves.
Member States
Albania Andorra Armenia Austria Azerbaijan Belarus Belgium Bosnia and Herzegovina Bulgaria Croatia Cyprus Czech Republic Denmark Estonia Finland France Georgia Germany Greece Hungary Iceland Ireland Israel Italy Kazakhstan Kyrgyzstan Latvia Lithuania Luxembourg Malta Monaco Montenegro Netherlands Norway Poland Portugal Republic of Moldova Romania Russian Federation San Marino Serbia Slovakia Slovenia Spain Sweden Switzerland Tajikistan The former Yugoslav Republic of Macedonia Turkey Turkmenistan Ukraine United Kingdom Uzbekistan
World Health Organization Regional Office for Europe
UN City Marmorvej 51 DK-2100 Copenhagen Ø Denmark
Tel.: +45 45 33 70 00 Fax: +45 45 33 70 01 E-mail: [email protected] Web site: www.euro.who.int
cove
r ph
oto:
bjo
ern
stei
nz | p
anos
pic
ture
s