review of school bus collisions in alberta · review of school bus collisions in alberta final...
TRANSCRIPT

REVIEW OF SCHOOL BUS COLLISIONS IN ALBERTA Final Report
August 7, 2008
Opus Hamilton Consultants Ltd. Opus Hamilton Consultants Ltd. Unit 308, 809 Manning Road NE, Calgary, AB, T2E 7M9 Telephone: (403) 207 6000 Facsimile: (403) 207 6045 Contact Person: Sany R Zein [email protected] Our Reference: F-00044.00

School Bus Collisions in Alberta
Aug 2008 File Ref: F-00044.00

School Bus Collisions in Alberta
Aug 2008 File Ref: F-00044.00
Table of Contents Executive Summary 1. Introduction PAGE 1
1.1 Study Purpose PAGE 1 1.2 Background PAGE 1 1.3 School Buses and Seat Belts PAGE 3
2 School Bus Collision Trends PAGE 4
2.1 Annual Trends PAGE 4 2.2 Temporal Trends PAGE 6 2.3 Primary Event PAGE 8 2.4 Road Conditions PAGE 10 2.5 Driver Issues & Characteristics PAGE 12 2.6 Collision Locations PAGE 16 2.7 Review of Fatal Collisions PAGE 18 2.8 Overall and Major Injury Trends Summary PAGE 18
3 Recommendations PAGE 19
3.1 Recommendations for School Bus Improvements PAGE 20 3.2 Recommendations for Bus Route Safety PAGE 22 3.3 Recommendations for Driver Hiring & Training Issues PAGE 23 3.4 Recommendations for School Bus Safety Performance Management PAGE 25
APPENDIX A: Major Injury School Bus Collisions – Analysis Results APPENDIX B: All School Bus Collisions – Additional Analysis Results Cover photo by David Manifold, used with permission.

School Bus Collisions in Alberta
Aug 2008 File Ref: F-00044.00
THIS PAGE INTENTIONALLY LEFT BLANK.

School Bus Collisions in Alberta
Aug 2008 File Ref: F-00044.00
1
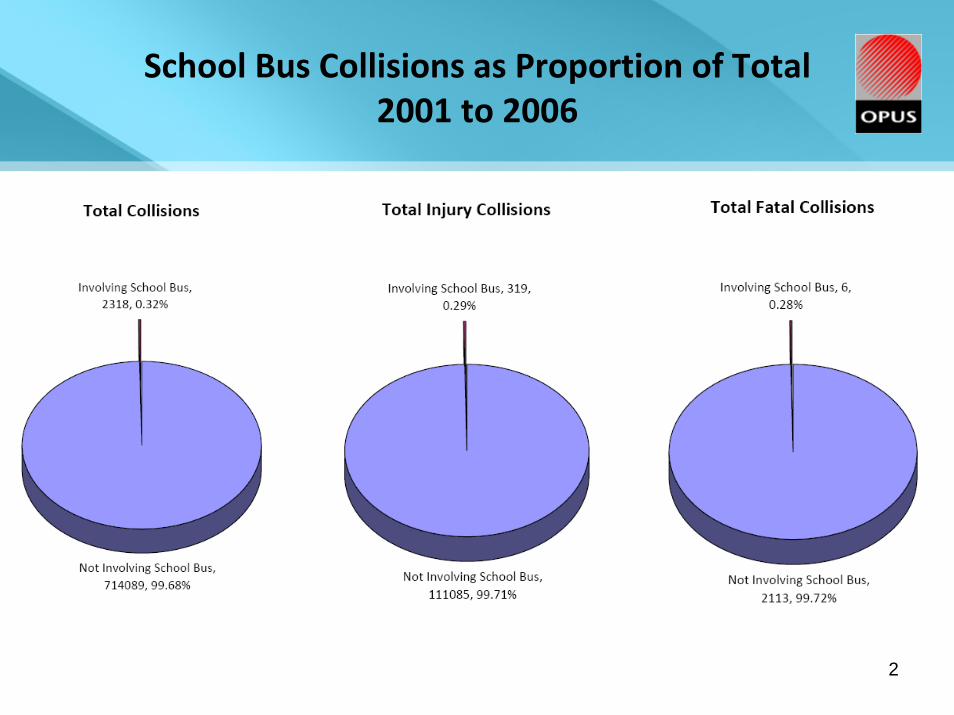
Executive Summary The purpose of this study is to independently review trends related to school bus collisions in Alberta, and to provide recommendations to Alberta Transportation related to improvements that can be made to reduce collisions involving school buses. This study is part of a larger review of school bus safety in Alberta involving school bus contractors, school boards, and government departments responsible for driver licensing, vehicle safety and student transportation. Every day more than 5,000 buses are used to transport over 265,000 young Albertans to school. This study included an independent review of all school bus collisions occurring in Alberta during the five school years from September 2001 to June 2006. The study also included a literature review of school bus safety issues, and a review of current practices related to school bus safety in other Canadian and international jurisdictions. The review of any advantages or disadvantages of providing seat-belts on school buses was not part of the scope of this study. Over the five year timeframe for this study (September 2001 to June 2006), a total of 2,318 school bus collisions were reported in Alberta. Six of these collisions were fatal (at least one person killed), 319 resulted in injury (at least one person injured), and the remaining 1,993 resulted in property damage. Of the 319 injury collisions, 42 resulted in major injuries requiring admittance to a hospital. Some of the key trends identified in this study are summarized as follows:
• The ratio of school bus collisions to total collisions in Alberta is relatively stable from year to year (around 0.46 percent of all collisions involve school buses).
• There is a slightly lower risk of school bus collisions resulting in injuries
(13.7 percent), compared to all collisions in Alberta (15.2 percent). • January, February and March are the months with the highest frequency of
school bus collisions; Wednesday is the day with the highest frequency of school bus collisions; and the morning hours between 0700 and 0900 are the hours with the highest frequency of school bus collisions.
• The most common type of school bus collision is “rear-end”, which
accounts for 28 percent of the total.

School Bus Collisions in Alberta
Aug 2008 File Ref: F-00044.00
2
• Most school bus collisions occur on dry pavement (49 percent), but another
42 percent occur on pavement that is covered with snow, slush, or ice. • School bus drivers were found by the attending police officer to be “driving
properly” in 58 percent of the school bus collisions. The school bus driver was either solely or jointly at-fault in 42 percent of the collisions. When the school bus driver was found to be driving improperly, the driver was most commonly either “following too closely” or “backing unsafely”.
• School bus collisions are most commonly reported in Edmonton and
Calgary. Three of the six fatal crashes occurred in rural areas. As a result of the research conducted for this study, recommendations to improve the safety of school bus travel were prepared for the consideration of Alberta Transportation. Consultation with all the relevant affected stakeholders will be needed prior to the implementation of these recommendations. The recommendations are categorized into the following areas:
• School Bus Improvements; • Bus Route Safety; • Driver Hiring and Training Issues; and, • School Bus Safety Performance Management.
A priority was assigned to each recommendation, also for the consideration of Alberta Transportation. The recommendations are summarized in the Tables below, and are discussed in greater detail in Section 3 of this report.
Recommendations for School Bus Improvements
Reference Recommendation Priority
1A All school buses to be equipped with a flashing strobe light on the roof.
High
1B All school buses to be equipped with on-board passenger video recording equipment (short-term loop or incident-activated).
Medium
1C All school buses to be equipped with Global Positioning Systems (GPS).
Medium-High
1D All school buses to be equipped with Electronic Vehicle Recorders.
Medium-High
1E Upgrade alternately flashing lights to LEDs Medium
1F All school buses to be equipped with back-up monitor displays.
Medium

School Bus Collisions in Alberta
Aug 2008 File Ref: F-00044.00
3
Recommendations for Bus Route Safety
Reference Recommendation Priority
2A
A documented road safety assessment of all bus routes should be conducted within 1 month of the start of every school year, using a simple, standardized checklist.
High
Recommendations for Driver Hiring & Training Issues
Reference Recommendation Priority 3A All school bus drivers to have the S-Endorsement High
3B Adopt standardized criteria for driver hiring based on the recommendations of the American School Bus Council (February 14, 2007) for driver hiring.
Medium
3C Review/enhance driver training related to: poor road surface/weather conditions; following distances.
Medium
Recommendations for School Bus Safety Performance Management
Reference Recommendation Priority
4A Implement an industry-managed one-stop Hot-Line and web site for reporting school bus safety concerns, including driver
Medium
4B Create and manage a registry of active school bus drivers, updated on an annual basis.
High
4C Implement an annual safety performance award recognition system for carriers and drivers.
Medium
4D Increase public awareness of fines or penalties for not stopping for a school bus.
Low

School Bus Collisions in Alberta
Aug 2008 File Ref: F-00044.00
4
THIS PAGE INTENTIONALLY LEFT BLANK.

School Bus Collisions in Alberta
Aug 2008 File Ref: F-00044.00
1
1. Introduction
1.1. Study Purpose
The purpose of this study is to independently review trends related to school bus collisions in Alberta, and to provide recommendations to Alberta Transportation related to improvements that can be made to reduce collisions involving school buses. This study is part of a larger review of school bus safety in Alberta involving school bus contractors, school boards, and government departments responsible for driver licensing, vehicle safety and student transportation.
1.2. Background
School bus safety has always had a high priority in Alberta with many systems currently in place to ensure safe travel. Recent fatalities involving school buses have brought media and public attention to this topic, and Alberta Transportation has instigated a thorough review of school bus collisions in Alberta and a review of industry best practice to determine whether existing systems can be improved. Every day more than 5,000 buses are responsible for the safe transportation of over 265,000 young Albertans to school. Multiple agencies are involved in the provision of school bus transportation, each recognizing the importance of safety. This review has been undertaken in the knowledge that much previous work has been done both within Alberta Transportation and other agencies involved with school bus travel. There is a constant desire to strive for even better and safer service. This review is the result of this mindset; to ensure safety remains a priority, and industry best practice is met wherever possible. This study conducted an independent review of all school bus collisions occurring in Alberta during the five school years from September 2001 to June 2006. Over the five year timeframe for this study, a total of 2,318 school bus collisions were reported in Alberta, shown in TABLE 1. Six of these collisions were fatal (at least one person killed), 319 resulted in injury (at least one person injured), and the remaining 1,993 resulted in property damage. Of the 319 injury collisions, 42 resulted in major injuries requiring admittance to a hospital.

School Bus Collisions in Alberta
Aug 2008 File Ref: F-00044.00
2
TABLE 2 presents these values in the context of the total number of collisions that occurred in Alberta during the same time period. Collisions that involve school buses represent about 0.46 percent of the total number of Alberta crashes.
TABLE 1: SCHOOL BUS COLLISIONS IN ALBERTA
(by school year)
2001/2002
2002/2003
2003/2004
2004/2005
2005/2006
TOTAL SCHOOL BUS COLLISIONS
% OF TOTAL SCHOOL BUS COLLISIONS
Fatal - 1 3 1 1 6 0.26%
Injury 66 76 69 47 61 319 13.76%
PDO* 360 418 369 416 430 1,993 85.98%
TOTAL 426 495 441 464 492 2,318 100%
* PDO = Property Damage Only
TABLE 2: COMPARISON OF SCHOOL BUS COLLISIONS TO ALL COLLISIONS IN ALBERTA, SEPTEMBER 2001 TO JUNE 2006
SEVERITY SCHOOL BUS COLLISIONS
ALL COLLISIONS IN ALBERTA
RATIO
Fatal 6 1,370 0.44%
Injury 319 76,620 0.42%
PDO 1,993 424,979 0.47%
TOTAL 2,318 502,969 0.46%
The ratio of injury school bus collisions to total school bus collisions is 13.7 percent. The ratio of total injury to total collisions in Alberta during the same time period is 15.2 percent. There is therefore a slightly lower risk of school bus collisions resulting in injuries compared to all collisions.

School Bus Collisions in Alberta
Aug 2008 File Ref: F-00044.00
3
In order to understand the trends relating to school bus collisions the following project tasks were completed: • A review of trends relating to total collisions split by spatial distribution,
temporal and environmental distribution and driver characteristics; • A summary of all fatal collisions, including environmental and driver
conditions; • A review of trends relating to injury collisions split by spatial distribution,
temporal and environmental distribution, driver characteristics and location type;
• Research regarding driver recruitment, training and certification programs in
Alberta and beyond; • Research of best practice regarding school bus route choice, pick-up/drop-off
procedures and school bus visibility; • Analysis of school bus collision rates in relation to non-school bus collision
rates; and • A review of issues raised by the school bus drivers. This report documents the results of the above project tasks and proposes a number of recommendations. 1.3 School Buses and Seat Belts The scope of this study excluded the review of any advantages and disadvantages related to the provision of seat-belts on school buses. A separate research assignment focusing on the review of international literature related to seat-belts on school buses is being conducted by Alberta Transportation.

School Bus Collisions in Alberta
Aug 2008 File Ref: F-00044.00
4
2. School Bus Collision Trends
This section describes the analysis of school bus collisions completed as part of this study. As a percentage, school bus collisions make up around 0.46 percent of all collisions in Alberta. Therefore all trends and conclusions should be taken against a background of very low overall numbers of collisions involving school buses.
2.1. Annual Trends
FIGURE 1 summarizes the annual school bus collision statistics by severity.
FIGURE 1: ANNUAL SCHOOL BUS COLLISIONS BY SEVERITY (SEPTEMBER 2001 TO JUNE 2006)
Over the five year study period, school bus collisions causing property damage have increased from 360 (in 2001/02) to 430 (in 2005/06), an increasing rate of 4.5 percent per year. However, this increase has not been continuous (there was no increase in frequency between 2002/03 and 2004/05). In comparison, Alberta’s population grew by an average of 2.5 percent between 2001 and 2006 (from 2.9 to 3.3 Million).

School Bus Collisions in Alberta
Aug 2008 File Ref: F-00044.00
5
The number of school bus collisions causing injuries has slightly decreased from 66 in 2001/02 to 61 in 2005/06, although this number has fluctuated as high as 76 and as low as 47 during the years that were analyzed for this study. The number of school bus collisions resulting in fatalities has not exceeded three in any one school year. Fatal collisions involving school buses are extremely rare events and no trends can be discerned. FIGURE 2 illustrates the percentage of school bus collisions as a proportion of all Alberta collisions for each year by severity.
FIGURE 2: ANNUAL RATIO OF SCHOOL BUS COLLISIONS TO ALL ALBERTA COLLISIONS
(SEPTEMBER 2001 TO JUNE 2006)
The ratio of all school bus collisions to all Alberta collisions has been relatively steady since 2001 and has averaged 0.46 percent. The ratio of school bus collisions causing injury to all Alberta collisions that caused injury has averaged 0.42 percent. There is no discernable increasing representation of school bus related collisions in the overall number of Alberta collisions. The occurrence of school bus related collisions is closely aligned with overall collision trends.

School Bus Collisions in Alberta
Aug 2008 File Ref: F-00044.00
6
There is wide year-to-year discrepancy in the ratio of fatal school bus collisions relative to total Alberta fatal collisions, since bus collisions resulting in fatalities are generally rare events.
2.2. Temporal Trends The monthly distribution of school bus collisions was analyzed, and the results are shown in FIGURE 3.
FIGURE 3: MONTHLY DISTRIBUTION OF SCHOOL BUS COLLISIONS (SEPTEMBER 2001 TO JUNE 2006)
The results of the monthly distribution analysis suggest that January, February and March are the highest risk months for school bus collisions. The frequency of both property damage only and injury collisions is highest during these months. This result suggests that winter driving conditions likely contribute to the risk of occurrence of school bus collisions. September to December represents the second-highest risk period, while April to June represents the lowest risk period of the year. The daily distribution of school bus collisions was analyzed, and the results are summarized in FIGURE 4.

School Bus Collisions in Alberta
Aug 2008 File Ref: F-00044.00
7
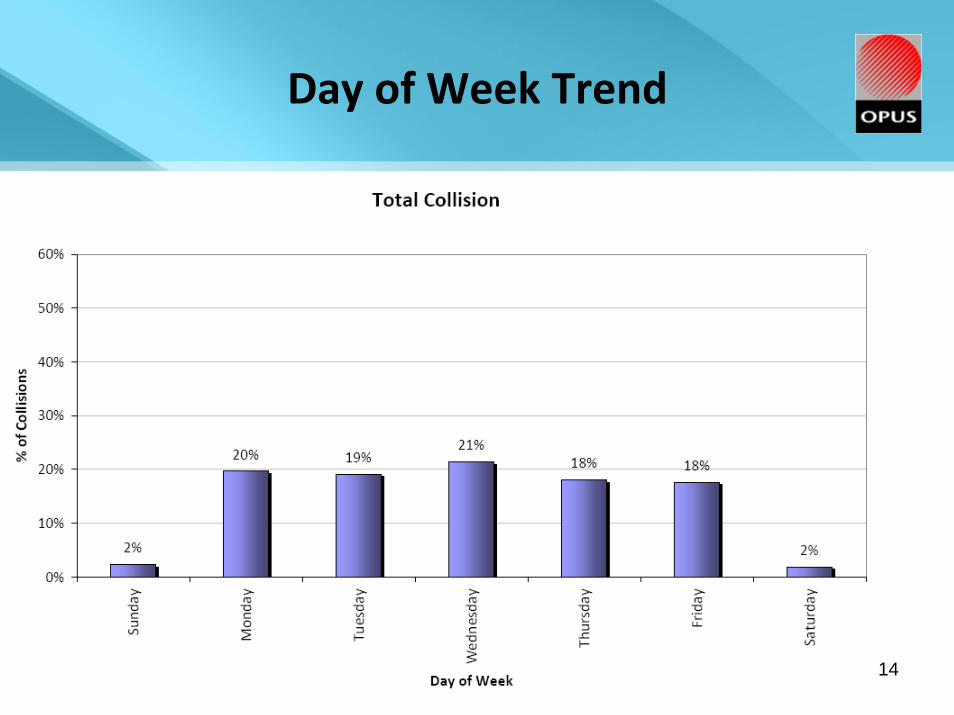
FIGURE 4: DAY OF WEEK DISTRIBUTION OF SCHOOL BUS COLLISIONS (SEPTEMBER 2001 TO JUNE 2006)
School bus collisions tend to occur between Monday and Friday, mirroring standard school opening times. The highest frequency of school bus collisions occurred on Wednesday. Property-damage-only and fatal collision frequencies were highest on Wednesday, while the injury collision frequency was highest on Monday. The lower frequency of school bus collisions on Friday may be related to the occurrence of professional development days and statutory holidays, thereby reducing the exposure of school buses on those days. The occurrence of school bus collisions by time of day was analyzed, and the results are summarized in FIGURE 5.
School Bus Collisions in Alberta
Aug 2008 File Ref: F-00044.00
8
F
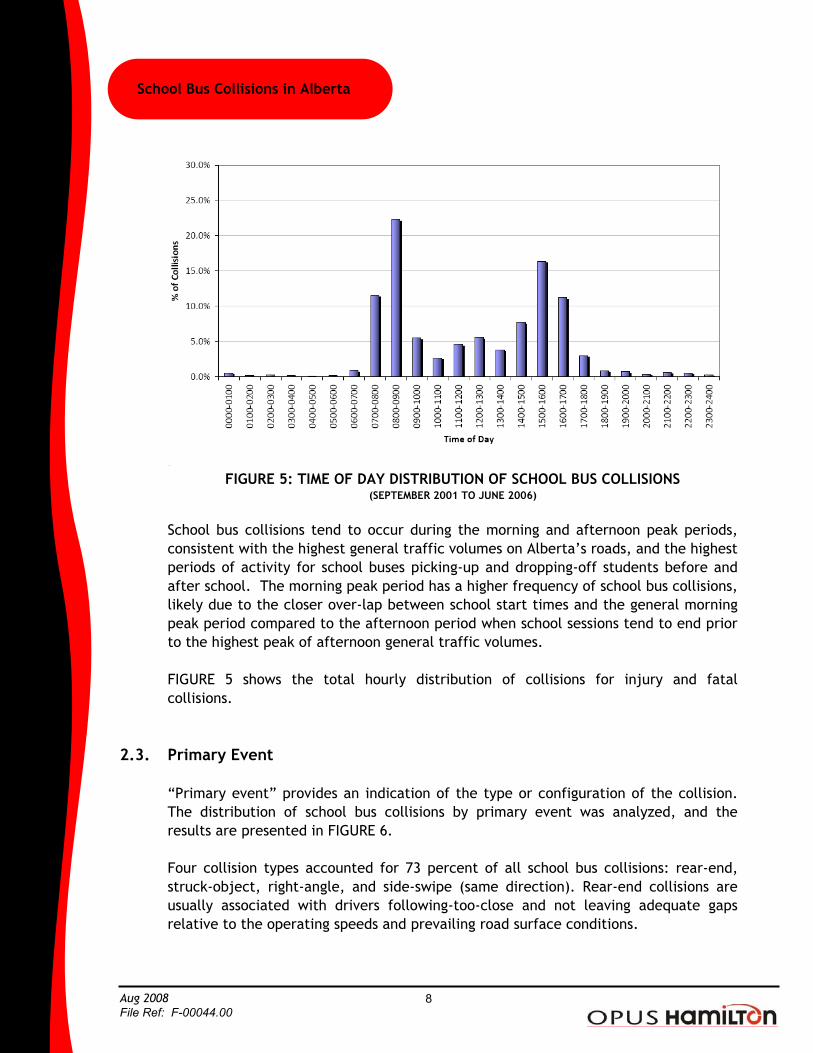
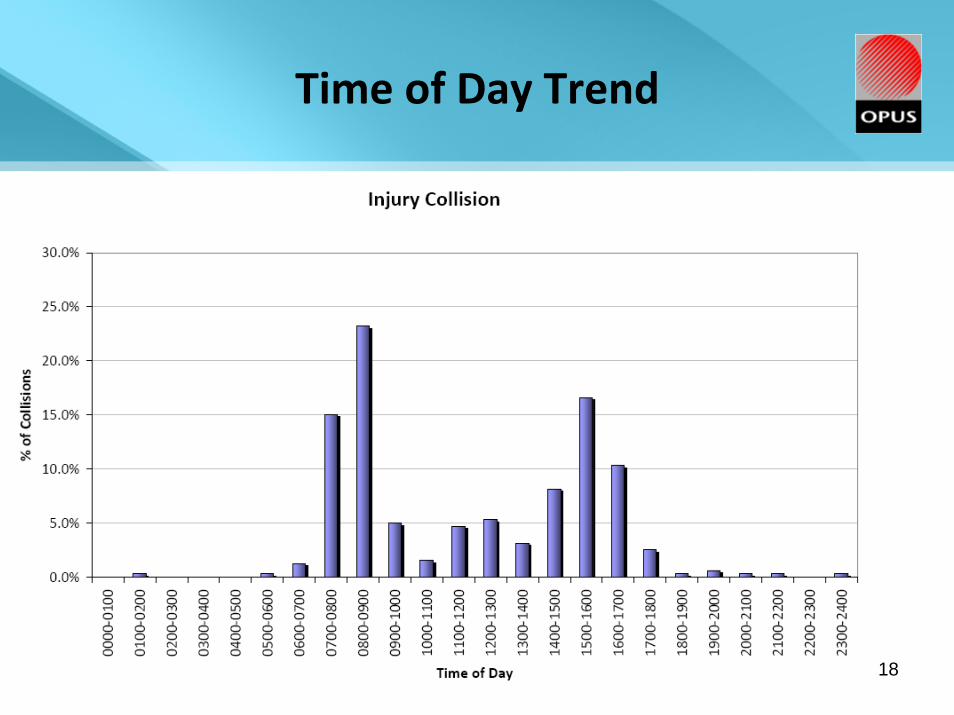
FIGURE 5: TIME OF DAY DISTRIBUTION OF SCHOOL BUS COLLISIONS (SEPTEMBER 2001 TO JUNE 2006)
School bus collisions tend to occur during the morning and afternoon peak periods, consistent with the highest general traffic volumes on Alberta’s roads, and the highest periods of activity for school buses picking-up and dropping-off students before and after school. The morning peak period has a higher frequency of school bus collisions, likely due to the closer over-lap between school start times and the general morning peak period compared to the afternoon period when school sessions tend to end prior to the highest peak of afternoon general traffic volumes. FIGURE 5 shows the total hourly distribution of collisions for injury and fatal collisions.
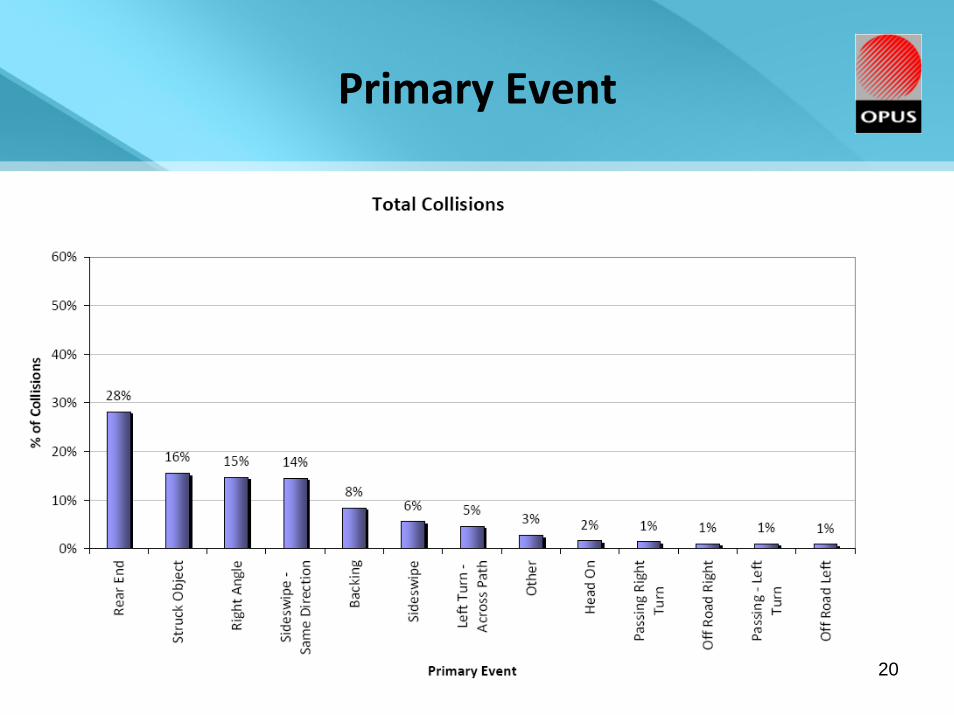
2.3. Primary Event “Primary event” provides an indication of the type or configuration of the collision. The distribution of school bus collisions by primary event was analyzed, and the results are presented in FIGURE 6. Four collision types accounted for 73 percent of all school bus collisions: rear-end, struck-object, right-angle, and side-swipe (same direction). Rear-end collisions are usually associated with drivers following-too-close and not leaving adequate gaps relative to the operating speeds and prevailing road surface conditions.

School Bus Collisions in Alberta
Aug 2008 File Ref: F-00044.00
9
FIGURE 6: PRIMARY EVENT REPORTED IN SCHOOL BUS COLLISIONS
(SEPTEMBER 2001 TO JUNE 2006)
Struck-object collisions typically involve striking an animal, a parked or stopped vehicle, a roadside or median barrier, a pedestrian or cyclist, a ditch, or similar objects. Right-angle collisions are typically intersection-related and usually involve a driver who entered the intersection when it was not safe to do so. Side-swipe (same direction) collisions typically involve unsafe lane changes, merging and passing (overtaking) manoeuvres. The point of impact on the bus, as reported by police, was analyzed. The results are summarized in FIGURE 7. The most common point of impact on the bus was “Front Centre” at 38 percent. The second most common bus point of impact was “Back Centre” at 13 percent. This is consistent with Rear End being the most common type of collision involving school buses. The higher proportion of “Front Centre” points of impact suggests that it is more common for buses to be the following vehicle (instead of the leading vehicle) in a rear-end collision.

School Bus Collisions in Alberta
Aug 2008 File Ref: F-00044.00
10
FIGURE 7: SCHOOL BUS POINT OF IMPACT (SEPTEMBER 2001 TO JUNE 2006)
2.4. Road Conditions
The road surface conditions related to all school bus collisions from 2001 to 2006 were compared with the surface conditions for all collisions recorded in Alberta during the same time, and the results are presented in FIGURE 8. July and August were removed from both data sets to allow for a meaningful comparison. It was found that 42 percent of school bus collisions during the remaining months occurred during slush / snow / ice road surface conditions, compared to 30 percent of all collisions in Alberta. This implies that school buses are more susceptible to collisions during adverse road surface conditions than regular passenger vehicles.

School Bus Collisions in Alberta
Aug 2008 File Ref: F-00044.00
11
FIGURE 8: SURFACE CONDITIONS – SCHOOL BUS COLLISIONS AND ALL ALBERTA COLLISIONS
(SEPTEMBER 2001 TO JUNE 2006)

School Bus Collisions in Alberta
Aug 2008 File Ref: F-00044.00
12
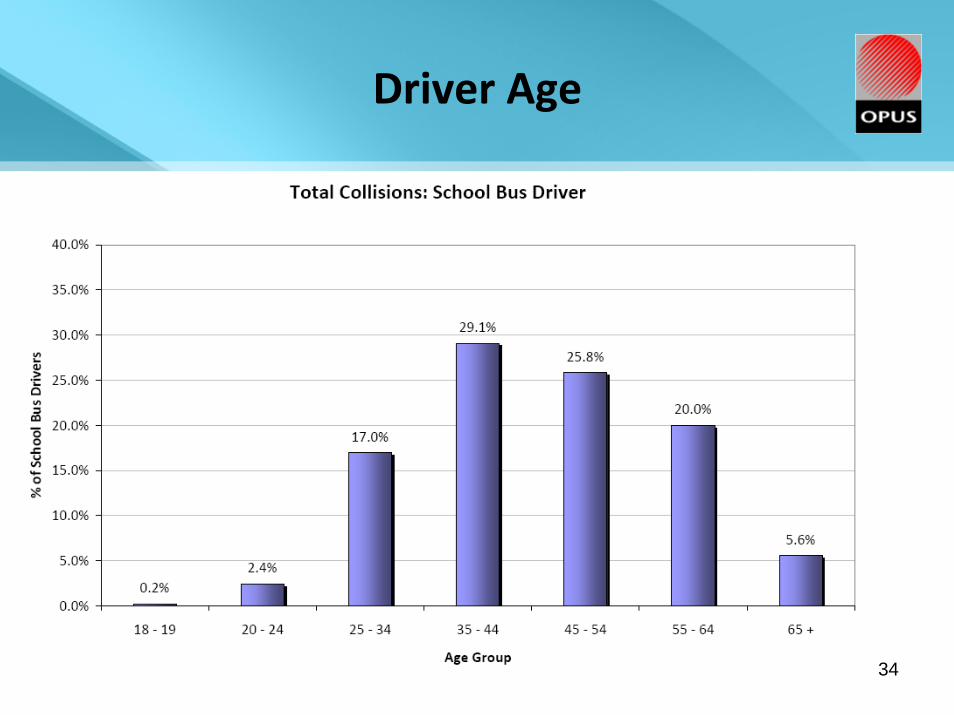
2.5 Driver Issues & Characteristics
The age of the drivers involved in all the school bus collisions was analyzed, and the results are shown in FIGURE 9.
FIGURE 9: AGE OF SCHOOL BUS DRIVERS INVOLVED IN COLLISIONS (SEPTEMBER 2001 TO JUNE 2006)
No information was available on the total number of drivers in each age category, and therefore this distribution gives no indication of whether a particular age range is over-represented. FIGURE 10 shows the distribution of drivers involved in school bus collisions by gender. The graphic on the left refers only to the gender of the school bus driver; the graphic on the right shows the gender of all drivers involved in school bus collisions. No information was available on the gender split of the total population of school bus drivers, so no conclusions can be drawn on any over-representations of school bus driver genders.

School Bus Collisions in Alberta
Aug 2008 File Ref: F-00044.00
13
FIGURE 10: DRIVERS INVOLVED IN SCHOOL BUS COLLISIONS BY
GENDER (SEPTEMBER 2001 TO JUNE 2006)
FIGURE 11 summarizes the school bus driver action for all collisions. Of all the school bus collisions recorded, 58 percent indicated the school bus driver was driving in a proper manner. This means that the school bus driver was found to be performing an “improper” action in 42 percent of the collisions involving school buses. In several of the collisions, the drivers of more than one vehicle were reported to be driving improperly to some extent. When bus drivers were found to be taking an improper action, “Followed too closely” and “Backed unsafely” were the most likely actions. Driver action may be one area in which improvements can be made through enhancements to hiring and training programmes. FIGURE 12 shows the percentage of school bus collisions in which unsafe speed was recorded as a factor.

School Bus Collisions in Alberta
Aug 2008 File Ref: F-00044.00
14
FIGURE 11: BUS DRIVER ACTION: ALL SCHOOL BUS COLLIONS
(SEPTEMBER 2001 TO JUNE 2006)
FIGURE 12: UNSAFE SPEED AS A CONTRIBUTING COLLISION CAUSE (SEPTEMBER 2001 TO JUNE 2006)

School Bus Collisions in Alberta
Aug 2008 File Ref: F-00044.00
15
Unsafe speed does not appear to be a major contributing factor in either school bus driver behaviour or all drivers involved in school bus collisions. The results of more detailed analysis of the instances when bus drivers were found to have taken an improper action are presented in TABLE 3.
TABLE 3 BUS DRIVER IMPROPER ACTION TRENDS
(SEPTEMBER 2001 TO JUNE 2006)
Trend Summary
Bus Driver Age Majority occurred in the bus driver age group between 37 to 46 years old
Temporal Distribution Largest number occurred in January and February Most occur on Wednesday (25%)
Primary Event Struck Object (35%) Sideswipe (8%)
Environmental Condition 80% clear 7% snowing 3% raining
Road Alignment 7% along vertical grade 21% along horizontal curve
Surface Condition 60% dry 30% slush/snow/ice 8% wet
Location Type 88% in urban areas
Driver condition was also analysed. In almost all collisions driver conditions were recorded as normal, with very few (four) reports of alcohol, medical defects, fatigue or drug use.

School Bus Collisions in Alberta
Aug 2008 File Ref: F-00044.00
16
Between September 2001 and June 2006, a total of 21 school bus crashes involved pedestrians. This represents 0.9 percent of the total number of school bus collisions. FIGURE 13 shows the pedestrian movement for school bus collisions involving pedestrians. Of note, walking on the road was attributed to 33 percent of collisions in which pedestrians were involved.
FIGURE 13: PEDESTRIAN ACTION FOR SCHOOL BUS RELATED COLLISIONS
(SEPTEMBER 2001 TO JUNE 2006)
2.6 Collision Locations
The locations of the collisions involving school buses were summarized, and the results are shown in TABLE 4. Not surprisingly, by far the highest number of school bus related collisions occurred in Edmonton and Calgary. A significantly higher proportion of school bus collisions in Edmonton were recorded as resulting in injury compared to Calgary; this is attributed to variations across jurisdictions in the reporting of injuries by the attending police officers. The traffic control devices at the locations of the school bus collisions were analyzed, and the results are shown in FIGURE 14. The majority of collisions occur at locations with no traffic control device. 20 percent of all school bus collisions (and 30 percent of school bus collisions resulting in injuries) occurred at traffic signal controlled intersections.

School Bus Collisions in Alberta
Aug 2008 File Ref: F-00044.00
17
TABLE 4: LOCATIONS WHERE COLLISIONS INVOLVING SCHOOL BUSES WERE MOST
FREQUENTLY RECORDED: “IN OR NEAR” MUNICIPALITIES (SEPTEMBER 2001 TO JUNE 2006)
Most Frequently Recorded Locations for…
Total School Bus Collisions
Injury School Bus Collisions
Fatal School Bus Collisions
Edmonton: 777 Edmonton: 137 Calgary: 3
Calgary: 695 Calgary: 54 Ponoka: 1
Red Deer: 68 Medicine Hat: 9 Cold Lake: 1
Sherwood Park: 64 Grande Prairie: 7 Blood Indian Reserve 1
Grande Prairie: 39 Sherwood Park: 7
FIGURE 14: TRAFFIC CONTROL DEVICES AT THE SCHOOL BUS COLLISION LOCATIONS
(SEPTEMBER 2001 TO JUNE 2006)

School Bus Collisions in Alberta
Aug 2008 File Ref: F-00044.00
18
2.7 Review of Fatal Collisions
The Opus team conducted a detailed review of the data available for the school bus collisions that resulted in fatalities between 2001 and June 2008. Summaries were prepared and submitted to Alberta Transportation. The summary for each fatal collision included the time, date, location, road and environmental conditions, human factors, and likely contributing factors.
2.8 Overall and Major Injury Additional Analysis Results
APPENDICES A and B provide additional charts that summarize the results of the data analysis for the Major Injury and Total school bus related collisions respectively. Of the 2,318 total number of school bus collisions that occurred between September 2001 and June 2006, 42 resulted in Major Injury (admittance to hospital). The trends related to the Major Injury collisions are presented in APPENDIX A.

School Bus Collisions in Alberta
Aug 2008 File Ref: F-00044.00
19
3. Recommendations
The recommendations presented in this section are based on the results of the data analysis, and research into the best practices related to school bus safety from other jurisdictions. The significant trends in the data analysis that would be addressed by specific recommendations are included in the discussion below as appropriate. Other recommendations are preventive and pro-active, and serve to reduce the likelihood of all school bus collisions or to reduce the severity of collisions once they occur. These recommendations were developed further to research of international best practices related to school bus safety. The Opus team researched best practices from jurisdictions including:
• Other Canadian provinces; • The United States; • Australia; • New Zealand; • Europe.
Additional recommendations presented below are intended to improve the strategic management of school bus safety, to better understand and manage the risks that lead to collisions, so that pre-emptive actions can be planned over the medium and long-term. The recommendations were categorized into the following areas:
• School Bus Improvements; • Bus Route Safety; • Driver Hiring and Training Issues; and, • School Bus Safety Performance Management.
Continuous and integrated action is needed in all four areas to achieve improvements in school bus safety performance, as illustrated in FIGURE 15. Each recommendation is described below, summarized in the table at the beginning of each section, with the corresponding suggested priority for implementation. The main safety benefits and any other appropriate comments are annotated in the relevant section. Prior to the adoption of any recommendations discussed below, thorough consultation with all the affected stakeholders will need to be undertaken.

School Bus Collisions in Alberta
Aug 2008 File Ref: F-00044.00
20
School Buses(the Vehicle)
Bus Routes(the Road)
Driver Hiringand Training
School Bus SafetyPerformanceManagement
SchoolBus Safety
FIGURE 15: SCHOOL BUS SAFETY FOCUS AREAS
3.1. Recommendations for School Bus Improvements
Reference Recommendation Priority
1A All school buses to be equipped with a flashing strobe light on the roof.
High
1B All school buses to be equipped with on-board passenger video recording equipment (short-term loop or incident-activated).
Medium
1C All school buses to be equipped with Global Positioning Systems (GPS).
Medium-High
1D All school buses to be equipped with Electronic Vehicle Recorders.
Medium-High
1E Upgrade alternately flashing lights to LEDs Medium
1F All school buses to be equipped with back-up monitor displays.
Medium

School Bus Collisions in Alberta
Aug 2008 File Ref: F-00044.00
21
Recommendation 1A: All school buses to be equipped with a flashing strobe light on the roof. With a roof-mounted strobe light, school buses are more visible in the following conditions:
o Fog; o Dark; and, o On vertical curves, especially on rural highways.
The fatal collision near Rimbey on Highway 53 (April 2008) occurred during heavy fog conditions. One other fatal collision (November 2003 on Highway 8) occurred in darkness during snow conditions. Recommendation 1B: All school buses to be equipped with on-board passenger video recording equipment (short-term loop or incident-activated). Recording equipment provides a record of on-board behaviour that may contribute to a collision. It may be used to identify behaviours that may cause a safety concern and address them by using targeted education and social marketing campaigns. To avoid any concerns about privacy, it is recommended that any recording equipment only capture key incidents (collisions or severe conflicts). This can be achieved with short-term looped recordings or incident-activated recording systems. Recommendation 1C: All school buses to be equipped with Global Positioning Systems (GPS). GPS provides a method to quickly locate bus position and therefore improve emergency response times. It significantly improves collision location data and subsequent analysis by providing more precise data.
School Bus Collisions in Alberta
Aug 2008 File Ref: F-00044.00
22
Recommendation 1D: All school buses to be equipped with Electronic Vehicle Recorders. Most new vehicles come equipped with electronic vehicle recorders (EVRs). The intent of this recommendation is to make this equipment mandatory on school buses, and to use EVRs routinely in the investigation of collisions involving school buses. EVRs provide a method to track vehicle movements and identify safety issues and trends, such as hard braking, speeding, and severe cornering. Recommendation 1E: Upgrade Alternately Flashing Lights to LEDs.
Light emitting diodes (LEDs) are significantly brighter and visible from longer
distances compared to standard light bulbs. By mandating the use of LEDs on the alternately flashing lights, the conspicuity and safety of the bus can be enhanced. It is noted that 21 injury collisions involving school buses occurred in darkness, within the analysis period used for this study.
Recommendation 1F: All School Buses to be Equipped with Back-Up Monitor Displays.
The analysis of school bus collision data indicated that collisions where the school bus
was backing-up were frequent. In the Primary Event analysis, 8 percent of collisions were classified as “Backing”. In the analysis of school driver action at the time of collision, 9 percent were “backing unsafely”. It is recommended that the backing-up manoeuvre be facilitated by the provision of back-up monitor display systems that the driver can use to avoid hazards behind the bus.
3.2. Recommendations for Bus Route Safety
Reference Recommendation Priority
2A
A documented road safety assessment of all bus routes should be conducted within 1 month of the start of every school year, using a simple, standardized checklist.
High

School Bus Collisions in Alberta
Aug 2008 File Ref: F-00044.00
23
Recommendation 2A: Conduct a documented road safety assessment of all bus routes within 1 month of the start of every school year, using a simple, standardized checklist. A documented and systematic road safety assessment will help to identify and address any road-related hazards. Such hazards can be related to road geometry (vertical, horizontal and cross-sectional), intersection operations, bus-stop locations, turn-around operations, and other road and traffic related issues. Implementing this recommendation will also help manage road-related risks by providing drivers the information they need to make safer route-related decisions, for example to recognize risks, and take action such as skipping a stop or stopping at an alternate location if conditions are too foggy at a designated location. A systematic and documented process will encourage good record-keeping and follow-up to address any identified issues. It is important that the process for this road safety assessment be kept simple and easy to understand and apply. Alberta Transportation could lead the preparation of assessment criteria and processes in consultation with school districts and carriers, and make these available to school districts and carriers to conduct the assessments and identify mitigation measures.
3.3. Recommendations for Driver Hiring & Training Issues
Reference Recommendation Priority 3A All school bus drivers to have the S-Endorsement High
3B Adopt standardized criteria for driver hiring based on the recommendations of the American School Bus Council (February 14, 2007) for driver hiring.
Medium
3C Review/enhance driver training related to: poor road surface/weather conditions; following distances.
Medium
Recommendation 3A: All school bus drivers to have the S-Endorsement Drivers with licence Class 1, 2 or 4 are now eligible to drive school buses. The S-Endorsement is achieved when a driver attends and passes an advanced driving course specifically dedicated to school bus safety and operations. It is recommended that current school bus drivers be provided with a period of one year to achieve the S-Endorsement. It is further recommended that the S-Endorsement be a requirement for all new drivers hired to drive school buses. It is noted that many Alberta bus companies may already have this requirement.

School Bus Collisions in Alberta
Aug 2008 File Ref: F-00044.00
24
As part of this recommendation, it is also recommended that Alberta Transportation explore options for requiring the renewal of the S-Endorsement on a regular basis (say every 3 or 5 years). This will ensure that drivers remain current, and drivers who obtained the S-Endorsement many years ago but did not practice as school bus drivers refresh their skills prior to driving school buses. Recommendation 3B: Adopt standardized criteria for driver hiring based on the recommendations of the American School Bus Council (ASBC) (February 14, 2007) for driver hiring. The ASBC has established a set of criteria that summarize the requirements for school bus driver hiring and training. It is recommended that these criteria be adopted as minimum standards in Alberta. These criteria ensure that school bus drivers achieve the highest possible level of safety and reliability, and that systemic checks are in place to help drivers achieve and maintain the best safety performance. It is noted that many Alberta bus companies may already have similar criteria. The American School Bus Council driver hiring practices and criteria are:
Development of specific written criteria for hiring and rejecting applicants.
Development and use of a written application document. A personal interview with each applicant. Pre-employment and ongoing driving record check. Pre-employment and ongoing drug and alcohol screening. Pre-employment and ongoing physical exams. Pre-employment and periodic criminal background checks. Pre-employment road performance testing and annual employee
evaluations. Annual (province)-approved training and testing programs. Periodic evaluation to ensure that drivers’ skills meet standards. Ongoing in-service training and testing to ensure appropriate driver
knowledge. Demonstrated ability to follow written instructions and record data
accurately.

School Bus Collisions in Alberta
Aug 2008 File Ref: F-00044.00
25
Recommendation 3C: Review/enhance driver training related to: poor road surface/weather conditions; following distances. The collision data analysis showed that 42 percent of school bus collisions occurred in slush / snow / ice conditions compared to an average of 30 percent for overall collisions in Alberta. A total of 40 percent of the injury-causing school bus collisions occurred in slush / snow / ice conditions. Collisions during adverse pavement surface conditions are often rear-enders, as braking distances are increased significantly when the pavement is not clear. A total of 28 percent of school bus collisions (and 40 percent of injury-causing school bus collisions) were rear-enders. It is recommended that a review be conducted of the current driver training for the Class 1, 2, and 4 licences and the S-Endorsement as related to driving safely on poor road surfaces (snow / ice / slush) and maintaining safe driving distances to reduce the risk of rear-end collisions. These two patterns (poor road surface conditions and rear–end collisions) emerged from the analysis of provincial school bus collision data. This recommendation will target these patterns through improved emphasis in training courses. In addition to the above recommendations it is suggested that the message of Operation Lifesaver (safety at intersections with at-grade rail crossing) be re-emphasized as part of continuous school bus driver training. The collision data did not indicate any pattern of school buses being involved in collisions at rail crossings. It is important to remain pro-active and minimize the likelihood of such collisions happening in the future.
3.4. Recommendations for School Bus Safety Performance Management
Reference Recommendation Priority
4A Implement an industry-managed one-stop Hot-Line and web site for reporting school bus safety concerns, including driver
Medium
4B Create and manage a registry of active school bus drivers, updated on an annual basis.
High
4C Implement an annual safety performance award recognition system for carriers and drivers.
Medium
4D Review increasing the fines or penalties for not stopping for a school bus.
Low

School Bus Collisions in Alberta
Aug 2008 File Ref: F-00044.00
26
Recommendation 4A: Implement an industry-managed one-stop Hot-Line and web site for reporting school bus safety concerns, including driver behaviour, bus route and bus condition concerns. It is recommended that the school bus carrier industry implement a centralized system for the public to report any concerns related to school bus safety. These could include concerns related to observed bus driver behaviour, observed bus route safety risks, observed bus stop safety locations, or the observed physical condition of the bus. Such a system will allow the public to share and contribute to improving school bus safety, while increasing public awareness of safety issues. Such a system will also allow the monitoring of trends. This recommendation requires the implementation of a uniform system to identify individual buses. The carrier industry will need to work with Alberta Transportation to identify and address the diverse issues associated with implementing this recommendation. Recommendation 4B: Create and manage a registry of active school bus drivers, updated on an annual basis. It is important that a registry of active school bus drivers be created and managed, with updates no less frequently than once a year. Alberta Transportation needs to have real-time access to this registry. The creation and maintenance of the registry needs to be a cooperative effort between the carriers and Alberta Transportation. There were many questions related to the profile of Alberta school bus drivers that could not be answered as part of this study. For example:
• How many currently active school bus drivers have earned the S-Endorsement?
• Among currently active school bus drivers, what is the distribution by licence class? (holders of Classes 1, 2 and 4 are eligible to drive school buses).
• What is the age distribution of currently active school bus drivers? • What is the gender distribution of currently active school bus drivers?

School Bus Collisions in Alberta
Aug 2008 File Ref: F-00044.00
27
• What is the average driving record (involvement in collisions, fines incurred
for driving offences) of active school bus drivers? • What is the distribution by years-of-driving-experience of Alberta’s current
school bus driver community? In order to properly manage the safety performance of school buses, it is important that Alberta Transportation has up-to-date access to the driver profile of the current school bus driver community. This will allow the monitoring, identification and analysis of safety-related trends, and the pro-active planning and implementation of required safety interventions. If the development of this registry is considered, the completion of a Privacy Impact Assessment would need to be one of the development steps. Recommendation 4C: Implement an annual safety performance award recognition system for carriers and drivers. While current incentive programs exist on a carrier-by-carrier basis, it is recommended that high-profile industry-wide safety performance awards be implemented, with the encouragement of Alberta Transportation in a partnership program. The intention will be to publicly “recognize excellence” and reward the carriers and the drivers who achieve the highest level of safety performance. This recommendation will increase the incentive for carriers and school bus drivers to pro-actively focus on safety, while increasing awareness. Participation on such a program and the awards received by carriers and drivers can be used by the carriers to promote their services, attract new employees, and when bidding on new contracts. Recommendation 4D: Increase public awareness of the fines and penalties for not obeying school alternately flashing lights and signs. There is no evidence in the data that was reviewed for this study to suggest that drivers who disobey the alternately flashing school bus lights have caused collisions. Nevertheless, from April 1, 2007 to March 31, 2008 there were 93 convictions (24 of which were out-of-province drivers) for failing to stop for a school bus or failing to proceed safely after stopping for a school bus. It is not known how many drivers have received more than one conviction.

School Bus Collisions in Alberta
Aug 2008 File Ref: F-00044.00
28
In Alberta, the fine for disobeying school bus alternately flashing lights is $400 and six demerit points. In Ontario the fine ranges from $400 to $2,000 and six demerit points for a first offence. For each subsequent offence, the fine increases to between $1,000 and $4,000, with six demerit points and up to six months in jail. It is recommended that greater public awareness of the current system of fines and penalties in Alberta be pursued. If violations continue to persist or increase, the fines might then be reviewed at a later date.

School Bus Collisions in Alberta
Aug 2008 File Ref: F-00044.00
1
APPENDIX A:
Major Injury School Bus Collisions
September 2001 to June 2006
Analysis Results
School Bus Collisions in Alberta
Aug 2008 File Ref: F-00044.00
2
THIS PAGE INTENTIONALLY LEFT BLANK.

School Bus Collisions in Alberta
Aug 2008 File Ref: F-00044.00
1
APPENDIX B:
All School Bus Collisions
September 2001 to June 2006
Additional Analysis Results

School Bus Collisions in Alberta
Aug 2008 File Ref: F-00044.00
2
THIS PAGE INTENTIONALLY LEFT BLANK.

1
Annual Trend
2001 Data: September to December
2006 Data: January to June

2
Monthly Trend

3
Day of Week Trend

4
Time of Day TrendMajor Injury Collisions
2% 2%
14%
26%
5% 5%
2% 2%
10%
12%
7%
5%
2% 2%2%
0%
5%
10%
15%
20%
25%
30%
0000
‐010
0
0100
‐020
0
0200
‐030
0
0300
‐040
0
0400
‐050
0
0500
‐060
0
0600
‐070
0
0700
‐080
0
0800
‐090
0
0900
‐100
0
1000
‐110
0
1100
‐120
0
1200
‐130
0
1300
‐140
0
1400
‐150
0
1500
‐160
0
1600
‐170
0
1700
‐180
0
1800
‐190
0
1900
‐200
0
2000
‐210
0
2100
‐220
0
2200
‐230
0
2300
‐240
0
Time of Day
% of C
ollisions

5
Primary Event
Major Injury Collisions
17%
7%
2% 2% 2% 2%
33%33%
0%
5%
10%
15%
20%
25%
30%
35%
Right A
ngle
Rear End
Struck Object
Left Turn
Across Path
Side
swipe
Off Road Righ
t
Backing
Other
Primary Event
% of C
ollisions

6
Surface Condition
Major Injury Collisions: 2001 to 2006
Dry, 26, 62%
Slush/Snow/Ice, 12, 29%
Wet, 2, 5%Other, 1, 2%
Loose Surface Material, 1, 2%

7
Lighting Condition
Major Injury Collisions
Light Condition (Natural Light)
Daylight , 37, 92%
Darkness, 3, 8%
Light Condition (Artificial Light)
Artificial Light , 2, 8%
No Artificial Light, 22, 92%

8
Road Alignment
Major Injury Collisions
Road Alignment (Vertical)
Level , 26, 81%
Grade , 4, 13%Sag, 2, 6%
Road Alignment (Horizontal)
Straight, 30, 88%
Curve, 4, 12%

9
Driver Age

10
Driver Gender
School Bus Driver
Female , 20, 49%
Male , 21, 51%
All Drivers Involved
Female , 38, 47%
Male , 43, 53%
Drivers Involved in Major Injury Collisions
11
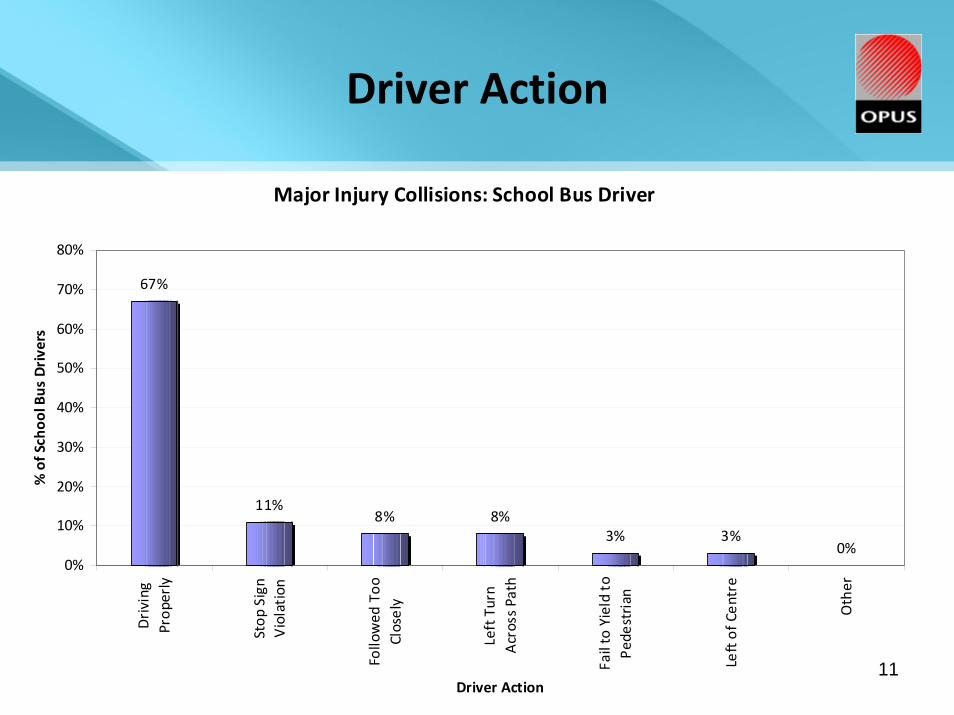
Driver Action
Major Injury Collisions: School Bus Driver
67%
11%8% 8%
3% 3%0%
0%
10%
20%
30%
40%
50%
60%
70%
80%
Driving
Prop
erly
Stop
Sign
Violation
Followed
Too
Closely
Left Turn
Across Path
Fail to Yield to
Pede
strian
Left of C
entre
Other
Driver Action
% of Schoo
l Bus
Drivers

12
Driver Condition
Major Injury Collisions: School Bus Driver

13
Traffic Control Device

14
Point of Impact

15
Major Injury Location Type
Highway / Outside Municipality, 19,
45%Within Municipality,
23, 55%

16
Bus Driver Contribution
Major Injury Collisions
Major, 10, 25%
Partial , 7, 18%None, 23, 57%

17
School Bus Activity
Major Injury Collisions
Unknown, 31, 73%
Unknown, 7, 17%
Stopped / Parked, 4,
10%

18
Primary Contributing Factor
Major Injury Collisions
Other Driver Error, 18, 42%
Bus Driver Error, 10, 24%
Unknown, 7, 17%
Road Environment, 7, 17%

1
Review of School Bus Collisions in Alberta
Data Analysis
2001/02 to 2005/06
2
School Bus Collisions as Proportion of Total2001 to 2006

3
Annual Trend

4
Annual Trend
2001 Data: September to December
2006 Data: January to June

5
Annual Trend
2001 Data: September to December
2006 Data: January to June

6
Annual Trend
2001 Data: September to December
2006 Data: January to June

7
Annual Trend
2001 Data: September to December 2006 Data: January to June

8
Annual Trend
2001 Data: September to December 2006 Data: January to June

9
Annual Trend
2001 Data: September to December 2006 Data: January to June

10
Annual Trend
2001 Data: September to December 2006 Data: January to June

11
Monthly Trend

12
Monthly Trend

13
Monthly Trend
14
Day of Week Trend

15
Day of Week Trend

16
Day of Week Trend

17
Time of Day Trend
18
Time of Day Trend

19
Time of Day Trend
20
Primary Event

21
Primary Event

22
Primary Event

23
Surface Condition

24
Surface Condition

25
Surface Condition

26
Lighting Condition
Total School Bus Collision

27
Lighting Condition
Injury School Bus Collision

28
Lighting Condition
Fatal School Bus Collision

29
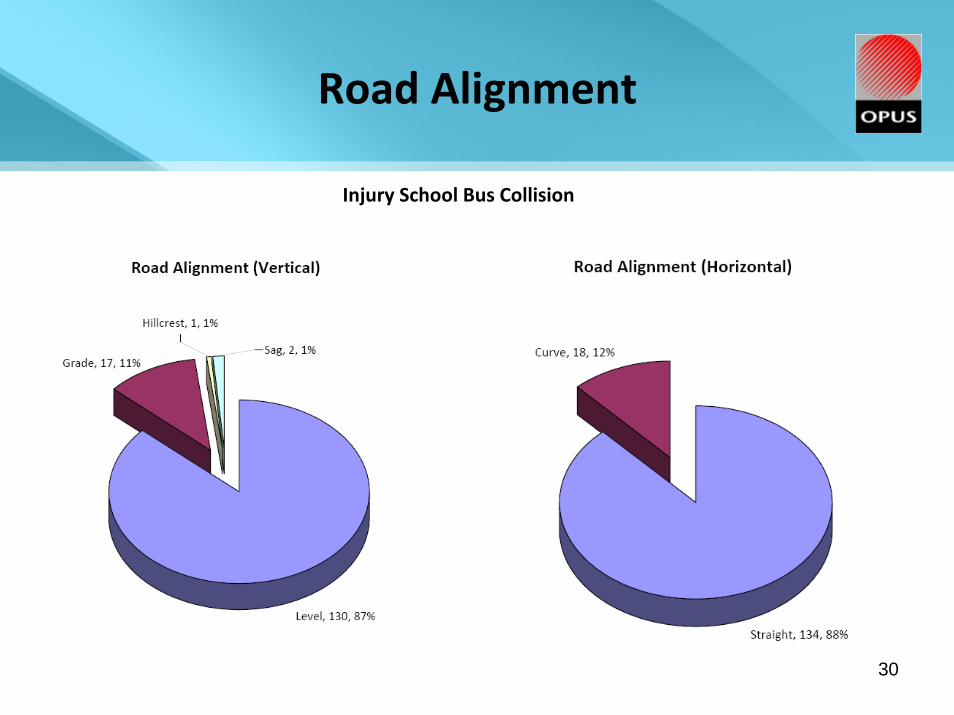
Road Alignment
Total School Bus Collision
30
Road Alignment
Injury School Bus Collision
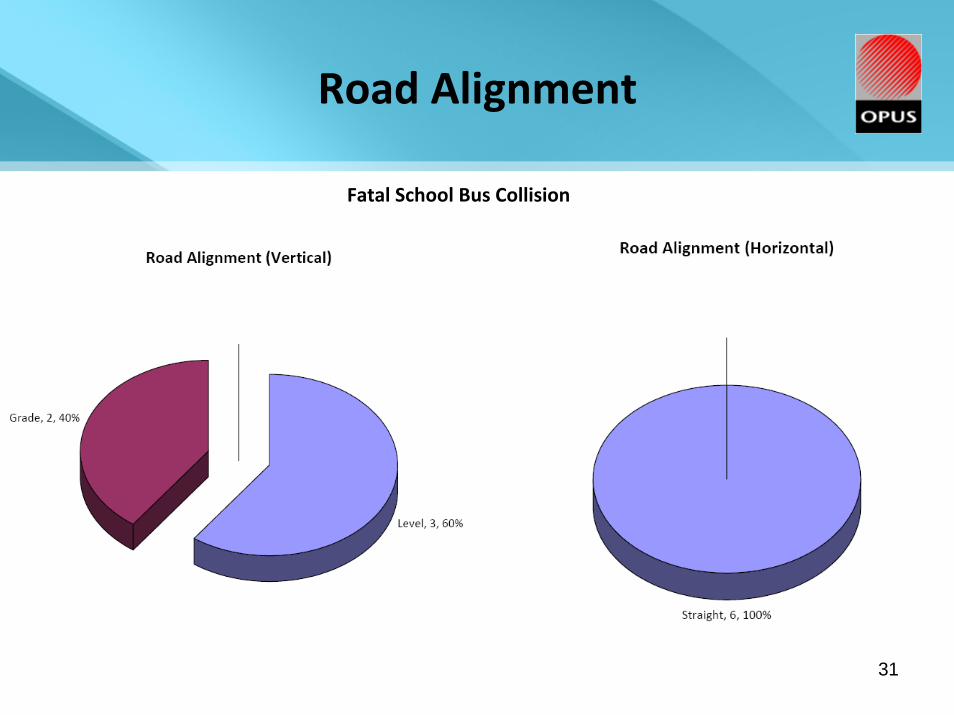
31
Road Alignment
Fatal School Bus Collision

32
Province of Issued Licence
All Drivers Involved in School Bus Collisions from 2001 to 2006

33
Valid Driver Licence
All drivers involved in fatal collisions had a valid driver licence.
All Drivers Involved in School Bus Collisions from 2001 to 2006
34
Driver Age

35
Driver Age

36
Driver Age

37
Driver Gender
All School Bus Collisions from 2001 to 2006

38
Driver Action

39
Driver Action

40
Driver Action

41
Driver Action

42
Driver Action

43
Driver Action

44
Pedestrian Action
Actions of Pedestrians: All Collisions

45
Driver Condition

46
Driver Condition

47
Driver Condition

48
Driver Condition

49
Driver Condition

50
Driver Condition

51
Unsafe Speed
School Bus Collisions from 2001/02 to 2005/06

52
Traffic Control Device

53
Traffic Control Device
54
Traffic Control Device

55
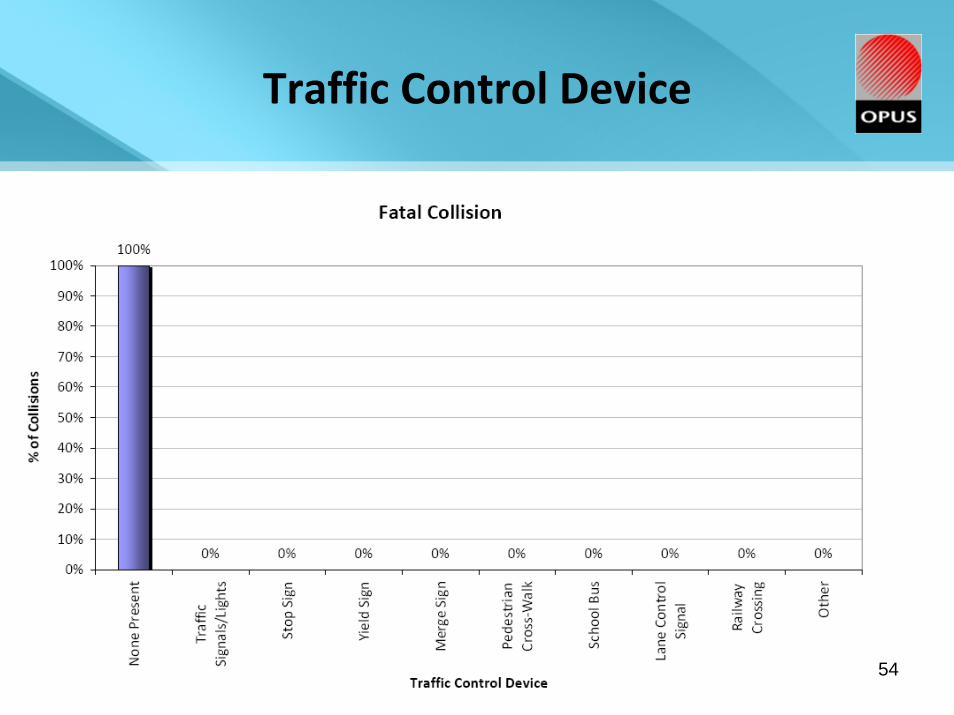
Contributing Road Conditions
No unusual conditions were present during any of the fatal collisions

56
Point of Impact

57
Point of Impact

58
Point of Impact

59
Overall Collision Rate Comparison

60
Injury Collision Rate Comparison

61
Fatal Collision Rate Comparison

62
Overall Collision Rate Comparison

63
Overall Collision Rate Comparison
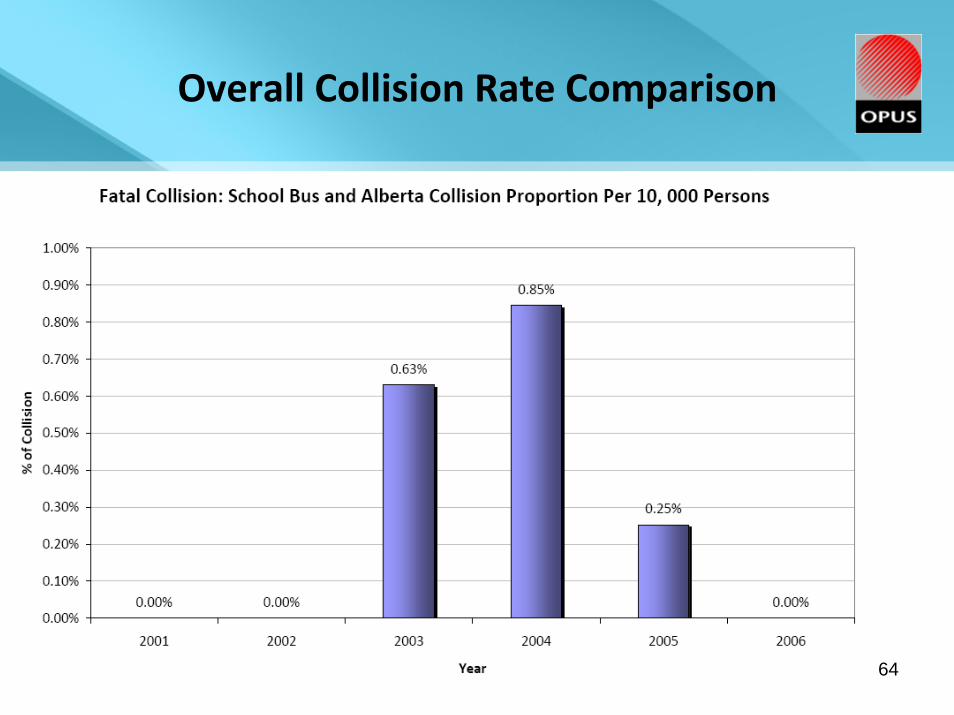
64
Overall Collision Rate Comparison

65
Injury Collision Rate Comparison
Assuming 400,000 km per day and 200 days per year for school bus

66
Fatal Collision Rate Comparison
Assuming 400,000 km per day and 200 days per year for school bus

67
Overall Collision Rate Comparison

68
Overall Collision Rate Comparison

69
Fatality Location Type

70
Injury Location Type

71
Collision Location
Total School Bus Collisions In or Near Municipalities
Municipality Number of Injury Collisions
Edmonton 777
Calgary 695
Red Deer 68
Sherwood Park 64
Grande Prairie 39
Medicine Hat 33
St. Albert 30
Fort McMurray 27
Spruce Grove 25
Stony Plain 25

72
Collision Location
Fatal School Bus Collisions In or Near Municipalities
Municipality Number of Fatal Collisions
Calgary 3
Blood Indian Reserve #148 1
Cold Lake 1
Ponoka 1
5Stony Plain
5St. Alberta
5Spruce Grove
5Red Deer
6Lethbridge
7Sherwood Park
7Grande Prairie
9Medicine Hat
54*Calgary
137*Edmonton
Number of Injury CollisionsMunicipality
Injury School Bus Collisions In or Near Municipalities
* The definition of an injury collision used in police reporting is not consistent between Calgary and Edmonton.