review of post-election audits of voting equipmentjlarc.virginia.gov/pdfs/reports/rpt400.pdfreview...
TRANSCRIPT

Review of
Post-election Audits of Voting Equipment
Report of the Joint Legislative Audit and Review Commission To the Governor and The General Assembly of Virginia
SENATE DOCUMENT NO. 9 2010
Members of the Joint Legislative Audit and Review Commission
Chair Senator Charles J. Colgan Vice-Chair Delegate John M. O'Bannon III Delegate David B. Albo Delegate M. Kirkland Cox Delegate H. Morgan Griffith Senator R. Edward Houck Senator Janet D. Howell Delegate Johnny S. Joannou Delegate Harvey B. Morgan Senator Thomas K. Norment, Jr. Delegate Robert D. Orrock, Sr. Delegate Clarence E. Phillips Delegate Lacey E. Putney Senator Walter A. Stosch Walter J. Kucharski, Auditor of Public Accounts Director Philip A. Leone
Senate Joint Resolution 328 (2009) directed JLARC staff to study post-election audits of voting equipment. A post-election audit is typically conducted to test the accuracy of voting equipment. The test con-sists of comparing the tally of election results produced by the voting equipment on election day to a subse-quent tally conducted dur-ing an audit. Various sta-tistical strategies are used to draw samples to include in the audit, and various counting methods can be used to conduct the audit.
JLARC staff worked with the State Board of Elec-tions and four localities to conduct a pilot post-election audit project. The pilot pro-ject found a 0.21 percent difference between election day and audit results. This difference would change the outcome only in the closest of elections.
Post-election audits can provide benefits, such as increasing election trans-parency and providing in-sight into voting equipment security, accuracy, and re-liability. A locality would spend, on average, about five hours on the audit process. There are several key implementation con-siderations, including the diversity of voting equip-ment used in Virginia, which would be relevant when deciding whether to require an ongoing, large-scale post-election audit program.
In Brief
This report is available on the JLARC website at http://jlarc.virginia.gov
Copyright 2010, Commonwealth of Virginia.
JLARC Staff for This Report Bob Rotz, Division Chief Justin Brown, Project Leader Stefanie Papps Greg Rest

July 19, 2010 The Honorable Charles J. Colgan Chairman Joint Legislative Audit and Review Commission General Assembly Building Richmond, VA 23219 Dear Senator Colgan:
Senate Joint Resolution 328 from the 2009 General Assembly directed us to study post-election audits of voting equipment. Items specifically noted in the resolution for us to address included estimating the time and cost of conducting post-election audits, as well as incorporating the results of pilot post-election audits conducted in Virginia. Findings of the study were presented to the Commission on June 14, 2010.
On behalf of the Commission staff, I would like to thank the State Board of Elections staff for their assistance during this study. I would also like to thank the general registrars, electoral boards, and clerks of the circuit court in the City of Charlottesville, and Page, Chesterfield, and Fairfax counties. Finally, I would like to thank those from voters’ rights organizations and academia who helped our staff during the study.
Sincerely, Philip A. Leone
Director PAL/jcb

TTaabbllee ooff CCoonntteennttss
JLARC Report Summary i
1 Electoral Environment and Background 1
Key Legislative Initiatives Preceding JLARC Study 1
National Voting Equipment and Post-Election Audit Landscape
2
Virginia’s Electoral Process and Voting Equipment Landscape
3
2 Voting Equipment 9
DREs and Optical Scan Machines Used in Virginia Have Been Certified and Tested
9
Concerns Regarding Voting Equipment Security, Accuracy, and Reliability Vary
12
3 Post-Election Audits in Other States 17
Twenty-Seven States Do Not Require Post-Election Audits, While 23 States Do
17
Other States Audit for Various Purposes and Use Several Audit Strategies and Methods
19
Most Audits in Other States Do Not Find Substantial Discrepancies
21
4 Virginia’s Post-Election Audit Pilot Project 23
Pilot Post-Election Audit Methodology and Planning 23 Pilot Post-Election Audit Time Requirements and Results 24
Lessons Learned From Virginia’s Post-Election Audit Pilot Project
30
5 Time, Expenditures, and Statistical Considerations 35
Hypothetical Audit Approach and Assumptions 35
Sample Size, Statistical Considerations, Time, and Expenditures If Virginia Implemented a Fixed-Percentage Audit Strategy
38
Sample Size, Statistical Considerations, Time, and Expenditures If Virginia Implemented an Adjustable- Percentage Audit Strategy
42
6 Potential Role of Post-Election Audits in Virginia 47
Benefits and Costs of Requiring Post-Election Audits 47
Key Implementation Considerations of Requiring Post-Election Audits
50

Appendixes
A: Study Mandate 55
B: Research Activities and Methods 57
C: Detailed Information on Pilot Post-Election Audits 65
D: Post-Election Audits in Other States 83
E: Potential Changes to the Code of Virginia If Audits Are Required
85
F: Agency Response 87
JLARC Report Summary i
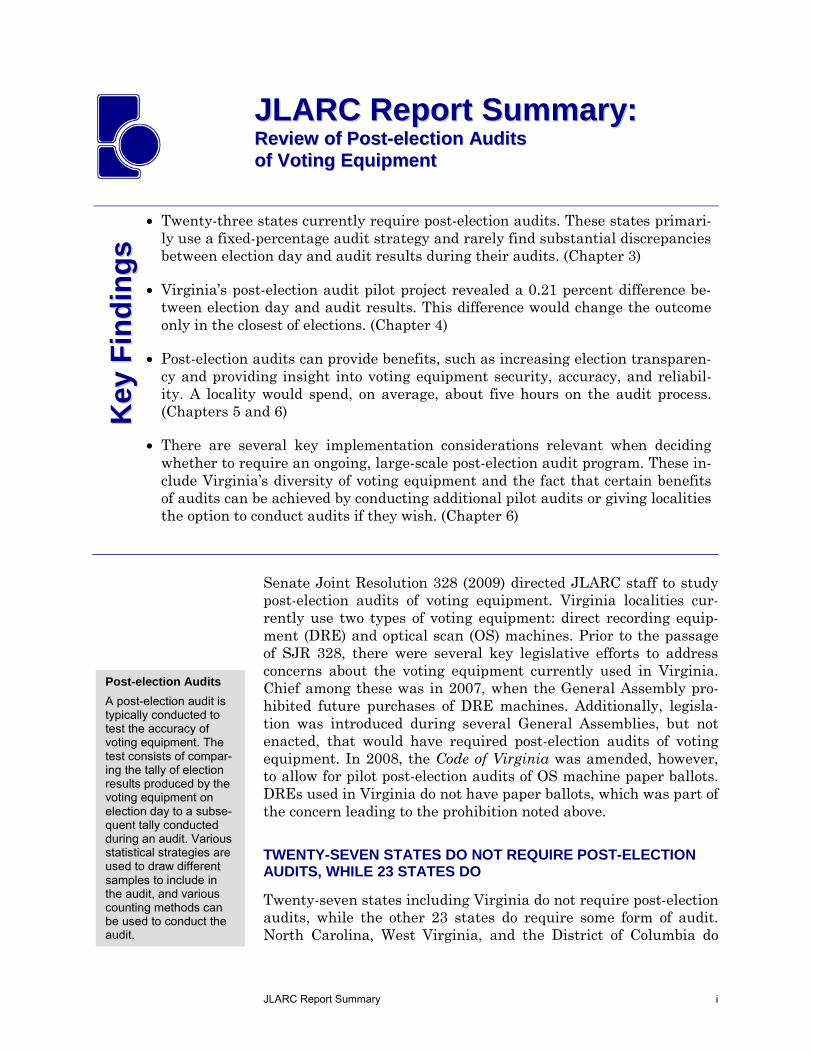
Senate Joint Resolution 328 (2009) directed JLARC staff to study post-election audits of voting equipment. Virginia localities cur-rently use two types of voting equipment: direct recording equip-ment (DRE) and optical scan (OS) machines. Prior to the passage of SJR 328, there were several key legislative efforts to address concerns about the voting equipment currently used in Virginia. Chief among these was in 2007, when the General Assembly pro-hibited future purchases of DRE machines. Additionally, legisla-tion was introduced during several General Assemblies, but not enacted, that would have required post-election audits of voting equipment. In 2008, the Code of Virginia was amended, however, to allow for pilot post-election audits of OS machine paper ballots. DREs used in Virginia do not have paper ballots, which was part of the concern leading to the prohibition noted above.
TWENTY-SEVEN STATES DO NOT REQUIRE POST-ELECTION AUDITS, WHILE 23 STATES DO
Twenty-seven states including Virginia do not require post-election audits, while the other 23 states do require some form of audit. North Carolina, West Virginia, and the District of Columbia do
JJLLAARRCC RReeppoorrtt SSuummmmaarryy:: RReevviieeww ooff PPoosstt--eelleeccttiioonn AAuuddiittss ooff VVoottiinngg EEqquuiippmmeenntt
Twenty-three states currently require post-election audits. These states primari-ly use a fixed-percentage audit strategy and rarely find substantial discrepanciesbetween election day and audit results during their audits. (Chapter 3)
Virginia’s post-election audit pilot project revealed a 0.21 percent difference be-tween election day and audit results. This difference would change the outcomeonly in the closest of elections. (Chapter 4)
Post-election audits can provide benefits, such as increasing election transparen-cy and providing insight into voting equipment security, accuracy, and reliabil-ity. A locality would spend, on average, about five hours on the audit process.(Chapters 5 and 6)
There are several key implementation considerations relevant when decidingwhether to require an ongoing, large-scale post-election audit program. These in-clude Virginia’s diversity of voting equipment and the fact that certain benefitsof audits can be achieved by conducting additional pilot audits or giving localitiesthe option to conduct audits if they wish. (Chapter 6)
KKee y
y FF
ii nndd
ii nngg
ss
Post-election Audits
A post-election audit is typically conducted to test the accuracy of voting equipment. The test consists of compar-ing the tally of election results produced by the voting equipment on election day to a subse-quent tally conducted during an audit. Various statistical strategies are used to draw different samples to include in the audit, and various counting methods can be used to conduct the audit.

JLARC Report Summary ii
conduct audits while Maryland does not. States that do require post-election audits conduct them to achieve various purposes, in-cluding to enhance election transparency and increase voter confi-dence. Most states report their audits are an effective use of re-sources.
Most states that conduct audits use a fixed-percentage (FP) strate-gy, which consists of auditing a consistent sample size after each election. Most states use either a hand-to-eye count (HTEC) or a combination of that method and a machine-assisted (MA) method. The vast majority of post-election audits conducted by other states do not find discrepancies that change the outcome of the election. When discrepancies are found, they tend to be relatively small and attributable to factors such as a voter incorrectly completing a bal-lot. Still, proponents of post-election audits advocate that audits are an important way to check the security, reliability, and accura-cy of voting equipment used in elections.
VIRGINIA’S PILOT PROJECT YIELDED SEVERAL LESSONS
JLARC staff worked with the State Board of Elections, the Virgin-ia Electoral Board Association, and the Voter Registrars’ Associa-tion of Virginia to conduct a pilot post-election audit project. The City of Charlottesville and Page, Chesterfield, and Fairfax Coun-ties volunteered to participate in the pilot project. The audits were conducted in February and March 2010, using variations of the HTEC or MA audit method (see photographs below).
The audits resulted in several lessons learned about voting equip-ment and post-election audits. Perhaps the most important lesson learned was that the difference between the election day totals and
Examples of HTEC and MA Audit Methods Used in Chesterfield and Fairfax Counties
Source: JLARC staff photos taken at the Chesterfield County and Fairfax County post-election audits on March 10 and 15, 2010.
Ballots Sorted on Tables Using Hand-to-eye Count Method in Chesterfield County
Ballots Tabulated Using Machine-assisted Counting Method in Fairfax County

JLARC Report Summary iii
audit totals was, collectively, 0.21 percent (see table). This sug-gests that only in the closest of elections would the difference have affected the election outcome. It should be noted that Virginia law allows defeated candidates to appeal for a recount when the ap-parent margin of victory is at or below one percent.
Pilot Project: Differences Between Election Day and Audit Totals
Locality Optical Scan
Machine Audited % Difference Between Election
Day and Audit Totals Page County Optech IIIPE 0.33% City of Charlottesville eScan 0.00 Chesterfield County M-100 0.00 Fairfax County Accuvote 0.30 Project Total 0.21%
Source: JLARC staff analysis of results of Virginia post-election audit pilot project.
Other lessons learned were that the OS machines audited could read many, though not all, ballots that were not properly complet-ed by voters. Overall, the machines were fairly adept at tabulating these votes, but there were a few instances in which a human could read the vote on an incorrectly completed ballot but the ma-chine could not. SBE and localities may want to further assess the technical and logistical feasibility of reducing the instances in which such ballots are not tabulated.
BENEFITS AND COSTS OF POST-ELECTION AUDITS SHOULD BE ASSESSED IN CONTEXT OF KEY IMPLEMENTATION CONSIDERATIONS
The potential benefits of post-election audits will vary depending on whether the FP or the adjustable-percentage (AP) statistical strategy is used (see figure, next page). The AP strategy, which utilizes larger sample sizes as the margin of victory narrows, would better accomplish validating the election outcome when compared to the FP strategy while the FP strategy would be supe-rior in enhancing election transparency. checking the security, ac-curacy, and reliability of voting equipment, and identifying lessons learned.
The costs of the audits would also depend on the statistical strate-gy and audit methods used. For example, an FP audit of one-percent of precincts in Virginia would take a locality, on average, about 5.5 hours to complete. In total, localities could spend about $145,000 to conduct a one-percent FP audit. The vast majority of these expenditures would be fees paid to voting equipment vendors to prepare the voting machines for audit. Requiring the AP strate-gy would in most cases cost less and involve fewer localities.
SBE and localities may want to further assess the technical and logistical feasi-bility of reducing the instances in which incorrectly completed ballots are not tabu-lated.

JLARC Report Summary iv
Potential Benefits and Costs if Virginia Were to Require Post-election Audits
Audit Strategy
Potential Benefits Potential Costs
(1) Election Transparency
(2) Security, Accuracy, Reliability
(3) Lessons Learned
(4) Validate Election Outcome
Time $
1% Fixed - Percentage 4 4 4 2
5.5 hours /
locality
$145,267
Adjustable - Percentagea 2 2 2 4
Range of 4.8 hours / localityb to same as full
recount
Range of $15,822b to same as full
recount
Legend for Scale of Potential Benefit 4 High 2 Medium 0 Low
a Assumes a margin of victory that is the average of a sample of races in Virginia since 2001, which is 13.7 percent. b Would involve 11 localities with the margin of victory noted above. Source: JLARC staff analysis.
However, in close elections the AP strategy’s time and expendi-tures would be close to that of a full recount.
Finally, the above benefits and costs need to be assessed in the context of several important implementation considerations that are specific to Virginia. Among these is the prevalence of DREs used by localities, which do not have a paper trail, and therefore can only be audited by analyzing the machine’s memory cards. Some computer scientists indicate that analyzing these memory cards has limited usefulness because the process, unlike an audit using a paper ballot, is not an independent check. Another consid-eration is that some of the benefits of post-election audits can like-ly be achieved in ways other than requiring an ongoing, large-scale audit program. These other ways could include continuing to con-duct pilot audits under the existing statute, or amending the Code of Virginia to give localities permission to conduct them if they wish.

Chapter 1: Electoral Environment and Background 1
Senate Joint Resolution 328 from the 2009 General Assembly di-rects the Joint Legislative Audit and Review Commission (JLARC) staff to study post-election audits of voting equipment (Appendix A). The resolution identifies six items to be addressed during the study, which primarily involve collecting information about the time, cost, and outcomes of various post-election audit strategies and methods. Currently, Virginia does not require post-election audits of voting equipment.
KEY LEGISLATIVE INITIATIVES PRECEDING JLARC STUDY
The study resolution was preceded by several relevant legislative initiatives. In particular, the 2004 General Assembly passed House Joint Resolution 174, which established a joint subcommittee to study the certification process for voting equipment and the per-formance and proper deployment of voting equipment. The joint subcommittee met several times from mid-2005 to early 2006 and concluded with a final report. The final report addresses two key factors relevant to this JLARC study.
The first factor discussed in the report of the joint subcommittee was the variety of—and somewhat conflicting—perspectives on the reliability and usability of the electronic voting equipment being used by Virginia localities. For example,
A professor from the Carnegie Mellon University School of Computer Science noted that direct recording equipment (DRE) voting machines have been used for years without a
Ch
ap
ter
11
EElleeccttoorraall EEnnvviirroonnmmeenntt aanndd BBaacckkggrroouunndd
Virginia’s localities currently use either direct recording equipment (DRE) or opticalscan machines to tabulate votes during elections. The majority of localities use a mixof both types of machines. As a way to check whether these machines tabulate votesproperly during an election, some other states conduct post-election audits. Virginia,however, currently does not require or conduct these audits. Concern about bothtypes of voting equipment led to several legislative initiatives that relate to votingequipment and post-election audits. In 2007, the General Assembly amended theCode of Virginia to prohibit localities from purchasing any new DREs. Additionally,legislation was introduced on several occasions that would have required post-election audits of voting equipment. This legislation was not enacted; however, in2008 the Code was amended to allow for pilot post-election audits. II nn
SSuu
mmmm
aa rr yy
Post-election Audits
A post-election audit is typically conducted to test the accuracy of voting equipment. The test consists of compar-ing the tally of election results produced by the voting equipment on election day to a subse-quent tally conducted during an audit. Various statistical strategies are used to draw different samples to include in the audit, and there are various counting meth-ods that can be used to conduct the audit.
Chapter 1: Electoral Environment and Background 2
verified incident of tampering. He did acknowledge, however, the public perception that DREs are subject to tampering, in part because of several well-publicized studies pointing to po-tential security problems.
Other experts pointed to vulnerabilities with DRE systems, especially that DREs are potentially vulnerable to hacking or inadvertent programming error.
Several local election officials, speaking on behalf of both election staff and voters in their jurisdiction, expressed satis-faction with the DREs being used in their locality.
Virginia Verified Voting, the Virginia chapter of a national organization concerned with voters’ rights, and other indi-viduals questioned the security of DREs and other electronic voting equipment—citing the need for some type of audit or paper trail.
The second factor discussed in the final joint subcommittee report was recommended legislation requiring post-election audits of vot-ing equipment. The language of the recommended legislation di-rected each electoral board to randomly select at least five percent of precincts for a post-election audit. The audited precincts were to include all years and models of DREs and optical scan (OS) ma-chines. House Bill 1243 that included this language was intro-duced during the 2006 General Assembly to implement the audit requirement. The bill was continued to 2007 in a voice vote by the Appropriations Committee, but was then left in committee during the 2007 General Assembly.
Though the legislation requiring post-election audits did not pass, there have since been two subsequent changes to the Code of Vir-ginia that will be discussed throughout this report:
In 2007, §24.2-626 of the Code of Virginia was amended such that after July 1, 2007, “no county or city shall acquire any direct recording electronic machine for use in elections … DREs acquired prior to July 1, 2007 may be used in elections … for the remainder of their useful life.”
In 2008, §24.2-671.1 of the Code was added to “provide for pi-lot programs in one or more localities … to conduct a post-election audit of one or more optical scan tabulators.”
NATIONAL VOTING EQUIPMENT AND POST-ELECTION AUDIT LANDSCAPE
A seminal event in the debate around voting equipment and the need for audits was the recount of ballots and subsequent Supreme Court decision in the 2000 U.S. presidential election. As a result of
Voting Equipment
There are two primary types of electronic vot-ing equipment. The first type is direct recording equipment (DRE), which typically uses “touch screens” that display an electronic ballot and require users to select their choices by touch-ing the screen. The se-cond type are optical scan (OS) machines, which are scanners that read paper optical scan ballots completed by voters. These paper ballots are often differ-ent from paper ballots that are hand counted, and not for use in opti-cal scan machines.

Chapter 1: Electoral Environment and Background 3
the controversy surrounding the voting equipment used—particularly in Florida—the Help America Vote Act (HAVA) was passed in 2002. The act was intended to accomplish a variety of ob-jectives, including distribution of funding to states so they could replace older punch card voting systems with newer DREs and OS machines.
Virginia’s HAVA implementation plan and report indicates that the State Board of Elections (SBE) allocated more than $24 million in federal HAVA funds to all 134 localities in Virginia. The plan indicates the funding was used to replace outdated voting equip-ment with HAVA compliant voting equipment. Localities had the flexibility to purchase various types of voting equipment from dif-ferent vendors, as long as the equipment was certified by SBE. Us-ing HAVA funds, all 134 localities purchased at least one DRE or other type of equipment accessible for disabled voters; some locali-ties also purchased OS machines. This influx of federal funding, along with local flexibility to purchase different machines, contrib-uted to a diversity of voting equipment across the State.
Amid this nationwide, federally funded effort to replace voting equipment, there has been ongoing discussion and debate about the reliability of voting equipment and the potential need to con-duct audits. A 2004 report by the U.S. Government Accountability Office noted that “as older voting equipment has been replaced with newer electronic voting systems … the debate has shifted from hanging chads and butterfly ballots to vulnerabilities associ-ated with DREs.” The GAO report cites several examples of prob-lems with DREs used in North Carolina, Florida, and California. More recently, HR 2894 introduced in June 2009 would amend HAVA to mandate, among other things, that all voting equipment is required to use a paper ballot, and that these ballots would be counted by hand in any subsequent recount or audit of election re-sults. As of May 2010, there were 97 co-sponsors of the bill, which was referred to the Subcommittee on Technology and Innovation.
Though there is no current federal requirement, almost half of the states conduct some form of post-election audit. Most of these states audit a fixed-percentage sample of ballots (typically from one to five percent) and conduct a manual, hand-to-eye count of the ballots.
VIRGINIA’S ELECTORAL PROCESS AND VOTING EQUIPMENT LANDSCAPE
Virginia’s electoral process is governed by Title 24.2 of the Code of Virginia. The three-member SBE directs its staff regarding the agency’s mission of promoting proper administration of Virginia’s election laws. The SBE promulgates rules, regulations, and guid-
The debate has shift-ed from hanging chads and butterfly ballots to vulnerabili-ties associated with DREs.
Chapter 1: Electoral Environment and Background 4
ance governing the election process. SBE also offers assistance to localities, upon request. At the local level, each locality has a three-member electoral board which sets local election policy, in accordance with the State election policy as articulated in statute and regulations. Each local electoral board employs a general reg-istrar who, depending on locality size, directs a staff to carry out the election according to policy set by the General Assembly, SBE, and local electoral board.
Virginia’s Electoral Process
Through the Code of Virginia, the General Assembly has provided SBE and local electoral boards with specific direction about how elections should be conducted in the Commonwealth. The Code specifies what localities and SBE should do prior to election day to prepare to hold the election, on election day, and then after the polls close. A timeline of some of the key aspects of Virginia’s elec-toral process is presented in Figure 1.
Prior to election day, a variety of activities must take place, includ-ing gaining SBE approval for and printing ballots, appointing vot-ing equipment custodians, training officers of election, conducting logic and accuracy testing on each piece of equipment to be used in the election, and delivering ballots (if necessary) and voting equipment to each precinct. The Code provides extensive guidance about how election day should unfold at polling places across the Commonwealth, including requiring officers of election to report to polling places by 5:15 a.m. on election day, and to examine the equipment to ensure that it does not appear to have been tam-pered with and the counters register “zero.”
The polls must open at 6:00 a.m., and they must be declared closed at 7:00 p.m. Once the polls close, officers of election obtain results from the voting equipment, record the results on statements of re-sults, and announce the results to anyone waiting for results out-side the polling place. The election materials are delivered to the clerk of the circuit court where the election took place by noon on the day following the election.
By 5:00 p.m. the day following the election, the local electoral board should meet to conduct its canvass of the results and certify the results. Next, the SBE meets to conduct its canvass, and it de-termines the total number of votes for any election crossing more than one local jurisdiction (for example, members of the General Assembly or U.S. Congress). Once SBE determines the results of the election, it completes a statement of results and issues certifi-cates of election to the winners.

Chapter 1: Electoral Environment and Background 5
Figure 1: Timeline of Virginia’s Electoral Process
Source: Code of Virginia Title 24.2, Virginia State Board of Elections (SBE), and JLARC staff analysis.
Aft
er t
he
Po
lls
Clo
seE
lect
ion
Da
yP
rio
r to
Ele
cti
on
Day
Test for logic and accuracy, seal, and deliver voting equipment to precincts
Train officers of election
Appoint voting equipment custodians30 Days Before Election Day
Print, deliver, check, and seal ballots
Test for logic and accuracy, seal, and deliver voting equipment to precincts
Train officers of election
Appoint voting equipment custodians30 Days Before Election Day
Print, deliver, check, and seal ballots
Polls close. Officers of election obtain results from the voting equipment, complete a statement of results, seal and lock voting equipment, and announce unofficial results
7:00 p.m.
Officers of election announce polls will close at 7:00 p.m.6:45 p.m.
Polls open, voting commences6:00 a.m.
Officers of election take the oath of office, set up the polling place, and ensure that all voting equipment counters register “zero”
Officers of election arrive at polling places5:15 a.m.
For any office spanning more than one locality, SBE conducts a canvass to certify the results
If the margin of victory is less than or equal to 1%, the unsuccessful candidate may petition for a recount
Unsuccessful candidates may contest results if they believe misconduct occurred in election administration that would change the result
Varies by type of election
Electoral board meets to conduct its canvass and certificates are given to the winners
By 5:00 p.m. the day after
election
All sealed envelopes from the election delivered to the clerk of the circuit court
By 12:00 p.m. the day after
election
Chapter 1: Electoral Environment and Background 6
The Code of Virginia allows for recounts in any election where the margin of victory between the top two candidates is less than or equal to one percent (calculated as the winner total minus the de-feated total, divided by the total votes for both, then multiplied by 100). In these close elections, the candidate who appears to have lost the election may petition for a recount. If the margin of victory is one-half percent or less, or if the requesting candidate ends-up winning the recount, localities pay the cost of the recount. In all other circumstances, the candidate requesting the recount is re-sponsible for the costs. The Code includes specific recount proce-dures depending on whether paper ballots or voting equipment was used. Additionally, the Code allows unsuccessful candidates to contest election results if they believe that some misconduct oc-curred in the administration of the election, which if proven true, could change the election outcome.
Virginians Vote Using DREs or Optical Scan Machines
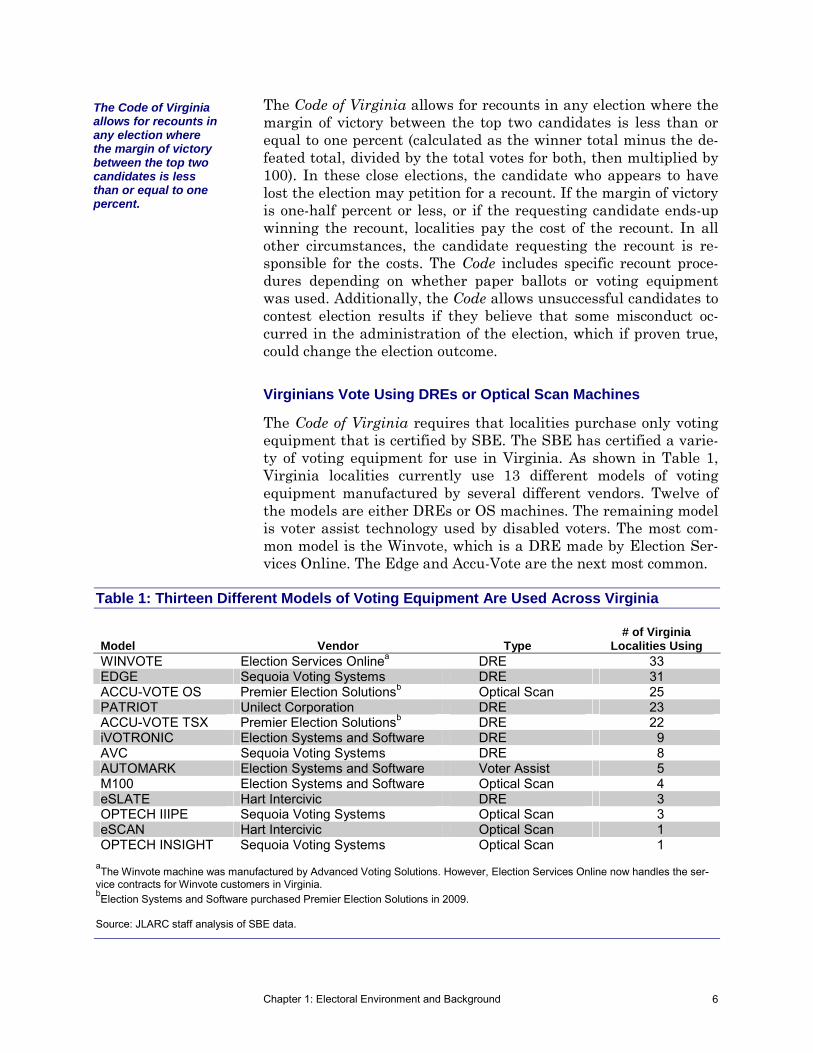
The Code of Virginia requires that localities purchase only voting equipment that is certified by SBE. The SBE has certified a varie-ty of voting equipment for use in Virginia. As shown in Table 1, Virginia localities currently use 13 different models of voting equipment manufactured by several different vendors. Twelve of the models are either DREs or OS machines. The remaining model is voter assist technology used by disabled voters. The most com-mon model is the Winvote, which is a DRE made by Election Ser-vices Online. The Edge and Accu-Vote are the next most common.
Table 1: Thirteen Different Models of Voting Equipment Are Used Across Virginia
Model Vendor Type # of Virginia
Localities Using WINVOTE Election Services Onlinea DRE 33 EDGE Sequoia Voting Systems DRE 31 ACCU-VOTE OS Premier Election Solutionsb Optical Scan 25 PATRIOT Unilect Corporation DRE 23 ACCU-VOTE TSX Premier Election Solutionsb DRE 22 iVOTRONIC Election Systems and Software DRE 9 AVC Sequoia Voting Systems DRE 8 AUTOMARK Election Systems and Software Voter Assist 5 M100 Election Systems and Software Optical Scan 4 eSLATE Hart Intercivic DRE 3 OPTECH IIIPE Sequoia Voting Systems Optical Scan 3 eSCAN Hart Intercivic Optical Scan 1 OPTECH INSIGHT Sequoia Voting Systems Optical Scan 1
aThe Winvote machine was manufactured by Advanced Voting Solutions. However, Election Services Online now handles the ser-vice contracts for Winvote customers in Virginia. bElection Systems and Software purchased Premier Election Solutions in 2009. Source: JLARC staff analysis of SBE data.
The Code of Virginia allows for recounts in any election where the margin of victory between the top two candidates is less than or equal to one percent.

Chapter 1: Electoral Environment and Background 7
Examples of a DRE and an OS machine are shown in Figure 2. OS machines tabulate a paper ballot which voters fill-out, by hand, and then feed into the machine. Most optical scan ballots require voters to either fill in ovals or connect lines next to the name of their candidate of choice for each office on the ballot. The OS ma-chine then tabulates the ballot by scanning the ballot in the man-ner programmed for the ballot design of that particular precinct. After scanning and tabulating the ballot, the OS machine deposits the ballot into a locked drawer at the bottom of the machine.
DREs are typically “touch-screen” computer terminals, which allow a voter to make selections and cast a vote. The vote is recorded and stored on a removable memory card and an internal memory sys-tem. Recently, DRE vendors have developed attachments that can be used to create a voter-verifiable paper record (VVPR). The VVPR can serve as a paper back-up to be checked after elections. To date, SBE has not received any vendor requests to certify any VVPR printers for use in Virginia.
Since the introduction of DREs, concerns have been expressed re-garding the security of these machines. Several studies indicate that DREs could be vulnerable to tampering; however, no verified incident of tampering with a DRE machine has occurred in Virgin-ia. Nonetheless, these studies have created a public perception that DREs may endanger the integrity of elections. There are also examples of DREs, and to a lesser degree OS machines, not tabu-lating votes correctly.
Figure 2: Example Direct Recording Equipment and Optical Scan Machine
Source: Election Systems and Software, Inc. and Fairfax County, Virginia.
Direct Recording Equipment Optical Scan Machine
Chapter 1: Electoral Environment and Background 8
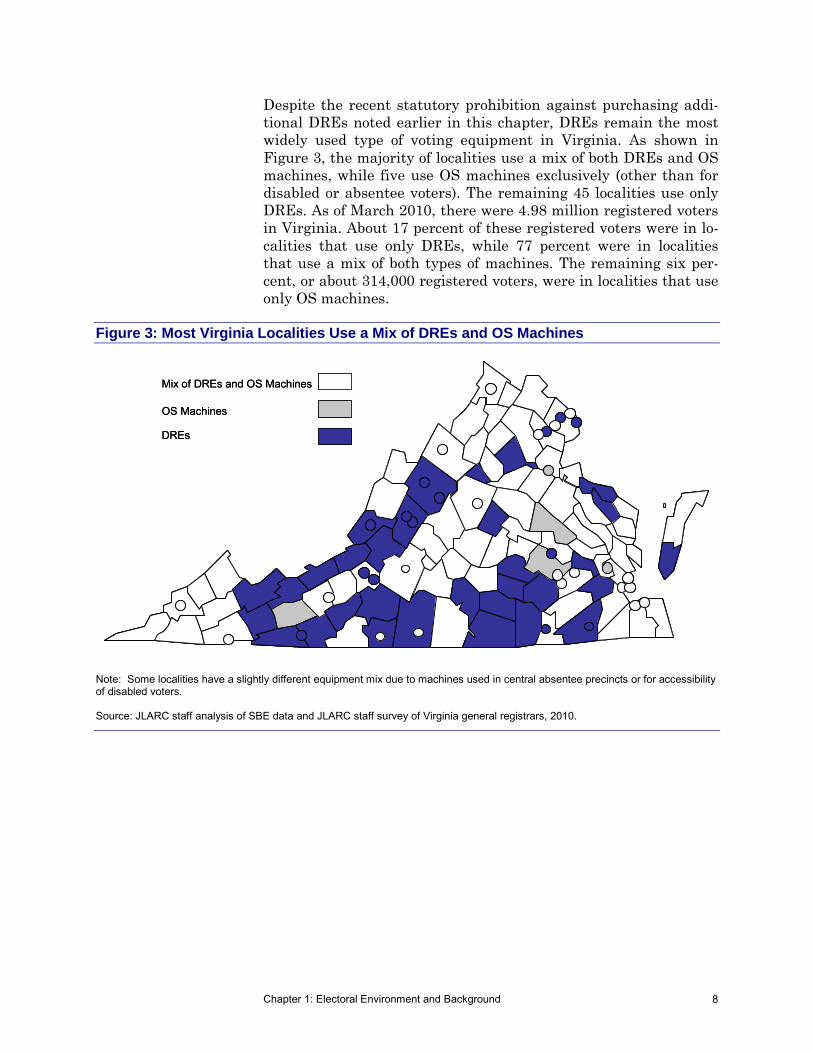
Despite the recent statutory prohibition against purchasing addi-tional DREs noted earlier in this chapter, DREs remain the most widely used type of voting equipment in Virginia. As shown in Figure 3, the majority of localities use a mix of both DREs and OS machines, while five use OS machines exclusively (other than for disabled or absentee voters). The remaining 45 localities use only DREs. As of March 2010, there were 4.98 million registered voters in Virginia. About 17 percent of these registered voters were in lo-calities that use only DREs, while 77 percent were in localities that use a mix of both types of machines. The remaining six per-cent, or about 314,000 registered voters, were in localities that use only OS machines.
Figure 3: Most Virginia Localities Use a Mix of DREs and OS Machines
Mix of DREs and OS Machines
OS Machines
DREs
Mix of DREs and OS Machines
OS Machines
DREs
Mix of DREs and OS Machines
OS Machines
DREs
Note: Some localities have a slightly different equipment mix due to machines used in central absentee precincts or for accessibility of disabled voters. Source: JLARC staff analysis of SBE data and JLARC staff survey of Virginia general registrars, 2010.

Chapter 2: Voting Equipment 9
An important backdrop for considering post-election audits is the voting equipment being audited. Localities in Virginia currently use either direct recording equipment (DRE) or optical scan (OS) machines. Determining the extent to which post-election audits are necessary rests in part on the degree of certainty about the se-curity, accuracy, and reliability of election results produced by each type of voting equipment.
DREs AND OPTICAL SCAN MACHINES USED IN VIRGINIA HAVE BEEN CERTIFIED AND TESTED
The certification of voting equipment for use in Virginia consists of several phases (Figure 4). The process begins when a national en-tity tests and certifies the equipment. The National Association of State Election Directors (NASED) used to administer the national testing program, but since 2007 it has been administered by the Election Assistance Commission (EAC). There is also State-level certification, which in Virginia is conducted by the State Board of Elections (SBE). Localities then conduct acceptance testing once the equipment is delivered, and also conduct ongoing testing prior to the equipment being used in each election.
National Certification Testing
Typically, the national certification process is initiated when a vendor requests that its equipment be certified. The purpose of
Ch
ap
ter
22 VVoottiinngg EEqquuiippmmeenntt
Voting equipment currently used by Virginia’s localities has been certified national-ly and by the State Board of Elections. Localities also conduct a relatively simple test on each machine prior to each election. Nevertheless, some computer scientistsexpress skepticism about the security, accuracy, and reliability of both direct record-ing equipment (DRE) and optical scan (OS) machines. They are somewhat less con-cerned about OS machines because they use a paper ballot that can be audited. Sev-eral other states have conducted detailed reviews of their voting equipment,including some of the same models used in Virginia. These reviews have generallyresulted in an increased reliance on OS machines and post-election audits, in addi-tion to other technical and procedural changes. Virginia’s general registrars express a very high degree of confidence in both the DREs and OS machines used by theirlocalities. Virginia’s general registrars tend to have an even higher degree of confi-dence in DREs than OS machines.
II nn SS
uumm
mmaa r
r yy
EAC Now Performs National Certification
Between 1994 and 2007, the National As-sociation of State Elec-tion Directors (NASED) administered a national voting equipment certi-fication program. The Help America Vote Act mandated that the cer-tification testing pro-cess be transferred from NASED to the newly created Election Assistance Commis-sion (EAC). To date, the EAC has certified four models of voting equipment, none of which is used in Virgin-

Chapter 2: Voting Equipment 10
Vend
or
requ
ests
eq
uipm
ent b
e ce
rtifie
d
Vend
or
requ
ests
eq
uipm
ent
be c
ertif
ied
Loca
lity
notif
ies
SBE
Vend
or
deliv
ers
equi
pmen
t to
loca
lity
Inde
pend
ent
lab
test
s eq
uipm
ent
func
tiona
l ca
pabi
litie
s
NAS
ED /
EAC
* re
view
in
depe
nden
t lab
te
st re
sults
Test
resu
lts
satis
fact
ory?
NA
SED
/
EA
C is
sues
qu
alifi
catio
n /
certi
ficat
ion
num
ber
Lo
cal L
og
ic
and
Acc
ura
cy
Tes
tin
g
Loca
lity
uses
var
ying
pr
oced
ures
to
prep
are
equi
pmen
t fo
r tes
t (de
pend
ing
on
equ
ipm
ent t
ype)
Appo
inte
d vo
ting
equi
pmen
t cus
todi
an
over
sees
test
ing;
pu
blic
atte
ndan
ce
perm
itted
Suc
cess
ful
test
ing?
Equ
ipm
ent u
sed
in
eac
h pr
ecin
ct o
n el
ectio
n da
y
Equi
pmen
t sen
t bac
k to
Gen
eral
R
egis
trar f
or u
se in
nex
t ele
ctio
n
Gen
eral
Reg
istra
r di
strib
utes
eq
uipm
ent t
o pr
ecin
cts
Equi
pmen
t set
asi
de to
be
fixed
; no
t dis
tribu
ted
to p
reci
nct
YES
NO
Nat
ion
al
Cer
tifi
cati
on
T
esti
ng
Sta
te
Cer
tifi
cati
on
T
esti
ng
SBE*
ev
alua
tes
equi
pmen
t op
erat
ions
and
pr
oced
ures
Eval
uatio
n
sa
tisfa
ctor
y?Lo
calit
y us
es
equi
pmen
t in
test
ele
ctio
n
Test
elec
tion
satis
fact
ory?
SBE
not
ifies
ve
ndor
of
certi
ficat
ion
Ac
cep
tan
ce
Tes
tin
g
Loca
lity
conf
irms
equi
pmen
t is
iden
tical
to
certi
fied
equi
pmen
t or
dere
d
Sam
e eq
uipm
ent?
Loca
lity
eval
uate
s eq
uipm
ent
func
tiona
lity
and
cons
iste
ncy
with
re
quire
men
ts
Eval
uatio
n sa
tisfa
ctor
y?
YES
NO
YES
NO
YES
NO
YES
NO
YES
NO
Fi
gure
4: N
atio
nal a
nd V
irgin
ia C
ertif
icat
ion
and
Test
ing
Proc
ess
N
ote:
NAS
ED, N
atio
nal A
ssoc
iatio
n of
Sta
te E
lect
ion
Dire
ctor
s; E
AC, E
lect
ion
Assis
tanc
e Co
mm
issio
n; S
BE, S
tate
Boa
rd o
f Ele
ctio
ns.
Sour
ce: J
LARC
staf
f ana
lysis
of E
AC d
ocum
enta
tion,
the
Code
of V
irgin
ia, a
nd S
BE p
olic
y.
Chapter 2: Voting Equipment 11
national certification is to validate and document, through an in-dependent testing process, that voting equipment meets the voting system performance guidelines and is consistent with the vendor’s specifications. National certification testing is performed by ac-credited testing labs, which test voting equipment. The testing in-cludes: examination of system software, tests of hardware under conditions similar to how it will be actually used, and operational tests to validate system performance and function. For older sys-tems certified by NASED, such as those used in Virginia, an inde-pendent testing authority issued a qualification test report to the vendor and NASED. NASED then reviewed the test report, and if the voting equipment achieved satisfactory results, NASED issued a qualification number that remains valid for as long as the voting equipment is unchanged. For newer systems seeking EAC certifi-cation, the EAC reviews the test reports and determines whether the equipment achieved satisfactory results. If the results of the test are satisfactory, the EAC issues a certification number indi-cating the system has completed testing.
State Certification Testing
To initiate the State certification process, a voting equipment ven-dor sends the Secretary of SBE a letter requesting certification. The purpose of State certification testing is to verify that the de-sign and performance of voting equipment complies with all appli-cable requirements in the Code of Virginia. State certification test-ing is also intended to verify that the equipment being tested is identical to the system that has been certified in the national pro-cess described above. Importantly, State certification is not intend-ed to be an exhaustive test of voting equipment. The testing does, however, include defining ballot formats, installing application and election-specific programs and data in the ballot counting device, counting ballots, and obtaining data and audit reports.
To complete State certification, the equipment must be used in an actual “test” election in one or more localities. The election must be a general election in which write-ins are allowed. If the equipment performs satisfactorily in the test election, SBE will notify the vendor that the equipment will be certified.
Acceptance Testing
As part of the procurement process for voting equipment, a locality conducts acceptance testing. SBE policy requires localities to con-firm that the equipment is identical to the certified equipment, and that the equipment is fully functional and capable of satisfying the locality’s administrative and statutory requirements. Typical-ly, acceptance testing consists of evaluating the equipment’s func-

Chapter 2: Voting Equipment 12
tionality, including: processing simulated ballots for each precinct in the locality, handling write-ins, generating a final report of the election, and producing audit logs. The locality then sends SBE a letter to confirm that the equipment received is identical to the certified equipment that it ordered.
Local Logic and Accuracy Testing
After a machine is certified nationally, by the State, and accepted by a locality, it is subject to less comprehensive testing prior to use in each election. This testing, known as logic and accuracy (L&A) testing, involves ensuring that each piece of equipment correctly tabulates votes. Logic and accuracy testing is conducted on all ma-chines prior to each election. For each election, the local electoral board appoints a voting equipment custodian—which is usually an interested member of the public. The custodian oversees the L&A test, which the public may view if they wish.
The L&A test consists of programming the machine and running a small number of test ballots through the machine. The custodian knows how many votes for each candidate are in the test ballots. If the machine accurately counts the total number of ballots and votes, the counter is then set to zero, and the machine is locked and distributed to a local precinct for use on election day. After election day, the machines are returned to the general registrar, then stored for use until the next election. Because post-election audits are not required in Virginia, these L&A tests are the only ongoing process to test voting equipment.
CONCERNS REGARDING VOTING EQUIPMENT SECURITY, ACCURACY, AND RELIABILITY VARY
Despite the certification and testing process described above, com-puter scientists, voters’ rights organizations, and some practition-ers express concern about the security, accuracy, and reliability of both DREs and OS machines. Examples across the country, includ-ing in Virginia, of problems with voting equipment raise questions about whether machines operate properly during each election. One method of at least partially answering these questions is con-ducting a post-election audit on the voting equipment.
There are few discernable differences between DRE and OS ma-chine security, accuracy, and reliability except for the fact that OS machines use a paper ballot that can easily be audited. Even if at-tachments that produce voter verifiable paper records are installed on DREs, the paper records are still not created directly by the voter and are cumbersome to audit. For this reason, those that be-lieve audits are important and necessary advocate for the use of OS machines rather than DREs. These concerns were the primary
Security, Accuracy, and Reliability
According to a 2006 GAO report on voting equipment, security is a machine’s vulnerabil-ity to attacks that would violate the election’s integrity, and potential-ly impact the accuracy and reliability of the machine. Accuracy is defined as how fre-quently the equipment completely and correct-ly records and counts votes, and reliability is the extent to which the system performs as intended.
Chapter 2: Voting Equipment 13
reason the General Assembly prohibited localities from purchasing new DRE equipment after 2007.
Some Computer Scientists Express Concern About Both Voting Equipment Types, but Are Less Concerned About OS Machines Because of Paper Ballot
As the National Research Council indicated in its 2005 study of electronic voting, “security is a particularly elusive goal” for com-puter scientists because their “perspective can be summarized as a worst-case perspective—if a vulnerability cannot be ruled out, it is necessarily of concern.” From this perspective, computer scientists have publicly aired major concerns regarding electronic voting equipment, which has fueled skepticism of electronic voting equipment, in particular DREs.
According to some nationally renowned computer security experts, such as those with a National Science Foundation consortium AC-CURATE (see sidebar), DREs and OS are equally susceptible to security threats. Recent studies have demonstrated both DREs and OS are susceptible to the three types of security threats: (1) integrity, (2) anonymity, and (3) availability. However, because OS machines use a voter-verified paper record, computer scientists seem to agree that OS machines present less risk than DREs.
Integrity threats describe attacks that “aim to change election to-tals,” or diminish the machine’s accuracy. For example, a single at-tacker could inject a virus or program onto the machine that would change results by erasing votes, adding votes, or switching votes. Computer security experts at ACCURATE indicated to JLARC staff that on most voting equipment types, such a virus could spread from one voting machine to others. Optical scan machines and DREs are equally susceptible to being injected with a mali-cious program or virus; however, with an OS machine, the attack should be caught if the paper ballots are subjected to either a post-election audit or recount. To successfully launch this attack on an OS machine, the attacker would need to somehow replace all the cast ballots with fake ballots matching the tainted electronic tally. Making such a ballot switch would be very difficult. Because of this, OS machines generally provide greater protection against in-tegrity attacks than DREs.
Anonymity threats describe attacks that would compromise a vot-er’s privacy and confidentiality in the voting booth. For example, some DREs record votes in the order they were cast. If the attacker could access the pollbook, likely requiring the participation of a poll worker, an attacker could identify how individual voters cast their votes. With both DREs and OS machines, these attacks would generally require the collusion of some poll workers to be
ACCURATE
ACCURATE, which stands for A Center for Correct, Usable, Relia-ble, Auditable, and Transparent Elections, is a multi-institution voting research center funded by the National Science Foundation. Principal investigators with the center are affiliated with institu-tions such as Johns Hopkins University, Rice University, the University of Iowa, SRI International, the Uni-versity of California at Berkeley, and Stanford University.

Chapter 2: Voting Equipment 14
successful, which makes these attacks less likely to occur than an attack that would not require a conspiracy.
Finally, availability threats describe attacks that would disrupt the election. For example, an attacker could inject a virus or pro-gram that could disable or shut down the machine, which would prevent voters from casting votes. Additionally, if the goal of the attack was to merely disrupt the election, an attacker could physi-cally damage the machine. However, for an OS machine, to truly disrupt the election the attacker would also need to destroy or steal the OS ballots; otherwise, voters could continue to cast bal-lots even if the machine were not functional. Again, the OS ma-chine is less vulnerable to these availability threats when com-pared to a DRE because of its paper ballot.
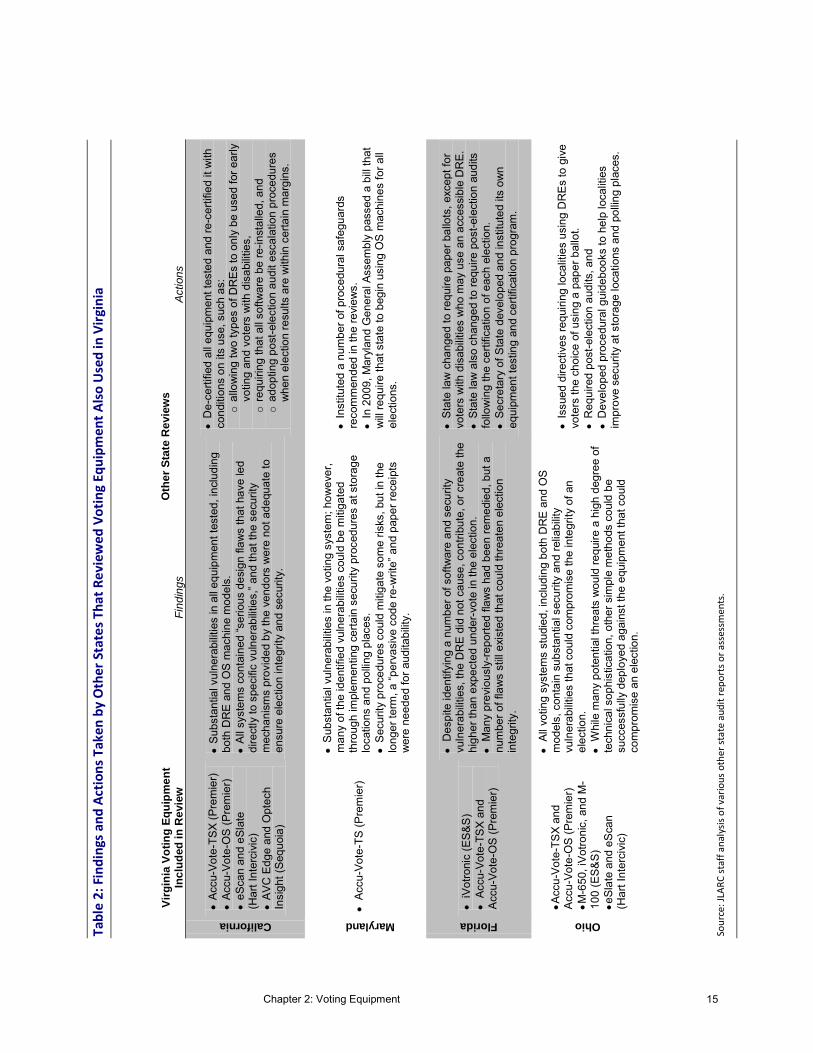
Several States Have Identified Problems With Equipment Also Used in Virginia; Now Relying More on Paper Ballots and Audits
In response to computer scientists’ criticisms of electronic voting equipment, California, Ohio, Maryland, and Florida have reviewed the voting equipment used in their states. These reviews included several voting machines also used in Virginia, in particular vari-ous versions of the Accu-vote machine. Each of these states found problems with the equipment and took a variety of actions, with a general trend towards the use of OS machines using a paper bal-lot. Table 2 (next page) summarizes the findings and actions taken by these four states in response to their voting equipment review. California, Florida, and Maryland eventually discontinued the use of DREs, while Ohio began allowing voters a choice of DREs or OS machines. Florida, Ohio, and California each added post-election audit requirements.
In Virginia, SBE staff informally monitor voting equipment devel-opments in other states, such as the review findings issued by Maryland, Florida, Ohio, and California. However, SBE has not taken any action regarding the findings of these studies. SBE staff noted that, while not directly in response to these other state re-views, the General Assembly has taken action to address skepti-cism regarding electronic voting equipment, including prohibiting the future purchase of DREs.
Virginia General Registrars Are Very Confident in Virginia’s Equipment, Slightly More Confident in DREs
Though aware of the concerns of computer scientists and certain actions taken by other states, Virginia’s general registrars still re-port a high degree of confidence in their locality’s voting equip-ment. On a JLARC staff survey of Virginia general registrars, 95
Chapter 2: Voting Equipment 15
Oth
er
Sta
te R
evi
ews
V
irg
inia
Vo
tin
g E
qu
ipm
en
t In
clu
ded
in
Re
view
Fi
ndin
gs
Act
ions
California
Ac
cu-V
ote-
TSX
(Pre
mie
r)
Accu
-Vot
e-O
S (P
rem
ier)
eSca
n an
d eS
late
(H
art I
nter
civi
c)
AV
C E
dge
and
Opt
ech
Insi
ght (
Sequ
oia)
Su
bsta
ntia
l vul
nera
bilit
ies
in a
ll eq
uipm
ent t
este
d, in
clud
ing
both
DR
E a
nd O
S m
achi
ne m
odel
s.
A
ll sy
stem
s co
ntai
ned
“ser
ious
des
ign
flaw
s th
at h
ave
led
dire
ctly
to s
peci
fic v
ulne
rabi
litie
s,” a
nd th
at th
e se
curit
y m
echa
nism
s pr
ovid
ed b
y th
e ve
ndor
s w
ere
not a
dequ
ate
to
ensu
re e
lect
ion
inte
grity
and
sec
urity
.
D
e-ce
rtifie
d al
l equ
ipm
ent t
este
d an
d re
-cer
tifie
d it
with
co
nditi
ons
on it
s us
e, s
uch
as:
o al
low
ing
two
type
s of
DR
Es to
onl
y be
use
d fo
r ear
ly
votin
g an
d vo
ters
with
dis
abili
ties,
o
requ
iring
that
all
softw
are
be re
-inst
alle
d, a
nd
o ad
optin
g po
st-e
lect
ion
audi
t esc
alat
ion
proc
edur
es
whe
n el
ectio
n re
sults
are
with
in c
erta
in m
argi
ns.
Maryland
Ac
cu-V
ote-
TS (P
rem
ier)
S
ubst
antia
l vul
nera
bilit
ies
in th
e vo
ting
syst
em; h
owev
er,
man
y of
the
iden
tifie
d vu
lner
abili
ties
coul
d be
miti
gate
d th
roug
h im
plem
entin
g ce
rtain
sec
urity
pro
cedu
res
at s
tora
ge
loca
tions
and
pol
ling
plac
es.
S
ecur
ity p
roce
dure
s co
uld
miti
gate
som
e ris
ks, b
ut in
the
long
er te
rm, a
“per
vasi
ve c
ode
re-w
rite”
and
pap
er re
ceip
ts
wer
e ne
eded
for a
udita
bilit
y.
In
stitu
ted
a nu
mbe
r of p
roce
dura
l saf
egua
rds
reco
mm
ende
d in
the
revi
ews.
In 2
009,
Mar
ylan
d G
ener
al A
ssem
bly
pass
ed a
bill
that
w
ill re
quire
that
sta
te to
beg
in u
sing
OS
mac
hine
s fo
r all
elec
tions
.
Florida
iV
otro
nic
(ES&
S)
Ac
cu-V
ote-
TSX
and
Acc
u-Vo
te-O
S (P
rem
ier)
D
espi
te id
entif
ying
a n
umbe
r of s
oftw
are
and
secu
rity
vuln
erab
ilitie
s, th
e D
RE
did
not c
ause
, con
tribu
te, o
r cre
ate
the
high
er th
an e
xpec
ted
unde
r-vot
e in
the
elec
tion.
Man
y pr
evio
usly
-repo
rted
flaw
s ha
d be
en re
med
ied,
but
a
num
ber o
f fla
ws
still
exi
sted
that
cou
ld th
reat
en e
lect
ion
inte
grity
.
St
ate
law
cha
nged
to re
quire
pap
er b
allo
ts, e
xcep
t for
vo
ters
with
dis
abilit
ies
who
may
use
an
acce
ssib
le D
RE.
Stat
e la
w a
lso
chan
ged
to re
quire
pos
t-ele
ctio
n au
dits
fo
llow
ing
the
certi
ficat
ion
of e
ach
elec
tion.
Secr
etar
y of
Sta
te d
evel
oped
and
inst
itute
d its
ow
n eq
uipm
ent t
estin
g an
d ce
rtific
atio
n pr
ogra
m.
Ohio
Acc
u-Vo
te-T
SX a
nd
Acc
u-Vo
te-O
S (P
rem
ier)
M
-650
, iVo
troni
c, a
nd M
-10
0 (E
S&S)
e
Slat
e an
d eS
can
(Har
t Int
erci
vic)
Al
l vot
ing
syst
ems
stud
ied,
incl
udin
g bo
th D
RE
and
OS
mod
els,
con
tain
sub
stan
tial s
ecur
ity a
nd re
liabi
lity
vuln
erab
ilitie
s th
at c
ould
com
prom
ise
the
inte
grity
of a
n el
ectio
n.
W
hile
man
y po
tent
ial t
hrea
ts w
ould
requ
ire a
hig
h de
gree
of
tech
nica
l sop
hist
icat
ion,
oth
er s
impl
e m
etho
ds c
ould
be
succ
essf
ully
dep
loye
d ag
ains
t the
equ
ipm
ent t
hat c
ould
co
mpr
omis
e an
ele
ctio
n.
Is
sued
dire
ctiv
es re
quiri
ng lo
calit
ies
usin
g D
RE
s to
giv
e vo
ters
the
choi
ce o
f usi
ng a
pap
er b
allo
t.
Req
uire
d po
st-e
lect
ion
audi
ts, a
nd
D
evel
oped
pro
cedu
ral g
uide
book
s to
hel
p lo
calit
ies
impr
ove
secu
rity
at s
tora
ge lo
catio
ns a
nd p
ollin
g pl
aces
.
Sour
ce: J
LARC
staf
f ana
lysis
of v
ario
us o
ther
stat
e au
dit r
epor
ts o
r ass
essm
ents
.
Tabl
e 2:
Fin
ding
s and
Act
ions
Tak
en b
y O
ther
Sta
tes T
hat R
evie
wed
Vot
ing
Equi
pmen
t Also
Use
d in
Virg
inia
Chapter 2: Voting Equipment 16
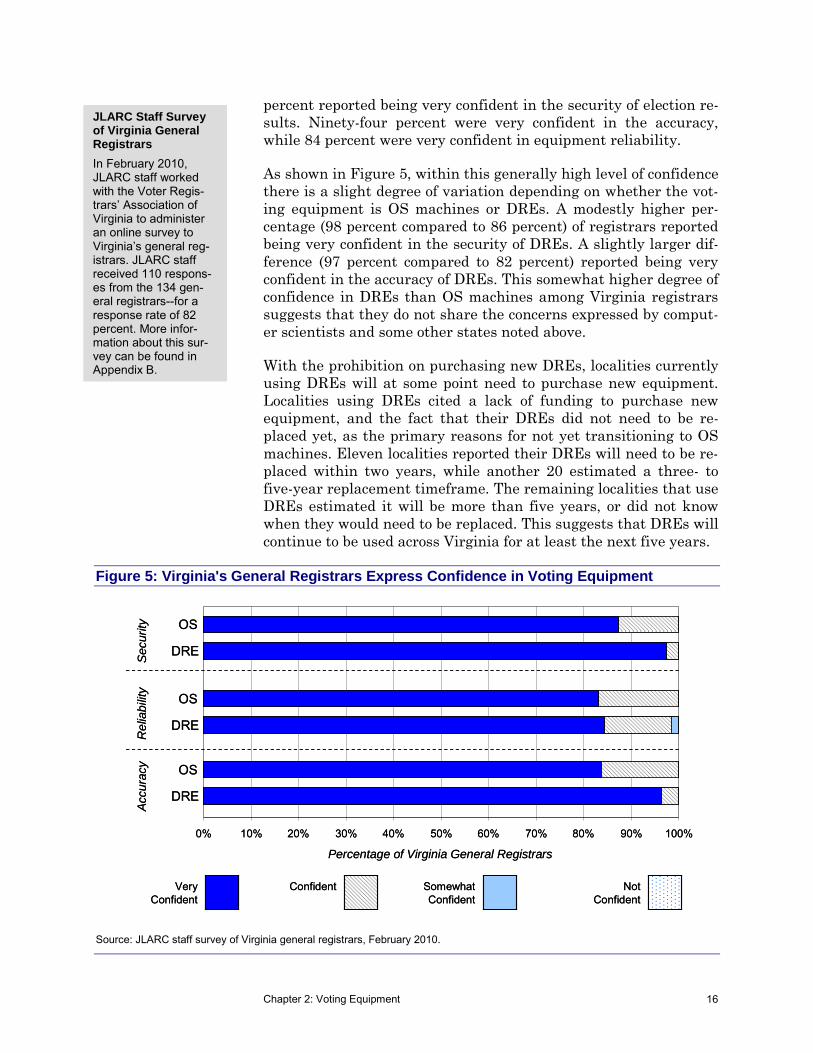
percent reported being very confident in the security of election re-sults. Ninety-four percent were very confident in the accuracy, while 84 percent were very confident in equipment reliability.
As shown in Figure 5, within this generally high level of confidence there is a slight degree of variation depending on whether the vot-ing equipment is OS machines or DREs. A modestly higher per-centage (98 percent compared to 86 percent) of registrars reported being very confident in the security of DREs. A slightly larger dif-ference (97 percent compared to 82 percent) reported being very confident in the accuracy of DREs. This somewhat higher degree of confidence in DREs than OS machines among Virginia registrars suggests that they do not share the concerns expressed by comput-er scientists and some other states noted above.
With the prohibition on purchasing new DREs, localities currently using DREs will at some point need to purchase new equipment. Localities using DREs cited a lack of funding to purchase new equipment, and the fact that their DREs did not need to be re-placed yet, as the primary reasons for not yet transitioning to OS machines. Eleven localities reported their DREs will need to be re-placed within two years, while another 20 estimated a three- to five-year replacement timeframe. The remaining localities that use DREs estimated it will be more than five years, or did not know when they would need to be replaced. This suggests that DREs will continue to be used across Virginia for at least the next five years.
Figure 5: Virginia's General Registrars Express Confidence in Voting Equipment
Source: JLARC staff survey of Virginia general registrars, February 2010.
JLARC Staff Survey of Virginia General Registrars
In February 2010, JLARC staff worked with the Voter Regis-trars’ Association of Virginia to administer an online survey to Virginia’s general reg-istrars. JLARC staff received 110 respons-es from the 134 gen-eral registrars--for a response rate of 82 percent. More infor-mation about this sur-vey can be found in Appendix B.
Not Confident
Somewhat Confident
ConfidentVery Confident
0% 10% 20% 30% 40% 50% 60% 70% 80% 90% 100%
DRE
OS
DRE
OS
DRE
OS
Percentage of Virginia General Registrars
Sec
urity
Rel
iabi
lity
Accu
racy
Not Confident
Somewhat Confident
ConfidentVery Confident
0% 10% 20% 30% 40% 50% 60% 70% 80% 90% 100%
DRE
OS
DRE
OS
DRE
OS
Percentage of Virginia General Registrars
Sec
urity
Rel
iabi
lity
Accu
racy
Chapter 3: Post-election Audits in Other States 17
Senate Joint Resolution 328 directs JLARC staff to review the ex-perience of post-election audits in other states. There is currently no federal requirement for states to conduct post-election audits, and more than half of the nation’s states—including Virginia—have chosen not to require audits. Virginia’s deliberations sur-rounding post-election audits can be informed by the purposes, strategies and methods, and results associated with audits con-ducted by other states.
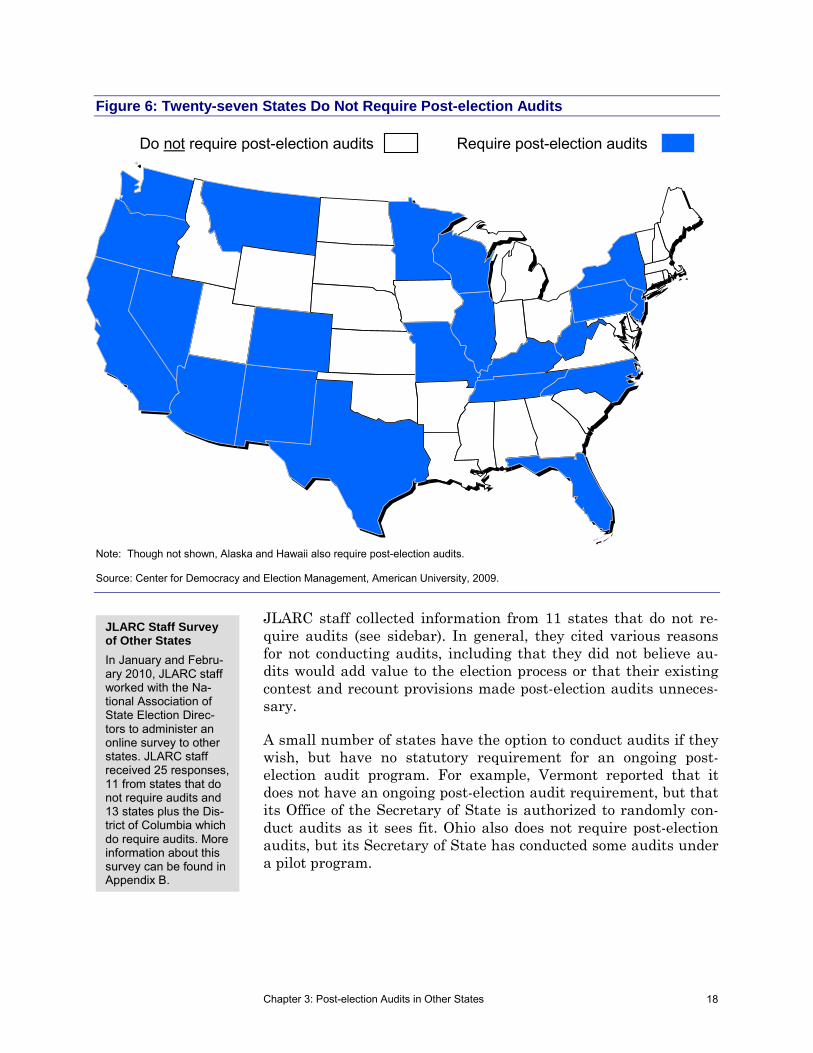
TWENTY-SEVEN STATES DO NOT REQUIRE POST-ELECTION AUDITS, WHILE 23 STATES DO
According to the Center for Democracy and Election Management at American University, 23 states have some type of post-election audit requirement, while the remaining 27 states do not (Figure 6). In general, states in the mid-west and southeast tend to be those that do not require audits. States along the west coast and in the southwest tend to be those that do require some form of post-election audit. Some states, such as California, have had audit programs for many years. Other states, such as Tennessee, have only recently begun their post-election audit programs. Maryland is the only state that borders Virginia that does not currently re-quire post-election audits on a regular basis.
Ch
ap
ter
33
PPoosstt--eelleeccttiioonn AAuuddiittss iinn OOtthheerr SSttaatteess
Twenty-three states require post-election audits, while the remaining 27 states do not. States that do conduct audits implement them to achieve various purposes, such as enhancing election transparency and voter confidence. Most of these states use a fixed-percentage audit strategy, while a few use adjustable-percentage strategies in which larger sample sizes are selected for audit as the margin of victory narrows. States use several different audit methods to conduct their audits, but most use a hand-to-eye, or manual, counting method. Audit completion times can depend on the number of races audited, number of ballots included in a precinct selected for audit, and whether a discrepancy is found that needs to be reconciled. States report that the vast majority of their audits do not find substantial discrepancies. Audits do, however, at times find discrepancies that are typically attributed to factors such as avoter incorrectly filling out a ballot.
II nn SS
uumm
mmaa r
r yy
Chapter 3: Post-election Audits in Other States 18
Figure 6: Twenty-seven States Do Not Require Post-election Audits
Note: Though not shown, Alaska and Hawaii also require post-election audits. Source: Center for Democracy and Election Management, American University, 2009.
JLARC staff collected information from 11 states that do not re-quire audits (see sidebar). In general, they cited various reasons for not conducting audits, including that they did not believe au-dits would add value to the election process or that their existing contest and recount provisions made post-election audits unneces-sary.
A small number of states have the option to conduct audits if they wish, but have no statutory requirement for an ongoing post-election audit program. For example, Vermont reported that it does not have an ongoing post-election audit requirement, but that its Office of the Secretary of State is authorized to randomly con-duct audits as it sees fit. Ohio also does not require post-election audits, but its Secretary of State has conducted some audits under a pilot program.
JLARC Staff Survey of Other States
In January and Febru-ary 2010, JLARC staff worked with the Na-tional Association of State Election Direc-tors to administer an online survey to other states. JLARC staff received 25 responses, 11 from states that do not require audits and 13 states plus the Dis-trict of Columbia which do require audits. More information about this survey can be found in Appendix B.
Require post-election auditsRequire post-election auditsDo not require post-election auditsDo not require post-election audits

Chapter 3: Post-election Audits in Other States 19
OTHER STATES AUDIT FOR VARIOUS PURPOSES AND USE SEVERAL AUDIT STRATEGIES AND METHODS
JLARC staff collected information from 13 states and the District of Columbia (D.C.) about their post-election audit programs. These states and D.C. have each implemented different programs, but some patterns do exist that can provide some insight for states such as Virginia studying post-election audits. An exhibit showing each state’s and D.C.’s responses to certain survey questions is provided in Appendix D.
Majority of States That Conduct Audits Find Them Useful for a Variety of Purposes and an Effective Use of Resources
In general, other states require post-election audits to achieve sev-eral related purposes. Of 13 states (and D.C.) JLARC staff col-lected information from that do require post-election audits, most reported they found audits very useful for enhancing the transpar-ency of the election and increasing voter confidence. Most of these states also reported that audits were very useful to verify election results and check the accuracy of voting equipment. Most of these states also characterized their post-election audits as a highly ef-fective or effective use of resources. One state, however, reported its audits were not an effective use of resources.
Most States Use a Fixed-Percentage Audit Strategy to Determine Audit Sample Size
States that require post-election audits use either (1) a fixed-percentage audit strategy (FP), (2) an adjustable-percentage (AP) audit strategy designed to achieve a certain level of statistical con-fidence, or (3) a combination of the two. The majority of states that require audits use a FP strategy. Several states noted, however, that they would now recommend a strategy similar to the AP that would result in larger sample sizes as the margin of victory nar-rows. In this respect, Colorado noted that it is redesigning its cur-rent FP strategy to be one that, similar to an AP strategy, deter-mines sample size based on limiting the risk that the election result was incorrect. North Carolina uses an AP strategy in which a statistician selects the appropriate sample size once the results of the election are known. The sample size is designed to achieve a 99 percent level of confidence that the winner on election night was the actual winner. To accomplish this, North Carolina typi-cally has found that auditing two precincts in most localities and more precincts in the largest localities achieves an appropriate level of statistical confidence.
Chapter 3: Post-election Audits in Other States 20
Most States Use Hand-to-eye Count or Combined Audit Method
States that require audits use either a (1) hand-to-eye counting (HTEC) audit method, (2) machine-assisted (MA) method, or (3) a combination of both. Only one state reported to JLARC that it uses only the MA method, while the remaining states reported either using the HTEC method or a combination of that method and the MA method.
Other states cite some differences between these audit methods. For example, Wisconsin noted that conducting a HTEC on OS bal-lots can make it difficult to determine with a high degree of cer-tainty whether the machine should have counted a ballot with a partially filled oval or arrow. If these ballots are not fed back through an OS machine, it can be unclear whether the machine tabulated the ballot on election night. In terms of the MA method, California found that while it can minimize the time and labor nec-essary to conduct the post-election audit, each locality conducting the audit would need to acquire at least one spare machine to use for the machine-assisted audit. This machine would require pro-gramming and auditing.
States Report Varying Resources and Costs For Their Post-election Audits
Whether states rely more heavily on machines or people to conduct their audits, the resources for audits are typically provided at the local level. Most of the states that conduct audits fund them using primarily local funds. In most cases, either local election staff or poll worker volunteers serve on the audit teams.
Other states report varying numbers of audit officials and time to complete their audits. Illinois reports it uses one audit official per precinct, while Nevada reports it uses six. In most cases it appears states use teams of two or three people to conduct the counting. Most states reported it takes one to two hours for a team of audit officials to audit a precinct. Numerous factors appear to affect the number of people and time required to audit a given precinct, in-cluding
what type of voting equipment used during the election was subject to audit;
whether a HTEC, MA, or combination audit method is used;
the number of races on the ballot included in the audit;
the number of ballots cast in the precincts being audited; and
whether discrepancies are found during the audit that must be reconciled through re-counting or additional auditing.
Minnesota Reports Varying Times to Conduct Audits
In a report issued after the state's 2008 post-election audit of the general election, Min-nesota reported that, on average, 12 ballots were counted per min-ute and the average audit completion time was 163.3 minutes. However, some audit locations took longer than others and there are many possible ex-planations for the vary-ing audit times across the state.
Concern About Hand Count Audit Method
In 2006, Georgia pub-lished a report on a pilot post-election audit it conducted in selec-ted localities. Georgia election officials noted particular concern about the increased opportunity for human errors in the hand-counting of the individ-ual votes on the paper roll produced by the DRE.
Chapter 3: Post-election Audits in Other States 21
Furthermore, the amount of planning, set up, and audit close-out time surrounding the actual audit itself can vary substantially. Some states include this time in their estimates, while others may not.
Most States With Post-election Audits Conduct Them Prior to Certifying Election Results
Most of the 13 states responding to the JLARC staff survey, as well as D.C., conduct their audits before election results are offi-cially certified. Alternatively, Arizona and Florida conduct their audits after election results are certified, but prior to the deadline to file a petition for a recount. Wisconsin conducts its audits after results are certified and after the deadline to file for a recount. Eight of these 13 states that require post-election audits also re-ported having a law that triggers a recount if the margin of victory is below a certain threshold.
MOST AUDITS IN OTHER STATES DO NOT FIND SUBSTANTIAL DISCREPENCIES
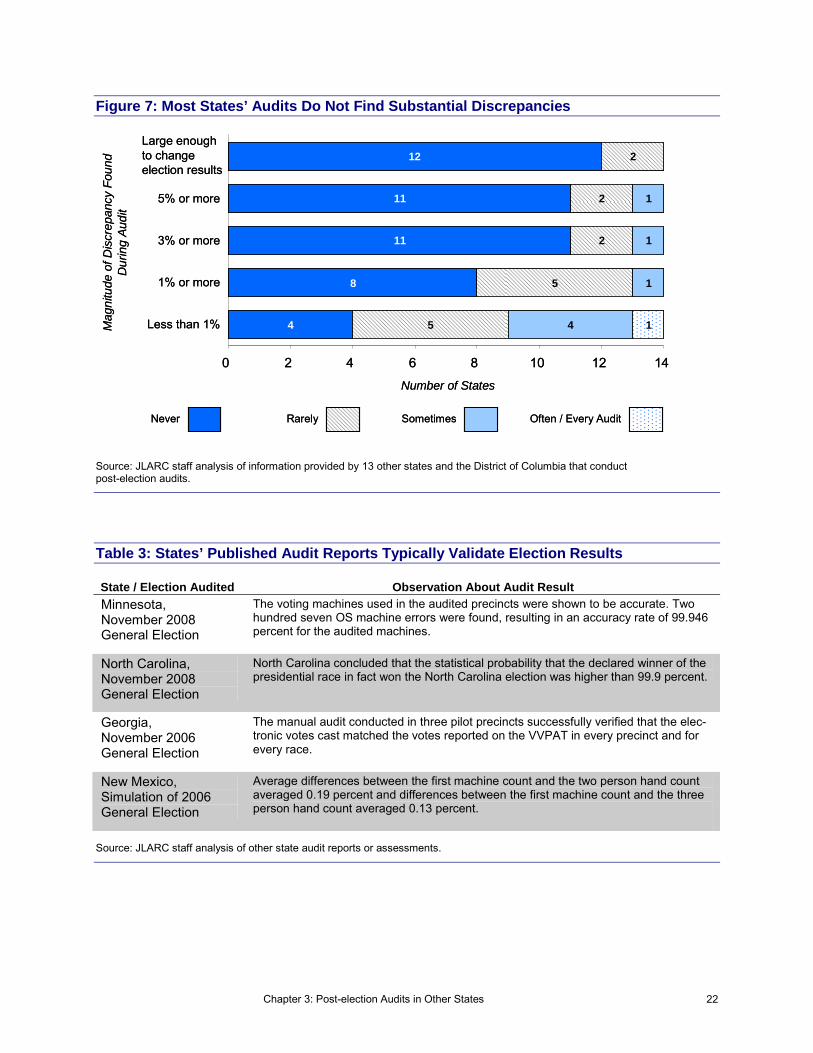
As shown in Figure 7, other states’ experiences with post-election audits suggest that in the vast majority of audits conducted, dis-crepancies that are found do not change the outcome of the elec-tion. Of the 13 states (and D.C.) that conduct audits JLARC staff collected information from, most report that they have never found a discrepancy between election night and audit tallies that was large enough to change the initial election results. States that have formally reported on the results of their audits reached similar conclusions (Table 3). On the survey, Illinois reported it sometimes found discrepancies of five percent or greater, while Montana and Arkansas reported they rarely find discrepancies large enough to change the election results.
The 13 states and D.C. reported a variety of responses to finding discrepancies that arise during their post-election audits, including publicizing the discrepancies and pulling a larger sample of ballots or conducting a full recount of ballots. Incorrect completion of bal-lots by voters was the most frequently cited reason for what typi-cally account for discrepancies between the election night and au-dit tally. Other factors cited were errors in reporting the results of the count, errors in setting up the voting equipment, or errors in the HTEC during the audit.
Chapter 3: Post-election Audits in Other States 22
Figure 7: Most States’ Audits Do Not Find Substantial Discrepancies
Source: JLARC staff analysis of information provided by 13 other states and the District of Columbia that conduct post-election audits.
Table 3: States’ Published Audit Reports Typically Validate Election Results State / Election Audited Observation About Audit Result
Minnesota, November 2008 General Election
The voting machines used in the audited precincts were shown to be accurate. Two hundred seven OS machine errors were found, resulting in an accuracy rate of 99.946 percent for the audited machines.
North Carolina, November 2008 General Election
North Carolina concluded that the statistical probability that the declared winner of the presidential race in fact won the North Carolina election was higher than 99.9 percent.
Georgia, November 2006 General Election
The manual audit conducted in three pilot precincts successfully verified that the elec-tronic votes cast matched the votes reported on the VVPAT in every precinct and for every race.
New Mexico, Simulation of 2006 General Election
Average differences between the first machine count and the two person hand count averaged 0.19 percent and differences between the first machine count and the three person hand count averaged 0.13 percent.
Source: JLARC staff analysis of other state audit reports or assessments.
Less than 1%
1% or more
3% or more
5% or more
Large enough to change election results
Number of States
Mag
nitu
de o
f Dis
crep
ancy
Fou
nd
Dur
ing
Audi
t
Often / Every AuditSometimesRarelyNever
4
8
11
11
12
5
5
2
2
2
4
1
1
1
1
0 2 4 6 8 10 12 14
Less than 1%
1% or more
3% or more
5% or more
Large enough to change election results
Number of States
Mag
nitu
de o
f Dis
crep
ancy
Fou
nd
Dur
ing
Audi
t
Often / Every AuditSometimesRarelyNever
4
8
11
11
12
5
5
2
2
2
4
1
1
1
1
0 2 4 6 8 10 12 14
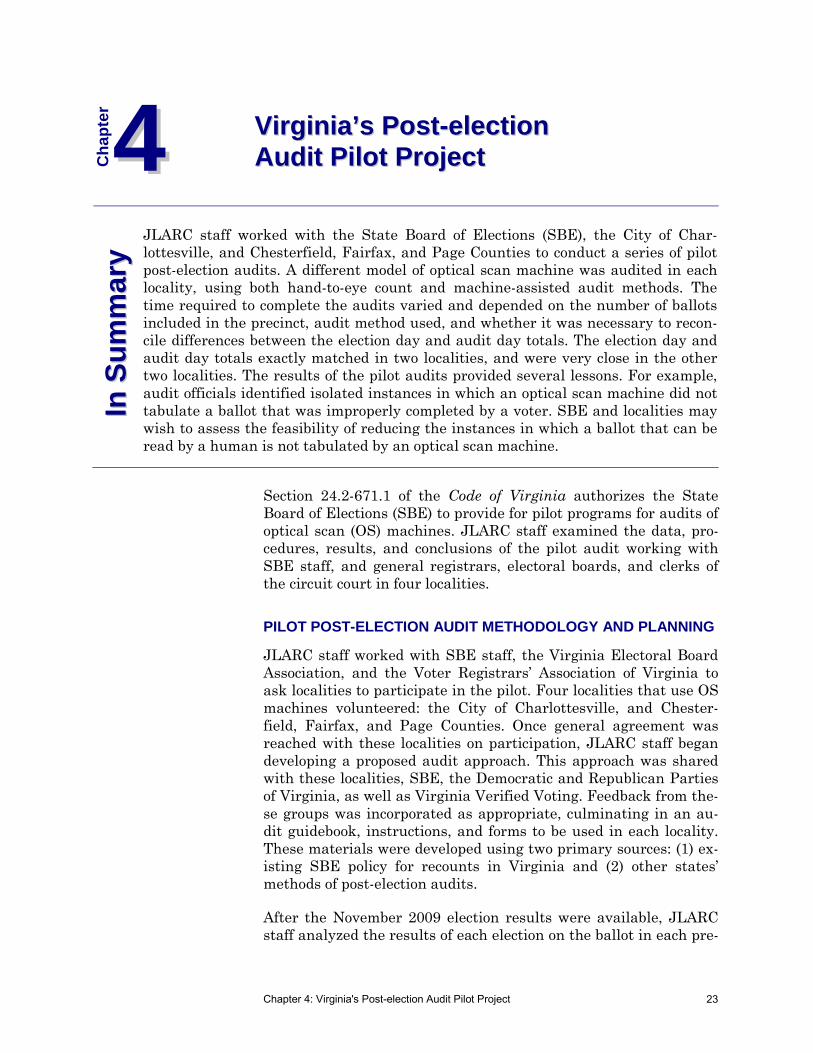
Chapter 4: Virginia's Post-election Audit Pilot Project 23
Section 24.2-671.1 of the Code of Virginia authorizes the State Board of Elections (SBE) to provide for pilot programs for audits of optical scan (OS) machines. JLARC staff examined the data, pro-cedures, results, and conclusions of the pilot audit working with SBE staff, and general registrars, electoral boards, and clerks of the circuit court in four localities.
PILOT POST-ELECTION AUDIT METHODOLOGY AND PLANNING
JLARC staff worked with SBE staff, the Virginia Electoral Board Association, and the Voter Registrars’ Association of Virginia to ask localities to participate in the pilot. Four localities that use OS machines volunteered: the City of Charlottesville, and Chester-field, Fairfax, and Page Counties. Once general agreement was reached with these localities on participation, JLARC staff began developing a proposed audit approach. This approach was shared with these localities, SBE, the Democratic and Republican Parties of Virginia, as well as Virginia Verified Voting. Feedback from the-se groups was incorporated as appropriate, culminating in an au-dit guidebook, instructions, and forms to be used in each locality. These materials were developed using two primary sources: (1) ex-isting SBE policy for recounts in Virginia and (2) other states’ methods of post-election audits.
After the November 2009 election results were available, JLARC staff analyzed the results of each election on the ballot in each pre-
44 Ch
ap
ter
VViirrggiinniiaa’’ss PPoosstt--eelleeccttiioonn AAuuddiitt PPiilloott PPrroojjeecctt
JLARC staff worked with the State Board of Elections (SBE), the City of Char-lottesville, and Chesterfield, Fairfax, and Page Counties to conduct a series of pilot post-election audits. A different model of optical scan machine was audited in eachlocality, using both hand-to-eye count and machine-assisted audit methods. The time required to complete the audits varied and depended on the number of ballots included in the precinct, audit method used, and whether it was necessary to recon-cile differences between the election day and audit day totals. The election day and audit day totals exactly matched in two localities, and were very close in the othertwo localities. The results of the pilot audits provided several lessons. For example, audit officials identified isolated instances in which an optical scan machine did not tabulate a ballot that was improperly completed by a voter. SBE and localities may wish to assess the feasibility of reducing the instances in which a ballot that can beread by a human is not tabulated by an optical scan machine.
II nn SS
uumm
mmaa r
r yy

Chapter 4: Virginia's Post-election Audit Pilot Project 24
cinct in the four participating localities. Races and precincts were selected based on statutory requirements, essentially intended to audit races with substantial margins of victory. More information about this race and precinct selection process can be found in Ap-pendix B.
JLARC staff then notified each candidate on each ballot in each precinct selected for audit. The State and local Democratic and Republican parties were also notified. On January 15, 2010, SBE approved the general approach for the pilot audit project, as well as the required notification to the clerk of the circuit court in each of the four localities that would allow access to the ballots.
PILOT POST-ELECTION AUDIT TIME REQUIREMENTS AND RESULTS
The pilot post-election audits were conducted in February and March 2010 (Table 4). Several different races from elections held in 2009 were audited, and the audits used two different types of audit methods: hand-to-eye count (HTEC) or machine-assisted (MA). The HTEC method, also known as the manual counting method, consists of physically counting the ballots by hand. There are several variations of the HTEC method that were used during the audits, including sorting and stacking the ballots by candidate, and a call and tally method in which one audit official called the vote and the other audit official marked which candidate received the vote on a tally sheet. One of these variations of the HTEC method was used in all four pilot audits. The MA method used in Charlottesville and Fairfax County consisted of feeding the ballots cast on election day back through an OS machine. The audit re-sults were produced by having the machine tabulate the ballots, and then print a tape indicating how many votes each candidate received. Examples of the HTEC and MA audit methods used in two of the localities are shown in Figure 8.
Table 4: JLARC Staff and Localities Conducted Four Post-election Audits Locality Audit Date Race Audited Audit MethodPage County February 3, 2010 2009 Attorney General HTEC
Charlottesville February 18, 2010 2009 Democratic Primary, Governor HTEC and MA
Chesterfield County March 10, 2010 2009 Attorney General HTEC
Fairfax County March 15, 2010 2009 General Assembly, District 45 HTEC and MA
Source: JLARC staff.

Chapter 4: Virginia's Post-election Audit Pilot Project 25
Figure 8: Examples of HTEC and MA Audit Methods
Source: JLARC staff photos taken at the Chesterfield County and Fairfax County post-election audits on March 10 and 15, 2010.
Time Required to Audit a Precinct Varied and Depended on Audit Method, Precinct Size, and Extent of Reconciliation Needed
As shown in Tables 5 and 6, the audits took anywhere from three minutes to more than three hours. Across all audits conducted, be-tween 1.5 and 12.5 ballots were audited per minute, per audit offi-cial. This wide range is due to the different audit methods used, numbers of ballots included in the precinct, and whether reconcili-ation was necessary after obtaining an initial total and comparing it to the election day total. Reconciliation consists of re-
Table 5: HTEC Audit Method Times
Locality Precinct HTEC Variation Used
Reconciliation Required After
First Count Ballots Audited
Audit Time (min)
Ballots Audited / Minute /
Audit Official
Page County 501 Sorting / Stackinga Yes 1,054 193 2.7 Page County 401 Sorting / Stacking Yes 905 112 4.0 Charlottesville Absentee Call and tally No 41 3 6.8 Chesterfield Coun-ty 511 Sorting / Stacking Yes 1,230 111 3.7
Chesterfield Coun-ty 307 Sorting / Stacking Yes 1,212 69 5.9
Fairfax County 408 Sorting Yes 519 71 3.6 Fairfax County 608 Sorting Yes 902 91 5.0 Fairfax County 621 Sorting No 439 28 7.8
a The total number of ballots was tabulated first as a separate step prior to sorting and stacking the ballots by candidate in this pre-cinct. These steps were combined in subsequent HTEC audits. Source: JLARC staff analysis of Virginia post-election audit pilot project.
Ballots Sorted on Tables Using Hand-to-eye Count Method in Chesterfield County
Ballots Tabulated Using Machine-assisted Counting Method in Fairfax County

Chapter 4: Virginia's Post-election Audit Pilot Project 26
Table 6: MA Audit Method Times Locality Precinct Ballots Audited Audit Time (min) Ballots Audited / MinuteCharlottesville Absentee 41 28 1.5 Fairfax County 408 519 50 10.4 Fairfax County 608 902 72 12.5 Fairfax County 621 439 42 10.5
Source: JLARC staff analysis of Virginia post-election audit pilot project.
examining and/or recounting the initial tally to try to find a reason for any differences between the initial audit total and election day total.
In general, the MA method allowed audit officials to count more ballots per minute than using the HTEC method. Variations of the HTEC method were used in some of the localities, which also ap-peared to impact the time required to complete the audit. Audit of-ficials were generally able to audit precincts with fewer ballots in less time. Audits that required reconciliation (that is, re-checking the number of ballots in stacks, or re-checking to make sure candi-date ballots were correctly sorted) generally took more time.
The longest audit was of precinct 501 in Page County. This audit used the most time-consuming variation of the HTEC method, in-cluded 1,054 ballots, and required reconciliation after the first count. The shortest HTEC audit (other than in Charlottesville, which was somewhat of an anomaly because it included only 41 ballots) was of precinct 621 in Fairfax County. This precinct had the fewest ballots (other than in Charlottesville), and no reconcili-ation was required after the first count because it matched the election day total.
Page County Audit Totals Very Close to Election Day Totals
Both precincts audited in Page County used an Optech IIIPE OS machine manufactured by Sequioa Voting Systems. As shown in Figure 9, the election day and audit day totals across both pre-cincts audited were very close. The combined difference between the candidate totals in both precincts audited was 0.33 percent of the total votes cast for each candidate in both precincts.
The audit of precinct 501 concluded that there were four ballots cast for Cuccinelli and two ballots cast for Shannon that were most likely not read by the OS machine, but the voter intent could be determined by the audit official. This resulted in the audit day to-tal being 0.59 percent higher for Cucinnelli and 0.65 percent high-er for Shannon (Table 8 at the end of this chapter summarizes all candidate totals and differences for each precinct audited).
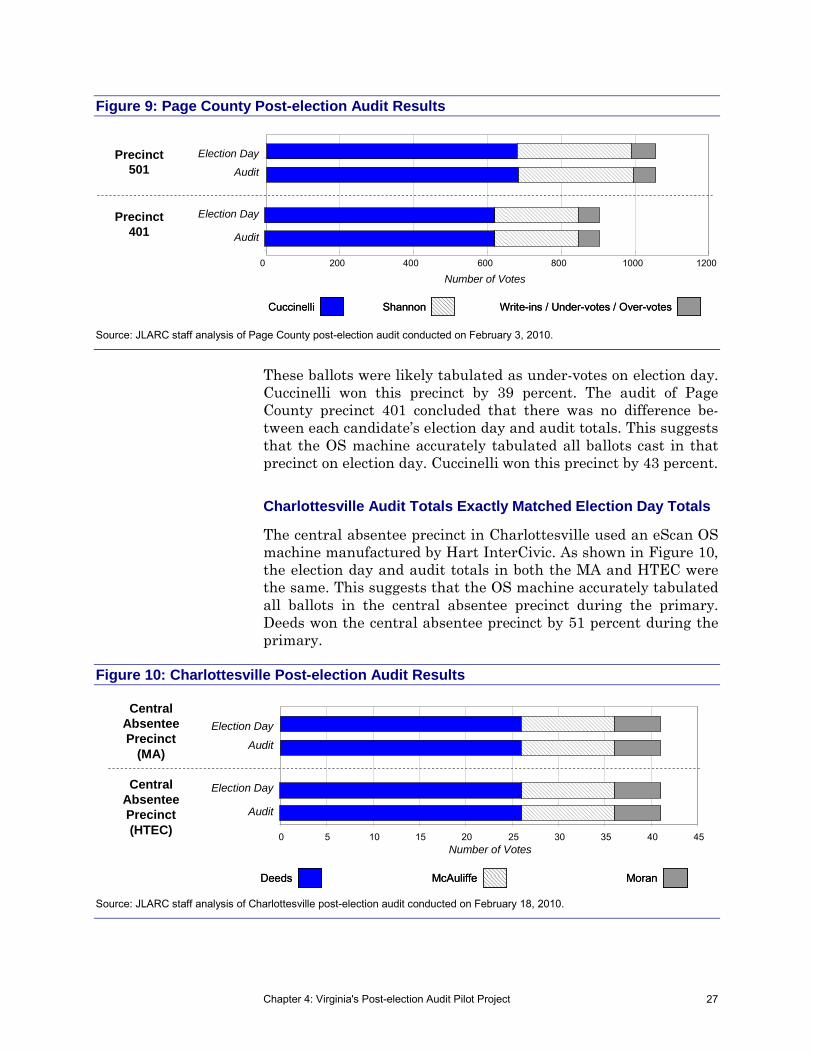
Chapter 4: Virginia's Post-election Audit Pilot Project 27
Figure 9: Page County Post-election Audit Results
Source: JLARC staff analysis of Page County post-election audit conducted on February 3, 2010.
These ballots were likely tabulated as under-votes on election day. Cuccinelli won this precinct by 39 percent. The audit of Page County precinct 401 concluded that there was no difference be-tween each candidate’s election day and audit totals. This suggests that the OS machine accurately tabulated all ballots cast in that precinct on election day. Cuccinelli won this precinct by 43 percent.
Charlottesville Audit Totals Exactly Matched Election Day Totals
The central absentee precinct in Charlottesville used an eScan OS machine manufactured by Hart InterCivic. As shown in Figure 10, the election day and audit totals in both the MA and HTEC were the same. This suggests that the OS machine accurately tabulated all ballots in the central absentee precinct during the primary. Deeds won the central absentee precinct by 51 percent during the primary.
Figure 10: Charlottesville Post-election Audit Results
Source: JLARC staff analysis of Charlottesville post-election audit conducted on February 18, 2010.
0 200 400 600 800 1000 1200
Election Day
Audit
Election Day
Audit
Write-ins / Under-votes / Over-votesShannonCuccinelli Write-ins / Under-votes / Over-votesShannonCuccinelli
Precinct 501
Precinct 401
Number of Votes
Election Day
Audit
Election Day
Audit
MoranMcAuliffeDeeds MoranMcAuliffeDeeds
Central Absentee Precinct
(MA)
Central Absentee Precinct (HTEC) 0 5 10 15 20 25 30 35 40 45
Number of Votes
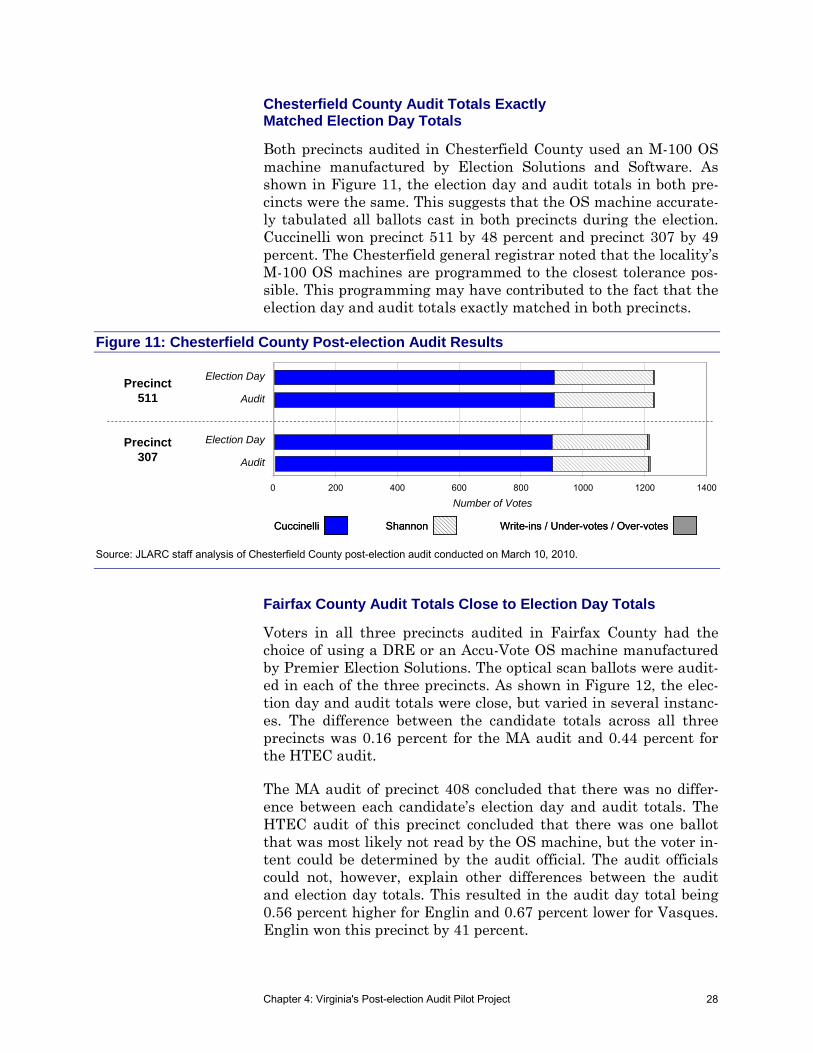
Chapter 4: Virginia's Post-election Audit Pilot Project 28
Chesterfield County Audit Totals Exactly Matched Election Day Totals
Both precincts audited in Chesterfield County used an M-100 OS machine manufactured by Election Solutions and Software. As shown in Figure 11, the election day and audit totals in both pre-cincts were the same. This suggests that the OS machine accurate-ly tabulated all ballots cast in both precincts during the election. Cuccinelli won precinct 511 by 48 percent and precinct 307 by 49 percent. The Chesterfield general registrar noted that the locality’s M-100 OS machines are programmed to the closest tolerance pos-sible. This programming may have contributed to the fact that the election day and audit totals exactly matched in both precincts.
Figure 11: Chesterfield County Post-election Audit Results
Source: JLARC staff analysis of Chesterfield County post-election audit conducted on March 10, 2010.
Fairfax County Audit Totals Close to Election Day Totals
Voters in all three precincts audited in Fairfax County had the choice of using a DRE or an Accu-Vote OS machine manufactured by Premier Election Solutions. The optical scan ballots were audit-ed in each of the three precincts. As shown in Figure 12, the elec-tion day and audit totals were close, but varied in several instanc-es. The difference between the candidate totals across all three precincts was 0.16 percent for the MA audit and 0.44 percent for the HTEC audit.
The MA audit of precinct 408 concluded that there was no differ-ence between each candidate’s election day and audit totals. The HTEC audit of this precinct concluded that there was one ballot that was most likely not read by the OS machine, but the voter in-tent could be determined by the audit official. The audit officials could not, however, explain other differences between the audit and election day totals. This resulted in the audit day total being 0.56 percent higher for Englin and 0.67 percent lower for Vasques. Englin won this precinct by 41 percent.
Election Day
Audit
Election Day
Audit
Precinct 511
Precinct 307
Write-ins / Under-votes / Over-votesShannonCuccinelli Write-ins / Under-votes / Over-votesShannonCuccinelli
0 200 400 600 800 1000 1200 1400
Number of Votes

Chapter 4: Virginia's Post-election Audit Pilot Project 29
Figure 12: Fairfax County Post-election Audit Results
Source: JLARC staff analysis of Fairfax County post-election audit conducted on March 15, 2010.
The MA audit of precinct 608 concluded that that the OS machine counted one more ballot than what was counted on election day. Audit officials hypothesized that two votes attributed to candidates were likely votes that the machine was unable to read on election day and tabulated as under-votes, while a third additional vote at-tributed to one of the candidates was likely the additional ballot not counted on election night. The fact that the audit yielded one more ballot than the election night was difficult to explain. This resulted in the audit day total being 0.34 percent higher for Englin and 0.33 percent higher for Vasques. Englin won this precinct by 33 percent.
The HTEC audit of precinct 608 concluded that the election day and audit totals differed for a variety of reasons, some potentially explainable and others not as explainable. Audit officials hypothe-sized that four of the additional votes they had attributed to can-didates were likely counted as under-votes by the OS machine on election day because the ballots were not completed according to the instructions given. They also concluded that a fifth additional
Election Day
Audit
Election Day
Audit
Precinct 408 (MA)
Precinct 608 (MA)
Write-ins / Under-votes / Over-votesEnglinVasques Write-ins / Under-votes / Over-votesEnglinVasques
Precinct 621 (MA)
Election Day
Audit
Election Day
Audit
Election Day
Audit
Precinct 408
(HTEC)
Precinct 608
(HTEC)
Precinct 621
(HTEC)
Election Day
Audit
0 100 200 300 400 500 600 700 800 900 1000
0 100 200 300 400 500 600 700 800 900 1000Number of Votes

Chapter 4: Virginia's Post-election Audit Pilot Project 30
vote they had attributed to a candidate was likely the extra ballot that had not been counted on election day. However, it is unclear why a sixth vote had been attributed to a candidate, and—as with the MA audit—why one more ballot was counted during the audit than on election day. This resulted in the audit day total being 0.68 percent higher for Englin and 0.33 percent higher for Vasques. Englin’s margin of victory in this precinct was 33 per-cent.
Both the MA and HTEC audits of precinct 621 concluded there was no difference between each candidate’s election day totals and au-dit totals. This suggests that the OS machine accurately tabulated all ballots cast in that precinct on election day. Englin won this precinct by 25 percent on election day.
More detailed information about each of the four pilot audits dis-cussed above is in Appendix C.
LESSONS LEARNED FROM VIRGINIA’S POST-ELECTION AUDIT PILOT PROJECT
Collectively, the findings from the four pilot audits provide some important lessons. The experiences of using varying audit methods and auditing precincts of varying sizes illustrated the differences between the two main audit methods. In addition, having access to optical scan ballots completed by voters provided information about the different ways voters complete ballots and the extent to which they can be read by a machine if not properly completed. Most importantly, the individual and collective error rates of the audits provide insight into the security, accuracy, and reliability of four different types of OS machines used in Virginia.
HTEC and MA Audit Methods Have Differences
The HTEC and MA audit methods used across the pilots, including the variations on the HTEC method, are different in terms of their ability to perform an audit quickly, tabulate votes accurately, and reconcile results completely (Table 7). In terms of the speed with which the audit can be completed, a HTEC is likely more efficient in precincts with smaller numbers of ballots because there is less set-up time required than with a MA audit. In addition to the ma-chine’s set-up, logic and accuracy testing, and break down, each ballot must be individually fed into the machine by an audit offi-cial (though some types of OS machines can be fitted with an au-tomatic ballot feeder). As the number of ballots increases, though, a machine can tabulate more ballots in a given period of time than a human can. This has the effect of reducing the role that machine set-up, logic and accuracy testing, and break down play in the total time of the audit.
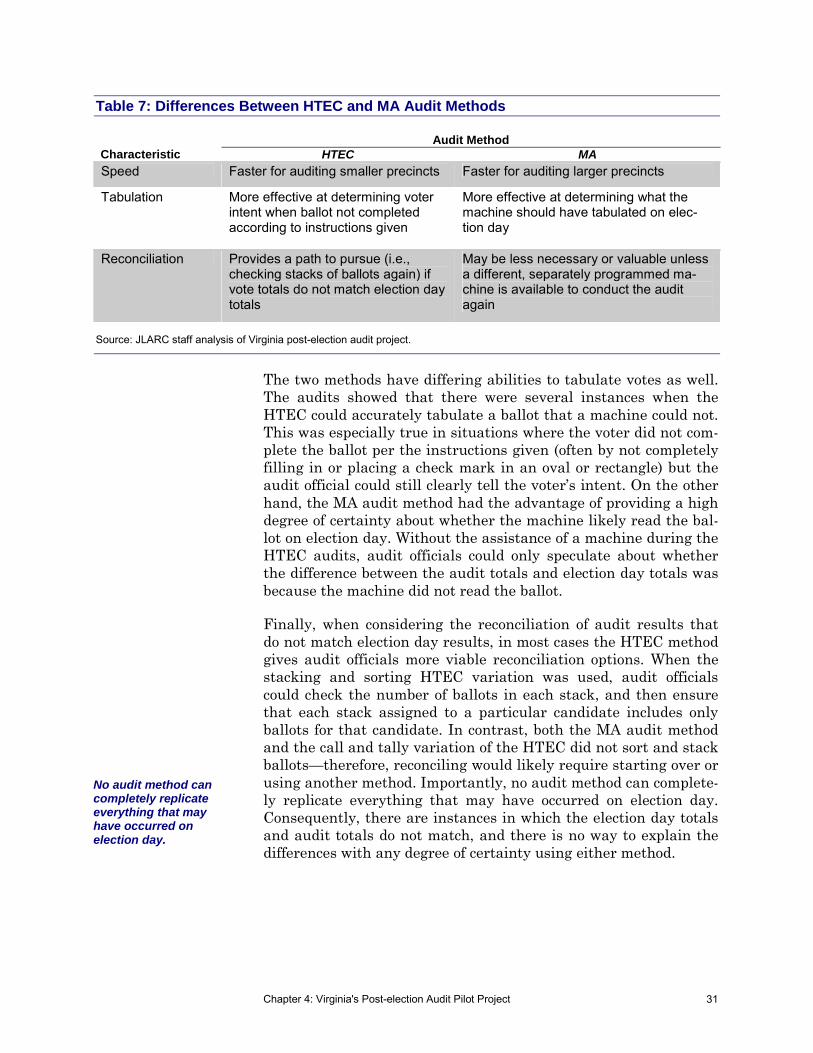
Chapter 4: Virginia's Post-election Audit Pilot Project 31
Table 7: Differences Between HTEC and MA Audit Methods
Characteristic Audit Method
HTEC MA Speed Faster for auditing smaller precincts Faster for auditing larger precincts
Tabulation More effective at determining voter intent when ballot not completed according to instructions given
More effective at determining what the machine should have tabulated on elec-tion day
Reconciliation Provides a path to pursue (i.e., checking stacks of ballots again) if vote totals do not match election day totals
May be less necessary or valuable unless a different, separately programmed ma-chine is available to conduct the audit again
Source: JLARC staff analysis of Virginia post-election audit project.
The two methods have differing abilities to tabulate votes as well. The audits showed that there were several instances when the HTEC could accurately tabulate a ballot that a machine could not. This was especially true in situations where the voter did not com-plete the ballot per the instructions given (often by not completely filling in or placing a check mark in an oval or rectangle) but the audit official could still clearly tell the voter’s intent. On the other hand, the MA audit method had the advantage of providing a high degree of certainty about whether the machine likely read the bal-lot on election day. Without the assistance of a machine during the HTEC audits, audit officials could only speculate about whether the difference between the audit totals and election day totals was because the machine did not read the ballot.
Finally, when considering the reconciliation of audit results that do not match election day results, in most cases the HTEC method gives audit officials more viable reconciliation options. When the stacking and sorting HTEC variation was used, audit officials could check the number of ballots in each stack, and then ensure that each stack assigned to a particular candidate includes only ballots for that candidate. In contrast, both the MA audit method and the call and tally variation of the HTEC did not sort and stack ballots—therefore, reconciling would likely require starting over or using another method. Importantly, no audit method can complete-ly replicate everything that may have occurred on election day. Consequently, there are instances in which the election day totals and audit totals do not match, and there is no way to explain the differences with any degree of certainty using either method.
No audit method can completely replicate everything that may have occurred on election day.
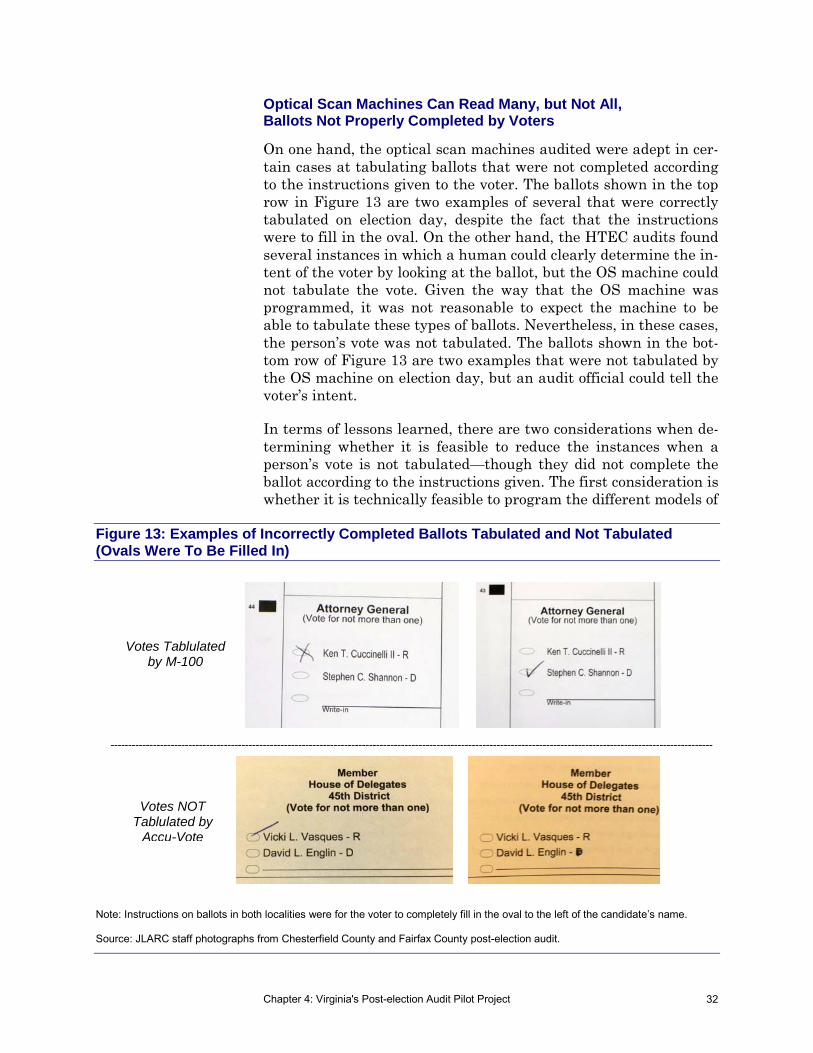
Chapter 4: Virginia's Post-election Audit Pilot Project 32
Optical Scan Machines Can Read Many, but Not All, Ballots Not Properly Completed by Voters
On one hand, the optical scan machines audited were adept in cer-tain cases at tabulating ballots that were not completed according to the instructions given to the voter. The ballots shown in the top row in Figure 13 are two examples of several that were correctly tabulated on election day, despite the fact that the instructions were to fill in the oval. On the other hand, the HTEC audits found several instances in which a human could clearly determine the in-tent of the voter by looking at the ballot, but the OS machine could not tabulate the vote. Given the way that the OS machine was programmed, it was not reasonable to expect the machine to be able to tabulate these types of ballots. Nevertheless, in these cases, the person’s vote was not tabulated. The ballots shown in the bot-tom row of Figure 13 are two examples that were not tabulated by the OS machine on election day, but an audit official could tell the voter’s intent.
In terms of lessons learned, there are two considerations when de-termining whether it is feasible to reduce the instances when a person’s vote is not tabulated—though they did not complete the ballot according to the instructions given. The first consideration is whether it is technically feasible to program the different models of
Figure 13: Examples of Incorrectly Completed Ballots Tabulated and Not Tabulated (Ovals Were To Be Filled In)
Note: Instructions on ballots in both localities were for the voter to completely fill in the oval to the left of the candidate’s name. Source: JLARC staff photographs from Chesterfield County and Fairfax County post-election audit.
Votes Tablulated by M-100
Votes NOT Tablulated by
Accu-Vote
--------------------------------------------------------------------------------------------------------------------------------------------------------------------------

Chapter 4: Virginia's Post-election Audit Pilot Project 33
OS machines used in Virginia to better detect these types of bal-lots. Each type of machine has various thresholds for the minimum percentage of the area (whether it is an oval, rectangle, or line that must be completed) that can be marked by a voter and still be read by the machine.
Even if it is technically feasible, the logistical feasibility of ad-dressing the issue also needs to be considered. Even if machines could be better programmed to detect instances in which they could not read a vote, the only likely recourse would be to notify the voter and give him or her the opportunity to improve the mark placed on the ballot. During busy times in a precinct on election day, this could cause potentially disruptive back-ups at the optical scan machine. When asked on the JLARC staff survey of Virginia general registrars, 41 of the 64 responding to the question—about two-thirds—thought programming their machines to alert voters about this could be either mildly or not very disruptive to voting at their precincts. Nine general registrars believed this could be high-ly disruptive, while 14 believed it could be disruptive.
Because such ballots represent instances in which a voter believes he or she has voted for a candidate, but in fact his or her vote is not counted, SBE and localities may wish to assess this issue fur-ther. The assessment could consider both the technical feasibility and potential disruptive impact in precincts. The assessment could also examine the various methods of addressing the issue, which may include more precise programming of OS machines, more rig-orous logic and accuracy testing, and/or changes to voter instruc-tions or election day procedures.
Differences Between Election Day and Audit Results Would Not Change Election Outcome in All But Closest Elections
The voting equipment certification standards in place when most of Virginia’s voting equipment was purchased note that the error rate is “set at a sufficiently stringent level such that the likelihood of voting system errors affecting the outcome of an election is ex-ceptionally remote even in the closest of elections.” Considering this standard, none of the observed differences between the elec-tion day totals and audit day totals were large enough to affect the election day outcome.
As shown in Table 8, across all 12 audits conducted, the difference between election day and audit totals was 0.21 percent of all can-didate vote totals on election day. In eight of the 12 precincts au-dited (counting each HTEC and each MA count as a separate audit activity), the election day and audit results matched exactly. In the remaining four precinct audits, there were differences of several
Machine Error Rate
Voting equipment certi-fication standards re-quire machines to read at least 1,549,703 con-secutive ballot posi-tions correctly. Howev-er, because the pilot project design included counting only a single race, consecutive bal-lot positions—or all possible selections on the ballot—were not measured. Conse-quently, the difference between election day and audit totals for the pilot project cannot be readily compared to the certified error rate for the machines audit-ed.
Because such ballots represent instances in which a voter be-lieves he or she has voted for a candidate, but in fact his or her vote is not counted, SBE and localities may wish to assess this issue further.
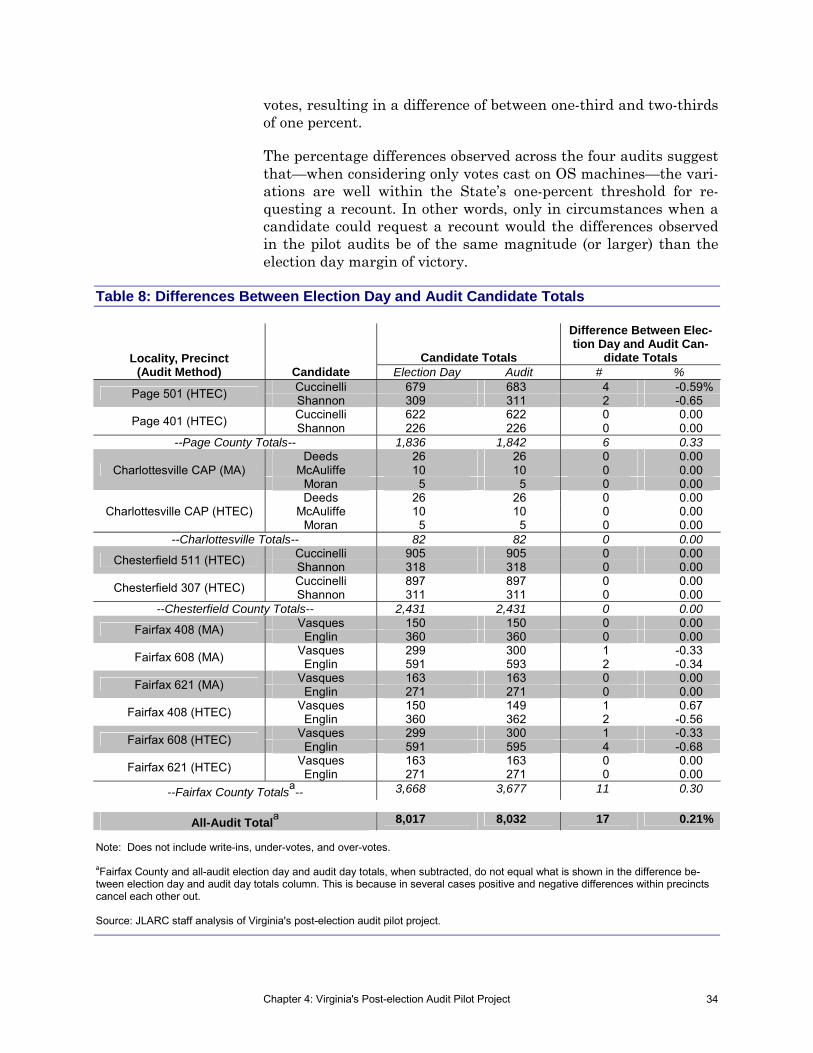
Chapter 4: Virginia's Post-election Audit Pilot Project 34
votes, resulting in a difference of between one-third and two-thirds of one percent.
The percentage differences observed across the four audits suggest that—when considering only votes cast on OS machines—the vari-ations are well within the State’s one-percent threshold for re-questing a recount. In other words, only in circumstances when a candidate could request a recount would the differences observed in the pilot audits be of the same magnitude (or larger) than the election day margin of victory.
Table 8: Differences Between Election Day and Audit Candidate Totals
Locality, Precinct (Audit Method) Candidate
Candidate Totals
Difference Between Elec-tion Day and Audit Can-
didate Totals Election Day Audit # %
Page 501 (HTEC) Cuccinelli 679 683 4 -0.59% Shannon 309 311 2 -0.65
Page 401 (HTEC) Cuccinelli 622 622 0 0.00 Shannon 226 226 0 0.00
--Page County Totals-- 1,836 1,842 6 0.33
Charlottesville CAP (MA) Deeds 26 26 0 0.00
McAuliffe 10 10 0 0.00 Moran 5 5 0 0.00
Charlottesville CAP (HTEC) Deeds 26 26 0 0.00
McAuliffe 10 10 0 0.00 Moran 5 5 0 0.00
--Charlottesville Totals-- 82 82 0 0.00
Chesterfield 511 (HTEC) Cuccinelli 905 905 0 0.00 Shannon 318 318 0 0.00
Chesterfield 307 (HTEC) Cuccinelli 897 897 0 0.00 Shannon 311 311 0 0.00
--Chesterfield County Totals-- 2,431 2,431 0 0.00
Fairfax 408 (MA) Vasques 150 150 0 0.00 Englin 360 360 0 0.00
Fairfax 608 (MA) Vasques 299 300 1 -0.33 Englin 591 593 2 -0.34
Fairfax 621 (MA) Vasques 163 163 0 0.00 Englin 271 271 0 0.00
Fairfax 408 (HTEC) Vasques 150 149 1 0.67 Englin 360 362 2 -0.56
Fairfax 608 (HTEC) Vasques 299 300 1 -0.33 Englin 591 595 4 -0.68
Fairfax 621 (HTEC) Vasques 163 163 0 0.00 Englin 271 271 0 0.00
--Fairfax County Totalsa-- 3,668 3,677 11 0.30
All-Audit Totala 8,017 8,032 17 0.21%
Note: Does not include write-ins, under-votes, and over-votes. aFairfax County and all-audit election day and audit day totals, when subtracted, do not equal what is shown in the difference be-tween election day and audit day totals column. This is because in several cases positive and negative differences within precincts cancel each other out. Source: JLARC staff analysis of Virginia's post-election audit pilot project.
Chapter 5: Time, Expenditures, and Statistical Considerations 35
JLARC staff reviewed alternative procedures and processes for post-election audits, estimated the time requirements and costs of post-election audits, and considered the statistical confidence of different audit strategies. As noted in Chapter 3, other states em-ploy two main statistical audit strategies. Most states that require post-election audits use a fixed-percentage (FP) audit strategy, while a smaller but growing number use an adjustable-percentage (AP) or combined strategy. As noted in Chapters 3 and 4, there are also several audit methods, which can be categorized as either hand-to-eye count (HTEC) or machine-assisted (MA).
JLARC staff developed and applied a hypothetical audit approach to Virginia’s current electoral environment. For comparative pur-poses, the approach was applied using both the FP and AP audit strategies, as well as the HTEC and MA audit methods.
HYPOTHETICAL AUDIT APPROACH AND ASSUMPTIONS
In order to provide reasonable time and expenditure estimates, JLARC staff compiled information about each of Virginia’s locali-ties. This information included whether the locality used direct re-cording equipment (DRE), optical scan (OS) machines, or a mix of both; the number of precincts in the locality; and the number of registered voters in each precinct. JLARC staff then developed a hypothetical audit approach and made a series of assumptions about how post-election audits could be implemented in Virginia. The approach and assumptions were then applied to the informa-
Ch
ap
ter
55
TTiimmee,, EExxppeennddiittuurreess,, aanndd SSttaattiissttiiccaall CCoonnssiiddeerraattiioonnss
There are two primary statistical strategies for choosing the post-election audit sample size: the fixed-percentage (FP) strategy and the adjustable-percentage (AP) strategy. The strategy used to create the audit sample affects the ability to plan for the audit, the level of statistical confidence, the time required to conduct the audit, and the expenditures required to complete the audit. While the FP strategy is easier to plan for, it may not provide statistical confidence in the election outcome. The AP strategy does provide a high degree of statistical confidence, but its variable sample size makes it more difficult to plan for. An FP audit could require 5.5 to 6.2 hours, on average, to complete in each of Virginia’s 134 localities. In total, all localities in Virginia could spend up to $148,000 to conduct an FP audit. In contrast, an average AP audit would involve fewer localities and require them to spend less time and money. However, in elections with small margins of victory, an AP audit could re-quire almost the same amount of time and cost associated with a full recount.
II nn SS
uumm
mmaa r
r yy

Chapter 5: Time, Expenditures, and Statistical Considerations 36
tion about each Virginia locality, resulting in information about the time, expenditures, and statistical considerations for various audit strategies and methods.
Hypothetical Audit Approach for Basis of Time and Expenditure Estimates
The hypothetical approach is based on JLARC staff research into other states’ post-election audit approaches, interviews with and surveys of those knowledgeable about post-election audits, and in-formation collected during Virginia’s post-election pilot project. Whether a FP or AP audit strategy is employed, the post-election audit approach used by Virginia would likely consist of the same two main phases: pre-audit and audit and closeout (Figure 13). During the pre-audit phase, SBE would randomly select precincts at the local level to be included in the audit sample. Localities and SBE would then coordinate as necessary to notify affected candi-dates, political parties, and others who may be interested in ob-serving the audit, of the audit details. Localities would then coor-dinate internally among the general registrar, electoral board, and clerk of the circuit court to ensure access to the key items needed for the audit, including ballots and voting equipment.
Figure 13: Hypothetical Approach for Post-election Audits
Source: JLARC staff analysis of other states' audit approaches, interviews and survey, and Virginia post-election audit pilot project.
II.D -Locality
documents and publicizes
audit results
II.B.1 –Reconciliation,
such as additional auditing or recounting,
conducted as needed
I. Pre-Audit II. Audit and Closeout
I.A - SBE randomly selects
precincts for sample
I.C -Localities coordinate as necessary to
ensure ballots, voting
equipment, memory cards,
and location available for
auditI.B -Localities and SBE
coordinate to notify affected candidates,
political parties, and interested public of precincts
selected, audit location, date,
and time
II.A - General Registrars,
staff, and audit officials
conduct audit using
appropriate method,
depending on voting
equipment used
I.D -Localities gather needed supplies and materials for
audit
II.B - Audit tally
compared to election
night tally
II.C - Ballots, voting
equipment, memory cards re-sealed and
returned to storage
Do tallies
match?
YES
NO

Chapter 5: Time, Expenditures, and Statistical Considerations 37
In the pre-audit phase, each general registrar would also be re-sponsible for determining how the audit would be staffed. At a minimum, there would likely be someone serving as an audit coor-dinator and two other people serving as audit officials. Staff with knowledge of the voting equipment being audited, the locality’s voting equipment vendor, as well as administrative support staff may also need to participate in certain parts of the audit.
The audit and closeout phase would consist of conducting the audit itself, with the specific process, resources, and time required vary-ing depending on what type of voting equipment the locality uses and what audit method is used. Once the counting is completed, the audit tally would then be compared to the election night tally. If the tallies are the same, then the locality would re-seal and re-turn the ballots, voting equipment, and other materials to storage. However, if the tallies do not match, audit officials would attempt to reconcile the difference by re-examining and/or recounting their initial tally to try to find the reason for the discrepancy. Once the audit tallies match or the likely reason for the discrepancy is iden-tified, the audit then would conclude with the locality documenting and publicizing the result of the audit.
Key Assumptions Used by JLARC Staff to Calculate Audit Time and Expenditure Estimates
There are several important assumptions about how post-election audits would be implemented in Virginia that impact how much time and money might be involved if audits were required. For each of the time and expenditure estimates that follow in this chapter, JLARC staff have made a series of baseline assumptions. In addition, variations from these baseline assumptions are also shown to illustrate their impact on the time and expenditure esti-mates. When possible, these assumptions are based on existing procedures and actual data about Virginia’s localities. Three key assumptions are made in the baseline estimates:
A machine-assisted audit method would be used. Though the majority of other states use an HTEC method and computer scientists express concern about auditing DRE memory cards, Virginia’s current recount procedures require a MA method. When asked on the JLARC staff survey of Virginia general registrars, adopting the current recount procedures was the most frequently-cited way to conduct an audit on both DREs and OS machines. Consequently, JLARC staff have assumed the most likely method used for audits in Vir-ginia would be the MA method.
Many localities would require assistance from their voting equipment vendor to program their DRE and OS machines to
Chapter 5: Time, Expenditures, and Statistical Considerations 38
conduct a machine-assisted audit. MA audits would require each locality to prepare their voting equipment and/or com-puters to analyze memory cards from their DREs and/or re-accept OS ballots. Some localities in Virginia report currently having the capability to do this “in-house,” while others re-port they would require assistance from their voting equip-ment vendor. According to the Brennan Center for Justice at New York University Law School, this need for vendor assis-tance is among the most significant factors that determines what a locality—and by extension the State collectively—would spend if audits were required. Where possible, JLARC staff used estimates made by localities of what they would pay their vendor for assistance in preparing for an audit.
Localities would pay citizens to help conduct the audit of OS machines, but not DREs. The process of analyzing a DRE memory card is not time-consuming, and something that could be done by existing staff (or vendors) in most Virginia general registrar offices. However, either feeding ballots into an OS machine or hand-counting OS ballots—particularly in precincts with high numbers of voters or in multiple pre-cincts—would likely require the assistance of other people to serve as audit officials. In these cases, the locality could use a subset of those who serve as election officials on election day, and pay them on a pro-rated basis for their work. Where pos-sible, the actual amount that localities pay election officials was used in the estimates made by JLARC staff.
SAMPLE SIZE, STATISTICAL CONSIDERATIONS, TIME, AND EXPENDITURES IF VIRGINIA IMPLEMENTED A FIXED-PERCENTAGE AUDIT STRATEGY
A 2007 paper co-authored by the Brennan Center for Justice at New York University School of Law and the Samuelson Law, Technology, and Public Policy Clinic at the University of Califor-nia, Berkeley School of Law provides a definition for a fixed-percentage (FP) post-election audit:
Jurisdictions are required to randomly select a fixed per-centage of precincts or machines to audit. All voter verifi-able paper records for the selected precincts or machines are hand-counted and compared to the electronic tallies.
Fixed-Percentage Audit Features Stable Sample Size, but Is Not Intended to Provide Statistical Confidence About Election Outcome
The primary purpose of the FP audit strategy is to check the secu-rity, accuracy, and reliability of the voting equipment used on elec-

Chapter 5: Time, Expenditures, and Statistical Considerations 39
tion day. The FP audit strategy features a stable, constant sample size that does not vary based on the margin of victory. This strat-egy is not necessarily intended to provide a particular degree of statistical confidence that the election outcome was correct. As shown in Table 9, a FP audit of one percent of the State’s precincts would result in a sample size of 135 precincts and an estimated 138,937 ballots. Each locality would be required to audit one pre-cinct, and Fairfax County, which has more than 200 precincts, would be required to audit two precincts. An important considera-tion is that in most localities, one percent of precincts is far less than one precinct. As a result, in cases where one percent of pre-cincts was less than one precinct, JLARC staff assumed that one full precinct would be audited. For example, Augusta County has 25 precincts and a one percent audit would call for auditing one-quarter of a precinct, which is not currently possible. The inability to audit a portion of a precinct means that four percent of the county’s precincts would be audited when only one percent was necessary according to the sample strategy.
The number of precincts and ballots included in the sample would increase as larger fixed-percentage sample sizes are chosen. How-ever, once a fixed-percentage sample size is chosen, whether it is one, three, five, or some higher percentage, the number of pre-cincts does not change from election to election. This stability in sample size facilitates planning at both the State and local levels for the time and expenditures that would be necessary if fixed-audits were required.
Table 9: Precincts and Ballots Included in Fixed-Percentage Audit of One, Three, and Five Percent of Precincts
Fixed-Percentage # of Precincts
in Sample Estimated # of Ballots Included
in Precincts Sampled 1 135 138,937 3 151 162,524 5 175 196,550
Note: Estimates assume (1) statewide voter turnout of 55percent among 4.97 million registered Virginia voters in 2,363 precincts (excluding central absentee precincts); (2) precinct for audit in each locality is chosen randomly after the election has occurred; (3) the chosen precinct has the average number of voters in a given precinct for the locality; and (4) in localities with fewer than 100 precincts, one entire precinct would be audited. Source: JLARC staff analysis.
FP Strategy Could Take Each Locality, On Average, 5.5 to 6.2 Hours
If Virginia were to require FP audits, each locality could take, on average, slightly more than half a day to complete the pre-audit and audit and closeout phases. Using a baseline scenario that as-
… in most localities, one percent of pre-cincts is far less than one precinct.

Chapter 5: Time, Expenditures, and Statistical Considerations 40
sumes that both DREs and OS machines are subject to audit and that a MA method is used, it would take approximately 5.5 hours for an average locality to complete a one-percent audit (Table 10). It would take an average locality only slightly longer, 5.8 hours and 6.2 hours, to complete a three- and five-percent audit, respec-tively. As the audit sample size increases 200 percent from one percent to three percent, the audit time only increases about 13 percent. These small increases in average audit time even as the sample size increases can be explained by two factors:
The dynamic noted above whereby one, three, and five per-cent is still well below a single precinct in many localities. Consequently, many localities still audit a single precinct as the sample size increases.
The large role that the pre-audit activities play in the time of the total audit. In many cases, it could take longer to coordi-nate within the locality and secure access to the needed audit materials than it could to actually conduct the audit. This is especially true for localities using only DREs.
These averages mask a wide variation in the time it might take a small locality compared to a larger locality. For example, a large locality such as Virginia Beach would audit five precincts in a five- percent audit, which would take a single audit team an estimated 14.8 hours. A smaller locality such as Surry County would still au-dit one precinct in a five-percent audit, taking a single audit team about 2.4 hours.
If the HTEC method rather than a MA audit method were used, it would take slightly less time to conduct a one-percent audit. This dynamic occurs because time is saved with smaller samples by not having to prepare voting equipment to be used in the audit. Be-cause of the large percentage of localities using DREs—which are therefore unaffected by using the HTEC rather than the MA meth-od—even very large sample sizes take less time statewide when the HTEC method is used.
Table 10: Estimated Average Time Per Locality to Conduct Fixed-Percentage Audit Based on Various Assumptions
Fixed-Percentage (Average Locality Audit Time in Hours) 1% Sample 3% Sample 5% Sample Baseline Scenarioa 5.5 5.8 6.2 OS Hand-to-eye Count 5.0 5.3 5.7
a Baseline scenario assumes (1) DRE and OS machines are both subject to audit; (2) MA rather than HTEC audit method is used to
audit OS machines, and (3) localities with both DREs and OS machines conduct the audit of each type of equipment sequentially, rather than simultaneously. Source: JLARC staff analysis.

Chapter 5: Time, Expenditures, and Statistical Considerations 41
FP Strategy Could Require Up to $148,000 in Expenditures
A one-percent audit could cost about $145,000 statewide, assuming that: both DREs and OS machines are subject to audit, a MA method is used, localities need to pay IT vendor fees, and localities with OS machines pay audit officials. A three-percent audit could cost about $146,000. A five-percent audit could cost just under $148,000.
Depending on the audit sample size and variations in the baseline assumptions, a FP audit could cost anywhere between about $9,000 and $148,000, statewide (Table 11). This wide range is driven less by the size of the audit sample and more by changes to the baseline assumptions. This is illustrated most clearly by the large drop in potential expenditures when no IT vendor fees are included. Removing these IT vendor support fees from the estimate significantly reduces the cost, and therefore cost per ballot, down to $0.06. This lower cost per ballot estimate that does not include IT vendor fees is more consistent with the cost per ballot figures reported by several other states highlighted in Chapter 3. This suggests that (1) these other state estimates do not include these IT vendor fees, and/or (2) the vendor fees are not relevant in other state audits using the HTEC method.
Using a HTEC method rather than a MA method would cost be-tween $85,000 and $90,000. This is lower than the baseline sce-nario estimate because localities would not need to pay IT vendor fees to prepare to audit their OS machines. This would not affect, however, the localities that would still need IT vendor assistance to analyze their DRE memory cards.
The $145,267 in expenditures for a one-percent audit would be, on average, $1,084 for each of Virginia’s 134 localities. However, ac-tual expenditures for any given locality would vary depending on
Table 11: Estimated Total Statewide Expenditure Estimates for Fixed-Percentage Audit Based on Various Assumptions Fixed-Percentage 1% Sample 3% Sample 5% Sample
$ $ / Ballot $ $ / Ballot $ $ / Ballot Baseline Scenarioa $145,267 $1.05 $146,252 $0.90 $147,928 $0.75 OS Hand-to-eye Count 85,756 0.62 87,235 0.54 89,404 0.45 No IT Vendor Fees 8,674 0.06 9,660 0.06 11,336 0.06
a Baseline scenario assumes (1) DRE and OS machines are both subject to audit; (2) MA rather than HTEC audit method is used to
audit OS machines; (3) localities with both DREs and OS machines conduct the audit of each type of equipment sequentially rather than simultaneously; (4) localities with OS machines pay audit officials the equivalent of a half day of work per precinct counted calculated using a locality-reported average of the daily rate paid to election officials; and (5) localities without programming ability will pay their vendor a fee to program their equipment for the audit. Source: JLARC staff analysis.
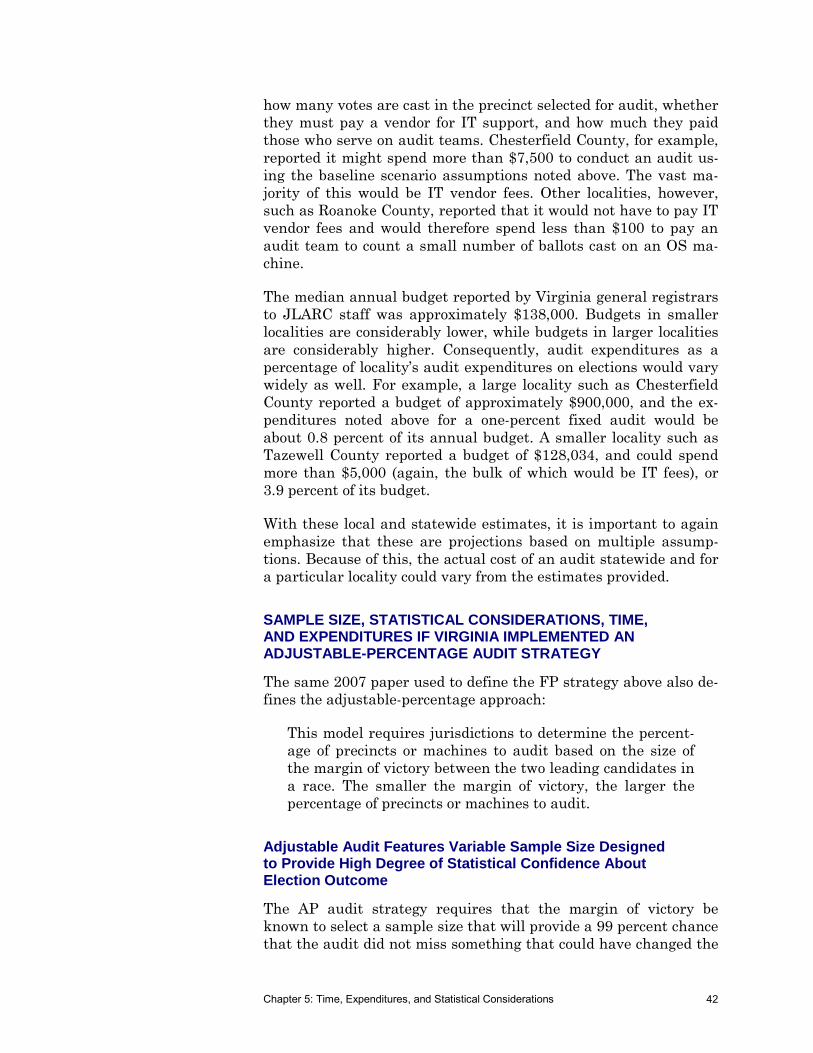
Chapter 5: Time, Expenditures, and Statistical Considerations 42
how many votes are cast in the precinct selected for audit, whether they must pay a vendor for IT support, and how much they paid those who serve on audit teams. Chesterfield County, for example, reported it might spend more than $7,500 to conduct an audit us-ing the baseline scenario assumptions noted above. The vast ma-jority of this would be IT vendor fees. Other localities, however, such as Roanoke County, reported that it would not have to pay IT vendor fees and would therefore spend less than $100 to pay an audit team to count a small number of ballots cast on an OS ma-chine.
The median annual budget reported by Virginia general registrars to JLARC staff was approximately $138,000. Budgets in smaller localities are considerably lower, while budgets in larger localities are considerably higher. Consequently, audit expenditures as a percentage of locality’s audit expenditures on elections would vary widely as well. For example, a large locality such as Chesterfield County reported a budget of approximately $900,000, and the ex-penditures noted above for a one-percent fixed audit would be about 0.8 percent of its annual budget. A smaller locality such as Tazewell County reported a budget of $128,034, and could spend more than $5,000 (again, the bulk of which would be IT fees), or 3.9 percent of its budget.
With these local and statewide estimates, it is important to again emphasize that these are projections based on multiple assump-tions. Because of this, the actual cost of an audit statewide and for a particular locality could vary from the estimates provided.
SAMPLE SIZE, STATISTICAL CONSIDERATIONS, TIME, AND EXPENDITURES IF VIRGINIA IMPLEMENTED AN ADJUSTABLE-PERCENTAGE AUDIT STRATEGY
The same 2007 paper used to define the FP strategy above also de-fines the adjustable-percentage approach:
This model requires jurisdictions to determine the percent-age of precincts or machines to audit based on the size of the margin of victory between the two leading candidates in a race. The smaller the margin of victory, the larger the percentage of precincts or machines to audit.
Adjustable Audit Features Variable Sample Size Designed to Provide High Degree of Statistical Confidence About Election Outcome
The AP audit strategy requires that the margin of victory be known to select a sample size that will provide a 99 percent chance that the audit did not miss something that could have changed the

Chapter 5: Time, Expenditures, and Statistical Considerations 43
election results. Elections with smaller margins of victory require larger sample sizes, while elections with larger margins of victory require smaller sample sizes (Table 12).
The variable nature of the AP sample size, while necessary to achieve a desired level of statistical confidence, makes the AP au-dit strategy more difficult to plan than the FP audit. This difficulty stems, in part, from the adjustable strategy requiring the margin of victory to be known prior to determining the sample size and randomly selecting precincts to be included. This means prior to the election, localities do not know (1) whether they will be in-cluded in the sample and (2) how many precincts, if any, in their locality will be audited. In contrast, the FP audit does not rely on the margin of victory; therefore, each locality would know that it would be required to audit at least one precinct, and only have to wait until after the sample selection to know exactly which pre-cinct(s) had been selected. This would especially impact the timing of collaborating with the clerk of the circuit court in each locality on access to the ballots, securing space to conduct the audit, and identifying people to serve on audit teams.
Another planning difficulty is related to the magnitude of re-sources needed to conduct the audit. While past election results can be averaged to project a likely future margin of victory average across multiple elections, the margin of victory in any given future election could be either in line with the historical average, very small, or very large. This means that the time and expenditures required to implement an AP strategy—again because its sample
Table 12: Precincts and Ballots Audited in Statewide Races Using an AP Strategy Designed to Achieve 99 Percent Confidence
Margin of Victory a
# of Precincts
in Sampleb Estimated # of Ballots Included
in Precincts Sampled 0.25% 631 1,327,420 0.50 339 713,146 0.75 231 485,949 1.0 175 368,143 2.0 88 185,124 3.0 58 122,013 5.0 34 71,525
10.0 16 33,659 15.0 10 21,037 20.0 7 14,726 25.0 5 10,518
a When the margin of victory between the two candidates is equal to or less than one percent-age point, the Code of Virginia §24.2-800 allows the apparently unsuccessful candidate to peti-tion for a full recount. b Number of precincts shown is the minimum number of precincts required for 99 percent statis-tical confidence. Source: JLARC staff analysis.
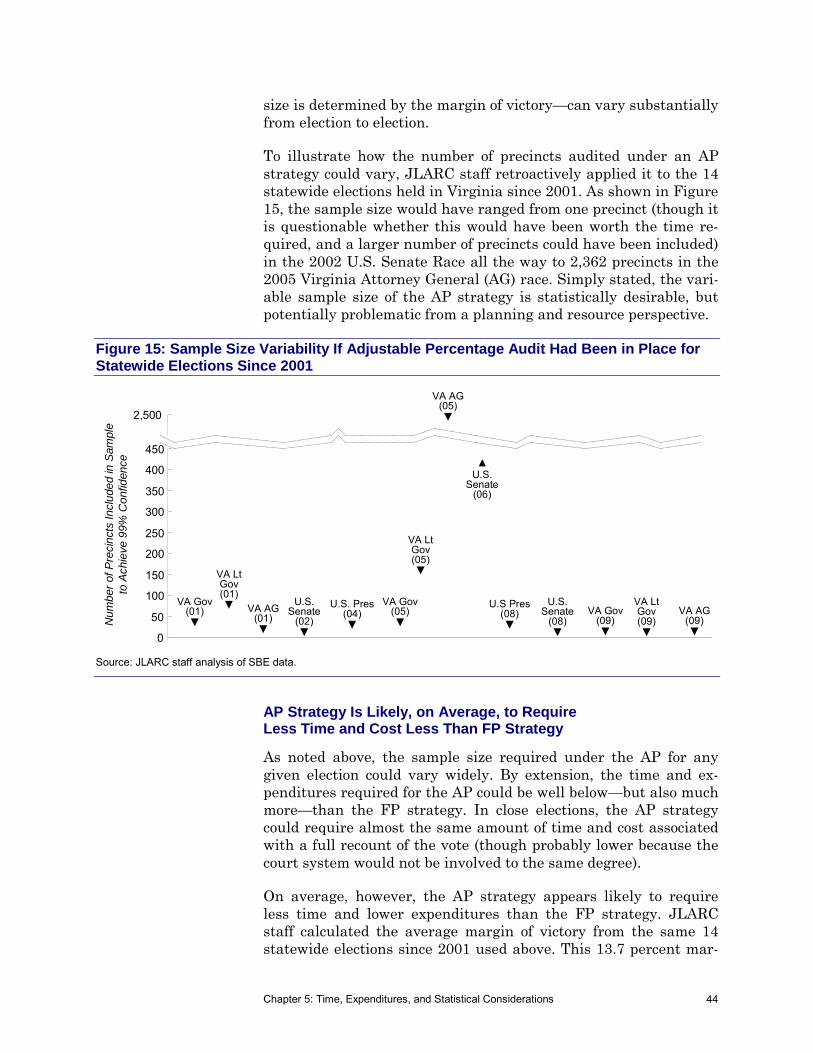
Chapter 5: Time, Expenditures, and Statistical Considerations 44
size is determined by the margin of victory—can vary substantially from election to election.
To illustrate how the number of precincts audited under an AP strategy could vary, JLARC staff retroactively applied it to the 14 statewide elections held in Virginia since 2001. As shown in Figure 15, the sample size would have ranged from one precinct (though it is questionable whether this would have been worth the time re-quired, and a larger number of precincts could have been included) in the 2002 U.S. Senate Race all the way to 2,362 precincts in the 2005 Virginia Attorney General (AG) race. Simply stated, the vari-able sample size of the AP strategy is statistically desirable, but potentially problematic from a planning and resource perspective.
Figure 15: Sample Size Variability If Adjustable Percentage Audit Had Been in Place for Statewide Elections Since 2001
Source: JLARC staff analysis of SBE data.
AP Strategy Is Likely, on Average, to Require Less Time and Cost Less Than FP Strategy
As noted above, the sample size required under the AP for any given election could vary widely. By extension, the time and ex-penditures required for the AP could be well below—but also much more—than the FP strategy. In close elections, the AP strategy could require almost the same amount of time and cost associated with a full recount of the vote (though probably lower because the court system would not be involved to the same degree).
On average, however, the AP strategy appears likely to require less time and lower expenditures than the FP strategy. JLARC staff calculated the average margin of victory from the same 14 statewide elections since 2001 used above. This 13.7 percent mar-
0
50
100
150
200
250
300
350
400
450
2,500
U.S. Pres (04)▼
VA AG (01)▼
VA Gov (01)▼
VA Lt Gov (01)▼ U.S.
Senate (02)▼
VA Gov (05)▼
VA Lt Gov (05)▼
VA AG (05)▼
▲U.S.
Senate (06)
U.S Pres (08)▼
U.S. Senate
(08)▼
VA AG (09)▼
VA Gov (09)▼
VA Lt Gov (09)▼
Num
ber o
f Pre
cinc
ts In
clud
ed in
Sam
ple
to A
chie
ve 9
9% C
onfid
ence
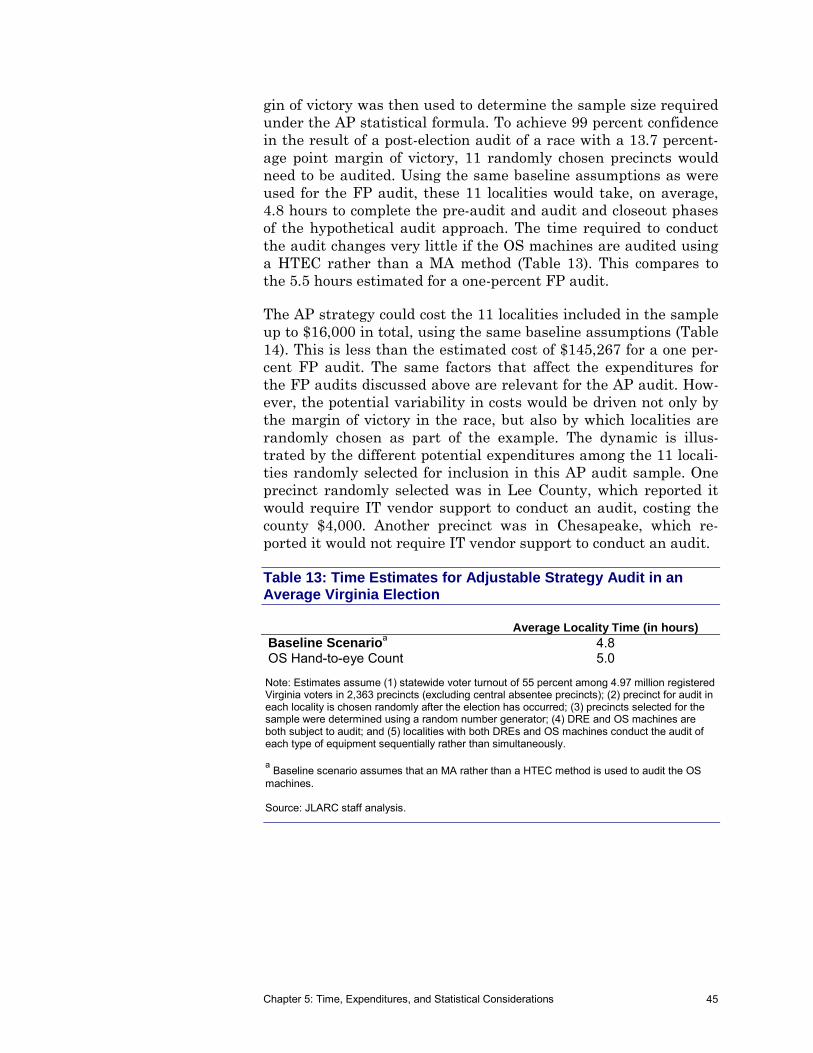
Chapter 5: Time, Expenditures, and Statistical Considerations 45
gin of victory was then used to determine the sample size required under the AP statistical formula. To achieve 99 percent confidence in the result of a post-election audit of a race with a 13.7 percent-age point margin of victory, 11 randomly chosen precincts would need to be audited. Using the same baseline assumptions as were used for the FP audit, these 11 localities would take, on average, 4.8 hours to complete the pre-audit and audit and closeout phases of the hypothetical audit approach. The time required to conduct the audit changes very little if the OS machines are audited using a HTEC rather than a MA method (Table 13). This compares to the 5.5 hours estimated for a one-percent FP audit.
The AP strategy could cost the 11 localities included in the sample up to $16,000 in total, using the same baseline assumptions (Table 14). This is less than the estimated cost of $145,267 for a one per-cent FP audit. The same factors that affect the expenditures for the FP audits discussed above are relevant for the AP audit. How-ever, the potential variability in costs would be driven not only by the margin of victory in the race, but also by which localities are randomly chosen as part of the example. The dynamic is illus-trated by the different potential expenditures among the 11 locali-ties randomly selected for inclusion in this AP audit sample. One precinct randomly selected was in Lee County, which reported it would require IT vendor support to conduct an audit, costing the county $4,000. Another precinct was in Chesapeake, which re-ported it would not require IT vendor support to conduct an audit.
Table 13: Time Estimates for Adjustable Strategy Audit in an Average Virginia Election
Average Locality Time (in hours) Baseline Scenarioa 4.8 OS Hand-to-eye Count 5.0
Note: Estimates assume (1) statewide voter turnout of 55 percent among 4.97 million registered Virginia voters in 2,363 precincts (excluding central absentee precincts); (2) precinct for audit in each locality is chosen randomly after the election has occurred; (3) precincts selected for the sample were determined using a random number generator; (4) DRE and OS machines are both subject to audit; and (5) localities with both DREs and OS machines conduct the audit of each type of equipment sequentially rather than simultaneously. a Baseline scenario assumes that an MA rather than a HTEC method is used to audit the OS
machines. Source: JLARC staff analysis.
Chapter 5: Time, Expenditures, and Statistical Considerations 46
Table 14: Cost Estimates for Adjustable Strategy Audit in an Average Virginia Election
$ $ / Ballot Baseline Scenario a $15,822 $1.09 OS Hand-to-eye Count 11,822 0.81 No IT Vendor Fees 822 0.06
Note: Estimates assume (1) statewide voter turnout of 55 percent among 4.97 million registered Virginia voters in 2,363 precincts; (2) precinct for audit in each locality is chosen randomly after the election has occurred; (3) precincts selected for the sample were determined using a ran-dom number generator; (4) DRE and OS machines are both subject to audit; (5) localities with both DREs and OS machines conduct the audit of each type of equipment sequentially rather than simultaneously; (6) audit officials are paid the equivalent of a half day of work per precinct counted; and (7) localities without programming ability will pay their vendor a fee to program their equipment for the audit. a
Baseline scenario assumes that a MA rather than a HTEC method is used to audit the OS ma-chines. Source: JLARC staff analysis.

Chapter 6: Potential Role of Post-election Audits in Virginia 47
JLARC staff were not directed to recommend whether Virginia should require post-election audits. However, a summary of infor-mation gained in this study can provide insight into the benefits and costs and the potential role that post-election audits could play in Virginia.
BENEFITS AND COSTS OF REQUIRING POST-ELECTION AUDITS
Implementing post-election audits likely would result in some ben-efits for Virginia. Realizing these benefits would require incurring some costs, primarily time and expenditures by Virginia’s locali-ties. Balancing these benefits and costs is an important part of un-derstanding the potential role that post-election audits could play in Virginia.
Various Audit Purposes Provide Framework to Assess Potential Benefits of Post-election Audits
As noted in Chapter 3, other states report that they conduct post-election audits to achieve a variety of purposes. These purposes in-clude (1) enhancing election transparency; (2) providing insight in-to voting equipment security, accuracy, and reliability; (3) identify-ing lessons learned to improve the electoral process; and (4) validating the election outcome. These purposes can serve as a
Ch
ap
ter
66
PPootteennttiiaall RRoollee ooff PPoosstt--eelleeccttiioonn AAuuddiittss iinn VViirrggiinniiaa
Conducting post-election audits would result in benefits, such as enhanced election transparency and providing insight into the security, accuracy, and reliability of vot-ing equipment. Achieving these benefits would require Virginia—primarily locali-ties—to spend varying amounts of time and resources depending on which audit strategy is employed. These benefits and costs need to be considered in the contextof several important implementation considerations that specifically relate to Vir-ginia’s environment. These considerations include the prevalence of direct recording equipment (DRE) used by localities, which do not have a paper trail and therefore can only be audited by analyzing the memory cards used by the machines. Computer scientists indicate analyzing these memory cards has limited usefulness because the process, unlike an audit using a paper ballot, is not an independent check. In addi-tion, some of the benefits of post-election audits can likely be achieved in ways otherthan requiring an ongoing, large-scale audit program.
II nn SS
uumm
mmaa r
r yy
Chapter 6: Potential Role of Post-election Audits in Virginia 48
framework to discuss the potential benefits of requiring either a fixed-percentage (FP) or adjustable-percentage (AP) audit.
When assessed on a relative basis against each other, the FP and AP audit strategies would achieve the above four benefits to differ-ing degrees. A one-percent FP audit would, in most cases, provide a high degree of election transparency and insight into voting equipment security, accuracy, and reliability. It would also in most cases provide more opportunities to identify lessons learned than the AP strategy. This is essentially because, on average, the FP strategy would require at least one precinct to be audited in each of the State’s 134 localities. This means that all voting equipment used by the State would be subject to audit and that interested in-dividuals would have opportunities in all parts of the State to ob-serve audits when they occur. The AP audit strategy would, on av-erage, result in fewer precincts being audited. Because of this smaller sample size and because all voting equipment models would likely not be audited, the AP strategy would achieve the first three benefits noted above to a lesser degree.
Alternatively, the AP strategy would provide the benefit of validat-ing the election outcome to a high degree when compared to the FP strategy. As discussed in Chapter 5, the sample size for the AP au-dit strategy is calculated based on what would be necessary to achieve 99 percent statistical confidence in the election outcome. In contrast, the FP strategy sample size remains the same regard-less of the margin of victory.
Achieving this fourth benefit of validating the election outcome may be less necessary, however, given two aspects of Virginia’s electoral environment. First, as noted in Chapter 1, §24.2-800 of the Code of Virginia stipulates that when the difference between the apparent winner and defeated candidate is not more than one percent, the defeated candidate may appeal for a recount. This statutory provision has come in to play, for example, in 2009 in the 21st House of Delegates district race, in 2008 in the 5th Congres-sional district race, and in 2005 in the Virginia Attorney General’s race. In each of these recounts and others, the recount did not change the election outcome. A few other recent elections have also been close, such as the 2006 race for one of Virginia’s U.S. Senate seats, but the losing candidate did not request a recount.
Second, most elections in Virginia are not close (Table 15). In fact, only 52, or about 13 percent, of the 416 elections analyzed by JLARC staff had a margin of victory closer than 10 percent. Only seven of those were within a one-percent margin. Taken together, the existence of a recount statute and the historical pattern of most elections not being close may reduce the need to further vali-date election outcomes in Virginia.
… validating the elec-tion outcome may be less necessary con-sidering that most Virginia elections are not close and there are recount provi-sions.
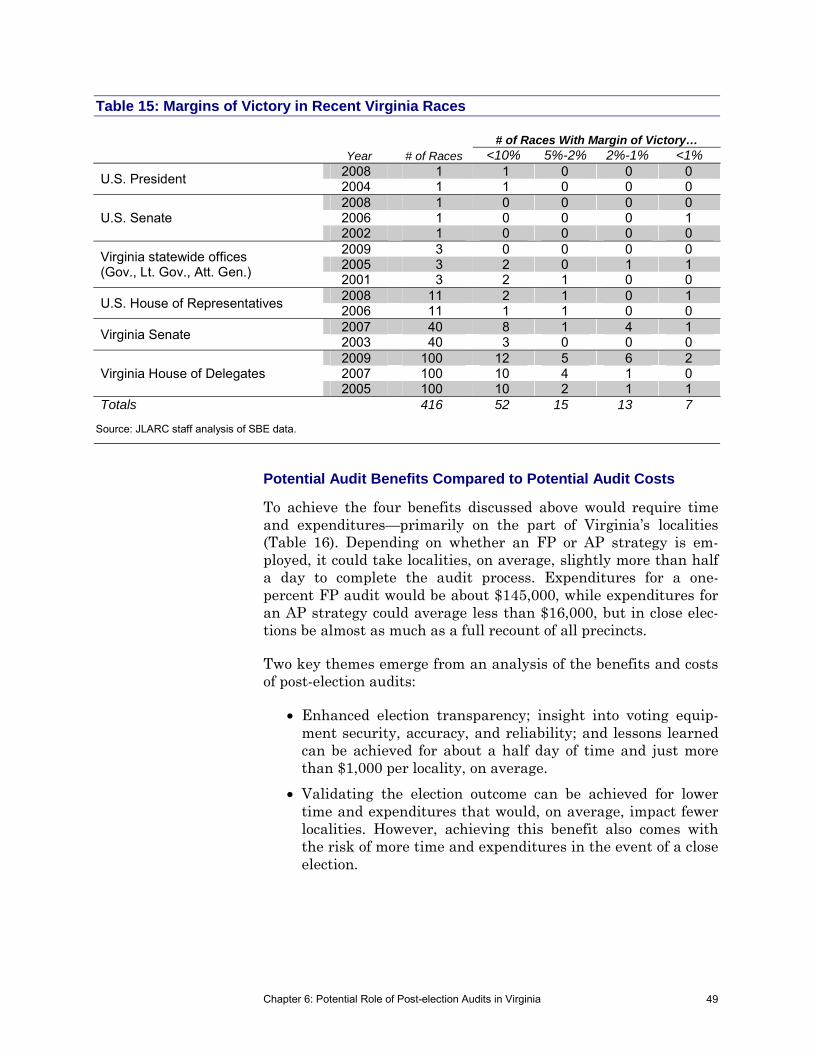
Chapter 6: Potential Role of Post-election Audits in Virginia 49
Table 15: Margins of Victory in Recent Virginia Races
Year # of Races # of Races With Margin of Victory…
<10% 5%-2% 2%-1% <1%
U.S. President 2008 1 1 0 0 0 2004 1 1 0 0 0
U.S. Senate 2008 1 0 0 0 0 2006 1 0 0 0 1 2002 1 0 0 0 0
Virginia statewide offices (Gov., Lt. Gov., Att. Gen.)
2009 3 0 0 0 0 2005 3 2 0 1 1 2001 3 2 1 0 0
U.S. House of Representatives 2008 11 2 1 0 1 2006 11 1 1 0 0
Virginia Senate 2007 40 8 1 4 1 2003 40 3 0 0 0
Virginia House of Delegates 2009 100 12 5 6 2 2007 100 10 4 1 0 2005 100 10 2 1 1
Totals 416 52 15 13 7
Source: JLARC staff analysis of SBE data.
Potential Audit Benefits Compared to Potential Audit Costs
To achieve the four benefits discussed above would require time and expenditures—primarily on the part of Virginia’s localities (Table 16). Depending on whether an FP or AP strategy is em-ployed, it could take localities, on average, slightly more than half a day to complete the audit process. Expenditures for a one-percent FP audit would be about $145,000, while expenditures for an AP strategy could average less than $16,000, but in close elec-tions be almost as much as a full recount of all precincts.
Two key themes emerge from an analysis of the benefits and costs of post-election audits:
Enhanced election transparency; insight into voting equip-ment security, accuracy, and reliability; and lessons learned can be achieved for about a half day of time and just more than $1,000 per locality, on average.
Validating the election outcome can be achieved for lower time and expenditures that would, on average, impact fewer localities. However, achieving this benefit also comes with the risk of more time and expenditures in the event of a close election.

Chapter 6: Potential Role of Post-election Audits in Virginia 50
Table 16: Potential Benefits and Costs If Virginia Were to Require Post-election Audits
Audit Strategy
Potential Benefits Potential Costs
(1) Election Transparency
(2) Security, Accuracy, Reliability
(3) Lessons Learned
(4) Validate Election Outcome
Time $
1% Fixed - Percentage 4 4 4 2
5.5 hours /
locality
$145,267
Adjustable - Percentagea 2 2 2 4
Range of 4.8 hours / localityb to same as full
recount
Range of $15,822b to same as full
recount
Legend for Scale of Potential Benefit 4 High 2 Medium 0 Low
a Assumes a margin of victory that is the average of a sample of races in Virginia since 2001, which is 13.7 percent. b Would involve 11 localities with the margin of victory noted above. Source: JLARC staff analysis.
A less quantifiable, but still important, final consideration is how requiring post-election audits would be done within the State’s current statutory and procedural framework. Depending on how they are structured and when they are conducted, requiring post-election audits would necessitate a number of changes to the Code of Virginia. The most significant of these changes depends on when the State chooses to conduct the audits. Conducting audits prior to local or SBE certification could require expanding the time given to localities to canvass and certify election results, as well as the time given to SBE to certify results. As noted in Chapter 3, the ma-jority of other states that require audits conduct them prior to elec-tion certification.
When asked, however, Virginia general registrars had mixed opin-ions about when audits should be required. About a third thought they could be done after the recount deadline, while either 35 or 40 percent (depending on whether they use OS machines or DREs) thought they could be done after certification, but before the re-count deadline. About one-quarter thought they should be done be-fore certification.
More information about other potential changes required to the Code of Virginia is provided in Appendix D.
KEY IMPLEMENTATION CONSIDERATIONS OF REQUIRING POST-ELECTION AUDITS
Beyond the benefits and costs of post-election audits discussed above, some additional implementation considerations are relevant

Chapter 6: Potential Role of Post-election Audits in Virginia 51
when assessing the potential role that audits could play in Virgin-ia. These include the diversity of Virginia’s voting equipment, that some benefits of audits could be achieved without requiring all lo-calities to participate in an ongoing audit program, and that most Virginia general registrars are strongly against requiring localities to conduct audits. While none of these considerations are alone reasons to not require post-election audits, they collectively sug-gest that it may not be prudent to require an ongoing, large-scale audit program at this time.
Virginia’s Mixed Voting Equipment Environment Complicates Post-election Audit Implementation
Despite the statutory prohibition against purchasing new DREs, they are still used by many localities. Only five localities use only OS machines (other than for disabled or absentee voters). The fact that Virginia’s DREs have no paper trail, unlike the OS ballots, means that localities auditing DREs would in most cases use the DRE memory card from the election to re-run the election results.
This fundamental difference between OS machines and DREs raises two potential complications. First, some computer scientists and interest groups have expressed skepticism about the value of re-running results from DRE memory cards. Although this is the typical approach used when conducting an audit or recount, com-puter scientists and interest groups place less faith in the process than auditing paper ballots from OS machines. Second, in nearly all cases, the 45 localities that use only DREs would spend far more time in the audit set-up phase than they would conducting the audit itself. Furthermore, the localities among these 45 that do not have the capabilities in-house to audit the memory cards would need to pay additional IT vendor fees.
The current prevalence of DREs in Virginia suggests it may not be prudent to require all localities to participate in a large-scale, on-going post-election audit program. As localities’ current DREs are retired and replaced with OS machines, this complication disap-pears. As noted in Chapter 2, DREs will be prevalent across Vir-ginia for at least another five years based on locality’s current plans.
Audit Benefits Can Be Achieved Without an Ongoing Program Requiring All Localities to Conduct Audits in Every Election
Most other states that require audits conduct them on at least one contest in every statewide election. However, even the relatively small-scale pilot audit project recently conducted in Virginia pro-vided some of the intended benefits of larger, more formalized post-election audit programs. For example,
The fundamental dif-ference between OS machines and DREs raises two potential complications.
Chapter 6: Potential Role of Post-election Audits in Virginia 52
The observers who attended the audits in person, and other interested individuals who are informed of the audit results, benefit from the enhanced transparency of the elections that were audited.
The pilot audit results, showing a difference of 0.21 percent between the election day and audit totals, provide some in-sight into the security, accuracy, and reliability of the four models of OS machine audited.
Lessons that could potentially improve the electoral pro-cess—in particular the ability to examine ballots not com-pleted according to the instructions given—were learned and resulted in a recommendation for SBE to assess the issue further.
This suggests that for those interested in achieving the benefits of audits, SBE and localities could coordinate to conduct additional audits under the existing pilot program statute. Alternatively, SBE could approve post-election audit procedures and the General Assembly could amend the Code of Virginia to give localities ex-plicit permission to conduct audits if they wish. Voters’ rights or-ganizations and some in academia suggest other approaches that would provide insight into the accuracy of voting equipment with-out the time and effort involved in a large-scale required audit program. These approaches include candidate-requested audits of small samples of ballots when results seem unusual, or audits of small batches of ballots within a precinct, rather than entire pre-cincts.
Most General Registrars Would Likely Be Strongly Against Re-quiring All Localities to Conduct Audits Using Local Resources
In response to the JLARC staff survey of Virginia general regis-trars, the majority of registrars reported they were either some-what or not very familiar with post-election audits. Nevertheless, these would be the individuals most responsible for implementing post-election audits if they were required by the State. When asked, Virginia registrars were at best lukewarm to the idea of having an additional requirement for post-election audits. Only 11 percent believed audits should be required, mostly if the State paid for the audits or split the cost with localities. Forty-two percent re-ported that localities should be authorized to conduct post-election audits at their discretion, but not required to do so. Another 37 percent reported that post-election audits should not be required.
Over 80 percent of registrars reported that they believe audits might not be a good idea for several reasons, including their beliefs that: (1) Virginia’s voting equipment is already secure, accurate, and reliable; (2) Virginia’s recount and contest provisions ade-

Chapter 6: Potential Role of Post-election Audits in Virginia 53
quately address ensuring the correct person was elected based on the actual vote; and (3) there are better uses of resources to ad-dress concerns. In addition, when shown a list of nine options (such as allowing more time for the local canvass or more effective training) that would potentially improve the security, accuracy, and reliability of elections, requiring post-election audits was se-lected least frequently—by only eight registrars.
In most cases, audits would take about a half-day of time for a typ-ical general registrar and some SBE staff time. However, depend-ing on how audits are implemented, it could require a varying amount of expenditures and time per locality. This extra demand on localities’ time, particularly if audits are required prior to certi-fication, would occur shortly after staff had worked long hours preparing for and holding the election. In addition, these expendi-tures, particularly for localities that must pay IT vendor fees, could be a considerable percentage—perhaps up to five percent—of their operating budgets. When asked, about two-thirds of Virginia gen-eral registrars thought that if audits are required, they should be State funded and locally executed. Most of the remaining regis-trars thought they should be both State funded and State execut-ed.
These survey findings suggest that collectively Virginia general registrars are opposed to requiring localities to conduct audits, es-pecially if local resources are required. Though this is not suffi-cient reason alone to not require audits, it represents a challenge when considering successful implementation of a large, ongoing post-election audit program.

Chapter 6: Potential Role of Post-election Audits in Virginia 54

Appendix A: Study Mandate 55
SENATE JOINT RESOLUTION NO. 328 Directing the Joint Legislative Audit and Review Commission to study postelection
audits of voting equipment. Report. Agreed to by the Senate, February 26, 2009 Agreed to by the House of Delegates, February 26, 2009 WHEREAS, Virginia has witnessed several close elections in recent years; and WHEREAS, nineteen states conduct some form of postelection audit to confirm the integrity and accuracy of voting systems, and legislation proposing some form of postelection audit for the Commonwealth has come before the General Assembly each of the last three sessions; and WHEREAS, the General Assembly added § 24.2-671.1 to the Code of Virginia in 2008 to authorize the State Board of Elections to provide for pilot programs for au-dits of optical scan tabulators in localities agreeing to participate; and WHEREAS, there are multiple technical, financial, and legal issues concerning post election audits that are difficult to address during a legislative session; and WHEREAS, a careful analysis of postelection audit options will serve to ensure the integrity of elections, voter confidence, and the wise investment of public resources; now, therefore, be it RESOLVED by the Senate, the House of Delegates concurring, That the Joint Leg-islative Audit and Review Commission be directed to study postelection audits of voting equipment. In conducting its study, the Joint Legislative Audit and Review Commission shall (i) review alternative procedures and processes for postelection audits; (ii) examine the data, procedures, results, and conclusions of the pilot audit undertaken pursuant to § 24.2-671.1; (iii) estimate the time requirements and costs of postelection audits; (iv) review the experience of postelection audits in other states, (v) consider the statistical confidence of different audit strategies; and (vi) consider the changes that would be required in the Code and procedures for differ-ent audit strategies to be effective. In conducting its deliberations, the Joint Legis-lative Audit and Review Commission shall provide for participation by representa-tives of the state Democratic Party, the state Republican Party, and the Virginia Electoral Board Association, as well as experts in statistical analysis and election audits.
Ap
pen
dix
AA SSttuuddyy MMaannddaattee
Appendix A: Study Mandate 56
Technical assistance shall be provided by the State Board of Elections and the Vir-ginia Information Technologies Agency. All agencies of the Commonwealth shall provide assistance to the Joint Legislative Audit and Review Commission for this study, upon request. The Joint Legislative Audit and Review Commission shall complete its meetings for the first year by November 30, 2009, and for the second year by November 30, 2010, and the chairman shall submit to the Division of Legislative Automated Systems an executive summary of its findings and recommendations no later than the first day of the next Regular Session of the General Assembly for each year. Each executive summary shall state whether the Joint Legislative Audit and Review Commission intends to submit to the General Assembly and the Governor a report of its findings and recommendations for publication as a House or Senate document. The executive summaries and reports shall be submitted as provided in the procedures of the Di-vision of Legislative Automated Systems for the processing of legislative documents and reports and shall be posted on the General Assembly's Website.
Appendix B: Research Activities and Methods 57
JLARC staff conducted four major research activities to address the study mandate:
Facilitated pilot post-election audits in four Virginia locali-ties;
Administered surveys of Virginia general registrars and other states about post-election audits;
Conducted interviews with State Board of Elections (SBE) staff, general registrars, electoral board members, computer scientists, and other states that conduct post-election au-dits; and
Reviewed academic literature, reports from other states, and the Code of Virginia.
PILOT POST-ELECTION AUDITS IN FOUR VIRGINIA LOCALITIES
SJR 328 directed JLARC staff to “examine the data, procedures, results, and conclusions of the pilot audit undertaken pursuant to §24.2-671.1.” However, when JLARC staff began planning for this study, no planning for the audit had been conducted. As a result, JLARC staff worked with SBE, the Virginia Electoral Board Asso-ciation (VEBA), and the Voter Registrar’s Association of Virginia (VRAV) to begin the process of identifying localities willing to vol-unteer to participate. In order to participate, the locality needed to at least partly use optical scan machines so that paper ballots were available to audit. The process resulted in the City of Char-lottesville, and Page, Chesterfield, and Fairfax Counties volunteer-ing.
Agreement on General Approach for Pilot Audits
After securing participation from the four localities, JLARC staff drafted a discussion document that articulated a general approach for the pilot audits consisting of the process steps and timeframes shown in Figure B-1. This discussion document was provided to SBE staff, the electoral board and general registrar in each of the four localities, the Democratic and Republican Parties of Virginia, and Virginia Verified Voting. After several rounds of feedback and meetings with various participants on the proposed approach, JLARC staff then began selecting the races and precincts included
Ap
pen
dix
BB
RReesseeaarrcchh AAccttiivviittiieess aanndd MMeetthhooddss

Appendix B: Research Activities and Methods 58
Figure B-1: General Approach and Timeframes for Post-election Audits
Note: The main audits took place in February and March 2010, later than the original timeframe illustrated in this graphic. The timeframe was pushed back primarily due to inclement weather. Source: JLARC staff, 2009.
in the audit sample, and drafting more specific audit guidebooks, instructions, and forms that would be used in each locality.
Draft and Final Audit Guidebook Development
After securing general agreement on a high-level audit approach, JLARC staff began developing a draft audit guidebook for use in each locality. The basis for the draft audit guidebook was primarily any existing SBE policy for recounts in Virginia and information collected by JLARC staff about other state’s approaches to post-election audits. To collect information about various audit meth-ods, the guidebooks were written to require variations on the hand-to-eye counting audit method used primarily by other states, and the machine-assisted audit method currently used in Virginia for recounts.
Audit participants commented on various aspects of the draft audit guidebook. These comments were incorporated by JLARC staff and reflected in the final audit guidebook. The final audit guidebook also included specific instructions and data capture forms that would be used at each of the four audits.
A . Agreement on Participation &
Approach
B. Compile Draft Audit Guidebook
C. Finalize Audit Guidebook
E. Main Audits
F. Preliminary Assessment & Lessons Learned
G. Secondary
Audits (if needed)
Election
JunFeb Mar Apr May Aug Sep
D. Sample Selection /
Audit Preparation
Oct Nov Dec Jan

Appendix B: Research Activities and Methods 59
Audit Sample Selection
The statute that authorizes the pilot post-election audits, Code of Virginia §24.2-671.1, requires that every race on the ballot audited have a margin of victory greater than ten percentage points. This requirement prevented JLARC staff from using any probability sample design, such as simple random sampling or stratified ran-dom sampling. Consequently, the sample size and selection process became less important from a statistical perspective. Rather, the sample size and races to be included were chosen based on the statutory requirements and the time and resources that would be available to conduct each audit. Decision rules used by JLARC staff to select the races and precincts for audit included:
No race on the ballot could have a margin of victory less than or equal to ten percentage points at the precinct, coun-ty, and state levels (if applicable).
Precincts with the largest margins of victory in the selected race would be prioritized for selection.
Precincts with 1,500 or fewer ballots cast would be priori-tized for selection.
The selected race should not present an appearance of a conflict of interest, such as a race involving a JLARC mem-ber or a race involving a candidate who has previously ad-vocated for post-election audits.
The race selected should not involve a substantial transi-tion process for the victor, in particular the Governor’s race.
Table B-1 shows the precincts and races selected for the pilot post-election audits based on the decision rules presented above. In both Page and Chesterfield Counties, JLARC staff determined that the race for Attorney General from the November 2009 General
Table B-1: Races and Precincts Selected for the Pilot Post-election Audits
Locality Race Selected Precincts Selected Votes Audited
% of Locality’s Votes for This Race Audited
Page County Attorney General, 11/2009
401 – Newport 501—Shenandoah 1,959 26.9%
City of Charlottesville
Governor, Democratic Primary, 6/2009 CAP – Central Absentee 41 1.3
Fairfax County House of Delegates District 45, 11/2009
408 – Mt. Eagle 608 – Kirkside 621 – Grosvenor
1,860 40.6
Chesterfield County
Attorney General, 11/2009
307 – Cosby 511 – Black Heath 2,442 2.7
Source: JLARC staff analysis of elections results data from the Virginia State Board of Elections.

Appendix B: Research Activities and Methods 60
Election would be used for the pilot audits. After eliminating the Governor’s race from consideration (due to the potential transition involved for the Governor-Elect), the Attorney General’s race had the largest margin of victory of the two other statewide races. In Chesterfield County, JLARC staff eliminated from consideration any precincts with over 1,500 ballots cast and any precincts in House District 66 (represented by Delegate Cox, a JLARC mem-ber). In Page County, JLARC staff selected the two precincts with the largest margins of victories in the Attorney General’s race.
In Charlottesville, JLARC staff selected the Governor nominee race from the June 2009 democratic primary for the pilot audit. JLARC staff determined that the results of the November 2009 general election could not be used for the pilot post-election audit because a local race on that ballot had a margin of victory under ten percentage points. JLARC staff, therefore, determined that the results of the June 2009 Democratic primary would be used for the post-election audits in Charlottesville. It was subsequently deter-mined that optical scan machines were only used in the central ab-sentee precinct during the primaries, consequently it was the only precinct audited.
JLARC staff selected the House of Delegates District 45 race for the pilot post-election audit in Fairfax County. JLARC staff did not use any of the three statewide races from the November 2009 gen-eral election because each of these races had a margin of victory less than 10 percentage points at the county level. JLARC staff then considered the House of Delegates races in Fairfax County. JLARC staff sorted these races based on the races’ margins of vic-tories. Then JLARC staff analyzed precinct-level results for each of these races to find precincts that had margins of victories greater than 10 percentage points for all of their races. Three House Dis-tricts in Fairfax County had races with larger margins of victory than the race in House District 45; however, two of those races did not have three precincts where all the races on the precinct’s ballot had margins of victory greater than ten percentage points, and the third district was won by Delegate Hugo who had previously intro-duced legislation regarding post-election audits, which could pre-sent a minimal appearance of a conflict of interest.
Audit Preparation, Including Audit Notification and SBE Approval
JLARC staff continued to prepare for the audits in each locality. These preparations included working with the Clerk of the Circuit Court in each locality on securing access to the ballots and a loca-tion to conduct the audit. Additionally, consistent with statutory requirements, JLARC staff sent written notifications to each can-didate on the ballot in precincts selected for audits, local political parties, and the Democratic and Republican Parties of Virginia.

Appendix B: Research Activities and Methods 61
JLARC staff also posted information about the pilot audits on its website. The information included the audit time and location and race selected for audit in each of the four localities.
On January 15, 2010, SBE approved the proposed approach for the pilot post-election audits at a public meeting in the General As-sembly Building. After SBE approval, several audits were re-scheduled due to inclement weather. The revised audit dates and times were posted on the JLARC website, and individuals inter-ested in observing the audit who had contacted JLARC staff for in-formation were also notified of the changes.
Appendix C includes detailed information about the results of each of the four pilot audits.
SURVEYS OF VIRGINIA GENERAL REGISTRARS AND OTHER STATES ABOUT POST-ELECTION AUDITS
JLARC staff administered two surveys targeting (1) election staff in other states, and (2) Virginia general registrars. Surveys were designed to supplement the information gathered through the pilot post-election audits, structured interviews, and literature reviews.
Survey of Other States’ Election Staff
JLARC staff surveyed election staff in other states to gather in-formation about their voting system and their approach, if any, to conducting post-election audits. JLARC staff contacted the Na-tional Association of State Election Directors (NASED), and re-quested that they distribute a link to an online survey to their members. Survey topics included
voting equipment used in the state;
existence of statutory requirements for post-election audits;
statistical strategies used to determine audit sample sizes;
audit counting methods and timing of audit implementation within the electoral process;
audit results and the usefulness of audits to achieve various purposes; and
recommendations for designing a post-election audit pro-gram.
JLARC staff received 25 responses from other states and the Dis-trict of Columbia.
Appendix B: Research Activities and Methods 62
Survey of Virginia General Registrars
JLARC staff surveyed Virginia’s 134 general registrars to collect information about the electoral environment in their individual lo-calities and their opinions regarding post-election audits. The VRAV and VEBA helped JLARC staff inform general registrars about the survey. JLARC staff sent a link to the on-line survey via e-mail to each general registrar. Survey topics included
office budget and resources;
voting equipment used in their locality and an assessment of its accuracy, reliability, and security;
opinion regarding the necessity of post-election audits;
recommendations regarding how post-election audits could be implemented; and
opinions regarding the most effective and efficient ways to improve the electoral process.
JLARC staff received 110 responses from the State’s general regis-trars—for a response rate of 82 percent.
INTERVIEWS WITH VARIOUS INDIVIDUALS AND ENTITIES ABOUT POST-ELECTION AUDITS
JLARC staff conducted a variety of interviews with personnel from SBE, Virginia general registrars and their staffs, Virginia electoral board members, representatives of voting integrity groups, com-puter scientists and academics with expertise in voting equipment and post-election audits, and election personnel in other states. These interviews covered a variety of topics including the broader electoral environment, voting equipment, and post-election audits.
REVIEWS OF LITERATURE, REPORTS, AND THE CODE OF VIRGINIA
JLARC staff reviewed numerous documents and studies to sup-plement and validate findings from interviews, the pilot post-election audits, and surveys. A review of the literature was con-ducted regarding the
statistical strategies used to design post-election audits;
various counting methods used to conduct post-election au-dits;
performance of voting equipment; and
assessments of the role that post-election audits and voting equipment play in the broader electoral environment.
Appendix B: Research Activities and Methods 63
Approximately half of states have conducted at least one post-election audit at some point in the past five to ten years, and some of these states have published reports on their methods and find-ings. JLARC staff reviewed this documentation from other states. States producing this documentation reviewed by JLARC staff in-clude North Carolina, Georgia, New Mexico, Minnesota, and Con-necticut.
JLARC staff also reviewed documentation other states produced regarding voting equipment. Some states have conducted studies on the accuracy, reliability, and security of the voting equipment used in their states. JLARC staff reviewed voting equipment stud-ies conducted by Maryland, California, Ohio, and Florida.
Finally, JLARC staff reviewed the Code of Virginia and SBE poli-cies related to election administration, recounts, and post-election audits.

Appendix B: Research Activities and Methods 64

Appendix C: Detailed Information on Pilot Post-election Audits 65
Section 24.2-671.1 of the Code of Virginia authorizes the State Board of Elections (SBE) to provide for pilot programs for audits of optical scan machines. The study mandate directs JLARC staff to examine the data, procedures, results, and conclusions of the pilot audit undertaken pursuant to §24.2-671.1. Consequently, JLARC staff worked with SBE staff, and general registrars, electoral boards, and clerks of the circuit court in four localities to develop and implement audits under this pilot program statute. The audits occurred during February and March 2010 and had two primary objectives:
1. To determine the difference, if any, between (a) a count of a sample of the votes cast on paper optical scan ballots, and (b) the tally of those votes from the optical scan machine that counted the ballots in the selected precincts on election day; and
2. To collect information about the pilot experience that facilitates understanding the implementation factors, including time, cost, and the statistical considerations associated with various post-election audit methods.
PILOT POST-ELECTION AUDIT METHODOLOGY AND PLANNING
JLARC staff worked with SBE staff, the Virginia Electoral Board Association, and the Voter Registrars’ Association of Virginia to ask localities to participate in the pilot. Four localities that use op-tical scan machines volunteered: the City of Charlottesville, and Chesterfield, Fairfax, and Page counties. Once general agreement was reached with these localities on participation, JLARC staff be-gan developing a proposed audit approach. This approach was shared with these localities, SBE, the Democratic and Republican Parties of Virginia, as well as Virginia Verified Voting. Feedback from these groups was incorporated as appropriate, culminating in an audit guidebook, instructions, and forms to be used in each lo-cality. These materials were developed using two primary sources: (1) existing SBE policy for recounts in Virginia and (2) other states’ approaches to post-election audits.
After the November 2009 election results were available, JLARC staff analyzed the results of each election on the ballot in each pre-
Ap
pen
dix
CC
DDeettaaiilleedd IInnffoorrmmaattiioonn oonn PPiilloott PPoosstt--eelleeccttiioonn AAuuddiittss
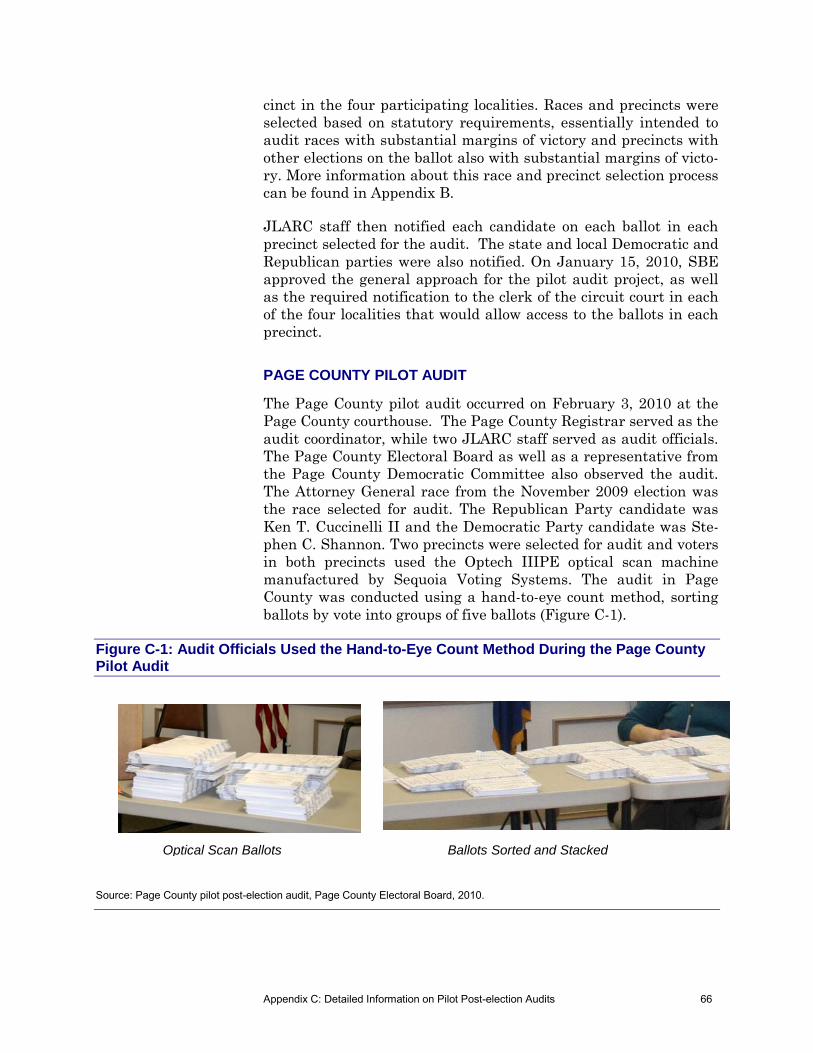
Appendix C: Detailed Information on Pilot Post-election Audits 66
cinct in the four participating localities. Races and precincts were selected based on statutory requirements, essentially intended to audit races with substantial margins of victory and precincts with other elections on the ballot also with substantial margins of victo-ry. More information about this race and precinct selection process can be found in Appendix B.
JLARC staff then notified each candidate on each ballot in each precinct selected for the audit. The state and local Democratic and Republican parties were also notified. On January 15, 2010, SBE approved the general approach for the pilot audit project, as well as the required notification to the clerk of the circuit court in each of the four localities that would allow access to the ballots in each precinct.
PAGE COUNTY PILOT AUDIT
The Page County pilot audit occurred on February 3, 2010 at the Page County courthouse. The Page County Registrar served as the audit coordinator, while two JLARC staff served as audit officials. The Page County Electoral Board as well as a representative from the Page County Democratic Committee also observed the audit. The Attorney General race from the November 2009 election was the race selected for audit. The Republican Party candidate was Ken T. Cuccinelli II and the Democratic Party candidate was Ste-phen C. Shannon. Two precincts were selected for audit and voters in both precincts used the Optech IIIPE optical scan machine manufactured by Sequoia Voting Systems. The audit in Page County was conducted using a hand-to-eye count method, sorting ballots by vote into groups of five ballots (Figure C-1).
Figure C-1: Audit Officials Used the Hand-to-Eye Count Method During the Page County Pilot Audit
Source: Page County pilot post-election audit, Page County Electoral Board, 2010.
Optical Scan Ballots Ballots Sorted and Stacked

Appendix C: Detailed Information on Pilot Post-election Audits 67
Audit of Precinct 501- Shenandoah
At 9:12, audit officials opened the box obtained from the clerk of the circuit court containing the ballots cast in precinct 501. At 9:15, audit officials began counting to compare the total number of ballots with what the Statement of Results (SOR) indicated was the total number of ballots read by the optical scan machine on election day. Audit officials ended this initial count at 10:00, con-cluding that there were 1,051 total ballots. After this conclusion was reached, the audit coordinator informed the audit officials that the SOR indicated there were 1,054 ballots read by the machine on election day.
Audit officials then reexamined their stacks to ensure that each stack of 100 ballots included 20 groups of five ballots, which they did. Audit officials then reexamined each group of five ballots to ensure that each included exactly five. During this process, one audit official found three groups of five ballots that actually in-cluded six ballots. These three additional ballots were then added to the initial count of 1,051, resulting in 1,054 total ballots which matched the total on the SOR.
The two audit officials then began grouping the ballots by candi-date at 10:35. Audit officials looked at each ballot, then placed it in one of the following piles: clear vote for Cuccinelli; clear vote for Shannon; a “questionable” vote for Cuccinelli or Shannon that may or may not have been read by the optical scan machine, but could easily be identified by the audit official that the voter intended to vote for Cuccinelli or Shannon; write-in vote for Attorney General; or no vote for Attorney General. Once any of these piles reached five ballots, the group of five ballots was placed into a larger pile of similarly cast ballots.
The audit officials ended this count by candidate at 12:05, conclud-ing that Cuccinelli received 683 votes, Shannon had received 311 votes, and there were 60 blank ballots or write-ins. After this con-clusion was reached, the audit coordinator informed the audit offi-cials that the SOR indicated Cuccinelli received 679 votes, Shan-non received 309 votes, and there were 66 write-ins or no votes for Attorney General.
Audit officials then reexamined their pile of questionable ballots. There were 16 such ballots for Cuccinelli and 12 such ballots for Shannon. In the Cuccinelli pile there was a ballot marked with an “X” next to Cuccinelli’s name but well outside the area where the machine was programmed to look for a mark. In the Shannon pile there was a ballot that was torn across the mark for Shannon. Audit officials were confident that the machine likely did not read either of these ballots. However, without running the ballots back

Appendix C: Detailed Information on Pilot Post-election Audits 68
through an optical scan machine, audit officials could not identify any other ballots that could be definitively identified as not being read by the machine.
The audit of precinct 501 concluded at 12:25, with the audit offi-cials and audit coordinator concurring that the difference of 4 bal-lots for Cuccinelli and 2 ballots for Shannon was most likely due to the optical scan machine not reading these ballots. Each of these ballots were likely in the pile of questionable ballots, though other than the ballot with the “X” next to Cuccinelli’s name and the bal-lot that was torn across the mark for Shannon, it was inconclusive which of the other ballots in the questionable pile were the ones not read by the machine. The time and results of the audit of pre-cinct 501 are summarized in Table C-1.
Table C-1: Page County Precinct 501 Audit Findings
Ballots and Time Results
Statement of
Results Audit Difference
(SOR – Audit) Ballots audited 1,054 Cuccinelli 679 683 -4a Total audit time (minutes) 193 Shannon 309 311 -2a
Ballots audited / minute 5.5 Write-ins/ under-votes/ over-votes
66 60 6 a
Ballots audited/ person / minute 2.7 Totals 1,054 1,054 0
aAudit officials concluded these ballots were not read by the optical scan machine, but were ballots that could be identified by the audit official as being cast by the voter for one candidate or the other. Source: JLARC staff analysis of pilot audit of Page County precinct 501.
Audit of Precinct 401 – Newport
Due to the length of time required to conduct the audit of precinct 501 earlier in the morning, audit officials and the audit coordina-tor agreed to streamline the audit approach for precinct 401. Ra-ther than counting the ballots once to determine a total, then re-count all of them to determine totals by candidate, this step would be consolidated so that each ballot would be handled by each audit official fewer times.
At 12:50, audit officials opened the box containing the ballots cast in precinct 401. At 12:55, audit officials began grouping the ballots by candidate, using the same piles as in precinct 501. The audit of-ficials took a lunch break from 1:20 to 1:45. Then, at 2:30, the au-dit officials concluded that there were 905 total ballots. After this conclusion was reached, the audit coordinator informed the audit officials that the SOR indicated there were also 905 ballots read by the machine on election day.

Appendix C: Detailed Information on Pilot Post-election Audits 69
Because of the consolidated approach used during this audit, audit officials were then ready to conclude that Cuccinelli received 624 votes, Shannon received 224 votes, and there were 57 write-ins or no votes for Attorney General. After this conclusion was reached, the audit coordinator informed the audit officials that the SOR in-dicated Cuccinelli received 622 votes, Shannon received 226 votes, and there were 57 write-ins or no votes.
Audit officials then reexamined their stacks to ensure that each stack of 100 ballots included 20 groups of five ballots, which they did. Audit officials then decided to examine all ballots in the pile for Cuccinelli to see if there were ballots cast for Shannon that an audit official mistakenly placed in the Cuccinelli pile. During this process, one audit official found two ballots clearly marked for Shannon that were in the Cuccinelli pile. These two ballots were removed from the Cuccinelli total and added to the Shannon total, resulting in 622 votes for Cuccinelli and 226 votes for Shannon—matching the SOR totals.
The audit of precinct 401 concluded at 3:07, with the audit officials and audit coordinator concurring that the audit results matched the election day results. The time and results of the audit of pre-cinct 401 are summarized in Table C-2.
Table C-2: Page County Precinct 401 Audit Findings
Ballots and Time Results
Statement of
Results Audit Difference
(SOR – Audit) Ballots audited 905 Cuccinelli 622 622 0 Total audit time (minutes) 112 Shannon 226 226 0
Ballots audited / minute 8.0 Write-ins/ under-votes/ over-votes
57 57 0
Ballots audited / person / minute 4.0 Totals 905 905 0
Source: JLARC staff analysis of pilot audit of Page County precinct 401.
CITY OF CHARLOTTESVILLE PILOT AUDIT
The City of Charlottesville pilot audit occurred on February 18, 2010 at the City’s General Registrar’s office in the City Hall An-nex. The Charlottesville registrar served as the audit coordinator, while two JLARC staff served as audit officials. Two Char-lottesville registrar staff, one SBE staff, and one interested citizen observed the audit. The race for the Democratic nominee for Gov-ernor from the June 2009 Democratic primary was the race select-ed for the audit. The three candidates were R. Creigh Deeds, Brian J. Moran, and Terry R. McAuliffe. Only absentee ballots mailed in-
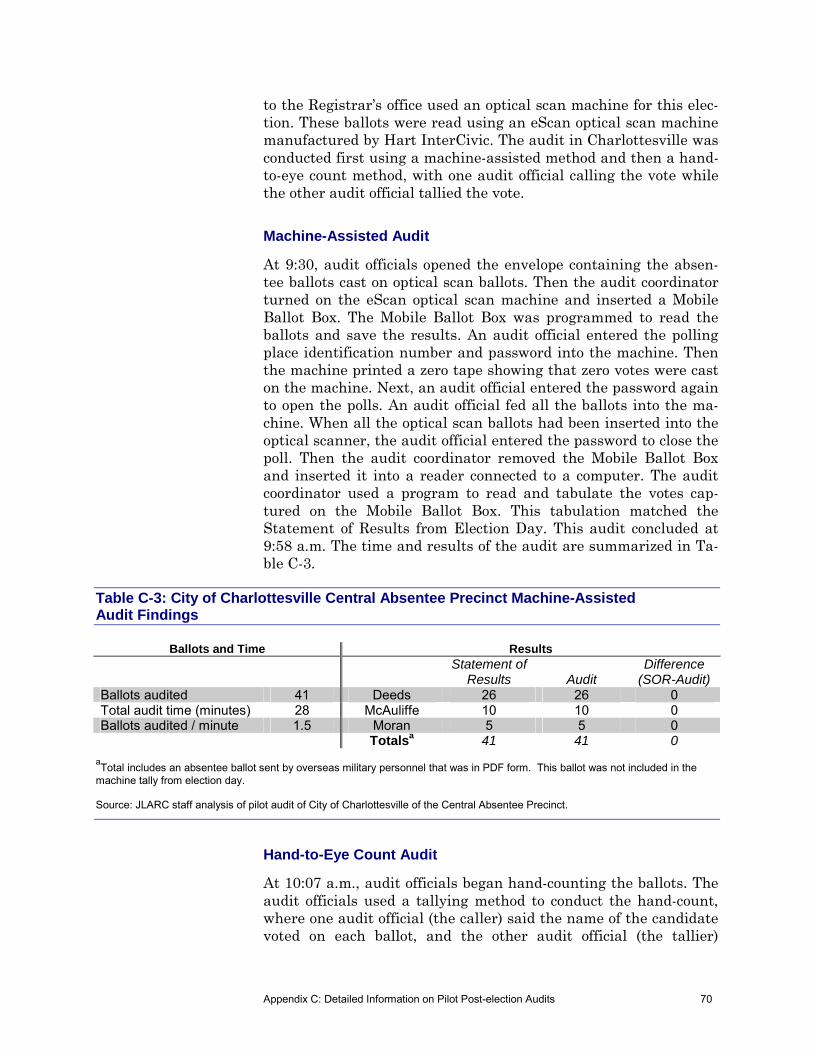
Appendix C: Detailed Information on Pilot Post-election Audits 70
to the Registrar’s office used an optical scan machine for this elec-tion. These ballots were read using an eScan optical scan machine manufactured by Hart InterCivic. The audit in Charlottesville was conducted first using a machine-assisted method and then a hand-to-eye count method, with one audit official calling the vote while the other audit official tallied the vote.
Machine-Assisted Audit
At 9:30, audit officials opened the envelope containing the absen-tee ballots cast on optical scan ballots. Then the audit coordinator turned on the eScan optical scan machine and inserted a Mobile Ballot Box. The Mobile Ballot Box was programmed to read the ballots and save the results. An audit official entered the polling place identification number and password into the machine. Then the machine printed a zero tape showing that zero votes were cast on the machine. Next, an audit official entered the password again to open the polls. An audit official fed all the ballots into the ma-chine. When all the optical scan ballots had been inserted into the optical scanner, the audit official entered the password to close the poll. Then the audit coordinator removed the Mobile Ballot Box and inserted it into a reader connected to a computer. The audit coordinator used a program to read and tabulate the votes cap-tured on the Mobile Ballot Box. This tabulation matched the Statement of Results from Election Day. This audit concluded at 9:58 a.m. The time and results of the audit are summarized in Ta-ble C-3.
Table C-3: City of Charlottesville Central Absentee Precinct Machine-Assisted Audit Findings
Ballots and Time Results
Statement of
Results Audit Difference
(SOR-Audit) Ballots audited 41 Deeds 26 26 0 Total audit time (minutes) 28 McAuliffe 10 10 0 Ballots audited / minute 1.5 Moran 5 5 0
Totalsa 41 41 0 aTotal includes an absentee ballot sent by overseas military personnel that was in PDF form. This ballot was not included in the machine tally from election day. Source: JLARC staff analysis of pilot audit of City of Charlottesville of the Central Absentee Precinct.
Hand-to-Eye Count Audit
At 10:07 a.m., audit officials began hand-counting the ballots. The audit officials used a tallying method to conduct the hand-count, where one audit official (the caller) said the name of the candidate voted on each ballot, and the other audit official (the tallier)
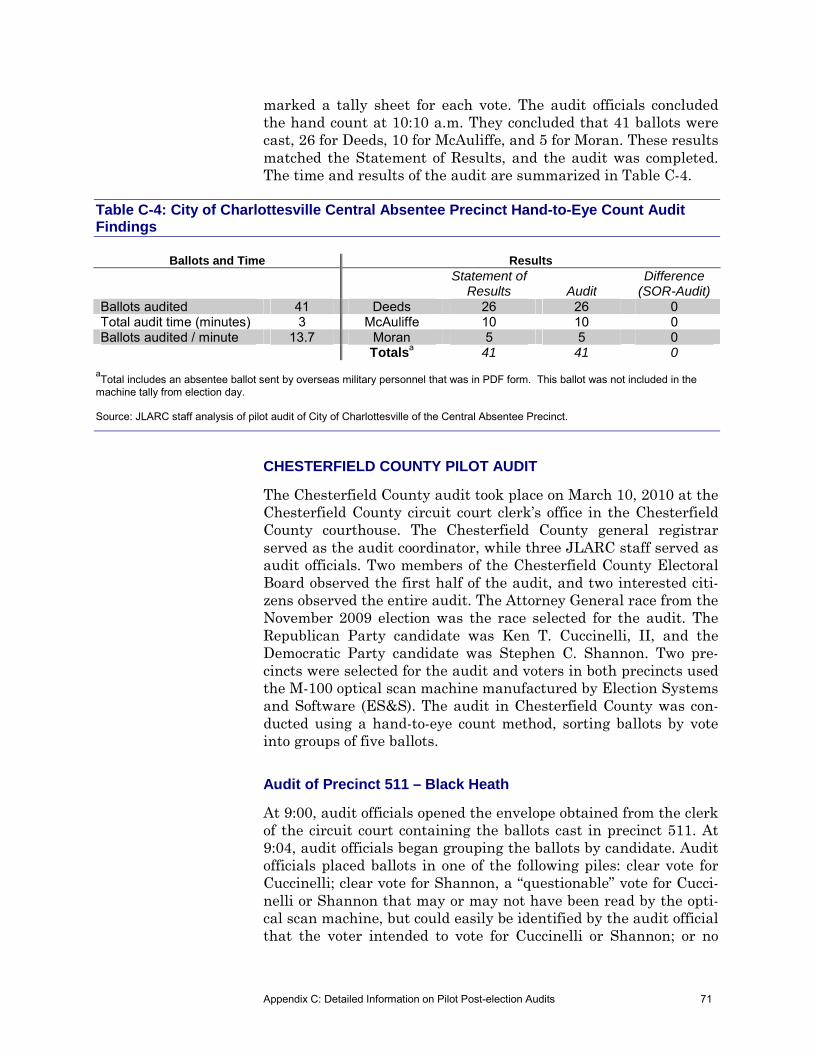
Appendix C: Detailed Information on Pilot Post-election Audits 71
marked a tally sheet for each vote. The audit officials concluded the hand count at 10:10 a.m. They concluded that 41 ballots were cast, 26 for Deeds, 10 for McAuliffe, and 5 for Moran. These results matched the Statement of Results, and the audit was completed. The time and results of the audit are summarized in Table C-4.
Table C-4: City of Charlottesville Central Absentee Precinct Hand-to-Eye Count Audit Findings
Ballots and Time Results
Statement of
Results Audit Difference
(SOR-Audit) Ballots audited 41 Deeds 26 26 0 Total audit time (minutes) 3 McAuliffe 10 10 0 Ballots audited / minute 13.7 Moran 5 5 0
Totalsa 41 41 0 aTotal includes an absentee ballot sent by overseas military personnel that was in PDF form. This ballot was not included in the machine tally from election day. Source: JLARC staff analysis of pilot audit of City of Charlottesville of the Central Absentee Precinct.
CHESTERFIELD COUNTY PILOT AUDIT
The Chesterfield County audit took place on March 10, 2010 at the Chesterfield County circuit court clerk’s office in the Chesterfield County courthouse. The Chesterfield County general registrar served as the audit coordinator, while three JLARC staff served as audit officials. Two members of the Chesterfield County Electoral Board observed the first half of the audit, and two interested citi-zens observed the entire audit. The Attorney General race from the November 2009 election was the race selected for the audit. The Republican Party candidate was Ken T. Cuccinelli, II, and the Democratic Party candidate was Stephen C. Shannon. Two pre-cincts were selected for the audit and voters in both precincts used the M-100 optical scan machine manufactured by Election Systems and Software (ES&S). The audit in Chesterfield County was con-ducted using a hand-to-eye count method, sorting ballots by vote into groups of five ballots.
Audit of Precinct 511 – Black Heath
At 9:00, audit officials opened the envelope obtained from the clerk of the circuit court containing the ballots cast in precinct 511. At 9:04, audit officials began grouping the ballots by candidate. Audit officials placed ballots in one of the following piles: clear vote for Cuccinelli; clear vote for Shannon, a “questionable” vote for Cucci-nelli or Shannon that may or may not have been read by the opti-cal scan machine, but could easily be identified by the audit official that the voter intended to vote for Cuccinelli or Shannon; or no

Appendix C: Detailed Information on Pilot Post-election Audits 72
vote for Attorney General. Once any of these piles reached five bal-lots the group of five ballots was placed in a larger stack of similar-ly cast ballots. Each larger stack was to include 20 stacks of 5 bal-lots, for a stack of 100 ballots.
Once all the ballots were sorted and stacked, the audit coordinator gave one of the audit officials a separate envelope containing the write-in votes for the precinct. This envelope contained ballots on which a voter wrote-in a candidate for any office. Most of the bal-lots in this envelope contained a write-in vote for some office other than Attorney General. The audit officials sorted these votes into the same categories as used for other ballots, plus they added a stack for write-in votes. The audit officials kept these ballots seg-regated from the other ballots to ensure that they were returned to the separate write-in envelope at the end of the audit.
The audit officials concluded their sorting at 9:50 and began com-piling a total. At 10:10, the audit officials concluded that there were a total of 1,227 ballots. After this conclusion was reached, the audit coordinator informed the audit officials that the Statement of Results (SOR) indicated there were 1,230 ballots read by the ma-chine on election day. Audit officials then reexamined their stacks to ensure that each stack of 100 ballots included 20 groups of five ballots, which they did. Audit officials then reexamined each group of five ballots to ensure that each included exactly five. During this process, the audit officials found three groups of five ballots that actually included six ballots. These three additional ballots were then added to the initial count of 1,227, resulting in 1,230 total ballots which matched the total on the SOR. This process lasted until 10:27.
Then the audit officials began totaling votes for each candidate concluding at 10:33. The audit officials concluded that Cuccinelli received 907 votes, Shannon received 316 votes, and there were 7 write-ins or no votes for Attorney General. After this conclusion was reached, the audit coordinator informed the audit officials that the SOR indicated that Cuccinelli receive 905 votes, Shannon re-ceived 318 votes, and there were 7 write-ins or no votes.
At 10:36, the audit officials began reexamining all ballots in the Cuccinelli piles to see if there were any ballots cast for Shannon that an audit official mistakenly placed in a Cuccinelli pile. During this process, the audit officials found two ballots clearly marked for Shannon that were in the Cuccinelli pile. These two ballots were removed from the Cuccinelli total and added to the Shannon total, resulting in 905 votes for Cuccinelli and 318 votes for Shannon—matching the SOR totals. The process concluded at 10:51.

Appendix C: Detailed Information on Pilot Post-election Audits 73
The audit of precinct 511 concluded at 10:51, with the audit offi-cials and audit coordinator concurring that the audit results matched the election day results. The time and results of the audit of precinct 511 are summarized in Table C-5.
Table C-5: Chesterfield County Precinct 511 Audit Findings
Ballots and Time Results
Statement of
Results Audit Difference
(SOR – Audit) Ballots audited 1,230 Cuccinelli 905 905 0 Total audit time (minutes) 111 Shannon 318 318 0
Ballots audited / minute 11.1 Write-ins / under-votes / over-votes
7 7 0
Ballots audited / person / minute 3.7 Totals 1,230 1,230 0
Source: JLARC staff analysis of pilot audit of Chesterfield County precinct 511.
Audit of Precinct 307 – Cosby
At 12:35, the audit officials opened the envelopes containing the ballots for precinct 307, and they began sorting and stacking the ballots. Audit officials used the same sorting method they had used earlier in the day for precinct 511 for precinct 307. Audit officials looked at each ballot, and placed ballots in one of five piles. Once any of these piles reached five ballots, the group of five ballots was placed in a larger stack of similarly cast ballots. Each larger stack was to include 20 stacks of 5 ballots, for a stack of 100 ballots. Again, when all the ballots had been sorted and stacked, the audit coordinator gave an audit official the envelope for write-in ballots. The audit officials added these ballots into the totals as appropri-ate. At 1:18, all ballots had been sorted and stacked, and the audit officials began totaling the ballots. At 1:25, the audit officials con-cluded there were 1,212 ballots. The audit coordinator informed the audit officials that this total matched the total on the SOR.
Then the audit officials began totaling votes for each candidate at 1:30, and they concluded at 1:32. The audit officials concluded that Cuccinelli received 898 votes, Shannon received 310 votes, and there were 4 write-ins or no votes for Attorney General. After this conclusion was reached, the audit coordinator informed the audit officials that the SOR indicated that Cuccinelli received 897 votes, Shannon received 311 votes, and there were 4 write-ins or no votes.
At 1:32, the audit officials began reexamining all ballots in the Cuccinelli piles to see if there were any ballots cast for Shannon that an audit official mistakenly placed in a Cuccinelli pile. During
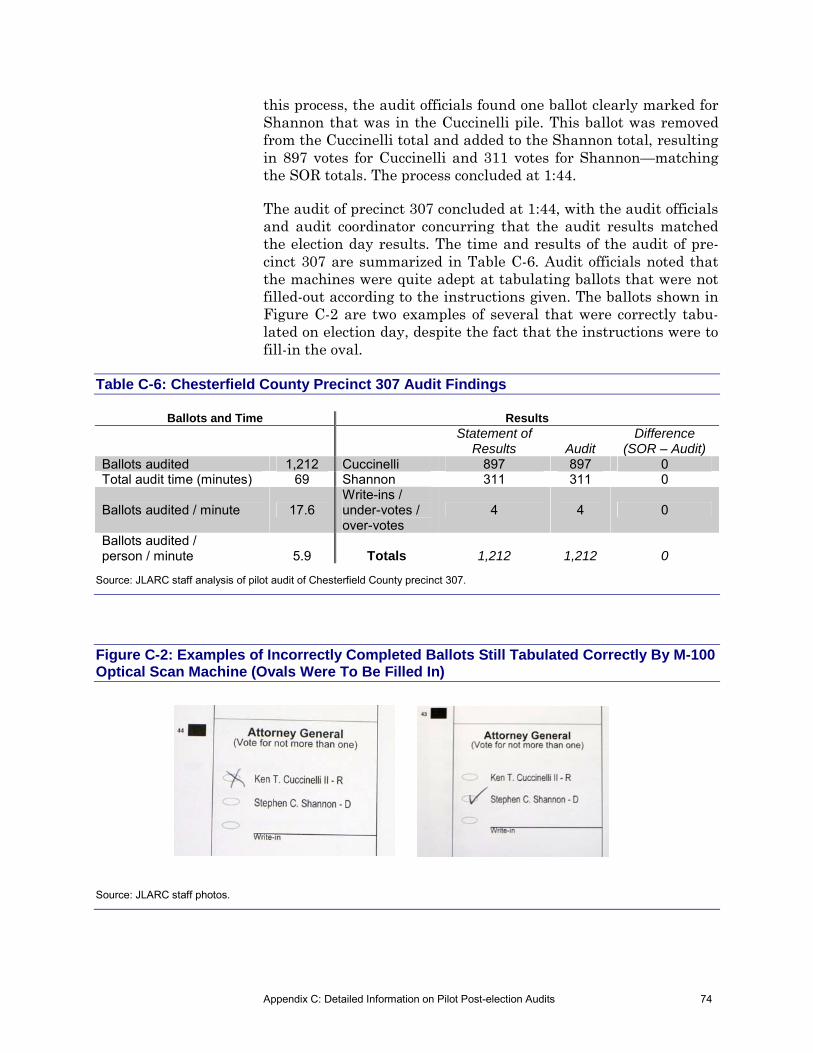
Appendix C: Detailed Information on Pilot Post-election Audits 74
this process, the audit officials found one ballot clearly marked for Shannon that was in the Cuccinelli pile. This ballot was removed from the Cuccinelli total and added to the Shannon total, resulting in 897 votes for Cuccinelli and 311 votes for Shannon—matching the SOR totals. The process concluded at 1:44.
The audit of precinct 307 concluded at 1:44, with the audit officials and audit coordinator concurring that the audit results matched the election day results. The time and results of the audit of pre-cinct 307 are summarized in Table C-6. Audit officials noted that the machines were quite adept at tabulating ballots that were not filled-out according to the instructions given. The ballots shown in Figure C-2 are two examples of several that were correctly tabu-lated on election day, despite the fact that the instructions were to fill-in the oval.
Table C-6: Chesterfield County Precinct 307 Audit Findings
Ballots and Time Results
Statement of
Results Audit Difference
(SOR – Audit) Ballots audited 1,212 Cuccinelli 897 897 0 Total audit time (minutes) 69 Shannon 311 311 0
Ballots audited / minute 17.6 Write-ins / under-votes / over-votes
4 4 0
Ballots audited / person / minute 5.9 Totals 1,212 1,212 0
Source: JLARC staff analysis of pilot audit of Chesterfield County precinct 307.
Figure C-2: Examples of Incorrectly Completed Ballots Still Tabulated Correctly By M-100 Optical Scan Machine (Ovals Were To Be Filled In)
Source: JLARC staff photos.

Appendix C: Detailed Information on Pilot Post-election Audits 75
FAIRFAX COUNTY PILOT AUDIT
The Fairfax County audit took place on March 15, 2010 at the Fairfax County courthouse. The Fairfax County general registrar served as the audit coordinator, while six Fairfax County general registrar staff served as audit officials. Two JLARC staff observed the audits, provided general guidance upon request, and took notes on the procedures used and time. Two members of the Fairfax County Electoral Board observed part of the audit, and one inter-ested citizen observed the entire audit. The House of Delegates District 45 race from the November 2009 election was the race se-lected for the audit. The Republican Party candidate was Vicki L. Vasques and the Democratic Party candidate was David L. Englin. Three precincts were selected for the audit and voters in all three precincts could choose to vote on a WinVote DRE or on an optical scan ballot fed through an AccuVote optical scanner manufactured by Premier Election Solutions. These three audits only audited those ballots cast on the optical scanners. The audit in Fairfax County was first conducted using a machine-assisted method, and then conducted using a hand-to-eye count method (Figure C-3).
Figure C-3: Machine-Assisted and Hand-to-eye Count Audit in Fairfax County
Source: JLARC staff photos taken at Fairfax County post-election audit pilot, March 15, 2010.
Machine-Assisted Audit
When JLARC staff arrived at the audit location, the ballots and optical scanners were locked in a secure storage area in the court-house. The chief deputy clerk of the Fairfax County circuit court led the audit coordinator, two audit officials and the two JLARC staff to this area to retrieve the optical scanners and ballots. Upon their return to the conference room hosting the audit at 8:53, the audit officials began to set the optical scanners up for use. Each optical scanner required approximately five minutes of set-up time.
Machine-assisted Count Hand-to-eye Count
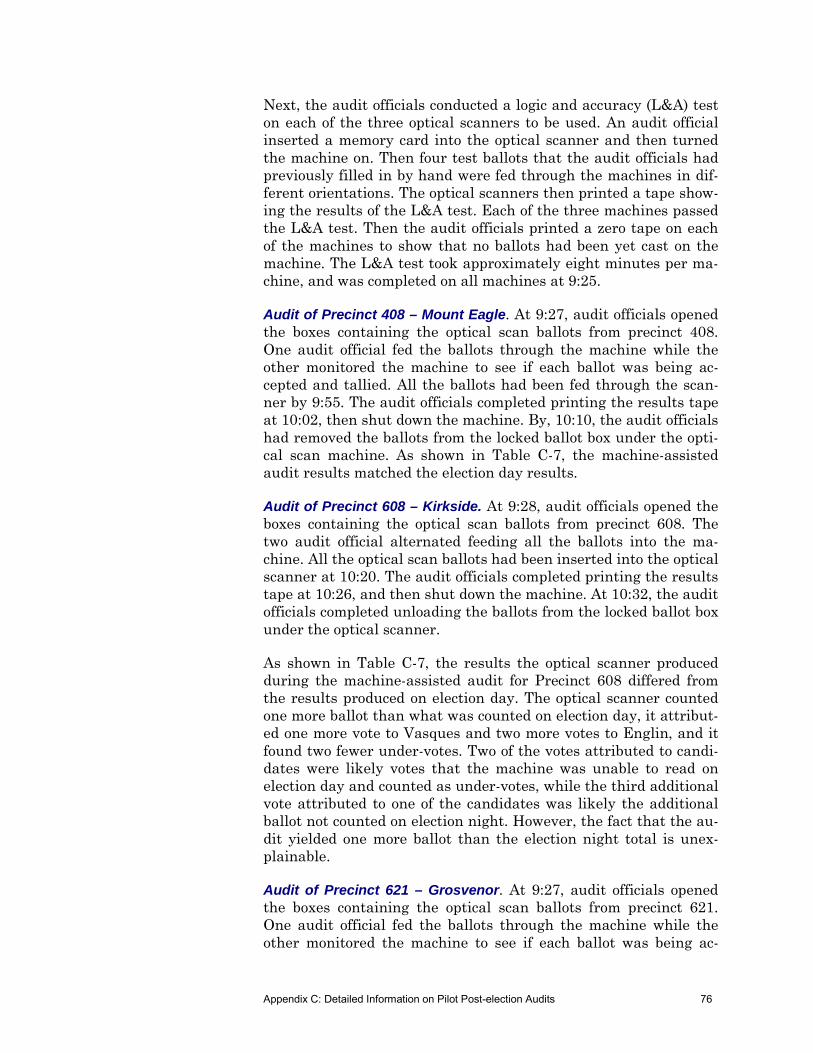
Appendix C: Detailed Information on Pilot Post-election Audits 76
Next, the audit officials conducted a logic and accuracy (L&A) test on each of the three optical scanners to be used. An audit official inserted a memory card into the optical scanner and then turned the machine on. Then four test ballots that the audit officials had previously filled in by hand were fed through the machines in dif-ferent orientations. The optical scanners then printed a tape show-ing the results of the L&A test. Each of the three machines passed the L&A test. Then the audit officials printed a zero tape on each of the machines to show that no ballots had been yet cast on the machine. The L&A test took approximately eight minutes per ma-chine, and was completed on all machines at 9:25.
Audit of Precinct 408 – Mount Eagle. At 9:27, audit officials opened the boxes containing the optical scan ballots from precinct 408. One audit official fed the ballots through the machine while the other monitored the machine to see if each ballot was being ac-cepted and tallied. All the ballots had been fed through the scan-ner by 9:55. The audit officials completed printing the results tape at 10:02, then shut down the machine. By, 10:10, the audit officials had removed the ballots from the locked ballot box under the opti-cal scan machine. As shown in Table C-7, the machine-assisted audit results matched the election day results.
Audit of Precinct 608 – Kirkside. At 9:28, audit officials opened the boxes containing the optical scan ballots from precinct 608. The two audit official alternated feeding all the ballots into the ma-chine. All the optical scan ballots had been inserted into the optical scanner at 10:20. The audit officials completed printing the results tape at 10:26, and then shut down the machine. At 10:32, the audit officials completed unloading the ballots from the locked ballot box under the optical scanner.
As shown in Table C-7, the results the optical scanner produced during the machine-assisted audit for Precinct 608 differed from the results produced on election day. The optical scanner counted one more ballot than what was counted on election day, it attribut-ed one more vote to Vasques and two more votes to Englin, and it found two fewer under-votes. Two of the votes attributed to candi-dates were likely votes that the machine was unable to read on election day and counted as under-votes, while the third additional vote attributed to one of the candidates was likely the additional ballot not counted on election night. However, the fact that the au-dit yielded one more ballot than the election night total is unex-plainable.
Audit of Precinct 621 – Grosvenor. At 9:27, audit officials opened the boxes containing the optical scan ballots from precinct 621. One audit official fed the ballots through the machine while the other monitored the machine to see if each ballot was being ac-

Appendix C: Detailed Information on Pilot Post-election Audits 77
cepted and tallied. All the ballots had been fed through the scan-ner by 9:51. The audit officials completed printing the results tape at 9:54, then shut down the machine. By, 10:01, the audit officials had removed the ballots from the locked ballot box under the opti-cal scan machine. As shown in Table C-7, the machine-assisted audit results matched the election day results.
Table C-7: Fairfax County Machine-Assisted Audit Findings
Precinct 408 – Mount Eagle Machine-Assisted Audit Findings Ballots and Time Results
Statement of
Results Audit Difference
(SOR – Audit) Ballots audited 519 Vasques 150 150 0 Total audit time (minutes) 50 Englin 360 360 0
Ballots audited / minute 10.4 Write-ins / under-votes / over-votes
9 9 0
Ballots audited / person / minute 5.2 Totals 519 519 0
Precinct 608 – Kirkside Machine-Assisted Audit FindingsBallots and Time Results
Statement of
Results Audit Difference
(SOR – Audit) Ballots audited 902 Vasques 299 300 -1a Total audit time (minutes) 72 Englin 591 593 -2 a
Ballots audited / minute 12.5 Write-ins / under-votes / over-votes
11 9 2 a
Ballots audited / person / minute 6.3 Totals 901 902 -1b
Precinct 621 – Grosvenor Machine-Assisted Audit Findings Ballots and Time Results
Statement of
Results Audit Difference
(SOR – Audit) Ballots audited 439 Vasques 163 163 0 Total audit time (minutes) 42 Englin 271 271 0
Ballots audited / minute 10.5
Write-ins / under-votes / over-votes
5 5 0
Ballots audited / person / minute 5.2 Totals 439 439 0
aAudit officials concluded these ballots were not read by the optical scan machine and were counted as under-votes on election day, but these ballots could be identified by the audit official as being cast by the voter for one candidate or the other. bThe Statement of Results for election day reported a total of 901 optical scan votes; however, both the machine-assisted and hand count audits had totals of 902 optical scan votes. This difference is unexplainable. Source: JLARC staff analysis of pilot audit of Fairfax County machine-assisted audit.
Hand-to-Eye Count Audit
Following a brief break, the audit coordinator assigned each team of audit officials to the same precinct they counted in the machine-
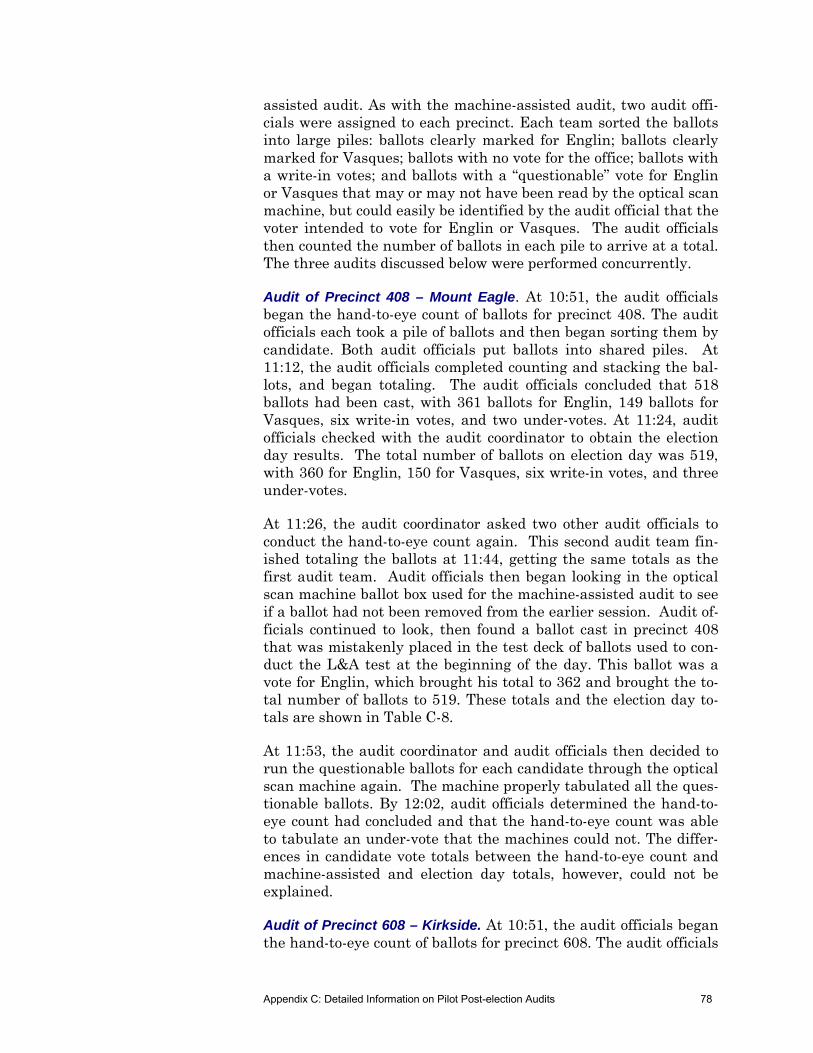
Appendix C: Detailed Information on Pilot Post-election Audits 78
assisted audit. As with the machine-assisted audit, two audit offi-cials were assigned to each precinct. Each team sorted the ballots into large piles: ballots clearly marked for Englin; ballots clearly marked for Vasques; ballots with no vote for the office; ballots with a write-in votes; and ballots with a “questionable” vote for Englin or Vasques that may or may not have been read by the optical scan machine, but could easily be identified by the audit official that the voter intended to vote for Englin or Vasques. The audit officials then counted the number of ballots in each pile to arrive at a total. The three audits discussed below were performed concurrently.
Audit of Precinct 408 – Mount Eagle. At 10:51, the audit officials began the hand-to-eye count of ballots for precinct 408. The audit officials each took a pile of ballots and then began sorting them by candidate. Both audit officials put ballots into shared piles. At 11:12, the audit officials completed counting and stacking the bal-lots, and began totaling. The audit officials concluded that 518 ballots had been cast, with 361 ballots for Englin, 149 ballots for Vasques, six write-in votes, and two under-votes. At 11:24, audit officials checked with the audit coordinator to obtain the election day results. The total number of ballots on election day was 519, with 360 for Englin, 150 for Vasques, six write-in votes, and three under-votes.
At 11:26, the audit coordinator asked two other audit officials to conduct the hand-to-eye count again. This second audit team fin-ished totaling the ballots at 11:44, getting the same totals as the first audit team. Audit officials then began looking in the optical scan machine ballot box used for the machine-assisted audit to see if a ballot had not been removed from the earlier session. Audit of-ficials continued to look, then found a ballot cast in precinct 408 that was mistakenly placed in the test deck of ballots used to con-duct the L&A test at the beginning of the day. This ballot was a vote for Englin, which brought his total to 362 and brought the to-tal number of ballots to 519. These totals and the election day to-tals are shown in Table C-8.
At 11:53, the audit coordinator and audit officials then decided to run the questionable ballots for each candidate through the optical scan machine again. The machine properly tabulated all the ques-tionable ballots. By 12:02, audit officials determined the hand-to-eye count had concluded and that the hand-to-eye count was able to tabulate an under-vote that the machines could not. The differ-ences in candidate vote totals between the hand-to-eye count and machine-assisted and election day totals, however, could not be explained.
Audit of Precinct 608 – Kirkside. At 10:51, the audit officials began the hand-to-eye count of ballots for precinct 608. The audit officials

Appendix C: Detailed Information on Pilot Post-election Audits 79
divided the pile in half and began by sorting ballots by candidate. Each audit official had their own piles of ballots, organized as dis-cussed above. At 11:13, the audit officials completed sorting the ballots by candidate and started counting the ballots by ten mak-ing stacks of 100 ballots.
The audit officials completed counting and stacking the ballots at 11:30 and they began totaling the ballots. The audit officials con-cluded that 902 ballots had been cast in the election with 596 votes cast for Englin, 301 votes cast for Vasques, one write-in votes, and four under-votes. The audit coordinator informed the audit officials that the election day tally had counted 901 ballots with 591 votes for Englin, 299 votes for Vasques, one write-in vote, and ten under-votes. These totals are shown in Table C-8.
At 11:55, the audit coordinator and audit officials decided to run the questionable ballots for each candidate through the optical scan machine again. The audit officials fed five ballots through the machine, which they had previously segregated as ballots with a “questionable” vote for Englin or Vasques that may or may not have been read by the optical scan machine, but could easily be identified by the audit official that the voter intended to vote for Englin or Vasques. The machine properly tabulated three of these questionable ballots. One vote that was not tabulated by the ma-chine had only a very thinly marked check in the target area for Vasques, as shown in Figure C-3. The other vote that was not tab-ulated did not have any mark in the target areas for either candi-date, but the “D” next to Englin’s name was colored in, as shown in Figure C-4. Since the machine did not read these ballots, they are not included in the totals for the candidates.
Figure C-4: "Questionable" Votes in Precinct 608
Source: Hand-to-Eye Count Pilot Post-election Audit, Fairfax County, March 15, 2010.
The audit officials concluded that four of the additional votes they had attributed to candidates were likely counted as under-votes by the optical scanner on election day because they contained non-standard marks. They also concluded that a fifth additional vote

Appendix C: Detailed Information on Pilot Post-election Audits 80
they had attributed to a candidate was likely the extra ballot that had not been counted on election day. However, it was unclear why one more ballot was counted during the audit than on election day. The audit concluded at 12:22.
Audit of Precinct 621 – Grosvenor. At 10:51, the audit officials be-gan the hand-to-eye count of ballots for precinct 621. The audit of-ficials each took a pile of ballots and then began sorting them by candidate. Both audit officials put ballots into shared piles. At 11:10, the audit officials completed counting and stacking the bal-lots and began getting a total. The audit officials concluded that 439 ballots had been cast, with 271 ballots for Englin, 163 for Vasques, zero write-in votes, and five under-votes. At 11:19, audit officials checked with the audit coordinator to obtain the election day results. As shown in Table C-8, the hand-to-eye count totals matched the election day totals.

Appendix C: Detailed Information on Pilot Post-election Audits 81
Table C-8: Fairfax County Hand-to-Eye Count Audit Findings
Precinct 408 – Mount Eagle Hand-to-Eye Count Audit Findings Ballots and Time Results
Statement of
Results Audit Difference
(SOR – Audit) Ballots audited 519 Vasques 150 149 1 Total audit time (minutes) 71 Englin 360 362 -2
Ballots audited / minute 7.3 Write-ins / under-votes / over-votes
9 8 1
Ballots audited / person / minute 3.6
Totals 519 519 0 Precinct 608 – Kirkside Hand-to-Eye Count Audit Findings
Ballots and Time Results
Statement of
Results Audit Difference
(SOR – Audit) Ballots audited 902 Vasques 299 300 b -1a, b Total audit time (minutes) 91 Englin 591 595 b -4 a, b
Ballots audited / minute 9.9
Write-ins / under-votes / over-votes
11 7 b 4 b
Ballots audited / person / minute 5.0
Totals 901 902 -1c Precinct 621 – Grosvenor Hand-to-Eye Count Audit Findings
Ballots and Time Results
Statement of
Results Audit Difference
(SOR – Audit) Ballots audited 439 Vasques 163 163 0 Total audit time (minutes) 28 Englin 271 271 0
Ballots audited / minute 15.7 Write-ins / under-votes / over-votes
5 5 0
Ballots audited / person / minute 7.8 Totals 439 439 0
aAudit officials concluded that four of these five additional votes attributed to candidates in the hand count audit were ballots that were not read by the optical scan machine and were counted as under-votes on election day, but these ballots could be identified by the audit official as being cast by the voter for one candidate or the other. One of these additional ballots was the additional ballot that was not included in the election day total. bAlthough the audit officials counted attributed two ballots to candidates, one to Vasques and one to Englin, that they were able to interpret but the optical scanner could not read (these votes are pictured in Figure C-4), these votes are not attributed to the candi-dates in these totals, and rather are counted in this table as under-votes. cThe statement of results for election day reported a total of 901 optical scan votes; however, both the machine-assisted and hand count audits had totals of 902 optical scan votes. This difference is unexplainable. Source: JLARC staff analysis of pilot audit of Fairfax County hand-to-eye count audit.

Appendix C: Detailed Information on Pilot Post-election Audits 82

Appendix D: Post-election Audits in Other States 83
To collect current and accurate information regarding other states’ post-election audit programs, JLARC staff administered a survey to state-level election staff in other states. The National Associa-tion of State Election Directors (NASED) distributed the survey to their members, and staff in 25 states responded, including the Dis-trict of Columbia. Of those who responded to the survey, 13 states plus the District of Columbia indicated that they had a post-election audit program in place. These states’ responses to a selec-tion of the survey questions regarding their post-election audit program are shown in the table.
Table D-1: Audit Design and Implementation
State
Year of most
recent revision to audit
law
Method to
conduct audits
When are audits conducted?
Sample size
selection strategy Who conducts audits?
Who funds audits?
AZ 2009 HTEC After certification, before recount deadline
FP Party appointees Local
AR 2009 Combo Before certification FP Local election staff; State employees; Poll workers; Volunteers
--
CO 2009 Combo Before certification AP Poll workers LocalCT 2007 HTEC Before certification FP Local election staff; Poll workers LocalDC 2009 Combo After certification,
before recount deadline AP Local election staff; Poll workers;
Volunteers N/A
FL N/A HTEC After certification, before recount deadline
FP Poll workers; Volunteers Local
IL 2007 MA Before certification FP Local election staff LocalMT 2009 HTEC Before certification FP Local election staff; State employees;
Volunteers State
NV 2007 Combo Before certification FP Local election staff LocalNC 2005 HTEC Before certification AP Local election staff LocalPA Prior to
1990 Combo Before certification AP Local election staff Local
WA 2005 HTEC Before certification FP Local election staff SharedWV 2008 HTEC Before certification FP Local election staff LocalWI 2006 HTEC After recount deadline FP Local election staff; State election
staff State
Note: HTEC - Hand-to-Eye Count; MA - Machine-Assisted; FP - Fixed-percentage; AP - Adjustable-percentage. Source: JLARC staff survey of other states, January and February 2010.
Ap
pen
dix
DD PPoosstt--eelleeccttiioonn AAuuddiittss iinn OOtthheerr SSttaatteess
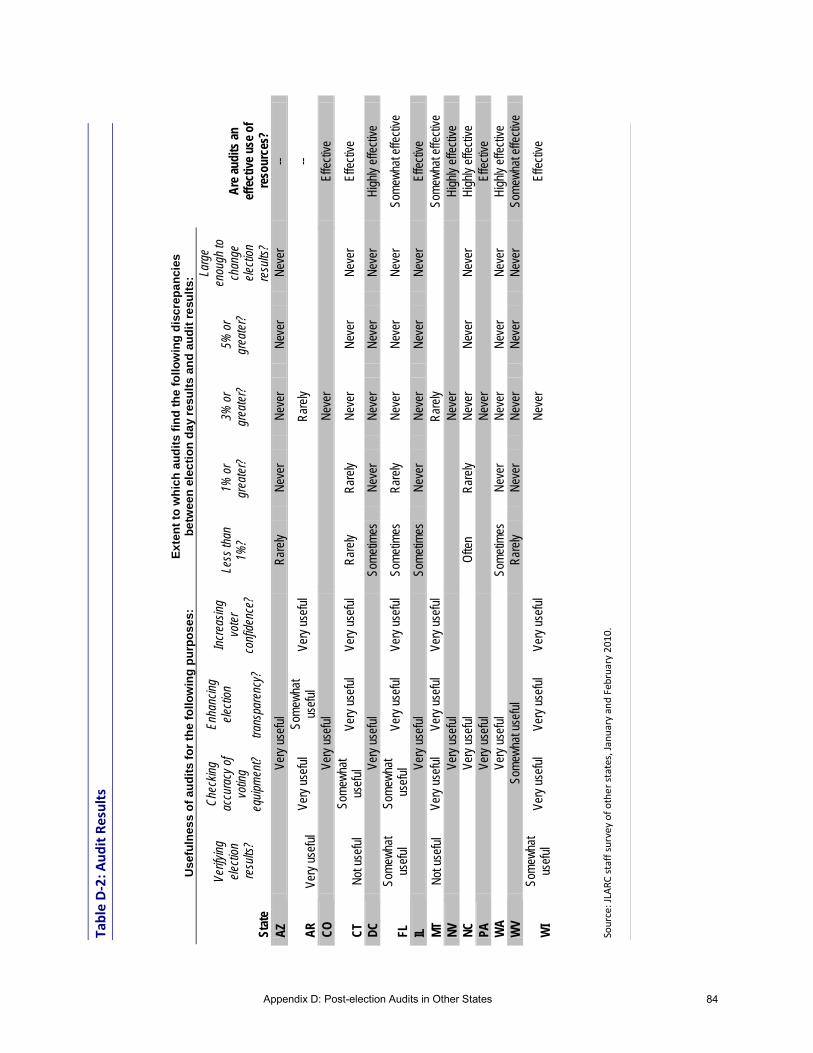
Appendix D: Post-election Audits in Other States 84
U
sefu
lnes
s o
f au
dit
s fo
r th
e fo
llow
ing
pu
rpo
ses
: E
xte
nt
to w
hic
h a
ud
its
fin
d t
he
follo
win
g d
iscr
epa
nci
es
be
twee
n e
lec
tio
n d
ay
resu
lts
and
au
dit
re
sult
s:
Stat
e
Verif
ying
ele
ction
re
sults
?
Chec
king
accu
racy
of
votin
g
equip
men
t?
Enha
ncing
ele
ction
trans
pare
ncy?
Incr
easin
g vo
ter
conf
idenc
e?
Less
than
1%
? 1%
or
grea
ter?
3%
or
grea
ter?
5%
or
grea
ter?
Larg
e en
ough
to
chan
ge
electi
on
resu
lts?
Are
aud
its a
n
effe
ctiv
e us
e of
re
sour
ces?
AZ
Very
use
ful
Rar
ely
Nev
er
Nev
er
Nev
er
Nev
er
--
AR
Ve
ry u
sefu
l Ve
ry u
sefu
l So
mew
hat
usef
ul
Very
use
ful
Rar
ely
--
CO
Ve
ry u
sefu
l N
ever
Ef
fect
ive
CT
Not
use
ful
Som
ewha
t us
eful
Ve
ry u
sefu
l Ve
ry u
sefu
l R
arel
y R
arel
y N
ever
N
ever
N
ever
Ef
fect
ive
DC
Ve
ry u
sefu
l So
met
imes
N
ever
N
ever
N
ever
N
ever
H
ighl
y ef
fect
ive
FL
Som
ewha
t us
eful
So
mew
hat
use
ful
Very
use
ful
Very
use
ful
Som
etim
es
Rar
ely
Nev
er
Nev
er
Nev
er
Som
ewha
t effe
ctiv
e
IL
Very
use
ful
Som
etim
es
Nev
er
Nev
er
Nev
er
Nev
er
Effe
ctiv
e M
T N
ot u
sefu
l Ve
ry u
sefu
l Ve
ry u
sefu
l Ve
ry u
sefu
l R
arel
y So
mew
hat e
ffect
ive
NV
Very
use
ful
Nev
er
Hig
hly
effe
ctiv
e N
C
Very
use
ful
Ofte
n R
arel
y N
ever
N
ever
N
ever
H
ighl
y ef
fect
ive
PA
Very
use
ful
Nev
er
Effe
ctiv
e W
A
Very
use
ful
Som
etim
es
Nev
er
Nev
er
Nev
er
Nev
er
Hig
hly
effe
ctiv
e W
V So
mew
hat u
sefu
l R
arel
y N
ever
N
ever
N
ever
N
ever
So
mew
hat e
ffect
ive
WI
Som
ewha
t us
eful
Ve
ry u
sefu
l Ve
ry u
sefu
l Ve
ry u
sefu
l N
ever
Ef
fect
ive
Tabl
e D-
2: A
udit
Resu
lts
Sour
ce: J
LARC
staf
f sur
vey
of o
ther
stat
es, J
anua
ry a
nd F
ebru
ary
2010
.
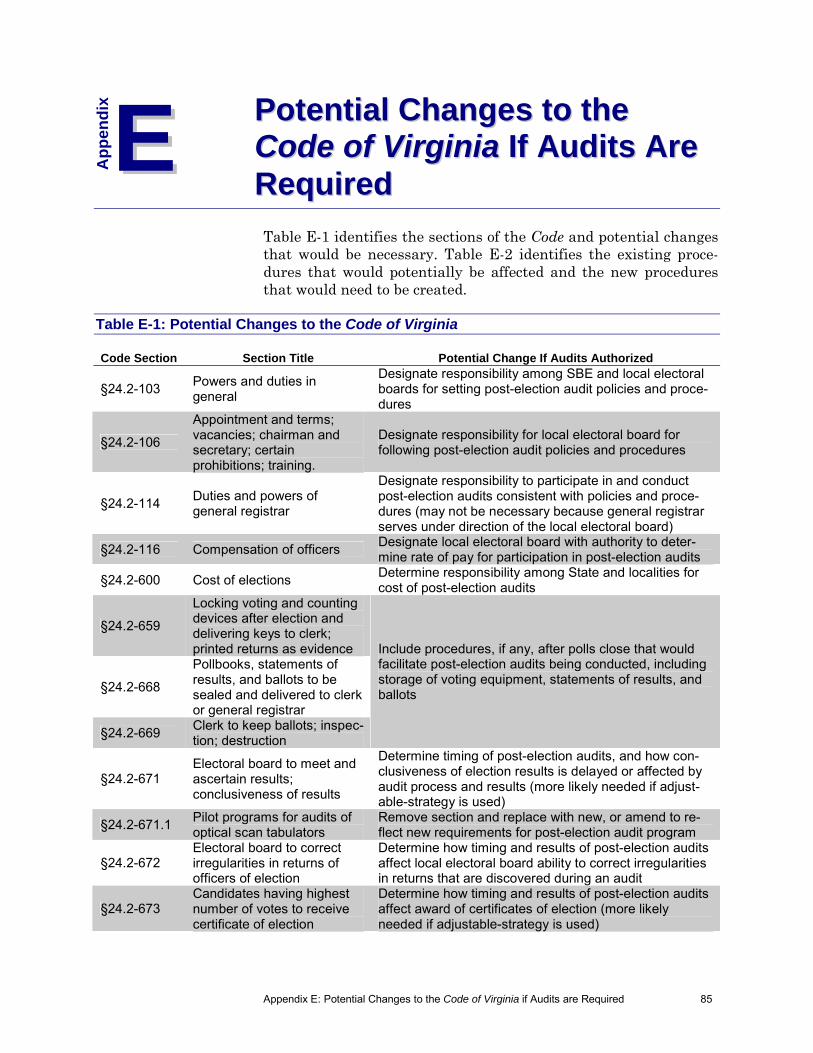
Appendix E: Potential Changes to the Code of Virginia if Audits are Required 85
Table E-1 identifies the sections of the Code and potential changes that would be necessary. Table E-2 identifies the existing proce-dures that would potentially be affected and the new procedures that would need to be created.
Table E-1: Potential Changes to the Code of Virginia Code Section Section Title Potential Change If Audits Authorized
§24.2-103 Powers and duties in general
Designate responsibility among SBE and local electoral boards for setting post-election audit policies and proce-dures
§24.2-106
Appointment and terms; vacancies; chairman and secretary; certain prohibitions; training.
Designate responsibility for local electoral board for following post-election audit policies and procedures
§24.2-114 Duties and powers of general registrar
Designate responsibility to participate in and conduct post-election audits consistent with policies and proce-dures (may not be necessary because general registrar serves under direction of the local electoral board)
§24.2-116 Compensation of officers Designate local electoral board with authority to deter-mine rate of pay for participation in post-election audits
§24.2-600 Cost of elections Determine responsibility among State and localities for cost of post-election audits
§24.2-659
Locking voting and counting devices after election and delivering keys to clerk; printed returns as evidence
§24.2-668
Pollbooks, statements of results, and ballots to be sealed and delivered to clerk or general registrar
§24.2-669 Clerk to keep ballots; inspec-tion; destruction
Include procedures, if any, after polls close that would facilitate post-election audits being conducted, including storage of voting equipment, statements of results, and ballots
§24.2-671 Electoral board to meet and ascertain results; conclusiveness of results
Determine timing of post-election audits, and how con-clusiveness of election results is delayed or affected by audit process and results (more likely needed if adjust-able-strategy is used)
§24.2-671.1 Pilot programs for audits of optical scan tabulators
Remove section and replace with new, or amend to re-flect new requirements for post-election audit program
§24.2-672 Electoral board to correct irregularities in returns of officers of election
Determine how timing and results of post-election audits affect local electoral board ability to correct irregularities in returns that are discovered during an audit
§24.2-673 Candidates having highest number of votes to receive certificate of election
Determine how timing and results of post-election audits affect award of certificates of election (more likely needed if adjustable-strategy is used)
Ap
pen
dix
EE
PPootteennttiiaall CChhaannggeess ttoo tthhee CCooddee ooff VViirrggiinniiaa IIff AAuuddiittss AArree RReeqquuiirreedd
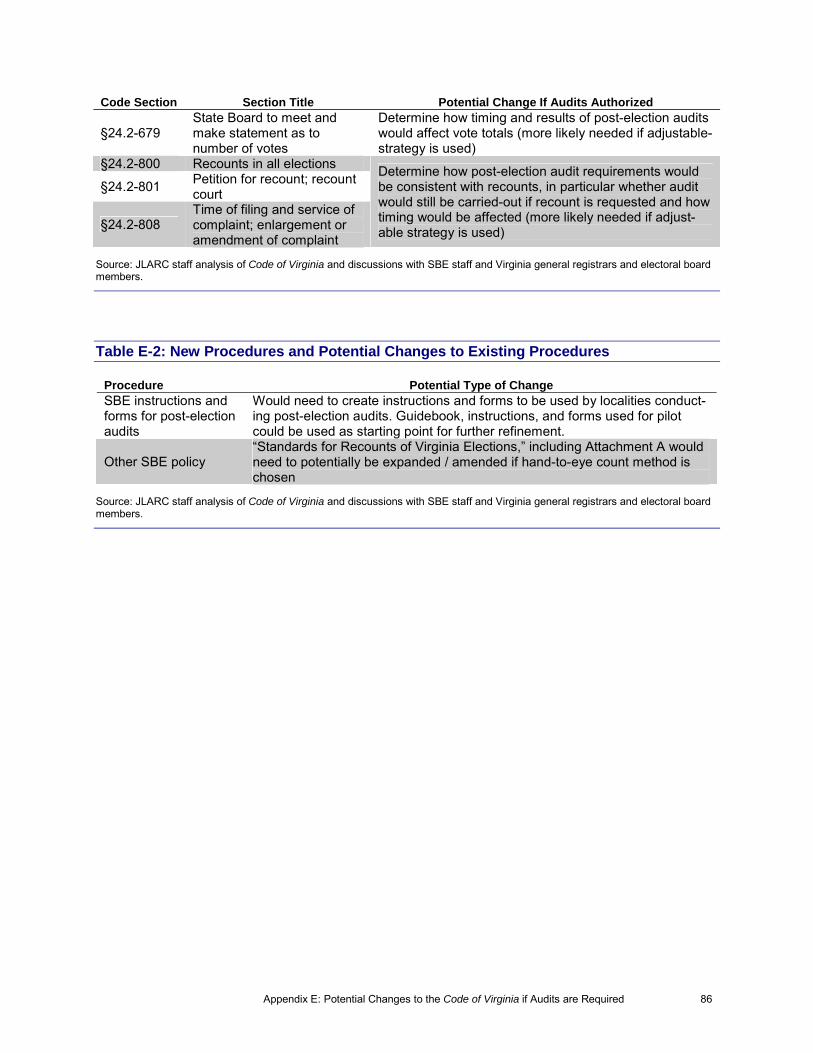
Appendix E: Potential Changes to the Code of Virginia if Audits are Required 86
Code Section Section Title Potential Change If Audits Authorized
§24.2-679 State Board to meet and make statement as to number of votes
Determine how timing and results of post-election audits would affect vote totals (more likely needed if adjustable-strategy is used)
§24.2-800 Recounts in all elections
§24.2-801 Petition for recount; recount court
§24.2-808 Time of filing and service of complaint; enlargement or amendment of complaint
Determine how post-election audit requirements would be consistent with recounts, in particular whether audit would still be carried-out if recount is requested and how timing would be affected (more likely needed if adjust-able strategy is used)
Source: JLARC staff analysis of Code of Virginia and discussions with SBE staff and Virginia general registrars and electoral board members.
Table E-2: New Procedures and Potential Changes to Existing Procedures
Procedure Potential Type of Change SBE instructions and forms for post-election audits
Would need to create instructions and forms to be used by localities conduct-ing post-election audits. Guidebook, instructions, and forms used for pilot could be used as starting point for further refinement.
Other SBE policy “Standards for Recounts of Virginia Elections,” including Attachment A would need to potentially be expanded / amended if hand-to-eye count method is chosen
Source: JLARC staff analysis of Code of Virginia and discussions with SBE staff and Virginia general registrars and electoral board members.
Appendix F: Agency Response 87
As a part of the extensive validation process, State agencies and other entities involved in a JLARC assessment are given the op-portunity to comment on an exposure draft of the report. Appro-priate technical corrections resulting from comments provided by these entities have been made in this version of the report. This appendix includes a written response from the State Board of Elec-tions.
Ap
pen
dix
FF AAggeennccyy RReessppoonnssee

Appendix F: Agency Response 88
Appendix F: Agency Response 89

Appendix F: Agency Response 90

JJLLAARRCC SSttaaffff
Executive Staff
Philip A. Leone, Director Glen S. Tittermary, Deputy Director
Division Chiefs
Robert B. Rotz, Senior Division Chief Harold E. Greer III, Division Chief
Section Managers
Paula C. Lambert, Fiscal & Administrative Services Gregory J. Rest, Research Methods Walter L. Smiley, Fiscal Analysis
Project Leaders
Aris W. Bearse Eric H. Messick Justin C. Brown Nathalie Molliet-Ribet Ashley S. Colvin Kimberly A. Sarte Martha L. Erwin
Project Staff
Janice G. Baab David A. Reynolds Jamie S. Bitz Tracey R. Smith Mark R. Gribbin Massey S. J. Whorley Bradley B. Marsh Christine D. Wolfe Ellen J. Miller Stefanie R. Papps
Administrative and Research Support Staff
Joan M. Irby Betsy M. Jackson
RReecceenntt JJLLAARRCC RReeppoorrttss
2009 Reports 384. Evaluation of HB 2337: Addendum to 2008 Evaluation of HB 615 and HB 669, Mandated Coverage of
Amino-Acid Based Formulas 385. Evaluation of HB 2191 and SB 1458: Mandated Coverage of Telehealth Services 386. Semi-Annual VRS Investment Report No. 32 387. Review of Department of General Services Internal Service Funds 388. Assessment of Services for Virginians With Autism Spectrum Disorders 389. 2009 Report to the General Assembly 390. Impact of eVA on Small Virginia Businesses 391. Review of Exemptions to the Virginia Administrative Process Act 392. Review of State Spending: 2009 Update 393. Operational and Capital Funding for District and Circuit Courts 394. Semi-Annual VRS Investment Report No. 33 395. State Spending on Standards of Quality (SOQ) Costs, FY 2009 2010 Reports 396. Virginia Compared to the Other States, 2010 Edition 397. Special Report: Assessment of the U.S. Bureau of Justice Statistics Report on Sexual Victimization in
Juvenile Correctional Centers 398. Review of Post-election Audits of Voting Equipment These reports are available on the JLARC website at http://jlarc.virginia.gov


Joint Legislative Audit and Review Commission Suite 1100
General Assembly Building Capitol Square
Richmond, Virginia 23219 804-786-1258 Fax 804-371-0101
http://jlarc.virginia.gov