review of pennsylvania department of environmental ... of pa dep...review of pennsylvania department...
TRANSCRIPT
Review of Pennsylvania Department of Environmental
Protection Technologically Enhanced Naturally
Occurring Radioactivity Materials (TENORM) Study
Report
December 2015
By
Marvin Resnikoff, Ph.D.
Radioactive Waste Management Associates
Box 105
Bellows Falls, VT 05101
For
Delaware Riverkeeper Network
Bristol, Pennsylvania

Critique of PADEP Norm Study Page 1
Delaware Riverkeeper Network
Introduction
It has been known since the 1960’s that the Marcellus shale formation is radioactive1. Drilling
logs by gas companies2 and reports by USGS
3 show that underground/subsurface radium
concentrations in the Marcellus shale are up to 32 times surface background concentrations.
More recent measurements by New York State DEC show radium in rock cuttings over 200
times background concentrations4. Drilling and natural gas production brings this radioactivity
to the surface in the form of solids (rock cuttings), liquids (drilling fluids, flowback water and
brine), and gas (radon).
This is not alchemy, where lead is magically turned into gold, or in the case of Marcellus shale,
where radioactivity below ground, magically disappears when brought to the surface.
Contaminated liquids, gases and solids will enter the accessible environment and be taken in by
the public, increasing the likelihood of cancers. Radium-226 has a half-life of 1,600 years, so it
will be present in the environment for thousands of years. It is also water soluble, meaning it
easily travels with water via streams and rivers. One of its decay products, radon, is an inert gas,
allowing it to travel with natural gas and enter homes through kitchen stoves,5 and from fugitive
gas emissions throughout the natural gas distribution network. As we discuss later, recent
studies show radon concentrations in homes in Pennsylvania are on the rise.
The Pennsylvania Department of Environmental Protection (DEP) undertook a study (the “DEP
Study”) to assess the environmental and public health impact of technologically enhanced
naturally occurring radioactive material (TENORM) related to oil and natural gas production in
Pennsylvania. DEP appointed Perma-Fix Environmental Services, Inc. (PESI) to undertake the
study on its behalf. The report was issued in January 2015.6 PESI operates five nuclear waste
treatment facilities throughout the country. In my professional opinion, an independent
consultant without investments in an industrial activity that is regulated by DEP would have been
a more appropriate choice without the risk of bias or conflict of interest.
This report critiques DEP and PESI’s study of TENORM related to oil and gas development, by
examining its methodology and the available data. It is Delaware Riverkeeper Network’s (DRN)
position that DEP has not released all of the data gathered for this study, so our review is limited
to the data released to DRN through the Right to Know Law and information published on
DEP’s website.7 8
1 Swanson, 1960.
2 Resnikoff, 2010.
3 Ibid.
4 Allied, 2012.
5 Resnikoff, 2012.
6 http://bit.ly/1Yeb6BW
7 Department of Environmental Protection v. Delaware Riverkeeper Network, 1373 C.D. 2014 (Pa. Cmwlth. 2015).
8 The opinions, including the conclusions, in this report, stated to a reasonable degree of scientific certainty, are
those of the author. As more information becomes available, I reserve the right to supplement this report.

Critique of PADEP Norm Study Page 2
Delaware Riverkeeper Network
Hydraulic fracturing or “fracking” in Pennsylvania started in earnest in 2008, however DEP did
not begin its study of the radioactive waste produced there until 2013. The first Marcellus shale
wells numbered about 375 wells from 2004-2007, but drilling began in earnest in 2008. 9 Since
gas operators began drilling, over nine thousand unconventional Marcellus Shale wells have
been drilled10
; and the DEP has issued over 16,000 drilling permits, and along with those, over
5,000 on-site drilling violations have been issued.11
12
What is hydraulic fracturing of Marcellus Shale?
The Marcellus shale formation lies at depths of 4,000 to 8,500 feet13
below the Earth’s surface
and ranges from West Virginia through eastern Ohio, across Pennsylvania, and into southern
New York. The new technology has allowed this major expansion of gas wells and involves
directional drilling, specifically horizontal drilling into shale formations, with high pressure, and
has opened shale formations and allowed the release of natural gas. New York State presently
has a moratorium on high volume hydraulic fracturing in tight shale formations, including
Marcellus Shale, but drilling is extensive in Ohio, West Virginia and primarily Pennsylvania.
Differing from older gas and oil wells, wells in the Marcellus shale formation are drilled a mile
or more vertically to reach the shale formation and then drilled a mile or more horizontally
through the shale formation. After casing the well bore, holes are punched in the horizontal
tubing with explosives, and fluid is pumped under high pressure, fracturing the tight shale
geologic formation to release the gas trapped in the rock.
The use of fracking has increased dramatically in the U.S. In the years 2011 to 2014, roughly
25,000 to 30,000 new oil and gas wells were hydraulically fractured each year. For
Pennsylvania, specifically, the number of hydraulically fractured gas wells that were producing
waste fluid was estimated as 1,232 in 2010, but increased to a total of 5,015 in 2013,14
and 6,987
by March 2014.15
Fracking requires a large quantity of water to complete the drilling process - on average 5 million
gallons of water per well16
. In terms of millions of gallons of wastewater produced in
Pennsylvania: in 2010, 180 million gallons, in 2011, 740 million gallons, and in 2013, 1300
million gallons were produced. Drilling fluid is used to remove the rock cuttings from horizontal
wells in the Marcellus shale formations and to transport the drill cuttings to the well surface.
9 http://geology.com/articles/marcellus-shale.shtml.
10 DEP counts wells according to conventional and unconventional. These definitions are in the state regulations and
are based on depth of formation and drilled horizontally within the formation—Marcellus wells are unconventional
wells. The definition of unconventional well is found at 25 Pa. Code, Ch. 78.1. 11
Total Unconventional Wells as of Mar. 27, 2015”, 04.24.2015, provided by The FracTracker Alliance on
FracTracker.org. 12
http://www.depreportingservices.state.pa.us/ReportServer/Pages/ReportViewer.aspx?/Oil_Gas/Wells_Drilled_By_
County . 13
EPA, 2015, p. 2-5. 14
EPA, 2015, p. 8-8. 15
Total Unconventional Wells as of Mar. 27, 2015”, 04.24.2015, provided by The FracTracker Alliance on
www.FracTracker.org. 16
Iowa, 2014.

Critique of PADEP Norm Study Page 3
Delaware Riverkeeper Network
Chemicals and proppants are added to the fluids to stimulate and facilitate gas extraction; while
many of the formulas are proprietary, it is well known that the mixtures contain hazardous and
toxic substances.17
There are two types of liquid waste water generated in the process: flowback water and produced
water or brine. Ten to forty percent18
, or an average of 25%19
of the drilling fluid plus interstitial
Marcellus liquid is returned within a few days; this is called flowback water and is typically
released to lined holding ponds near the drill site. Over time, particles settle out in the pond and
form a sludge at the lined pit bottom. Some operator use tanks to hold the flowback water and
particles settle to form a sludge at the bottom of the tank. When the gas well is in production,
additional water is brought up with natural gas and is separated at the well site and moved into
condensate tanks, or is trucked to central waste treatment (CWT) or deep wells for disposal.
This produced water has high concentrations of radium-226 and its decay products, up to 18,000
pCi/L or more radium-226 and 2,500 pCi/L radium-22820
, a decay product of thorium-232.
While no one is drinking this salty solution, as a yardstick, drinking water standards are 5 pCi/L
combined Ra-226 and Ra-228.
How are these drilling wastes disposed? Solids are separated from liquids at the drill site. The
contaminated solids are shipped to municipal landfills, occasionally tripping portal monitors
because the radioactivity is above permissible levels. Liquid from the settling ponds has been
generally transferred to local publicly owned wastewater treatment plants known as POTWs or
to CWT facilities, and then released to surface waterways.21
Flowback and produced water are injected into deep wells for long term storage or transported to
centralized water treatment facilities or CWTs that discharge to surface water. Transportation to
deep wells or centralized treatment facilities is generally by truck. Flowback water is also
recycled in hydrofracking operations at well sites and may be transferred from one well site to
another by pipeline. Some solids such as rock cuttings and residual waste such as materials
remaining in a pit after wastewater is removed, if they meet certain standards and permitting
requirements, can be buried on the well site or applied to the land. Some cuttings or other solids
are trucked to landfills or, if containing regulated materials, to treatment facilities.
17
EPA recently issued a list of 692 chemicals, many are regulated toxics. NYSDEC RDSGEIS also lists chemicals,
many are toxic and have adverse health effects. EPA citation: http://www2.epa.gov/hfstudy/appendix-chemicals-
identified-hydraulic-fracturing-fluids-and-wastewater-excel-file or, as they show it: US EPA. 2012. Study of the
Potential Impacts of Hydraulic Fracturing on Drinking Water Resources: Progress Report. EPA 601/R-12/011.
Available at http://www.epa.gov/hfstudy. 18
Urbina, 2011a. 19
Haluszczak, 2012. 20
USGS, 2011. 21
US EPA has proposed effluent regulations for oil and gas extraction that prohibits the discharge of unconventional
oil and gas wastewater to POTWs; the rule is expected to be adopted as final in 2016. Available at
http://www2.epa.gov/eg/unconventional-extraction-oil-and-gas-industry.
Critique of PADEP Norm Study Page 4
Delaware Riverkeeper Network
What did PESI seek to measure?
As we discuss in detail below, under the DEP plan, the following waste streams were to be
sampled for radioactivity: holding ponds, streams, flowback water, brine, influent and effluent at
water treatment plants, rock cuttings and radon gas at the well head. We sought to investigate
these waste streams and compare what PESI measured with what has been previously measured
elsewhere and compare the results to safe levels.
In April 2013, PESI prepared field sampling and quality assurance plans for the Pennsylvania
DEP. These plans outlined a “comprehensive study investigating the NORM and TENORM
related to the oil and gas exploration activities including conventional and unconventional
drilling through geological formation(s) and associated waste water operations throughout the
Commonwealth of Pennsylvania (PA).” This ambitious study plan presented a wide array of
components associated with drilling activities and included an evaluation of TENORM in
ambient air, drilling cuttings, natural gas, natural gas processing pipes and equipment, waste
water generated on drilling sites, sludge resulting from the processing of waste water from the
well pad development process and landfill leachate.
PESI intended to take samples related to the operations, equipment, and features pertaining to
“the drilling and production of natural gas from these geologic units and also in the transfer of
water to POTWs and CWTs for processing. Landfill leachate would also be sampled to study
whether radium had migrated from POTW and CWT sludge to the landfill leachate.” PESI took
samples related to:
Vertical and horizontal drill cuttings
Onsite pits containing cuttings
Production and Flowback water
Filter socks and filter presses
Compressed gas lines
Off gassing
Well pads
Centralized impoundments
Waste water facility sludge
Waste water facility influent and effluent water
Fresh proppant sands
Drilling muds
Piping and casing scale
Sampling locations are shown below in Fig. 1. Below the figure is a 2013 preliminary summary
of the type of sampling data collected; additional data were collected in 2014. It is unclear
whether DEP has reported all the data collected, or just a selected sample. We have identified
gaps in DEP’s data numbering system and sampling locations were not provided for all sites.
Delaware Riverkeeper Network attempted to obtain all records through a Right to Know
Request.

Critique of PADEP Norm Study Page 5
Delaware Riverkeeper Network
Figure 1. Locations of Sampling Sites. The red dots indicate well sites where data were
collected.
Susquehanna

Critique of PADEP Norm Study Page 6
Delaware Riverkeeper Network
The number of samples and types are listed below, as reported to the Citizens Advisory Council,
February 2014:
Concerns with the PESI Study
For the different waste streams, we discuss the data PESI gathered for each waste stream
according to the TENORM Study Scope of Work22
and compare the PESI results with
measurements obtained elsewhere and regulatory safe levels. We compare the data reported by
DEP with data previously reported by respected authorities such as the USGS, and we identify
any weaknesses of the study. We also examine whether the data are sufficient to quantify
releases to the environment. We reserve the right to amend this report if DEP makes more data
available.
PESI’s sampling plan discussed the sampling of many different sites and equipment, most of
which were on private property. The plan was not forthcoming regarding how and why PESI
chose their sample sites. It is unclear whether PESI had the freedom to choose any site in the
field, or whether DEP sampled specific sites based on industry’s approval. PESI’s study outline
also failed to discuss why some drill sites with high radiation readings were not included in the
study. For example, many spills at gas wells have been reported in Pennsylvania, and radiation
alarms have been set off at Pennsylvania landfills, but it is unclear whether these sites were
sampled.
22
PESI Scope of Work.
Critique of PADEP Norm Study Page 7
Delaware Riverkeeper Network
Another concern is that many measurements taken by unbiased agencies/entities lie outside the
data range PESI has measured. For example, the New York State DEC23
has measured rock
cuttings from Susquehanna County, Pennsylvania that far exceed the range of values PESI has
measured. And Duke University24
measured sediments downstream from a Pennsylvania
Publicly Owned Treatment Works that far exceeded the range of values found by PESI.
Interestingly, EPA gathered pre-fracking measurements of radon concentrations at wellheads
throughout the nation 25
and found about the same concentration as those found by PESI. This is
interesting as Marcellus shale is much more radioactive and therefore radon levels would be
expected to be much higher.
Measurement of Radon Gas at the Wellhead
Radon gas is a natural by-product of radium-226 and thus is present in the Marcellus Shale
formation. It is a chemically inert, but radioactive gas. Radon-222 has a short half-life, 3.8 days.
Radon gas, which is the 2nd
leading cause of lung cancer worldwide, occurs with natural gas.
When natural gas is used in home furnaces or stoves, it is released and creates an increase in
radon in the home, exposing citizens and creating an increased risk of lung cancers26
. PESI did
not conduct any sampling of radon in homes, yet reached the conclusion that radon exposure in
homes is not an issue.
Radon was not an important issue when natural gas was transported via pipelines to the
Northeast from the Gulf Coast because of the time required to transport the gas from hundreds of
miles away. At a speed of ten to eleven mph27
, much of the Gulf Coast radon had time to decay
during the long transport period. But the Marcellus shale formation is close to Northeast
metropolitan areas such as Philadelphia and New York City. Thus, the expected radon
concentrations will be higher. For this reason, it would be important to measure radon gas at the
well head28
; if the concentrations were high, as we expect, then a delay time should be built into
delivery to gas customers in the Northeast. The PESI Study measured radon at the well head.
Seventeen radon samples were collected in eight counties from Marcellus shale formations.
These samples were correctly taken between the well head and the separator units29
. The results
ranged between 3.0 and 147.5 pCi/L, with a median Rn concentration of 40.8 pCi/L.
PESI’s results are concerning for two reasons; the results are inconsistent with prior studies and
our own calculations. PESI’s results are highly suspicious when compared to EPA’s
measurements prior to the use of hydraulic fracturing in deep formations, as explained further
below. The average radon in natural gas, based on a survey conducted 42 years ago, in 1973, by
23
Allied, 2012. 24
Duke, 2013. 25
Johnson, 1973. 26
Resnikoff, 2012. 27
Johnson, 1973. 28
Natural gas delivered to customers is mixed from Pennsylvania and Gulf Coast sources. To understand the radon
contribution from Marcellus shale sources, we need to measure natural gas at the wellhead. 29
DEP, p. 3-8.
Critique of PADEP Norm Study Page 8
Delaware Riverkeeper Network
the EPA30
was 37 pCi/L, with a range of 1 to 79 pCi/L. This survey predates hydraulic
fracturing and gas extraction from the Marcellus shale formation.
We have carried out theoretical calculations that take into account a range of radium
concentrations in the Marcellus formation to calculate radon at the well head. We factored in the
distance between the well head and metropolitan areas, the mixing of radon with air in
apartments and the likelihood of developing lung cancer by inhaling radon gas. Our peer-
reviewed article31
shows that up to 30,000 additional lung cancers could be caused by radon from
the Marcellus formation, assuming the radium-226 concentrations are as high as 30 pCi/g. Since
the article was published, NYSDEC found radium-226 concentrations up to 204 pCi/g from rock
cuttings in Pennsylvania32
, demonstrating that radon concentrations could be higher than our
original calculations, as we discuss shortly.
A recent study by researchers at John Hopkins University’s Bloomberg School of Public Health
confirms the increased impact of fracking on radon in homes in Pennsylvania33
. The Bloomberg
study reported that 42 percent of the readings were higher than what is considered safe by federal
standards. The study was based on a review of DEP’s database of radon concentrations in
860,000 buildings between the years 1989 to 2013. Radon levels are often assessed when
property is being bought or sold and these records are kept by DEP.
Radon concentrations began an upward trend between 2004 and 2012 as more unconventional
wells were drilled in Pennsylvania, “with higher levels in counties with greater than 100 drilled
wells versus counties with none.”34
Because this is such a critical issue, all wells, including those with high radium-226
concentrations, should have been sampled for radon gas.
Under section 2g of the Scope of Work, PESI coordinated with DEP’s Radon Division and well
operators to perform radon sampling of gas as appropriate. The fact that the average radon
concentrations were about the same as reported by the EPA35
in 1973, in pre hydraulic fracturing
days indicates to us that wells were not chosen at random, but specific wells were chosen by
DEP. The EPA’s 1973 data of radon concentrations were obtained from conventional wells, in
geologic formations primarily from the Gulf Coast and Oklahoma. It is highly unlikely the more
radioactive Marcellus shale formation would have radon concentrations equal to 1973
concentrations unless the wells were conventional. This highlights the fact that the method for
choosing the wells and all of the raw data gathered therefrom, such as the radium-226
concentrations, are crucial to understanding the radon results. Additionally, because radon in
homes is such a critical issue, wells with high radium-226 concentrations should have been
sampled for radon gas.
30
Johnson, 1973. 31
Resnikoff, 2012. 32
Allied, 2012. 33
Schwartz, 2015. 34
Casey, 2015.
Critique of PADEP Norm Study Page 9
Delaware Riverkeeper Network
PESI also only sampled radon at two natural gas plants, and those samples were further limited
because of “wind and rain”.
The methodology employed by PESI36
, is standard. It is not clear why 10% of the samples taken
by PESI were chosen for further analysis, what were the criteria for selection, what were the
radium concentrations in each well, and the locations of all of the wells chosen for original
sampling is also unknown.
Measurement of Scale in Production Pipes
During production of natural gas, radium, which is dissolved in brine in Marcellus shale,
deposits or “plates out” inside the production pipes and inside above-ground feeder lines, and
separator and condensate tanks. The chemical form of this scale is a complex of primarily
barium sulfate and also barium carbonate.
Pennsylvania state regulations require that the direct gamma emanating from production pipes be
less than 50 μR/hr. This direct gamma radiation limit will not be protective of the public, the
environment, or workers because in order to yield a direct gamma level of 50 μR/hr outside the
pipe, the radium-226 and radium-228 concentrations within the pipe, must be on the order of
1500 pCi/g and 500 pCi/g, respectively.
We have observed radium-226 and radium-228 concentrations of 6,000 pCi/g and 2,000 pCi/g
respectively, from pipes withdrawn after 15 years in production37
. Production pipes are
generally removed after they become clogged and restrict oil or gas flow. If a pipe is cut open for
removal, the radium may be released from its confines within the pipe, exposing both the
workers involved in cutting up the pipes and the environment to high concentrations of radium.
EPA radium concentration limits in soil38
are 5 pCi/g for the top 15 cm of soil and 15 pCi/g
below the top 15 cm of soil. That is, radium released from pipes that met external gamma limits
would exceed EPA cleanup standards and would not be safe. The regulatory requirements are
shown in the box below.
36
Using a Lucas cell, which essentially consists of placing a radon sample in a ZnS-lined bag and counting the light
pulses with a photomultiplier tube. 37
See James McAllen’s successful suit against Forest Oil Corp. in 2008 for damages from contamination and
personal injury from post-production pipe radiation. 38
40 CFR §192.32(b)(2).

Critique of PADEP Norm Study Page 10
Delaware Riverkeeper Network
Pertinent Radiation Regulations
Maximum yearly radiation to the public
Whole body dose (total effective dose equivalent) to individual members of the public from a
facility cannot exceed 100 millirem in a year. (10 CFR 20.1301(a)(1) The whole body dose is
the sum of direct gamma radiation and the dose from inhaled and ingested radioactive materials.
A rem is a unit of tissue dosage, in terms of energy per mass. A whole body X-ray is 4 to 10
millirem.
Drinking water standards
The maximum contaminant limit for drinking water in a public water system is 5 picoCi/L for
combined Ra-226 + Ra-228. (40 CFR 141.66(b)).
Maximum ground contamination
The maximum ground contamination limit for combined Ra-226 + Ra-228 is 5 pCi/g in the top
15 cm of soil and 15 pCi/g below 15 cm (40 CFR 192.32(b)(2)).
DEP’s Study again falls short as it does not consider the eventual cutting and possible reuse of
production and other pipes. In Radioactive Waste Management Associates’ experience with
natural gas fields in Texas, over half of the pipes that were used in production were removed
after fifteen years and had high direct gamma levels which exceeded 50 μR/hr. These
contaminated pipes were subsequently cut up and re-used. After being cut up for use as fence
posts and gates, the radium was released from the pipes and spread on the ground, contaminating
a rancher’s property. The use of an acetylene torch to cut the pipes vaporized the radium,
presenting an inhalation hazard. Similar situations occurred in Martha, Kentucky, where oil field
pipes were used to build a corral, and in Allegany County, New York, where radioactive pipes
were used to construct playground equipment.
Natural gas production pipes have not been in use in Pennsylvania for enough time for scale to
build up to the point where pipes must be removed from operation. DEP failed to account for
this serious issue in its study; eventually production pipes will become clogged with scale and
must be removed from use and either cleaned or disposed of.
Under Section 2g, PESI sought to, “if possible, collect and screen samples of solids,” from
production equipment. It is unlikely this will be feasible for this study and should be reserved
for a future study.

Critique of PADEP Norm Study Page 11
Delaware Riverkeeper Network
Radium in Rock Cuttings
Under Section 2a of the Scope of Work, PESI intended to sample rock cuttings, and conduct
laboratory analysis for eighteen samples from ten well sites. The exact locations and methods of
selection have not been released by DEP.
Studies by the USGS present a range of radium-226 concentrations39
. Prior to the PESI sampling
program, Dr. David Allard, Director of the DEP’s Bureau of Radiation Protection, stated that
radium-226 in rock cuttings ranged from 3.4 to 34 pCi/g40
based on USGS and drill logs. But
NYSDEC’s measurements of rock cuttings from a Cabot Oil and Gas Co. Marcellus shale well in
Susquehanna County, PA41
reported considerably higher concentrations of radium-226 - 204
pCi/g. It is not possible to ascertain using the Fig. 1 map whether these two well sites were
sampled or avoided, but, inexplicably, DEP found horizontal solid drill cuttings for the State as a
whole to have a range42
from 0.092 pCi/g to 13.0 pCi/g Ra-226, with an average 5.22 pCi/g Ra-
226.43
We find these results completely out of line with measurements by the USGS and measurements
by NYSDEC in 2012 of rock cuttings from Susquehanna County, Pennsylvania of Cabot Oil and
Gas Co. from a Marcellus shale well.44
High radium-226 concentrations of rock cuttings
transported to a Niagara County landfill, up to 204 pCi/g Ra-226 in two train carloads of rock
cuttings were returned to Cabot Oil and Gas Co.
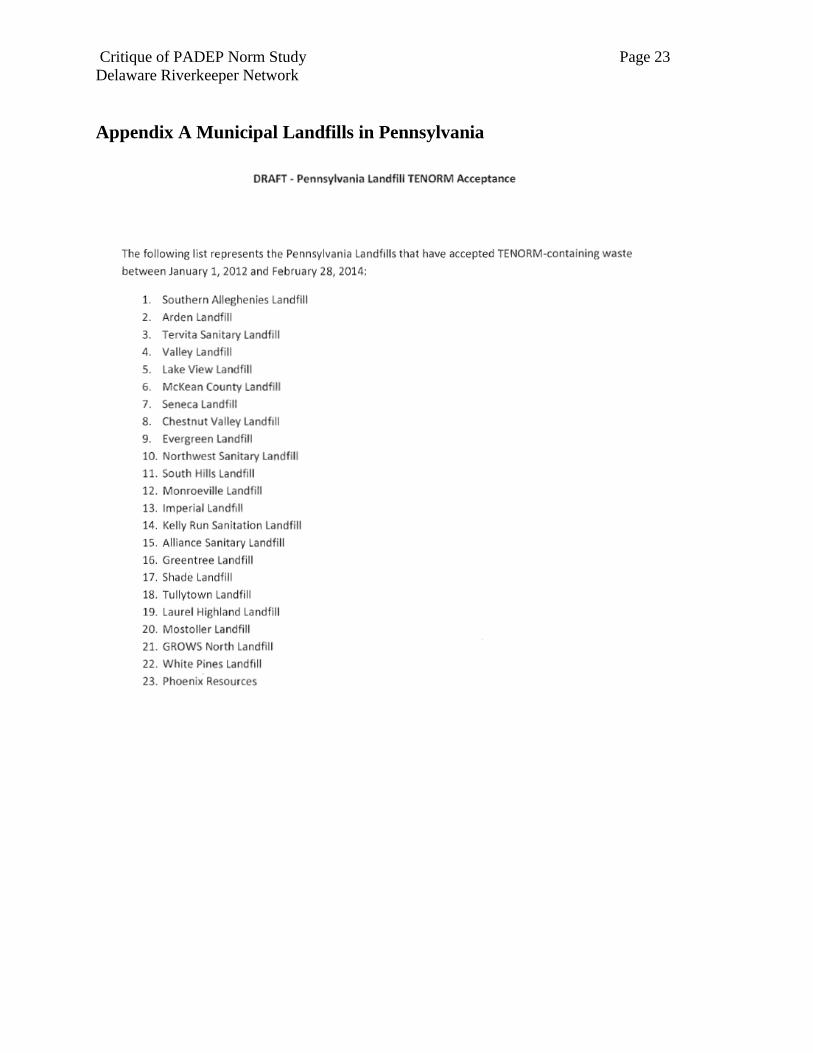
Pennsylvania has 49 municipal waste landfills, 23 of which receive TENORM waste, as seen in
Appendix A. Some Pennsylvania landfills have reported trucks carrying rock cuttings exceeding
the alarm settings of portal monitors at waste dump sites. According to DEP, in 2008, TENORM
triggered 423 alarms; by 2011, this number had risen to 798 alerts. In one such instance, the
MAX Environmental Technologies landfill in South Huntingdon, PA reported direct gamma
readings of 96 μR/hr; almost 10 times background levels and 10 times the acceptable level at that
particular landfill. An average reading of 5 pCi/g would not trigger radiation alarms, so again, it
appears as though cuttings from lower-emitting, outlier wells were selected for sampling, or that
the average was brought down by non-Marcellus cuttings.
In contrast, we compare the PESI results to those obtained by the USGS. The USGS analyzed
seventeen cores from wells in Pennsylvania, New York, Ohio, West Virginia, Kentucky,
Tennessee, and Illinois45
. Although the cores varied in thickness and in depth, geologists
identified the Marcellus stratum in several cores using data on the organic, sulfur, and uranium
content of the samples. Table 1 below summarizes the results from four cores that tapped into
39
Leventhal, 1981. 40
DEP, 2013a. 41
NYSDEC, 2012. 42
DEP, Table 3-7. 43
DEP, p. 3-5. 44
Allied, 2012. 45
Leventhal, 1981.

Critique of PADEP Norm Study Page 12
Delaware Riverkeeper Network
the radioactive Marcellus formation. The depths at which the layer was found as well as the
uranium measurements are presented. Radium-226 concentrations up to 30 pCi/g were found46
.
As mentioned above, Ra-226 in one sample from Susquehanna County, PA, was measured by
NYSDEC at 204 pCi/g. The measurements from NYSDEC and USGS47
(Table 1 below) lead us
to question how the PESI rock cuttings samples were chosen and whether they are
representative.
Table 1. Uranium Content and Depth of Marcellus Shale in Four Cores
Location of the Core Depth of Sample (feet) Uranium Content (ppm)
Alleghany County, PA 7342 – 7465 8.9 – 67.7
Tomkins County, NY 1380 – 1420 25 – 53
Livingston County, NY 543 – 576 16.6 – 83.7
Knox County, OH 1027 – 1127 32.5 – 41.1
Radium-226 in Brine
After wells are drilled and hydraulically fractured, the water returned within approximately the
first two weeks is called flowback water.48
Following this initial period, when gas wells are put
into production, lesser amounts of water are separated from gas and placed into condensate tanks
or trucks. This produced water or brine contains high concentrations of total dissolved solids
(TDS), as seen in Table 2. Over the initial fourteen day period before the well goes into
production, the TDS goes up dramatically, as seen in Table 2.
As additional wells have been drilled into Marcellus shale, TDS concentrations have risen in the
Monongahela River, the correlation clearly showing a trend that indicates that gas companies
may have been dumping wastewater into surface waters.49
Measurements by Duke University scientists50
that showed elevated levels of chloride and
bromide, combined with the strontium, radium, oxygen, and hydrogen isotopic compositions
reflect the effluents of Marcellus Shale produced waters. According to the study, the discharge of
the effluent from the treatment facility increased downstream concentrations of chloride and
bromide above background levels. In particular, Ra-226 concentrations in stream sediments at
the point of discharge were 200 times greater than upstream and background sediments and
above radioactive waste disposal threshold regulations.
46
Without going into the physics, Radium-226 in units pCi/g is approximately 1/3 total U content in units ppm, or
up to 30 pCi/g. 47
Leventhal, 1981. 48
Veil, 2012. 49
Urbina, 2011. 50
Warner, 2013.

Critique of PADEP Norm Study Page 13
Delaware Riverkeeper Network
Table 2. TDS (mg/L) as a Function of Time After Well Hydraulic Fractured51
The DEP Study sampled brine for radium content. In his public presentations, Dr. Allard
previously stated that radium concentrations in brine could be as high as 11,000 pCi/L52
, also
NYSDEC has reported radium-226 concentrations over 15,000 pCi/L. PESI found radium-226
concentrations from 40.5 to 26,600 pCi/L53
in unfiltered samples, and almost the same in filtered
samples; 87.0 to 24,100 pCi/L. Clearly filtering was not removing the radium, which was in
solution, not in particle form. Conventional water treatment plants which remove solids are not
able to effectively remove radium from wastewater unless radium is converted to a solid. The
difficulty of removing radium as a liquid is a major problem for the gas industry.
Brine used for Dust Suppression and De-icing
As reported to the Citizen Advisory Council in February, 2014, PESI sought to study thirteen
sites where brine has been used for dust suppression. The brine was sourced from
“conventional” gas wells; currently, only non-shale brine can be used for dust suppression and
de-icing. In all, thirty-two O&G brine-treated roads were surveyed in the southwest, northwest,
and north-central regions of the State, and eighteen reference background roads were surveyed.
PESI tested for direct gamma radiation and the surveys included gross gamma radiation scans
performed using 2-inch x 2-inch NaI detectors and a Ludlum Model 2221 scaler/ratemeter
instrument. The surveys showed about half the roads were slightly above background.
51
Veil, 2012. 52
Allard, 2013. 53
DEP, E-22.

Critique of PADEP Norm Study Page 14
Delaware Riverkeeper Network
As a practice, using brine fluid as a de-icer is unwise for health and safety reasons; it is a means
of providing the maximum radiation dose to the population. The number of radiation pathways
to humans is increased. This is because radium-226 decays to gamma emitters, such as bismuth-
214, so spread brine is a gamma emitter. In addition, during dry periods, radium-226 in brine
can be resuspended by car movement and be inhaled by the public. It can also be spread off
roads onto nearby residential and agricultural lands. PESI did not analyze inhalation and
incidental ingestion of radium; PESI also did not consider ingestion of food/plants grown near to
treated roadways, in contaminated soil.
Wastewater at Water Treatment Facilities
While DEP has asked drillers to voluntarily cease sending wastewater directly from ponds or
tanks at well sites to POTWs, some POTWs have continued the practice under a Consent Decree.
This should cease when the proposed EPA effluent regulations are implemented, if it hasn’t
already.54
It is not clear how pending federal regulations will affect effluent that has been pre-
treated at CWTs. POTWs can accept wastewater from CWTs and this is current practice. In any
case, neither POTWs nor currently operating CWTs are effectively removing radium in solution.
PESI sampled a small fraction of influent and effluent wastewater at POTWs and CWTs; for
example, only six POTWs were sampled. The locations of the POTWs and CWTs and the origin
well sites are not stated.
As shown in Tables 4-8 through 4-15 of DEP’s report, the average radium-226 concentration
found in effluent is 129 pCi/L and the maximum is 363 pCi/L. The average radium-228
concentration found in effluent is 9.6 pCi/L and the maximum is 35 pCi/L. These concentrations
are far above drinking water standards for POTWs, which is 5 pCi/L combined Ra-226 and 228.
Also troubling is the fact that brine and produced water, according to PESI data, have Ra-226
concentrations up to 26,000 pCi/L. The low Ra-226 concentrations to POTWs are due to DEP’s
recommendation in 2011 that well sites transport brine to CWT’s and to deep wells for
disposal55
, but high radium concentrations can still be received by CWTs.
The PESI Study also sampled influent and effluent at CWTs. The effluent from CWTs may end
up in one of three places: as influent to POTWs, released directly into the environment, or to out-
of-state injection wells. According to the Duke study56
, in 2011, about twenty percent of drilling
fluids, eight percent of hydraulic fracturing flowback fluid, and fourteen percent of produced
water (i.e., brine) from unconventional Marcellus Shale wells were treated at centralized waste
treatment facilities and then discharged to local streams. The PESI Study showed the Ra-226
54
It should be noted that EPA reports in its proposed hydraulic fracturing wastewater effluent rulemaking that EPA
found no instances where onshore unconventional gas wells were still sending wastewater to POTWs. US EPA has
proposed effluent regulations for oil and gas extraction that prohibits the discharge of unconventional oil and gas
wastewater to POTWs; the rule is not yet in force and is expected to be adopted as final in 2016. Available at
http://www2.epa.gov/eg/unconventional-extraction-oil-and-gas-industry. 55
EPA, 2015, p. 8-17. 56
Duke, 2011.
Critique of PADEP Norm Study Page 15
Delaware Riverkeeper Network
average and maximum effluents from CWTs as 1,840 pCi/L and 15,500 pCi/L, respectively. The
PESI Study did not detail the ultimate disposition of this material.
PESI stated that twenty-two of the highest volume Marcellus shale waste water treatment
facilities would be included in this study and that each would be sampled as often as three times
to establish a trend. The sampling plan was more ambitious than the actual work performed. For
example, of the ten POTWs sampled, only six were influenced by Marcellus shale input, i.e., by
having received wastewater from the gas industry and only five were sampled in all three rounds.
Three survey rounds were conducted at nine of the ten CWTs. Radiological surveys were also
conducted at all nine zero liquid discharge (ZLD) plants.
As discussed above, it is clear from the data that the POTWs and the CWTs do not remove
radionuclides in solution, such as radium, leaving open the question, where does this radium go?
The data shows that treatment plants’ effluent contains radium-226, which will be released into
the environment. The radium-226 concentration found by PESI is high, as high as 26,600 pCi/L57
and far above safe drinking water levels, which are 5 pCi/L for combined Ra-226 and Ra-228.
Ground Contamination and Worker Exposure
Open land areas around POTWs have become contaminated with radioactive materials, exposing
workers. The highest average gamma radiation exposure rate found by PESI was 36.3 µR/hr and
the maximum gamma radiation exposure rate measured was 257 µR/hr58
. For a 2,000 hr/yr.
work period, the potential dose to a worker who remained at this location would be 514
mrem/yr., considerably above the allowable dose of 100 mrem/yr.59
. This is the dose due to
gamma radiation alone; additional radiation pathways include incidental ingestion which can
occur when a worker wipes contaminated hands across his or her mouth, or if he or she eats with
contaminated hands. Alpha and beta emitting radiation can also be inhaled when contamination
is resuspended. These pathways add to the direct gamma radiation dose.
In evaluating health impacts, DEP’s Study considers only the immediate time period. Since
radium-226 has a half-life of 1,600 years, it is vital to consider more than the immediate time
period. Institutional controls may not be assumed to be in place for more than 100 years60
after
which landfills may be abandoned and monitoring ceased. For public safety, it should be
assumed that residents live on the property full-time, build homes with basements and grow
gardens. Farmers should be assumed to continue or resume agricultural practices on these lands.
This kind of exposure was not studied or considered by DEP and PESI, thus calling into question
the credibility of DEP’s evaluation of health impacts and of long term pollution and degradation
of the environment, e.g. legacy pollution.
57
DEP, ES-22. 58
DEP, p. 4-2. 59
See Regulatory Box on p. 24. 60
10 CFR §61.59.

Critique of PADEP Norm Study Page 16
Delaware Riverkeeper Network
Landfills
According to the sampling plan, landfill leachate was sampled at each of the 51 active landfills
and analyzed for gross alpha/beta and Ra-226/Ra-228 by gamma spectroscopy. The sampling
was broken into two groups, 42 samples were taken at landfills receiving less O&G solid waste,
and more extensive sampling was conducted at nine landfills taking more O&G waste. The terms
“less” and “more” were not defined. We assume all these landfills tested by PESI were located
in Pennsylvania, and not in New York State, Ohio and West Virginia, where rock cuttings have
also been shipped. However, DEP did not provide the locations of the landfills tested. Radium
was detected in all leachate samples.61
Sample results from the 42 landfills not selected for
extensive sampling showed Ra-226 results that ranged from 54.0 to 416 pCi/L, with an average
Ra-226 112 pCi/L. Radium-226 results from the nine selected landfills ranged from 85 pCi/L to
378 pCi/L with an average 106 pCi/L.
As a yardstick, these concentrations exceed drinking water regulations for POTW effluent into a
public water supply62
. One must also keep in mind that the above concentrations are a snapshot
in time. When management at these landfills no longer exists and maintenance is not
maintained, these concentrations may increase. For time periods greater than 100 years,
management controls may no longer exist.
It is unclear whether effluent at all nine landfills was filtered, but for those that did filter effluent,
radium was detected in all of the filter cake samples. Radium-226 results ranged from 8.73 to
53.0 pCi/g, with an average of 24.3 pCi/g. At three landfills that discharged effluent water
directly to the environment, a sediment-impacted soil sample was collected at each of the three
effluent outfalls. Radium-226 results ranged from 2.82 to 4.46 pCi/g with an average of 3.57
pCi/g. These results for downstream sediments are much lower than those found by Duke,
which were 14.7 pCi/g to 237 pCi/g. Landfills that do not discharge effluent directly to the
environment often direct the effluent to a POTW. The radium concentration at a POTW would
be diluted with other influent.
Brine Trucks and Driver Radiation Exposures
PESI estimated the gamma radiation exposure for drivers transporting wastewater from well sites
to wastewater treatment plants. PESI assumed the driver worked for ten weeks per year (rather
than fifty weeks per year)63
and the truck carried 3,800 gallons of wastewater with a radium-226
and progeny concentration of 18,400 pCi/L. We reviewed the Microshield calculations and
except for the number of hours worked, they appear correct. However, PESI and DEP fail to
analyze the safety implications of transporting this total inventory of brine in one shipment.
Brine is transported by truck from well sites either to CWTs or deep wells. These trucks must
satisfy Federal DOT rules. Transported material that exceeds a total activity, in terms of total
Curies of radioactivity, is classed as a hazardous, class 7, radioactive material by DOT. The
61
DEP, p. 5-1. 62
40 CFR §141.66. 63
DEP, p. 4-12.
Critique of PADEP Norm Study Page 17
Delaware Riverkeeper Network
specific limit for Radium-226 is 2.7x10⁻⁷
Curies[47]
. Below this total activity, the material is not
classed as radioactive by DOT; above this amount, specific Federal regulations apply regarding
design, packaging and labeling of transportation vehicles. For placarding, the NRC has even
stricter limits 1 x 10⁻⁷
Curies (10CFR20, App. C). The above shipments contain 2.6 E-4 Ci Ra-
226 and are therefore 1000 times above DOT limits. PESI does not discuss this aspect of
transportation. The brine trucks we have seen on Pennsylvania highways have not satisfied
federal DOT design, packaging and labeling requirements for class 7 radioactive materials. This
is a major oversight by Pennsylvania DOT and should be immediately corrected.
Production Site Survey and Sampling
PESI intended to sample closed/reclaimed cuttings pits64
. PESI was to sample pits using
portable survey meters, which is an effective method only if contamination is on the surface. If
contamination is covered by more than one foot of soil, radium and its decay products will not be
detected, as gamma radiation from TENORM is reduced by 98% by one foot of soil cover. In
order to detect subsurface contamination, push probes and laboratory analysis of samples is
necessary; PESI did not utilize this method of sampling. This is particularly concerning because
buried TENORM can be exhumed by landowners when constructing homes or planting gardens;
all buried TENORM must be found.
PESI intended to sample and analyze fresh proppant sands, drill muds, flowback and produced
water on sites in accordance with the sampling plan65
. While the intent of the gas industry is to
recycle seventy to eighty percent of drilling fluids, our concern is with the twenty to thirty
percent that have become too concentrated in certain properties (such as salts) so they cannot be
re-used. It is not clear whether these fluids that cannot be recycled and which contain buildups
of toxic and radioactive materials have been sampled by PESI. Similarly, the sludges and
residues from open pits, settling ponds and holding tanks at well sites, wastewater treatment
plants or pre-treatment basins or vessels may also have not been sampled.
PESI also sampled temporary water storage vessels and recycle systems66
. PESI conducted
gamma surveys and took wipe samples for removable alpha and beta radiation. The gamma
surveys were sufficient to determine whether a gamma dose exceeded regulatory limits of 100
mrem/yr. for a member of the public. However, the gamma surveys, as outlined in the Statement
of Work, were not sufficiently location-specific to determine whether particular locations were
unusually radioactive, such as the gas/water separators, condensate tank bottoms or feeder lines.
This would have yielded information on whether radium scale or sludge had built up in these
components. Sludge would have built up in the condensate tank bottoms; scale would build up in
all three components over time.
PESI intended to visit twenty well sites in various stages of development, out of over 5000 well
sites in production in the State. These visits were for the purpose of taking radon samples, or
64
PESI Scope of Work Section 2b. 65
Ibid at Section 2c. 66
Ibid at Section 2d.

Critique of PADEP Norm Study Page 18
Delaware Riverkeeper Network
gamma surveys. Many well sites in the State have had spills, and it is not clear whether any such
wells were sampled for the study.
Sludge Sampling
Though PESI stated that sludge would be sampled, we cannot identify whether sludge was
sampled. PESI sampled filter cake, sediment-impacted soil and high gamma rates on the exterior
of condensate tanks, which may be due to sludge, but we cannot identify sludge itself being
sampled. The maximum gamma radiation exposure rate measured at the POTWs was 257 µR/hr
on contact with the outside of a wastewater tank; this may be due to sludge settled at the bottom
of the tank.
The sampling results of solids collected on filters or filter cakes are presented in Table 4-27. All
the CWT filter cake samples contain elevated Ra-226. The maximum results were 305 pCi/g for
Ra-226 and 177 pCi/g for Ra-228. The PESI Study should have detailed the fate and transport of
the filter cake samples from the CWTs, but does not.
Three survey rounds were conducted at nine of the ten CWTs. Sediment-impacted soil was
collected at the accessible effluent discharge points at the CWTs. Radium above typical soil
background levels to a maximum of 508 pCi/g of total Ra was identified. This can be compared
to EPA clean-up criteria of 5 pCi/g total Ra for surface soils and 15 pCi/g below 15 cm depth.
The highest average gamma radiation exposure rate was 43.1 µR/hr, and the maximum gamma
radiation exposure rate measured was 445 µR/hr. These are not safe levels. For example, if a
permanent resident lived in an area with radium-226 soil concentration 508 pCi/g, and cultivated
a garden, the annual radiation whole body dose would be almost 5000 mrem/y, due almost
entirely to direct gamma and ingestion of contaminated food.67
Conclusion
It is well known and has been demonstrated by several studies by reputable scientific bodies that
the Marcellus shale formation, from which natural gas is drawn, is highly radioactive. This
radioactivity does not disappear during drilling and when natural gas is brought to the surface.
Our conclusion from our review of DEP’s Study is that it failed to fully evaluate the full worker
and public radiation exposure, TENORM disposal, and environmental impacts. Our review
identified major gaps in data collection.
Radon: Radon is a radioactive chemically inert gas and a decay product of radium. It is also the
second leading cause of lung cancer worldwide. As natural gas is released from the Marcellus
shale formation, radon is released with it. The median concentration of radon found by DEP is
highly suspect as it is almost identical to those levels found by the EPA in 1973, well before
horizontal high volume hydraulic fracturing was used to extract natural gas. Studies show that
67
We assumed a one foot contamination layer with no clean soil shielding, and employed the software RESRAD
7.0. The lung dose due to radon would be very high.

Critique of PADEP Norm Study Page 19
Delaware Riverkeeper Network
radon concentrations in Pennsylvania homes have been increasing in areas where well activity is
the greatest. The findings in the DEP report cannot be accepted as an accurate assessment of
radon from Marcellus shale.
Pipe Scale: During production of natural gas, radium, which is dissolved in brine in Marcellus
shale, is deposited or “plates out” inside the production pipes and also inside of above-ground
feeder lines, separator and condensate tanks. Eventually, pipes become clogged and must be
removed. DEP’s Study does not consider the fate of and resulting exposure to harmful levels of
radiation from removal of these pipes. Since no pipes have been removed yet, none have been
tested. DEP should plan a follow up study to sample this future exposure pathway. Until this
follow up sampling and study is done, it cannot be assumed that scale will not present a
significant pathway for exposure of workers and the public to radiation from Marcellus shale.
Rock Cuttings: Prior to the PESI sampling, Dr. David Allard, Director of the Bureau of
Radiation Protection, stated68
that radium-226 ranged from 3.4 to 34 pCi/g. This was our
understanding as well, based on a previous USGS study and drill logs. But, surprisingly,
horizontal solid drill cuttings in the DEP Study ranged from 0.092 pCi/g to 13.0 pCi/g Ra-226,
with an average of 5.22 pCi/g Ra-226. Rock cutting measurements by New York State from the
same formation were found to range up to 204 pCi/g Ra-226. The surprisingly low range found
by DEP demonstrates either an anomaly or selective sampling. Either way, the findings cannot
be accepted as a valid representation of the radioactive properties of Marcellus shale rock
cuttings.
Wastewater: Wastewater, in the form of brine and flowback water, is highly radioactive, with
concentrations that range up to 26,600 pCi/L69
Ra-226. Workers at treatment plants have the
potential to be exposed to high levels of radiation if they work with or around the filter cakes.
Radium is in solution at CWTs and is either released directly to the environment and potentially
taken in by surface water intakes that supply drinking water, or sent to POTWs as influent. But
the average influent to POTWs is 129 pCi/L, i.e., nowhere near 26,600 pCi/L. The concentration
129 pCi/L is not a plausible measurement. These data must be re-examined based on the fact
that currently employed wastewater treatment systems do not effectively remove radioactivity, so
it is reasonable to examine the potential that radioactive contaminants are entering the
environment and can be contaminating drinking water sources.
Landfills: Radium was detected in all landfill leachate samples gathered for DEP’s study.
Radium-226 concentrations ranged from 67.0 to 378 pCi/L for effluent samples. This can be
compared to drinking water standards of 5 pCi/L for combined Radium-226 and 228. Workers at
landfills have the potential to be exposed to high levels of radiation if they work with or around
the filter cakes processing landfill leachate. Since leachate treatment does not remove Radium-
226 and effluent discharges into waterways, downstream water intakes could be impacted.
Radium-226 may not be sampled for or removed by water treatment systems, so downstream
water systems could unknowingly pass these contaminants through to water users. Additionally,
68
Allard, 2014. 69
DEP, ES-22.

Critique of PADEP Norm Study Page 20
Delaware Riverkeeper Network
since radium-226 has a half-life of 1,600 years, this leaching will continue long past management
oversight of these landfills. The issue of landfill leachate carrying Radium-226 into the
environment and drinking water must be fully analyzed through a comprehensive examination of
all point discharges of treated leachate from landfills that accept gas well drill cuttings.
Brine Transport: The study discusses the safety to truck drivers of transporting brine, but does
not discuss the hazard to the general public of potential accidents and the need for proper
packaging, placarding and insurance. DEP also falsely and inexplicably assumes that workers
transporting brine work only ten weeks a year. The Commonwealth should refer for immediate
action to Pennsylvania Department of Transportation the important issue of required placarding
and the enforcement of transport regulations which apparently are not being enforced regarding
Marcellus shale wastewater.
Production Site Survey and Sampling: PESI’s method of sampling abandoned cuttings pits is
ineffective because gamma surveys cannot detect contamination from pits covered by one foot or
more of clean soil. Push probes and laboratory analysis are required to detect such buried
contamination. Landowners may unearth this radioactive contamination, resulting in exposure,
when constructing homes and buildings, or even planting a garden, or farmers may disturb and
distribute the contamination through agricultural practices, exposing farm workers, the public,
livestock and food supplies to potential contamination. DEP must further test well site pits and
production areas through push probes and laboratory analysis to gather the data needed to draw a
valid conclusion regarding the radioactivity of buried solids at Marcellus shale gas well sites.
Non-recycled drilling fluids and sludges: The industry’s goal is to recycle seventy to eighty
percent of drilling fluids, however it is not clear that the fluids that cannot be recycled, that have
buildups of toxic and radioactive materials, have been sampled by PESI. Similarly, the sludges
and residues from settling ponds and holding tanks at wastewater treatment plants or pre-
treatment basins or vessels may also have not been sampled. We have not been able to identify
from the DEP Study where this has been done. These sludges must be sampled to provide the
data necessary for valid conclusions regarding residues from recycled drilling fluids.
Finally, stream water quality, sediments and instream habitats could be degraded by cumulative
buildup of radioactivity in waterways. DEP’s Study failed to analyze streams, sediments, and
failed to sample fish flesh or mussels, for example. These should be analyzed to provide the
evidence from which to draw valid conclusions regarding the environmental impacts of
radioactive contaminants produced by Marcellus shale extraction.
Critique of PADEP Norm Study Page 21
Delaware Riverkeeper Network
References
(Allard, 2013) Allard, DJ, “Marcellus Shale and Tenorm,” ISCORS Meeting, May 1, 2013.
(Allard, 2014) Allard, DJ, “TENORM Experiences in Pennsylvania,” presentation before Mid-
Atlantic States Rad Control DVSRS Meeting, March 25, 2014.
(Allied, 2012) NYSDEC, Division of Environmental Remediation, August 2012, re. Allied
Landfill, Niagara County.
(Casey, 2015) Casey, JA, et al, “Predictors of Indoor Radon Concentrations in Pennsylvania,
1989 – 2013”, Environmental Health Perspectives, vol 123, November 2015.
(DEP, 2013) Pennsylvania Department of Environmental Protection, “Technologically Enhanced
Naturally Occurring Radioactive Materials (Tenorm) Study Report, Scope of Work,” April 10,
2013.
(DEP, 2015) Pennsylvania Department of Environmental Protection, “Technologically Enhanced
Naturally Occurring Radioactive Materials (Tenorm) Study Report,” January 2015, prepared by
Perma-Fix Environmental Services, Inc.
(DRN, 2015) Department of Environmental Protection v. Delaware Riverkeeper Network, 1373
C.D. 2014 (Pa. Cmwlth. 2015)
(Duke, 2013) Warner, RN, et al, “Impacts of Shale Gas Wastewater Disposal on Water Quality
in Western Pennsylvania,” Division of Earth and Ocean Sciences, Duke University,
Environmental Science and Technology, October 2, 2013.
(Haluszczak, 2012) Haluszczak LO, Rose AW, Kump LR (2012) Geochemical evaluation of
flowback brine from Marcellus gas wells in Pennsylvania, USA. Appl. Geochem,
http://dx.doi.org/10.1016/j.apgeochem.2012.10.002
(Iowa, 2014) Schultz, MK and Nelson, AW, “Radioactivity and Unconventional Drilling,”
University of Iowa, for the U.S. Department of Energy, National Analytical Management
Program (NAMP)
(Johnson, 1973) Johnson, RH, et al, “Assessment of Potential Radiological Health Effects from
Radon in Natural Gas,” Environmental Protection Agency, EPA-520/1-73-004, November 1973.
(King, 2008) King, HM, "Marcellus Shale Gas: New Research Results Surprise Geologists!".
geology.com. Retrieved 2008-05-03.
(Leventhal, 1981) Leventhal, J. S., J. G. Crock, and M. J. Malcolm. "Geochemistry of trace
elements and uranium in Devonian shales of the Appalachian Basin." USGS Open File Report
81-778. (1981).

Critique of PADEP Norm Study Page 22
Delaware Riverkeeper Network
(PESI Scope of Work) TENORM Study Scope of Work. (2013) Available at
files.dep.state.pa.us/.../TENORM-Study_SoW_04_03_2013_FINAL.pdf.
(Resnikoff, 2010) Resnikoff, M, Alexandrova, E, and Travers, J. "Radioactivity in Marcellus
Shale." Report Prepared for Residents of for the Preservation of Lowman and Chemung
(RFPLC). (2010)
(Resnikoff, 2012) Resnikoff, M, “Radon in Natural Gas from Marcellus Shale,” Ethics in
Biology, Engineering & Medicine - An International Journal, 2(4): 317–331 (2011).
(Schwartz, 2015) Schwartz, Brian S, et al, “Predictors of Indoor Radon Concentrations in
Pennsylvania 1989-2013,” Dept. Envtl. Health Sciences, Johns Hopkins U, April 9, 2015.
(Swanson, 1960) Swanson, VE, “Oil Yield and Uranium Content of Black Shales,” USGS paper
356-A (1960)
(Urbina, 2011) Urbina, I, “Regulation Lax as Gas Wells’ Tainted Water Hits Rivers”, NY Times,
February 27, 2011.
(US EPA, 2012). Study of the Potential Impacts of Hydraulic Fracturing on Drinking Water
Resources: Progress Report. EPA 601/R-12/011. Available at http://www.epa.gov/hfstudy.
(USEPA, 2015, “Assessment of the Potential Impacts of Hydraulic Fracturing for Oil and Gas on
Drinking Water Resources,” EPA/600/R-15/047a, June 2015.
(USGS, 2011) Rowan, EL, et al., “ Radium Content of Oil- and Gas-Field Produced Waters in
the Northern Appalachian Basin (USA), USGS Scientific Investigations Report 2011-5135”
(2011)
(Veil, 2012) Veil, J, “Overview of Shale Gas Water Issues,” WEFTEC 2012, New Orleans, LA,
October 2012.
(Warner, 2013) Warner, NR, et al, “Impacts of Shale Gas Wastewater Disposal on Water Quality
in Western Pennsylvania,” Enviro Science and Technology, Oct 2, 2013, pp. 11849
Critique of PADEP Norm Study Page 23
Delaware Riverkeeper Network
Appendix A Municipal Landfills in Pennsylvania

Critique of PADEP Norm Study Page 24
Delaware Riverkeeper Network