review of motion sickness evaluation methods and their
TRANSCRIPT

12 | SIMPACK News | July 2013
CUSTOMER APPLICATION | This Wiederkehr, Friedhelm Altpeter, Helbling Technik AG, Aarau
Seasickness or motion sickness (kineto-sis) is not only an issue at sea, but on rails as well. Unlike vibration discomfort, no clear guidelines exist for assessing motion sickness. Recent developments such as tilting technology and increased passenger demands regarding comfort have led to higher requirements for roll-ing stock equipment and infrastructure. This article presents a tool for assessing train design with respect to motion sick-ness at the engineering stage.
WHAT IS MOTION SICKNESSMotion sickness is a phenomenon usually experienced by persons exposed to a mov-ing environment with low frequency accel-erations. The most common symptoms of seasickness are nausea and vomiting.It is evident from tests that the ves-tibular, visual, and somatosensory system play a role in the onset of motion sickness. Psychological factors are also involved [6]. However, there is no agreement in the sci-entific community on why the human body has developed these symptoms. The most widely accepted hypothesis is the sensor conflict theory. This theory states that our brain collects information from the human sensors and tries to correlate the informa-tion to body movement. If the brain is not able to correlate the information properly, it may develop the symptoms known as mo-tion sickness.
This simple theory, however, does not explain motion sickness sufficiently. It was therefore extended to the sensory rearrangement theory [7]. This theory states that motion sickness is caused either by vari-ance between the motion signals obtained from two sensors, or between one sensor and what is expected, based on previous experience.
MODELS USED TO CHARACTERIZE MOTION SICKNESSOne of the first studies characterizing the effect of various frequencies with the symptoms of motion sickness was carried out in 1974 [8]. O’Halon and McCauley determined that the most motion sickness-provoking frequencies are found around 0.2 Hz. They defined the “motion sickness incidence” (MSI) as the percentage of people who experienced emesis (vomiting).Similar to the frequency-weighting curves used for comfort assessment, M. J. Griffin and Lawther [1] defined a frequency-weighting curve for kinetosis based on
laboratory tests with humans. This frequency-weighting curve can be found in the International Standard ISO
2631-1 [2] and is named wf. The weighting function is displayed in Fig. 1.Based on this frequency-weighting filter, the motion sickness dose value is introduced as the square root of the integral of the squared frequency weighted accelerations over time. The full mathematical description is as follows:
𝑀𝑆𝐷𝑉� ���𝑎�� ∙�𝑡
Based on the motion sickness dose value, the vomiting incidence (𝑉𝐼) is given as a percentage. The illness rating (𝐼𝑅) can be estimated from the following formulas:
𝑉𝐼 � ��� ∙ 𝑀𝑆𝐷𝑉�
𝐼𝑅 � ���� ∙ 𝑀𝑆𝐷𝑉�
The values obtained for the illness rating allow one to judge motion sickness accord-ingly as shown in Table 1.As the motion sickness dose value is the integral over time of squared accelerations,
“Motion sickness is a phenomenon that is usually experienced by persons
exposed to a moving environment with low frequency accelerations.”
Review of Motion Sickness Evaluation Methods and their Application
to Simulation Technology

SIMPACK News | July 2013 | 13
This Wiederkehr, Friedhelm Altpeter, Helbling Technik AG, Aarau | CUSTOMER APPLICATION

Frequency [Hz]10-2 10-1 100 101
Filte
r Wf [
dB]
5
0
-5
-10
-15
-20
-25
-30
Position on track
Curv
atur
e
14 | SIMPACK News | July 2013
CUSTOMER APPLICATION | This Wiederkehr, Friedhelm Altpeter, Helbling Technik AG, Aarau
Fig. 1: Frequency weighting function for motion sickness
Fig. 2: Representative track course
the motion sickness dose values to horizon-tal (lateral) [4] and roll motions [3]. The latter are of particular importance in the case of railway vehicles [5].For now, the simplicity of application and clear rules make the motion sickness dose value the preferred method for assessing motion sickness.
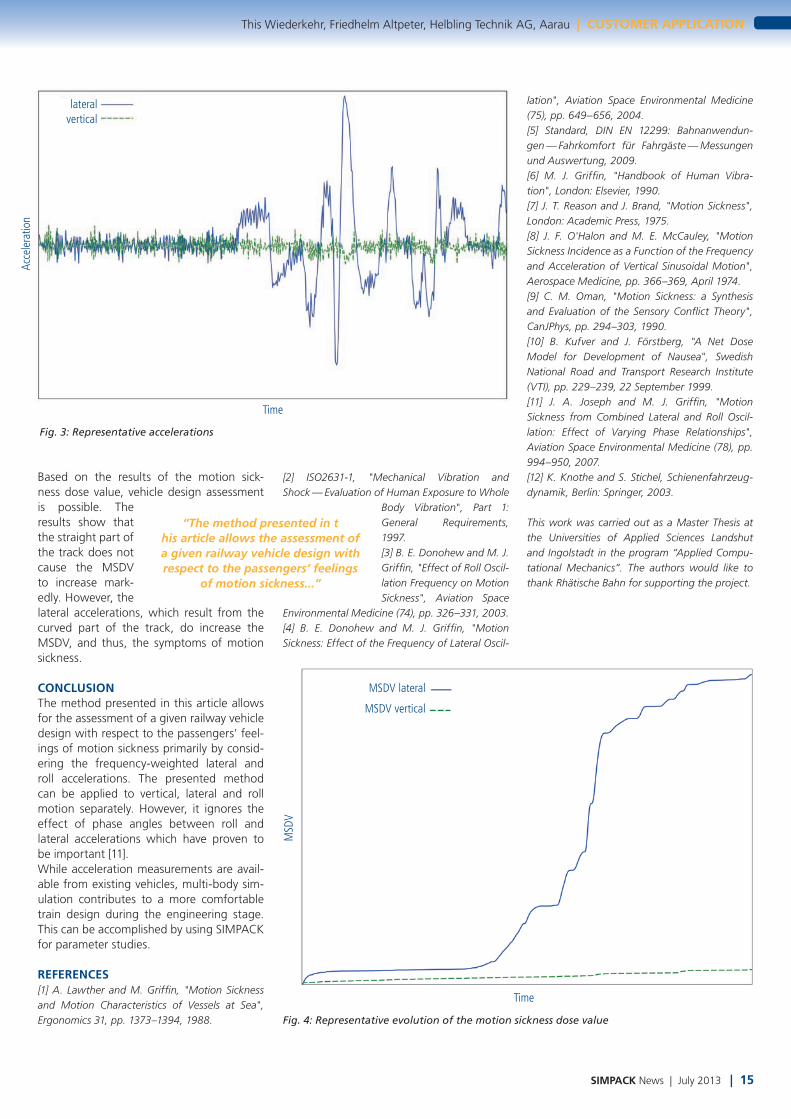
APPLICATION USING SIMPACKIn order to judge a given train design with respect to motion sickness, a multi body simulation model is created. This model simulates the vehicle on a given track and calculates the respective numbers character-izing motion sickness from the simulation results. SIMPACK is well-suited to perform this simulation, as it comes with the impor-tant features for railway dynamic simulations such as rail-wheel contact and track set up.As the most provoking frequencies for motion sickness are around 0.2 Hz, it is es-sential to use a representative track course (Fig. 2) with its curvature and super-eleva-tion. The track under observation consists of a fairly straight section and segments with curves to the left- and right-hand sides.Once the simulation is complete, the post-processing SIMPACK tool evaluates the motion sickness dose value from the ac-celerations (Fig. 3) using the frequency filter Wf. As the frequency filters for lateral mo-tions are not yet integrated in SIMPACK, the results are exported as MATLAB® readable data for further processing. The results of the motion sickness dose value for vertical and lateral motions are displayed in Fig. 4.
the dose value will never decrease over time. This is a weakness of the model as the human body is able to recover from the effects of motion sickness. Two models that overcome this weakness are Oman’s (Developed by Charles Oman at MIT [9]) and the net dose model (developed by the Swedish National Road and Transport Research Institute VTI [10]).Oman’s model attempts to model the neural behavior of the human body with respect to motion sickness. This model is therefore the most complete one available but, also the most difficult to apply.The net dose model was used to analyze a tilting train on a specific track in Sweden
“As the most provoking frequencies for motion sickness are
around 0.2 Hz, it is essential to use a representative track course with its
curvature and super-elevation.”
[10]. Passenger surveys were carried out in addition to the acceleration measurements.
Since the passenger rating was used to fit parameters of the model, it cannot be easily transferred to judge other accelera-tion histories.
New frequency filters have recently been published which extend the application of
Table 1: Values obtained for illness rating to judge motion sickness
Time
Acce
lera
tion
lateralvertical
MSDV lateral
MSDV vertical
Time
MSD
V
SIMPACK News | July 2013 | 15
This Wiederkehr, Friedhelm Altpeter, Helbling Technik AG, Aarau | CUSTOMER APPLICATION
Fig. 4: Representative evolution of the motion sickness dose value
Fig. 3: Representative accelerations
Based on the results of the motion sick-ness dose value, vehicle design assessment is possible. The results show that the straight part of the track does not cause the MSDV to increase mark-edly. However, the lateral accelerations, which result from the curved part of the track, do increase the MSDV, and thus, the symptoms of motion sickness.
CONCLUSIONThe method presented in this article allows for the assessment of a given railway vehicle design with respect to the passengers’ feel-ings of motion sickness primarily by consid-ering the frequency-weighted lateral and roll accelerations. The presented method can be applied to vertical, lateral and roll motion separately. However, it ignores the effect of phase angles between roll and lateral accelerations which have proven to be important [11].While acceleration measurements are avail-able from existing vehicles, multi-body sim-ulation contributes to a more comfortable train design during the engineering stage. This can be accomplished by using SIMPACK for parameter studies.
REFERENCES[1] A. Lawther and M. Griffin, "Motion Sickness and Motion Characteristics of Vessels at Sea", Ergonomics 31, pp. 1373–1394, 1988.
[2] ISO2631-1, "Mechanical Vibration and Shock — Evaluation of Human Exposure to Whole
Body Vibration", Part 1: General Requirements, 1997. [3] B. E. Donohew and M. J. Griffin, "Effect of Roll Oscil-lation Frequency on Motion Sickness", Aviation Space
Environmental Medicine (74), pp. 326–331, 2003. [4] B. E. Donohew and M. J. Griffin, "Motion Sickness: Effect of the Frequency of Lateral Oscil-
lation", Aviation Space Environmental Medicine (75), pp. 649–656, 2004. [5] Standard, DIN EN 12299: Bahnanwendun-gen — Fahrkomfort für Fahrgäste — Messungen und Auswertung, 2009. [6] M. J. Griffin, "Handbook of Human Vibra-tion", London: Elsevier, 1990. [7] J. T. Reason and J. Brand, "Motion Sickness", London: Academic Press, 1975. [8] J. F. O'Halon and M. E. McCauley, "Motion Sickness Incidence as a Function of the Frequency and Acceleration of Vertical Sinusoidal Motion", Aerospace Medicine, pp. 366–369, April 1974. [9] C. M. Oman, "Motion Sickness: a Synthesis and Evaluation of the Sensory Conflict Theory", CanJPhys, pp. 294–303, 1990. [10] B. Kufver and J. Förstberg, "A Net Dose Model for Development of Nausea", Swedish National Road and Transport Research Institute (VTI), pp. 229–239, 22 September 1999. [11] J. A. Joseph and M. J. Griffin, "Motion Sickness from Combined Lateral and Roll Oscil-lation: Effect of Varying Phase Relationships", Aviation Space Environmental Medicine (78), pp. 994–950, 2007. [12] K. Knothe and S. Stichel, Schienenfahrzeug-dynamik, Berlin: Springer, 2003.
This work was carried out as a Master Thesis at the Universities of Applied Sciences Landshut and Ingolstadt in the program “Applied Compu-tational Mechanics”. The authors would like to thank Rhätische Bahn for supporting the project.
“The method presented in t his article allows the assessment of a given railway vehicle design with respect to the passengers’ feelings
of motion sickness...”