review of kentucky's economic development incentives ky incenti… · is to provide in-depth...
TRANSCRIPT

June 11, 2012
© Anderson Economic Group, LLC, 2012Permission to reproduce in entirety granted with proper citation. All other rights reserved.
Anderson Economic Group, LLC444 N Michigan Ave, Suite 2600Chicago, IL 60611Tel: (312) 670-6810
www.AndersonEconomicGroup.com
Review of Kentucky’s Economic Development Incentives
Prepared by:
Anderson Economic Group, LLCCaroline M. Sallee, DirectorColby Spencer, Senior AnalystJason Horwitz, Senior AnalystAlex Rosaen, Consultant
Commissioned by:Kentucky Legislative Research Commission
Table of Contents
I. Executive Summary ............................................................. 1
Report Purpose ................................................................................ 1Overview of Kentucky’s Incentives ............................................... 2Overview of Approach .................................................................... 5Summary of Findings ...................................................................... 5Recommendations ......................................................................... 17Limitations of Analysis ................................................................. 19About Anderson Economic Group ............................................... 20
II. Kentucky’s Economic Development Programs ............... 21
Purpose of Business Incentives ..................................................... 21Characteristics of Well-Designed Incentive Programs ................. 22Current Incentive Programs in Kentucky ..................................... 23Tax Incentives ............................................................................... 23Loans and Grants .......................................................................... 26Bond Program ............................................................................... 27Tax Increment Financing .............................................................. 28
III. Comparison of Kentucky’s Business Environment with Peer States............................................................... 29
Peer States ..................................................................................... 29Business Environment and Economic Factors .............................. 30Outcome: Economic Indicators .................................................... 31Tax Environment .......................................................................... 32Infrastructure ................................................................................. 33Educational Attainment ................................................................ 35Labor Force ................................................................................... 36Summary of State Environment Factors and
Number of Incentives ................................................................. 38
IV. Kentucky’s Use of Incentives Compared to Peer States .. 39
Summary of Incentives in Kentucky and Peer States ................... 39Use of Incentives to Target Specific Industries ............................ 40Use of Incentives to Address Cost Advantages and
Disadvantages ............................................................................. 43Compliance and Claw-backs ........................................................ 45
V. Knowledge-Based Jobs and Focus on Innovation............ 48
Definition of Knowledge-Based Industries .................................. 48Kentucky’s Knowledge-Based Industries Compared to Peers ..... 49Benchmarking Kentucky’s Performance in Specific
Knowledge-based Sectors ........................................................... 52Factors That Contribute to Knowledge-Based
Business Growth ......................................................................... 58
Anderson Economic Group, LLC TOC-1

Table of Contents
Kentucky Incentives That Target High-Tech and Knowledge-Based Businesses .................................................... 60
Peer State Incentive Comparison .................................................. 61Conclusions and Recommendations ............................................. 77
VI. Job Growth and Cost of Kentucky’s Incentives............... 79
Discussion of Data on Incentives .................................................. 79Caution about Jobs Numbers ........................................................ 79Job Creation at Firms Receiving Incentives ................................. 80Duration of Jobs ............................................................................ 86Gross Cost of Incentives ............................................................... 87Measuring Cost per Job ................................................................ 91KEDFA Direct Loans ................................................................... 92Confirming Results with BLS Data .............................................. 92Wages in Industries Receiving Incentives .................................... 94Limitations of Analysis ................................................................. 96
VII. Evaluating the Effectiveness of Key Incentives in Creating Jobs .............................................................. 97
Incentives Selected for Analysis ................................................... 97Questions For Policymakers Evaluating Incentives ..................... 97AEG Approach to Study Effectiveness ........................................ 99Results of Analysis ..................................................................... 102Conclusion .................................................................................. 105Comparison to University of Kentucky Study ............................ 106
VIII. Analysis of Reporting and Other Requirements ........ 109
Characteristics of Effective Incentive Program Monitoring, Reporting, and Evaluation .................................... 109
Kentucky’s Monitoring of Incentive Programs .......................... 110Reports to the Kentucky Legislature on Incentives .................... 111Monitoring, Reporting, and Evaluation in the Peer States ......... 114Statutory Reporting Requirements for Kentucky’s
Incentive Programs ................................................................... 116Recommendations ....................................................................... 117
IX. Analysis of Process Selecting the CED Secretary........ 119
Kentucky’s Statutory Requirements ........................................... 119Timeline of the Cabinet Secretary Search .................................. 119Salary Comparison with Peer States ........................................... 119Conclusions about Salary and Selection
Process Comparisons ................................................................ 122
Anderson Economic Group, LLC TOC-2

Table of Contents
Appendix A. Kentucky’s Incentive Programs ........A-1
Tax Incentives ............................................................................. A-1Loans and Grants ...................................................................... A-12Bonds ........................................................................................ A-15Tax Increment Financing .......................................................... A-15
Appendix B. Peer State Incentives ........................B-1
Alabama ...................................................................................... B-1Arkansas...................................................................................... B-2Georgia........................................................................................ B-3Illinois ......................................................................................... B-3Indiana ........................................................................................ B-4Missouri ...................................................................................... B-4North Carolina ............................................................................ B-5Ohio ............................................................................................ B-5South Carolina ............................................................................ B-6Tennessee.................................................................................... B-6Texas........................................................................................... B-7Virginia ....................................................................................... B-8West Virginia .............................................................................. B-8
Appendix C. Methodology.....................................C-1
Well-Designed Incentives Analysis ............................................ C-1Jobs Analysis .............................................................................. C-1Effectiveness Analysis ................................................................ C-5Peer Analysis ............................................................................ C-12Knowledge-Based Industries .................................................... C-13Survey of Reports on Incentive Programs ................................ C-17
Appendix D. About the Authors........................... D-1
Anderson Economic Group ........................................................ D-1Study’s Authors .......................................................................... D-1
Anderson Economic Group, LLC TOC-3

Executive Summary
I.Executive Summary
REPORT PURPOSE Economic development incentives are an important tool that state policymakers use to encourage businesses to locate, hire, and invest in their state. Incentives are often used to address cost disadvantages for specific types of industries, revitalize local economies, and attract new industries. The use of incentives comes at a price; governments must either forego tax revenues or appropriate state funds to provide these incentives.
Kentucky’s Legislative Research Commission (LRC) retained Anderson Eco-nomic Group, LLC to study the efficiency, effectiveness, oversight, and report-ing requirements of Kentucky’s incentive programs. The purpose of this report is to provide in-depth information on the Commonwealth of Kentucky’s major incentive programs so that policymakers can make informed decisions about these programs. Specifically, this report:
• Provides information on Kentucky’s incentives, including the purpose and main requirements of the programs.
• Compares Kentucky’s business environment and use of incentives to a set of 13 peer states chosen by the Cabinet for Economic Development (CED): Alabama, Arkansas, Georgia, Illinois, Indiana, Missouri, North Carolina, Ohio, South Carolina, Tennessee, Texas, Virginia, and West Virginia.
• Evaluates Kentucky’s use of incentives to attract high-tech and knowledge-based industries compared to peer states.
• Reports the number of firms that received incentives between 2001 and 2010, and estimates the number of jobs these firms reported creating and maintaining.
• Estimates the “gross cost” to the Commonwealth of Kentucky of incentives due to tax revenue the state has foregone, direct payments from the state in the form of grants and loans, and operating costs of the CED.
• Evaluates the “effectiveness threshold” of a subset of incentives, which is the percentage of new jobs for which the incentive must be directly responsible to be better than an alternative policy of reducing taxes for all businesses.
• Evaluates reporting on incentive programs and sharing of information with Kentucky’s legislature.
• Discusses the process of selecting the Secretary of the Kentucky Cabinet for Economic Development, and compares this process to other states.
We provide a detailed summary of Kentucky’s state incentive programs in Appendix A, a summary of the incentive programs offered in peer states in Appendix B, and our data and methodology in Appendix C.
Anderson Economic Group, LLC 1

Executive Summary
OVERVIEW OF KENTUCKY’S INCENTIVES
We analyzed the major incentive programs offered by Kentucky,1 which include a mix of the following types of incentives:
• Tax-Related IncentivesTwelve of Kentucky’s incentives provide a reduction in taxes that businesses pay, such as the corporate income tax or sales and use tax, often in proportion to
costs associated with a project.2
• LoansKentucky offers three state loan programs, which provide low-interest loans to businesses. The business then repays the loan with interest. Under one incentive program, the loan is “forgivable,” meaning the company does not have to repay it if certain conditions are met.
• GrantsKentucky has one grant program that provides money to firms to train employ-ees residing in Kentucky.
• BondsKentucky has one bond program by which state or local entities issue bonds on behalf of a business. Governments issue the bonds in order to facilitate lower financing costs as the business spends money developing land, buildings, and/or purchasing equipment.
See Table 1, “Summary of Kentucky’s Incentive Programs,” on page 3 for a description of the main purpose and requirements of Kentucky’s incentive pro-grams, along with a list of acronyms used throughout this report.
The Cabinet for Economic Development and the Tourism, Arts, and Heritage Cabinet (TAHC) are responsible for approving and monitoring the state’s major incentive programs. In order to obtain incentives, businesses have to meet cer-tain requirements, by creating jobs and/or making certain investments. Seven incentive programs have a jobs requirement, typically requiring the creation of
between 10 and 25 jobs.3 Other incentives require construction expenditures, site development, or worker training. See “Kentucky’s Economic Development Programs” on page 21.
If the company has met its requirements for the incentive, the CED and the TAHC pass along information to the Kentucky Department of Revenue, when applicable, to provide the credit.
1. At the request of the LRC, we limited our analysis to the major incentive programs overseen by the Cabinet for Economic Development and the Tourism, Arts, and Heritage Cabinet.
2. This incentives count includes Tax Increment Financing projects.
3. The Small Business Investment Credit and the Small Business Loans incentives each require firms to create one full-time job.
Anderson Economic Group, LLC 2
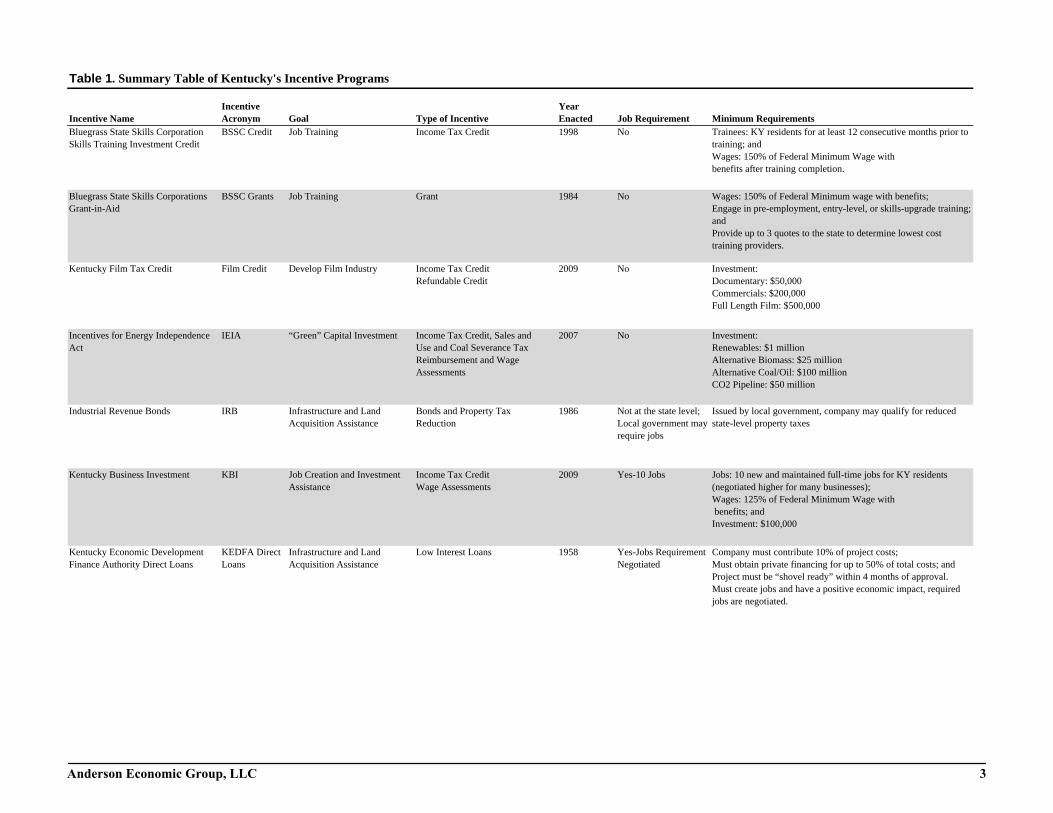
Table 1. Summary Table of Kentucky's Incentive Programs
Incentive NameIncentive Acronym Goal Type of Incentive
Year Enacted Job Requirement Minimum Requirements
BlueSkil
Y residents for at least 12 consecutive months prior to d% of Federal Minimum Wage with
er training completion.
BlueGran
% of Federal Minimum wage with benefits;re-employment, entry-level, or skills-upgrade training;
to 3 quotes to the state to determine lowest cost viders.
Ken :ry: $50,000ls: $200,000 Film: $500,000
InceAct
:s: $1 million Biomass: $25 million Coal/Oil: $100 millionne: $50 million
Indu ocal government, company may qualify for reduced property taxes
Ken w and maintained full-time jobs for KY residents higher for many businesses);% of Federal Minimum Wage with
nd: $100,000
KenFina
ust contribute 10% of project costs; private financing for up to 50% of total costs; and
st be “shovel ready” within 4 months of approval. jobs and have a positive economic impact, required
gotiated.
An 3
grass State Skills Corporation ls Training Investment Credit
BSSC Credit Job Training Income Tax Credit 1998 No Trainees: Ktraining; anWages: 150benefits aft
grass State Skills Corporations t-in-Aid
BSSC Grants Job Training Grant 1984 No Wages: 150Engage in pandProvide uptraining pro
tucky Film Tax Credit Film Credit Develop Film Industry Income Tax CreditRefundable Credit
2009 No InvestmentDocumentaCommerciaFull Length
ntives for Energy Independence IEIA “Green” Capital Investment Income Tax Credit, Sales and Use and Coal Severance Tax Reimbursement and Wage Assessments
2007 No InvestmentRenewableAlternativeAlternativeCO2 Pipeli
strial Revenue Bonds IRB Infrastructure and Land Acquisition Assistance
Bonds and Property Tax Reduction
1986 Not at the state level; Local government may require jobs
Issued by lstate-level
tucky Business Investment KBI Job Creation and Investment Assistance
Income Tax CreditWage Assessments
2009 Yes-10 Jobs Jobs: 10 ne(negotiatedWages: 125 benefits; aInvestment
tucky Economic Development nce Authority Direct Loans
KEDFA Direct Loans
Infrastructure and Land Acquisition Assistance
Low Interest Loans 1958 Yes-Jobs Requirement Negotiated
Company mMust obtainProject muMust createjobs are ne
derson Economic Group, LLC

Table 1. Summary Table of Kentucky's Incentive Programs (continued)
Incentive NameIncentive Acronym Goal Type of Incentive
Year Enacted Job Requirement Minimum Requirements
Ken : $500,000 (non-labor costs)
KenStew
of employees must receive county minimum wage ts; and: $5 million
KenCred
: $20,000 over maximum of two years;g a building to historic standards; andust be part of National Register of Historic Places.
KenAct
aintained jobs (500 if project is a coal mine) must verify if the plant is in danger of closing
Ken : $2.5 million; andtain 85% full employment (negotiated further with
KenInve
: $5,000; ust have less than 100 employees; and 1 new job
Ken nvestment: $5 millionays per year and 25% out-of-state patronst: open 300 days per year and 50% out-of-state patrons
OffiInnoand
-time within three years of loan, must maintain for ears; and,000/yr. excluding benefits.
Sma 1 full-time job;nds only for infrastructure, land, and equipment; and50 or fewer employees
Tax Project Types: Development-Minimum Investment of $20 millionrojects: Minimum Investment of $200 millionrty TIF: Minimum Investment of $10 million
SouAna
An 4
tucky Enterprise Initiative Act KEIA Construction Cost Assistance Sales and Use Tax Refund 2005 No Investment
tucky Environmental ardship Act
KESA “Green” Job Creation Income Tax Credit 2005 No Wages: 90%with benefiInvestment
tucky Historic Preservation Tax its
KHPTC Preservation of Kentucky’s Historic Building
Income Tax Credit 2005 No InvestmentRefurbishinBuilding m
tucky Industrial Revitalization KIRA Job Retention Income Tax CreditWage Assessments
1992 Yes- Jobs Requirement Negotiated
Jobs: 25 mConsultant
tucky Reinvestment Act KRA Job Retention and New Investment Assistance
Income Tax Credit 2003 Yes-Maintain 85% InvestmentJobs: MainCED)
tucky Small Business stment Credit
KSBIC Small Business Job Creation and Investment
Income Tax Credit 2009 Yes-Create 1 Job InvestmentBusiness mJob: Create
tucky Tourism Development Act KTDA Job Creation and Tourism Sales and Use Tax 1996 No Minimum IOpen 100 dIf restauran
ce of Commercialization and vation High-Tech Investment Construction Pools
OCI High-Tech Pools
High-Tech Job Creation Forgivable Loans 2000 Yes-Create 7 Jobs Jobs: 7 fullanother 3 yWages: $40
ll Business Loans SB Loans Small Business Financing Low Interest Loans 2005 Yes-Create 1 Job Job: CreateUse loan fuMust have
Increment Financing TIF Land Development Tax Increment from Property, Income, and Sales Taxes
2000 No 3 Possible Mixed UseSignature PReal Prope
rce: Kentucky Cabinet for Economic Development; Tourism, Arts, and Heritage Cabinetlysis: Anderson Economic Group, LLC
derson Economic Group, LLC

Executive Summary
OVERVIEW OF APPROACH
We estimated the number of jobs created and maintained by firms receiving Kentucky incentives for each year between 2001 and 2010. We also estimated the cost to the state of these incentive programs. We completed these analyses using data provided by the CED and TAHC. These cabinets provided detailed data on the types of incentives awarded, the number of firms receiving an incen-tive, the number of jobs these companies reported, the amount of investment firms make, and the amount of incentives awarded. The Department of Revenue provided the amount of incentives claimed each year by type of incentive. We were able to compare information firms reported to the CED to data maintained by the U.S. Bureau of Labor Statistics (BLS). This provided an independent ver-ification of employment at firms receiving incentives. See “Methodology” in Appendix C for information about our analysis.
The number of jobs presented in this report are those that firms report to the CED directly. (The incentives provided by TAHC do not have jobs require-ments.) Many of Kentucky’s incentive programs require firms to sign a “but for” agreement indicating that they would not have come to Kentucky “but for” the incentive. We do not, and cannot, make the claim that these jobs were directly caused by the provision of the incentive.
For a subset of incentives, we compared the jobs and investment created by tar-geted incentives to the expected jobs and investment that would result from an overall lowering of relevant taxes for all businesses in an amount similar to the current cost of incentives. We then estimated the minimum percentage of reported jobs that would need to be directly caused by the incentive to be more effective at job creation than an overall tax cut for all businesses. We discuss this model in detail in “Effectiveness Analysis” in Appendix C.
We compared the types of incentives offered by Kentucky to incentives offered in peer states. States do not report the cost of incentives to the public, but they release details on the structure and variety of incentives they offer. We used this information to assess Kentucky’s availability of incentives to attract high-tech and knowledge-based firms, in particular.
SUMMARY OF FINDINGS
Our analysis produced the following findings.
1. Businesses that received incentives reported the creation of 55,173 jobs between 2001 and 2010. Many of these jobs lasted for more than one year, resulting in an average of 33,000 “maintained” jobs per year.
Kentucky offers seven incentives that have a jobs requirement. All of these incentives are administered by the CED. Between 2001 and 2010, 577 unique companies received final approval for incentives. These companies reported a total of 55,173 jobs created to the Cabinet for Economic Development. Whether a firm continues to receive an incentive is often contingent upon whether the job
Anderson Economic Group, LLC 5

Executive Summary
is “maintained” (i.e. the firm continues employing someone in that position) for a set number of years. Firms receiving incentives report a yearly average of 33,000 maintained jobs after the job was first created. See Table 2 below and “Job Growth and Cost of Kentucky’s Incentives” on page 79.
2. Jobs created by firms last for an average of five years, according to information reported by businesses receiving incentives. Our analysis suggests that the decline in jobs after five years is due to firms no lon-ger reporting job totals to CED rather than reductions in employment at firms continuing to report jobs.
Job creation is much more valuable if the jobs that are created last more than one year. We used data provided by CED to track the number of jobs created and maintained by firms receiving incentives. Looking at all firms that started reporting jobs between 2001 and 2005, and including these firms in every year
TABLE 2. Jobs Created and Maintained by Companies Receiving an Incentive with a Jobs Requirement, 2001-2010
Year
Number of Firms
Reporting Jobs to CED Jobs Createda
Jobs Maintainedb
Total Jobs Created and Maintained
Jobs Required to be Created or Maintained
Jobs Reported/Jobs Required
2001 199 12,907 30,234 43,141 25,576 169%
2002 204 4,541 35,788 40,329 27,310 148%
2003 184 4,035 30,542 34,577 22,861 151%
2004 162 2,487 31,468 33,955 22,632 150%
2005 128 2,959 30,352 33,311 22,525 148%
2006 171 5,602 35,580 41,182 23,017 179%
2007 222 4,864 40,011 44,875 24,292 185%
2008 242 5,375 42,833 48,208 24,764 195%
2009 226 9,865 22,927 32,792 12,465 263%
2010 200 2,538 32,530 35,068 16,983 206%
TOTAL 577c 55,173 332,265 387,438 222,425 174%
Source: Kentucky Cabinet for Economic Development; AEG EstimatesAnalysis: Anderson Economic Group, LLC
a. “Jobs Created” is calculated by summing the total new (or retained, where applicable) jobs at firms that are reporting for the first time in the corresponding year, where “new jobs” are defined as the total jobs at the firm minus the firm’s begin-ning employment upon receiving the incentive. See “Jobs Created by Firms Receiving Incentives” on page 81 for spe-cific examples that illustrate the “jobs created” concept.
b. “Jobs Maintained” are the total jobs that are new, or retained, in subsequent years at firms that have previously reported to the CED, where “new jobs” are defined as the total jobs at the firm minus the firm’s beginning employment upon receiving the incentive. See “Jobs Created by Firms Receiving Incentives” on page 81 for specific examples that illus-trate the “jobs maintained” concept.
c. This is the total number of unique (unduplicated) firms that reported jobs created or maintained to CED between 2001 and 2010. It does not equal the sum of “number of firms reporting jobs to CED” because most firms report jobs for mul-tiple years.
Anderson Economic Group, LLC 6

Executive Summary
of our analysis whether they reported jobs to the CED each year or not, we found that the average job lasted five years. See “Duration of Jobs” on page 86.
However, when we studied firms that started reporting jobs between 2001 and 2005 and continuously reported jobs for six years, the number of jobs reported at these firms actually increased over time. This suggests that the average job duration of five years is conservative since it does not take into account ongoing jobs at firms that stop reporting jobs due to an incentive ending or not being used in a given year.
3. We found no systematic over-reporting of jobs to the CED by firms that received incentives.
Firms self-report data to the CED on how many employees they have at the site receiving the incentive. In order to verify the number of jobs at the firms that have received incentives, we compared CED-reported data to another data source, the BLS Quarterly Census of Employment and Wages (QCEW). The QCEW contains information on wages and employment for most firms, gath-ered by the states through the unemployment insurance system.
Using this data, we found that a quarter of all companies’ reported employment to the CED was within 5% of the BLS reported employment total. Further, we found that half of the companies reporting to CED were within 15% of BLS totals. See Figure 1 below.
FIGURE 1. Difference Between Data Reported to the CED and Data According to the Quarterly Census on Employment and Wages (QCEW)
0%
5%
10%
15%
20%
25%
30%
35% to 25%Lower
25% to 15%Lower
15% to 5%Lower
5% Lower to5% Higher
5% to 15%Higher
15% to 25%Higher
25% to 35%Higher
Sh
are o
f R
ep
orte
d E
mp
loy
men
t in
Ra
ng
e
Difference Between Employment Reported to CED and Official BLS Statistics
Employment Reported to CED HIGHER than BLS Statistics
Employment Reported to CED LOWER than BLS Statistics
DATA MATCHES
Source: Kentucky Cabinet for Economic Development; Bureau of Labor StatisticsAnalysis Anderson Economic Group, LLC
Anderson Economic Group, LLC 7

Executive Summary
We did not expect the data from these two sources to match perfectly due to sea-sonal trends and differences in how employees are counted. When there were differences in the data, we found that the data reported to the CED was typically lower than the BLS totals, implying no systematic over-reporting by firms to the CED.
4. The “gross cost” to the Commonwealth of Kentucky for tax incen-tives was $140 million in 2010. This includes $118 million in tax rev-enue foregone, $9 million in grants and forgivable loans, and $13 million for running the Cabinet for Economic Development.
We define the “gross cost” of incentive programs to the state to include: (1) the amount of tax revenue foregone due to tax credits and wage assessments, (2) direct payments made to businesses in the form of forgivable loans and grants for activities like training, and (3) the operating and personnel expenses for the Cabinet for Economic Development. Gross cost does not take into account tax revenue that the state might receive from increased economic activity due to the incentive.
According to data provided by the Department of Revenue, the CED, and state budget reports, the gross cost of incentives to the state government was $130 million on average annually between 2001 and 2010. In FY 2010, Kentucky received $118 million less in tax revenue due to incentives, or an amount equiv-alent to 1.4% of General Fund expenditures. See “Gross Cost of Incentives” on page 87.
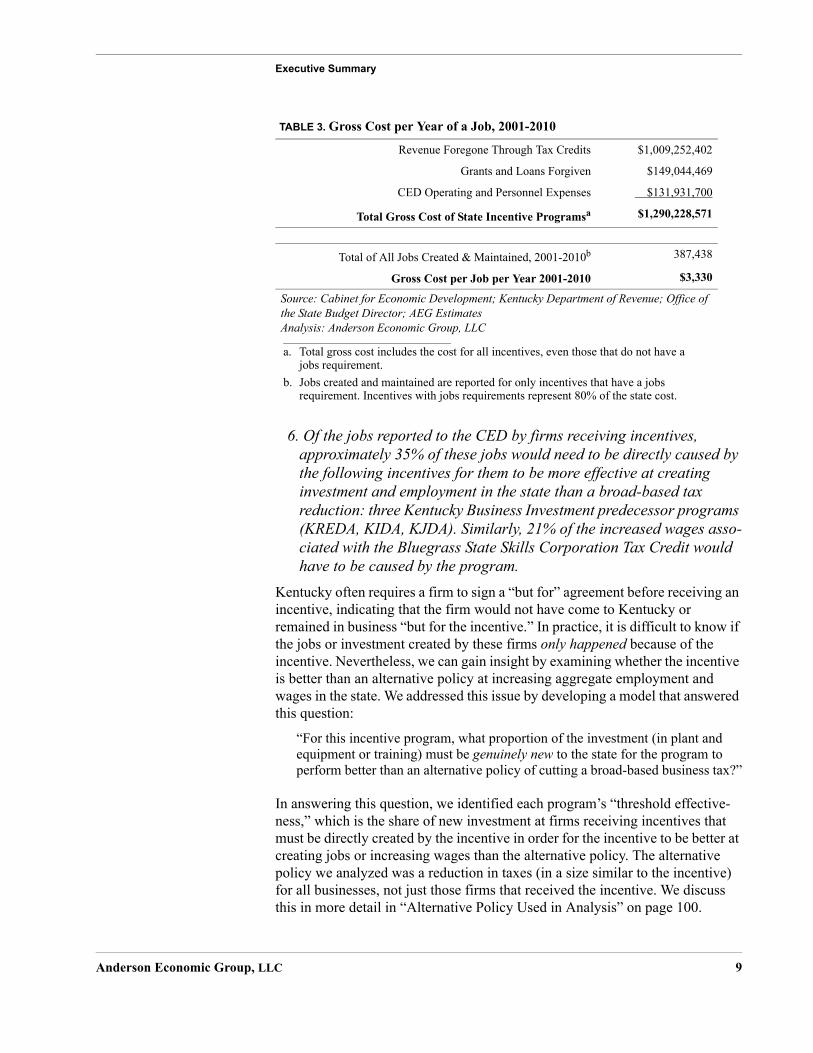
5. The average gross cost of incentives for the state was $3,330 per job per year between 2001 and 2010.
Between 2001 and 2010, the total gross cost to the state for incentive programs was almost $1.3 billion. The total jobs reported as created or maintained during this time was 387,438. The average “gross cost per job per year” was $3,330, as shown in Table 3. This is what the state either gave up in tax revenue or spent on incentive programs for a job reported in one year during this time frame.
It is impossible to know exactly what the businesses receiving incentives would have done without the incentive. It is possible that the firms would have com-pleted the same investment and made the same hiring decisions without the incentive. What we do know is that for firms that have a requirement to create a new job, retain an existing job, and/or maintain the job, the gross cost to the state per job per year was $3,330 between 2001 and 2010.
Anderson Economic Group, LLC 8
Executive Summary
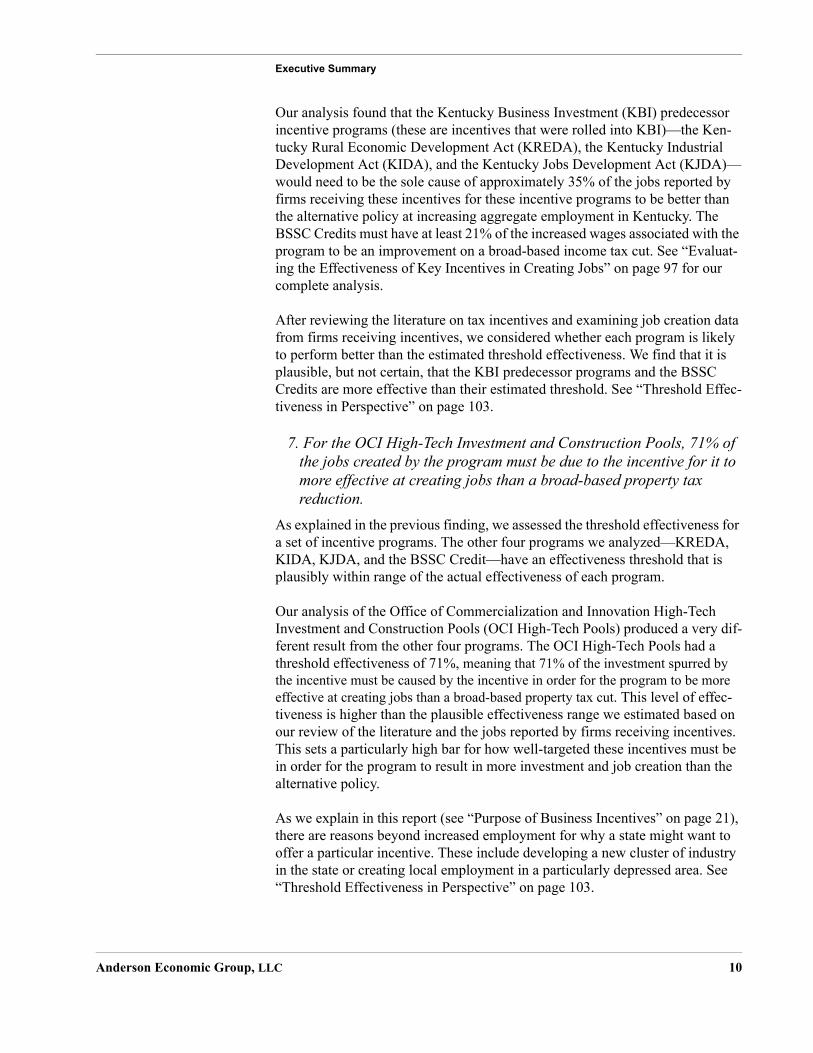
6. Of the jobs reported to the CED by firms receiving incentives, approximately 35% of these jobs would need to be directly caused by the following incentives for them to be more effective at creating investment and employment in the state than a broad-based tax reduction: three Kentucky Business Investment predecessor programs (KREDA, KIDA, KJDA). Similarly, 21% of the increased wages asso-ciated with the Bluegrass State Skills Corporation Tax Credit would have to be caused by the program.
Kentucky often requires a firm to sign a “but for” agreement before receiving an incentive, indicating that the firm would not have come to Kentucky or remained in business “but for the incentive.” In practice, it is difficult to know if the jobs or investment created by these firms only happened because of the incentive. Nevertheless, we can gain insight by examining whether the incentive is better than an alternative policy at increasing aggregate employment and wages in the state. We addressed this issue by developing a model that answered this question:
“For this incentive program, what proportion of the investment (in plant and equipment or training) must be genuinely new to the state for the program to perform better than an alternative policy of cutting a broad-based business tax?”
In answering this question, we identified each program’s “threshold effective-ness,” which is the share of new investment at firms receiving incentives that must be directly created by the incentive in order for the incentive to be better at creating jobs or increasing wages than the alternative policy. The alternative policy we analyzed was a reduction in taxes (in a size similar to the incentive) for all businesses, not just those firms that received the incentive. We discuss this in more detail in “Alternative Policy Used in Analysis” on page 100.
TABLE 3. Gross Cost per Year of a Job, 2001-2010
Revenue Foregone Through Tax Credits $1,009,252,402
Grants and Loans Forgiven $149,044,469
CED Operating and Personnel Expenses $131,931,700
Total Gross Cost of State Incentive Programsa
a. Total gross cost includes the cost for all incentives, even those that do not have a jobs requirement.
$1,290,228,571
Total of All Jobs Created & Maintained, 2001-2010b
b. Jobs created and maintained are reported for only incentives that have a jobs requirement. Incentives with jobs requirements represent 80% of the state cost.
387,438
Gross Cost per Job per Year 2001-2010 $3,330
Source: Cabinet for Economic Development; Kentucky Department of Revenue; Office of the State Budget Director; AEG EstimatesAnalysis: Anderson Economic Group, LLC
Anderson Economic Group, LLC 9
Executive Summary
Our analysis found that the Kentucky Business Investment (KBI) predecessor incentive programs (these are incentives that were rolled into KBI)—the Ken-tucky Rural Economic Development Act (KREDA), the Kentucky Industrial Development Act (KIDA), and the Kentucky Jobs Development Act (KJDA)—would need to be the sole cause of approximately 35% of the jobs reported by firms receiving these incentives for these incentive programs to be better than the alternative policy at increasing aggregate employment in Kentucky. The BSSC Credits must have at least 21% of the increased wages associated with the program to be an improvement on a broad-based income tax cut. See “Evaluat-ing the Effectiveness of Key Incentives in Creating Jobs” on page 97 for our complete analysis.
After reviewing the literature on tax incentives and examining job creation data from firms receiving incentives, we considered whether each program is likely to perform better than the estimated threshold effectiveness. We find that it is plausible, but not certain, that the KBI predecessor programs and the BSSC Credits are more effective than their estimated threshold. See “Threshold Effec-tiveness in Perspective” on page 103.
7. For the OCI High-Tech Investment and Construction Pools, 71% of the jobs created by the program must be due to the incentive for it to more effective at creating jobs than a broad-based property tax reduction.
As explained in the previous finding, we assessed the threshold effectiveness for a set of incentive programs. The other four programs we analyzed—KREDA, KIDA, KJDA, and the BSSC Credit—have an effectiveness threshold that is plausibly within range of the actual effectiveness of each program.
Our analysis of the Office of Commercialization and Innovation High-Tech Investment and Construction Pools (OCI High-Tech Pools) produced a very dif-ferent result from the other four programs. The OCI High-Tech Pools had a threshold effectiveness of 71%, meaning that 71% of the investment spurred by the incentive must be caused by the incentive in order for the program to be more effective at creating jobs than a broad-based property tax cut. This level of effec-tiveness is higher than the plausible effectiveness range we estimated based on our review of the literature and the jobs reported by firms receiving incentives. This sets a particularly high bar for how well-targeted these incentives must be in order for the program to result in more investment and job creation than the alternative policy.
As we explain in this report (see “Purpose of Business Incentives” on page 21), there are reasons beyond increased employment for why a state might want to offer a particular incentive. These include developing a new cluster of industry in the state or creating local employment in a particularly depressed area. See “Threshold Effectiveness in Perspective” on page 103.
Anderson Economic Group, LLC 10

Executive Summary
8. Kentucky has a low share of its employment in knowledge-based industries, but these industries are growing faster in Kentucky than in peer states and the nation. Kentucky is doing well in advanced manu-facturing but lags behind in computer programming and data man-agement industries.
We define knowledge-based sectors to include advanced manufacturing, life
sciences, and information communication technology industries.4 Kentucky is well below the peer state average, falling in the bottom three, for share of state employment in knowledge-based industries. However, Kentucky’s employment in these industries grew at a rate that was twice the peer average between 2004 and 2009 (3% annually versus 1.6%). Kentucky grew especially quickly in bio-logical industries, such as pharmaceutical and medical product manufacturing, and scientific research and development (R&D) services; and research relevant advanced manufacturing industries, such as engineering, testing laboratories, and industrial design. We found, however, that Kentucky lags in information communication technology industries, and growth in these industries was stag-nant. See “Knowledge-Based Jobs and Focus on Innovation” on page 48.
9. Kentucky has one-quarter of the research-intensive industries that its peers have, but it is rapidly increasing employment in these areas. Kentucky has universities to assist with this growth and has targeted research industries with OCI High-Tech Pools incentives and other initiatives.
Kentucky’s share of total employment in research-intensive industries, which includes industries such as engineering, testing laboratories, and scientific research and development services, was one-quarter to one-half the share of employment in peer states. However, these research industries in Kentucky grew at an average annual rate of 18% per year for biological research industries and 6.5% for advanced manufacturing research industries. In comparison, the average rate of growth in peer states was 0.3% and 4.5% in these industries, respectively. See “Kentucky’s Knowledge-Based Industries Compared to Peers” on page 49.
Kentucky has two Carnegie Foundation classified “Very High Research” uni-versities, the University of Kentucky and the University of Louisville. These
universities are assets in growing research-intensive industries in the state.5 Kentucky’s public universities are in the top half of their nationwide peers in number of degrees they award per 10,000 people, and research spending per
4. We followed closely the definition of high-tech and knowledge-based industries targeted by the Office of Commercialization and Innovation (OCI). Advanced manufacturing, research and development, technology, and other sciences are part of their definition.
5. The Carnegie Foundation Basic Classification for University of Kentucky and University of Louisville is “Very High Research.” Other Very High Research universities include MIT and the University of North Carolina at Chapel Hill.
Anderson Economic Group, LLC 11
Executive Summary
degree awarded. See “Factors That Contribute to Knowledge-Based Business Growth” on page 58.
Kentucky has used its Office of Commercialization and Innovation to provide incentives to research-intensive industries. The OCI High-Tech Pools typically provide between $100,000 and $250,000 in forgivable loans for certain start-up activities for high-tech and knowledge-based firms. Of the companies that have received OCI High-Tech Pools incentives, 72% were in knowledge-based industries, as we have defined them in this report. The most common industry targeted by OCI incentives from 2004 to 2010 was scientific research and devel-opment services, followed by scientific and technical consulting services, com-puter systems design, and medical and diagnostic laboratories.
We discuss in Finding 7 that we find it unlikely that OCI High-Tech Pools incentives are better at increasing investment than a broader tax reduction, but that they may be worth doing as part of a larger strategy to attract a certain type of industry. The OCI High-Tech Pools are just one program the OCI uses to tar-get knowledge-knowledge based firms, and it is not necessarily the case that this result applies to other programs. See “Incentives Available to High-Tech and Knowledge-Based Firms” on page 62.
10. Most of Kentucky’s incentive programs are available to knowledge-based and high-tech firms. Kentucky is in the top half of peer states in its offering of targeted incentives, but other states have unique pro-grams that include funding for infrastructure development and tech-nology transfer assistance.
Fourteen of Kentucky’s seventeen incentive programs are available to high-tech and knowledge-based firms. Kentucky is similar to its peers in the type and size of incentives that are available to these industries. We found that peer states had a greater number of incentives that target women and minority businesses and development in rural areas than Kentucky. We found that some states provided more generous grants for infrastructure development, including Tennessee’s Economic Development Grants, that provide up to $750,000 for infrastructure; Missouri’s grants of up to $2 million for industrial infrastructure in economi-cally distressed areas; and Georgia’s Redevelopment Fund that provides up to $500,000 for redevelopment in land and other infrastructure. These are incen-tives that are available to high-tech and knowledge-based industries, as well as other industries. See Table 33, “Comparison of Incentives Available to High-Tech and Knowledge-Based Firms in Kentucky and Peer States,” on page 64.
We were able to identify the differences in the type and structure of incentives that states offer, but not how much money they spend on specific incentives. This information is not publicly reported by the states. Even in Kentucky we were required to sign confidentiality agreements to obtain aggregate cost infor-mation by incentive.
Anderson Economic Group, LLC 12

Executive Summary
In addition to incentives that are available to high-tech knowledge-based firms, Kentucky offers specific incentives that target firms in these industries. Ken-tucky is one of seven peer states that provides a tax credit or tax exemption for expenditures on research and development equipment. Like many of its peers, Kentucky offers grant funding to firms in these industries. Kentucky provides matching funds to businesses who receive a federal Small Business Innovation Research (SBIR) award. The SBIR process is competitive, and Kentucky pro-vides funds to firms who have been vetted through this process. Kentucky is also one of four states that have specific loans available to firms in these indus-tries.
Unique programs in other states include:
• Virginia’s economic development access program that provides up to $500,000 to help build access roads and rail lines to research and development facilities and other high-tech facilities.
• Arkansas’s technology transfer assistance in the amount of $3,750 to help offset costs incurred by firms in the licensing or development of other agreements around technology.
• Arkansas’s royalty financing where the state invests up to a maximum of $100,000 in a business, and in exchange for this investment receives a certain percentage of net sales for a maximum term of 10 years.
• North Carolina’s First Flight Venture Center that provides incubator services in addition to start-up funding for high-tech and knowledge-based firms.
• West Virginia provides preferential property tax rates for manufacturing and high-tech business facilities; exempts property taxes for warehousing and distri-bution centers; and exempts e-commerce businesses from sales tax.
See “Incentives Targeted Specifically Towards Knowledge-Based Firms” on page 70.
11. Kentucky’s business tax and labor cost environment is competitive compared to peer states, but it is behind peers in educational attain-ment and certain types of infrastructure. Kentucky mostly uses its incentive programs to reinforce the good components of its business environment, rather than addressing its weaknesses.
According to surveys of business owners and CEOs, and from our discussions with site selection consultants, we know that businesses look for the following factors when deciding where to locate: quality infrastructure, a skilled work-
force, low business tax burden, and low labor costs.6
Kentucky has a competitive business tax environment and low labor costs com-pared to its peers. We discuss this in detail in “Comparison of Kentucky’s Busi-
6. We relied on two surveys: Area Development, “26th Annual Corporate Survey,” 2011; National Federation of Independent Businesses, National Small Business Poll Series, “Prob-lems and Priorities,” 2008. We also had conversations with site selection consultants referred to us by the CED.
Anderson Economic Group, LLC 13

Executive Summary
ness Environment with Peer States” on page 29. Kentucky’s overall business tax burden, as measured by the share of profits that Kentucky businesses pay in state and local taxes, is lower than its peers.
We show the number of Kentucky incentives that correspond to each business factor in Table 4 below. Kentucky’s incentives align well with what businesses care about. Kentucky has at least one incentive that addresses each business environment factor.
After reviewing the gross cost to the state for each type of incentive, we found that Kentucky’s number one priority in how it uses its incentives, as revealed by state cost, is lowering business taxes and labor costs. The state spends relatively
TABLE 4. Kentucky’s Use of Incentives to Address Business Concerns Compared to Its Peers
Factor
Quality Highway and Infrastructure
Access Availability of Skilled Labor
Corporate and Individual Tax
RatesProperty Tax
Rates Construction
and Labor Costs
Importance to Businessesa #1 #2 #4 #4 #5 (tied)
Kentucky Incentives that Address Business Priorities and Needs
9 3 12 2 10
Incentive Programs in Kentucky
None for Highway Access
Quality Infrastructure: KRA, IEIA, KESA,
KSBIC, KEIA, KHPTC, OCI, KEDFA
Loans, IRB,
KRA, Both BSSC Programs
IEIA, KBI, KRA, KESA, KIRA, Film
Credit, KHPTC, BSSC Credit
TIF and IRB IEIA, KBI, KRA, KEDFA Loans,
OCI, KEIA, KIRA, TIF, IRB, KHPTC
2010 Total Credits, Grants, and Loans in Kentucky to Address
Business Needb
$2,1763,97 $6,722,590 $111,977,574 $770,057 $111,758,632
Kentucky's Competitiveness Without Incentives
Average Below Average Very Competitive
Very Competitive
Very Competitive
Average Number of Peer Incentives that Address Business Priorities and Needs
3 2 10 2 8
Competitive Peers Missouri, Tennessee
Georgia, Missouri,
North Carolina, Virginia
Tennessee, Missouri, Arkansas, Georgia
Missouri, Texas, West
Virginia, North Carolina
South Carolina, West Virginia,
Arkansas
Source: Kentucky Cabinet for Economic Development; Kentucky Department of Revenue; Economic Development WebsitesAnalysis: Anderson Economic Group, LLC
a. Area Development, “26th Annual Corporate Survey,” 2011. National Federation of Independent Businesses, National Small Business Poll Series, “Problems and Priorities,” 2008.
b. The costs shown here overlap because some incentives address more than one business need. Also, not all programs issued credits or spent funds in 2010. Not included in the amounts above are IRBs issued and historic building tax credits.
Anderson Economic Group, LLC 14

Executive Summary
little on incentives to address its weak areas of skilled labor and infrastructure, but there are other ways that the state can address these problems rather than using incentives. See “Comparison of Kentucky’s Business Environment with Peer States” on page 29.
12. Kentucky’s incentives do not include claw-back provisions because incentives are contingent upon performance and awarded on an annual basis. This strategy is preferred by businesses and reduces the state’s recovery costs. Kentucky is a leader in this compared to its peers.
Most of Kentucky’s incentive programs are “performance based,” meaning that the company must meet certain requirements each year to obtain the incentive. In addition, the size of the incentive is tied to the amount of investment.
Kentucky does not have a need for claw-backs due to this structure. Other states require the business receiving the incentive to meet job requirements for a defined number of years or all previous incentives are clawed-back. Kentucky’s approach has three main advantages over using claw-backs. First, the annual monitoring of whether businesses are meeting their requirements limits the cost to Kentucky in a given year. In our analysis, we found that the state pays an average of 38% in a given year of the maximum amount of incentives that firms are eligible to receive (see “Gross Cost of Incentives” on page 87). Since it is harder to collect back incentive funds once paid out, this likely lowers the state’s cost. Second, Kentucky’s approach is also preferred by businesses, making the incentive more appealing to prospective employers since these companies can-not predict economic and market conditions that will affect their business five or ten years in the future, when claw-back provisions may punish them for
under-performing.7 Third, by not placing these long-term conditions on firms, the state limits recovery costs, which require state resources for things like negotiation and possible litigation. See “Compliance and Claw-backs” on page 45.
Kentucky’s OCI High-Tech Pools is the one program that contains a provision that in practice functions like a claw-back. We found that 57 out of 139 projects had to pay back some of the funds the state provided through OCI High-Tech Pools. However, many of these companies only had to pay back a small amount. The total amount of money paid back by companies due to noncompliance, or because their projects were downsized after disbursement of funds, was $7.6 million, or less than 6% of all funds originally disbursed to companies through OCI loans. See “Claw-Back Provisions” on page 45.
7. Based on our conversations with business owners and site selection consultants referred to us by the CED.
Anderson Economic Group, LLC 15
Executive Summary
13. Incentive programs with statutory reporting requirements include OCI, BSSC, KTDA, KEIA, IEIA, TIF, and the Film Credit. These incentives have detailed annual reports on their performance. How-ever, the information and level of detail of these reports is not uni-form. There are a handful of states that do a better job of reporting detailed data on all programs.
The BSSC and OCI, in particular, have extensive annual reports, detailing infor-mation on each project receiving tax credits or grants among the many programs that these two entities administer. In addition, programs administered by the Tourism, Arts, and Heritage Cabinet have extensive reports on incentives pro-vided and project status. For the most part, these entities provide these reports because they are required by law. Among these reports, OCI appears to be the only entity that goes above and beyond the requirements to provide a particu-larly detailed report, replete with suggestions for improving various programs and extensive descriptions of companies receiving incentives. There is no statu-tory requirement for most other programs; however, the CED voluntarily pro-vides extensive information on other programs through its website, as discussed in the next finding.
Reporting standards vary extensively among Kentucky’s peers. A handful of peer states publish detailed reports on all programs, which Kentucky does not do. See “Monitoring, Reporting, and Evaluation in the Peer States” on page 114.
14. While not statutorily required, the CED publishes extensive data on all incentives via its website. This level of transparency is unique to the Commonwealth of Kentucky.
The CED has an extensive and well-maintained website and regularly collects data to monitor the performance of firms receiving the incentives. For each pro-gram, the database that is publicly available on the CED’s website shows pro-jected investment, approved amount of funding, and additional statistics for all companies receiving an incentive. In addition, the CED has started publicly releasing monitoring data, including annual updates on the number of jobs cre-ated and the amount of tax credits claimed, for companies receiving Kentucky Business Investment and Kentucky Reinvestment Act incentives. The CED vol-untarily maintains this level of public information, but it is not statutorily required to report the status of most of its incentive programs to the legislature, the LRC, or the governor.
The CED website is unique among the states in the level of information made available to the public. See “Analysis of Reporting and Other Requirements” on page 109 for more information.
Anderson Economic Group, LLC 16

Executive Summary
15. Kentucky’s process for selecting a secretary of the Cabinet for Eco-nomic Development is different from peer states and focuses on hir-ing someone from the private sector with significant economic development experience.
Kentucky law requires the use of a search firm to identify three candidates to present to the governor for selection. In most states, as in Kentucky, the position is appointed by the governor. Some states require the legislature to confirm the appointment. During our research, we did not come across another state that uses a search firm to identify potential candidates.
Kentucky pays its secretary of the CED $250,000 annually. This is $100,000 more than the average salary of the economic development head in peer states. Possible explanations for the higher salary in Kentucky include the responsibili-ties of the secretary, the high-profile nature of the job, and the requirement that the secretary have significant economic development experience. See “Analysis of Process Selecting the CED Secretary” on page 119 for a complete discussion of this topic.
RECOMMENDATIONS The purpose of this report is to provide extensive information on Kentucky’s incentives so that legislators and other policymakers have the information they need to make informed decisions about the operation of these programs going forward. We only provide recommendations in areas where our research pro-duced insight into specific actions the state could take. These areas are: report-ing on incentive programs, and Kentucky’s use of incentives to target knowledge-based and high-tech firms. The recommendations below can also be found in the corresponding chapters of the report.
Recommendations to Improve Reporting on Incentive Programs
• Consider statutorily requiring that information available on the CED web-site be reported.With the exception of a few programs (BSSC, OCI, KBI, KTDA, IEIA, TIF, and Film Credits), there are few reporting requirements regarding what needs to be provided to the LRC, the legislature, or the gover-nor. Even among programs with reporting requirements, there is a fair amount of variation in what has to be provided. Despite this, the CED makes informa-tion publicly available and continues to increase transparency. This transpar-ency is currently voluntary, so changes in management or procedure at the CED could very possibly result in less rigorous maintenance of the site or an end to this practice altogether. If the legislature prizes this level of transparency, then it may want to make maintenance of this public site a statutory requirement.
• Maintain quality annual reports from BSSC and OCI. The Bluegrass State Skills Corporation and the Office of Commercialization and Innovation each provide an annual report that is easily accessible to the public. These reports are comprehensive, delving into details about the programs that each entity pro-vides and the companies which are taking advantage of their programs. The
Anderson Economic Group, LLC 17
Executive Summary
OCI, in particular, does an impressive job of summarizing activity in the many different programs that they provide, often including specific details about com-panies receiving funding. Though the BSSC report would benefit from even more detail about recipient companies, the report provides a full list of all com-panies receiving funds, with how many funds they receive and the number of employees to be trained. These reports reflect a high level of transparency, and these entities should continue to maintain and improve their quality.
• Produce one comprehensive, annual summary report. As explained above, detailed reports are provided for some of Kentucky’s incentive programs. How-ever, there is no uniform report on all incentive programs. We recommend that comprehensive information on all of Kentucky’s incentive programs be pro-duced annually, with consistent and comparable details available on each pro-gram. Ideally, this information would be provided in one annual report. Such a reform would require collaboration between the TAHC and the CED on moni-toring and reporting standards.
Summary measures that could be included in the report include jobs created or retained by program, investments made by program, amount of revenue forgone due to tax credits and/or grants by program, and number of new projects receiv-ing final approval.
• Maintain consistent monitoring and data definitions to allow for easier tracking of performance by incentive. We found that monitoring data was often inconsistently tracked, and errors were common. A comprehensive report can only be completed year-to-year if there are consistent monitoring and data definitions in place that allow for better tracking of requirements. Agencies should be required to collect data with the knowledge that it will eventually need to be compiled and presented, and they are likely to maintain internal stan-dards that make production of such a report easier. Even in the absence of such a report, agencies involved in monitoring compliance with incentive programs should be rigorous about consistent monitoring and maintaining easily under-standable and accessible data.
Recommendations to Encourage Growth in Kentucky’s Knowledge-Based Industries
We found that research-intensive industries grew rapidly in the last five years for which data was available (2004-2009). We expect this trend to continue nationally, and believe Kentucky can undertake a few actions to support contin-ued growth in these industries.
• Put more emphasis on bridging the gap between research universities and private enterprise. Facilitating connections between researchers and the busi-ness community will help researchers transfer their inventions to the private sector more quickly, and will help the business community complete research necessary for their business.
Of the three states with special offices that target high-tech and knowledge-
Anderson Economic Group, LLC 18

Executive Summary
based firms, two have programs that directly connect businesses with state research universities. In North Carolina, the state sponsors a businesses venture fund and incubator program in partnership with the Research Triangle. The state also connected businesses in specifically targeted industries to the University of North Carolina at Chapel Hill and North Carolina State University to create spe-cial degree programs and course offerings that trained students for work in their industry. Ohio has leveraged Ohio State University to help attract research and development facilities and to aid young entrepreneurs in commercializing tech-nology. The Ohio New Entrepreneurs (ONE) Fund is a partnership between Ohio State University’s College of Business and the Third Frontier Program.
Beyond an annual business plan competition, the OCI does not work with local researchers and students to foster innovation and entrepreneurship. Kentucky’s public research institutions provide an opportunity for the state to develop more knowledge-based and high-tech businesses. Public research universities are a great economic growth driver. Technology transfer activities such as patent cre-ation and start-up companies are just two examples of how universities can assist states with private sector growth.
• Consider increasing or expanding the state’s tax credit for qualified research and development expenditures. Research and development is an area where the state has valuable assets and is growing, but still lags behinds its peers. Kentucky is currently one of seven states that provides a tax credit for qualified expenditures on the construction of research facilities and research performed. However, other states provide more generous credits and appear to publish the availability of these credits more widely than Kentucky.
The legislature may want to consider the following actions. (1) Consider mak-ing more generous the current R&D income tax credit equal to 5% of qualified expenditures. (2) Consider expanding the tax credit to other taxes, such as sales and use, as other states have done. (3) Consider providing an enhanced incen-tive if a firm works with universities for the R&D. Other states have done this, and there are possible benefits from working with public universities, including forming relationships with researchers who can undertake applied research for the firm, and developing relationships with students who could work for the business upon graduation.
LIMITATIONS OF ANALYSIS
While our analysis is extensive and detailed, it does have several limitations, which we describe below.
• We did not analyze whether firms receiving incentives would have created the jobs or investment without the incentive. However, for a subset of incentives, we provide an analysis of the share of investment that would need to be created by the incentive in Kentucky for the program to be better than alternative uses of the same funds. We also compare this to the literature of the likely impact that incentives have on creating employment in states.
• We did not estimate the indirect and induced impacts of incentive programs. In other words, we did not estimate the additional jobs and earnings in the state that might be induced by the incentive (i.e. a ripple or multiplier effect).
Anderson Economic Group, LLC 19

Executive Summary
• The amount of tax revenue that peer states forego due to incentives is not pub-licly-available. This prevented us from completing a state-by-state comparison of incentive strategy and priorities using dollars spent. Instead, we relied on incentive structure for our comparison.
• We did not complete an exhaustive review of all programs offered by the Office of Commercialization and Innovation as we were asked to study only the OCI High-Tech Investment and Construction Pools.
ABOUT ANDERSON ECONOMIC GROUP
Anderson Economic Group, LLC offers research and consulting services in eco-nomics, public policy, finance, and market analysis. AEG has experience assessing state tax incentives and business tax policies across the United States. The firm publishes an annual study on state business tax burdens.
Anderson Economic Group, LLC 20

Kentucky’s Economic Development Programs
II. Kentucky’s Economic Development Programs
States throughout the U.S. have provided business incentives since as early as 1791, when the state of New Jersey offered a company a tax exemption to build
an industrial park.8 Today, Kentucky offers 17 unique business incentive pro-grams through the Cabinet for Economic Development (CED) and the Tourism, Arts, and Heritage Cabinet (TAHC).
Kentucky began offering incentives to businesses in 1984, when the Bluegrass State Skills Corporation (BSSC) started a grant program to help businesses train workers. The past decade has been a period of change for Kentucky’s incen-tives. Kentucky created new incentives to keep pace with other states and to tar-get businesses in high-tech and knowledge-based firms. The state also increased incentive program requirements and consolidated four small similar incentives into one large program.
In this section, we describe the purpose of state-sponsored business incentive programs, discuss the characteristics of well-designed incentives, and provide an overview of Kentucky’s current incentive programs.
PURPOSE OF BUSINESS INCENTIVES
State and local governments use incentives for the following purposes:
1. Address Cost DisadvantagesIncentives are used to reduce the overall cost of doing business for firms that are starting up, expanding, or relocating.
2. Revitalize Distressed Local EconomiesGovernments often offer more generous incentives to business that choose to locate in areas with higher rates of unemployment and poverty. Kentucky pro-vides more generous incentives to firms that locate in enhanced incentive coun-ties where counties have higher unemployment rates, lower educational attainment, and poorer road quality compared to the state average.
3. Encourage Beneficial BehaviorMany states have incentive programs that encourage beneficial behavior, such as lowering plant emissions, or creating new products. An example of this in Kentucky is the Kentucky Environmental Stewardship Act (KESA) where a business receives a tax credit for manufacturing a product with a positive envi-ronmental impact.
4. Targeted Industrial PolicySome states use incentives to attract or support an industry that is not already prevalent in the state due to the potential strategic importance of the industry to growing the state’s economy. For example, the CED’s strategic plan for eco-nomic development emphasizes attracting firms in high-tech and knowledge-based industries, which are growing nationally.
8. Peter Eisinger, The Rise of the Entrepreneurial State: State and Local Development Policy, Wisconsin, 1988.
Anderson Economic Group, LLC 21

Kentucky’s Economic Development Programs
CHARACTERISTICS OF WELL-DESIGNED INCENTIVE PROGRAMS
Not all incentives produce beneficial outcomes or are a prudent use of taxpayer funds. The first step in designing a good incentive is determining its purpose. Eco-nomic developers should ask the following questions when designing incentives:
• What labor force segment are we trying to attract, retain, or employ, and why?
• What industry clusters are currently over- or under-represented in the state com-pared with benchmark states? Are we trying to build on existing strengths or develop new industry clusters where we lag behind?
• What is the state of our tangible infrastructure? Is there evidence that a lack of infrastructure is a barrier to attracting new industries? Are the issues best addressed with broad or targeted policies?
• What is the state’s business climate? Are high costs compared to benchmark states best addressed with broad or targeted policies?
The next step in designing good incentives is defining desired outcomes that can be measured by the agency administering the incentive. Monitoring provides
information that helps states determine whether an incentive is successful or not.9 Table 5 provides examples of incentives and ways to monitor firms receiving incentives.
9. For a discussion of monitoring, see “Analysis of Reporting and Other Requirements” on page 109.
TABLE 5. Examples of Effective Incentive Design
Purpose of Incentive Incentive Example Monitoring Design
Address Cost Disadvantages
Small Business Loan Programs
• Small business provides documentation verifying an inability to acquire private financing.
• State agency collects data on purchases, hiring of new workers, or other metrics to track business growth.
Revitalize Distressed Local Economies
Region-Specific Job Growth Incentive
• Require a commitment from business to stay in region for at least the incentive term.
• State agency collects employment, wage, and investment data on an annual basis.
• Tie amount of credit or grant to performance metrics.
Encourage a Beneficial Behavior
Tax Credit for Pur-chasing Equipment Used in Recycling
• Size of credit should reflect the state’s need for more recycling equip-ment.
• Give credit after proof of investment is shown to state.
Targeted Industrial Policy Tax Credit for New Industries
• Require a commitment from businesses to stay for at least the incen-tive term.
• State agency collects employment, wage, and investment data on an annual basis.
• Tie amount of tax credit to performance metrics.
Sources: AEG research and analysis; Interviews with professional site selection consultants. See Appendix C for sources.Analysis: Anderson Economic Group, LLC
Anderson Economic Group, LLC 22

Kentucky’s Economic Development Programs
CURRENT INCENTIVE PROGRAMS IN KENTUCKY
The Cabinet for Economic Development and the Tourism, Arts, and Heritage Cabinet administer the state’s 17 major incentive programs. Table 6 provides a summary of the incentive programs, sorted by purpose of the incentive and administrative agency. Note that the BSSC Grants and Tax Credits are shown in one row. We discuss each type of incentive in greater detail, including the requirements for participating businesses, in “Kentucky’s Incentive Programs” on page A-1 of Appendix A.
As shown in the table, the majority of the state’s incentives are administered by the CED. Most of Kentucky’s incentives are intended to either address cost dis-advantages or attract or retain a specific industry.
The remainder of this chapter discusses each incentive program type in greater detail.
TAX INCENTIVES Of Kentucky’s 17 active incentive programs, 11 reduce or eliminate a tax.10 This includes eight incentive programs administered by the CED as well as the three programs administered by the Tourism, Arts, and Heritage Cabinet.
TABLE 6. Kentucky’s Incentive Programs: Purpose and Administering Agency
Name of Incentive Administering Agency Purpose of Incentive
Bluegrass State Skills Grants and Tax Credits CED Address Cost Disadvantages
KEDFA Direct Loans CED Address Cost Disadvantages
Kentucky Enterprise Initiative Act CED Address Cost Disadvantages
Kentucky Small Business Investment Credit CED Address Cost Disadvantages
Small Business Loans CED Address Cost Disadvantages
Kentucky Industrial Revitalization Act CED Revitalize Distressed Local Economies
Kentucky Reinvestment Act CED Revitalize Distressed Local Economies
Incentives for Energy Independence CED Encourage Beneficial Behavior
Kentucky Environmental Stewardship Act CED Encourage Beneficial Behavior
Kentucky Historic Preservation Tax Credits TAHC Encourage Beneficial Behavior
Kentucky Film Tax Credit TAHC Targeted Industrial Policy
High-Tech Investment and Construction Loan Pools CED Targeted Industrial Policy
Industrial Revenue Bonds CED Targeted Industrial Policy
Kentucky Business Investment CED Targeted Industrial Policy
Tax Increment Financing CED Targeted Industrial Policy
Kentucky Tourism Development Act TAHC Targeted Industrial Policy
Sources: Kentucky Cabinet for Economic Development; Kentucky Tourism, Arts, and Heritage CabinetAnalysis: Anderson Economic Group, LLC
10.This does not include Tax Increment Financing (TIF) programs. In tables later in the report where we compare Kentucky’s incentives to its peers, we include TIF programs in the “Tax Related Incentives” count.
Anderson Economic Group, LLC 23

Kentucky’s Economic Development Programs
Table 7 shows Kentucky’s tax incentive programs, their purpose, the taxes they affect, and the year they were enacted.
The majority of Kentucky’s tax incentives reduce corporate income tax liability. Under almost all of these incentives, the amount that businesses receive in tax credits is calculated as a percentage of the investment made by the participating
TABLE 7. Kentucky’s Tax Incentive Programs
Incentive Name Acronym Specific Goal Tax Affected Year Enacted
Contract Length
Kentucky Industrial Revitalization Act KIRA Job Retention Income Taxa
Wage Assessments
1992 Up to 10 years
Kentucky Tourism Development Act KTDA Job Creation and Tourism
Sales and Use Tax 1996 Up to 20 years
Bluegrass State Skills Corporation Skills Training Investment Credit
BSSC Credit
Job Training Income Tax 1998 Up to 3 years
Kentucky Reinvestment Act KRA Job Retention and New Investment Assistance
Income Tax 2003 Up to 10 years
Kentucky Enterprise Initiative Act KEIA Construction Cost Assistance
Sales and Use Tax 2005 Up to 7 years
Kentucky Environmental Stewardship Act KESA Green Job Creation Income Tax 2005 Up to 10 years
Kentucky Historic Preservation Tax Credits KHPTC Preservation of Kentucky’s Historic Buildings
Income Tax 2005 Up to 2 years
Incentives for Energy Independence Act IEIA Green Capital Investment
Income Tax, Sales and Use Tax, Coal Severance Tax and Wage Assessments
2007 Up to 25 years
Kentucky Small Business Investment Credit KSBIC Small Business Investment
Income Tax 2009 One time credit
Kentucky Film Tax Credit KFTC Develop Film Industry Income TaxRefundable Credit
2009 One time credit
Kentucky Business Investment KBI Job Creation and Invest-ment Assistance
Income Tax Wage Assessments
2009 Up to 15 years
Incentives Replaced by the KBIb
Kentucky Rural Economic Development Act KREDA Rural Manufacturing Job Creation
Income TaxWage Assessments
1988 Up to 15 years
Kentucky Industrial Development Act KIDA Manufacturing Job Creation
Income Tax Wage Assessments
1992 Up to 10 years
Kentucky Jobs Development Act KJDA Technology Job Creation Income Tax Wage Assessments
1992 Up to 10 years
Kentucky Economic Opportunity Zone KEOZ Economically Disadvantaged Area Job Creation
Income Tax Wage Assessments
2000 Up to 10 years
Source: Kentucky Cabinet for Economic Development; Tourism, Arts, and Heritage CabinetAnalysis: Anderson Economic Group, LLC
a. Throughout the report when discussing Kentucky’s tax incentives we will use “income tax” to mean corporation income tax and limited liabil-ity entity tax. The state’s tax credits against business income cover all types of business entities. For our purposes we call these income tax credits.
b. These four programs are no longer offered to businesses seeking incentives in Kentucky. In 2009 they were eliminated and the Kentucky Business Investment (KBI) was created. The KBI embodies the same goals and characteristics of these four incentive programs and expands them.
Anderson Economic Group, LLC 24
Kentucky’s Economic Development Programs
business. Businesses tend to support this arrangement because it reduces costs in proportion to investment. Kentucky continues to use a company’s overall
investment as the base for creating most incentive packages today.11
Incentives Offered Through the Tourism, Arts, and Heritage Cabinet
The Tourism, Arts, and Heritage Cabinet offers three main incentive programs: a film tax credit, a sales and use tax rebate for tourist attractions, and a tax credit for preserving historical sites. TAHC also administers a revolving loan fund for tourism projects. We discuss TAHC’s three tax-related incentive programs below.
Kentucky Tourism Development Act. A project that is awarded an incentive through the Kentucky Tourism Development Act (KTDA) receives the sales and use taxes paid by visitors for each year it is eligible for the incentive. In order to qualify for this incentive a project must meet certain investment levels and quotas for out-of-state visitors. Most projects must report that at least 25% of its patrons are out-of-state visitors. If the project is a theme restaurant, it must have at least 50% of its patrons from out-of-state to qualify for the incentive. Projects usually determine whether a patron is out-of-state using credit card data. Each project reports to the Tourism, Arts, and Heritage Cabinet on an annual basis. Once the project reports its visitor information, the TAHC contacts the Department of Revenue and the project is given back the estimated sales taxes paid by visitors on admissions, food, gift sales, and lodging. If a project does not meet its targeted percentage of out-of-state visitors then it receives nothing for that year. During the ten years a firm can receive this incentive, a firm can redeem up to a quarter of its initial investment through these rebates.
This “all or nothing” component of the KTDA incentive is different from the structure of most of Kentucky’s tax incentives where a project that achieves a portion of its jobs requirement receives a similar portion of the credit. To date, no project has had less than the required out-of-state visitors.
While the program began in 1996, the Department of Revenue has only remitted sales taxes for projects since 2006. From 2006 through 2011, approximately $36 million in sales and use taxes were remitted back to tourism projects through the KTDA. This is an average of about $6 million per year. In FY 2011, the Com-monwealth of Kentucky collected approximately $2.9 billion in sales and use taxes making up about 33% of the General Fund for the state. The $6 million in sales taxes remitted for the KTDA is equal to 0.1% of sales and use tax revenues
and 0.07% of General Fund receipts.12
11.We learned that Kentucky’s approach with KREDA was well received by the business com-munity during interviews with site selection consultants who have worked with businesses locating to Kentucky. There is also academic literature that supports this statement. See Timo-thy J Bartik, “Solving the Problems of Economic Development Incentives,” W.E. Upjohn Institute, 2007.
Anderson Economic Group, LLC 25

Kentucky’s Economic Development Programs
Film Tax Credit. The Tourism, Arts, and Heritage Cabinet also administers the Film Tax Credit, which went into effect in 2009. This incentive is a refundable credit equal to 20% of the investment made by a film company. It is offered for large-scale feature films, TV shows, documentaries, and short films. This is Kentucky’s only refundable credit program. Under a refundable credit, if a firm’s overall tax liability is less than the amount awarded in credits, the state will remit the additional funds back to the firm by writing a check. For example, if a firm is awarded a credit of $50,000 but its tax liability is only $40,000, the state will give the remaining $10,000 to the firm. The first approvals for this incentive were awarded in 2011. To date, the Department of Revenue has not reported any tax credit claimed by companies that have been awarded this incentive.
Kentucky Historic Preservation Tax Credit. The Kentucky Historic Preser-vation Tax Credit (KHPTC) provides an income tax credit worth up to 20% of rehabilitation expenses that are at least $20,000. The total credit may not exceed $400,000. This credit is administered through the Kentucky Heritage Council within the Tourism, Arts, and Heritage Cabinet. The overall goal is to provide Kentucky businesses and residents an incentive to invest in refurbishing build-ings on the National Register of Historical Places.
The credit is targeted to individuals, businesses, non-profits, and governments. Currently, the maximum amount of incentive allowed for all projects in a given year is $5 million. There are always more projects that qualify for incentives than this $5 million can cover.
LOANS AND GRANTS Kentucky offers three loan programs and one grant incentive. Table 8 below shows these four programs, their purpose, type, and year enacted.
12.Thomas B. Miller, Annual Report 2010-2011, Kentucky Department of Revenue, December 1, 2011.
TABLE 8. Kentucky’s Loan and Grant Programs
Incentive Name Acronym Purpose Type of Program
Year Enacted
Contract Length
Kentucky Economic Development Finance Authority Direct Loans
KEDFA Direct Loans
Infrastructure and Land Acquisition Assistance
Low Interest Loans
1988 Up to 10 years
Office of Commercialization and Innovation High-Tech Investment and Construction Pools
OCI High-Tech Pools
High-tech Job Creation Forgivable Loans
2000 6 years
Small Business Loans SB Loans Small Business Financing Low Interest Loans
2005 Up to 10 years
Bluegrass State Skills Corporations Grant-in-Aid
BSSC Grants Job Training Grant 1984 One Year Grant
Source: Kentucky Cabinet for Economic DevelopmentAnalysis: Anderson Economic Group, LLC
Anderson Economic Group, LLC 26
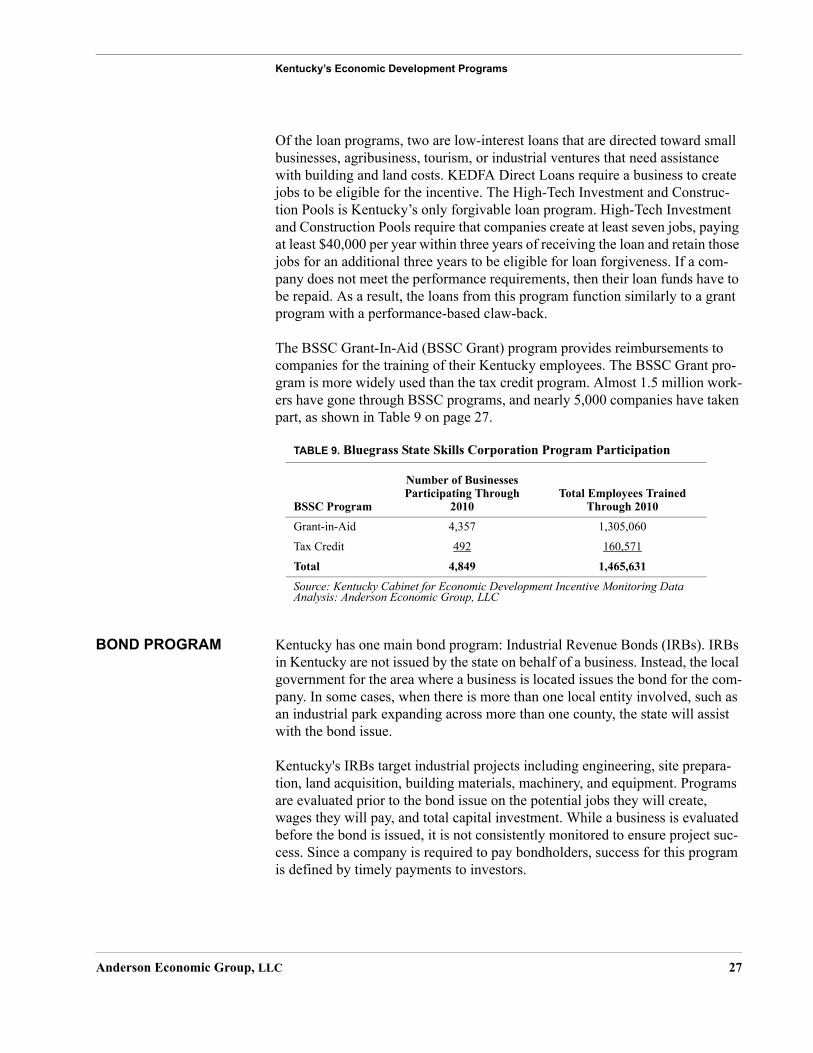
Kentucky’s Economic Development Programs
Of the loan programs, two are low-interest loans that are directed toward small businesses, agribusiness, tourism, or industrial ventures that need assistance with building and land costs. KEDFA Direct Loans require a business to create jobs to be eligible for the incentive. The High-Tech Investment and Construc-tion Pools is Kentucky’s only forgivable loan program. High-Tech Investment and Construction Pools require that companies create at least seven jobs, paying at least $40,000 per year within three years of receiving the loan and retain those jobs for an additional three years to be eligible for loan forgiveness. If a com-pany does not meet the performance requirements, then their loan funds have to be repaid. As a result, the loans from this program function similarly to a grant program with a performance-based claw-back.
The BSSC Grant-In-Aid (BSSC Grant) program provides reimbursements to companies for the training of their Kentucky employees. The BSSC Grant pro-gram is more widely used than the tax credit program. Almost 1.5 million work-ers have gone through BSSC programs, and nearly 5,000 companies have taken part, as shown in Table 9 on page 27.
BOND PROGRAM Kentucky has one main bond program: Industrial Revenue Bonds (IRBs). IRBs in Kentucky are not issued by the state on behalf of a business. Instead, the local government for the area where a business is located issues the bond for the com-pany. In some cases, when there is more than one local entity involved, such as an industrial park expanding across more than one county, the state will assist with the bond issue.
Kentucky's IRBs target industrial projects including engineering, site prepara-tion, land acquisition, building materials, machinery, and equipment. Programs are evaluated prior to the bond issue on the potential jobs they will create, wages they will pay, and total capital investment. While a business is evaluated before the bond is issued, it is not consistently monitored to ensure project suc-cess. Since a company is required to pay bondholders, success for this program is defined by timely payments to investors.
TABLE 9. Bluegrass State Skills Corporation Program Participation
BSSC Program
Number of Businesses Participating Through
2010Total Employees Trained
Through 2010
Grant-in-Aid 4,357 1,305,060
Tax Credit 492 160,571
Total 4,849 1,465,631
Source: Kentucky Cabinet for Economic Development Incentive Monitoring DataAnalysis: Anderson Economic Group, LLC
Anderson Economic Group, LLC 27

Kentucky’s Economic Development Programs
TAX INCREMENT FINANCING
Tax Increment Financing (TIF) programs do not neatly fall under one of the cat-egories of incentives already described in this section. TIFs are development projects where future revenue from increased taxes due to the project is used to pay off debt issued to build certain types of public infrastructure for the project. TIFs work in the following way. First, a TIF development area is established by a city, county, or eligible entity. Second, a TIF project has to meet certain crite-ria, such as using previously undeveloped land or locating in a blighted urban redevelopment area. Third, once the district and project is approved, certain types of tax revenue, the “tax increment,” can be designated to pay off debt issued to build public infrastructure for the project.
TIF projects in Kentucky are generally local in nature. The state will participate in a TIF under certain circumstances. The tax revenue that the state allows to flow to the TIF project is the “possible recovery” from the state to finance the project.
In Kentucky, four TIF districts are currently active and receiving increments. Table 10 below shows the four active TIF areas in Kentucky, the duration, size, taxes eligible, year started, the capital investment made by the company, and the total possible funds recoverable from tax increments over the 20-year term.
TIFs can be risky for the holders of debt related to the project. Projects that tie repayment of bonds to increases in the sales, income, and property taxes in the geographical area of the project may find themselves coming up short if taxes fall due to economic or other circumstances.
TABLE 10. Active TIF Projects in Kentucky
ProjectTIF Term
Size of Development Area
Taxes Eligible For Recovery
Year Started
Capital Investment
Maximum Possible Recovery From State TIF
Downtown Marriott 20 Years 3 Acres Sales, Withholding 2003 $122,000,000 $22,000,000
Churchill Downs 20 Years 147 Acres Corporation Income, Sales 2005 $125,000,000 $25,000,000
Renaissance Zone 20 Years 800 Acres Property, Sales, Withholding 2004 Undetermined Undetermined
Louisville Arena 20 Years 3,840 Acres Property, Sales, Withholding 2009 $435,000,000 $265,000,000
Source: Kentucky Cabinet for Economic DevelopmentAnalysis: Anderson Economic Group, LLC
Anderson Economic Group, LLC 28
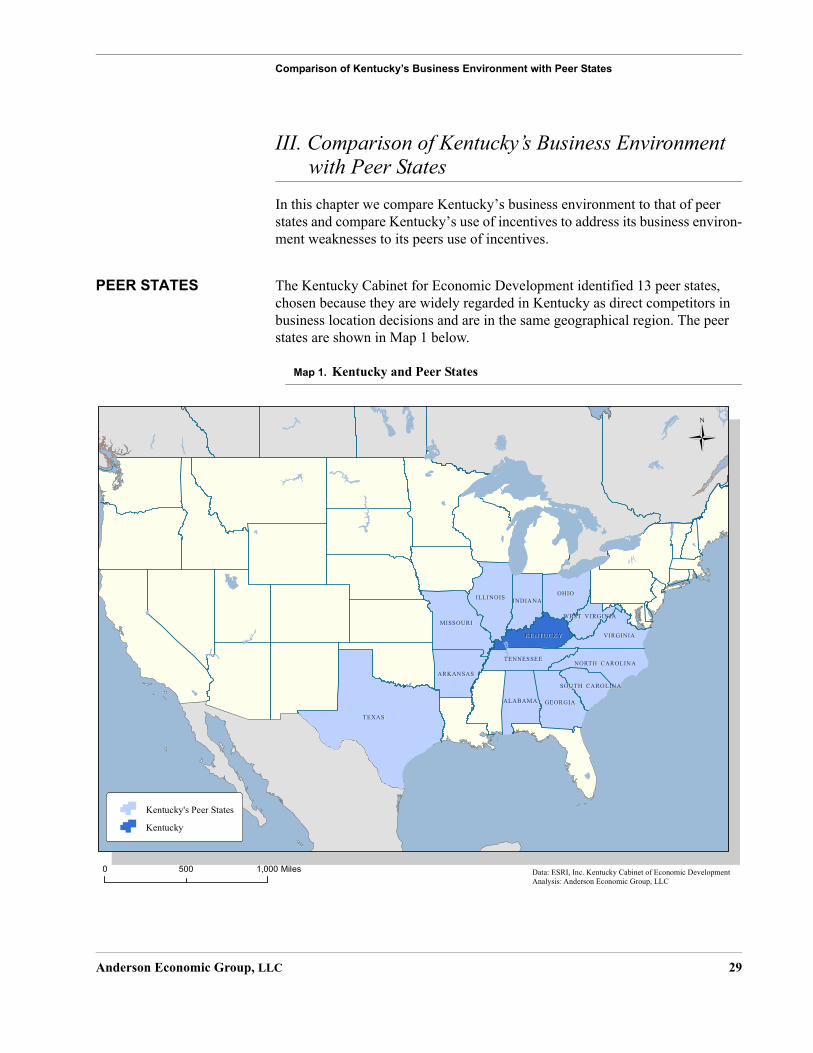
Comparison of Kentucky’s Business Environment with Peer States
III. Comparison of Kentucky’s Business Environment with Peer States
In this chapter we compare Kentucky’s business environment to that of peer states and compare Kentucky’s use of incentives to address its business environ-ment weaknesses to its peers use of incentives.
PEER STATES The Kentucky Cabinet for Economic Development identified 13 peer states, chosen because they are widely regarded in Kentucky as direct competitors in business location decisions and are in the same geographical region. The peer states are shown in Map 1 below.
Map 1. Kentucky and Peer States
TEXASTEXAS
OHIOOHIO
MISSOURIMISSOURI
ILLINOISILLINOIS
GEORGIAGEORGIAALABAMAALABAMA
ARKANSASARKANSAS
VIRGINIAVIRGINIA
INDIANAINDIANA
KENTUCKYKENTUCKY
TENNESSEETENNESSEENORTH CAROLINANORTH CAROLINA
SOUTH CAROLINASOUTH CAROLINA
WEST VIRGINIAWEST VIRGINIA
Data: ESRI, Inc. Kentucky Cabinet of Economic DevelopmentAnalysis: Anderson Economic Group, LLC
Kentucky's Peer States
Kentucky
Ü
0 1,000500 Miles
Anderson Economic Group, LLC 29

Comparison of Kentucky’s Business Environment with Peer States
BUSINESS ENVIRONMENT AND ECONOMIC FACTORS
In “Purpose of Business Incentives” on page 21, we listed “addressing cost dis-advantages” as one of the purposes of state incentives. In this chapter we iden-tify the environment factors that are important to businesses when choosing where to locate and compare Kentucky’s business environment to that of its peers. In Table 11 below, we show the rankings of business environment factors by Chief Executive Officers (CEOs) and small business owners. We include only the factors that governments can address in some way.
The most important factors to CEOs include highway access, cost of labor, availability of skilled labor, tax rates, and access to a college or university. Small business owners also list tax rates and availability of skilled labor in their top business concerns. Small business owners are most concerned with factors that government has some, but little control over, including energy prices and insurance costs.
TABLE 11. Ranking of Importance of Environment Factors by Business
Business Environment Factors Rank for CEOsa
a. This corresponds to priorities of CEOs of larger businesses, reported in the Area Develop-ment survey. Almost half of all respondents are CEOs of mid-sized firms (100-499 employees).
Rank for Small Business Ownersb
b. These rankings correspond to the National Federation of Independent Businesses survey.
Highway Access #1 n/a
Cost of Labor #2 n/a
Availability of Skilled Labor #5 (tied) #12
Tax Incentives and Tax Exemptions #5 (tied) and #8 n/a
Corporate and Individual Tax Rates #4 #3 and #7
Property Tax Rates n/a #4
Access to a University or College #6c
c. “Colleges and universities in area” ranked 6th in terms of importance on the “quality of life factors” in the Area Development survey.
n/a
Note: n/a means “not applicable” to indicate when the survey does not include the environment factor.Source: Area Development, “26th Annual Corporate Survey,” 2011; National Federation of Independent Businesses, National Small Business Poll “Problems and Priorities,” 2008.Analysis: Anderson Economic Group, LLC
Anderson Economic Group, LLC 30

Comparison of Kentucky’s Business Environment with Peer States
In the remaining sections of this chapter, we compare Kentucky’s business envi-ronment and economic performance to that of its peers. Specifically, we look at the following factors:
OUTCOME: ECONOMIC INDICATORS
We compare Kentucky’s recent economic performance to that of its peers using three economic indicators: per capita GDP, per capita personal income, and unemployment. Kentucky’s economy performed worse than the peer state aver-age on all economic indicators shown in Table 12 on page 32. However, Ken-tucky had average growth during this period on all metrics.
Economic Indicators • Per Capita Gross Domestic Product (GDP)• Per Capita Personal Income• Unemployment
Taxes • Business Tax Burden• Corporate, Sales, Property Tax Rates
Infrastructure • Road Quality• Air Passenger Volume and Airport Hubs• Age of Housing• Public Transit Use• Internet Access
Education • Educational Attainment• College Retention and Graduation Rates
Labor Force • Career Readiness for High School Grads
• Median Hourly Wage
• Immigrant and Migrant Educational Attainment• Workforce in Managerial, Professional, or Technical Jobs
• Workforce in IT Occupations
Anderson Economic Group, LLC 31

Comparison of Kentucky’s Business Environment with Peer States
TAX ENVIRONMENT Taxes are one of the most important factors that businesses consider when mak-ing a location decision. A recent CEO survey found that the corporate tax rate is
the fourth most important factor when a business is relocating.13 Table 13 on page 33 shows business tax rates for Kentucky and selected peers.
Kentucky’s business tax environment is competitive. Its overall tax burden, measured as the amount of taxes businesses pay compared to profits available to pay the tax, was below the peer state average. The effective tax rates, which look at what businesses actually pay compared to the property tax base, are very
TABLE 12. Economic Environment Indicators in Kentucky and the Peer States
Per Capita GDP Per Capita Personal Income Unemployment
State 20102010 Rank
2001-2010 Annual Growth 2011
2011 Rank
2001-2011 Annual Growth 2011
2011 Ranka
2001-2011 Average
Kentucky $29,374 10 0.7% $33,667 13 2.9% 9.5% 10 7.1%
Alabama $29,206 11 1.3% $34,650 10 3.3% 9.0% 7 6.1%
Arkansas $27,791 12 1.2% $34,014 11 3.6% 8.0% 3 5.9%
Georgia $32,562 8 -0.7% $36,104 8 2.1% 9.8% 11 6.4%
Illinois $39,838 2 0.8% $44,140 2 2.9% 9.8% 11 7.1%
Indiana $32,251 9 0.4% $35,550 9 2.4% 9.0% 7 6.5%
Missouri $33,100 7 0.5% $38,248 4 2.9% 8.6% 5 6.4%
North Carolina $34,860 4 0.3% $36,164 7 2.5% 10.5% 14 7.2%
Ohio $33,308 5 0.4% $37,791 5 2.6% 8.6% 5 7.0%
South Carolina $27,524 13 -0.2% $33,673 12 2.8% 10.3% 13 7.9%
Tennessee $33,162 6 0.9% $36,533 6 2.9% 9.2% 9 6.8%
Texas $37,435 3 0.8% $39,593 3 3.1% 7.9% 2 6.2%
Virginia $43,127 1 1.6% $45,920 1 3.3% 6.2% 1 4.5%
West Virginia $25,843 14 1.2% $33,513 14 3.6% 8.0% 3 5.9%
Peer State Average
$33,077 0.7% $37,376 2.9% 8.8% 6.5%
Source: Bureau of Economic Analysis; State Level Data and Bureau of Labor Statistics State UnemploymentAnalysis: Anderson Economic Group, LLC
a. States with the same unemployment rate in 2011 are given the same rank.
13.Area Development Magazine, 26th Annual Corporate Survey, 2011.
Anderson Economic Group, LLC 32

Comparison of Kentucky’s Business Environment with Peer States
low. Finally, the statutory rates shown in the table for sales taxes and corporate taxes are average.
INFRASTRUCTURE Access to highways, airports, public transportation, housing, and the Internet are major considerations for business leaders. Table 14 on page 34 benchmarks infrastructure quality metrics for Kentucky and its peers.
Kentucky’s performance in infrastructure is average. Though the overall quality of roads is better than the peer average, many Kentucky residents do not have access to the major highways and interstates. There is room for improvement on
TABLE 13. Business Taxes in Kentucky and Peer States (as of 2011)
State
Business Tax
Burdena
Corporate Income Tax
Rate FY 2011 (Highest
Bracket)b
Personal Income Tax Rate
(Highest bracket shown with flat rate
indicated by *)Sales Tax
Rate
Effective Property Tax
Rate (Commercial
and Industrial Average)c
Effective Commercial and
Industrial Machinery and Equipment Tax
(Commercial and Industrial Average)
Kentucky 18.2% 6.00% 6.0% 6.0% 1.14% 0.98%
Alabama 17.4% 6.50% 5.0% 4.0% 1.37% 1.39%
Arkansas 19.4% 6.50% 7.0% 6.0% 1.38% 1.41%
Georgia 17.1% 6.00% 6.0% 4.0% 1.62% 1.77%
Illinois 18.3% 9.50% *5.0% 6.25% 2.64% None
Indiana 13.8% 8.50% *3.4% 7.0% 2.72% 2.75%
Missouri 15.3% 6.25% 6.0% 4.225% 3.02% 2.64%
North Carolina 16.6% 6.90% 7.75% 4.75% 1.08% 1.30%
Ohio 19.2% None 5.925% 5.5% 2.21% None
South Carolina 21.2% 5.00% 7.0% 6.0% 2.52% 4.75%
Tennessee 18.3% 6.50% *6.0% 7.0% 2.89% 2.16%
Texas 23.1% None None 6.25% 2.44% 2.53%
Virginia 17.2% 6.00% 5.75% 5.0% 0.65% 0.91%
West Virginia 33.4% 8.50% 6.5% 6.0% 1.67% 1.67%
Peer Average 19.3% 6.9% 6.3% 5.5% 2.0% 2.1%
Source: AEG 2011 State Business Tax Burden; The Tax Foundation; Ernst and Young 2011 New Investment Tax BurdenAnalysis: Anderson Economic Group, LLC
a. The business tax burden is the share of profits paid in state and local taxes in 2010. Calculation includes all taxes paid by busi-nesses divided by total profits in state. This is based on AEG estimates, which have not been publicly released.
b. Ohio and Texas both levy a Gross Receipts Tax in lieu of a corporate income tax. The gross receipts tax is not used as part of the “peer average” calculation. Virginia levies both corporate income and gross receipts taxes. Only the corporate income tax is shown and used in the “peer average” calculation.
c. Property Tax Rates are the effective average rates for the state both for property and for equipment and machinery. As these rates are effective rates they do include any incentives claimed by the taxpayers.
Anderson Economic Group, LLC 33
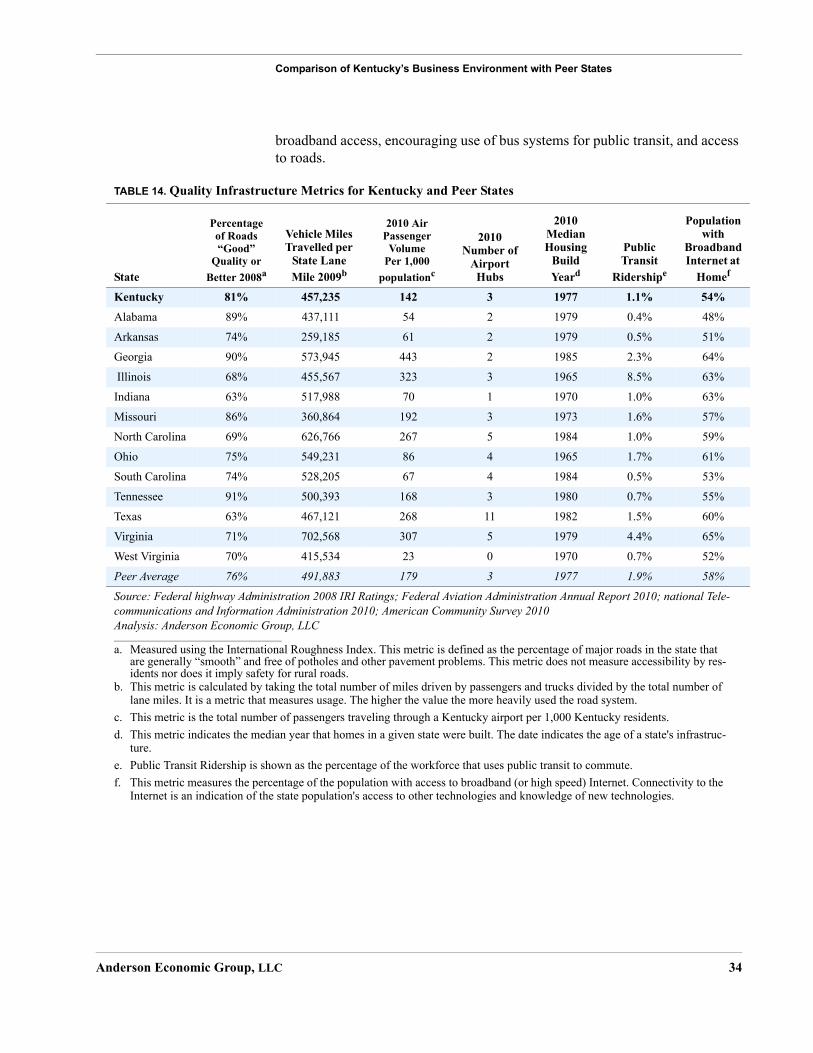
Comparison of Kentucky’s Business Environment with Peer States
broadband access, encouraging use of bus systems for public transit, and access to roads.
TABLE 14. Quality Infrastructure Metrics for Kentucky and Peer States
State
Percentage of Roads “Good”
Quality or
Better 2008a
Vehicle Miles Travelled per
State Lane Mile 2009b
2010 Air Passenger
Volume Per 1,000
populationc
2010 Number of
Airport Hubs
2010 Median Housing
Build Yeard
Public Transit
Ridershipe
Population with
Broadband Internet at
Homef
Kentucky 81% 457,235 142 3 1977 1.1% 54%
Alabama 89% 437,111 54 2 1979 0.4% 48%
Arkansas 74% 259,185 61 2 1979 0.5% 51%
Georgia 90% 573,945 443 2 1985 2.3% 64%
Illinois 68% 455,567 323 3 1965 8.5% 63%
Indiana 63% 517,988 70 1 1970 1.0% 63%
Missouri 86% 360,864 192 3 1973 1.6% 57%
North Carolina 69% 626,766 267 5 1984 1.0% 59%
Ohio 75% 549,231 86 4 1965 1.7% 61%
South Carolina 74% 528,205 67 4 1984 0.5% 53%
Tennessee 91% 500,393 168 3 1980 0.7% 55%
Texas 63% 467,121 268 11 1982 1.5% 60%
Virginia 71% 702,568 307 5 1979 4.4% 65%
West Virginia 70% 415,534 23 0 1970 0.7% 52%
Peer Average 76% 491,883 179 3 1977 1.9% 58%
Source: Federal highway Administration 2008 IRI Ratings; Federal Aviation Administration Annual Report 2010; national Tele-communications and Information Administration 2010; American Community Survey 2010Analysis: Anderson Economic Group, LLC
a. Measured using the International Roughness Index. This metric is defined as the percentage of major roads in the state that are generally “smooth” and free of potholes and other pavement problems. This metric does not measure accessibility by res-idents nor does it imply safety for rural roads.
b. This metric is calculated by taking the total number of miles driven by passengers and trucks divided by the total number of lane miles. It is a metric that measures usage. The higher the value the more heavily used the road system.
c. This metric is the total number of passengers traveling through a Kentucky airport per 1,000 Kentucky residents.
d. This metric indicates the median year that homes in a given state were built. The date indicates the age of a state's infrastruc-ture.
e. Public Transit Ridership is shown as the percentage of the workforce that uses public transit to commute.
f. This metric measures the percentage of the population with access to broadband (or high speed) Internet. Connectivity to the Internet is an indication of the state population's access to other technologies and knowledge of new technologies.
Anderson Economic Group, LLC 34

Comparison of Kentucky’s Business Environment with Peer States
EDUCATIONAL ATTAINMENT
CEOs have cited higher education institutions as a top ten site selection quality-of-life factor. Table 15 shows higher educational attainment metrics for Ken-tucky and selected peer states.
Kentucky ranks among the bottom three performers for higher education attain-ment with only Arkansas and West Virginia falling behind. Overall, Kentucky does not perform well on educational attainment metrics. While the retention rate and six-year graduation rate at its public universities is near the peer aver-age, as is the percentage of 18-24 year olds with some college or higher, the per-centage of the working-age population with a bachelor’s degree or higher is low. Educational attainment in Kentucky’s workforce is not competitive and presents an opportunity for improvement.
TABLE 15. Higher Education Attainment for Kentucky and Peer States
Population Ages 18-24 Population Ages 25+
State Public 4-Year Colleges and Universities
State
High School
Diploma or
Higher
Some College or Associate's
Degree
Some College
or Higher
High School
Diploma or
Higher
Some College or Associate's
Degree
Bachelor's Degree or
HigherAdvanced
Degree
Student Retention
Ratea
6-Year Graduation
Rateb
Kentucky 83% 41% 48% 82% 27% 21% 8% 74.1% 46.6%
Alabama 80% 44% 50% 82% 29% 22% 8% 75.7% 47.6%
Arkansas 80% 42% 47% 83% 29% 20% 6% 70.3% 37.6%
Georgia 79% 40% 47% 84% 28% 27% 10% 80.0% 49.5%
Illinois 85% 45% 57% 87% 29% 31% 12% 79.1% 58.3%
Indiana 80% 42% 50% 87% 28% 23% 8% 77.1% 51.0%
Missouri 84% 44% 53% 87% 29% 26% 10% 76.0% 52.1%
North Carolina 82% 45% 53% 85% 31% 27% 9% 83.0% 59.8%
Ohio 83% 44% 53% 88% 28% 25% 9% 77.1% 51.3%
South Carolina 80% 43% 51% 84% 29% 25% 9% 79.8% 61.4%
Tennessee 84% 42% 49% 71% 27% 23% 9% 74.3% 46.8%
Texas 80% 43% 50% 78% 29% 26% 9% 75.4% 48.7%
Virginia 87% 46% 57% 87% 27% 34% 14% 85.9% 67.4%
West Virginia 84% 42% 50% 83% 24% 18% 7% 71.1% 45.1%
Peer Average 82% 43% 51% 84% 28% 25% 9% 77% 52%
Source: American Community Survey 2010; Integrated Postsecondary Education Data SystemAnalysis: Anderson Economic Group, LLC
a. Student retention rate is the percentage of students at Kentucky's public universities who returned in the 2009 fall semester who were enrolled in the previous semester.
b. The 6-year graduation rate is the percentage of students at Kentucky's public universities who graduate within 6-years of starting a bachelor's degree program.
Anderson Economic Group, LLC 35

Comparison of Kentucky’s Business Environment with Peer States
LABOR FORCE The final category of business environment metrics we analyzed is the labor force. We looked at the labor force in two ways: skills and the mix of jobs in the current workforce.
Workforce Skills. CEOs and small businesses alike consider the availability of skilled labor an important site selection factor. Among CEOs, the availability of skilled labor is the number two most important factor they consider when look-ing to locate a business. Table 16 below benchmarks Kentucky’s workforce skill level to peers.
Among the peer states, Kentucky does not have a high share of high school graduates who are college and career ready. Only 16% of Kentucky’s high school graduates in 2011 scored sufficiently well on the ACT to be defined as “college and career ready.” This percentage is about half that of the top three performers in this metric, where between 30% and 32% of high school gradu-ates were deemed “college and career ready.”
TABLE 16. Workforce Skill Level Benchmarks for Kentucky and Peer States
State
College and Career Ready High School Graduates
2011a
Migration of U.S. Knowledge Workers (Average Years of Education of Recent
U.S. Migrants to the State) 2009b
Immigration of Knowledge Workers
(Average Years of Education of Recent Immigrants) 2009
Kentucky 16% 12.5 12.4
Alabama 18% 12.4 11.5
Arkansas 25% 11.8 11.1
Georgia 21% 12.7 11.8
Illinois 23% 13.5 12.2
Indiana 31% 12.9 12.6
Missouri 26% 12.8 13.7
North Carolina 30% 13.0 11.5
Ohio 28% 13.2 13.4
South Carolina 19% 12.8 12.0
Tennessee 15% 12.5 11.9
Texas 24% 12.6 10.8
Virginia 32% 13.9 13.0
West Virginia 17% 11.9 11.4
Peer Average 24% 12.8 12.1
Source: ACT.org 2011 ACT Test Scores; American Community Survey; Kauffman Foundation for EntrepreneurshipAnalysis: Anderson Economic Group, LLC
a. This is the percentage of high school graduates whose ACT score indicates that they have a 75% chance of receiving at “C” or better in a college course, or a 50% of receiving a “B” or better. ACT.org indicates that students with these scores are most likely to perform well in college and in the workforce.
b. This metric and the next column represent the average years of education for recent U.S. migrants and international migrants. 12 years of education is equivalent to a high school diploma. If the state average is above 12, then the average educational level for workers coming into the state from other states and abroad is above a high school level.
Anderson Economic Group, LLC 36

Comparison of Kentucky’s Business Environment with Peer States
For the other workforce metrics in Table 16, Kentucky performs near the aver-age. U.S. workers migrating into Kentucky on average have slightly above the equivalent of a high school degree. Immigrants into Kentucky from abroad have a similar educational level as domestic migrants. This tells us that, on average, workers moving into Kentucky, whether domestic or from abroad, have slightly more than a high school education.
Current Workforce Employment. We also benchmarked Kentucky and its peers on share of workforce in managerial, professional, and high-tech jobs, as shown in Table 17. Not only are workforce skills important but the types of jobs in each state provides an indication of the business environment, especially for states that are targeting incentives to a specific industry. Kentucky falls near the bottom of its peers with a below average percentage of its workforce in manage-rial, professional, and technical jobs.
Kentucky’s median hourly wage for all workers is low. States like Virginia and Illinois that are home to major cities have the highest wages. They also have a lot of highly educated workers that demand a higher wage because of their skills. States with a similar industrial mix to Kentucky, namely states that com-
TABLE 17. Current Workforce Benchmarks in Kentucky and Peer States
StateMedian Hourly Wage
2011a
a. This represents the median hourly wage in each state for all job categories and levels of employment.
Percentage of the Workforce in Managerial, Professional,
and Technical Jobs 2009
Kentucky $14.62 19.4%
Alabama $14.35 19.0%
Arkansas $13.68 18.1%
Georgia $15.25 20.8%
Illinois $16.95 23.8%
Indiana $15.04 19.1%
Missouri $14.99 21.0%
North Carolina $15.16 20.3%
Ohio $15.67 20.9%
South Carolina $14.45 18.4%
Tennessee $14.56 18.7%
Texas $15.44 20.9%
Virginia $17.45 24.6%
West Virginia $13.46 19.8%
Peer Average $15.11 20.4%
Source: Kauffman Foundation of Entrepreneurship 2010 Report; BLS 2009 Occupational Employment StatisticsAnalysis: Anderson Economic Group, LLC
Anderson Economic Group, LLC 37

Comparison of Kentucky’s Business Environment with Peer States
pete directly, such as Tennessee, Missouri, and North Carolina, all have similar median hourly wage rates.
SUMMARY OF STATE ENVIRONMENT FACTORS AND NUMBER OF INCENTIVES
We show Kentucky’s use of incentives to address business concerns in Table 18 below, and the incentives that other states have to address these business con-cerns. Since there is no publicly available data on the cost of incentives in the peer states, we show the number and mix of incentive programs as a proxy for state priority in the absence of this information.
Kentucky performs well on some of the factors that matter to businesses when selecting a location, and not so well on others. Kentucky has a competitive busi-ness tax environment, and targets many incentives towards reducing taxes that businesses pay. On other measures where some improvements are needed, such as increasing the educational attainment and skills of the workforce, Kentucky has a few incentives for this, but as we discuss in the next chapter does not put much funds towards it.
TABLE 18. Kentucky and Select Peer State Incentives that Address CEO’s Top Site Selection Factorsa
StateTotal
Incentives
Highway Access and Quality
Infrastructure (Priority #1)
Labor and Construction
Costs (Priority #2 &
#5)
Tax Exemptions and Credits
(Priority #5 & #8)
Corporate Tax Rate
(Priority #4)
Availability of Skilled
Labor (Priority #2)
Kentucky 17 9 10 12 8 3Incentives None for Highway
Access and 9 forQuality Infrastructure: KRA, IEIA, KESA,
KSBIC, KEIA, KHPTC, OCI, KEDFA
Loans, IRB
IEIA, KBI, KRA, KEDFA Loans, OCI,
KEIA, KIRA, TIF, IRB, KHPTC
IEIA, KBI, KRA, KESA, KSBIC,
KEIA, KIRA, Tour-ism Credit, Film Credit, KHPTC,
BSSC Credit
IEIA, KBI, KRA, KESA, KIRA, Film Credit,
KHPTC, BSSC Credit
KRA, Both BSSC
Programs
States With at Least One Incentive to Address Each Business Site Selection Factor
North Carolina 11 2 5 6 5 1
Indiana 11 3 3 4 3 2
Virginia 16 3 10 2 2 1
Tennessee 26 7 12 15 12 3
Missouri 27 7 11 16 13 2
South Carolina 31 7 11 29 15 2
Arkansas 32 3 9 16 11 3
Source: Kentucky CED, C2ER.org, Area Development, 26th Annual Corporate Survey, 2011. National Federation of Independent Businesses, National Small Business Poll “Problems and Priorities”, 2008, and Small Business Impact Study, 2009.Analysis: Anderson Economic Group LLC
a. Priority ranking listed under each site selection factor are according to CEOs who were polled in Area Development Maga-zine’s 2011 Annual Corporate Survey of Site Selection Factors.
Anderson Economic Group, LLC 38

Kentucky’s Use of Incentives Compared to Peer States
IV. Kentucky’s Use of Incentives Compared to Peer States
This chapter builds upon the analysis in the previous chapter to assess how Ken-tucky uses incentives compared to its peers. We provide a brief overview of the types of incentives offered by Kentucky and its peers and discuss how well each state addresses business environment factors by using incentives. We compare the incentive compliance structure and claw-back provisions in Kentucky to its peers.
SUMMARY OF INCENTIVES IN KENTUCKY AND PEER STATES
The number and types of incentives offered by Kentucky and its peers are shown in Table 19 below. The table displays the total number of incentives offered by a state, the types of incentives offered, and the percentage of incen-tives with a jobs requirement. A jobs requirement indicates that a participating company must create and/or retain a certain number of jobs in order to receive incentive benefits. The number and types of incentives shown provides an indi-cation of the state’s preferences for incentive type and number. For details on each state’s development policies please see “Peer State Incentives” on page B-1.
TABLE 19. Summary of Number of Type of Incentives Offered in Kentucky and Peer States
State
Total Number of
Active Business
Incentives Bonds LoansInvestment Programs Grants
Tax Related
Incentives
Active Incentives
With A Job Creation
Requirement
Percent of Incentives with Jobs
Requirement
Kentuckya 17 1 3 0b 1 12 7 41%
Alabama 15 0 1 0 3 11 4 27%
Arkansas 32 4 5 3 4 16 7 22%
Georgia 19 1 4 0 3 11 8 42%
Illinois 22 1 7 0 10 4 3 14%
Indiana 11 2 0 1 4 4 3 27%
Missouri 27 3 4 1 3 16 6 22%
North Carolina 11 1 1 1 2 6 6 55%
Ohio 16 2 7 0 2 5 8 50%
South Carolina 31 1 0 0 1 29 7 23%
Tennessee 26 1 4 0 6 15 10 38%
Texas 10 1 3 0 2 4 3 30%
Virginia 16 0 8 0 6 2 6 38%
West Virginia 30 2 5 1 5 17 6 20%
Total Incentives 283 21 52 7 52 151 82 29%
Average Peer State 20 1 4 1 4 11 6 31%
Source: Kentucky CED, C2ER Incentives Database, State Economic Development WebsitesAnalysis: Anderson Economic Group, LLC
a. Kentucky’s total of 17 active incentives does not include the four incentives that were replaced when the KBI was created in 2009. Businesses are still receiving incentives under the older programs.
b. The Office of Commercialization and Innovation supports several incentives that could be considered investment programs. They are not part of the 17 major incentive programs the Legislative Research Commission asked us to analyze and are not included here.
Anderson Economic Group, LLC 39

Kentucky’s Use of Incentives Compared to Peer States
The number of each type of incentive in Kentucky is nearly identical to the peer state average for each incentive category. While Kentucky’s peers range from offering ten incentive on the low end to 32 on the high end, Kentucky falls in the middle. The majority of incentives in Kentucky and peer states are tax related. These incentives take the form of tax credits, refundable credits, preferential tax
rates, tax abatements, and tax exemptions.14 The exceptions to this are Ohio and Virginia, where the majority of incentive programs are loan-related programs, and Illinois, which relies more on grants. Kentucky offers 11 tax incentive pro-grams, which is the third highest proportion of total incentives that are tax
related.15 Among the 14 states in this analysis, Kentucky ranks 4th for highest percentage of incentives with a jobs requirement. The state that is most similar to Kentucky in terms of types and numbers of incentives is Georgia.
A less commonly discussed group of incentives are investment programs. How-ever, five of Kentucky’s peers have state-sponsored investment programs as part of their development policy. These range from a government-sponsored busi-ness incubator in North Carolina's Research Triangle to Arkansas’ state-spon-sored venture capital fund.
USE OF INCENTIVES TO TARGET SPECIFIC INDUSTRIES
One way that states indicate their business development priorities is through tar-geted business incentives. Some states have several programs specially designed for specific industries. Others have incentives available to a short list of industries. Other incentives are very broad-based and available to almost any
industry.16
The majority of Kentucky’s incentives are targeted towards specific industries or groups of industries. The CED’s most recent strategic plan and incentives offered indicate that Kentucky is most focused on manufacturing, advanced manufacturing, high-tech industries, and technology and research-related facili-ties. Most of these are considered “knowledge-based” by Kentucky legislators
and policy.17 Figure 2 on page 41 shows the number of incentives available to different industries. The majority of incentives are available to high-tech,
14.All tax incentives effectively lower the tax liability required by a business whether it is by low-ering the rate they are subject to or by providing credits.
15.Table 19 on page 39 indicates that Kentucky offers 12 “Tax-Related Incentives” in which we included Tax Increment Financing (TIF). While TIF is tax-related, it is not a tax incentive in the same way the others are. Therefore, we separate it for our comparison of more traditional tax incentives.
16.In general, retail businesses are not eligible for incentive programs unless they are part of a larger development district or a tourism project.
17.The Office of Commercialization and Innovation (OCI) housed within the CED specifically lists the industry groups that are classified as “high-tech and knowledge-based” as advanced manufacturing, research and development, technology, and other sciences.
Anderson Economic Group, LLC 40

Kentucky’s Use of Incentives Compared to Peer States
advanced manufacturing, or knowledge-based companies. Note that the number of incentives below does not add to 17 (the number of individual incentives offered by Kentucky) because many incentives are available to multiple indus-try groups.
FIGURE 2. Number of Kentucky Incentives Available to Industries/Type of Facility
Kentucky also makes a large number of incentives available for tourism proj-ects. Not only does it have a specific tourism development incentive (the Ken-tucky Tourism Development Act, or KTDA, that provides sales and use tax rebates), but the state also provides tax incentives for tourism projects that make large capital investments in the state.
* This category includes incentives targeted to advanced manufacturing, research and development facilities, and high-tech industries.Note: The values above do not sum to 17 incentives. Incentives often target more than one industry.Source: Cabinet for Economic Development; C2ER.org; State Economic Development websitesAnalysis: Anderson Economic Group, LLC
Anderson Economic Group, LLC 41

Kentucky’s Use of Incentives Compared to Peer States
Peer State Priorities
Kentucky’s peers have a wide range of priorities for their incentive programs. There is not a common theme among the states—some states focus heavily on underdeveloped, economically disadvantaged areas and others heavily target specific industries. Below we highlight the incentives offered in Missouri, North Carolina, Ohio, and Tennessee. We selected these states to profile, due to the variety and unique aspects of them. We provide information on incentive programs offered in all peer states in Appendix B.
Missouri. Missouri’s 27 incentive programs focus heavily on business develop-ment for agriculture and manufacturing, and provide incentives for distressed communities.
Overall, these programs are not focused on job creation. Only six of Missouri’s 27 incentives have a jobs requirement, but programs with a jobs requirement have higher minimums than Kentucky’s incentives. For example, the Business Incentives for Large Scale Development requires between 100 and 500 jobs. Additionally, unlike Kentucky, Missouri provides some incentives based the number of jobs they create rather than on a company’s investment in the state. For example, Missouri’s brownfield development incentive awards a company between $500 and $1,300 per job created.
Missouri’s TIF program is also unique in that the state will only fund a TIF proj-ect at the request of a local government that cannot finance the project itself. The state also partners with local government through Missouri’s industrial infrastructure grants. If a local government cannot fully fund infrastructure improvements, the state will provide funds to the sponsoring local government.
North Carolina. North Carolina targets almost all of its incentives toward tech-nology and research and development (R&D). This is partly because it is home to the so-called Research Triangle, which includes Duke University, University of North Carolina Chapel Hill, and North Carolina State University. Official development policy in the state focuses on three main goals: workforce, disad-vantaged populations, and business development. North Carolina does not offer many broad-based incentives and instead has a list of “preferred industries” for its incentive programs. Among these are aircraft maintenance and repair, mail-order and electronic shipping warehouses, motorsports, and R&D facilities.
Half of North Carolina’s incentives have a jobs creation requirement. One such program is a grant given to companies to stimulate job creation, where the firm must agree to stay in the state for at least 150% of the time of the agreement. The state’s business property tax credit, which waives property taxes, requires a company to create at least 75 jobs and pay at least 50% of employee health insurance premiums.
North Carolina only has one loan program, the Microenterprise loan program. This differs from Kentucky’s loans because it specifically targets rural, low-
Anderson Economic Group, LLC 42

Kentucky’s Use of Incentives Compared to Peer States
income, female, and minority business owners. This program is similar to micro loans in developing countries. Loans can be issued on an individual or a group basis, and North Carolina provides training programs for loan recipients to help educate the recipients about how the program works.
Ohio. Ohio’s development incentives differ from those of most peer states because the majority are loans, rather than tax incentives. Ohio’s loan programs do have a jobs requirement; however, the requirement is not as high in compari-son to other states. In four loan programs, the recipient company must create 1 job per $35,000 to $75,000 in loans, depending on the program. Ohio’s one pro-gram with a high jobs requirement is the Job Retention Credit, where a com-pany must first employ at least 500 people before it can apply for the incentive, and then it must retain those workers upon receiving the credit.
Also, Ohio’s programs frequently have a location and an industry target. For example, most loans for R&D facilities, manufacturing, and distribution centers are only available to companies locating in a rural area. Similar to North Caro-lina’s micro-loan program, Ohio’s incentives also places special emphasis on minority-owned and women-owned businesses.
Tennessee. Tennessee’s economic development strategy is regional in nature. It separates the state into nine regions, with each region having its own strategic plan and development targets. Of Tennessee’s 26 incentives, 22 are available to alternative energy firms and environmentally friendly product manufacturers. The state also places special emphasis on high-tech industries, including advanced manufacturing and R&D.
Similar to Missouri, most of Tennessee’s incentives that require jobs provide funds on a per-job basis. For example, for the state’s Jobs Tax Credit, a com-pany creating between 25 and 400 jobs receives $4,500 per employee. Tennes-see's tax incentives for job creation offer the most per job among the peer states. Tennessee also offers a credit called the Integrated Supplier and Integrated Cus-tomer Tax Credit, which provides a $5,000 credit per job. This credit is avail-able to projects involving investment over $1 billion and that also employ a minimum of 500 people.
For a complete list of the number of targeted incentives in Kentucky and each peer state please see “Number of Incentives in Kentucky and Peer States Target-ing Specific Industries” on page B-12. For more details on incentives in all 13 peer states, please see “Peer State Incentives” on page B-1.
USE OF INCENTIVES TO ADDRESS COST ADVANTAGES AND DISADVANTAGES
Ideally, a state’s incentive programs address the most pressing business con-cerns that state governments have the power to address. As discussed in “Com-parison of Kentucky’s Business Environment with Peer States” on page 29, the four main categories of interest to businesses for site selection are:
• Business Taxes and Costs
• Quality Infrastructure
Anderson Economic Group, LLC 43

Kentucky’s Use of Incentives Compared to Peer States
• Higher Education
• Labor Force
Table 20 below shows these areas of business concern. Most of Kentucky’s pro-grams are tax incentives, although the state already has a competitive tax system without the incentives. Kentucky also spends the most on tax incentive pro-grams. Kentucky is not using its incentive programs to address weaknesses in the areas of infrastructure development and a lack of skilled labor.
TABLE 20. Kentucky’s Use of Incentives to Address Business Concerns Compared to Its Peers
Quality Highway and Infrastruc-
ture Access
Availability of Skilled Labor
Corporate and Individual Tax
Rates
Property Tax Rates
Construction and Labor Costs
Business Prioritya #1 #2 #4 Small Business
Priority #4b#5
Number of Incentives that Address Business Priorities and Needs
0 for Highways and Roads
9 for Other Infra-structure
3 12 2 10
Programs in Kentucky None for Highway Access
Quality Infrastructure: KRA, IEIA, KESA,
KSBIC, KEIA, KHPTC, OCI, KEDFA
Loans, IRB,
KRA, Both BSSC Programs
IEIA, KBI, KRA, KESA, KIRA, Film
Credit, KHPTC, BSSC Credit
TIF and IRB IEIA, KBI, KRA, KEDFA Loans,
OCI, KEIA, KIRA, TIF, IRB, KHPTC
2010 Total Credits, Grants, and Loans in Kentucky to Address
Business Needc
$2,1763,97 $6,722,590 $111,977,574 $770,057 $111,758,632
AEG’s Assessment of Kentucky's Competitiveness Without Incentives
Average Below Average Very Competitive
Very Competitive
Very Competitive
Average Number of Peer Incentives that Address Business Priorities and Needs
3 2 10 2 8
Competitive Peers Missouri, Tennessee
Georgia, Missouri,
North Carolina, Virginia
Tennessee, Missouri, Arkansas, Georgia
Missouri, Texas, West Virginia, North Carolina
South Carolina, West Virginia,
Arkansas
Source: Kentucky Cabinet for Economic Development; Kentucky Department of Revenue; Economic Development WebsitesAnalysis: Anderson Economic Group
a. Rankings of the importance of environment factors is from Area Development, “26th Annual Corporate Survey,” 2011. Area Development surveys the highest rankings person in firms. Almost half of respondents work for mid-sized firms (100-499) employees.
b. This ranking is taken from the National Federation of Independent Businesses, National Small Business Poll, “Problems and Priorities,” 2008. Property taxes are a particular concern to small businesses. See also Exhibit B-3.
c. The dollars shown here overlap because some incentives address more than one business need. The sum of these rows would result in a much larger value than the state actually spends on credits, grants, and loans. Also, not all programs issued credits or spent funds in 2010. Not included in the amounts above are IRBs issued and historic building tax credits.
Anderson Economic Group, LLC 44

Kentucky’s Use of Incentives Compared to Peer States
COMPLIANCE AND CLAW-BACKS
Performance Based Incentives
Most of Kentucky’s incentive programs are “performance based.” That is, the receiving company must meet certain requirements in order to receive the incentive each year. In “Current Incentive Programs in Kentucky” on page 23, we outlined the minimum requirements for Kentucky’s incentive programs. All but two of Kentucky’s performance-based incentives are awarded on a sliding scale. This means that if a company has a requirement in its contract to create 20 jobs, but only creates 10 jobs, it would only receive 50% of its potential maxi-mum incentive amount for that year.
As we discussed in “Tax Increment Financing” on page 27, TIF projects only receive a benefit if they are profitable and increasing in value. The KTDA pro-gram only awards sales and use tax refunds for a given year if the full require-ments are met. If not, then the company does not receive any tax refund that year.
Claw-Back Provisions
Many states that offer up-front incentives on the promise of performance have claw-back provisions in a company’s contract. A claw-back occurs when a com-pany does not meet its requirements and must pay the state back for a portion of the incentive received. Claw-back provisions are necessary if a program is designed to provide taxpayer dollars to a company up-front before performance is measured. These provisions ensure that a company has an incentive to comply with the requirements. Table 21 on page 46 shows which of Kentucky’s peer states have claw-back provisions. The table also indicates the percentage of incentives with a jobs requirement. We include this measure because the major-ity of claw-backs occur when a company does not meet its promised job perfor-mance.
Kentucky does not have claw-back provisions for its state-sponsored jobs-based tax incentive programs because they are structured to only award performance. The only program that has a provision that in practice functions like a claw-back is the High-Tech Investment and Construction Pools program from the Office of Commercialization and Innovation (OCI High-Tech Pools). This program pro-vides forgivable loans to high-tech firms that create jobs paying at least $40,000 per year. A company is given up-front funds as part of the program like any other loan, and then is required to create jobs within three years of the loan and maintain them for another three years. The company is then issued annual repayment notices and must provide job and wage information to the OCI. If a company meets its targets, the loan is forgiven for that payment period and that portion looks more like a grant. However, if a company does not meet its target, the loan must be repaid. What makes the OCI High-Tech Pools incentives simi-
Anderson Economic Group, LLC 45

Kentucky’s Use of Incentives Compared to Peer States
lar to a grant with a claw-back is that the loan must only be repaid if a firm does not perform.
Some states, North Carolina for example, include claw-back provisions on per-formance-based awards if a company does not maintain its contract to term. This means that some states will only award incentives when a company reports its employment, but if that company is not able to maintain its employment for the duration of the contract with the state, then the state can require the com-pany to pay back all or a portion of the incentives received. Kentucky’s perfor-mance-based incentives do not have a claw-back provision in this way. The Kentucky Department of Revenue awards tax credits based on performance only in the years that the company reports its employment and meets a percent-age of required job creation.
Claw-back of OCI High-Tech Investment and Construction Pools. In the previous section, we mention that the forgivable loans in OCI High-tech Pools resemble a grant with a claw-back provision. In any given year, firms only have to pay back a portion of the original up front loan disbursement if they fail to perform the requirements outlined by the OCI, so in practice, the program is
TABLE 21. Claw-back Requirements in Kentucky and Peer States
State Claw-back Provisions
Percentage of all Incentives with Jobs-Requirement
Kentucky Yesa
a. The OCI High-Tech Investment and Construction Pools contain a provision resembling a claw-back.
41.2%
Alabama Yes 26.7%
Arkansas Yes 21.9%
Georgia Yes 42.1%
Illinois Yes 13.6%
Indiana Yes 27.3%
Missouri Yes 22.2%
North Carolina Yes 54.5%
Ohio Yes 50.0%
South Carolina No 22.6%
Tennessee No 38.5%
Texas Yes 30.0%
Virginia Yes 37.5%
West Virginia Yes 20.0%
Source: Kentucky Cabinet for Economic Development; GoodJobsFirst.org; State Eco-nomic Development Websites; News Articles; C2ER.orgAnalysis: Anderson Economic Group, LLC
Anderson Economic Group, LLC 46

Kentucky’s Use of Incentives Compared to Peer States
administered no differently than an up front grant that must be partially returned if a company fails to follow through on its part of the agreement, just like a claw-back provision.
Out of 157 total projects granted loans from OCI between 2000 and the end of the year 2011 (the OCI has only been in operation since 2000), 18 have resulted in the funds being withdrawn prior to disbursement, meaning the funds were never provided. Out of the remaining 139 projects, 57 have had to pay back at least some money to the state after the funds had already been provided. The amount that companies are required to pay back varies considerably. Of the 57 projects that paid back at least some of their loan, 21 paid back over $100,000 each to the state. The total amount of money paid back by companies due to noncompliance, or because their projects were downsized after reimbursement, was $7.6 million, or nearly 6% of all funds originally disbursed to companies through OCI loans.
Companies that are unable to pay back all the money at once can choose to arrange a payment schedule where they return the loan with interest to the CED over time. There are 3 companies that are currently in the process of returning loaned funds under a payment plan.
Claw-backs at the Local Level. One program that is partially provided by the state and partially provided by a local entity does have a claw-back provision. This program is the Economic Development Bond (EDB) program. EDBs are funds from bonds specifically issued by the state for economic development activities. This pool of money can be used as up-front funding for a business as part of an incentive package. Most companies receive EDB funding in a pack-age with other incentives that have performance requirements, and with other incentives provided by a local government.
If a company receives an EDB along with other incentives from the CED, then the EDB funds are subject to claw-backs by the participating local government. If a company does not meet the goals of its incentive program as required, and has received an EDB, then the local government, not the state, can claw back those up-front funds. The funds are not returned to the state but can be used by the local government for economic development activities that are approved by the CED.
Anderson Economic Group, LLC 47

Knowledge-Based Jobs and Focus on Innovation
V. Knowledge-Based Jobs and Focus on Innovation
This chapter provides a discussion of Kentucky’s performance in knowledge-based industries, and how Kentucky is using incentives to target firms in high-tech and knowledge-based industries. We then compare Kentucky’s incentives to incentive programs in other states.
DEFINITION OF KNOWLEDGE-BASED INDUSTRIES
We define the knowledge-based economy of Kentucky as a combination of three primary components: advanced manufacturing, life sciences, and informa-tion and communication technology (ICT). These three components combined provide a comprehensive definition of the knowledge-based economy, which includes fields as diverse as computer systems engineering, graphic design, machinery manufacturing, pharmaceutical manufacturing, and scientific research and development (R&D), among many others.
We go into much greater detail about these three distinct components in “Bench-marking Kentucky’s Performance in Specific Knowledge-based Sectors” on page 52, but first, we present a brief summary below:
• Advanced Manufacturing. This sector includes manufacturing industries that produce high-tech materials and rely on advanced processes for their produc-tion. In many cases, these industries have seen significant advances in produc-tivity due to technologically advanced machinery and procedures. Many industries in this sector produce complex or precision products. We also include non-manufacturing industries that provide support to advanced manufacturing through engineering and scientific research.
• Life Sciences. The life sciences sector includes all industries that contribute to the advancement of human health. The life sciences sector includes relevant research in laboratories, manufacturing of medical machinery and pharmaceuti-cal products, and some other chemical manufacturing.
• Information and communication technology. This sector is what many peo-ple think of when they think of high-tech and knowledge-based industries. It includes website and graphic design, data management, telecommunications, and electrical engineering.
There is some overlap between these three sectors. For example, pharmaceutical manufacturing is both a life sciences industry and an advanced manufacturing industry. We eliminate duplication in the aggregate performance of knowledge-based industries that we discuss in the following section.
See Table C-4 in Appendix C for a full list of the knowledge-based industries by North American Industry Classification System (NAICS) codes.
Anderson Economic Group, LLC 48

Knowledge-Based Jobs and Focus on Innovation
l h
KENTUCKY’S KNOWLEDGE-BASED INDUSTRIES COMPARED TO PEERS
We compare Kentucky’s employment in knowledge-based industries to that of its peers in Table 22. Kentucky has a very low share of its statewide employ-ment and payroll in knowledge-based industries, but it is improving more quickly than its peers and the national average. In 2004, only 4.4% of employ-ment in the state was in knowledge-based industries. That is the lowest share out of all of the peer states except for West Virginia in the year 2004. In that year, payroll in knowledge-based industries totaled $2.8 billion in the state.
From 2004 to 2009 (the year in which the most recent data is available), Ken-tucky employment in knowledge-based industries grew by 3.1% each year, on average. This is a higher rate of growth than all but two peer states, North Caro-lina and West Virginia. In addition, this rate of growth in the knowledge-based sector is three times the national average, and about twice the peer average, over that same time period. Even after this level of growth, however, the size of the knowledge-based sector in Kentucky is only greater than two peer states—West Virginia and Arkansas. Arkansas performed particularly poorly between 2004
TABLE 22. Employment and Payroll in Knowledge-based Industries in Kentucky and Peer States, 2004 and 2009
EMPLOYMENT PAYROLL (millions)
2004%
Total 2009%
Total
Avg. Annual Growth 2004
% Total 2009
% Total
Avg.AnnuaGrowt
Kentucky 65,611 4.4% 76,585 5.2% 3.1% $2,796 6.1% $4,082 7.9% 7.9%
United States 9,621,509 8.4% 10,119,197 8.8% 1.0% $591,112 13.9% $726,329 15.0% 4.2%
Peer Average 219,425 7.5% 237,190 8.1% 1.6% $12,612 12.5% $16,037 13.7% 4.9%
Peer Average (w/o Virginia)
204,462 7.0% 220,724 7.5% 1.5% $11,443 11.4% $14,408 12.5% 4.7%
Alabama 107,785 6.6% 116,766 7.2% 1.6% $5,391 10.8% $6,892 12.1% 5.0%
Arkansas 44,660 4.4% 45,515 4.7% 0.4% $2,033 7.1% $2,271 6.9% 2.2%
Georgia 288,978 8.4% 329,126 9.7% 2.6% $16,709 13.8% $22,302 16.3% 5.9%
Illinois 425,078 8.1% 429,037 8.4% 0.2% $26,421 12.7% $30,827 13.2% 3.1%
Indiana 144,499 5.6% 153,193 6.3% 1.2% $7,100 8.3% $8,143 9.2% 2.8%
Missouri 167,098 6.9% 169,935 7.2% 0.3% $8,781 11.1% $10,338 11.6% 3.3%
North Carolina 213,035 6.3% 251,162 7.5% 3.3% $11,415 10.4% $16,748 13.5% 8.0%
Ohio 296,874 6.2% 297,621 6.7% 0.1% $15,600 9.6% $17,858 10.4% 2.7%
South Carolina 80,093 5.1% 88,859 5.8% 2.1% $3,914 8.4% $4,810 9.3% 4.2%
Tennessee 139,709 6.0% 126,993 5.5% -1.9% $6,992 9.1% $7,609 8.8% 1.7%
Texas 666,234 8.2% 760,086 8.5% 2.7% $40,841 13.9% $54,245 14.4% 5.8%
Virginia 413,938 13.6% 451,254 14.7% 1.7% $27,818 24.2% $37,215 27.1% 6.0%
West Virginia 18,351 3.2% 24,528 4.3% 6.0% $760 4.9% $1,176 6.2% 9.1%
Source: Bureau of Labor Statistics, U.S. Census Bureau County Business PatternsAnalysis: Anderson Economic Group, LLC
Anderson Economic Group, LLC 49

Knowledge-Based Jobs and Focus on Innovation
and 2009 in these industries. Employment in 2009 in knowledge-based indus-tries in Kentucky was 77,000, and payroll totaled $4.1 billion.
Table 23 below compares the average annual wage in knowledge-based sectors to the average annual wage economy wide for Kentucky, the nation, and peer states. The motivation for attracting knowledge-based investment and jobs to the state is justified in part by the significantly higher wages paid for knowl-edge-based jobs, compared to the average job. Knowledge-based jobs pay about $19,000 per year more than the average job in Kentucky, the nation, and peer states. In Kentucky, knowledge-based jobs pay, on average, $53,300 per year compared to $34,800 per year across all sectors in Kentucky.
Kentucky wages are lower than both those of peer states and of the nation, on average, in knowledge-based sectors and economy wide. This is, in some ways, a good thing because it makes Kentucky a more attractive, low-cost environ-ment for businesses. At the same time, however, it reflects the lower productiv-ity economy and lower education level of workers in Kentucky compared to its peers and to the nation.
The industries that contributed the most to growth in Kentucky’s knowledge-based sector were motor vehicle manufacturers and wired telecommunications carriers. Computer systems design contributed the most to growth in the knowl-edge-based sector nationally, and was third in terms of employment growth among knowledge-based sectors in Kentucky. See Table 24 on page 51 for the knowledge-based industries that exhibited the most employment growth between 2004 and 2009.
TABLE 23. Average Wages in Knowledge-Based Sectors, Kentucky and Peer States, 2009
Knowledge-based Sectors All Sectors
Kentucky $53,303 $34,790
United States $71,777 $42,403
Peer States $67,612 $39,960
Note: Average Wage is annual payroll divided by employment.Source: U.S. Census Bureau County Business PatternsAnalysis: Anderson Economic Group, LLC
Anderson Economic Group, LLC 50

Knowledge-Based Jobs and Focus on Innovation
t
8
8
4
5
6
9
4
6
7
8
The knowledge-based industries that had the greatest impact on employment growth in Kentucky tend to align pretty consistently with those creating the most employment growth nationally in the knowledge-based sector. Knowl-edge-based industries that are growing in Kentucky but do not appear in the top ten for the nation include professional and commercial equipment and supplies wholesalers, medical equipment and supplies manufacturing, iron and steel mills and ferroalloy manufacturing, electronic and precision equipment repair and maintenance, and electric lighting equipment manufacturing.
Knowledge-based industries growing quickly nationally that Kentucky has not seen a lot of growth in include architectural, engineering, and related services; software publishing; other information services, such as news syndicates and Internet publishing; advertising and public relations; and medical and diagnostic laboratories. These are areas that were doing well nationally between 2004 and 2009. Also, given the growth in electric manufacturing and electronic equip-ment maintenance in the state, it is somewhat surprising that Kentucky has not shared in the national growth of electrical and electronic goods wholesalers (employment in this industry in Kentucky increased by 207 jobs from 2004 to 2009).
TABLE 24. Top Knowledge-Based Industries for Employment Growth, Kentucky and U.S., 2004-2009
KENTUCKYKnowledge-based Industry
Employment Increase(2004-09)
UNITED STATESKnowledge-based Industry
EmploymenIncrease(2004-09)
1. Motor vehicle manufacturing +12,056 1. Computer systems design and related services +246,66
2. Wired telecommunications carriers +4,272 2. Architectural, engineering, and related ser-vices
+101,24
3. Computer systems design and related services +3,105 3. Other information services (news syndicates, Internet publishing, Web search portals)
+87,35
4. Radio and television broadcasting +2,939 4. Wired telecommunications carriers +59,10
5. Professional and commercial equipment and supplies merchant wholesalers
+2,652 5. Electrical and electronic goods merchant wholesalers
+57,61
6. Medical equipment and supplies manufactur-ing
+2,153 6. Other telecommunications (satellite tracking and stations, Internet access services)
+50,38
7. Motion picture and video industries +1,974 7. Advertising, public relations, and related ser-vices
+42,36
8. Iron and steel mills and ferroalloy manufac-turing
+1,863 8. Software publishers +41,39
9. Electronic and precision equipment repair and maintenance
+1,351 9. Motion picture and video industries +33,69
10. Electric lighting equipment manufacturing +942 10. Medical and diagnostic laboratories +30,45
Note: Employment increases in these industries do not sum to the totals in Table 22 on page 49 because only the top ten industries areshown. Many of the other industries not shown had negative growth in employment over this period in both Kentucky and the U.S.Source: Bureau of Labor Statistics, U.S. Census Country Business PatternsAnalysis: Anderson Economic Group, LLC
Anderson Economic Group, LLC 51

Knowledge-Based Jobs and Focus on Innovation
BENCHMARKING KENTUCKY’S PERFORMANCE IN SPECIFIC KNOWLEDGE-BASED SECTORS
To further assess Kentucky’s performance in high-tech industries, we took a closer look at the three components in our definition: advanced manufacturing, life sciences, and information and communication technology.
Advanced Manufacturing
The U.S. continues to be the largest manufacturer in the world, but the type of manufacturing in which our country excels has changed dramatically over the past few decades. Today, the manufacturing sectors that tend to thrive in the United States are those that are the most productive, using advanced processes and high technology to generate the most output from workers and equipment.
We divide advanced manufacturing into two sub-sectors: advanced products and
processes, and relevant research industries.18 We define these sub-sectors as fol-lows:
• Advanced products and processes consist primarily of food manufacturing, chemical manufacturing, industrial machinery manufacturing, electrical equip-ment manufacturing, and transportation equipment manufacturing, among other industries. These are industries that require high-tech equipment, produce high-tech products, or have been rapidly increasing in productivity recently due to adoption of new processes.
• Relevant research industries include services industries that substantially sup-port advanced manufacturing, such as engineering, test laboratories, industrial design, and technical consulting.
The employment, payroll, and average wage in advanced manufacturing indus-tries for the years 2004 and 2009 are summarized in Table 25 below for Ken-tucky, its peer states, and the nation.
18.The industries included in advanced manufacturing were drawn from a previous AEG report:Caroline Sallee, Erin Agemy, and Alex Rosaen, “The University Research Corridor’s Support for Advanced Manufacturing in Michigan,” Anderson Economic Group, LLC, July 2010.
Anderson Economic Group, LLC 52
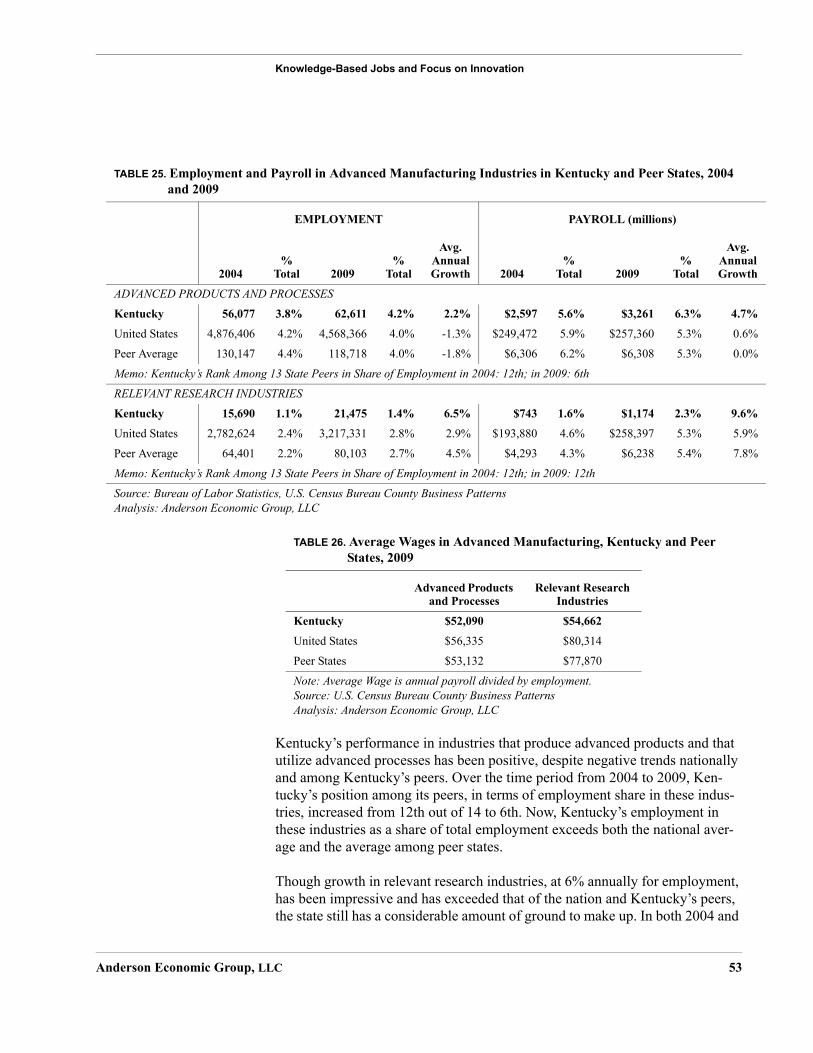
Knowledge-Based Jobs and Focus on Innovation
Kentucky’s performance in industries that produce advanced products and that utilize advanced processes has been positive, despite negative trends nationally and among Kentucky’s peers. Over the time period from 2004 to 2009, Ken-tucky’s position among its peers, in terms of employment share in these indus-tries, increased from 12th out of 14 to 6th. Now, Kentucky’s employment in these industries as a share of total employment exceeds both the national aver-age and the average among peer states.
Though growth in relevant research industries, at 6% annually for employment, has been impressive and has exceeded that of the nation and Kentucky’s peers, the state still has a considerable amount of ground to make up. In both 2004 and
TABLE 25. Employment and Payroll in Advanced Manufacturing Industries in Kentucky and Peer States, 2004 and 2009
EMPLOYMENT PAYROLL (millions)
2004%
Total 2009%
Total
Avg. Annual Growth 2004
% Total 2009
% Total
Avg. AnnualGrowth
ADVANCED PRODUCTS AND PROCESSES
Kentucky 56,077 3.8% 62,611 4.2% 2.2% $2,597 5.6% $3,261 6.3% 4.7%
United States 4,876,406 4.2% 4,568,366 4.0% -1.3% $249,472 5.9% $257,360 5.3% 0.6%
Peer Average 130,147 4.4% 118,718 4.0% -1.8% $6,306 6.2% $6,308 5.3% 0.0%
Memo: Kentucky’s Rank Among 13 State Peers in Share of Employment in 2004: 12th; in 2009: 6th
RELEVANT RESEARCH INDUSTRIES
Kentucky 15,690 1.1% 21,475 1.4% 6.5% $743 1.6% $1,174 2.3% 9.6%
United States 2,782,624 2.4% 3,217,331 2.8% 2.9% $193,880 4.6% $258,397 5.3% 5.9%
Peer Average 64,401 2.2% 80,103 2.7% 4.5% $4,293 4.3% $6,238 5.4% 7.8%
Memo: Kentucky’s Rank Among 13 State Peers in Share of Employment in 2004: 12th; in 2009: 12th
Source: Bureau of Labor Statistics, U.S. Census Bureau County Business PatternsAnalysis: Anderson Economic Group, LLC
TABLE 26. Average Wages in Advanced Manufacturing, Kentucky and Peer States, 2009
Advanced Products and Processes
Relevant Research Industries
Kentucky $52,090 $54,662
United States $56,335 $80,314
Peer States $53,132 $77,870
Note: Average Wage is annual payroll divided by employment.Source: U.S. Census Bureau County Business PatternsAnalysis: Anderson Economic Group, LLC
Anderson Economic Group, LLC 53

Knowledge-Based Jobs and Focus on Innovation
2009, the share of total employment in relevant research industries was approx-imately half of that in peer states. Also, the state’s average wage in relevant research industries is strikingly low compared to the nationwide and peer-state average, suggesting that the state continues to lag behind in higher-paid profes-sions, such as engineers and research scientists.
Life Sciences
The life sciences, in general, consist of those industries that improve human health through research, development, and application of biological processes, tools, and advanced medical treatments. The life sciences are an important part of the country’s high tech and knowledge-based industries. Developments in medicine and agriculture, for example, tend to require the use of advanced tech-nologies in a research setting, and they often result in global improvement of technology and health treatments.
We divide life sciences into two sub-sectors: a biological cluster and a medical
cluster.19 We define these sub-sectors as follows:
• The biological cluster includes industries such as pharmaceutical and medical product manufacturing, chemical preparation and product manufacturing, and scientific research and development.
• The medical cluster includes medical laboratories and diagnostic imaging cen-ters. This does not include health services.
The employment, payroll, and average wage in life sciences industries for the years 2004 and 2009 are summarized in Table 27 on page 55 and Table 28 on page 55 for Kentucky, its peer states, and the nation.
19.The industries included in life sciences were drawn from a previous AEG report:Caroline Sallee, Erin Agemy, and Alex Rosaen, “The University Research Corridor’s Support for Advanced Manufacturing in Michigan,” Anderson Economic Group, LLC, July 2010.
Anderson Economic Group, LLC 54
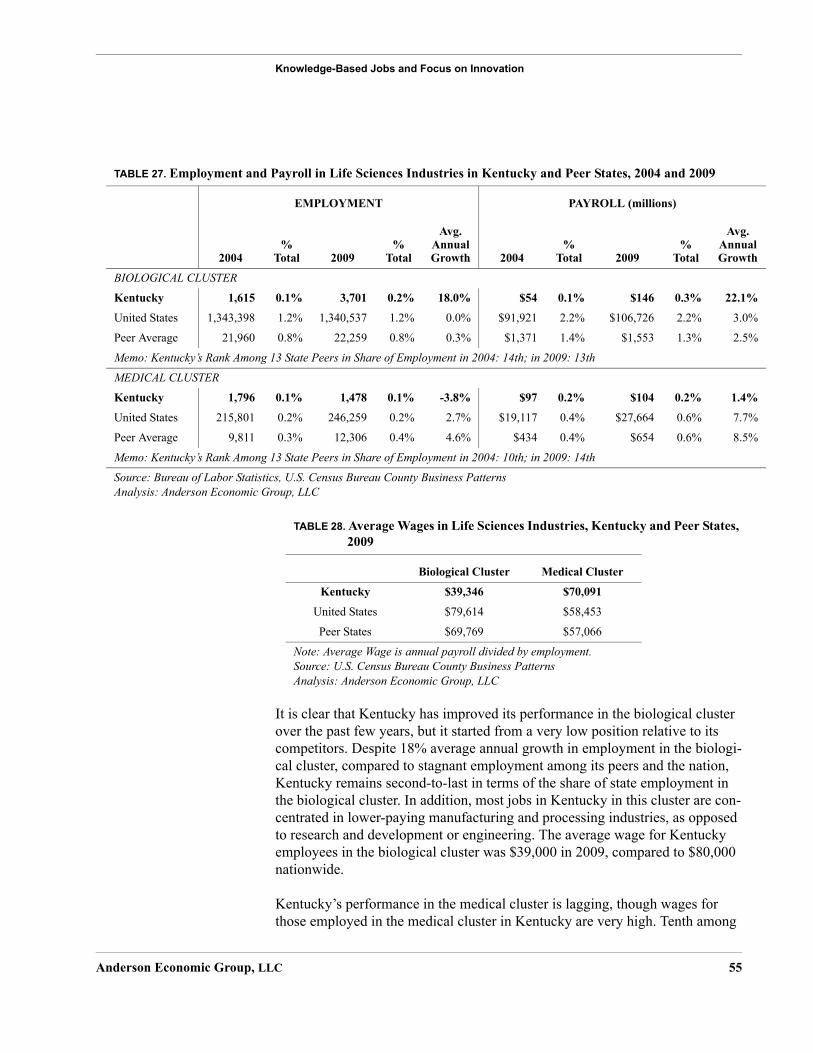
Knowledge-Based Jobs and Focus on Innovation
It is clear that Kentucky has improved its performance in the biological cluster over the past few years, but it started from a very low position relative to its competitors. Despite 18% average annual growth in employment in the biologi-cal cluster, compared to stagnant employment among its peers and the nation, Kentucky remains second-to-last in terms of the share of state employment in the biological cluster. In addition, most jobs in Kentucky in this cluster are con-centrated in lower-paying manufacturing and processing industries, as opposed to research and development or engineering. The average wage for Kentucky employees in the biological cluster was $39,000 in 2009, compared to $80,000 nationwide.
Kentucky’s performance in the medical cluster is lagging, though wages for those employed in the medical cluster in Kentucky are very high. Tenth among
TABLE 27. Employment and Payroll in Life Sciences Industries in Kentucky and Peer States, 2004 and 2009
EMPLOYMENT PAYROLL (millions)
2004%
Total 2009%
Total
Avg. Annual Growth 2004
% Total 2009
% Total
Avg. AnnualGrowth
BIOLOGICAL CLUSTER
Kentucky 1,615 0.1% 3,701 0.2% 18.0% $54 0.1% $146 0.3% 22.1%
United States 1,343,398 1.2% 1,340,537 1.2% 0.0% $91,921 2.2% $106,726 2.2% 3.0%
Peer Average 21,960 0.8% 22,259 0.8% 0.3% $1,371 1.4% $1,553 1.3% 2.5%
Memo: Kentucky’s Rank Among 13 State Peers in Share of Employment in 2004: 14th; in 2009: 13th
MEDICAL CLUSTER
Kentucky 1,796 0.1% 1,478 0.1% -3.8% $97 0.2% $104 0.2% 1.4%
United States 215,801 0.2% 246,259 0.2% 2.7% $19,117 0.4% $27,664 0.6% 7.7%
Peer Average 9,811 0.3% 12,306 0.4% 4.6% $434 0.4% $654 0.6% 8.5%
Memo: Kentucky’s Rank Among 13 State Peers in Share of Employment in 2004: 10th; in 2009: 14th
Source: Bureau of Labor Statistics, U.S. Census Bureau County Business PatternsAnalysis: Anderson Economic Group, LLC
TABLE 28. Average Wages in Life Sciences Industries, Kentucky and Peer States, 2009
Biological Cluster Medical Cluster
Kentucky $39,346 $70,091
United States $79,614 $58,453
Peer States $69,769 $57,066
Note: Average Wage is annual payroll divided by employment.Source: U.S. Census Bureau County Business PatternsAnalysis: Anderson Economic Group, LLC
Anderson Economic Group, LLC 55

Knowledge-Based Jobs and Focus on Innovation
its peers in terms of employment share in 2004, the state fell to last by 2009. This suggests that medical laboratories and centers for high-technology treat-ment have been stagnant in the state, even as they have become increasingly important in the economies of the state’s peers. We should note that the benefits of this sector are ambiguous because studies have shown that greater prevalence of high-tech medical centers can lead to higher health care costs for locals with-
out necessarily resulting in improved care.20
Information and Communication Technology (ICT)
As technology improves, information and communication technology has become an increasingly important part of people’s daily lives and business oper-ations in all types of industries. The information and communication technology sector, as we define it, includes the manufacture, programming, management, and repair of devices such as smart phones, personal computers, data centers, imaging devices, and more. We define ICT industries as those that tend to employ a lot of workers in ICT occupations, such as programmers, network or database administrators, high-tech installation and repair technicians, electrical engineers, and graphics designers, just to name a few.
We divide information and communication technology into three sub-sectors: a computer and math cluster, a design and engineering cluster, and an installation
and repair cluster.21 We define these sub-sectors as follows:
• The computer and math cluster includes industries that utilize expertise in computer science and programming, and data or network management.
• The design and engineering cluster includes industries that require extensive graphic design or communication-related engineering, such as printing indus-tries or electric engineering and consulting.
• The installation and repair cluster includes industries that install or repair products using information and communication technologies, such as satellites, wiring, and data centers.
20.The research literature on this issue is extensive, and there is some conflicting evidence, but some influential articles include:Elliott S. Fisher, Julie P. Bynum, and Jonathan S. Skinner, “Slowing the Growth of Health Care Costs—Lessons from Regional Variation,” New England Journal of Medicine, iss. 360 (Feb. 26, 2009), pp. 849-852.Albert A. Okunade and Vasudeva N.R. Murthy, “Technology as a ‘major driver’ of health care costs: a cointegration analysis of the Newhouse conjecture,” Journal of Health Economics, vol. 21, iss. 1 (January 2002), pp. 147-159.Burton A. Weisbrod, “The Health Care Quadrilemma: An Essay on Technological Change, Insurance, Quality of Care, and Cost Containment,” Journal of Economic Literature, vol. 29 (June 1991), pp. 523-552.
21.The industries included in information and communication technology are derived using occu-pations listed in a previous AEG report. Caroline Sallee and Erin Agemy, “The University Research Corridor’s Support for Information and Communication Technology in Michigan,” Anderson Economic Group, LLC, May 28, 2009.
Anderson Economic Group, LLC 56

Knowledge-Based Jobs and Focus on Innovation
The employment, payroll, and average wages in ICT industries for the years 2004 and 2009 are summarized in Table 29 and Table 30 below for Kentucky, its peer states, and the nation.
Kentucky’s performance in information and communication technology indus-tries is weak, across the board. Though growth in payroll suggests that jobs in these industries are becoming more lucrative in the state, employment growth
TABLE 29. Employment and Payroll in Information and Communication Technology Industries in Kentucky and Peer States, 2004 and 2009
EMPLOYMENT PAYROLL (millions)
2004%
Total 2009%
Total
Avg. Annual Growth 2004
% Total 2009
% Total
Avg. AnnualGrowth
COMPUTER AND MATH
Kentucky 27,183 1.8% 26,824 1.8% -0.3% $1,180 2.6% $1,925 3.7% 10.3%
United States 3,748,537 3.3% 4,060,781 3.5% 1.6% $254,933 6.0% $321,935 6.6% 4.8%
Peer Average 87,607 3.0% 99,611 3.4% 2.6% $5,678 5.6% $7,528 6.4% 5.8%
Memo: Kentucky’s Rank Among 13 State Peers in Share of Employment in 2004: 9th; in 2009: 10th
DESIGN AND ENGINEERING
Kentucky 49,859 3.3% 51,134 3.4% 0.5% $2,101 4.6% $2,350 4.5% 2.3%
United States 6,366,300 5.5% 6,174,226 5.4% -0.6% $362,343 8.5% $408,735 8.4% 2.4%
Peer Average 136,034 4.6% 130,788 4.4% -0.8% $6,991 6.9% $7,875 6.7% 2.4%
Memo: Kentucky’s Rank Among 13 State Peers in Share of Employment in 2004: 13th; in 2009: 13th
INSTALLATION AND REPAIR
Kentucky 45,744 3.1% 42,082 2.8% -1.7% $1,805 3.9% $2,414 4.7% 6.0%
United States 5,274,651 4.6% 5,232,738 4.6% -0.2% $295,495 6.9% $336,443 6.9% 2.6%
Peer Average 124,376 4.2% 122,411 4.2% -0.3% $6,421 6.3% $7,352 6.3% 2.7%
Memo: Kentucky’s Rank Among 13 State Peers in Share of Employment in 2004: 13th; in 2009: 13h
Source: Bureau of Labor Statistics, U.S. Census Bureau County Business PatternsAnalysis: Anderson Economic Group, LLC
TABLE 30. Average Wages in Information and Communication Technologies Industries, Kentucky and Peer States, 2009
Computer and Math
Design and Engineering
Installation and Repair
Kentucky $71,771 $45,963 $57,376
United States $79,279 $66,200 $64,296
Peer States $75,576 $60,213 $60,062
Note: Average Wage is annual payroll divided by employment.Source: U.S. Census Bureau County Business PatternsAnalysis: Anderson Economic Group, LLC
Anderson Economic Group, LLC 57

Knowledge-Based Jobs and Focus on Innovation
lags behind that of the nation and of Kentucky’s peers in the computer and math cluster, as well as in installation and repair. In addition, Kentucky’s performance in design and engineering outpaced that of peers, but was only slightly positive.
Kentucky remains considerably below average, in terms of the relative size of these industries in the state. The state remains second-to-last among peers in design and engineering, as well as installation and repair. The state’s ranking in the computer and math cluster is not much better, at tenth place out of 14 for employment share in 2009.
The average wages in ICT industries follow a similar trend as for knowledge-based industries, in general. Kentucky’s average wages are below those in peer states, which are below those in the country, as a whole. Kentucky wages are particularly low in design and engineering fields, which include graphics design for publications and Web sites and electrical engineering, among other indus-tries.
FACTORS THAT CONTRIBUTE TO KNOWLEDGE-BASED BUSINESS GROWTH
From surveys of business owners and interviews with site selection consultants, we know that businesses look at the presence of a skilled workforce, existing infrastructure, and other factors such as university resources, when making site selection decisions. We show in Table 31 specific data on the number and types of degrees awarded by Kentucky’s public universities and the research spending
by these universities make per degree awarded.22 This provides some informa-tion about the research environment and workforce that is available for knowl-edge-based firms in Kentucky.
22.We gathered data only from each state’s four-year, degree-awarding colleges and universities. Community colleges were not included.
Anderson Economic Group, LLC 58

Knowledge-Based Jobs and Focus on Innovation
Kentucky is in the top half of peer states in research spending per degree awarded and degrees awarded per 10,000 people. As discussed in “Educational Attainment” on page 35, it appears that some students who earn a higher educa-tion degree leave the state as Kentucky’s higher educational attainment is below that of its peers, while Kentucky’s public institutions award more degrees than peer states.
Kentucky is home to two Carnegie Foundation classified Very High Research (VHR) institutions: the University of Kentucky and the University of Louis-
TABLE 31. Additional Factors That Contribute to the Attraction of Knowledge-Based Businesses
State
Research Spending by Public
Universities Per Degree Awarded,
2009a
Total Degrees Awarded at Public Universities, 2009b
Degrees Awarded per 10,000 in State Population, 2009c
STEM Degrees at Public Universities
(Share of Total Degrees) 2009d
Kentucky $16,643 23,196 53.43 12.7%
Alabama $17,347 31,949 67.36 13.3%
Arkansas $13,983 16,190 55.65 10.8%
Georgia $18,553 46,016 45.93 16.6%
Illinois $15,177 48,880 37.62 16.5%
Indiana $10,885 41,350 63.97 14.4%
Missouri $8,703 27,628 45.98 16.2%
North Carolina $16,722 43,693 45.93 17.0%
Ohio $12,356 61,380 53.16 14.4%
South Carolina $19,191 20,364 44.14 15.1%
Tennessee $10,674 26,311 41.41 12.0%
Texas $18,282 118,670 47.02 15.9%
Virginia $16,541 45,644 57.26 15.7%
West Virginia $12,066 12,641 69.42 12.8%
Peer Average $14,652 41,594 51.91 14.7%
Source: Integrated Postsecondary Educational Data System; American Community SurveyAnalysis: Anderson Economic Group, LLC
a. Research spending per degree awarded is calculated by taking the total amount spent on research at each state’s public universities divided by the total number of degrees awarded to students at those universities during the 2008-2009 aca-demic year.
b. Total degrees awarded is the total number of associate's, bachelor’s, master’s, professional, and doctoral degrees awarded at each state’s public universities.
c. Degrees per 10,000 in state population is the total number of degrees awarded at each state’s public universities per 10,000 people in that state. Showing the metric of degrees awarded by 10,000 in state population gives a better frame of reference for comparison than the total degrees awarded metric.
d. STEM stands for science, technology, engineering, and mathematics.
Anderson Economic Group, LLC 59

Knowledge-Based Jobs and Focus on Innovation
ville.23 Other very high research institutions include MIT, the University of Michigan, and the University of North Carolina at Chapel Hill. Both institu-tions’ research expenditures are at the peer average for public VHR universities in the United States. Both universities engage in research and development of technology that is often transferred to the private sector. The University of Lou-isville’s technology transfer office focuses much of its efforts on biomedical
research and medical technologies.24 The University of Kentucky focuses much
of its technology transfer and research efforts on transportation.25 Kentucky has developed an automotive cluster, attracting both original equipment manufac-turing and suppliers to the state.
Kentucky awards fewer degrees in the fields of science, technology, engineer-ing, and mathematics than its peers. These are degrees that businesses in high-
tech and knowledge-based industries look for when hiring.26
KENTUCKY INCENTIVES THAT TARGET HIGH-TECH AND KNOWLEDGE-BASED BUSINESSES
Kentucky created the Office of Commercialization and Innovation (OCI) in 2000. The office is responsible for leading the CED’s efforts in nurturing a knowledge-based economy throughout the state. The main responsibilities of
OCI, taken from the “Think Kentucky” website,27 are:
• Manage the Kentucky Innovation and Commercialization Center Program.
• Monitor the return on investments and effectiveness of the Kentucky Innovation Act.
• Build infrastructure for the New Economy to promote networks of technology-driven clusters and research-intensive industries.
• Support the growth and creation of R&D and high-tech companies in the areas of human and health, information technology and communications, biosciences, energy and environmental technologies, and material sciences and advanced manufacturing.
OCI High-Tech Investment and Construction Pools. We were tasked with studying the High-Tech Investment and Construction Pools program. These pools work in the following way: firms are typically awarded between $100,000 and $250,000 in forgivable loans. The funds are to be used to purchase special-
23.The University of Kentucky and the University of Louisville are classified as “Very High Research” universities by the Carnegie Foundation.
24.University of Louisville Technology Transfer Website
25.University of Kentucky Technology Transfer Website
26.The National Association of Colleges and Employers’ Job Outlook 2011 Report surveyed 200 employers from a variety of sectors. This survey lists business, computer science, and engi-neering degrees as those in the highest demand by employers.
27.See State of Kentucky, “Technology and Innovation Overview,” available at www.thinkken-tucky.com/dci.
Anderson Economic Group, LLC 60

Knowledge-Based Jobs and Focus on Innovation
ized equipment, IP protection, and other uses that the OCI determines. The firms have three years to create at least seven jobs paying a minimum of $40,000 per year, and then maintain those jobs for another three years. If a firm meets these criteria then the firm’s loan is forgiven. It the firm does not meet the criteria, then the loan must be repaid to the OCI.
Other Incentives Offered Through OCI. The OCI supports other incentives that focus on high-tech or knowledge-industries. These incentives include:
• Commonwealth Seed Capital: Start-up funding through OCI in the form of debt or equity investments for early-stage companies in Kentucky;
• Matching funds for Federal Small Business Innovation Research and Small Business Technology Transfer awards. These generally include awards up to $100,000 and $500,000 for each program respectively; and
• Research Facilities State Income Tax Credit: This credit is an income tax credit equal to 5% of qualified costs for constructing research facilities and for “quali-fied research” as defined in Federal IRS code. Unused credits may be carried forward 10 years. This credit is available to new and existing Kentucky busi-nesses to construct, remodel, expand, or equip research facilities.
Recent Activities of OCI. The OCI has had the following activities:28
• Investing almost $20 million in start-up firms through Commonwealth Seed Capital;
• Providing over $3 million in state venture funds managed through a private ven-ture firm and awarded to Kentucky companies;
• Operating the state’s six regional Innovation and Commercialization Centers, and seven affiliate centers to aid entrepreneurs with start-ups and investments throughout Kentucky;
• Holding the fourth annual statewide business plan competition called “Idea State U” in which 20 teams from Kentucky’s state universities compete for $100,000 in prizes for business plans and start-up ideas; and
• Providing $26.8 million in matching grant funds (112 programs) to companies that received Phase 1 or Phase 2 Federal Small Business Innovation Research and Small Business Technology Transfer awards.
PEER STATE INCENTIVE COMPARISON
We completed two extensive reviews of the types of incentives offered to Ken-tucky’s high-tech and knowledge-based firms:
1. We reviewed incentives available to these industries. These include broad incentive programs that are available to high-tech and knowledge-based firms, but also other industries. We carefully describe these incentives in Kentucky and peer states in the Table 33 on page 64.
28.Kentucky Cabinet for Economic Development, Office of Commercialization and Innovation, Performance Report for July 1, 2010-June 30, 2011, accessed at www.thinkkentucky.com.
Anderson Economic Group, LLC 61

Knowledge-Based Jobs and Focus on Innovation
2. We reviewed the specific incentives targeted to high-tech and knowledge-based firms. These are incentives that are only for these types of industries. See Table 34 on page 72.
Incentives Available to High-Tech and Knowledge-Based Firms
A high-tech or knowledge-based firm seeking incentives in Kentucky could be eligible for up to 14 different incentive programs. These range from job training tax credits and grants to low interest loans to a menu of tax credits for invest-ments in fixed assets, infrastructure, and equipment.
Among firms receiving incentives, we were able to match just over a quarter with their respective industry, using the Bureau of Labor Statistics Quarterly
Census on Employment and Wages (QCEW).29 Of the firms we matched, 29% are in industries that we categorized as knowledge-based industries, as defined in “Definition of Knowledge-Based Industries” on page 48. Table 32 below shows the most common high-tech industries that received incentives, in terms of the percent of total incentives going to firms in that industry.
29.Due to confidentiality concerns, Kentucky could not provide AEG with the BLS data directly, so AEG provided code to the Legislative Research Commission to run on the data. The LRC then provided the outputs of the programs to AEG to analyze.
TABLE 32. Percent of Incentives Going to High-Tech Industries, Top 10
Industry% of Total Incentives
1. Other general purpose manufacturing (pumps, compressors, eleva-tors, escalators, conveyors, hand tools, packaging machinery, industrial furnaces and ovens)
2.4%
2. Other food manufacturing (snack foods, coffees, teas, syrup, season-ing, dressing, condiments, spices)
1.7%
3. Computer systems design and related services 1.7%
4. Beverage manufacturing 1.4%
5. Resin, synthetic rubber, and artificial synthetic fibers and filaments manufacturing
1.4%
6. Other fabricated metal product manufacturing (valves, hoses, fittings, pipes, patterns, small arms ammunition)
1.1%
7. Semiconductor and other electronic component manufacturing 1.0%
8. Scientific research and development services 1.0%
9. Basic chemical manufacturing 0.9%
10. Other chemical product and preparation manufacturing 0.8%
Source: Kentucky Cabinet for Economic Development; Quarterly Census on Employ-ment and WagesAnalysis: Anderson Economic Group, LLC
Anderson Economic Group, LLC 62

Knowledge-Based Jobs and Focus on Innovation
Kentucky’s peers offer a wide variety of incentives to knowledge-based firms. Most states make available tax credits, grants, loans, and bonds to knowledge-based industries. Kentucky’s offerings are consistent with what is offered by its peers, as shown in Table 33 on page 64.
For some states, the sheer number of incentive programs make it so that a greater number of incentive programs are available to high-tech and knowledge-based firms than in Kentucky. This does not necessarily mean the programs are successful, or that they provide more money in practice to these firms. States publicize the types of incentives offered, but not the confidential information of how much they provide in dollars and tax credits to these firms. Offering a large number of incentives can have ambiguous signaling effects. On one hand, a state might be doing well economically and still offering a large number of incentives. On the other hand, a state may be offering dozens of generous incen-tives because they are not performing well economically and are trying to draw as much business as possible. As explained in the previous two chapters, the overall business environment is very important to businesses as they make loca-tion decisions. Kentucky has a competitive business environment overall.
Arkansas and West Virginia are examples of states that offer many incentives, but are not performing well economically. They offer many generous incentive programs to many kinds of businesses, including high-tech and knowledge-based firms. However, they are not performing well economically and they do not have a skilled workforce. Businesses seek places where they think they will thrive. An incentive program might affect a company’s decision at the margin, but it will not make an undesirable location instantly desirable.
We found a few differences in the types of incentives available to high-tech and knowledge-based firms in other peer states. We found that peer states had a greater number of incentives that target women and minority businesses and development in rural areas than Kentucky. We found that some states provided more generous grants for infrastructure development, including Tennessee’s Economic Development Grants, that provide up to $750,000 for infrastructure; Missouri’s grants of up to $2 million for industrial infrastructure in economi-cally distressed areas; and Georgia’s Redevelopment Fund that provides up to $500,000 for redevelopment in land and other infrastructure. These are incen-tives that are available to high-tech and knowledge-based industries, as well as other industries.
Anderson Economic Group, LLC 63

State Tax Credits and Rebates Grants Loans Bonds Other Incentives**
Ken
tuck
y*
IEIA: Income tax credits up to 100% of income tax liability, sales and BSSC Grants: Up to $50,000 in KEDFA Loans: Loans at rate below 5% IRB: Bonds issued at local level with ultiple locals are e projects may qualify
t bond issues. State will roperty taxes for firms ded IRBs.
TIF: State forgoes increased revenues from tax collections in investment area. Developer issues a bond or loan that is repaid through tax increment increases in income tax, sales and use taxes, and property taxes.
Ala
bam
a
Inventory Tax: No inventory tax.Income Tax Operating Loss: 15 year carry-forward and deduction for net operating losses.Tax Exemptions: Exemption from all sales and use taxes, non-educational property taxes, and mortgage and recording taxes.Pollution Control Equipment Tax Deduction: Firms may deduct the among of funds investment for controlling, reducing, or eliminating pollution from their income for tax purposes.
TABLE 33. Comparison of Incentives Available to High-Tech and Knowledge-Based Firms in Kentucky and Peer States
Anderson 64
use tax refund up to 100% of personal property and 80% coal and natural severance taxes, and wage assessments up to 4% of gross wages for each employee for new investment.KBI: Income tax credits up to 100% of income tax liability and wage assessments up to 5% of gross wages for new employees.KRA: Income tax credits up to 100% of income tax liability if company invests at least $2.5 million and maintains 85% full employment.KESA: Income tax credits up to 100% of income tax liability for fixed asset investment and employee skills training.KSBIC: Income tax credits up to $3,500 per new job or $25,000 per company with 50 or fewer employees for companies that invest at least $5,000 in equipment.KEIA: Refund of sales and use taxes for purchase of building and construction materials, R&D equipment, and electronic processing equipment.KIRA: Income tax credits worth up to 75% of costs of rehabilitation or up to 5% wage assessments for manufacturing and agribusiness firms at risk of closing.BSSC Credits: Income tax credits worth up to $500 per employee or $10,000 per company for employee training.
employee training costs reimbursed through grant funds.
for up to $500,000. OCI: Loans generally up to $250,000, forgivable if company creates seven jobs with wage at $40,000 per year. Small Business Loans: Loans up to $100,000 for firms with 50 or fewer employees and must create one new job.
state help if minvolved. Somfor tax exempalso reduce pthat are awar
Enterprise Zone Program: Income tax credits up to $2,500 per new employee for businesses locating in certain zones.Capital: Income tax credit worth 5% of capital costs for new and expanding businesses.Education: Income tax credits worth up to 20% of employer sponsored employee education program to help employees reach 12th grade proficiency level.
Industrial Development Grant: Grants up to $150,000 for projects investment $25 million or more for site preparation.Industrial Development Training: Free employee training at the Alabama Industrial Development Training Institute for new and expanding Alabama businesses.
Economic Group, LLC

State Tax Credits and Rebates Grants Loans Bonds Other Incentives**
Ark
ansa
s
Advantage Arkansas: Income tax credits up to 4% of total payroll or Business and Industry Training: Arkansas Capital Corporation: Long- IRB: Up to $10 million in bonds state on behalf of me may be issued as tax
ntee: State guarantees up in bonds to help firm r credit rating.
TIF: State bonds issued to finance development of blighted, deteriorated, or underdeveloped areas.Seed Capital Fund: Start-up funds up to $500,000 to be repaid through royalties.Venture Capital Fund: State venture fund for Arkansas businesses.Technology Development Program: State will invest $100,000 with maximum of 5% of sales for up to 10 yrs. given back to the state.
Geo
rgia
tion: State issued elopment bonds on behalf 125,000 in financing for ted.
Foreign Trade Zones (FTZ): Companies operating in an FTZ they are exempt from paying duties on imported goods for manufacturing and assembly.Sales Tax Exemption: Firms employing 500 or more Georgia residents are exempt from all sales and use taxes.
TABLE 33. Comparison of Incentives Available to High-Tech and Knowledge-Based Firms in Kentucky and Peer States (continued)
Anderson 65
50% of total income tax liability.InvestARK: Sales and use tax credits for spending at least $5 million for new, modernizing, or expanding plant and equipment.ArkPlus: Income tax credits up to 10% of investment in new or expanding project.Targeted Business Incentives: Refund of sales and use taxes paid for materials and machinery and income tax credits up to 10% of payroll.R&D: Income tax credits worth up to 33% of R&D expenditures or a maximum of $50,0000 per year.Child Care Facility or Early Childhood Program: Any firm that builds a child care facility or early childhood educational program for its employees is eligible for a one time $5,000 income tax credit or an annual credit worth 3.9% of payroll for child-care employees.Recycling Equipment: Income tax credit worth 30% of equipment and installation costs.Water Conservation: Income tax credit worth 50% of the project costs for construction, installation, or restoration of impoundments to help reduce state's dependence on ground water.Apprenticeship: Firm with trains a youth apprentice from a registered program is eligible for a credit in the amount of the lesser of $2,000 credit or 10% of the wage paid to the apprentice.Tax Back: Sales and use tax refunds for building materials and equipment during expansion or building project.Create Rebate: Up to 5% of annual payroll of new employees rebated from the state.
Recruiting, pre-employment training, and on-the-job training for new and expanding businesses, some costs are covered by the state.Existing Workforce Training: State will cover up to 50% of the costs of retraining existing employees.Technology Transfer Grant: State will fund $3,750 of costs associated with transferring technology to an Alabama company.
term, fixed-rate loans.Capital Access Program: Loan funds for firms that do not qualify for conventional bank loans.Disadvantaged Business Enterprise: Working capital loan assistance for businesses owned by ethnic minorities and women.Intermediary Lending: Loans up to $150,000 for businesses in rural communities with under 25,000 people.Speculative Building Loans: Up to $1 million at below market interest rates for building fixed industrial structures.
issued by thebusinesses, soexempt.Bond Guarato $5 millionobtain a bette
Child Care: Income tax credit worth 75%-100% of costs to build child care facility for employee use.Quality Jobs: Firms that create at least 50 jobs may receive tax credits up to $5,000 per job. Investment: Income tax credits worth 1%-8% of total capital investment of $50,000 or more.Job Creation: Up to $3,500 per job created in income tax credits.Optional Investment: Income tax credits worth 6%-10% of total capital investment of $5 million-$20 million.R&D: Income tax credit worth 10% of R&D spending over base as defined by the IRS.Retraining Credit: Income tax credits worth up to $500 per existing employee retrained on new technologies.Adult Basic Skills Education: Income tax credit worth a third of the costs of education per roll-time equivalent student employee enrolled in an adult basic skills program.Ports Activity: Income tax credits worth $1,250 per job created and up to 10% of capital investment if the company has at least 75 net tons or five containers of Georgia ports traffic annually.
Redevelopment Fund: Up to $500,000 for redevelopment in land, fixed assets, and other infrastructure.
Local Revolving Loans: Loans for companies that employee low and moderate-income residents. Downtown Development: Below market interest rates for loans up to $250,000 for businesses within areas with a population of 100,000 or less.Business Development: Loans up to $200,000 or 50% of project cost for business expansion and building fixed, useful assets.
Bond Allocaindustrial devof business $each job crea
Economic Group, LLC

State Tax Credits and Rebates Grants Loans Bonds Other Incentives**
TABLE 33. Comparison of Incentives Available to High-Tech and Knowledge-Based Firms in Kentucky and Peer States (continued)Il
linoi
s
Sales Tax: Sales tax credit for the purchase of manufacturing Renewable Fuels Research, Access to Capital Program: $25
Indi
ana
ial revenue bonds issued t lower than market rates, issued as tax exempt.
Venture Capital Investment: Income tax credits for investing in a qualified Indiana business.
Anderson 66
machinery and equipment.Welfare-to-Work: Up to $10,000 in income tax credits for hiring recent "welfare" recipients.Renewable Energy Resources: Rebate of $50,000 for research and development of renewable energy sources.
Development, and Demonstration: Grants to accelerate the commercialization of Illinois biofuels research.Coal Development: Grants between $250,000-$600,000 for advanced coal technologies.Coal Research: Grants between $60,000-$250,000 for coal research issued by state university research programs.Job Training: Grant funding for job training partnerships between small businesses and community education providers to help educate and train low-income and homeless residents.Recycling Industry: Grants up to $250,000 for modernizing recycling facilities.Large Business Development: Grants for large businesses for site development and construction. Amount is negotiated based on projected hiring.
million in low cost liquidity provided to banks to allow them to lend to local businesses.Minority, Women, and Disability Participation: Loan guarantee up to $100,000 for business owned by minorities, women, or disabled persons.
Hoosier Business Investment: Income tax credits worth 10% of new capital investment.EDGE: Wage assessments on wages paid to new employees.Enterprise Zones: Wage assessments, loan interest credits, and income tax credits for businesses locating in the zones.
Industrial Development: Grants up to 50% of total costs for construction fixed assets and infrastructure.Skills Enhancement Fund: Grants to refund 50% of the costs of employee training. Technology Enhancement: Job training cost reimbursement through a grant worth up to $2,500 per employee or a maximum of $50,000.Indiana 21st Century Fund: Grant up to $2 million for commercializing advanced technologies.
IRB: Industrby the state asome may be
Economic Group, LLC
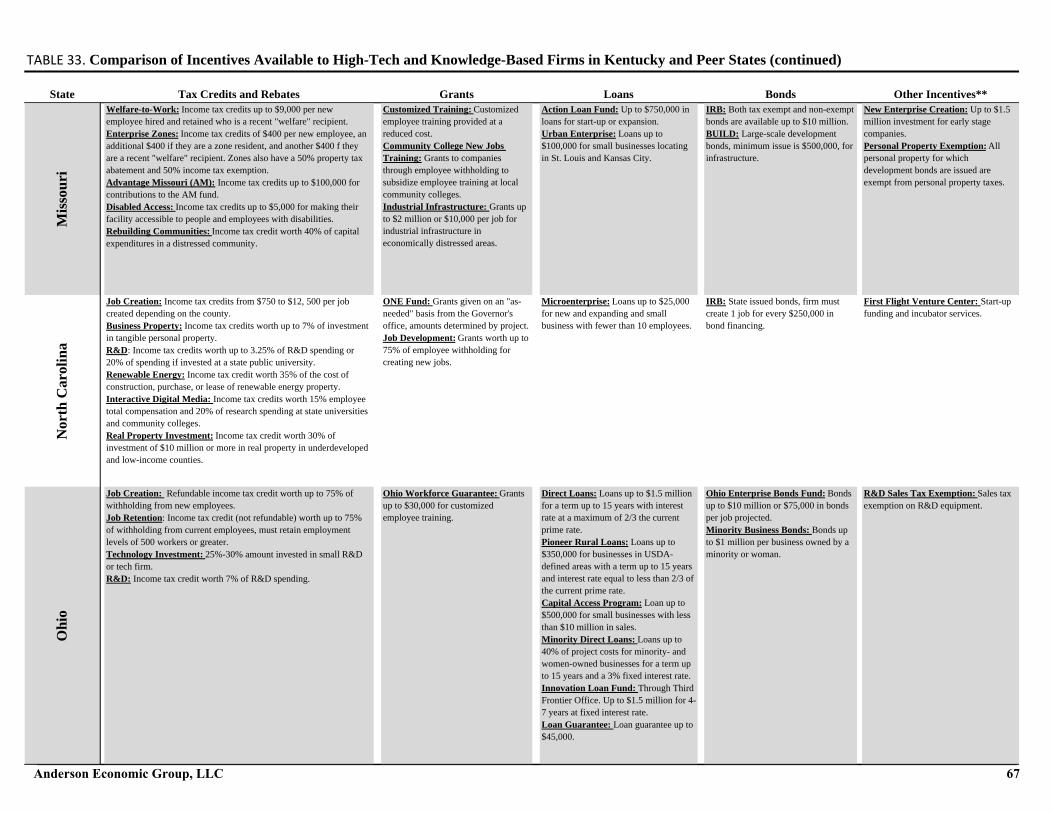
State Tax Credits and Rebates Grants Loans Bonds Other Incentives**
TABLE 33. Comparison of Incentives Available to High-Tech and Knowledge-Based Firms in Kentucky and Peer States (continued)M
isso
uri
Welfare-to-Work: Income tax credits up to $9,000 per new Customized Training: Customized Action Loan Fund: Up to $750,000 in IRB: Both tax exempt and non-exempt ilable up to $10 million.
ge-scale development um issue is $500,000, for .
New Enterprise Creation: Up to $1.5 million investment for early stage companies.Personal Property Exemption: All personal property for which development bonds are issued are exempt from personal property taxes.
Nor
th C
arol
ina
sued bonds, firm must or every $250,000 in g.
First Flight Venture Center: Start-up funding and incubator services.
Ohi
o
rise Bonds Fund: Bonds lion or $75,000 in bonds ted.siness Bonds: Bonds up per business owned by a oman.
R&D Sales Tax Exemption: Sales tax exemption on R&D equipment.
Anderson 67
employee hired and retained who is a recent "welfare" recipient.Enterprise Zones: Income tax credits of $400 per new employee, an additional $400 if they are a zone resident, and another $400 f they are a recent "welfare" recipient. Zones also have a 50% property tax abatement and 50% income tax exemption.Advantage Missouri (AM): Income tax credits up to $100,000 for contributions to the AM fund.Disabled Access: Income tax credits up to $5,000 for making their facility accessible to people and employees with disabilities.Rebuilding Communities: Income tax credit worth 40% of capital expenditures in a distressed community.
employee training provided at a reduced cost.Community College New Jobs Training: Grants to companies through employee withholding to subsidize employee training at local community colleges.Industrial Infrastructure: Grants up to $2 million or $10,000 per job for industrial infrastructure in economically distressed areas.
loans for start-up or expansion.Urban Enterprise: Loans up to $100,000 for small businesses locating in St. Louis and Kansas City.
bonds are avaBUILD: Larbonds, miniminfrastructure
Job Creation: Income tax credits from $750 to $12, 500 per job created depending on the county.Business Property: Income tax credits worth up to 7% of investment in tangible personal property.R&D: Income tax credits worth up to 3.25% of R&D spending or 20% of spending if invested at a state public university.Renewable Energy: Income tax credit worth 35% of the cost of construction, purchase, or lease of renewable energy property. Interactive Digital Media: Income tax credits worth 15% employee total compensation and 20% of research spending at state universities and community colleges.Real Property Investment: Income tax credit worth 30% of investment of $10 million or more in real property in underdeveloped and low-income counties.
ONE Fund: Grants given on an "as-needed" basis from the Governor's office, amounts determined by project.Job Development: Grants worth up to 75% of employee withholding for creating new jobs.
Microenterprise: Loans up to $25,000 for new and expanding and small business with fewer than 10 employees.
IRB: State iscreate 1 job fbond financin
Job Creation: Refundable income tax credit worth up to 75% of withholding from new employees.Job Retention: Income tax credit (not refundable) worth up to 75% of withholding from current employees, must retain employment levels of 500 workers or greater.Technology Investment: 25%-30% amount invested in small R&D or tech firm.R&D: Income tax credit worth 7% of R&D spending.
Ohio Workforce Guarantee: Grants up to $30,000 for customized employee training.
Direct Loans: Loans up to $1.5 million for a term up to 15 years with interest rate at a maximum of 2/3 the current prime rate.Pioneer Rural Loans: Loans up to $350,000 for businesses in USDA-defined areas with a term up to 15 years and interest rate equal to less than 2/3 of the current prime rate.Capital Access Program: Loan up to $500,000 for small businesses with less than $10 million in sales.Minority Direct Loans: Loans up to 40% of project costs for minority- and women-owned businesses for a term up to 15 years and a 3% fixed interest rate.Innovation Loan Fund: Through Third Frontier Office. Up to $1.5 million for 4-7 years at fixed interest rate.Loan Guarantee: Loan guarantee up to $45,000.
Ohio Enterpup to $10 milper job projecMinority Buto $1 millionminority or w
Economic Group, LLC

State Tax Credits and Rebates Grants Loans Bonds Other Incentives**
TABLE 33. Comparison of Incentives Available to High-Tech and Knowledge-Based Firms in Kentucky and Peer States (continued)So
uth
Car
olin
a
Jobs: Up to $8,000 in income tax credits per job created and South Carolina Accelerated JEDA Bond Program: Bonds issue by ehalf of a firm for a $10 million.
Economic Development Alternative Apportionment: Apportioning income for multi-state companies to lower tax burden in South Carolina.Fee in Lieu of Taxes: Five programs that allow a company to pay a fee in lieu of non-school property taxes.Property Tax Exemptions: Machinery and equipment are exempt from property taxes for 5 years. R&D Exemptions: R&D property tax exemption for 5 years (all non-school) and all sales taxes. Corporate Exemptions: Exemption from non-school property taxes for headquarters and corporate facilities.
Ten
ness
ee
up to $90 per capita in a for infrastructure s.
Electricity Tax Reduction: 1.5% reduced sales tax on electricity.Wind Energy Systems: Up to 66% of property taxes exempt if using wind energy.Pollution Control: Taxed at salvage value for property tax purposes.
Anderson 68
maintained.Job Development: Refundable income tax credit worth up to 5% of employee gross wages. Retaining Job Development: Refundable income tax credit up to $2,000 per employee for retraining existing employees for new technology. Economic Impact Zone: Income tax credit worth up to 5% of investment in equipment in a specific zone.Headquarters: Income tax credits for establishing a headquarters or corporate office facility and hiring at least 40 new full-time employees.Infrastructure Construction: Income tax credit up to 50% of expenditures for construction public infrastructure.Hiring Family Independence Recipient: Income tax credit worth 15% of gross wages paid to new employees who are recent "welfare" recipients.Child Care Program: Income tax credits up to 50% of costs of establishing an employee child care program. Also included is an annual credit up to $3,000 for each participating employee.Recycling Facility: Income tax credits worth 30% of construction a recycling facility or investing in current facility.Minority Business: Income tax credits worth up to $50,000 for employing a minority business as a contractor or subcontractor.
Technology Training Program: Pre and post-training available at little or no cost through state Technical College System.
the state on bproject up to
Jobs: $4,500 per new employee in income tax credits for a t least 25 newly created and maintained jobs. Super Jobs: Income tax credits worth up to 100% income tax liability for creating 500 or more jobs.Integrated Supplier: Income tax credits up to $10,000 per new job for integrated supplier/consumer creating 500 or more jobs.Industrial Machinery: Up to $100,000,000 in income tax credits for investing in industrial machinery. Credit amount is linked to investment.Emerging Industry: Sales and use tax credit equal to all but 0.5% of the state sales tax rate. Company must hire 50 employees.Rural Jobs: Franchise and excise tax credits up to $4,500 per new employee at firms who locate in specific areas.Green Energy: Income tax credits for green energy supply chain.
Green Island Corridor: Grants up to $45,000 per pump to install biofuel pumps at gas stations along Tennessee's highways and major roads.Fast-track Infrastructure: Grants up to $75,000 for developing public infrastructure.Fast-track Job Training: Grants to reimburse business for training employees.Tennessee Job Skills: Reimbursement through grants for high wage, high skill technology focused job training.Job Based Training: Reimbursement for pre-employment training.Economic Development Grants: Grants up to $750,000 for fixed assets and infrastructure.
Small Business Energy Loan: Low cost loans up to $300,000 for small business to upgrade energy efficiency in their buildings.Rural Microloan: Loans up to $10,000 for businesses in USDA-defined rural area.Rural Entrepreneurship: Loans up to $10,000 at a fixed rate as low as 1% for small business owners and entrepreneurs in USDA-defined rural areas.
IRB: Bonds given localityimprovement
Economic Group, LLC

State Tax Credits and Rebates Grants Loans Bonds Other Incentives**
TABLE 33. Comparison of Incentives Available to High-Tech and Knowledge-Based Firms in Kentucky and Peer States (continued)T
exas
Enterprise Zone: Refund of sales and use taxes up to $7,500 per job Texas Capital Fund: Up to $750,000 Texas Leverage Fund: Long-term low IRB: Tax exempt bonds at low cost for nd and fixed assets.
Reinvestment Zone: Property tax abatements on specific zones.Sales and Use Exemptions: Machinery and electricity equipment are exempt from sales and use taxes.
Vir
gini
aW
est V
irgi
nia
empt bonds for small g, projects in specified , and special facilities.
TIF: Property tax based TIF.West Virginia Venture Capital: Venture fund run but the state that have provided $25 million in funds thus far.High-Tech Property: Personal property is valued at 5% original cost for tax valuation purposes.Electric power rates: Special electricity rates for hiring 25 people and investing $500,000.Sales Tax Exemption: Sales tax exemption for R&D equipment and manufacturing equipment.Wind Energy: Low property tax rates on wind energy property.5 for 10: Equipment valued at 5% of original cost for property tax purposes for 10 years.
* Additional de** Other IncentSource: KentucAnalysis: Ander
Anderson 69
created in a zone.Economic Development Tax Refund: Refunds of all non-school property taxes if firm has payroll of at least $3 million and property worth at least $4 million.
in grants for infrastructure, main street development, and real estate acquisition.Skills Development: Grants up to $50,000 for training at state community and technical colleges and engineering services.
cost loans up to $3 million. purchasing la
Major Business Facility Tax: Income tax credits up to $1,000 per new job created and maintained.Recycling Processing Equipment: Income tax credit for purchasing recycling equipment and materials.
Governor's Opportunity Fund: Funds at the Governor's discretion for economic development projects and businesses.Economic Development Access and Rail Access Programs: Grants up to $500,000 for roads and $450,000 for rail lines to aid firms in building access to their facilities.Solar Manufacturing: Grants of 75 cents per watt of solar panels manufactured.Investment Partnership Grants: Discretionary grants to help firms modernize their facilities. Enterprise Zones: Grants for hiring zone residents $800 per person per year and $200,000 for real property investment.
Enterprise Initiative: Microloans for disadvantaged entrepreneurs.Tobacco Commission: Loans up to $250,000 for small businesses.Economic Development Loan Fund: Loans up to $1 million for acquiring land and equipment.Revolving Loan Fund: Low interest loans up to $10,000 per job created. Small Business Environmental Compliance: Small business loans to assist with compliance with clean energy and air requirements.Export Financing: Loan guarantees to help Virginia companies obtain working capital to expand overseas markets.
Economic Opportunity: Offset 80% of business taxes if hiring 20 people.Manufacturing Investment and Inventory: 60% credit on income taxes for purchase of equipment and net worth of inventory.Strategic R&D: Income tax credit worth 100% of a company's income tax liability for all R&D expenditures. High-Tech Manufacturing: Offset 100% of business income taxes, occupation taxes, and franchise taxes for up to 20 years if they create and maintain at least 20 jobs.
Governor's Guaranteed Work Force: Full funded employee training for firms that hire at and maintain at least 10 new employees.Workforce Investment: Customized training for firms that hire disadvantaged workers.West Virginia Advance: Tailored job training for start-up firms through the state community and technical college system.Commercialization: Grants to small businesses up to $5,000 to offset commercialization costs.
Direct Loans: Low interest loans with up to 15 year term.Indirect Loans: 80% loan guarantee on private bank loan.Infrastructure and Jobs Development: Loans specifically for infrastructure improvements.Loan Insurance: Loan guarantee up to $500,000.
IRB: Tax exmanufacturincommunities
tails on Kentucky's incentives can be found in Appendix A. This table is meant to give a brief overview of the incentives for basic comparison purposes.ives includes investment programs, tax deductions, and tax exemptions.ky Cabinet for Economic Development; C2ER.org; State economic development websitesson Economic Group, LLC
Economic Group, LLC

Knowledge-Based Jobs and Focus on Innovation
Incentives Targeted Specifically Towards Knowledge-Based Firms
While all peer states have incentives that are available to high-tech and knowl-edge-based firms, some states provide more specialized incentives for knowl-edge-based firms. Three of Kentucky’s peer states have offices similar to Kentucky’s OCI: North Carolina, Ohio, and Tennessee. Eleven of the 14 states provide at least one specific incentive for knowledge-based or high-tech firms.
Table 34 on page 72 describes the incentives each state offers that target high-tech and knowledge-based firms. Kentucky is in the top half of the peer states in the number of programs specifically for firms in these industries. Two of the peer states (Illinois and Missouri) do not provide any specific incentive for these industries, while three others only provide one or two incentives.
OCI programs specifically target high-tech and knowledge-based industries in Kentucky. We find that 72% of the companies receiving loans from the OCI High-tech Pools were in knowledge-based industries, as we have defined them in this chapter. The most common industry targeted by OCI High-Tech Pools from 2004 to 2010 was scientific research and development services, followed by scientific and technical consulting services, computer systems design, and medical and diagnostic laboratories. The fields that received OCI incentives that were not part of our definition of knowledge-based industries were sparsely rep-resented. They included wholesale electronics merchants, offices of physicians, drug merchant wholesalers, glass product manufacturing, and animal food man-ufacturing, among others.
As reported in “Job Creation at Firms Receiving Incentives” on page 80, there were 25 firms receiving incentives from OCI High-Tech Pools that reported jobs numbers to the CED from the year 2001 to 2010. At these firms, a com-bined 230 jobs were created in the first year that they reported. We find, how-ever, in “Evaluating the Effectiveness of Key Incentives in Creating Jobs” on page 97, that there is reason to believe that these forgivable loans may not be a more efficient use of state funds than an alternative policy of broad-based tax relief. Note that this program is different than other incentives offered to knowl-edge-based industries, so there is no reason to believe that other programs are similarly ineffective.
Kentucky is one of seven states that provides a tax credit or tax exemption for expenditures on research and development equipment. Like many of its peers, Kentucky offers grant funding. Kentucky provides grant funding in smart way, providing matching funds to businesses who receive a federal Small Business Innovation (SBIR) award. The SBIR process is competitive, and Kentucky pro-vides funds to firms who have been vetted through this process. Kentucky is also one of four states that have specific loans available to these firms.
Anderson Economic Group, LLC 70

Knowledge-Based Jobs and Focus on Innovation
Unique programs in other states include:
• Virginia’s economic development access program that provides up to $500,000 to help build access roads and rail lines to research and development facilities and other high-tech facilities.
• Arkansas’s technology transfer assistance in the form of $3,750 to help offset costs incurred by firms in the licensing or development of other agreements around technology.
• Arkansas’s royalty financing where the state invests up to a maximum of $100,000 in a business, and in exchange for this investment receives a certain percentage of net sales for a maximum term of 10 years.
• North Carolina’s First Flight Venture Center that provides incubator services in addition to start-up funding for high-tech and knowledge-based firms.
• West Virginia provides preferential property tax rates for manufacturing and high-tech business facilities; exempts property taxes for warehousing and distri-bution centers; and exempts e-commerce businesses from sales tax.
After Table 34 on page 72, we provide short summaries of the credits states use to specifically target high-tech and knowledge-based firms. We exclude states from our summaries that only offer minimal incentives.
Anderson Economic Group, LLC 71

State Research and Development Activities Tax Credits Grant Funding Loans Tax Exemptions and Rate
Reductions Other Incentives
Ke alth Seed rt-up funds for companies.
Al
Ar ncing: State will 000 with 5% of sales for given back to
Ge
IllIn Enhancement
Reimbursementmployee trained 0.
M
NoCa
enture Center: ding and
rvices.
TABLE 34. Comparison of Incentives Targeted Exclusively to High-Tech and Knowledge-Based Firms in Kentucky and Peer States
An 72
ntucky Income tax credit equal to 5% of the qualified cost for construction of research facilities and qualified research.
Matching grant funds up to $500,000 for Federal Small Business Innovation Research and Technology Transfer awards.
Forgivable loan generally between $100,000 and $250,000 for high-tech and knowledge-based firms if they create at least seven jobs.
CommonweCapital: staearly stage
abama $150,000 in grant funding for site prep for projects with at least $25 million in capital costs.
High-Tech firms are exempt from sales and use taxes, non-educational local sales and use taxes and property taxes.
kansas Income tax credit worth 33% on R&D expenditures or a maximum of $50,0000 per year.
Tech transfer assistance grant, will fund $3,750 of costs associated with transferring technology to an Alabama company.
Long term loan up to $3 million.
Royalty finainvest $100,maximum ofup to 10 yrs.the state.
orgia Income tax credit worth 10% of R&D spending over base as defined by the IRS.
$1,250-$3,500 in credits per job for up to 5 years for companies that create at least 5 jobs.
inoisdiana Grants up to $5 million for
Research and Technology firms with new technologies.
Technology Job Training$2,500 per eup to $50,00
issouri
rth rolina
Credit equal up to 3.25% of expenditures or 20% if funds are spent for R&D at North Carolina's public universities.
Interactive Digital Media Credit: 20% of R&D paid to universities and 15% of wages paid to employees.
One North Carolina Fund: State and local entity partner each provide 50% of funds, total amount based on Governor's discretion and local participation.
First Flight VStart-Up FunIncubator se
derson Economic Group, LLC

State Research and Development Activities Tax Credits Grant Funding Loans Tax Exemptions and Rate
Reductions Other Incentives
Oh
SoCa
Te
Te
Vi artnership and
ng facilities that d at least $25 operated in VA r longer. Grants d on job
investment.
W
SouAna
Not centives that are ava
TABLE 34. Comparison of Incentives Targeted Exclusively to High-Tech and Knowledge-Based Firms in Kentucky and Peer States (continued)
An 73
io Two programs, sales tax exemption on R&D equipment, and income tax credit worth 7% of R&D spending.
Technology Investment Credit: 25%-30% amount invested in small R&D or tech firm.
Training grants: Reimbursement of up to $30,000 based on expenses for customized training.
Innovation Loan Fund through Third Frontier Office: Up to $1.5 million for 4-7 years at fixed interest rate.
uth rolina
R&D property tax exemption for 5 years (all non-school) and all sales taxes.
Retraining Credit: Refundable income tax credit up to $2,000 per employee for retraining existing employees for new technology.
Accelerated Technology Training Grants: pre and post-training available at little or no cost through state Technical College System.
nnessee Sales and Use Tax Credit for high-tech, clean energy, R&D, and emerging industry. Must invest at least $100 million and create at least 50 new jobs.
Grants to companies to reimburse for training costs for high wage, high skill, jobs in technology focused sectors.
xas Skills Development Grants: Grants up to $50,000 for training at state community and technical colleges and engineering services.
rginia Economic Development Access Program: Up to $500,000 to help build access roads and rail lines to R&D and other types of large facilities.
Loans for technology-based firms and R&D companies of up to $1 million for companies that invest in a local area, generate majority of sales from out-of-state, and pay wages of at least $10 per hour.
Investment PGrants: R&Dmanufacturihave investemillion and for 5 years oare paid basecreation and
est Virginia Sales tax exemption for R&D equipment, and income tax credit worth 100% of a company's income tax liability for all R&D expenditures.
High-Tech manufacturing credit: will offset 100% of business income taxes, occupation taxes, and franchise taxes for up to 20 years if they create and maintain at least 20 jobs.
Grants to small businesses up to $5,000 to offset commercialization costs.
High-Tech Business Property Tax rate reduction. Personal property is valued at 5% original cost for tax valuation purposes.
rce: Kentucky Cabinet for Economic Development; C2ER.org; State economic development websiteslysis: Anderson Economic Group, LLC
e: We include only incentives that exclusively apply to high-tech and knowledge-based firms. We leave out incentives that are available to, but do not specifically target, these industries. Exhibit B-3 shows the inilable to advanced manufacturing and knowledge-based industries. Blanks indicate a state that had no specific incentives under each category.
derson Economic Group, LLC

Knowledge-Based Jobs and Focus on Innovation
Arkansas. Arkansas offers many incentives targeted to technology and research firms. Arkansas offers a generous R&D income tax incentive worth up to 33% of annual R&D expenditures up to a maximum of $50,000 in credits per year. Other incentives include grant funding to aid companies or researchers in trans-ferring technology. The state will provide up to $3,750 of the costs associated with transferring and licensing of new technology to an Alabama company.
Arkansas also provides financing to high-tech firms with the expectation that the state will be paid back in royalties. The State will invest up to $100,000 in a company. In return, the company provides up to 5% of net sales for a maximum of 10 years. Alabama also offers long term loans to high-tech firms for up to $3 million.
Georgia. Georgia offers two main incentives that specifically target high-tech and knowledge-based firms. The state provides an income tax credit worth 10% of qualified research and development expenses that are above a certain amount. Georgia also offers a job creation tax credit. This tax credit gives firms between $1,250 and $3,500 for each job created if the job lasts five years and the firm creates a minimum of five jobs.The job creation tax credit targets high-tech and R&D firms as well as manufacturing, data processing, tourism, and warehous-ing.
Indiana. Indiana provides two targeted incentives for technology and knowl-edge-based firms. They provide a grant from a pool of funds called the “Indiana 21st Century Research and Technology Fund” worth up to $5 million for any research and technology firm utilizing a new technology. Indiana also has the “Technology Enhancement Certification for Hoosier (TECH) Fund” which pro-vides $2,500 per employee or $50,000 maximum for customized employee training.
North Carolina. North Carolina’s office that targets high-tech and knowledge-based industries is called the First Flight Venture Center (FFVC). The FFVC is housed in the Research Triangle Park, a public-private partnership that taps into research occurring at North Carolina’s public universities. The FFVC is a state-sponsored venture fund and incubator program for high-tech start-ups. The Cen-ter actively partners with the state’s research universities in the area.
The state has a specific tax credit for R&D spending. A company can recoup up to 3.25% of its R&D spending in tax credits and up to 20% of its spending if the R&D occurs at a public research institution.
Another credit in North Carolina that enables partnerships between universities and the private sector is the Interactive Digital Media Credit. This credit is com-monly known as the “video game tax credit,” but it is targeted toward all digital interactive media companies, including companies working on virtual reality, graphical imaging, and related technologies. Before this credit was offered, state
Anderson Economic Group, LLC 74
Knowledge-Based Jobs and Focus on Innovation
officials noticed that the state’s two large research universities (University of North Carolina at Chapel Hill and North Carolina State) were some of the only schools in the country with a heavy focus on digital media and virtual reality technology research. This led the state to encourage companies to enter the state using a tax credit. As of 2011, North Carolina was home to over 45 digital media companies, many of which partner with the universities for course offer-ings and research.
Ohio. Ohio is home to the Third Frontier office, which is focused on technol-ogy, information technology, electronics, and science-related firms. Third Fron-tier sponsors the Innovation Loan Fund in Ohio, which is similar to Kentucky’s High-Tech Investment and Construction Loan Pools. The Innovation Loan Fund offers firms $500,000 to $2 million in loans to expand their high-tech and sci-ence-related businesses. The loan amount is negotiated, as is the number of jobs to be created or retained. In addition to issuing loans, the office sponsors the Ohio New Entrepreneurs (ONE) Fund, a partnership between the state and the Center for Entrepreneurship at The Ohio State University’s Fisher College of Business. This novel program attracts young entrepreneurs and assists them in commercializing new technologies.
The Third Frontier is also sponsoring a new effort to build a large, nationally designated research facility in the state, which would be available for use by the federal government, nonprofit research institutions, and the private sector. The state has requested proposals from developers, and will provide matching funds for the facility’s construction.
Two of Ohio’s programs are specifically targeted toward research and develop-ment spending. Ohio offers income tax credits worth 7% of all R&D spending in the state, as well as a sales tax exemption on all R&D equipment.
South Carolina. South Carolina offers many of its incentives to high-tech and knowledge-based firms but only a few are specifically targeted to this type of firm. The state has three tax-related incentives for technology and R&D firms. R&D firms are exempt from all non-school property taxes for five years and are also exempt from all sales taxes. Technology firms can take advantage of South Carolina’s “Retraining Credit,” which targets technology firms who seek to retrain employees on new technologies. The retraining credit offers up to $2,000 in business income tax credits per employee to help with costs of retraining.
South Carolina also offers a training grant for technology firms. Through a part-nership with the South Carolina Technical College system, South Carolina high-tech firms can train current or new employees at little or no cost.
Tennessee. Tennessee has an office with functions similar to that of Kentucky’s OCI called the Tennessee Technology Development Corporation (TTDC). Ten-nessee has a new program called “INCITE” that is a partnership between the
Anderson Economic Group, LLC 75

Knowledge-Based Jobs and Focus on Innovation
TTDC and the Department of Economic and Community Development. INCITE stands for Innovation, Commercialization, Investment, Technology, and Entrepreneurship. The partnership is geared to increase the state’s focus on aiding high-tech and knowledge-based businesses in the state.
Tennessee’s targeted incentives differ from other states in that the majority of their targeted incentives are for clean and/or renewable energy firms. For exam-ple, the state offers a program called the Green Island Corridor Grant, which provides grant funding to build pumps at retail fuel stations for E85 fuel, an alternative to “regular” gasoline that contains a high percentage of ethanol.
The INCITE program in Tennessee is also unique in that it does not have any separate, new programs for only high-tech and knowledge-based firms. The INCITE program seeks to use currently available incentives, like the state’s small business loans, efficient energy program, the Green Island program, and other more broad-based incentives to target high-tech and knowledge-based firms.
Virginia. Virginia offers two grants and a loan program that specifically target high-tech and knowledge-based firms. One grant program addresses highway access, which is the number one site location concern for CEOs, according to recent surveys. Virginia offers R&D firms and other high-tech firms up to $500,000 in grant funds to build access roads to their facilities. Another grant program offered by Virginia is the Investment Partnership Grant. R&D compa-nies that have operated in Virginia for at least five year and have made an investment in the state worth at least $25 million are eligible to receive grant funding.
Virginia also offers a loan program that targets technology-based and R&D companies. The State provides loans of up to $1 million for companies that make investments in quality-of-life projects in their local area. Qualifying com-panies must also pay employees at least $10 per hour and have a majority of their sales and services distributed out of state.
West Virginia. West Virginia offers the most incentives targeted directly toward high-tech and knowledge-based firms. While the state does not have an office that specifically targets these companies, West Virginia has the most extensive and generous incentives in comparison to peers. West Virginia has an income tax credit worth 100% of a firm’s income tax liability for all R&D expenditures. The state also exempts R&D equipment from sales taxes.
For high-tech manufacturing firms, 100% of business income taxes will be cred-ited for up to 20 years for companies that create at least 20 jobs for the term of the credit. High-tech firms are also offered a special rate for personal property taxes. Personal property at high-tech firms will be valued at 5% of its original
Anderson Economic Group, LLC 76

Knowledge-Based Jobs and Focus on Innovation
cost for tax valuation purposes. Finally, West Virginia also offers $5,000 grants to assist companies with commercializing new technologies.
CONCLUSIONS AND RECOMMENDATIONS
To summarize the many topics that have been covered in this chapter, we came to the following conclusions regarding Kentucky’s competitiveness in knowl-edge-based industries and how effectively they are addressing shortcomings.
• In general, as a share of employment and pay, the presence of knowledge-based industries in Kentucky is very low compared to peer states and the nation. How-ever, over the past few years, these industries have been growing at a rate that exceeds most of the state’s competitors.
• Looking more closely at specific aspects of knowledge-based industries, we find that Kentucky is doing fairly well in advanced manufacturing, but contin-ues to lag behind in research industries and industries related to the computer sciences, such as programming and graphic design.
• Kentucky has not been able to fully capitalize on the research and technology advantages that it has in its very high research universities in the state. Ken-tucky has a high level of graduates, but many of these graduates leave, as the state’s average education level among adults is relatively low.
• Kentucky has many different types of incentives available to high-tech firms. We found that about 30% of firms receiving incentives were in knowledge-based or high-tech industries, far exceeding their representation in the Kentucky economy. The range of incentives available to these types of firms in Kentucky exceeds that in most peer states. (Data on the extent to which other states target high-tech firms, in terms of awards provided or funding levels, is not available.)
• Kentucky’s research and development has been growing at a very fast pace, and the state has R&D credits available, but the state’s presence in these industries remain low. There could be further opportunities for the state if it were to bring its R&D credit closer to that of competitive states, and if it fosters further rela-tionships between its high-research public universities and innovators and developers in private industry.
We recommend the following alteration in focus in order to help attract more high-tech and knowledge-based firms:
• Put more emphasis on bridging the gap between research universities and private enterprise. Of the three states with special offices that target high-tech and knowledge-based firms, two have programs that directly connect businesses with state research universities. In North Carolina, the state sponsors a busi-nesses venture fund and incubator program in partnership with the Research Triangle. The state also connects businesses in the video game industry to the University of North Carolina at Chapel Hill and North Carolina State University to create special degree programs and course offerings that train students for work in their industry. Ohio has leveraged the Ohio State University to help attract research and development facilities and to aid young entrepreneurs in commercializing technology. The Ohio New Entrepreneurs (ONE) Fund is a partnership between Ohio State University’s College of Business and the Third Frontier Program.
Anderson Economic Group, LLC 77
Knowledge-Based Jobs and Focus on Innovation
Beyond an annual business plan competition, the OCI does not work with local researchers and students to foster innovation and entrepreneurship. Kentucky’s public research institutions provide an opportunity for the state to develop more knowledge-based and high-tech businesses. For example, in 2009 and 2010, the University of Louisville and the University of Kentucky were responsible for 25 start-up companies. Between 2000 and 2010, these universities had 88 start-ups. Over that same time period, researchers at these Universities were awarded 299 U.S. patents. Both universities have incredible opportunities to expand their already fruitful technology transfer programs. University of Louisville’s focus on biomedical and life sciences and University of Kentucky’s transportation programs are special opportunities for the state. Public research universities are a great economic growth driver. Technology transfer activities such as patent creation and start-up companies are just two examples of how universities can assist states with private sector growth.
• Consider increasing or expanding the state’s tax credit for qualified research and development expenditures.Research and development is an area where the state has valuable assets and is growing, but still lags behinds its peers. Kentucky is currently one of seven states that provides a tax credit for qualified expenditures on the construction of research facilities and research performed. However, other states provide more generous credits and appear to publish the availability of these credits more widely than Kentucky.
The legislature may want to consider the following actions. (1) Consider mak-ing the current tax income credit equal to 5% of the qualified cost for the con-struction of research facilities and qualified research more generous to match other states. (2) Consider expanding the tax credit to other taxes, such as sales and use, as other states have done. (3) Consider providing an enhanced incen-tive if a firm works with universities for the R&D. Other states have done this, and there are possible benefits from working with public universities, including forming relationships with researchers who can undertake applied research for the firm, and developing relationships with students who could work for the business upon graduation.
Anderson Economic Group, LLC 78

Job Growth and Cost of Kentucky’s Incentives
VI. Job Growth and Cost of Kentucky’s Incentives
In this chapter, we use data provided by the Kentucky Cabinet for Economic Development (CED); the Kentucky Tourism, Arts, and Heritage Cabinet (TAHC); and the Kentucky Department of Revenue to show the number of jobs reported by firms who receive incentives and the cost to the state for those incentives.
DISCUSSION OF DATA ON INCENTIVES
The CED collects detailed data to track characteristics of firms receiving incen-tives and to ensure ongoing compliance with incentive terms. The data provided to us from the CED listed all firms that have received incentives, the status of those incentives (e.g. preliminary approval, final approval, withdrawn), as well as other statistics about those firms over time. In particular, for those incentives that have job requirements, the CED documented the work site’s beginning employment upon activating the incentive or receiving final approval, and then monitored that firm’s total employment over time for the site. (Incentives are usually provided based on the operations of one site, not the entire scope of operations by a firm within the state.)
The Kentucky Tourism, Arts, and Heritage Cabinet also administers incentive programs. TAHC incentive programs include the film credit and Kentucky Tourism Development Act credits. TAHC provided us with extensive data on the companies receiving these credits, the expected amount of investment, the actual investment and credits provided, and the share of visitors from out of state utilizing facilities built with incentives, where applicable. Since these incentives do not come with an accompanying job requirement, and therefore there is no monitoring of jobs at companies receiving these incentives, they are not included in much of the job-related analysis presented in this chapter. We include the cost of programs and number of businesses receiving credits through TAHC incentives.
The Department of Revenue provided data on total credits claimed by compa-nies for incentive programs that included credits on statewide taxes.
CAUTION ABOUT JOBS NUMBERS
The number of jobs at firms receiving incentives are reported to the CED by the firms themselves, and any additional jobs for Kentucky residents are counted as new jobs toward fulfillment of incentive requirements. We do not (and cannot) make the claim that these jobs were directly caused by provision of the incen-tive.
Furthermore, due to inconsistencies in the CED data, we estimated the total and new jobs numbers for all firms in order to make sure we had a consistent jobs number for these incentives. For the same reasons, we estimated the required
Anderson Economic Group, LLC 79

Job Growth and Cost of Kentucky’s Incentives
jobs under each incentive. We discuss these data issues more in “Monitoring, Reporting, and Evaluation in the Peer States” on page 114.
JOB CREATION AT FIRMS RECEIVING INCENTIVES
As discussed in the previous chapter, Kentucky provides 17 incentive programs to encourage business investment and employment in the state. In the analysis presented in this section and remaining sections in this chapter, we show the number of firms receiving incentives, the amount of jobs created at those firms, where applicable, and the cost of those incentives to the state.
Seven active incentives have an explicit jobs requirement. In addition, the four incentive programs that have been consolidated into the Kentucky Business Investment (KBI) incentive also had jobs requirements. For those four incentive programs and five of the seven active incentive programs that include jobs requirements (we exclude the Small Business Investment Credit and Small
Business Loans30), we show specific jobs data over the decade from 2001 to 2010. We restrict our jobs analysis to these incentive programs and this time period due to availability and quality of jobs monitoring data. Jobs monitoring data is only reliable for those years and incentive programs where jobs were actually required. The nine incentive programs included in our jobs analysis are summarized in Table 35 below.
30.The Small Business Investment Credit and Small Business Loans programs each require that only one job be created at recipient companies. For this reason, monitoring data for these pro-grams is not as consistent as for the other programs listed in Table 35.
TABLE 35. Incentive Programs Included in Jobs Analysis
Acronym Incentive Program
KRA Kentucky Reinvestment Act
KEDFA KEDFA Direct Loans
OCI High-Tech Pools Office of Commercialization and Innovation High-Tech Pools
KIRA Kentucky Industrial Revitalization Act
KBI Kentucky Business Investment Program
Incentive programs replaced by KBI
KREDA Kentucky Rural Economic Development Act
KIDA Kentucky Industrial Development Act
KJDA Kentucky Jobs Development Act
KEOZ Kentucky Economic Opportunity Zone Act
Anderson Economic Group, LLC 80

Job Growth and Cost of Kentucky’s Incentives
Y TO
TA
L
2 51
2 06
2 12
2 90
2 56
2 01
2 21
2 53
2 61
2 62
T 20
NtTTT ct cSA
a
Firms Receiving Incentives
Between the years 2001 and 2010, nearly 2,000 firms received incentives in Kentucky. The most commonly used programs, by far, are the Bluegrass State Skills Corporation grants and credits (BSSC Grants and Credits). Nearly 1,000 separate firms received grants or tax credits for employee training through the BSSC over this time period. On the opposite end of the spectrum, the Kentucky Environmental Stewardship Act (KESA) and the Kentucky Reinvestment Act (KRA) each only provided an incentive to one firm. Table 36 below shows the total number of firms receiving incentives by program and year.
Jobs Created by Firms Receiving Incentives
Most incentives over the period reviewed here (2001-2010) require a firm to create additional jobs and to maintain those jobs over a given period of time. In order to ensure that companies continue to comply with their incentive require-ments, the Cabinet requires that firms submit an annual accounting of their employees who are Kentucky residents. The number of new jobs in any given year is the extent to which employment at the firm in that year exceeds the employment that was at the firm when the incentive was first activated.
TABLE 36. Number of Kentucky Firms Awarded Incentives by Year of Final Approval and Incentive Program, 2001-2010
ear BS
SC
FIL
M
IRB
KB
I
KE
DFA
KE
IA
KE
OZ
KE
SA
KID
A
KIR
A
KJD
A
KR
A
KR
ED
A
KT
DA
OC
Ia
TIF
001 122 0 0 0 18 0 0 0 25 4 32 0 27 1 10 0 2
002 112 0 0 0 16 0 1 0 19 1 14 0 20 4 19 2 2
003 102 0 4 0 2 0 2 0 22 2 19 0 18 2 36 1 2
004 108 0 8 0 6 0 2 0 21 2 22 0 13 0 2 0 1
005 66 0 2 0 8 1 0 0 18 1 16 0 14 0 24 0 1
006 79 0 3 0 3 20 0 0 39 1 26 1 12 0 14 1 2
007 123 0 1 0 9 26 0 1 11 1 17 0 14 1 13 5 2
008 72 0 4 0 3 24 0 0 13 2 12 0 8 3 11 0 1
009 81 3 1 0 3 17 0 0 13 3 17 0 4 0 10 3 1
010 75 2 4 5 4 32 0 0 10 1 8 0 4 1 11 1 1
OTAL 940 5 27 5 72 120 5 1 191 18 183 1 134 12 150 13 1,8
ote: Within an incentive program, firms are only counted once, for the first incentive they receive. Some firms, however, are included more han once if they received credits from different incentive programs.he BSSC column includes firms that received tax credits through BSSC, as well as firms that received grants through BSSC.he TIF column includes only projects that involve at least some state participation.his table does not include Small Business Loans, Kentucky Small Business Investment Credits, and the Incentives for Energy Independence Aredits. Only one firm has received final approval under IEIA, and that occurred in fiscal year 2011.ource: Kentucky Cabinet for Economic Development; Kentucky Tourism, Arts and Heritage Cabinetnalysis: Anderson Economic Group, LLC
. Total firms awarded incentives in the OCI column includes firms that receive incentives from all programs operated by the Office of Commercialization and Innovation. This does not match the total OCI firms in Table 40 because jobs data is only analyzed for certain programs that were monitored under the High-Tech Investment and Construction Pools, specifically.
Anderson Economic Group, LLC 81
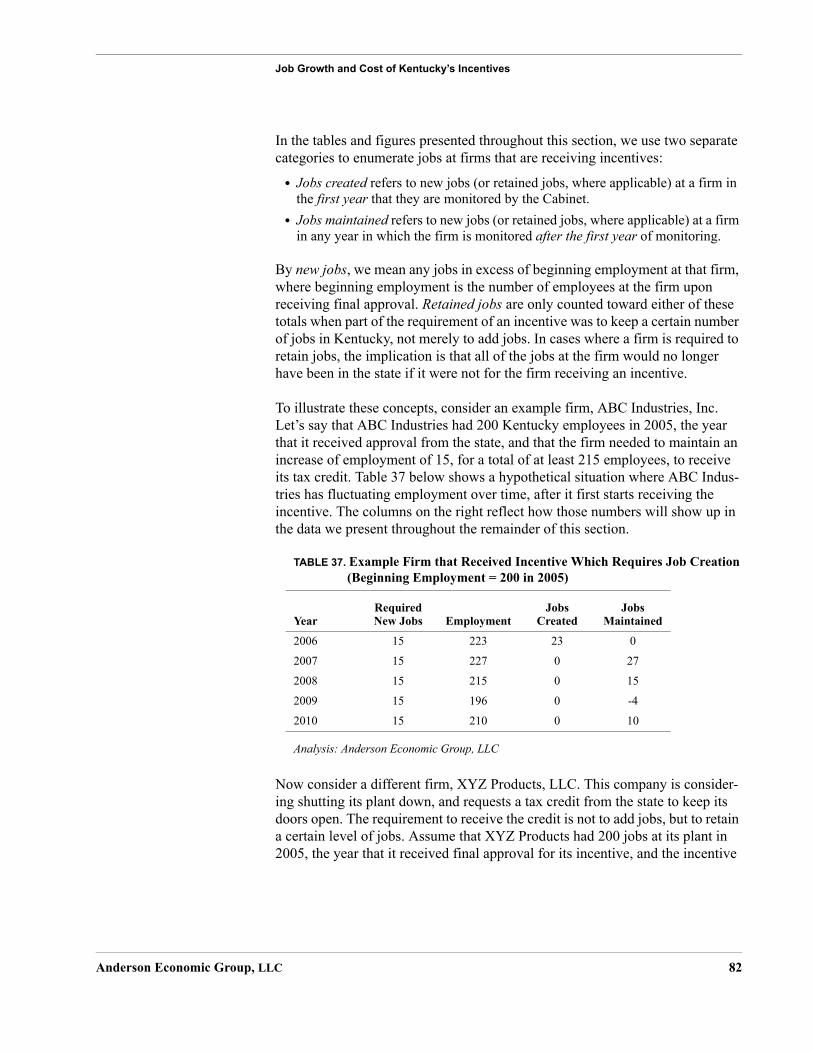
Job Growth and Cost of Kentucky’s Incentives
In the tables and figures presented throughout this section, we use two separate categories to enumerate jobs at firms that are receiving incentives:
• Jobs created refers to new jobs (or retained jobs, where applicable) at a firm in the first year that they are monitored by the Cabinet.
• Jobs maintained refers to new jobs (or retained jobs, where applicable) at a firm in any year in which the firm is monitored after the first year of monitoring.
By new jobs, we mean any jobs in excess of beginning employment at that firm, where beginning employment is the number of employees at the firm upon receiving final approval. Retained jobs are only counted toward either of these totals when part of the requirement of an incentive was to keep a certain number of jobs in Kentucky, not merely to add jobs. In cases where a firm is required to retain jobs, the implication is that all of the jobs at the firm would no longer have been in the state if it were not for the firm receiving an incentive.
To illustrate these concepts, consider an example firm, ABC Industries, Inc. Let’s say that ABC Industries had 200 Kentucky employees in 2005, the year that it received approval from the state, and that the firm needed to maintain an increase of employment of 15, for a total of at least 215 employees, to receive its tax credit. Table 37 below shows a hypothetical situation where ABC Indus-tries has fluctuating employment over time, after it first starts receiving the incentive. The columns on the right reflect how those numbers will show up in the data we present throughout the remainder of this section.
Now consider a different firm, XYZ Products, LLC. This company is consider-ing shutting its plant down, and requests a tax credit from the state to keep its doors open. The requirement to receive the credit is not to add jobs, but to retain a certain level of jobs. Assume that XYZ Products had 200 jobs at its plant in 2005, the year that it received final approval for its incentive, and the incentive
TABLE 37. Example Firm that Received Incentive Which Requires Job Creation(Beginning Employment = 200 in 2005)
YearRequired New Jobs Employment
Jobs Created
Jobs Maintained
2006 15 223 23 0
2007 15 227 0 27
2008 15 215 0 15
2009 15 196 0 -4
2010 15 210 0 10
Analysis: Anderson Economic Group, LLC
Anderson Economic Group, LLC 82

Job Growth and Cost of Kentucky’s Incentives
provided requires that XYZ retain 180 jobs at the plant for each year after that. Example employment figures are shown in Table 38 below.
Note that, for both ABC Industries and XYZ Products, even if jobs increase beyond what they were in the first year of receiving an incentive, they are counted as “Jobs Maintained” instead of “Jobs Created.” Also, in the case of ABC Industries, when the firm’s employment drops below the beginning employment level of 200, this counts as a negative amount. In years 2009 and 2010, ABC would receive a reduced credit or no credit, depending on the nature of the program, because it falls short of its new jobs requirement. For XYZ, all jobs are counted towards jobs created or maintained in any given year because the assumption is that the firm would no longer have operated in the state with-out receiving a credit. In the year 2009, XYZ would receive a reduced credit or no credit, depending on the nature of the program, because it falls short of its
retained jobs requirement.31
See Table 39 on page 84 for a summary of jobs created and maintained for all incentives that involve a jobs requirement, from the years 2001 to 2010. (See Table 35 on page 80 for a list of which incentives are included in this total.)
TABLE 38. Example Firm that Received Incentive Which Requires Job Retention(Beginning Employment = 200 in 2005)
Year
Required Jobs
Retained EmploymentJobs
CreatedJobs
Maintained
2006 180 202 202 0
2007 180 190 0 190
2008 180 193 0 193
2009 180 176 0 176
2010 180 182 0 182
Analysis: Anderson Economic Group, LLC
31.Some credits allow companies to receive their credit even if they fall a little short of their jobs requirements, but we ignore that detail in this example.
Anderson Economic Group, LLC 83

Job Growth and Cost of Kentucky’s Incentives
Among those companies receiving incentives in which a certain number of new or retained jobs were required, over 55,000 jobs were created from 2001 to 2010, or an average of 5,517 jobs per year. In addition, the average number of jobs maintained in any given year over this period was 33,227. That is, for firms that had already been monitored for at least a year, employment was still a total of 33,227 jobs higher annually, on average, than it purportedly would be without an incentive.
Total jobs created was at its highest in 2001, largely because many firms hap-pened to begun being monitored in that year. Total jobs maintained reached a peak in the year 2008. In that year, reported jobs were 95% greater than the amount that firms were required to create or maintain in order to receive their incentives.
TABLE 39. Jobs Created and Maintained by Companies Receiving an Incentive with a Jobs Requirement, 2001-2010
Year
Number of Firms
Reporting Jobs to CED Jobs Createda
Jobs Maintainedb
Total Jobs Created and Maintained
Jobs Required to be Created or Maintained
Actual Jobs/Jobs Required
2001 199 12,907 30,234 43,141 25,576 169%
2002 204 4,541 35,788 40,329 27,310 148%
2003 184 4,035 30,542 34,577 22,861 151%
2004 162 2,487 31,468 33,955 22,632 150%
2005 128 2,959 30,352 33,311 22,525 148%
2006 171 5,602 35,580 41,182 23,017 179%
2007 222 4,864 40,011 44,875 24,292 185%
2008 242 5,375 42,833 48,208 24,764 195%
2009 226 9,865 22,927 32,792 12,465 263%
2010 200 2,538 32,530 35,068 16,983 206%
TOTAL 577c 55,173 332,265 387,438 222,425 174%
Note: Only firms that reported non-zero job counts are included in this analysis. If a firm received more than one incentive, we counted jobs created and maintained based on beginning employment for the most recent incentive received.Source: Kentucky Cabinet for Economic Development; AEG EstimatesAnalysis: Anderson Economic Group, LLC
a. “Jobs Created” is calculated by summing the total new jobs (or retained, where applicable) at firms in the first year that they are monitored by the CED.
b. “Jobs Maintained” are the total jobs that are new, or retained, at firms that have previously reported jobs to the CED. “New jobs” are defined as the total jobs at the firm minus the firm’s beginning employment.
c. This total includes all unique firms reporting jobs between 2001 and 2010, so it does not equal the sum of companies in each year because companies received an incentive over several years.
Anderson Economic Group, LLC 84

Job Growth and Cost of Kentucky’s Incentives
Incenti
Kentuc
Kent
Ken
Ken
Ken
Kentuc
KEDFA
Office oHigh-T
Kentuc
Note: Otable dureportinSource:Analysi
a. “JodataDue
b. Theprohavapp
Kentucky’s incentive programs generally do not have stringent job require-ments. Required additional jobs rarely exceeded 10 to 15 jobs for any given incentive in these programs. There were no years in which the aggregate num-ber of jobs reported by firms receiving incentives came close to falling short of the number of new or retained jobs required, though there were several isolated cases where individual firms failed to meet their job requirements.
The most widely used incentive program, in terms of number of firms, was KIDA. Over 200 firms received loans through KIDA between 2001 and 2010, and these firms created 15,000 jobs. The incentive program that resulted in the most jobs created and years maintained for each job, at 333,536 over this period,
was KJDA.32 Again, we cannot be sure that these jobs would not have been cre-ated in the absence of the incentive. We know only that companies receiving an incentive maintained increased employment while they were receiving an incentive.
TABLE 40. Number of Jobs Created and Years Maintained Under Kentucky Incentive Programs that Require Firms to Add Jobs, 2000-2010
ve Acronym
Firms Reporting
Jobs for First Time
Jobs Created in 1st Year
Jobs Created &
Years Maintained
Job-Years Projected a
Job-Years Required
ky Business Investment Program KBI 5 323 368 324 60
ucky Rural Economic Development Act KREDA 192 11,116 49,013 62,803 6,287
tucky Industrial Development Act KIDA 213 15,077 184,619 116,987 9,750
tucky Jobs Development Act KJDA 147 16,054 333,536 195,829 204,211
tucky Economic Opportunity Zone Act KEOZ 1 10 41 40 40
ky Reinvestment Act KRA 1 7,241 13,939 12,506 13,216
Direct Loans KEDFA 79 4,731 33,696 22,929 8,333
f Commercialization and Innovation ech Pools
OCI 25b 230 718 1,891 592
ky Industrial Revitalization Act KIRA 18 11,139 71,266 59,942 26,755
nly firms that reported non-zero job counts are included in this analysis. Sums across incentive programs exceed those in the previous e to firms receiving multiple incentives. When a firm received more than one incentive, calculations for Table 39 are based on the g provided and base employment of the most recent incentive received. Cabinet for Economic Development, AEG Estimatess: Anderson Economic Group, LLC
b-years projected” and “job-years required” only include those projected and required for firms in years that have job monitoring available. Note that this excludes years in which a project may have been discontinued due to firm withdrawal or noncompliance. to data problems, AEG estimated reported job-years and required job-years for many firms.
number of firms reporting jobs in this period is low compared to the value shown in Table 36 for two reasons: a large portion of jects receiving funds from OCI high-tech pools are performed in concert with state universities and local governments and do not e the same job monitoring standards, and there is a 3-year delay between final approval and jobs reporting so firms receiving final roval in 2007 or later are not included.
Anderson Economic Group, LLC 85

Job Growth and Cost of Kentucky’s Incentives
DURATION OF JOBS Job creation is much more valuable if the jobs that are created are retained over time. We performed an analysis that approximates the duration of the average job created at firms receiving incentives. Looking only at firms that started reporting jobs in the years 2001 through 2005, we looked at how many total jobs remained as time passed. For example, our analysis looked at the trend of total jobs reported one, two, and three years after monitoring has begun at each individual firm. The results are presented below in Figure 3.
FIGURE 3. Total Jobs Reported Over Time for Firms First Reporting Jobs in the Years 2001-2005
The trend in total jobs over time suggests that the average job lasts five years. We include total jobs at all firms over time, even if the firm stopped reporting jobs at some point. It turns out that almost all of the reduction in jobs over time is not due to reductions in jobs at firms that continue reporting and receiving incentives, but rather due to firms discontinuing their reporting. If we only look at firms that continuously report for six years, the number of jobs actually increases, as shown in Figure 4 on page 87.
32.Job-years are a measure of jobs times how many years those jobs last. For example, if a firm hires 10 people and maintains that additional work force for 5 years, we count that as 50 addi-tional job-years. This allows us to capture not only how many jobs were added but the extent to which that additional employment was maintained. We’ve only included job-years for the years and firms for which monitoring data is available.
0
5
10
15
20
25
30
0 1 2 3 4 5
Tota
l J
ob
s (t
hou
san
ds)
Years Since First Year of Monitoring
Source: Kentucky Cabinet for Economic DevelopmentAnalysis: Anderson Economic Group, LLC
Anderson Economic Group, LLC 86

Job Growth and Cost of Kentucky’s Incentives
FIGURE 4. Average Jobs Reported Over Time by Firms that Continuously Report Jobs for Six Years
We can draw two conclusions from this analysis. First, the average duration of jobs is, at minimum, five years. Since jobs reported fall over time due to firms no longer reporting jobs, we can safely assume that at least some jobs will con-tinue and simply not be reported. This suggests that the 5-year duration estimate is a conservative one, since it does not take these continued jobs into account. Second, firms that continually report jobs actually increase their employment over time, as shown in Figure 4. This suggests that our estimates for “jobs cre-ated,” which only take into account new or retained jobs in the first year of reporting, are conservative estimates. At least some jobs are being created even after that first year but are instead listed under “jobs maintained” in the tables in “Jobs Created by Firms Receiving Incentives” on page 81.
GROSS COST OF INCENTIVES
The “gross cost” of Kentucky’s incentive programs comprises two components: tax revenue that has been foregone (e.g. tax credits), and direct payments to firms in the form of forgivable loans and grants. Forgivable loans are loans that do not need to be paid back as long as a firm fulfills the incentive requirements. The CED provided data regarding grant payments and forgivable loan disburse-ments. In addition, we received aggregate data on tax credit claims by type of tax and program from the Department of Revenue.
In most cases, the CED informs the Department of Revenue of the amount that firms are able to claim under their incentives. Table 41 below shows the actual
020406080
100120140160180200
0 1 2 3 4 5
Av
era
ge J
ob
s
Years Since First Year of Monitoring
Source: Kentucky Cabinet for Economic DevelopmentAnalysis: Anderson Economic Group, LLC
Anderson Economic Group, LLC 87

Job Growth and Cost of Kentucky’s Incentives
amount claimed for each incentive between the years of 2001 and 2010, inclu-sive.
Note that the largest incentives are KREDA, KIDA, and KJDA in terms of total revenue foregone. These are the programs that have all been rolled into the new KBI program. We anticipate that the KBI program, which first came into law in 2009, will soon be the largest program in the state, but businesses have yet to claim a significant number of credits. Other large programs, in terms of cost, were KIRA; KTDA; the BSSC, which is the most highly utilized program; and OCI high-tech pools.
Table 42 on page 89 shows the same gross cost figures broken down by year. The year with the highest cost was 2004, when there was a simultaneous jump
TABLE 41. Total Gross Cost of Kentucky’s Incentive Programs, 2001-2010
Incentive AcronymRevenue Foregone
Grants and Loans
ForgivenTotal Gross
Cost
Kentucky Business Incentive KBI $8,583 $0 $8,583
Kentucky Rural Economic Development Act KREDA $478,970,400 $0 $478,970,400
Kentucky Industrial Development Act KIDA $170,817,358 $0 $170,817,358
Kentucky Jobs Development Act KJDA $249,247,867 $0 $249,247,867
Kentucky Economic Opportunity Zone KEOZA $23,357 $0 $23,357
Kentucky Reinvestment Acta KRA $0 $0 $0
Kentucky Economic Development Finance Authority Direct
LoansbKEDFA
Loans$0 $0 $0
Office of Commercialization and Innovation High-Tech Pools OCI $0 $115,133,359 $115,133,359
Kentucky Industrial Revitalization Act KIRA $62,090,485 $0 $62,090,485
Bluegrass State Skills Corporation Grants and Credits BSSC $4,728,749 $33,911,110 $38,639,859
Kentucky Enterprise Initiative Act KEIA $6,442,816 $0 $6,442,816
Kentucky Investment Fund Act KIFA $3,203,857 $0 $3,203,857
Kentucky Tourism and Development Act KTDA $30,788,163 $0 $30,788,163
Tax Increment Financing TIF $2,930,767 $0 $2,930,767
Cabinet for Economic Development Operational Expenses $21,399,600
Cabinet for Economic Development Personnel Costs $110,532,100
TOTALS $1,009,252,402 $149,044,469 $1,290,228,571
Source: Cabinet for Economic Development; Kentucky Department of Revenue; Office of the State Budget Director; AEG EstimatesAnalysis: Anderson Economic Group, LLC
a. Though a firm has been eligible to receive credits under KRA since 2009, no credits have been claimed yet.
b. KEDFA Direct Loans do not pose costs to the state in the same way that other programs do because they are loans with inter-est. We discuss this separately in “KEDFA Direct Loans” on page 92.
Anderson Economic Group, LLC 88

Job Growth and Cost of Kentucky’s Incentives
in OCI forgivable loans provided and claims made on tax credits through other incentive programs. In most recent years, the total cost of these programs, including expenses for operations of the CED, has been about $140 million. The vast majority of costs are from foregone revenue due to tax credits claimed by companies receiving incentives.
With most incentives, the CED approves a maximum amount of money that the firm could possibly collect under the incentive, but that amount is contingent on the firm’s activities. For example, the size of the incentive is often directly tied to the amount of capital investment that the firm makes in the state. Also, sales tax credits, for example, depend on the actual amount of sales tax paid on pur-chases made by the company. For each incentive awarded, there is a maximum amount of funding for which the firm is eligible. Often, that amount is set far above what the firm’s performance will merit, but the firm can collect a portion of the incentive if it is able to attain certain levels of consumption, employment, or investment. This allows the state to incentivize activity more flexibly, rather than setting a strict goal where the firm would receive full payment or none at
TABLE 42. Total Cost of Incentive Programs, Annually, 2001-2010
Revenue Foregone
Grants and Loans
Forgiven
CED Operating and Personnel
ExpensesTotal Gross
Cost
2001 $66,596,547 $38,406,441 $13,037,400 $118,040,388
2002 $90,691,112 $8,728,222 $13,543,800 $112,963,134
2003 $92,519,608 $11,231,817 $13,609,300 $117,360,726
2004 $116,679,992 $23,688,759 $13,771,300 $154,140,051
2005 $87,610,478 $6,008,287 $13,192,500 $106,811,265
2006 $106,396,092 $14,691,462 $13,820,600 $134,908,154
2007 $114,727,678 $14,071,183 $12,734,600 $141,533,461
2008 $115,982,242 $12,939,524 $12,875,400 $141,797,166
2009 $99,715,292 $9,127,209 $12,545,300 $122,412,158
2010 $118,333,359 $10,182,116 $12,801,500 $140,262,068
TOTALS $1,009,252,402 $149,044,469 $131,931,700 $1,290,228,571
Source: Cabinet for Economic Development; Kentucky Department of Revenue; Office of the State Budget Director; AEG EstimatesAnalysis: Anderson Economic Group, LLC
Anderson Economic Group, LLC 89

Job Growth and Cost of Kentucky’s Incentives
all. We have approximated what this maximum potential amount could be for the programs that include jobs requirements, as shown in Table 43 below.
Firms received a total of $1.1 billion in foregone revenue and forgivable loans from the state under the incentive programs listed in Table 43. KREDA, KIDA, KJDA were the largest three programs in terms of cost. Among these, KREDA only actually paid out 62% of the maximum approved amount to qualifying companies. In addition, KIDA and KJDA both had large maximum potential costs to the state of $800 million and $900 million, respectively, but tax credits actually claimed only totaled 22% and 28% of that amount over this time period.
Companies rarely collect the full amount in credits that they are initially awarded. On average, only 38% of the potential maximum cost was actually provided as tax credits or forgiven loans over the time period from 2001 to 2010 for the programs shown here. OCI had the highest ratio of actual cost to poten-tial maximum cost, at 87%, while KEOZ had the lowest, with 18%. No funds have been provided to firms under the KRA credit. OCI’s higher ratio is proba-bly due to the fact that OCI funds are provided up front, as forgivable loans, and
TABLE 43. Utilization of Available Incentive Funds by Program for Programs with Jobs Requirements
Incentive Acronym
Maximum Potential
Government Cost (est.)a
Actual Government
Costb
Actual Cost/Maximum Potential
Cost
Kentucky Business Incentive Program KBI $68,000 $8,583 13%
Kentucky Rural Economic Development Act KREDA $773,930,123 $478,970,400 62%
Kentucky Industrial Development Act KIDA $774,259,873 $170,817,358 22%
Kentucky Jobs Development Act KJDA $893,062,531 $249,247,867 28%
Kentucky Economic Opportunity Zone Act KEOZ $128,295 $23,357 18%
Kentucky Reinvestment Act KRA $43,000,000 $0 0%
Office of Commercialization and Innovation High-Tech Investment and Construction Pools
OCI $131,828,245 $115,133,359 87%
Kentucky Industrial Revitalization Act KIRA $198,731,550 $62,090,485 31%
TOTALS $2,815,008,617 $1,076,291,410c 38%
Source: Cabinet for Economic Development; Kentucky Department of Revenue; AEG EstimatesAnalysis: Anderson Economic Group, LLC
a. “Maximum Potential Government Cost,” in most cases, is the total approved amount under an incentive divided by the years over which the firm is eligible for incentives. Note that this is an approximation because a firm may be able to collect a disproportionate amount of its credits in a year. In the case of OCI, maximum potential cost is the total approved amount, since OCI funds tend to be provided up front.
b. “Actual Government Cost” is calculated by adding revenues foregone to grants and forgiven loans.
c. This total does not match the total presented in Table 42 on page 89 because it includes only the programs shown here.
Anderson Economic Group, LLC 90

Job Growth and Cost of Kentucky’s Incentives
only given back in the case where a firm fails to fulfill its investments or job requirements. Because of this, awards through OCI high-tech pools are not pro-vided through a “sliding scale” based on performance like other incentives.
MEASURING COST PER JOB
In this section, we present two estimates: cost per job created and cost per year that a job is maintained. We provide conservative estimates, accounting for all costs but only accounting for jobs created and maintained for programs that report employment.
We show the average gross cost per job and per year of maintained job using totals for the entire ten-year period for two reasons. First, state costs, jobs cre-ated, and jobs maintained vary over time, so an average provides a stable esti-mate. Second, it is not possible to draw a direct line between money spent and jobs created. Jobs may be created in anticipation of receiving an incentive. For example, KRA has not paid out any claims, despite the fact that the company receiving that incentive has been reporting retained jobs for several years.
We cannot claim that these costs directly caused jobs at firms receiving incen-tives. It is likely that, at least for some firms, a certain number of these jobs would have been created even without an incentive. We can only state that these calculations reflect the costs to the state for incentives that correspond to a given amount of job creation. The results are shown in Table 44 below.
On average, for each new job created at firms receiving incentives, the gross cost to the state was approximately $23,385 over this ten-year period. Similarly, for each year of a new or retained job that was reported to the CED, we found
TABLE 44. Gross Cost per Job and Gross Cost per Year of a Job, 2001-2010
Revenue Foregone through Tax Credits $1,009,252,402
Grants and Loans Forgiven $149,044,469
CED Operating and Personnel Expenses $131,931,700
Total Gross Cost of State Incentive Programsa
a. Total cost includes cost for all incentives, even those that do not have a jobs requirement.
$1,290,228,571
Total Jobs Created, 2001-2010 55,173
Gross Cost per Job Created, 2001-2010 $23,385
Total Combined Years that All Jobs Are Maintained, 2001-2010 387,438
Gross Cost per Job per Year, 2001-2010 $3,330
Source: Cabinet for Economic Development; Kentucky Department of Revenue; Office of the State Budget Director; AEG EstimatesAnalysis: Anderson Economic Group, LLC
Anderson Economic Group, LLC 91

Job Growth and Cost of Kentucky’s Incentives
that the state spent approximately $3,330 in foregone revenue, grants, or forgiv-able loans.
KEDFA DIRECT LOANS
Under the KEDFA Direct Loans and Small Business Loans programs, the Ken-tucky Economic Development Financial Authority uses a pool of funds to pro-vide low-interest loans directly to businesses. We discuss this program separately because the “cost” of a loan program is not directly comparable to
that of a grant or tax credit.33 The cost of a loan program comes from money being loaned at some risk, and that money cannot be used for other purposes; however, over time, interest payments result in net revenues due to loan pro-grams.
KEDFA Direct Loans and Small Business Loans programs have resulted in net revenues for the state. According to KEDFA financial statements, collections on program loans and interest received on loans exceeded loans issued by $1.7 mil-lion in fiscal year 2011. In fact, the collections on loans for this program have exceeded loan issuance for each year since 2003. This is due to the fact that KEDFA loans have generally performed very well. In all years but one, over the past decade, KEDFA has had to write off less than 1% of the total loans out-standing. There are currently $27.5 million in net receivable loans for both KEDFA Direct Loans and small business loans combined. This is down from a peak of $54 million in 2003.
CONFIRMING RESULTS WITH BLS DATA
The jobs data used in the analysis in this chapter is self-reported—firms tell the CED each year how many employees they have at the site receiving the incen-tive by providing a list of current employees. These firms are audited only once per year, and they have an incentive to report at a time when their employment happens to be high (e.g. due to seasonal fluctuations). For newer programs, the CED uses average employment, based on several audits over the course of a year, but this policy was only recently adopted.
In order to verify the veracity of the jobs numbers presented above, we checked the extent to which CED monitoring data was reflected in Bureau of Labor Sta-
tistics (BLS) employment data.34 For each year in which a firm provided a total jobs figure to the CED, we checked the percent difference between the CED fig-ure and the BLS figure. We do not expect the numbers to match perfectly because there could be several sources of discrepancies in this data:
33.KEDFA also administers the OCI high-tech loan pool, but since this program involves forgiv-able loans, it more closely resembles a grant program than a typical business loan program. The cost of OCI is included in the tables above.
34.Due to confidentiality concerns, Kentucky could not provide AEG with the BLS data directly, so AEG provided code to the Legislative Research Commission to run on the data. The LRC then provided the outputs of the programs to AEG to analyze.
Anderson Economic Group, LLC 92
Job Growth and Cost of Kentucky’s Incentives
• Data error. Kentucky provides incentives to thousands of companies, so there are bound to be data issues. We found there were quite a few inconsistencies in the data. For example, the same column in the monitoring data provided us might refer to new jobs (total jobs minus beginning employment) in one year and total jobs the next for the same incentive. For this reason, we came up with our own estimates for total jobs that we used in the comparison with BLS data.
• Matching issues. We were able to match 1,346 companies and work sites pro-vided by the CED with corresponding BLS locations. This represents just over a quarter of the total sites that were originally provided. The reason for the rela-tively low match rate is that the company names and addresses entered by the CED often had small differences from the names and addresses as they appeared in the BLS data. Comparisons of the matched dataset to the total data-set showed that companies that matched had slightly higher employment, on average.
• Aggregated numbers. Companies might report different parts of their opera-tions that are located at the same site or very near each other as one entity or as several. Because it was difficult to predict when this would occur, we assumed that the aggregate data for sites located very near each other geographically in the BLS data was the proper unit of comparison to CED numbers.
• Seasonal trends. Monitoring data from the CED provides total employment at a site at a given point in time, once each year. BLS data includes quarterly esti-mates of employment. There is employment variation throughout the year at most work sites, which would show up as a difference between CED monitoring data and BLS data.
• Kentucky employment. Firms only report employment of Kentucky residents to the CED. The BLS data includes total employment, regardless of the place of residence of the employee.
Ultimately, we found that approximately a quarter of all companies reported numbers within 5% of the BLS reported total and about half of all companies reported numbers within 15% of the BLS number. In addition, the majority of comparisons actually pointed towards BLS totals being higher than CED totals. This suggests that companies are not mis-reporting their data, in general. In fact, the main issue with the data may be that we could not account for the fact that QCEW data includes employees residing outside Kentucky. Also, we could have incorrectly aggregated some BLS units that were very near each other geo-graphically, resulting in an overestimate of BLS employment for the site. See Figure 5 on page 94 for the distribution of differences between the two datasets.
Anderson Economic Group, LLC 93
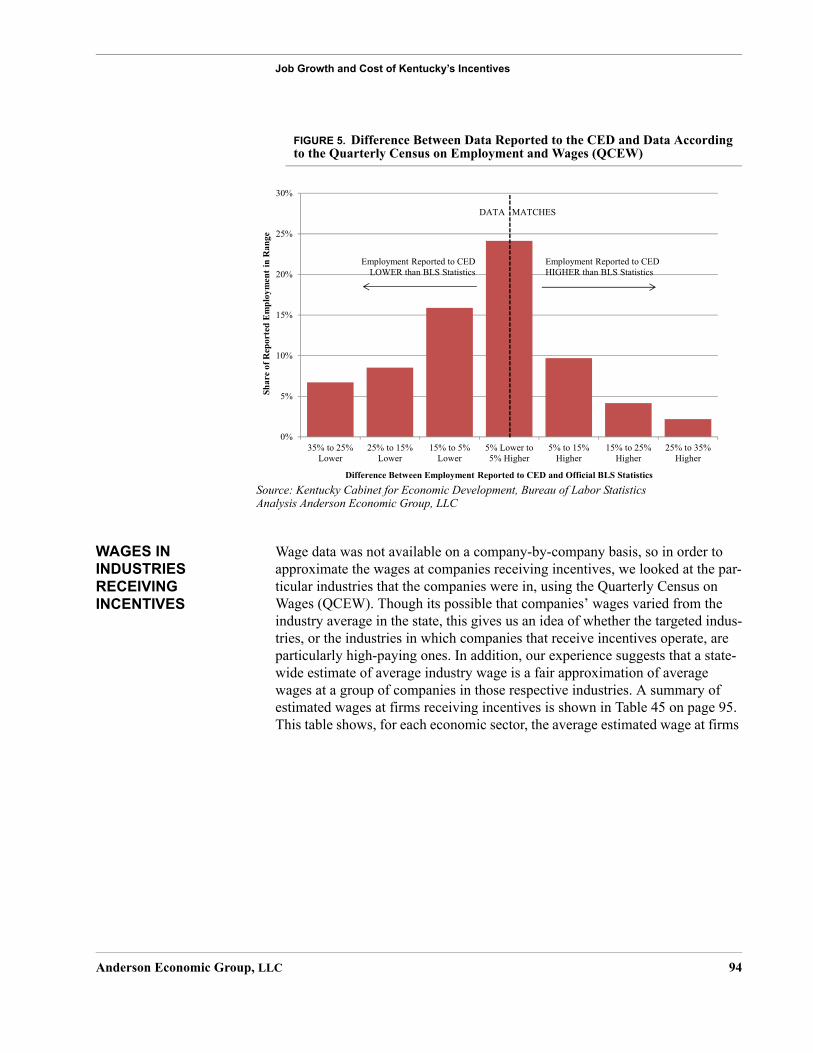
Job Growth and Cost of Kentucky’s Incentives
FIGURE 5. Difference Between Data Reported to the CED and Data According to the Quarterly Census on Employment and Wages (QCEW)
WAGES IN INDUSTRIES RECEIVING INCENTIVES
Wage data was not available on a company-by-company basis, so in order to approximate the wages at companies receiving incentives, we looked at the par-ticular industries that the companies were in, using the Quarterly Census on Wages (QCEW). Though its possible that companies’ wages varied from the industry average in the state, this gives us an idea of whether the targeted indus-tries, or the industries in which companies that receive incentives operate, are particularly high-paying ones. In addition, our experience suggests that a state-wide estimate of average industry wage is a fair approximation of average wages at a group of companies in those respective industries. A summary of estimated wages at firms receiving incentives is shown in Table 45 on page 95. This table shows, for each economic sector, the average estimated wage at firms
0%
5%
10%
15%
20%
25%
30%
35% to 25%Lower
25% to 15%Lower
15% to 5%Lower
5% Lower to5% Higher
5% to 15%Higher
15% to 25%Higher
25% to 35%Higher
Sh
are o
f R
ep
orte
d E
mp
loy
men
t in
Ra
ng
e
Difference Between Employment Reported to CED and Official BLS Statistics
Employment Reported to CED HIGHER than BLS Statistics
Employment Reported to CED LOWER than BLS Statistics
DATA MATCHES
Source: Kentucky Cabinet for Economic Development, Bureau of Labor StatisticsAnalysis Anderson Economic Group, LLC
Anderson Economic Group, LLC 94

Job Growth and Cost of Kentucky’s Incentives
receiving tax incentives compared to the average wage for all companies in Kentucky and the United States, respectively.
Within many sectors, the average wage at companies receiving incentives was lower than the average for all companies in Kentucky, but there is a fair amount of variation. The sectors where there were a significant amount of incentives provided and a higher average wage among companies receiving incentives include professional, scientific, and technical services; administrative, support, and waste management services; information services; and health care services. The largest share of incentives, by far, went to manufacturing firms. The aver-
TABLE 45. Wages at Companies Receiving Incentives Compared to State and National Average
Economic Sector
Share of Companies Receiving
Incentives in Sector
Estimated Average Annual Wage at
Companies Receiving
Incentivesa
Average Annual Wage
at All Companies in
Kentucky
Average Annual Wage
at All Companies in
U.S.
Agriculture and mining 0.6% $43,516 $56,993 $61,944
Construction 1.3% $36,942 $39,792 $47,082
Manufacturing 69.4% $39,814 $41,888 $47,248
Wholesale trade 8.8% $44,863 $50,431 $57,339
Retail trade 1.0% $29,888 $23,101 $24,015
Transportation and warehousing 3.2% $38,601 $42,590 $39,557
Information services 1.8% $48,039 $38,370 $68,459
Finance, insurance, and real estate ser-vices
1.8% $41,001 $45,226 $66,008
Professional, scientific, and technical services
4.9% $46,757 $44,661 $67,226
Management of companies 1.6% $78,485 $78,520 $92,767
Administrative, support, and waste management services
2.5% $31,784 $24,687 $31,986
Educational services 0.0% n/a $23,064 $32,866
Health care services 1.7% $45,217 $38,492 $41,956
Arts, entertainment, accommodation, and food services
0.0% n/a $13,414 $17,888
Other services 1.5% $36,306 $22,342 $26,469
TOTAL 100.0% $41,088 $34,790 $42,403
Note: May not sum exactly due to rounding. Average wages are derived by dividing annual payroll by total employ-ment.Source: Kentucky Cabinet for Economic Development, Quarterly Census on Employment and Wages, U.S. Census Bureau County Business PatternsAnalysis: Anderson Economic Group
a. Due to data limitations, this average wage is approximated based on the industry in which the company receiv-ing an incentive operates.
Anderson Economic Group, LLC 95

Job Growth and Cost of Kentucky’s Incentives
age wage at manufacturing firms receiving incentives was estimated to be somewhat below the statewide average in that sector.
Despite this variation, the overall average wage at firms receiving incentives, at $41,000 per year, was considerably above the statewide average of $35,000. This difference is primarily due to the fact that the lowest-paid sectors in the state do not have access to economic development incentive programs. Sectors that do not have access to state incentives include educational services and arts, entertainment, accommodation, and food services.
CED has begun to track wages more rigorously for the companies receiving KBI incentives. The average wage at the few firms that have begun reporting under KBI is $27 an hour. Going forward, due to improved data collection, we believe it will be possible to analyze wages paid for jobs created at firms receiv-ing incentives.
LIMITATIONS OF ANALYSIS
We do not estimate the jobs directly caused by the incentive. The analysis in this section provides estimates of the reported jobs created and maintained by businesses that received Kentucky incentives after 2000. We do not attempt to estimate the jobs directly caused by the provision of the incentive. In the next chapter, we discuss this issue.
We do not estimate the indirect effects of job creation due to the incen-tives. There is an indirect impact in a region when jobs are directly created, as this economic activity results in more business for local suppliers and as employees spend their money on local retail and services. We do not account for indirect impacts and only look at the jobs at firms directly receiving incentives because we did not estimate how many jobs were directly created by those incentives.
Anderson Economic Group, LLC 96

Evaluating the Effectiveness of Key Incentives in Creating Jobs
VII. Evaluating the Effectiveness of Key Incentives in Creating Jobs
This chapter provides an in-depth analysis of a select group of incentives on their “effectiveness” at creating jobs in Kentucky. By “effectiveness” we mean whether the incentive program generates more investment in Kentucky (and therefore more jobs and higher wages) than other uses of the same funds. The purpose of this analysis is to see how effective an incentive program would have to be than an “alternative policy” of lowering a set of taxes for all business (not just those that receive incentives). The results of this exercise may help policy-makers decide how the state should direct its limited economic development resources, by specifically comparing a reduction in taxes more broadly to focus-ing on specific incentives.
INCENTIVES SELECTED FOR ANALYSIS
We worked with the Legislative Research Commission to identify the incentive programs for a more-detailed analysis based on their size and their perceived importance in the state. The incentive programs we analyzed are:
• Predecessors to the Kentucky Business Investment (KBI) incentive, including Kentucky Industrial Development Act (KIDA), Kentucky Rural Economic Development Act (KREDA), and Kentucky Jobs Development Act (KJDA).
• Bluegrass State Skills Corporation Training Investment Credit (BSSC Credit).
• Office of Commercialization and Innovation (OCI) High-Tech Investment and Construction Pools.
There were four programs that were also of interest to the LRC that we did not select for analysis. Two of them, KBI and the Kentucky Employment Opportu-nity Zone, had too few credits in place in the year we studied (2010) to allow an analysis to be undertaken. Nevertheless, the KBI-predecessors we analyze have a similar structure to KBI, so the analysis of KIDA, KREDA, and KJDA pro-vides valuable information about what an analysis using the same methodology would reveal about KBI. The other two, tourism credits and the Tax Increment Finance program, do not have a purpose or structure that allows them to be ana-lyzed using our model, which is designed to study incentives that encourage business investment and employment. These programs, by contrast, target con-sumption decisions by out-of-state residents.
QUESTIONS FOR POLICYMAKERS EVALUATING INCENTIVES
When evaluating a proposed tax incentive, policy-makers typically want to know two things about the incentives:
1. Is the incentive effective at creating economic activity that would not have occurred otherwise?
2. Is the incentive more effective at creating jobs when compared to all possible alternative uses of the same resources?
Anderson Economic Group, LLC 97

Evaluating the Effectiveness of Key Incentives in Creating Jobs
In the end, an analysis of the true value of an incentive program should account for both questions. Each of these questions is discussed in greater detail below.
Does the Incentive Create Genuinely New Jobs?
The first of these questions, the program’s effectiveness at spurring genuinely new jobs for the state, is difficult to estimate. State and local incentive programs of all kinds are controversial in economics literature for this reason. While most programs require that a firm receiving an incentive report the number of work-ers associated with the incentive they received, there are many reasons why this may not tell policymakers the actual number of new jobs created by the incen-tive. A partial list of factors clouding the picture includes:
• Firms make location decisions based on many factors, including proximity to customers, labor force quality, and many more. If a state is attractive with an incentive program, it is probably an attractive site without one. Where incen-tives can make a difference is “on the margin,” meaning that firms for whom coming to a state is a close call can have an incentive affect their decision. Many firms receiving incentives would likely locate in the state even without an incentive, though they will take an incentive if one is available.
• Firms coming to the state because of an incentive may compete with existing firms in the state for customers, attractive business locations (e.g. near key infrastructure), and skilled workers. In some cases, the new firms may “crowd out” some existing production, employment, and investment in a state.
• Some firms can have value beyond the amount of economic activity they them-selves generate. A firm might, for example, establish a new cluster in the state that then grows on its own without further incentives.
Many of Kentucky’s incentive programs require firms to sign a “but for” agree-ment indicating that they would not have come to Kentucky “but for the incen-tive.” Nevertheless, the true impact of programs is usually not known.
Are There Other Policies That Would Work Even Better?
The second item on the policymaker’s question list, comparing the program to alternatives, is also a difficult task. In principle, it could involve analysis of unlimited other uses of the resources being considered for use on the proposed program. Nevertheless, policymakers must always consider the question: “an incentive is effective at creating jobs compared to what other policy?” Exam-ples of possible alternative policies include:
• General spending on government services.
• Specific investments expenditures, such as education spending or spending on infrastructure.
• Changes in taxes on individuals or businesses.
Many studies of tax incentives do not consider alternative uses of funds dedi-cated to tax incentives, focusing only on whether an incentive generates enough economic activity to “pay for itself” through economic growth. Any evaluation
Anderson Economic Group, LLC 98
Evaluating the Effectiveness of Key Incentives in Creating Jobs
of an incentive that has a cost should consider one or more alternative uses for the resources they use, as our approach does.
AEG APPROACH TO STUDY EFFECTIVENESS
This section lays out the model we use. It first discusses, in broad terms, how our model deals with the questions discussed above. It then presents a descrip-tion of how the model works. Finally, we conclude with specific assumptions that underlie the model for each incentive we studied.
Addressing Questions for Policymakers
We address the questions described above using a simulation model we created. This model answers the question:
“For this incentive program, what proportion of the investment (either in plant and equipment or training of workers) must be genuinely new to the state for the program to perform better than an alternative policy of cutting a broad-based business tax?”
This approach addresses both questions raised above. It names an explicit alter-native policy, and it identifies each program’s “threshold effectiveness,” which is share of new investment the incentive must create to be better than the alter-native policy. As policymakers and economic development officials consider the fate of a particular incentive program, they can compare this threshold effec-tiveness to their own sense of the program’s true effectiveness, which may come from discussing the program with potential recipients and other information sources.
We selected a broad-based cut on a tax affecting business as the alternative pol-icy for comparison because it is a plausible alternative for policymakers who have decided to dedicate state resources to economic development. Further-more, a reduction in taxes affecting business is the most similar alternative pol-icy because, like incentive programs, it targets the decisions of businesses rather than using an altogether different approach, such as direct education expendi-tures to improve the workforce.
How The Model Works
The model compares the change in the affected tax base under the incentive to the change in the affected tax base under the alternative policy (a broad-based cut). By “affected tax base” we mean the economic activity that is subject to a particular tax. For example, the tax base for Kentucky’s corporate income tax is the taxable income (i.e. profit) these companies earn from their operations. Under the incentive program, only the abated tax base (the companies receiving the incentive) receives a tax cut. Under the alternative policy, the entire tax base receives a smaller cut, such that the total amounts devoted to tax cuts are roughly the same.
Anderson Economic Group, LLC 99

Evaluating the Effectiveness of Key Incentives in Creating Jobs
We then estimate the amount of employment and earnings associated with this
change in tax base using state-wide ratios for relevant industries.35 We run this model using different effectiveness parameters until the incentive program and the alternative policy produce the same amount of jobs. This is how we arrive at the output of our analysis: the threshold effectiveness of each incentive pro-gram, described above.
We list the relevant equations and variable definitions in Appendix C, “Effec-tiveness Analysis” on page C-5. For the extensive calculations performed for multiple programs under varying assumptions, we coded these equations and variables into a model using Matlab software.
Alternative Policy Used in Analysis
As discussed above, we compared each incentive program to a plausible alterna-tive policy designed to spur economic development: a broad-based tax cut that affects all businesses. The purpose of selecting a single tax base for each incen-tive is to provide a common basis on which the tax incentive and the alternative policy are evaluated. Most importantly, if the incentive and the alternative pol-icy affect the same tax base, they affect the behavior of firms in the same way. This way, the model is comparing using a targeted approach to using a broad approach to encouraging beneficial business activity. For each program, we identify the tax base most strongly related to the behavior targeted by the incen-tive program, such as business investment in plant and equipment. Table 46 below indicates which tax base we used to model each incentive’s effectiveness.
KBI Predecessors. Three of the incentives (each of them KBI predecessor pro-grams: KIDA, KREDA, and KJDA) are modeled as corporate income tax pro-grams. This is because a company’s corporate income tax liability is often the limiting factor for how much tax credits a company receives because many companies’ credit amount is equal to or close to 100% of their corporate tax lia-
35.For simplicity, in this section we refer to the “jobs created” by an incentive and the alternative policies. This implies a fixed relationship between the amount of investment spurred by a pro-gram or tax cut and the employment associated with the investment.
TABLE 46. Total Size of Affected Tax Base for Selected Tax Incentives
Tax Incentive Tax Base Affected As Modeled
KIDA Corporate Income Tax
KREDA Corporate Income Tax
KJDA Corporate Income Tax
BSSC Credits Individual Income Tax
OCI Real and Personal Property Tax
Analysis: Anderson Economic Group, LLC
Anderson Economic Group, LLC 100

Evaluating the Effectiveness of Key Incentives in Creating Jobs
bility. Through our analysis of CED monitoring data, and discussions with the Department of Revenue, we have learned that on average companies claim only 30% of the amount they are eligible for, which strongly suggests that most com-panies are limited not by the amount of investment they make (which increases the amount they are eligible for), but rather the amount of corporate income tax liability they have.
BSSC Credits. The BSSC Credits provide a reduction in corporation income tax liability for expenditures on the training of workers. Nevertheless, we model the tax change as a change to the individual income tax. This is because the indi-vidual income tax is the tax most strongly related to the incentive for worker earning power to increase through training and education. Unlike investments in buildings and equipment, which are taxed directly by the property tax, there is no direct tax on companies’ expenditures on training. The individual income tax affects the returns to worker training (namely, increased earnings). Therefore, though it is directly paid by workers and not businesses themselves (leaving aside pass-through income for business owners), the individual income tax can be thought of as a tax on the supply of skilled labor businesses look for when making location decisions. As such, a broad-based reduction in the individual income tax would improve workers’ incentive to seek opportunities for training on their own, such as favoring offers from employers offering training, or pay-ing for formal training or schooling.
OCI Loans. The OCI program has a more straightforward interpretation in our model: the incentive amount is proportional to a company’s investment in build-ings and equipment, and is therefore a modeled as a property tax reduction. While nominally loans, the loans are forgiven if companies meet agreed-upon conditions. Therefore, the program is best modeled as a grant. The loan amount is negotiated on a case-by-case basis, and is typically around $250,000. Invest-ments above the negotiated loan amount do not receive additional incentive funds. As such, when modeling this program as a targeted tax cut, we need to make an explicit assumption about the average size of the investments associ-ated with the program. Using data provided by OCI on projected investment, we used an investment amount that was eight times the maximum loan amount, or $2 million, on average.
Additional Assumptions Included in the Model
To model the direct effect of a policy change, we use additional parameters characterizing basic facts about the incentive’s size and nature, behavior param-eters, and employment ratios. Some of these parameters are easily measured directly or otherwise estimated with reasonable certainty. Other parameters, including the behavior parameters, required more professional judgment. The primary factors for each program are described below.
Anderson Economic Group, LLC 101

Evaluating the Effectiveness of Key Incentives in Creating Jobs
The response of businesses to changes in the tax rate. As tax rates change, firms change their behavior. The economic concept used to quantify this change is called the “tax-price elasticity of supply.” This is the proportional change in
tax base due to a proportional change in the tax rate.36 For example, if the tax price elasticity is -0.1, this means that a 10% decrease in a tax rate will result in a 1% increase (which is -10% times -0.1) in the size of the tax base. Such changes account for both increased economic activity and changes in tax plan-ning behavior. Our review of the economic literature suggests a tax elasticity of -0.1 to -0.35, or a 10% reduction in taxes for firms would result in an increase to the tax base of 1% to 3.5%.
For KBI-predecessor programs and OCI loans, we use a value of -0.35, the high end of the range supported by the literature. The companies targeted by these programs are among the most mobile, and, as noted throughout this report, the Commonwealth of Kentucky is situated near several competitor states that pro-vide alternatives. In our view, this means that companies will likely be more cost-sensitive in making location decisions among states in the region.
For the BSSC credit we use a value of -0.2, toward the lower end of the range supported by the literature. This is because workers, who pay the tax that we are modeling for the BSSC credit program, are less mobile than companies making business location decisions.
For the OCI loan program we used a value of -0.35, the high end of the range. The companies targeted by these programs are mobile companies in an eco-nomic sector (high-tech industry) that is sought-after by many states with spe-cifically targeted programs (as discussed in “Kentucky Incentives That Target High-Tech and Knowledge-Based Businesses” on page 60).
RESULTS OF ANALYSIS
We use a model that identifies each program’s threshold effectiveness, which is the share of investment the incentive must create to be better than the alternative policy. Table 47 on page 103 summarizes these results.
36.Timothy Bartik, “The Effects of State and Local Taxes on Economic Development: A Review of Recent Research,” Economic Development Quarterly, vol. 6, no. 1, February 1992. Jay L. Helms. L., “The Effect of State and Local Taxes on Economic Growth: A Time Series-Cross Section Approach,” The Review of Economics and Statistics, vol. 67, no.4, November 1985.Sanjay Gupta and Mary Ann Hoffman, “The Effect of State Income Tax Apportionment and Tax Incentives on New Capital Expenditures,” Journal of the American Taxation Association, vol. 25, supplement, 2003. Alison R. Felix, “Do State Corporate Income Taxes Reduce Wages?” Federal Reserve Bank of Kansas City, Economic Review, 2nd Quarter, 2009.
Anderson Economic Group, LLC 102

Evaluating the Effectiveness of Key Incentives in Creating Jobs
Our analysis indicates the following:
• For the KBI predecessors, which create jobs by incentivizing investments in plant and equipment, approximately one-third of the jobs created must be directly caused by the incentive program to be an improvement on a cut in the state’s corporate income tax.
• At least 21% of the increased wages associated with the BSSC Credits must be caused by the incentive for the program to be an improvement on a broad-based income tax cut.
• The OCI High-Tech Pools had a threshold effectiveness of 71%, meaning that 71% of the investment spurred by the incentive must be caused by the incentive in order for the program to be more effective at creating jobs than a broad-based property tax cut. This level of effectiveness is not plausible and has no precedent in the literature on tax incentives. This program is very likely not effective as a spur of investment compared to a broader approach.
Threshold Effectiveness in Perspective
Once we have estimated the threshold effectiveness, the logical next questions are:
1. How effective are these programs in the real world compared to this effective-ness threshold?
2. What does it mean if we think an incentive program is less effective at creating jobs than the alternative policy evaluated?
We discuss these questions below.
How effective are these programs in the real world compared to this effec-tiveness threshold?
While we do not have the definitive answer to this question, we can assess how plausible it is that these programs exceed the threshold.
TABLE 47. Effectiveness of Incentives Versus Lower Tax Policy
Threshold Effectivenessa
a. Minimum percentage of jobs created at firms receiving incentive that must be caused by the incentive for incentive to be more effective than alterna-tive policy.
KIDA 36%
KREDA 36%
KJDA 35%
BSSC Credit 21%
OCI Loans 71%
Source: Kentucky Cabinet for Economic DevelopmentAnalysis: Anderson Economic Group, LLC
Anderson Economic Group, LLC 103
Evaluating the Effectiveness of Key Incentives in Creating Jobs
To do so, we reviewed a set of studies that examine the impact of business tax changes on employment. The results of these studies inform a rough estimate of the increase in employment we would expect these incentives to cause. The pre-vailing literature on the effects of state tax reduction for businesses suggests that incentives that lower a firm’s taxes by 100% result in an increase in employ-ment of roughly 30%, on average. Correspondingly, a tax reduction of 50%
would result in a 15% increase in employment.37
We can compare the number of jobs we expect to be directly caused by these tax changes to the number of jobs reported by companies receiving incentives. Using the “jobs created” estimate shown in “Job Creation at Firms Receiving Incentives” on page 80, the average increase in employment at companies receiving incentives was 72%. In many cases, we expect that the tax credits pro-vided by incentives offset a firm’s entire corporate income tax liability. If this were true for all firms, and if firms targeted by incentives responded to changes in taxation in a way that is consistent with the literature described above, then
the effectiveness of these incentives was approximately 40%, on average.38 If, on the other hand, the share of tax liability offset by incentives for these firms was closer to 50%, then the effectiveness of these incentives was approximately 20%, on average. In sum, a plausible share of the jobs reported by firms receiv-ing incentives that were directly caused by receipt of the incentive is 20% to 40%.
To be clear, effectiveness is a measure that is contingent on how effectively the state provides incentives only to those companies that would not have moved to or expanded in the state if not for the incentive. If the state has done a particu-larly good job at targeting companies that would not have increased employ-ment but for receiving incentives, then the effectiveness of these programs is higher than the 20%-40% range estimated above. If, on the other hand, many of the jobs created under these programs are at firms that would have increased their employment even without the incentive, then the effectiveness is lower.
37.These are rough estimates, but they provide a plausible range of tax effects. Studies reviewed that led to this conclusion are:Timothy J. Bartik, “The Effects of State and Local Taxes on Economic Development: A Review of Recent Research,” Economic Development Quarterly, vol. 6, no. 1 (Feb. 1992), pp. 102-110.Alan Peters and Peter Fisher, “The Failures of Economic Development Incentives,” Journal of the American Planning, vol. 70, no. 1 (Winter 2004).Joseph M. Phillips and Ernest P. Goss, “The Effect of State and Local Taxes on Economic Development: A Meta-Analysis,” Southern Economic Journal, vol. 62, no. 2 (Oct. 1995), pp. 320-333.
38.We calculate this 40% effectiveness figure by dividing the increase in jobs that is directly attributable to receiving the incentive under 100% decrease in taxation (30%) by the increase in jobs reported by firms receiving an incentive (72%). We then round the result to the nearest ten percent since it is a rough estimate intended only to provide a plausible range.
Anderson Economic Group, LLC 104
Evaluating the Effectiveness of Key Incentives in Creating Jobs
Given this analysis, the effectiveness thresholds we find for the KBI predeces-sor incentives and BSSC Credits are in the middle-to-high range of what effec-tiveness we expect these incentive programs have achieved. The notion that these programs are better than a broad-based tax reduction is certainly plausible. By contrast, it is more difficult to make the case that the OCI High-Tech Pools program is more effective than the threshold. In order for the OCI High-Tech Pools program to be more effective at creating employment than a more broad-based alternative, the OCI would have to be doing a remarkably good job of determining which businesses require the incentive to move into the state or expand.
What does it mean if we think an incentive program is less effective at cre-ating jobs than the alternative policy evaluated?
Stepping back further, we should note that the specific approach that our model takes, while useful, does not address every question policymakers should ask about a prospective incentive program. Exploring a program’s “effectiveness compared to a broader tax reduction,” as we do, is one of several factors that should be considered, and programs believed to be operating below their thresh-
old effectiveness can still be worth doing.39 Possible benefits beyond a simple measure of “increased employment” include:
• Employment increases in particular geographic areas, labor market segments (such as “unskilled” workers or the long-term unemployed), or industries can provide more benefits to the state than the “average” job created in the econ-omy, for several reasons. For example, someone who is part of the “long-term unemployed” group likely pays few taxes and uses more government services than the average resident of Kentucky.
• Increased activity in a particular industry thought to be strategically important can have more important long-run benefits than the “average” bit of growth in the state’s economy. Though economists are generally skeptical of anyone hav-ing the ability to determine what these industries are ahead of time for a particu-lar state, most states engage in at least a small amount of “industrial policy” with the hope of seeding the development of a new growth cluster in their state.
CONCLUSION Overall, we reach the following conclusions based on our analysis:
• Policymakers should compare a proposed program’s performance to that of an alternative use of the funds, such as a broader-based tax reduction or investment by the state in education or infrastructure, and think about what level of jobs creation or investment caused by the incentive makes the incentive worth doing.
• Our model shows that comparing incentive programs to an alternative policy using broad-based tax cuts sets a bar for programs to clear, requiring that the
39.For a good review of “best practices” and when incentives are worth doing see: Timothy J. Bartik, “Solving the Problems of Economic Development Incentives,” W.E. Upjohn Institute, 2007.
Anderson Economic Group, LLC 105

Evaluating the Effectiveness of Key Incentives in Creating Jobs
programs we studied surpass a certain threshold effectiveness (a certain propor-tion of the claimed jobs created or earnings increase be genuinely new to the state) to be considered better at attracting investment and jobs than the alterna-tive use of funds.
• Based on a review of academic studies in the economics literature, a plausible share of the jobs reported by firms receiving incentives that were directly caused by receipt of the incentive is 20% to 40%. Each of the KBI predeces-sor programs evaluated, KIDA, KREDA, and KJDA have a “threshold effec-tiveness” of over 35%. The BSSC Credit’s “threshold effectiveness” is 21%. On balance, it is plausible, but by no means certain, that these programs are effec-tive at spurring economic development when compared to a broader-based tax cut.
• The OCI loan program has a threshold effectiveness of 71%, a level of effec-tiveness that has no precedent in the literature on tax incentives. This program is very likely not effective as a spur of investment and employment compared to a broader approach.
• “Effectiveness compared to a broader tax reduction” is not the only consider-ation by which an incentive program should be judged, and programs below their threshold effectiveness can still be worth doing. While a broad-based approach may, in some cases, create more employment, new employment or additional worker training in depressed areas or economic sectors may be con-sidered by some to be more socially beneficial than a new job filled by a worker moving from out of state. Furthermore, employment in strategically important industries may also be more beneficial than the “average” job created by an eco-nomic development program. We describe the specific purposes of Kentucky’s business incentive programs in “Purpose of Business Incentives” on page 21.
COMPARISON TO UNIVERSITY OF KENTUCKY STUDY
As we conducted the research for this report, we were aware that many readers will have read another study of the Commonwealth of Kentucky’s business incentive programs completed several years ago by University of Kentucky
(UK) scholars.40 This section briefly discusses the how the approach and results of that study are related to our work in this report.
Different Approaches to the Problem of Studying Incentives
The UK study takes a different approach than ours. We conduct a model-based study that (as discussed in “Results of Analysis” on page 102) explores the rela-tionship between incentives and alternative policies, showing what would have to be true about the programs’ effectiveness for them to clear the standard set by a plausible alternative approach (broad-based tax reductions). The UK study, by contrast, is an empirical study that attempts to shed light on the actual economic situation (change in employment, change in earnings, earnings per job, and
40.William Hoyt, Christopher Jespen and Kenneth Troske, “An Examination of Incentives to Attract and Retain Businesses in Kentucky,” University of Kentucky Center for Business and Economic Research (CBER), 2007.
Anderson Economic Group, LLC 106
Evaluating the Effectiveness of Key Incentives in Creating Jobs
change in property values) in counties where incentives were awarded. The study looks at what happened in the economic data after an incentive is awarded.
A Common Thread: No Claim of Causation
Though our study and the UK study take different approaches, they have at least one key aspect in common: neither attempts to quantify the amount of increased economic activity caused by the incentive programs (i.e. employment and earn-ings growth that would not have happened without the program, after account-ing for “crowding out” of existing local businesses and other factors). As discussed in “How The Model Works” on page 99, our study assesses what pro-portion of reported jobs would have to be caused by an incentive program for the program to perform better than an alternative policy; we do not claim to have shown how effective these programs actually are.
The UK study is similar in this respect. The study’s empirical findings on the relationship between incentives and growth are all expressed using terms that do not imply causation, such as “jobs associated with” an incentive program; when economic activity is found to be higher in counties with more incentives, the authors are not claiming that this is because of the incentives. This is the proper way to express these results because, when there is a relationship between two factors (i.e., find that they are “associated with” each other), there are many pos-sible explanations for this relationship other than one having caused the other. One possible explanation is that the causation goes in the opposite direction from what the analyst expects. Another possible reason for an “association” between variables is that a third factor, which hasn’t been measured, could be causing both of the measured factors to change together.
In short, the authors of the UK study have, by using non-causal language, prop-erly acknowledged that they have identified associations between incentives and economic activity, but not necessarily a causal link. Causation is notori-ously difficult to prove without a careful experiment planned ahead of time, for the reasons discussed above in “Questions For Policymakers Evaluating Incen-tives” on page 38.
Similar Results Between the Two Studies
It is reasonable to ask: do the AEG and UK studies agree with each other? Our study and the UK study use different approaches to shed light on the Common-wealth of Kentucky’s business incentive programs, and do not have directly comparable results. Nevertheless, it would be possible for the studies to have findings that provide evidence pointing in opposite directions. For example, if our study found a very low “threshold effectiveness” for an incentive (meaning the incentive would be a net job creator compared to a tax cut even if it weren’t very effective), but the UK study found a negative association between the incentive program and employment growth, the results would be in conflict.
Anderson Economic Group, LLC 107

Evaluating the Effectiveness of Key Incentives in Creating Jobs
The results of the two studies show no such conflicts. The qualitative results of each study are summarized in Table 48 below, which shows that, for each type of incentive, the two studies do not show an apparent conflict.
Note that this lack of apparent conflict does not change the meaning of the results of either study. We present this comparison simply because we under-stand that the UK study may also be read by many readers of this report.
TABLE 48. Qualitative Comparison Between AEG and UK Results
Credit/Type
AEG Relative Result (Threshold effectiveness
compared to other incentives studied)
UK Relative Result (Associated economic
activity compared to other incentives studied) Comment
BSSC Tax Credits Lowest threshold Highest economic activity Results do not conflict
KBI-predecessors/Tax credits Middle threshold Middle economic activity Results do not conflict
OCI/Financing programs Highest threshold Lowest economic activity Results do not conflict
Source: University of Kentucky CBER, Anderson Economic Group LLCAnalysis: Anderson Economic Group LLC
Anderson Economic Group, LLC 108

Analysis of Reporting and Other Requirements
VIII. Analysis of Reporting and Other Requirements
In “Characteristics of Well-Designed Incentive Programs” on page 22, we dis-cuss the process of designing goal-oriented incentives. We note that all incen-tive programs should have metrics to help the state evaluate their effectiveness. Regular and transparent monitoring and reporting on incentive metrics and goals can help states create effective development policies. This section reviews some principles of effective monitoring, reporting, and evaluation of incentive programs. It also includes a survey of reports on incentive programs in Ken-tucky to determine the extent to which the state complies with these principles in implementing incentive programs. We provide:
• A brief description of effective monitoring, reporting, and evaluation for state incentive programs;
• An overview of Kentucky’s incentive monitoring and reporting requirements;
• A comparison of Kentucky’s policies with the peer states; and
• A discussion of the strengths and weaknesses in Kentucky’s monitoring, report-ing, and evaluation requirements.
CHARACTERISTICS OF EFFECTIVE INCENTIVE PROGRAM MONITORING, REPORTING, AND EVALUATION
While incentives may have slightly different purposes, there are general prac-tices that lower governmental cost and improve the effectiveness of incentives. Some aspects of well-designed and administered incentive programs include:
1. Transparency. Because economic development programs are funded by the state using taxpayer dollars, transparency is just as essential for incentives as it is for the budget process. Keeping the public and business community informed about how their taxes are spent will help the state garner support for its pro-gramming. Building public trust for economic development programs can be achieved by regularly providing data and rigorously enforcing incentive requirements.
2. Monitoring. Monitoring is the practice of evaluating the performance of com-panies receiving incentives. Monitoring data is helpful for analyzing whether each incentive is delivering the intended result, and if not, why. If a program is not meeting the prescribed criteria, then a state can take action and change the program or cancel it. Monitoring data should be collected on a regular basis. If an incentive requires an outcome that cannot be regularly measured, then the incentive is not well designed.
3. Fiscal and Economic Impact Analysis. Every incentive program involves tax-payer dollars that could have been used for another purpose, either by the state or by taxpayers themselves. In order for a state economic development agency to know if investment in a business is the best way to use taxpayer dollars, the state should perform some type of economic impact analysis. An economic impact analysis can take several forms. At minimum, it should study the number of jobs firms report having created as a result of the incentive. If possible, a study should compare jobs reported as created to some sort of benchmark to assess what share of the jobs created under the incentive might have been cre-
Anderson Economic Group, LLC 109

Analysis of Reporting and Other Requirements
ated anyway without the incentive. A fiscal impact analysis will first look at the gross cost of the incentive to the state, meaning the money appropriated and tax revenue foregone due to the incentive programs. In addition, a fiscal impact analysis can give the state an idea of its return on investment (ROI), and allow it to compare provision of the incentive to other policy options.
4. Evidence-Based Policy Making. Each of the above aspects is important for any state incentive program; however, reporting and monitoring are not benefi-cial unless they help to inform policymaking. For this reason, members of the legislature should regularly review the information about state incentives and re-evaluate their incentive strategy based on results.
In order to systematically analyze program monitoring, reporting, and evalua-tion, we have proposed a list of five questions that capture the extent to which reporting on incentive programs complies with the above principles. These questions are:
1. Jobs and Investment: Do reports clearly enumerate jobs created, jobs retained, and/or investments made by companies receiving incentives, along with the jobs and investments required in order to qualify for or maintain the incentive?
2. Cost: Do reports show the cost of each program to the state, including revenue forgone for tax credits, exemptions, and abatements?
3. Economic Impact: Do reports on jobs created include a rigorous assessment of economic impact? In other words, does the state perform an economic analysis that accounts for which jobs might have been created even in the absence of an incentive, or if jobs and investment at incentivized companies are competing with and replacing other companies in the state?
4. Comprehensive: Are the assessments provided comprehensive, including all incentive programs?
5. Regular Reporting: Are the assessments provided on an annual or regular basis (for example, every 2 or 5 years)?
In the following two sections, we will use these five questions to help identify the extent to which Kentucky’s reporting, monitoring, and evaluation of incen-tive programs comply with the principles described above. In the next section, we compare Kentucky’s performance with that of competitive peer states. Finally, we make some suggestions on how Kentucky could improve its moni-toring and reporting of incentive programs.
KENTUCKY’S MONITORING OF INCENTIVE PROGRAMS
To keep track of the performance of various loans, grants, and credits, the Ken-tucky Cabinet for Economic Development (CED) and the Kentucky Tourism, Arts, and Heritage Cabinet (TAHC) have monitoring systems in place. The TAHC requires annual reports from firms receiving incentives, depending on the incentive, that outline which investments were made in the state and their cost, the amount of taxes paid, and/or the number of patrons from out of state.
For firms receiving incentives that require job creation at a given wage level, the CED is provided annually with a list of all employees and their wage levels.
Anderson Economic Group, LLC 110
Analysis of Reporting and Other Requirements
Recently, this system was changed so that CED monitors the same firm several times a year and averages the results over the course of the year, preventing a firm from increasing employment only temporarily to meet incentive require-ments. (We show in “Confirming Results with BLS Data” on page 92 that this was not a widespread issue.)
It was our experience that the CED and TAHC monitoring practices were effec-tive. They generally received thorough accounting of investment, jobs, and wages, when appropriate, from firms receiving incentives. We should note, however, that data sets kept by the CED to track these records were often diffi-cult to follow and riddled with errors.
Though one expects a certain amount of data errors in records of thousands of firms undergoing a complex set of requirements over several years, some of the mistakes were avoidable. For example, for the same incentive within the same firm, the data that was supposed to represent the number of jobs required or actually present at the firm sometimes would reflect new jobs since receiving the incentive and other times reflect total employment at the firm. These types of errors were prevalent enough that we estimated our own numbers for required and total jobs in order to report consistent results. These sorts of issues might be avoided if reporting requirements mandated greater detail and unifor-mity.
REPORTS TO THE KENTUCKY LEGISLATURE ON INCENTIVES
The CED and the TAHC are required to provide various reports about economic development incentive programs to the legislature on an annual or semi-annual basis. In addition, the CED maintains a comprehensive database that contains information about each incentive provided to companies over time.
We found that, though they often contain relevant information and make valu-able recommendations, reports to the legislature on Kentucky’s economic devel-opment incentive programs are inconsistent, focusing on incentive programs separately with varying levels of detail. The following sections briefly discuss these reports in the context of the questions outlined above.
For the following analysis, we reviewed 25 reports, some of them for multiple years and entities. Only five of these reports were available online. The remain-der were provided in hard copy by state agencies. See Appendix C for a com-plete list of reports reviewed for this analysis.
Jobs and Investment
Do reports clearly enumerate jobs created, jobs retained, and/or investments made by companies receiving incentives, along with the jobs and investments required in order to qualify for or maintain the incentive?
Mandatory annual reports provided to the legislature for many programs do pro-vide an estimate of the investments that companies receiving incentives plan to
Anderson Economic Group, LLC 111

Analysis of Reporting and Other Requirements
make and the requirements that companies must fulfill in order to continue to qualify for incentives. However, we found only five reports which presented the number of jobs created once the incentive was in place, covering only a portion of the programs funded by state economic incentives.
The five reports containing information on jobs created after disbursement of funds were the Bluegrass State Skills Corporation annual report, the Office of Commercialization and Innovation performance report (which provided infor-mation on a broad range of programs overseen by the OCI), the Kentucky Eco-nomic Development Finance Authority monthly construction activity reports, Kentucky Enterprise Initiative Act annual reports, and Economic Development Bond pool reports.
In addition, the database on the CED website is comprehensive and provides information on planned investments and job creation required for each company receiving an incentive, but, until recently, it did not provide updated information on how many jobs are actually being created or the size of actual investment. Only recently has the CED begun making more comprehensive updated infor-mation available on jobs created and investments made, but as of yet, this infor-mation is only available for Kentucky Business Investment and Kentucky Reinvestment Act incentives.
Costs
Do reports show the cost of each program to the state, including revenue forgone for tax credits, exemptions, and abatements?
There are three ways in which economic incentives result in gross costs to the state: grants, tax credits, and loans (which often result in a net return for the state). We found that CED’s online database and almost all reports to the LRC showed the total approved amount of funds that could be distributed to compa-nies through tax credits, grants, or loans; however, only a few reports showed the total amount of money claimed by companies on an annual basis.
Due to the performance-based nature of most incentive programs in Kentucky, there is a large difference between the amount approved for an incentive and the amount actually paid out in many cases, as shown in “Gross Cost of Incentives” on page 87. Also, companies can defer collection on credits. For these reasons, it is not possible to approximate the actual cost to the state of these programs on an annual basis by looking at the approved amount. Even the state’s Compre-hensive Annual Financial Report and other budget documents did not separately enumerate the funds that went to tax credits for economic development incen-tives.
There were a few reports that included the amount of money spent on individual programs. The CED has recently begun to report this information for KRA and
Anderson Economic Group, LLC 112
Analysis of Reporting and Other Requirements
KBI incentives on its online database. In addition, KEDFA financial statements showed total collections and interest paid on loans made through the Direct Loan Program. Others include the BSSC annual report, the OCI annual perfor-mance report, the TAHC report on tourism credits, the TAHC report on film credits, KEDFA monthly construction activity reports, and Economic Develop-ment Bond pool reports.
Economic Impact
Do reports on jobs created include a rigorous assessment of economic impact? In other words, does the state perform an economic analysis that accounts for which jobs might have been created even in the absence of an incentive, or if jobs and investment at incentivized companies are crowding out other state industries?
No regular reports submitted to the LRC have included an economic impact study. The only report we found resembling an economic impact study was car-ried out by the Center for Business and Economic Research, and commissioned
by the CED in 2006.41 Though it was not a conventional economic impact study, the authors sought to determine the impact that incentives had on regional economic growth.
Ideally, any economic impact study performed would compare the impact of incentives to the projected economic impact of one or more plausible alternate policies. This would allow the legislature to optimize the impact of taxpayer funds.
Comprehensive
Are the assessments provided comprehensive, including all incentive pro-grams?
Though almost all incentives were mentioned at least once in annual reports, there was a wide range of content in the reports. There was no standardized way of reporting information. Some reports included jobs numbers, while others did not. Some reports included details about companies receiving incentives or made recommendations about potential changes to the program, while others consisted of only one or two sentences saying how much money was spent or approved. Ideally, where appropriate, information on all incentives would be available within one comprehensive report that reported details in a consistent way.
41.William Hoyt, Christopher Jepsen, and Kenneth R. Troske, “An Examination of Incentives to Attract and Retain Businesses in Kentucky,” Center for Business and Economic Research, Submitted to the Kentucky Cabinet for Economic Development, January 18, 2007.
Anderson Economic Group, LLC 113

Analysis of Reporting and Other Requirements
Regular Reporting
Are the assessments provided on an annual or regular basis (for example, every 2 or 5 years)?
Every report we reviewed was provided on an annual, semi-annual, or even monthly basis.
MONITORING, REPORTING, AND EVALUATION IN THE PEER STATES
This section provides a brief description of monitoring, reporting, and evalua-tion in Kentucky’s peer states. Table 49 on page 115 indicates how Kentucky and its peers perform on the five questions presented in “Characteristics of Effective Incentive Program Monitoring, Reporting, and Evaluation” on page 109.
Of the 13 peer states in this analysis, three—Alabama, South Carolina, and Ten-nessee—do not provide official reports on the number of jobs at firms receiving incentives or on the cost of their incentive programs. Three other states—Geor-gia, Illinois, and West Virginia—provide extensive job and cost information annually for certain programs, but not for all incentive programs. Reporting in Georgia, Illinois, and West Virginia is similar in level and scope to reporting in Kentucky.
Nearly half of the peer states have performed a study involving some type of economic impact analysis on their incentive programs. Of those six states, only Arkansas performs an economic impact study regularly.
Anderson Economic Group, LLC 114

Analysis of Reporting and Other Requirements
TABLE 49. Incentive Monitoring and Reporting in Kentucky and Peer Statesa
State Jobs Cost Economic Impact ComprehensiveRegular
Reporting
Kentucky yes-for select programs
yes-for select programs
no no yes-for select programs
Incentive Programs BSSC grants and tax
credits, OCI, KEIA
BSSC grants and tax
credits, OCI, KTDA, KFTC, KEDFA Loans
BSSC grants and tax
credits, OCI, KEIA, KEDFA loans, KTDA,
KFTC
Alabama no no no no no
Arkansas yes yes yes yes yes-including economic
impact
Georgia yes yes no no yes
Illinois yes yes no no yes
Indiana yes nob no yes no
Missouri yes yes yes yes yesc
North Carolina yes yes yes yes yes
Ohio yes yes yes yes yes
South Carolina no no no no no
Tennessee nod no no no no
Texas yes yes yes yes no
Virginia yes yes yes yes yes
West Virginia yes yes no no yes
Source: Kentucky Cabinet for Economic Development; Pew Center for the States; state government websites and economic development websitesAnalysis: Anderson Economic Group
a. We only were able to confirm the presence of information that is available online. This survey does not include informa-tion that might be made available to the legislature but is not readily available to the public.
b. In Indiana, annual cost numbers are provided only for grant spending.
c. In Missouri, annual reports are only available on the cost of tax credit programs. They do not show jobs created annually.
d. In Tennessee, the only report we could find that provides job and cost information is for the Historic Preservation Tax Credit. The Department of Economic & Community Development annual report shows cost per job but neither total jobs nor cost.
Anderson Economic Group, LLC 115

Analysis of Reporting and Other Requirements
STATUTORY REPORTING REQUIREMENTS FOR KENTUCKY’S INCENTIVE PROGRAMS
Though some state agencies provide good information on incentive programs, especially the CED with its online database, there is not always a statutory requirement to do so. Agencies publish information because the legislature requires that they do so, but also voluntarily, at times. We surveyed all of the legislation that established the incentive programs reviewed in this report, and found that only a few had explicit requirements to submit reports to the LRC, the legislature, or the Governor.
We found that the law requires reporting to the LRC, the General Assembly, and/or the Governor for the following incentive programs:
• Office of Commercialization and Innovation. State law requires that the Ken-tucky Innovation Commission, which works with KEDFA to administer OCI programs, report to the Governor and the General Assembly annually, to dis-cussing certain performance indicators, measure progress in advancement of knowledge-based industries, provide information on all high-tech incentive pro-grams, and make recommendations on how to improve performance. This infor-mation is contained in the OCI annual report discussed in the previous section, and available online to the public.
• Bluegrass State Skills Corporation. The BSSC is required to submit an annual report within 2 months of the end of the fiscal year to the LRC and to the Gover-nor. The report is required to include descriptions of all incentive programs funded (i.e. the tax credit program and the grant-in-aid program), an evaluation of the performance of each program, a summary of expenditures, and a detailed description of the participants in each program.
• Kentucky Enterprise Initiative Act. KEDFA is required to submit a “complete and detailed report” of the use of sales and use tax incentives and participation of approved companies after each fiscal year to the LRC and to the Governor.
• Kentucky Tourism Development Act. The Tourism Development Finance Authority, which is housed within the Tourism, Arts, and Heritage Cabinet is required to provide the LRC with an annual report that also must be published on the TAHC web site. The report is required to include detail information on all KTDA projects, including terms of agreements and amount of credits recov-ered in the previous fiscal year. In addition, the report should include applica-tions submitted, applications receiving approval, and the total dollar amount approved for recovery in the previous fiscal year.
• Film Credits. The Tourism Development Finance Authority is also required to submit a report on film credit projects that contains the same information as the report for KTDA projects, as shown above.
• Incentives for Energy Independence Act. KEDFA and the Dept. of Revenue are required to jointly prepare a report for the LRC each year including a list of all companies with IEIA incentives and a detailed summary of the terms.
• Tax-Increment Financing Districts. The State TIF Commission is required to provide the Governor and the LRC with an annual report that contains a list of applications with detailed information on applicants, the approved applications, and a summary of commitments made by the state.
Anderson Economic Group, LLC 116
Analysis of Reporting and Other Requirements
Note that many of the programs with rigorous reporting requirements show up in our assessment in “Reports to the Kentucky Legislature on Incentives” on page 111. This suggests that agencies only tend to provide a significant amount of information if they are statutorily required to do so. A notable exception to this is the comprehensive online database maintained by the Cabinet for Eco-nomic Development. The CED voluntarily maintains a high level of transpar-ency by maintaining a website showing, for each incentive program that the CED administers, each company that receives incentives along with details of the agreement entered into by that company.
RECOMMENDATIONS There are at least a few ways in which Kentucky could improve its reporting and evaluation of incentive programs.
• Consider statutorily requiring that information available on the CED web-site be reported. As described in “Statutory Reporting Requirements for Ken-tucky’s Incentive Programs” on page 116, with the exception of a few programs (BSSC, OCI, KBI, KTDA, IEIA, TIF, and Film credits), there are few reporting requirements regarding what needs to be provided to the LRC, the legislature, or the Governor. Even among those programs with reporting requirements, there is a fair amount of variation in what needs to be provided. Despite this, the CED makes information publicly available and continues to increase transparency. This transparency is currently voluntary.
The state does not require that the CED maintain a comprehensive database on its website, so changes in management or procedure at the CED could very pos-sibly result in less rigorous maintenance of the site or an end to this practice altogether. If the legislature prizes this level of transparency, then they may want to make maintenance of this public site a statutory requirement.
• Maintain quality annual reports from BSSC and OCI. The Bluegrass State Skills Corporation and the Office of Commercialization and Innovation each provide an annual report that is easily accessible to the public. These reports are comprehensive, delving into details about the programs that each entity pro-vides and the companies which are taking advantage of their programs. The OCI, in particular, does an impressive job of summarizing activity in the many different programs that the Office provides, often including specific details about companies receiving funding. Though the BSSC could probably include some more detail about recipient companies, it provides a full list of all compa-nies receiving funds, with how many funds they receive and the number of employees to be trained. These reports reflect a high level of transparency, and these entities should continue to maintain and improve their quality.
• Produce one comprehensive, annual summary report. The information on Kentucky’s incentives is scattered and incomplete. Some reports, such as those for OCI and the BSSC, had comprehensive information on job numbers and cost for a range of programs, while other reports consisted of merely a sentence stating how much money had been spent on the program in the past year. We recommend that comprehensive information on all of Kentucky’s incentive pro-
Anderson Economic Group, LLC 117

Analysis of Reporting and Other Requirements
grams be produced annually, with consistent and comparable details available on each program. If this information could be provided though one annual report, that would be even better. Such a reform would require collaboration between the TAHC and the CED on monitoring and reporting standards.
Summary measures that could be included in the report include jobs created or retained by program, investments made by program, amount of revenue forgone due to tax credits and/or grants by program, number of new projects receiving final approval, and many others.
• Maintain consistent monitoring and data definitions to allow for easier tracking of performance by incentive. We found that monitoring data was often inconsistently tracked, and errors were common. A comprehensive report can only be completed year-to-year if there are consistent monitoring and data definitions in place that allow for better tracking of requirements. Agencies will be required to collect data with the knowledge that it will eventually need to be compiled and presented, and they are likely to maintain internal standards that make production of such a report easier. Even in the absence of such a report, agencies involved in monitoring compliance with incentive programs should be rigorous about consistent monitoring and maintaining easily understandable and accessible data.
Anderson Economic Group, LLC 118

Analysis of Process Selecting the CED Secretary
IX. Analysis of Process Selecting the CED Secretary
KENTUCKY’S STATUTORY REQUIREMENTS
Kentucky statute 154.10-040 states the process for the selection and appoint-ment of the secretary of the Cabinet for Economic Development (CED). The statute states:
(1) In the selection and appointment of the secretary, the board shall set the qualifica-tions for the position of the secretary, employ a national search firm, and conduct a nationwide search for candidates, and select from the list three (3) candidates for secre-tary of the Cabinet for Economic Development. The names of the three (3) candidates shall be submitted to the Governor who shall choose one of them as secretary, except that, if the Governor so chooses, he may reject the first list of names and direct the board to submit a list of three (3) additional names, from which he shall appoint the sec-retary. Once appointed, the secretary shall serve at the pleasure of the board.(2) The secretary shall be a person with significant experience and established reputa-tion as an economic development professional.
TIMELINE OF THE CABINET SECRETARY SEARCH
The Kentucky Economic Development Partnership (KEDP), which governs the CED, is responsible for hiring a search firm to find eligible candidates for the position of secretary. The most recent contract for a nationwide search began in 2009. The time line for this search was as follows:
1. A Request for Proposals (RFP) was issued on December 30, 2008 for the hiring of a search firm responsible for finding qualified candidates for the position of secretary of the CED. The RFP stated that the candidates must have an “estab-lished reputation as an economic development professional.” The RFP also stated that the search must be nationwide.
2. The KEDP hired The Pace Group on March 25, 2009. The firm was awarded $70,000 to conduct the nationwide search, which was to conclude with the pre-sentation of five finalists for the position.
3. On August 5, 2009, the KEDP adopted Resolution 09-02 that submitted three names to the governor for final appointment to the position of secretary of the CED.
4. On August 7, 2009, Kentucky Governor Steve Beshear announced the appoint-ment of Larry Hayes as secretary of the CED. Mr. Hayes was previously the secretary of the Governor’s Executive Cabinet and had been acting secretary for the CED since September of 2008.
The process of selecting the current secretary of the CED met statutory require-ments.
SALARY COMPARISON WITH PEER STATES
Using state websites and public documents, we identified Larry Hayes’ counter-
part in the 13 peer states.42 We show the agency, title, method of appointment, and most recent salary for Mr. Hayes’ counterparts in Table 50 on the next page.
Kentucky’s secretary of the CED has the highest salary of the peer states. We studied organizational charts and job descriptions to determine the appropriate counterpart in each state. We also compared the salary reported for these agency
Anderson Economic Group, LLC 119

Analysis of Process Selecting the CED Secretary
leaders on state websites with the annual salary reported for the “economic development head” (with limited further description) by the Council of State Governments in The Book of States 2011. After analyzing data from both sources, Mr. Hayes annual salary is $250,000, which is on average $100,000 more than his peers.
Caution When Using Salary Figures. We caution against using the salary fig-ures reported in Table 50 on page 121 as a perfect apples-to-apples comparison for the following reasons. First, we reported the listed salary, but there could be other compensation components for heads in other states. Second, Kentucky has very specific requirements for its secretary of CED, including having extensive experience and an established reputation in the field. Other states may not require as high profile of a person for this position. Third, there may also be statutory requirements and limitations in other states that affect compensation. Finally, the requirements of the job are most likely different in each state, depending on the status of the economic development agency and the bureau-cratic structure.
Other Salary Figures. During our review of public-private partnerships and semi-public economic development corporations, the salary for the head of these organizations appears to be over $150,000 and often more than $200,000. For example, the CEO of the Michigan Economic Development Corporation, a public-private partnership serving as the state’s marketing arm and lead agency for attracting businesses, earns $200,000. The CEO of the Charlotte, North Car-olina, Regional Partnership receives between $250,000 and $300,000. The CEO
of the Kansas City Area Development Corporation receives $210,000.43
42.We define counterpart as the highest ranking person in the government entity that focuses its efforts on economic development and is responsible for administering the majority of the state’s incentive programs.
43.Data taken from a presentation by The PACE Group titled “Salary Analysis and Market Com-parison,” provided by the Cabinet for Economic Development on May 1, 2012.
Anderson Economic Group, LLC 120
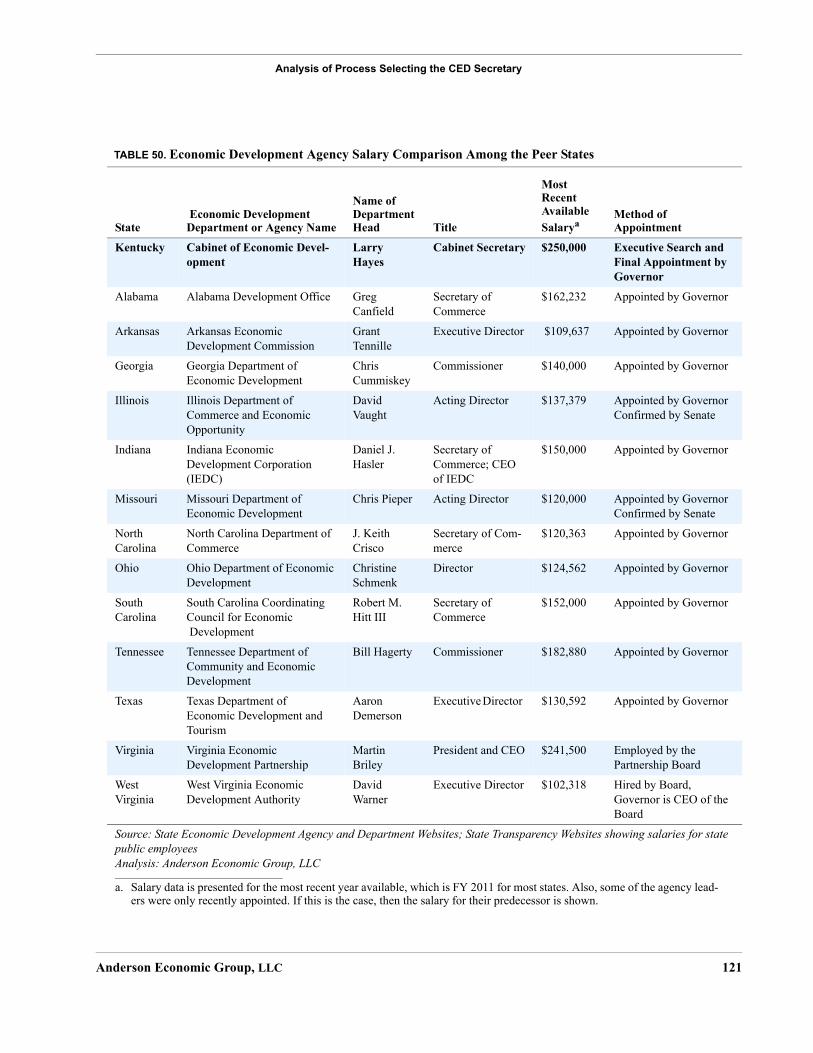
Analysis of Process Selecting the CED Secretary
TABLE 50. Economic Development Agency Salary Comparison Among the Peer States
State Economic Development Department or Agency Name
Name of Department Head Title
Most Recent Available Salarya
Method of Appointment
Kentucky Cabinet of Economic Devel-opment
Larry Hayes
Cabinet Secretary $250,000 Executive Search and Final Appointment by Governor
Alabama Alabama Development Office Greg Canfield
Secretary of Commerce
$162,232 Appointed by Governor
Arkansas Arkansas Economic Development Commission
Grant Tennille
Executive Director $109,637 Appointed by Governor
Georgia Georgia Department of Economic Development
Chris Cummiskey
Commissioner $140,000 Appointed by Governor
Illinois Illinois Department of Commerce and Economic Opportunity
David Vaught
Acting Director $137,379 Appointed by Governor Confirmed by Senate
Indiana Indiana Economic Development Corporation (IEDC)
Daniel J. Hasler
Secretary of Commerce; CEO of IEDC
$150,000 Appointed by Governor
Missouri Missouri Department of Economic Development
Chris Pieper Acting Director $120,000 Appointed by Governor Confirmed by Senate
North Carolina
North Carolina Department of Commerce
J. Keith Crisco
Secretary of Com-merce
$120,363 Appointed by Governor
Ohio Ohio Department of Economic Development
Christine Schmenk
Director $124,562 Appointed by Governor
South Carolina
South Carolina Coordinating Council for Economic Development
Robert M. Hitt III
Secretary of Commerce
$152,000 Appointed by Governor
Tennessee Tennessee Department of Community and Economic Development
Bill Hagerty Commissioner $182,880 Appointed by Governor
Texas Texas Department of Economic Development and Tourism
Aaron Demerson
Executive Director $130,592 Appointed by Governor
Virginia Virginia Economic Development Partnership
Martin Briley
President and CEO $241,500 Employed by the Partnership Board
West Virginia
West Virginia Economic Development Authority
David Warner
Executive Director $102,318 Hired by Board, Governor is CEO of the Board
Source: State Economic Development Agency and Department Websites; State Transparency Websites showing salaries for state public employeesAnalysis: Anderson Economic Group, LLC
a. Salary data is presented for the most recent year available, which is FY 2011 for most states. Also, some of the agency lead-ers were only recently appointed. If this is the case, then the salary for their predecessor is shown.
Anderson Economic Group, LLC 121

Analysis of Process Selecting the CED Secretary
CONCLUSIONS ABOUT SALARY AND SELECTION PROCESS COMPARISONS
Kentucky is unique in requiring a national search firm to find candidates for the secretary of economic development. In most states, including Kentucky, the governor appoints the economic development department or agency head. Ken-tucky’s secretary of the CED is paid about $100,000 more on average than his counterparts in peer states. The statutory requirements of using a national search firm, and requiring a secretary to have significant experience and an “estab-lished reputation as an economic development professional” favor someone from the private sector. To attract this type of person, a higher salary is often required.
Anderson Economic Group, LLC 122

-
Appendix A. Kentucky’s Incentive Programs
In “Kentucky’s Economic Development Programs” on page 21 we provided a brief overview of each of Kentucky’s business incentives.This appendix is meant to provide more detailed information on Kentucky’s incentive programs.
TAX INCENTIVES This section gives details on Kentucky’s tax incentives that we analyzed in this report. Table 51 below summarizes each tax incentive program and provides the main business requirements. Following the table below, we describe each tax incentive in greater detail.
TABLE 51. Summary of Kentucky’s Tax Incentives
Acronym Incentive Name GoalBusiness Taxes Affected
Year Enacted
Contract Length Main Requirements
KIRA Kentucky Industrial Revital-ization Act
Job Retention Income TaxWage Assess-ments
1992 Up to 10 years
• Jobs: Minimum 25 maintained jobs (500 if project is a coal mine); and
• Consultant study required to find that plant is danger of closing without state assistance.
KTDA Kentucky Tourism Development Act
Job Creation and Tourism
Sales and Use Tax
1996 Up to 20 years
• Open 100 days per year; and• 25% out-of-state patrons.
BSSC Credit
Bluegrass State Skills Corporation Skills Training Investment Credit
Job Training Income Tax 1998 Up to 3 years
• Trainees: KY residents for at least 12 consecu-tive months prior to training; and
• Wages: 150% of Federal Minimum Wage with benefits post training completion.
KRA Kentucky Reinvestment Act
Job Retention and Investment Assistance
Income Tax 2003 Up to 10 years
• Investment: Minimum $2.5 million; and• Jobs: Maintain 85% full employment (negoti-
ated further with CED).
KEIA Kentucky Enterprise Initiative Act
Construction Cost Assistance
Sales and Use Tax
2005 Up to 7 years
• Investment: Minimum of $500,000 (non-labor costs), and $50,000 for electronic processing equipment.
KESA Kentucky Environ-mental Steward-ship Act
“Green” Job Creation
Income Tax 2005 Up to 10 years
• Wages: 90% of employees must receive countyminimum wage with benefits; and
• Investment: $5 million.
KHPTC Kentucky Historic Preservation Tax Credits
Preservation of Kentucky’s Historic Buildings
Income Tax 2005 Up to 2 years
• Investment: $20,000 over maximum of two years;
• Refurnishing a building to historic standards; and
• Building must be part of National Register of Historic Places.
IEIA Incentives for Energy Indepen-dence Act
“Green” Capital Investment
Income, Sales and Use, and Coal Severance Tax and Wage Assessments
2007 Up to 25 years
• Investment:Renewables: $1 millionAlternative Biomass: $25 millionAlternative Coal/Oil: $100 millionCO2 Pipeline: $50 million
KSBIC Kentucky Small Business Invest-ment Credit
Small Business Investment
Income Tax 2009 One time credit
• Investment: $5,000; • Business must have less than 50 employees; and• Job: Create 1 new job.
Source: Kentucky Cabinet for Economic Development; Tourism, Arts, and Heritage Cabinet Analysis: Anderson Economic Group, LLC
Anderson Economic Group, LLC A-1

Kentucky Industrial Revitalization Act (KIRA)
The Kentucky Industrial Revitalization Act was created in 1992 to aid manufac-turing firms in Kentucky that had either closed or were at risk of closing without state support.
Basics of KIRA:
• Income Tax Credits up to 75% of costs of rehabilitation or construction of build-ings and refurbishing or purchasing of machinery and equipment and wage assessments up to 5% (4% state and 1% local)
• Employee Tax Credit: If company uses wage assessment portion of the program then the employee is also eligible for an income tax credit worth 4/5 of the total wage assessment and 1/5 of the local occupation tax wage assessment.
• Duration: Up to 10 years.
• Targeted Companies: Manufacturing or agribusiness in danger of closing or have temporarily closed due to need of financial assistance. Examples include: coal mining and processing facilities.
• Job Requirement: Company must have 25 jobs or 500 jobs at a coal mining and processing (producing at least 3 million tons of product) at the time of its appli-cation.
• Negotiation: Local letter of support must accompany the application. CED negotiates the total incentive amount based on independent consultant verifica-tion that the company is in danger of closing “but for” the incentive. Public hearing is required before final approval is given. Company must complete the project with 5 years of final approval.
• Oversight: Within 5 years of final approval all costs statements must be given to KEDFA for verification. Annual statements of compliance must be submitted to the CED.
Film Credit
Kentucky Film Tax Credit
Develop Film Industry in KY
Income TaxRefundable Credit
2009 One time credit
• Investment:Documentary: $50,000Commercials: $200,000Full Length Film: $500,000
KBI Kentucky Business Investment
Job Creation andInvestment Assistance
Income Tax Wage Assess-ments
2009 Up to 15 years
• Jobs: Minimum of 10 new and maintained full-time jobs for KY residents (negotiated higher for many businesses);
• Wages: 125% of Federal Minimum Wage with benefits; and
• Investment: $100,000Note: Requirements relaxed for Enhanced Incentive Counties.a
a. Enhanced incentive counties have higher unemployment than the state average for the preceding five calendar years, or unemployment greater than 200% of the state’s for the preceding year, or one of the most distressed counties based on unemployment, educational attainment, and road quality.
TABLE 51. Summary of Kentucky’s Tax Incentives (Continued)
Acronym Incentive Name GoalBusiness Taxes Affected
Year Enacted
Contract Length Main Requirements
Source: Kentucky Cabinet for Economic Development; Tourism, Arts, and Heritage Cabinet Analysis: Anderson Economic Group, LLC
Anderson Economic Group, LLC A-2

Kentucky Tourism Development Act (KTDA)
The Kentucky Tourism Development Act was created in 1996 to aid the state in developing its tourism industry and attracting out-of-state visitors. This incen-tive was the first of its kind in the U.S. as it provides a refund of sales and use taxes to the tourism site developer. This credit is administered and monitored by the Tourism, Arts, and Heritage Cabinet.
Basics of KTDA:
• Income Tax Credits: Up to 25% of project costs or 50% of projects that con-structed on state/federal park or national forest lands or Kentucky State Fair Board. The Kentucky Department of Revenue will return sales taxes paid on admissions, food and gift sales, and lodging costs. If the project is an entertain-ment destination center than the incentive amount is limited to the lesser of 25% of project costs or the full investment in public infrastructure.
• Duration: Up to 10 years for most projects and 20 years for those on state/fed-eral and national park land.
• Targeted Companies: Tourism new development site or expansion. Examples include: cultural and historical sites, recreation and entertainment, natural beauty areas, craft centers, theme restaurants, lodging in conjunction with other entertainment located within 50 miles of a facility on the National Register that offers cultural or recreational functions, and within the 100 least densely popu-lated counties.
• Minimum Requirements: At least 25% of visitors from out-of-state, 50% if a theme restaurant. Open at least 100 days of the year. Theme restaurants must be open at least 300 days per year.
• Investment: Lodging facilities are eligible if they restore or renovate a facility with no less than 500 rooms and invest at least $10 million. If the facility is part of a sports complex the minimum investment is $6 million. Theme restaurants must invest at least $5 million.
• Negotiation: Application to Tourism Secretary, a public hearing is required, all projects must have an outside consultant report to prove a positive economic and fiscal impact for the state.
• Oversight: Department of Revenue reimburses sales taxes paid once the Tour-ism, Arts, and Heritage Cabinet sends them notice that the company has com-plied with the incentive requirements.
Bluegrass State Skills Corporation (BSSC) Training Investment Credit
The BSSC Training Investment Credit program joined the BSSC Grant-in-Aid program in 1998 with the purpose of aiding companies in training their Ken-tucky resident employees.
Basics of BSSC Tax Credits:
• Income Tax Credit worth up to 50% of approved training costs not to exceed $500 per trained employee or $100,000 per company in aggregate per biennium. All qualified companies cannot use more than $2,500,000 in total each fiscal year.
• Duration: Must be used within 3 successive fiscal years.
Anderson Economic Group, LLC A-3

• Targeted Companies: Company must have been present in Kentucky for at least 3 years prior to application. Examples include: manufacturing, agribusiness, telecoms, health care (hospitals and nursing homes), R&D, mining, tourism, transportation. Retail companies are excluded.
• Minimum Requirements:
• Qualified Employees: Kentucky residents, full-time employment at the company for at least 12 consecutive months prior to application for incen-tive.
• Wages must be increased for all employees who participate in the training to the equivalent of $12.51 per hour or 150% of the federal minimum wage plus benefits.
• Process and Monitoring: Preliminary approval (company must complete all pro-grams in contract) and maintain employment levels for at least 90 days post-training. Final approval is then submitted no later than 6 month post-training. Final approval comes after a one year training project plus the 90 day retention period, company is then referred to Department of Revenue with documentation of a competed contract with the CED. If final approval is given then the credits may be used for 3 consecutive years following final approval.
Kentucky Reinvestment Act (KRA)
The Kentucky Reinvestment Act was created in 2003 to aid manufacturing firms that have been operating in Kentucky with job retention. A company must invest at least $2.5 million in the state to be eligible for KRA credits.
Basics of KRA:
• Income tax credits up to 100% of corporate income and limited liability tax gen-erated by the project, including 50% of equipment costs and 100% of skills training costs.
• Duration: Up to 10 years (or 20% of the incentive total per year, whichever occurs first).
• Targeted Companies: Manufacturing-related companies.
• Job Requirement: Maintain 85% full employment at location.
• Investment: Minimum $2,500,00 in eligible costs which include acquisition, construction, and installation or new equipment, rehab and installation of improvements of facilities (does not include replacing equipment with normal wear and usage depreciation), and training costs.
• Negotiation: Job retention percentage and eligible costs are negotiated with the CED.
• Oversight: Annual statements of compliance must be submitted to the CED.
Kentucky Enterprise Initiative Act (KEIA)
The Kentucky Enterprise Initiative Act is a tax incentive geared toward new and expanding service, technology, manufacturing, or tourism businesses. The KEIA repays sales and use taxes paid for construction materials and building fixtures for improvements to real property or for R&D and electronic processing equipment.
Anderson Economic Group, LLC A-4

Basics of KEIA:
• Tax Refund: Refund of sales and use taxes paid during the duration of the proj-ect from the purchase of the following:
• Building and construction materials
• R&D Equipment
• Electronic Processing equipment (minimum $50,000 investment)
• Maximum Tax Credit: Amount is contracted up to $20,000,000 for building and construction materials, and $5,000,000 for electronics and R&D equipment for all approved projects over a year.
• Duration: Up to 7 years.
• Targeted Companies: Manufacturing, service, technology, or operation of or development of tourism attraction.
• Minimum Requirements: Minimum investment of $500,000 not including labor costs.
• Oversight: Department of Revenue communicates directly with approved com-pany to issue tax credits for eligible purchases.
Kentucky Environmental Stewardship Act (KESA)
The Kentucky Environmental Stewardship Act was created in 2005 specifically for manufacturing companies that produce an environmentally beneficial prod-uct. Qualifying companies must make at least a $5 million investment in fixed assets and employee training.
Basics of KESA:
• Income Tax Credits of up to 100% of the tax liability including up to 25% of the fixed asset costs and up to 100% of employee skills training.
• Duration: Up to 10 years or until the full benefit has been realized (limited to 25% of full benefit each year).
• Targeted Companies: Any business that manufactures a product with positive environmental impact.
• Minimum Requirements: Employees must be paid at least the county minimum wage with benefits.
• Investment: At least $5,000,000 in eligible costs which include fixed asset costs and employee training.
• Negotiation: CED negotiates incentives based on projected eligible costs. Com-pany then completes the project and submits eligible cost statement. Once the investment is made and certified by the CED the company can begin using their tax credits.
• Oversight: Annual statements of compliance must be submitted to the CED.
Kentucky Historic Preservation Tax Credit (KHPTC)
The Kentucky Historic Preservation Tax Credit was created in 2005 and admin-istered through the Heritage Council. This credit is a partnership with the Fed-
Anderson Economic Group, LLC A-5

eral Historic Rehabilitation Tax Credit program. The goal of this credit is to increase historic preservation renovations throughout Kentucky.
Basics of KHPTC:
• Income tax credits worth up to 20% of rehabilitation expenses of at least $20,000. The total credit may not exceed $400,000.
• Rehabilitation credit may be taken over two years due to construction needs.
• Total amount of credits in the state is capped at $5 million annually, therefore companies and individuals may not receive a full 20% credits based on the num-ber of eligible applicants.
Kentucky Small Business Investment Credit (KSBIC)
The Kentucky Small Business Investment Credit was created in 2009 with the goal of encouraging investment in Kentucky’s small businesses. The KSBIC is limited to a total of $3 million in tax credits each fiscal year.
Basics of KSBIC:
• Income tax credits of $3,500 per position up to $25,000 per company for small businesses that create and fill one or more jobs and invest at least $5,000 in qualifying equipment.
• Small Business Definition: 50 or fewer full-time employees.
• The job created must pay at least 150% of the federal minimum wage.
Incentives for Energy Independence Act (IEIA)
Incentives for Energy Independence was created in 2007 with the following goals:
• Increase production and sale of alternative fuels;
• Increase production and sale of energy-efficient fuels; and
• Generate electricity for sale through solar, wind, biomass, landfill methane, hydropower, and other renewable sources.
Basics of IEIA:
• Income tax credits of up to 100% of corporate income tax or limited liability entity tax arising from project,
• Sales and use tax credits of up to 100% taxes paid on tangible personal property made to construct retrofit or upgrade facility, Severance Tax: Up to 80% of the taxes paid on the purchase of severance of coal or natural gas.
• Wage assessments of up to 4% of gross wages of each employee.
• Duration: Up to 25 years.
• Targeted Companies: Any company that retrofits or upgrades a facility to gener-ate, increase production, and sale of alternative fuels. Examples include: bio-mass, synthetic natural gas, hydropower, wind power, etc.
• Minimum Investment:
Anderson Economic Group, LLC A-6

•Alternative fuels and gas this is “carbon capture ready” using oil shale, tar sands, or coal:$100,000,000 investment
•Alternative fuels “carbon capture ready” using biomass: $25,000,000 investment
•Energy efficient alternative fuel facility producing a homogenous fuel using coal, waste coal or biomass: $25,000,000 investment.
•Natural gas, natural gas liquids, renewables (such as hydro, biomass, methane or 50 kilowatts of solar): $1,000,000 investment
•Carbon dioxide transmission pipeline: $50,000,000 investment.
• Negotiation and Oversight: Amount of credit is negotiated with the CED. Annual statements of compliance must be submitted to CED.
Kentucky Film Tax Credit (KFTC)
The Kentucky Film Tax Credit was created in 2009 and is administered by the Tourism, Arts, and Heritage Cabinet. Prior to creating this incentive the state of Kentucky commissioned a study to decide the amount of incentive they would offer.
Basics of KFTC:
• Refundable income tax credit for 20% of qualified expenses in Kentucky. This means that if the production company incurs a tax liability that is less than the incentive they qualify for, then the state remits the additional funds to the pro-duction company to provide a full credit for the approved amount. No other Kentucky credit is refundable.
• Minimum Investment:
• Documentaries and Touring Broadway Shows: $50,000
• Commercials: $200,000
• Full-Length Films: $500,000
Kentucky Business Investment (KBI)
The Kentucky Business Investment incentive or KBI was created in 2009 when the state of Kentucky passed legislation called “Incentives for New Kentucky.” This legislation changed performance targets for many incentives and created the KBI, eliminating the four incentives that predated the KBI. Below we describe the basics of the KBI. For incentives we list the maximum amount allowed and for the business requirements we provide the minimum. Most com-panies do not have these exact amounts for their incentives and requirements. The CED negotiates these factors for each individual contract.
Basics of KBI:
• Income tax credits of up to 100% of corporate income or Limited Liability Entity Tax arising from the project.
Anderson Economic Group, LLC A-7

A
d
SA
a
• Wage assessments up to 4% of gross wages of each employee, 5% in enhanced incentive counties.
• Duration: Up to 10 years or 15 years in enhanced incentive counties.
• Targeted Companies: manufacturing, agribusiness, regional or national head-quarters facilities, any non-retail company that services over 50% non-Ken-tucky residents. Examples include: call centers, administration and processing facilities, telephone and internet sales processing facilities, distribution centers, and R&D facilities.
• Minimum Requirements: Create and maintain 10 new full time jobs paying 150% of Federal Minimum Wage (125% in enhanced incentive counties) with benefits.
• Investment: Must make at least $100,000 investment in eligible costs (land, building, site development)
• Monitoring: Company is responsible for submitting annual reports to show compliance with their contractual requirements
Incentives that Were Replaced by KBI
Kentucky Rural Economic Development ACT (KREDA)
The Kentucky Rural Development Act was created in 1988 and was the first tax credit incentive program in Kentucky. The goal of KREDA was to assist expanding manufacturing companies and encourage out of state firms to locate in Kentucky’s economically distressed areas. Locations that are eligible are counties with one or more of the following criteria: a higher unemployment rate
TABLE 52. Incentives Replaced by the KBIa
cronym Incentive Name Goal Business Taxes Affected
Year Enacted
Contract Length Main Requirements
KREDA Kentucky Rural Economic Development Act
Rural Manu-facturing Job Creation
Income TaxWage Assess-ments
1988 Up to 15 years
• Jobs: Minimum of 15 new jobs for KY residents;• Wages: 90% of new employees paid county minimum
wage with benefits; and• Investment: At least $100,000
KIDA Kentucky Industrial Development Act
Manufactur-ing Job Creation
Income Tax or Wage Assessments
1992 Up to 10 years
• Jobs: Minimum of 15 new jobs for KY residents;• Wages: 90% of new employees paid county minimum
wage with benefits; and• Investment: At least $100,000
KJDA Kentucky Jobs Development Act
Technology Job Creation
Income Tax Wage Assess-ments
1992 Up to 10 years
• Jobs: Minimum of 15 new jobs for KY residents; an• Wages: 90% of new employees paid county minimum
wage with benefits.
KEOZ Kentucky Economic Opportunity Zone
Economically Disadvan-taged Area Job Creation
Income Tax Wage Assess-ments
2000 Up to 10 years
• Jobs: Minimum of 10 new jobs for KY residents;• Wages: 90% of new employees paid county minimum
wage with benefits; and• Investment: At least $100,000
ource: Kentucky Cabinet for Economic Developmentnalysis: Anderson Economic Group
. In 2009 these incentives were eliminated and the Kentucky Business Investment (KBI) was created. The KBI embodies the same goals and characteristics as these four incentive programs and expands upon them. These incentives are part of our overall analysis as well since they are so similar to KBI and KBI at the time of this report’s writing did not yet have extensive data.
Anderson Economic Group, LLC A-8
than the state average for five consecutive years; an unemployment rate twice that of the state for the preceding year; and those that have three years of higher unemployment than the state, lower educational attainment, and lower road quality.
Basics of KREDA:
• Income tax credits of up to 100% of real estate or capital lease expense.
• Wage assessments equal to 4% of gross wages from those hired as a result of the incentive.
• Duration: Up to 15 years (was originally a 25 year credit).
• Location Requirement: Available only in counties meeting specific criteria for unemployment and other factors.
• Targeted Companies: New or expanding manufacturing operations in qualifying counties.
• Minimum Requirements: Create and maintain at least 15 new jobs that pay the county's required minimum wage including benefits.
• Investment: Make at least a $100,000 investment in a real estate or capital lease.
• Oversight: Annual statements of compliance must be submitted to CED.
Kentucky Industrial Development Act (KIDA)
The Kentucky Industrial Development Act was created in 1992 and focuses solely on manufacturing expansion and development. Any expanding or relocat-ing manufacturing firm is eligible with a $100,000 capital investment. KIDA calculates the total amount of incentive not only on capital investment but also on how many people it employs. For each employee hired, a company may receive $20,000 in tax credits up to the amount spent for equipment.
Basics of KIDA:
• Income tax credits of up to 100% of a company’s income tax liability generated by the project or a 3% wage assessment on new employees. If a company uses only an operating lease as its investment then the company may only keep wage assessment and may not take part in the tax credit portion of the KIDA.
• Duration: Up to 10 years, any unused incentive can be carried over in the term but after 10 years any unused incentive is no longer accessible.
• Targeted Companies: Any business that establishes or expands manufacturing operations.
• Minimum Requirements: Create and maintain at least 15 jobs paying the county minimum wage with benefits.
• Investment: Minimum $100,000 investment in eligible costs such as land acqui-sition, site development, utility extensions, architectural and engineering ser-vices, building, construction and rehab, purchases of building fixtures including installation costs.
• Oversight: Annual reporting statements submitted to the CED.
Anderson Economic Group, LLC A-9

Kentucky Jobs Development Act (KJDA)
The Kentucky Jobs Development Act was created in 1992 to increase job devel-opment in service and technology-related companies. Examples of targeted companies include data processing centers, R&D facilities, or any other non-
manufacturing, non-retail, “white-collar” company.1 The KJDA was also the first of Kentucky’s incentive programs to allow for the recovery of rent on leased projects.
Basics of KJDA:
• Income tax credits up to 100% state income tax credit arising from the project and wage assessments of up to 5% of the increased gross payroll of the new employees.
• Duration: Up to 10 years.
• Targeted Companies: Any service or technology company with 75% of services located outside the state of Kentucky. Examples include: data processing, R&D, non-manufacturing, and non-retail “white collar” company.
• Minimum Requirements: Create and maintain at least 15 new full-time jobs at the project site paying at least the county minimum wage with benefits.
• Negotiation: The local jurisdiction must pass a local ordinance or resolution affirming that they will give up their portion of a company’s wage assessments. Once the total amount of incentive is negotiated with the CED (upon receipt of company's compliance with the requirements) a public hearing is held 3-6 months prior to final approval. A local resolution must be adopted to allow the incentive agreement for the given local county.
• Oversight: Annual statements must be submitted to the CED by the company for all years of the agreement.
Kentucky Economic Opportunity Zone (KEOZ)
The Kentucky Economic Opportunity Zone was created in 2000 to focus devel-opment efforts in areas with high unemployment and poverty. In order to desig-nate an “Economic Opportunity Zone” (Zone) the local entity must submit an application to the Kentucky Economic Development Finance Authority. Eligi-ble applicants include a county, urban-city government, or city of the first class. Only one Zone per county may be certified.
Basics of KEOZ:
1. The term “white-collar” is not specifically defined. The CED uses the language “white-collar” to help identify the companies eligible for KJDA as non-manufacturing and non-retail.
Anderson Economic Group, LLC A-10

• Income tax credits of up to 100% income tax liability on income generated by or arising out of the project and up to 5% (4% state and 1% local) wage assess-ment.
• Employee Tax Credit: Wage assessments are credited to each employee whose wages are eligible.
• Economic Opportunity Zones: Zones are considered 1-5 contiguous census tracts and must meet “economically distressed” criteria. For example, minimum poverty rate of 150% U.S. rate, higher unemployment rate than state average, population density of 200% the average Kentucky density.
• Duration: Up to 10 years
• Targeted Companies: Manufacturing, service, and technology companies
• Minimum Requirements: Create and maintain at least 10 new full-time jobs for residents in the Zone (the employee must have resided in zone 12 consecutive months prior to incentive) paying at least the county minimum wage with bene-fits.
• Investment: Minimum or $100,000 for the project.
• Negotiation: Must first be approved as a “zone” by the county. Only one “zone” per county is allowed. The total amount of incentive is negotiated by the CED.
• Oversight: If less than 10 jobs are created and maintained the incentive will be suspended until the job requirement is met. Annual statements of compliance must be submitted to CED.
Anderson Economic Group, LLC A-11

LOANS AND GRANTS Kentucky offers three loan programs and one grant. Table 53 below shows each of these programs. Following the table below we describe each loan and grant in greater detail.
KEDFA Direct Loans
KEDFA Direct loans come directly from the Kentucky Economic Development Finance Authority and are intended to help firms supplement financing from the private market. The funds come out of a state revolving loan fund and are pro-vided at below-market rates for eligible companies. This program began in 1988 with the goal of helping Kentucky acquire fixed assets for business use.
Basics of KEDFA Direct Loans:
• Targeted Companies: Agribusiness, tourism, industrial ventures, or service. Retail is excluded.
• Loan Amount: Ranges from 50% participation for under $200,000 in financing
to 30% participation in financing packages over $500,000.1 KEDFA partici-pates only in a portion to supplement financing and does not provide the full loan.
TABLE 53. Summary of Kentucky’s Loan and Grant Programs
AcronymIncentive Name Goal
Type of Program
Year Enacted
Contract Length Main Requirements
KEDFA Direct Loans
Kentucky Economic Development Finance Authority Direct Loans
Infrastructure and Land Acquisition Assistance
Low Interest Loans
1988 Up to 10 years
• Company must contribute 10% of project costs;• Must obtain private financing for up to 50% of total
costs; and• Project must be “shovel ready” within 4 months of
approval.• Must create jobs and have a positive economic
impact, required jobs are negotiated.
OCI High-Tech Pools
OCI High-Tech Invest-ment and Con-struction Pools
High-Tech Job Creation
Forgivable Loans
2000 6 years • Jobs: Minimum of 7 full-time within three years of loan, must maintain for another 3 years (Commis-sioner has discretion to waive or change require-ments); and
• Wages: $40,000/yr with benefits;.
SB Loans Small Business Loans
Small Business Financing
Low Interest Loans
2005 Up to 10 years
• Job: Create 1 full-time job;• Use loan funds only for infrastructure, land, and
equipment; and• Must have 50 or fewer employees.
BSSC Grants
Bluegrass State Skills Corporation Grant-in-Aid
Job Training Grant 1984 One Year Grant
• Wages: 150% of Federal Minimum wage with bene-fits;
• Engage in pre-employment, entry-level, or skills-upgrade training; and
• Provide up to 3 quotes to the state to determine low-est cost training providers.
Source: Kentucky Cabinet for Economic DevelopmentAnalysis: Anderson Economic Group, LLC
1. State participation in a loan means that the state will provide a percentage of the total loan required by a company.
Anderson Economic Group, LLC A-12

• Job Requirement: A company is required to create jobs in order to receive this loan. The number of jobs required is negotiated with the CED and used to deter-mine the loan amount.
• Exclusions: A company may not refinance, only fixed assets are eligible, term and repayments are based on the requirements of the private lending institution.
• Project Requirements: Only fixed-assets may be funded. Project must be “shovel-ready” within four months of approval. Loans are not disbursed until the project is complete.
• Interest Rates: Range from 1% for a 3-year loan to 5% for a 10-year loan.
• Monitoring: Annual statements of compliance are submitted to the CED for job creation and maintenance.
High-Tech Investment and Construction Pools
The Office of Commercialization and Innovation (OCI) is part of the Cabinet for Economic Development. This office focuses its attention on attracting and building high-tech and knowledge-based businesses in Kentucky. It administers the High-Tech Investment and Construction Pools program, which provide for-givable loans geared toward creating quality jobs in high-tech and knowledge-based companies.
Basics of OCI:
• Forgivable loans most commonly between $100,000- $250,000.
• Job Creation: At least 7 jobs paying a minimum of $40,000 per year exclusive of commissions and bonuses. Must create jobs within 3 years of loan and main-tain for another 3 years.
• Duration: Oversight of at least 6 years (3 years to create jobs and 3 years to maintain those jobs).
• Targeted Companies: High-Tech companies
• Examples include: R&D related, highly-technical jobs, and upper-level management, human health and development, information tech and com-munications, biosciences, environmental and energy tech, materials sci-ence and advanced manufacturing.
• Negotiation: Project plan and business plan submission, security for the loan must be provide via letter of credit. A company may also use real estate, deposit certificate, a lien on equipment worth 1.5 times the loan amount. Job descrip-tions must be submitted with minimum educational and experience require-ments, A budget will also be submitted to ensure loan is only for allowable expenses.
• Allowable Expenses: Purchase of specialized equipment, up-fit of facility, license and certification expense, IP protections, “other use determined by Department of Commercialization and Innovation”.
• Non-Allowable Expenses: Land and building construction, basic equip-ment (desks and chairs), salaries of the positions created, payroll expenses.
Anderson Economic Group, LLC A-13

Small Business Loans
The Kentucky Economic Development Finance Authority established the Small Business Loan Program in 2005 to assist small businesses with start-up funds and other funds to grow and expand their business.
Basics of SB Loans:
• Eligible Businesses: 50 or fewer employees in any business other than retail or personal services.
• Job Requirement: Must create at least one new full-time job.
• Loan Amount: $15,000-$100,000.
• Term: Up to 10 years.
• Oversight: Annual statements of compliance must be submitted to CED for job creation and maintenance requirement.
Bluegrass State Skills Corporation Grant-in-Aid
The BSSC Grant-in-Aid program began in 1984 with the purpose of aiding companies in training their Kentucky resident employees. The BSSC also facili-tates the creation of public private partnerships to help meet unfulfilled training needs in Kentucky.
Basics of BSSC Grant-In-Aid:
• Reimbursement for Training Programs. Up to $25,000 (for 1-499 Kentucky res-idents in training) or $50,000 (500+ Kentucky residents in training). All must be full-time employees. Companies can create a consortium, limited to $75,000 reimbursement. Limited to number of full-time employees times $2,000. Fund-ing caps are ultimately limited at the CED’s discretion. 100% reimbursement for training Kentucky employees.
• Duration: 1 year from approved start-date (no retroactive training for regular agreements) CED may allow 25% retroactive training agreements but is limited to training occurring no more than 60 days prior to agreement approval.
• Targeted Companies: Manufacturing, non-manufacturing (if a headquarters or if the majority of services are provided outside of Kentucky), public and non-profit hospitals. (Retail only available if the General Assembly has appropriated funds for this industry).
• Consortium Agreements: 3 or more companies in similar industry, funds for training must be paid out of a consortium bank account so that BSSC reimburse-ment goes to a single source. One company must be considered the “lead com-pany.” Must show that there is a savings to be had from working as a consortium in training employees.
• Economic Development: Project must “facilitate the economic development efforts of the host community.”
• Minimum Requirement: Must pay at least 150% of Federal Minimum wage with benefits.
Anderson Economic Group, LLC A-14

• Negotiation: The company must “shop around” for service providers. BSSC can request quotes from providers (up to 3) if they do not believe due diligence was met by requesting company.
• Process: Reimbursement up to total amount in contract. In order to apply a com-pany must win a certain number of “points” based on several categories (total Kentucky residents in full-time employment, area's socioeconomic need, train-ees base wages, flexible system production, and progressive company initia-tives) only those companies that score at least 25 points are eligible.
BONDS Industrial Revenue Bonds
Industrial revenue bonds are bond issued by either the state or a local entity on behalf of a private business. IRBs in Kentucky may be used to aid a company in developing land, buildings, acquiring machinery, and site preparation. Fre-quently, IRBs are lower cost to a company than issuing bonds on their own because a state or local entity may be able to issue tax-exempt bonds. There is a limit to the amount of tax-exempt bonds each state can issue each year, this is the known as the “volume cap.” Due to the volume-cap a local government must pick and choose which businesses it will issue bonds on behalf of.
TAX INCREMENT FINANCING
Tax Increment Financing Incentives
Kentucky participates in three types of TIF programs. All require an outside consultant verify the net positive impact to Kentucky and require the local gov-ernment entity applying for the incentive to certify that the project will not occur “but for” the TIF incentive. Also the state will only participate in TIF areas where there is mixed-use development, blighted areas, or vacant land with at least a 5,000 seat arena. The following are details of the three TIFs that include state participation:
Real Property Ad Valorem Tax Revenues
• Investment: Minimum $10 million.
• Incentive Amount: Up to 100% of the state real property incremental tax reve-nue may be pledged from the project's impact (shall not exceed 100% of the approved public infrastructure costs).
• Duration: Max 20 years.
• Restrictions: No more than 20% of final developed space may be devoted to retail (and more than 20% of project costs).
Program for Signature Projects
• Investment: Min $200 million.
• Taxes Pledged: real property, individual and corporate income, Limited Liabil-ity Entity taxes and sales taxes.
Anderson Economic Group, LLC A-15

• Incentive Amount: Up to 80% of incremental state revenues may be pledged to the project (Can recover up to 100% of public infrastructure less sales taxes paid).
• Duration: Up to 30 years.
• Extras: Sales tax refund on purchase of construction materials that do not qual-ify as an approved public infrastructure cost.
• Restrictions: No more than 20% of final developed space may be devoted to retail (and more than 20% of project costs).
Mixed Use Redevelopment in Blighted Urban Areas
• Definition: Must be made up of at least 2 of the following: retail, residential, office, restaurant, or hospitality.
• Must fulfill 3 of the following to be considered for TIF:
• Substantial loss of use
• 40%+ low income households
• 50%+ deteriorated structures
• Substantial abandoned structures
• Substantial presence of environmentally contaminated land
• Inadequate public infrastructure
• Also much be mixed-use, be new economic activity in Kentucky
• Investment: Min $20 million, no more than $200 million.
• Incentive Amount: Recover up to 100% of approved public infrastructure costs and those related to land prep, demolition, and clearance.
• Duration: Up to 20 years.
• Restrictions: Final project can contain no more than 20,000 square feet of retail space.
Anderson Economic Group, LLC A-16

Appendix B. Peer State Incentives
This section provides an overview of the development policy and business incentives offered in each of Kentucky’s peer states. These data are summarized in “Comparison of Kentucky’s Business Environment with Peer States” on page 29.
ALABAMA Alabama’s Development Office administers the majority of the state’s incen-tives programs. Many of Alabama’s incentives have a regional focus, meaning that incentives are tailored to the needs of different counties. Alabama focuses heavily on state enterprise zones (which are present in 27 out of 67 Alabama counties with greater economic need, poverty, and unemployment), offering more generous incentives for businesses in these areas. Alabama offers 15 dif-ferent business incentives, 11 of which are tax-related. Alabama also has one loan program and three grant programs. While most grant programs are train-ing-related in other states, Alabama’s three grant programs have three different missions. One is devoted to site preparation for new businesses, another has a specific focus on industrial infrastructure, and the third is a more traditional worker-training program. The infrastructure grant program also has a jobs requirement and is limited to manufacturing, distribution centers, and ware-housing.
Alabama has three tax credit programs, two of which have a jobs requirement. One credit with a jobs requirement is limited to enterprise zones and requires that 35% of the employees at the facility be residents in that enterprise zone. The other credit with a jobs requirement is offered to any business that adds jobs and makes an investment in the state. The requirements are highest for a head-quarters facility and are lower for small businesses and for businesses in enter-prise zones regardless of the business size. The third tax credit is a reimbursement for employee skills training. This credit reimburses training costs for 12th grade level skills including English language skills. Other tax-related incentives include:
• Tax exemption for inventory goods for sale;
• Property tax exemption for manufacturing, R&D facilities, labs, and industrial facilities. This includes all non-education-related property taxes; and
• Corporate tax deductions for pollution control and for air carrier hubs relocating to Alabama.
Type No.
Bonds 0
Loans 1
Investment Programs 0
Grants 3
Tax-Related Incentives 11
Total Number of Active Business Incentives
15
Active Incentives With A Job Creation Require-ment
4
Anderson Economic Group, LLC B-1

ARKANSAS With 32 individual incentive programs, Arkansas offers the most incentives among Kentucky and its peer states. Arkansas also has three investment pro-grams, the most of any state in this analysis. Arkansas’ investment programs include:
• A seed-capital fund providing up to $500,000 in royalty-based agreements to start-up firms;
• A state-sponsored venture fund that invests state money in professionally man-aged venture capital funds; and
• Royalty-based financing (up to $100,000) for technology-related companies.
Half of Arkansas’ incentives are tax-related and the rest are fairly evenly split between bonds, loans, grants, and investment programs. In 2003 Arkansas con-solidated many of its incentives programs into one larger program, the ArkPlus which is very similar to what Kentucky did with the KBI in 2009. Despite this consolidation, Arkansas still has 16 tax-related incentive programs, the majority of which are not targeted to a specific industry. The state uses a four-tier system based on a county’s income level, unemployment rate, population growth, and poverty level to define the amount of incentive available to businesses in each county. Arkansas’ tax-related incentives include but are not limited to:
• Apprenticeship tax credits; $2,000 in credit for each youth apprentice in a busi-ness;
• 33% income tax credits for R&D expenditures worth up to $50,000 per year;
• Tax credits for employer-provided child-care facility and early-childhood edu-cation program:
• Tax refunds of sales and use taxes paid on building materials for manufacturing plants; and
• Cash payments based on new payroll to manufacturing businesses.
Arkansas’ incentives are some of the most detailed and wide-reaching simply because there are so many options. This state also addresses the major concerns of business as shown in Exhibit B-2, “Number of Incentives in Kentucky and Peer States that Address Business Location Concerns,” on page 11. Although many incentives are available to manufacturing, technology-related businesses, and other industries. Arkansas explicitly excludes many arts and tourism-related businesses from many of its incentive programs. The result is that Arkansas has few broad-based incentives despite the volume of incentives it offers.
Type No.
Bonds 4
Loans 5
Investment Programs 3
Grants 4
Tax-Related Incentives 16
Total Number of Active Business Incentives
32
Active Incentives With A Job Creation Require-ment
7
Anderson Economic Group, LLC B-2

GEORGIA Georgia offers a similar number of incentives (19) as Kentucky with the major-ity of incentives being tax-related (11 incentives). Georgia is unique because it is home to a Foreign Trade Zone (FTZ) where businesses are considered to be outside of U.S. Customs Territory. This means that businesses do not have to pay tariffs on goods brought in and used in production.
Georgia also has the third largest proportion of broad-based incentives offered among the states in this analysis. Some examples of Georgia’s broad-based incentives include:
• 100% reimbursement through tax credits for employer constructed child-care facilities for employee use;
• Quality jobs credit for any business creating 50 jobs per year;
• Adult basic skills credit for providing 12th grade level education to employees in any business; and
• Retraining credit, similar to the Bluegrass State Skills Corporation tax credit program.
Georgia uses a similar four-tier system as Arkansas. Many incentives offer dif-ferent amounts of funds and have different requirements depending on the county where a business locates. For example Georgia offers:
• A special revolving loan fund for businesses in counties with fewer than 100,000 people. The loan is up to $250,000 for downtown development;
• $350,000 in matching funds for eligible counties to help with infrastructure improvements; and
• Loan guarantee from the state of up to $5 million for large scale development projects where a large proportion of the employees are middle to low income residents.
ILLINOIS Illinois offers 22 unique incentives, only 3 of which have a jobs requirement, making it the state with the lowest proportion of incentives with a jobs require-ment among the states in this analysis. Illinois also offers the 4th fewest incen-tives that address business needs as defined by CEO and small business surveys.
Illinois’ economic development strategy focuses many of the state incentives on farmers. Some of the incentives Illinois offers to farmers include:
• A bond program for beginning farmers;
• Three loan programs focusing on livestock purchases and young farmers; and
• Two loan guarantees for agribusiness that guarantee 85% of loan restructure debt at a lower interest rate.
Illinois also has the highest number of grants of all the peer states with ten grant programs. These programs include but are not limited to:
• Three grants for clean-coal and coal-related technology research and develop-ment;
Type No.
Bonds 1
Loans 4
Investment Programs 0
Grants 3
Tax-Related Incentives 11
Total Number of Active Business Incentives
19
Active Incentives With A Job Creation Require-ment
8
Type No.
Bonds 1
Loans 7
Investment Programs 0
Grants 10
Tax-Related Incentives 4
Total Number of Active Business Incentives
22
Active Incentives With A Job Creation Require-ment
3
Anderson Economic Group, LLC B-3

• Two recycling-related grants for modernizing and updating recycling equip-ment; and
• Two tourism-related grants focusing on infrastructure improvements and attracting trade shows and other conventions.
Almost all of Illinois’ incentives are targeted at specific industries. Illinois offers the third lowest proportion of broad-based incentives.
INDIANA Indiana offers some of the fewest incentives among the states in this analysis with only Texas offering fewer. However, Indiana also offers some of the fewest incentives with a jobs requirement making it an outlier among the states in this analysis. Most of the states in this analysis with few incentives tend to have a higher proportion with a jobs requirement.
Indiana is the only state in this analysis that offers the same number of grants as tax-related incentives. Next to Illinois, Indiana offers the highest proportion of grants among Kentucky and the peer states. Indiana’s grants include:
• Infrastructure grants to companies for building roads and other necessary infra-structure for new business development. A company match is required;
• Employee skills enhancement programs; and
• Two technology-related grants; one for high-tech employee training and another for high-tech and R&D-related businesses that will be commercial ready within 3-5 years.
Indiana also has the 3rd fewest incentives that address business needs as defined by CEO and small business surveys.
MISSOURI Missouri’s development policy focuses the 3rd most incentives on business needs as defined by CEO and small business surveys among Kentucky and the peer states. Missouri also offers some of the fewest incentives with a jobs requirement. More than half of Missouri’s incentives are tax-related.
Of Missouri’s 16 tax-related incentives the majority target specific industries, only three are broad-based. The broad-based incentives are:
• Welfare-to-Work program: Tax incentives for hiring disadvantaged employees including those previously on income assistance, veterans, and formerly incar-cerated residents;
• Advantage Missouri program: tax incentives worth up to 50% of a donation to the Advantage Missouri business development fund; and
• Disabled Access Credit: $5,000 per year for small businesses in any industry that make their facilities accessible to those with special needs.
Missouri has a unique tax increment financing (TIF) program. The TIF in Mis-souri is geared toward businesses that will build and invest in necessary public infrastructure that also facilitates business development, for example roads and
Type No.
Bonds 2
Loans 0
Investment Programs 1
Grants 4
Tax-Related Incentives 4
Total Number of Active Business Incentives
11
Active Incentives With A Job Creation Require-ment
3
Type No.
Bonds 3
Loans 4
Investment Programs 1
Grants 3
Tax-Related Incentives 16
Total Number of Active Business Incentives
27
Active Incentives With A Job Creation Requirement
6
Anderson Economic Group, LLC B-4
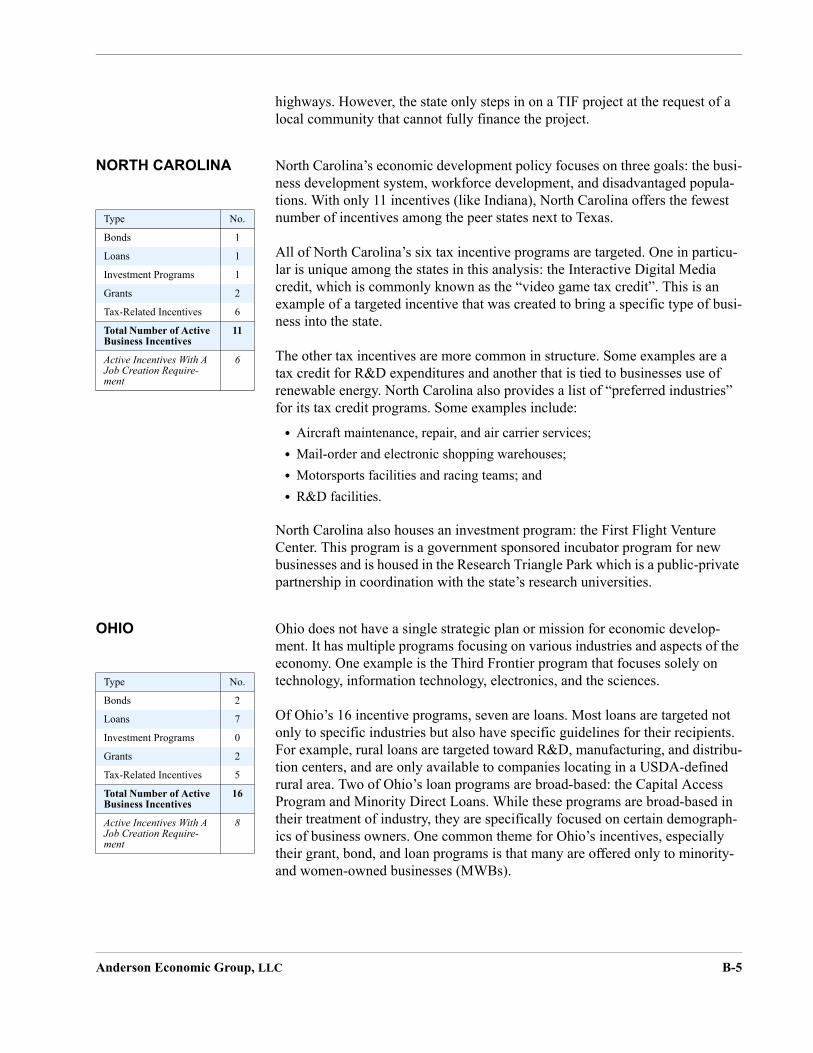
highways. However, the state only steps in on a TIF project at the request of a local community that cannot fully finance the project.
NORTH CAROLINA North Carolina’s economic development policy focuses on three goals: the busi-ness development system, workforce development, and disadvantaged popula-tions. With only 11 incentives (like Indiana), North Carolina offers the fewest number of incentives among the peer states next to Texas.
All of North Carolina’s six tax incentive programs are targeted. One in particu-lar is unique among the states in this analysis: the Interactive Digital Media credit, which is commonly known as the “video game tax credit”. This is an example of a targeted incentive that was created to bring a specific type of busi-ness into the state.
The other tax incentives are more common in structure. Some examples are a tax credit for R&D expenditures and another that is tied to businesses use of renewable energy. North Carolina also provides a list of “preferred industries” for its tax credit programs. Some examples include:
• Aircraft maintenance, repair, and air carrier services;
• Mail-order and electronic shopping warehouses;
• Motorsports facilities and racing teams; and
• R&D facilities.
North Carolina also houses an investment program: the First Flight Venture Center. This program is a government sponsored incubator program for new businesses and is housed in the Research Triangle Park which is a public-private partnership in coordination with the state’s research universities.
OHIO Ohio does not have a single strategic plan or mission for economic develop-ment. It has multiple programs focusing on various industries and aspects of the economy. One example is the Third Frontier program that focuses solely on technology, information technology, electronics, and the sciences.
Of Ohio’s 16 incentive programs, seven are loans. Most loans are targeted not only to specific industries but also have specific guidelines for their recipients. For example, rural loans are targeted toward R&D, manufacturing, and distribu-tion centers, and are only available to companies locating in a USDA-defined rural area. Two of Ohio’s loan programs are broad-based: the Capital Access Program and Minority Direct Loans. While these programs are broad-based in their treatment of industry, they are specifically focused on certain demograph-ics of business owners. One common theme for Ohio’s incentives, especially their grant, bond, and loan programs is that many are offered only to minority- and women-owned businesses (MWBs).
Type No.
Bonds 1
Loans 1
Investment Programs 1
Grants 2
Tax-Related Incentives 6
Total Number of Active Business Incentives
11
Active Incentives With A Job Creation Require-ment
6
Type No.
Bonds 2
Loans 7
Investment Programs 0
Grants 2
Tax-Related Incentives 5
Total Number of Active Business Incentives
16
Active Incentives With A Job Creation Require-ment
8
Anderson Economic Group, LLC B-5

Through the Third Frontier program Ohio places special focus on technology, IT, electronics, and the sciences. Some of the incentives offered through Third Frontier are:
• Innovation Loan Fund: Loans between $500,000-$1.5 million for start-up enter-prises;
• Tax credit for investment in small R&D facilities;
• R&D expenses tax credit; and
• Sales tax exemption for all R&D equipment purchases and activities.
SOUTH CAROLINA With 31 individual incentive programs, South Carolina has the most programs next to Arkansas’ 32. While the state does not have an official economic devel-opment strategic plan or mission that is publicly available, it does have an annu-ally published document that describes all business incentives that is available on the economic development website.
Almost all of South Carolina’s incentives are tax-related. The state has only two programs of their 31 that are not a tax incentive: one bond program and one job training grant program. South Carolina has 29 tax-related incentive programs. Some of the more uncommon ones among the peer states include:
• Child Care Facilities: $100,000 tax credit to a business for establishing a child care facility and program for employees;
• $400,000 tax credit to private firms that invest in public infrastructure building water facilities, sewers, and roads; and
• Multi-county Industrial Parks: Property tax exemptions for industrial parks that span multiple counties.
TENNESSEE Tennessee’s economic development strategy is regional in nature. The state is separated into nine regions and each region has its own strategic plan for eco-nomic development. The Department of Community and Economic Develop-ment is the state agency responsible for state incentives and coordinating regional programming.
Tennessee has 26 individual state-sponsored incentive programs. Of these, 15 are tax-related and all but four are targeted to specific industries or facilities. Through 22 of its 26 incentives Tennessee places special emphasis on renew-able energy and environmentally friendly production. Some examples of these incentives include:
• Green Energy Tax Credit: Refundable tax credit;
• Carbon Charge Tax Credit: Tax credit given to green energy companies to reim-burse their pollution charges;
• Green Island Corridor Grant: Grant funding for retail fueling stations and farm cooperatives to establish bio-fuel sites along Tennessee’s interstates and major highways;
• Loans for energy-efficient infrastructure updates for small businesses; and
Type No.
Bonds 1
Loans 0
Investment Programs 0
Grants 1
Tax-Related Incentives 29
Total Number of Active Business Incentives
31
Active Incentives With A Job Creation Require-ment
7
Type No.
Bonds 1
Loans 4
Investment Programs 0
Grants 6
Tax-Related Incentives 15
Total Number of Active Business Incentives
26
Active Incentives With A Job Creation Require-ment
10
Anderson Economic Group, LLC B-6

• Loans for soybean farmers that grow their product for bio-fuel use.
Tennessee also has six grant programs. Similar to Illinois’ grants that are more diverse than job training, Tennessee has three grants that are infrastructure-related. The Green Island Corridor Grant (mentioned in the above list) is one; the other two infrastructure grants are:
• Community Development Block Grants: Grant to local governments for use by private firms that are investing in infrastructure in the area; and
• FastTrack Infrastructure Development Program: Targets manufacturing where 50% or more of their product is exported outside of Tennessee, given only to projects that agree to a jobs and wage requirement.
Of Tennessee’s 26 incentives, ten have a jobs requirement. These are not limited to tax-related incentives as in many states. Two of Tennessee’s grant programs are tied to job creation.
TEXAS Texas does not have a publicly available state plan for economic development. The economic development website for the state does place special emphasis on technology, science, energy, and defense even though there is no official strat-egy.
With only ten incentive programs, Texas has the fewest incentives among all of the states in this analysis. Of these ten incentives six are broad-based. This is the largest proportion of incentives that are broad-based among the states in this analysis with Virginia’s 50% in second place. Some examples of Texas’ broad-based incentives include:
• Refund of sales, use, and franchise taxes if a business pays local school property
taxes;1
• Texas Capital Fund: Grants to build local main street infrastructure, any busi-ness is eligible if 51% or more of the jobs it creates are for residents from low- or middle-income Texas communities; and
• Skills Development Grant Fund: Partnership with community colleges and the state to provide customized worker training for any Texas business.
Another broad-based incentive program in Texas has a unique requirement compared to the other peer states. Enterprise Zones are defined in some peer states at the county level by identifying those that meet a specified poverty rate. Texas uses the poverty rate as well, but by Census block group rather than county. This is a much smaller spatial definition than the more common county-level.
Type No.
Bonds 1
Loans 3
Investment Programs 0
Grants 2
Tax-Related Incentives 4
Total Number of Active Business Incentives
10
Active Incentives With A Job Creation Require-ment
3
1. Texas also has a program that allows a business to pay a fee in lieu of school property taxes. This incentive encourages payment of school property taxes and provides an alternative bene-fit.
Anderson Economic Group, LLC B-7
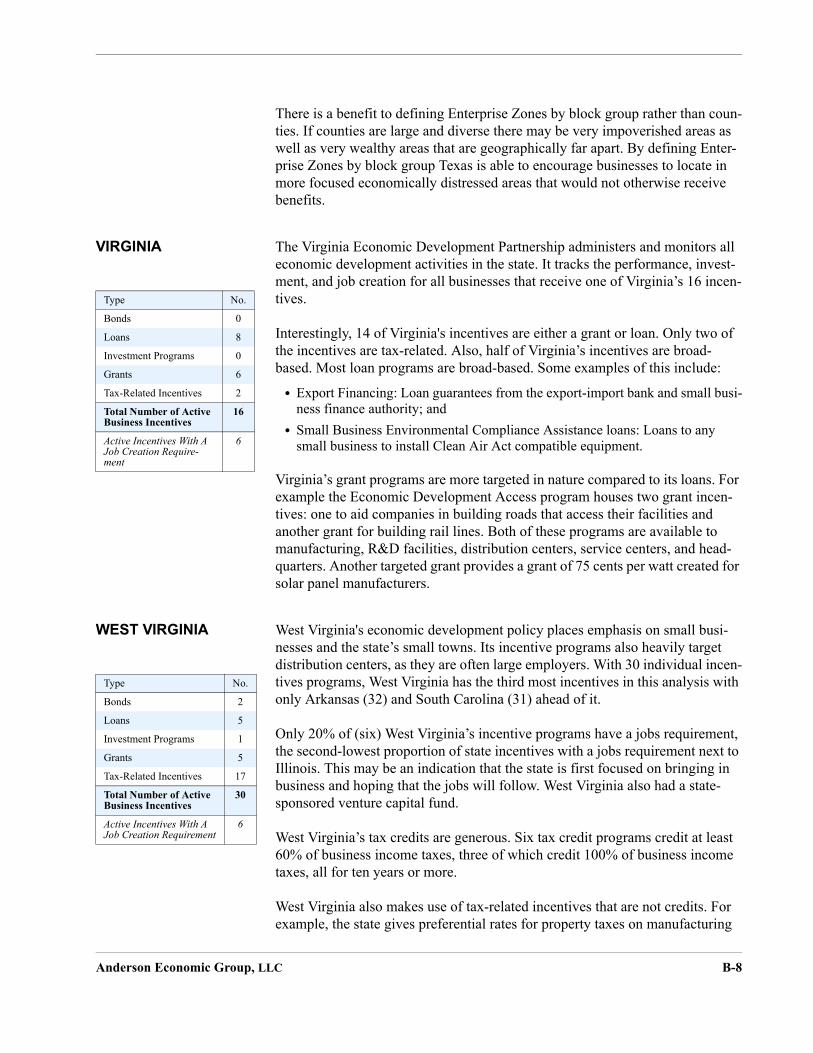
There is a benefit to defining Enterprise Zones by block group rather than coun-ties. If counties are large and diverse there may be very impoverished areas as well as very wealthy areas that are geographically far apart. By defining Enter-prise Zones by block group Texas is able to encourage businesses to locate in more focused economically distressed areas that would not otherwise receive benefits.
VIRGINIA The Virginia Economic Development Partnership administers and monitors all economic development activities in the state. It tracks the performance, invest-ment, and job creation for all businesses that receive one of Virginia’s 16 incen-tives.
Interestingly, 14 of Virginia's incentives are either a grant or loan. Only two of the incentives are tax-related. Also, half of Virginia’s incentives are broad-based. Most loan programs are broad-based. Some examples of this include:
• Export Financing: Loan guarantees from the export-import bank and small busi-ness finance authority; and
• Small Business Environmental Compliance Assistance loans: Loans to any small business to install Clean Air Act compatible equipment.
Virginia’s grant programs are more targeted in nature compared to its loans. For example the Economic Development Access program houses two grant incen-tives: one to aid companies in building roads that access their facilities and another grant for building rail lines. Both of these programs are available to manufacturing, R&D facilities, distribution centers, service centers, and head-quarters. Another targeted grant provides a grant of 75 cents per watt created for solar panel manufacturers.
WEST VIRGINIA West Virginia's economic development policy places emphasis on small busi-nesses and the state’s small towns. Its incentive programs also heavily target distribution centers, as they are often large employers. With 30 individual incen-tives programs, West Virginia has the third most incentives in this analysis with only Arkansas (32) and South Carolina (31) ahead of it.
Only 20% of (six) West Virginia’s incentive programs have a jobs requirement, the second-lowest proportion of state incentives with a jobs requirement next to Illinois. This may be an indication that the state is first focused on bringing in business and hoping that the jobs will follow. West Virginia also had a state-sponsored venture capital fund.
West Virginia’s tax credits are generous. Six tax credit programs credit at least 60% of business income taxes, three of which credit 100% of business income taxes, all for ten years or more.
West Virginia also makes use of tax-related incentives that are not credits. For example, the state gives preferential rates for property taxes on manufacturing
Type No.
Bonds 0
Loans 8
Investment Programs 0
Grants 6
Tax-Related Incentives 2
Total Number of Active Business Incentives
16
Active Incentives With A Job Creation Require-ment
6
Type No.
Bonds 2
Loans 5
Investment Programs 1
Grants 5
Tax-Related Incentives 17
Total Number of Active Business Incentives
30
Active Incentives With A Job Creation Requirement
6
Anderson Economic Group, LLC B-8

and high-tech business facilities; all property taxes are exempt for warehousing and distribution centers; and e-commerce businesses are exempt from sales tax.
West Virginia’s tourism development program is similar to Kentucky’s. The state refunds 25% of sales use taxes paid if the business has a positive economic impact, invests at least $41 million in the state, and is open at least 100 days a year to the public.
Anderson Economic Group, LLC B-9

Geographic TargetingKe Blighted Urban Areas
A nterprise Zones and Rural Communities A No Geographic Targeting
GTrade Zone, Local Region Specific, Development/Redevelopment Zone
Il No Geographic Targeting In Enterprise Zone M Urban Area and Enterprise Zone
NDevelopment/Redevelopment Zone and
Rural Community
ODevelopment/Redevelopment Zone,
Enterprise Zone, and Rural Community S Local Region Specific
TRural Community and Local Region
Specific
TEnterprise Zone, Trade Zone, and Rural
Community
VEnterprise Zone and Local Region
Specific W No Geographic TargetingSou sAna
Active Incentive Programs by Category
Exhibit B-1. Active Business Incentives in Kentucky and Peer States 2011
anies still claim incentives under these
B - 10
State
Total Number of Active Business
Incentives Bonds LoansInvestment Programs Grants
Tax Related Incentives
Active Incentives With A Job
Creation Requirement
ntucky1 17 2 3 0 1 11 7
labama 15 0 1 0 3 11 4 Erkansas 32 4 5 3 4 16 7
eorgia 19 1 4 0 3 11 8linois 22 1 7 0 10 4 3diana 11 2 0 1 4 4 3issouri 27 3 4 1 3 16 6
orth Carolina 11 1 1 1 2 6 6
hio 16 2 7 0 2 5 8outh Carolina 31 1 0 0 1 29 7
ennessee 26 1 4 0 6 15 10
exas 10 1 3 0 2 4 3
irginia 16 0 8 0 6 2 6est Virginia 30 2 5 1 5 17 6rce: Kentucky Cabinet for Economic Development; Tourism, Arts, and Heritage Cabinet; C2ER.org; State Economic Development Websitelysis: Anderson Economic Group, LLC
Notes: 1 Kentucky programs do not include those that were combined to create the Kentucky Business Investment (KBI). Comp
programs but they are not considered "active."
Anderson Economic Group, LLC

& Business ax Rate (#3 #7)
Property Taxes (#4)
Availability of Skilled Labor (#12)
Ke 12 2 3
KenProg
, KRA, KESA, stment Fund, siness Loans, IRA, Tourism Film Credit, uildings, BSSC redit
TIF, IRB BSSC Programs
A 0 0 0 A 16 0 3 G 11 0 2 Ill 4 0 1 In 4 1 2 M 16 3 2 N 6 1 1 O 5 0 1 So 29 11 2 Te 15 4 3 Te 4 3 1 V 2 0 1 W 18 6 3SouAna
CEO's Top Site Selection Factors Small Business Top Concerns
Exhibit B-2. Number of Incentives in Kentucky and Peer States that Address Top Business Location Concerns1
rporate Survey," 2011; and National Federation of
Ande B - 11
StateHighway Access
(#1)
Labor and Construction Costs
(#2 & #5)
Tax Exemptions and Credits (#5 &
#8)
Corporate Tax Rate (#4)
Availability of Skilled Labor
(#2)
Quality Infrastructure
(#1)
Government Lending to
Small Business (#2 & #11)
PersonalIncome T
&
ntucky 0 10 12 8 3 9 3
tucky rams
IEIA, KBI, KRA, KEDFA Loans, OCI,
KEIA, KIRA, TIF, IRB, Historic Buildings
IEIA, KBI, KRA, KESA, KY Investment Fund, Small Business Loans, KEIA, KIRA, Tourism Credit, Film
Credit, Historic Buildings, BSSC Credit
IEIA, KBI, KRA, KESA, KIRA, Film
Credit, Historic Building Credit,
BSSC Credit
KRA, BSSC Programs
None for Highway AccessQuality
Infrastructure: KRA, IEIA,
KESA, KSBIC, KEIA, KHPTC, OCI, KEDFA Loans IRB
KEDFA Loans, OCI, Small
Business Loans
IEIA, KBIKY InveSmall BuKEIA, K
Credit,Historic B
C
labama 0 3 8 5 2 0 1rkansas 1 9 16 11 3 3 5eorgia 0 8 11 9 2 5 3inois 0 6 4 2 1 1 8diana 1 3 4 3 2 3 1issouri 2 11 16 13 2 7 1orth Carolina 0 5 6 5 1 2 2hio 0 11 5 4 1 1 5uth Carolina 1 11 29 15 2 7 0nnessee 1 12 15 12 3 7 4xas 1 5 4 0 1 2 2
irginia 1 10 2 2 1 3 6est Virginia 0 10 18 8 3 2 1rce: Kentucky Cabinet for Economic Development; Tourism, Arts, and Heritage Cabinet; C2ER.org; State Economic Development Websiteslysis: Anderson Economic Group, LLC
Notes: 1 The Business Location Concerns come from a collection of surveys of CEO's and small businesses owners. See Area Development, "26th Annual Co
Independent Businesses, National Small Business Poll "Problems and Priorities," 2008.
rson Economic Group, LLC
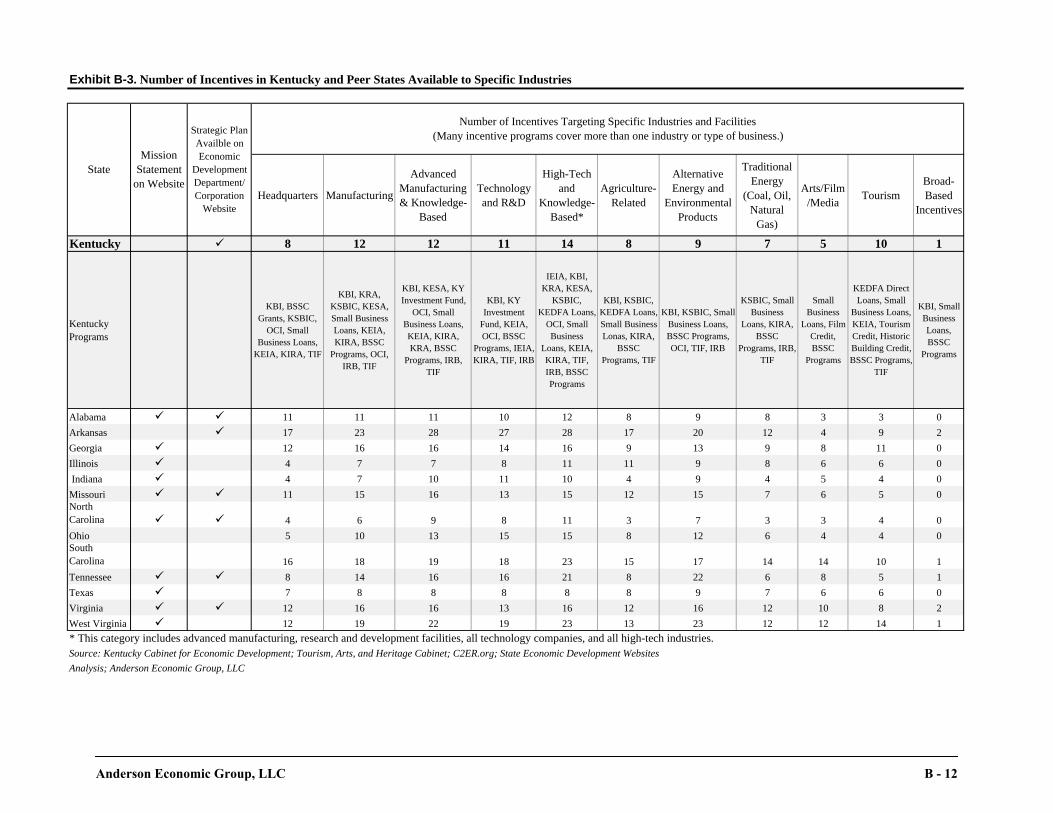
ditional nergy
oal, Oil, atural Gas)
Arts/Film/Media Tourism
Broad-Based
Incentives
Ke 7 5 10 1
KenProg
IC, Small usiness ns, KIRA, BSSC rams, IRB, TIF
Small Business
Loans, Film Credit, BSSC
Programs
KEDFA Direct Loans, Small
Business Loans, KEIA, Tourism Credit, Historic Building Credit, BSSC Programs,
TIF
KBI, Small Business Loans, BSSC
Programs
Ala 8 3 3 0Ark 12 4 9 2Geo 9 8 11 0Illin 8 6 6 0 Ind 4 5 4 0Mis 7 6 5 0NorCar 3 3 4 0Ohi 6 4 4 0SouCar 14 14 10 1Ten 6 8 5 1Tex 7 6 6 0Virg 12 10 8 2Wes 12 12 14 1* TSouAna
iness.)
Exhibit B-3. Number of Incentives in Kentucky and Peer States Available to Specific Industries
B - 12
Headquarters Manufacturing
Advanced Manufacturing & Knowledge-
Based
Technology and R&D
High-Tech and
Knowledge-Based*
Agriculture-Related
Alternative Energy and
Environmental Products
TraE
(CN
ntucky 8 12 12 11 14 8 9
tucky rams
KBI, BSSC Grants, KSBIC,
OCI, Small Business Loans,
KEIA, KIRA, TIF
KBI, KRA, KSBIC, KESA, Small Business Loans, KEIA, KIRA, BSSC
Programs, OCI, IRB, TIF
KBI, KESA, KY Investment Fund,
OCI, Small Business Loans, KEIA, KIRA, KRA, BSSC
Programs, IRB, TIF
KBI, KY Investment
Fund, KEIA, OCI, BSSC
Programs, IEIA, KIRA, TIF, IRB
IEIA, KBI, KRA, KESA,
KSBIC, KEDFA Loans,
OCI, Small Business
Loans, KEIA, KIRA, TIF, IRB, BSSC Programs
KBI, KSBIC, KEDFA Loans, Small Business Lonas, KIRA,
BSSC Programs, TIF
KBI, KSBIC, Small Business Loans, BSSC Programs, OCI, TIF, IRB
KSBB
Loa
Prog
bama 11 11 11 10 12 8 9ansas 17 23 28 27 28 17 20rgia 12 16 16 14 16 9 13ois 4 7 7 8 11 11 9iana 4 7 10 11 10 4 9souri 11 15 16 13 15 12 15th olina 4 6 9 8 11 3 7o 5 10 13 15 15 8 12th olina 16 18 19 18 23 15 17nessee 8 14 16 16 21 8 22as 7 8 8 8 8 8 9inia 12 16 16 13 16 12 16t Virginia 12 19 22 19 23 13 23his category includes advanced manufacturing, research and development facilities, all technology companies, and all high-tech industries. rce: Kentucky Cabinet for Economic Development; Tourism, Arts, and Heritage Cabinet; C2ER.org; State Economic Development Websiteslysis; Anderson Economic Group, LLC
Number of Incentives Targeting Specific Industries and Facilities(Many incentive programs cover more than one industry or type of busStrategic Plan
Availble on Economic
Development Department/Corporation
Website
StateMission
Statement on Website
Anderson Economic Group, LLC

Appendix C. Methodology
WELL-DESIGNED INCENTIVES ANALYSIS
In “Characteristics of Well-Designed Incentive Programs” on page 22, we describe different goals for states in offering business incentives, and we give examples of program characteristics that can help a state reach its goals. The information presented came from a variety of sources on the topic, as well as our expert judgement. The following is a list of consulted sources for this analy-sis:
• Bartik, Timothy. “Solving the Problems of Economic Development Incentives.” W.E. Upjohn Institute for Employment Research. 2007.
• Chirinko, Robert S. and Wilson, Daniel J. “State Investment Tax Incentives: A Zero-Sum Game?.” Federal Research Bank of San Francisco Working Paper Series. July 2008.
• Fisher, Peter and Peters, Alan. “Industrial Incentives: Competition among American States and Cities.” W.E. Upjohn Institute for Employment Research. Employment Research Newsletter Volume 5, Number 2. 1998.
• Finkle, Jeffrey. “Location Incentives Are Unfair and Poorly Justified.” National Council for Urban Economic Development. 2003.
• Gabe, Todd M. and Kraybill, David S. “The Effect of State Economic Develop-ment Incentives on Employment Growth of Establishments.” Journal of Regional Science Volume 42, Number 4. 2002.
• Gorin, Dan. “Economic Development INcentives: Research Approaches and Current Views.” Federal Reserve Bulletin. October 2008.
• Johnson, Thomas G, and Stallmann, Judith I. “Incentive programs: some best practices.” University of Missouri-Columbia. 2010.
• Peters, Alan and Fisher, Peter. “The Failures of Economic Development Incen-tives.” Journal of the American Planning Association. Winter 2004.
• Sands, Gary; Reese, Laura A; and Khan, Heather L. “Implementing Tax Abate-ments in Michigan: A Study of Best Practices.” Economic Development Quar-terly Volume 20, Number 1. February 2006.
JOBS ANALYSIS In order to estimate the number of jobs created, required, and projected at com-panies receiving targeted incentives, we used monitoring data from the Cabinet for Economic Development. This monitoring data included the name of the firm receiving the incentive, the incentive that the firm is receiving, the final approval date, the status of the incentive, the total approved amount of credits that the firm could collect over the course of the incentive period, beginning employment at the firm upon receiving the incentive, the required number of jobs for each year when the incentive was active, the projected number of jobs for each year when the incentive was active, and the reported total number of jobs at the firm for each year when the incentive was active. This section out-lines the multi-step process that we used in order to determine these figures.
Anderson Economic Group, LLC C-1

Estimating Jobs Required and Total Jobs
Upon trying to compile monitoring data provided by the CED, we realized that there were a number of data issues. Primarily, “total jobs” and “jobs required” in some parts of the data represented full employment at a site and in other parts of the data represented new employment at the site since receiving the incentive. There were no patterns as to when the category represented total employment and when it represented new employment, so we estimated these figures.
Total Jobs. When employment was zero, or when the total jobs figure was greater than projected jobs and beginning employment combined, we assumed that total jobs did in fact reflect full employment. On the other hand, when the “total jobs” figure was considerably less than beginning employment and none of those other conditions were satisfied, we assumed that it represented new employment (that beginning employment plus the “total jobs” figure in fact rep-resented total jobs). For “total jobs” figures that were not as clear-cut, we used our judgement to assign the value of total jobs.
Required Jobs. In cases where required jobs were shown to be 10, 15, or less than projected jobs, we assumed that required jobs represented required new jobs. We chose values of 10 and 15 here because many incentive programs have this exact requirement for job creation. In all other cases, with few exceptions, we assumed that the “required jobs” figure shown actually reflected the required total employment that needed to be present in order for the firm to comply.
Once we were confident that “total jobs” and “required jobs” in the data were consistent, we could move on to the analysis of how many jobs were created and maintained within each program.
Created and Maintained Jobs
In our analysis, it is important to keep in mind our use of the following terms, strictly defined:
• New jobs are the number of jobs in any given year that exceed beginning employment, which is the total employment at the firm prior to activation of the incentive.
• Retained jobs are jobs that continue to exist at the firm—essentially, total employment at the firm up to the amount of beginning employment.
These terms are important because we use them to describe the number of jobs at a firm that correspond to receiving an incentive. When a firm is supposed to create new jobs, we only count new jobs toward our jobs measures. When a firm is required to retain a certain amount of employment, we also add retained jobs to the total jobs corresponding to receiving the incentive. The implication in cases where we include retained jobs is that the firm would not have kept the retained jobs in the state if it were not for receiving an incentive. (There are only
Anderson Economic Group, LLC C-2

a few occasions where a firm is required to retain jobs and create new ones. In that case, we add both together to get the number of jobs associated with a given incentive.)
• Created jobs reflect the new and/or retained jobs that appear at a firm in the first year of monitoring by the state.
• Maintained jobs are new and/or retained jobs that the firm continues to report after the first year of monitoring.
Defined this way, when we use “created jobs,” we are referring to a one-time estimate of how many jobs were created at the firm. “Maintained jobs” occur every year. That is, each year, we count the total new and/or retained jobs towards the total amount of maintained jobs. Other analysis showed that “cre-ated jobs” is actually a conservative estimate of total jobs corresponding to an incentive because firms that continuously reported jobs tended to increase their employment over time.
Jobs Numbers Annually and by Program
In the section presenting jobs created and maintained, we show two tables: Table 39 on page 84 shows the jobs created, maintained, and required for all incentive programs with jobs requirements by year, while Table 40 on page 85 shows the jobs created, maintained, and required for all incentive programs with jobs requirements by program. Note that the sum of the numbers in Table 40 is considerably higher than that in the other table due to overlap. In any one year, when presenting the data by year, we wanted to count additional jobs at a firm only once, even if it was receiving multiple incentives. By contrast, when pre-senting the data by program, we presented total jobs created, maintained, and required for all firms receiving that incentive, regardless of whether they were receiving an incentive from another program or not.
The difference between these two tables is large primarily because new jobs and jobs maintained at firms is dependent on the base of employment. As a rule, when a firm was receiving more than one incentive in a given year, we used all of the data under the most recent incentive that business received in order to estimate jobs created, maintained, and required for that firm in that year. If a firm received a new incentive several years after its initial incentive, and its employment was elevated, then the estimated amount of jobs created or main-tained would be less, due to the higher level of “beginning employment.” Note that jobs created or maintained would be greater if some firm happened to have lost jobs after initially receiving the incentive. This provides for a more conser-vative estimate of annual jobs created and maintained.
Anderson Economic Group, LLC C-3
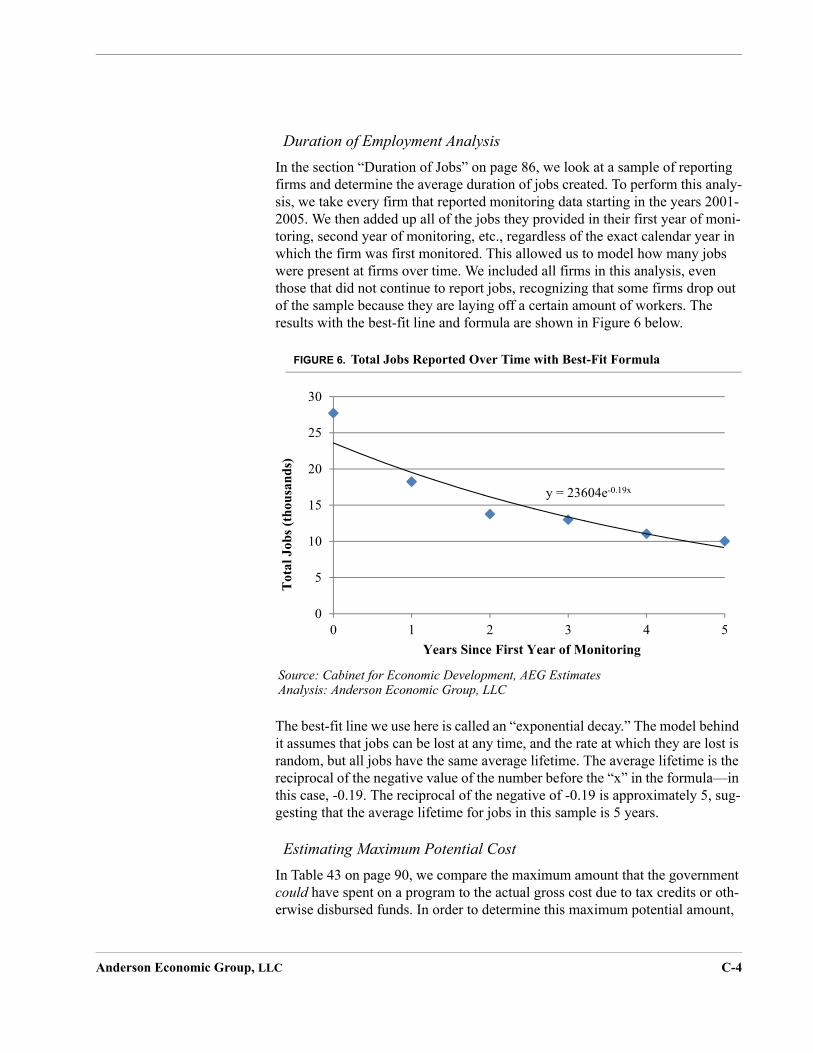
Duration of Employment Analysis
In the section “Duration of Jobs” on page 86, we look at a sample of reporting firms and determine the average duration of jobs created. To perform this analy-sis, we take every firm that reported monitoring data starting in the years 2001-2005. We then added up all of the jobs they provided in their first year of moni-toring, second year of monitoring, etc., regardless of the exact calendar year in which the firm was first monitored. This allowed us to model how many jobs were present at firms over time. We included all firms in this analysis, even those that did not continue to report jobs, recognizing that some firms drop out of the sample because they are laying off a certain amount of workers. The results with the best-fit line and formula are shown in Figure 6 below.
FIGURE 6. Total Jobs Reported Over Time with Best-Fit Formula
The best-fit line we use here is called an “exponential decay.” The model behind it assumes that jobs can be lost at any time, and the rate at which they are lost is random, but all jobs have the same average lifetime. The average lifetime is the reciprocal of the negative value of the number before the “x” in the formula—in this case, -0.19. The reciprocal of the negative of -0.19 is approximately 5, sug-gesting that the average lifetime for jobs in this sample is 5 years.
Estimating Maximum Potential Cost
In Table 43 on page 90, we compare the maximum amount that the government could have spent on a program to the actual gross cost due to tax credits or oth-erwise disbursed funds. In order to determine this maximum potential amount,
y = 23604e-0.19x
0
5
10
15
20
25
30
0 1 2 3 4 5
Tota
l J
ob
s (t
hou
san
ds)
Years Since First Year of Monitoring
Source: Cabinet for Economic Development, AEG EstimatesAnalysis: Anderson Economic Group, LLC
Anderson Economic Group, LLC C-4

we had to make some estimates based on the approved amount and how it might be distributed over time. Our methods were tailored to each incentive, as described below. Note that breaking down the amount of incentive that firms might be eligible for in each year was necessary because incentives are ongo-ing, and we only want to include the potential cost of the program in the years 2001-2010:
• For KBI, the calculation was straightforward. The state calculates a maximum amount of incentive that each project can receive on an annual basis. We simply added up these amounts for all active incentives in the year 2010. (Our analysis only covers the years 2001 to 2010, and 2010 was the first year that KBI incen-tives were active).
• For KREDA, KIDA, and KJDA, the state provided a list of all years for which the active incentives were expected to continue, regardless of whether they actually did. We assumed that the approved amount of claim would be distrib-uted evenly across all years, providing us with an annual estimate of the maxi-mum approved amount for that given year.
• For KEOZ, there was only one firm receiving an incentive, and that incentive was active for four years. Since the only approved money was available between the years 2001 and 2010, we simply included the entire amount.
• For KRA, there is only one firm receiving an incentive. That firm has been approved for a total amount of $43 million, all of which is included in our esti-mate for maximum amount.
• For OCI High-Tech pools, we were provided with data regarding all disburse-ments from the loan pool fund. To determine the maximum amount that the government could have spent, we added up all approved money for all projects, included those that were eventually withdrawn or paid back. We did not need to worry about the distribution of funds over time, in this case, because funds are all provided up-front.
• For KIRA, we added up the total approved amount for all firms receiving final approval during the years 2001 to 2010.
EFFECTIVENESS ANALYSIS
This section describes our methodology and assumptions used to evaluate the threshold effectiveness of several key business tax incentives in Kentucky as described in “Evaluating the Effectiveness of Key Incentives in Creating Jobs”
on page 97.1 We estimate each incentive program’s “threshold effectiveness” using a simulation model we created. This model answers the question:
“For this incentive program, what proportion of the associated jobs must be genuinely new to the state for the program to perform better than an alternative policy of cutting a broad-based business tax?”
1. Portions of this description are excerpted from the report where we first used this model: Anderson, Patrick L., Rosaen, Alex L., and Doe, Hilary. “Effectiveness of Michigan’s Key Business Tax Incentives,” Anderson Economic Group LLC, March 2010.
Anderson Economic Group, LLC C-5
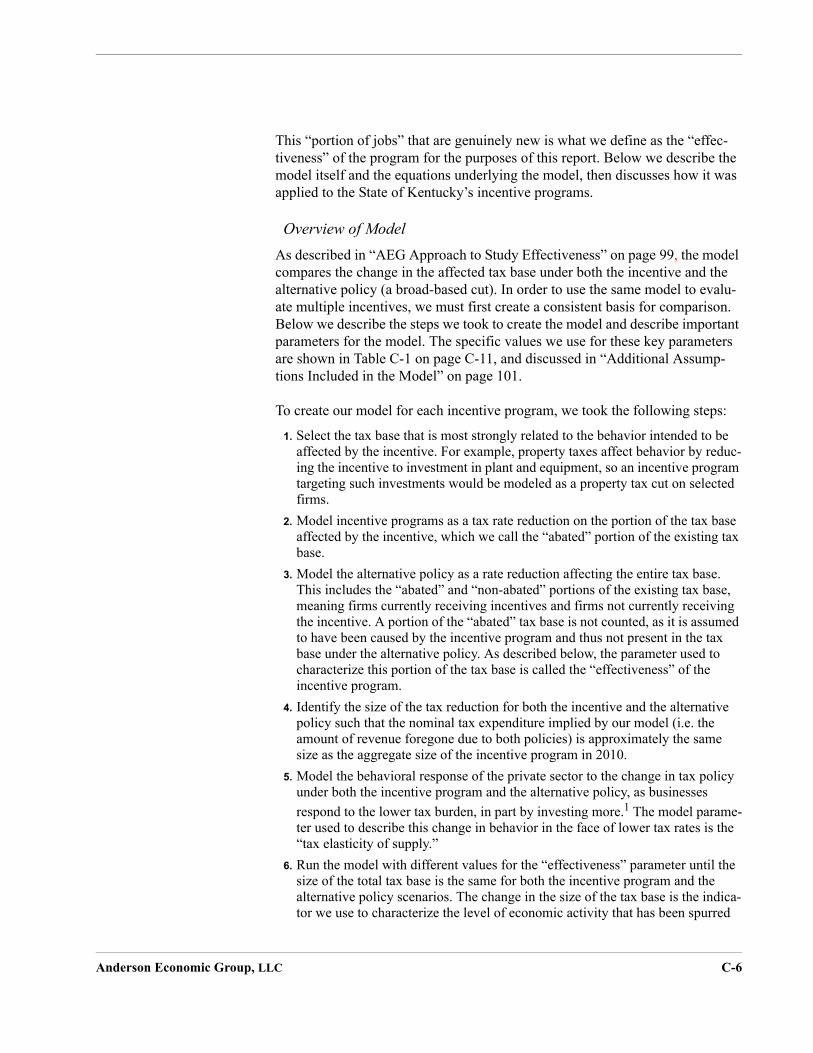
This “portion of jobs” that are genuinely new is what we define as the “effec-tiveness” of the program for the purposes of this report. Below we describe the model itself and the equations underlying the model, then discusses how it was applied to the State of Kentucky’s incentive programs.
Overview of Model
As described in “AEG Approach to Study Effectiveness” on page 99, the model compares the change in the affected tax base under both the incentive and the alternative policy (a broad-based cut). In order to use the same model to evalu-ate multiple incentives, we must first create a consistent basis for comparison. Below we describe the steps we took to create the model and describe important parameters for the model. The specific values we use for these key parameters are shown in Table C-1 on page C-11, and discussed in “Additional Assump-tions Included in the Model” on page 101.
To create our model for each incentive program, we took the following steps:
1. Select the tax base that is most strongly related to the behavior intended to be affected by the incentive. For example, property taxes affect behavior by reduc-ing the incentive to investment in plant and equipment, so an incentive program targeting such investments would be modeled as a property tax cut on selected firms.
2. Model incentive programs as a tax rate reduction on the portion of the tax base affected by the incentive, which we call the “abated” portion of the existing tax base.
3. Model the alternative policy as a rate reduction affecting the entire tax base. This includes the “abated” and “non-abated” portions of the existing tax base, meaning firms currently receiving incentives and firms not currently receiving the incentive. A portion of the “abated” tax base is not counted, as it is assumed to have been caused by the incentive program and thus not present in the tax base under the alternative policy. As described below, the parameter used to characterize this portion of the tax base is called the “effectiveness” of the incentive program.
4. Identify the size of the tax reduction for both the incentive and the alternative policy such that the nominal tax expenditure implied by our model (i.e. the amount of revenue foregone due to both policies) is approximately the same size as the aggregate size of the incentive program in 2010.
5. Model the behavioral response of the private sector to the change in tax policy under both the incentive program and the alternative policy, as businesses
respond to the lower tax burden, in part by investing more.1 The model parame-ter used to describe this change in behavior in the face of lower tax rates is the “tax elasticity of supply.”
6. Run the model with different values for the “effectiveness” parameter until the size of the total tax base is the same for both the incentive program and the alternative policy scenarios. The change in the size of the tax base is the indica-tor we use to characterize the level of economic activity that has been spurred
Anderson Economic Group, LLC C-6
by these policies. Thus, we assume that having the same tax base size after behavioral effects are accounted for indicates that the two policies will have approximately the same effect on economy-wide employment and earnings.
We list the relevant equations and variable definitions below. For the extensive calculations performed for multiple programs under varying assumptions, we coded these equations and variables into a model using Matlab software.
Limitations. Note that this approach does not attempt to model certain indirect effects, including:
• There is no policy “signaling” effect, which might encourage or discourage investors or operators to expand operations in the state because the state was changing policy.
• We did not model the related fiscal expenditure effect, primarily because the tax rate change was set to result in a modest change in overall tax revenue.
• We did not model the second-round incentive effect on the formerly-abated tax base, primarily because the abatement fractions encountered in actual programs (often 40 percent or higher) were substantially higher than the tax rate reduc-tions (often one or two percent) we used to model the revenue effects.
• We did not include the deadweight loss associated with the expenses of lobby-ing for tax abatements, applying for them, or administering them.
• We did not estimate any policy instability, wherein a state might create then can-cel or significantly modify an incentive program before it has had a chance to have its full impact.
1. Some of the increased tax base will come from increased economic activity, and some will come from changes in tax planning behavior. Our analysis does not attempt to quantify what portion comes from which source, but it does implicitly make two assumptions. First, it assumes that some of the increase in the size of the tax base comes from increased economic activity. Second, it assumes that the proportion coming from new economic activity is the same between the incentive and the alternative policy.
Anderson Economic Group, LLC C-7
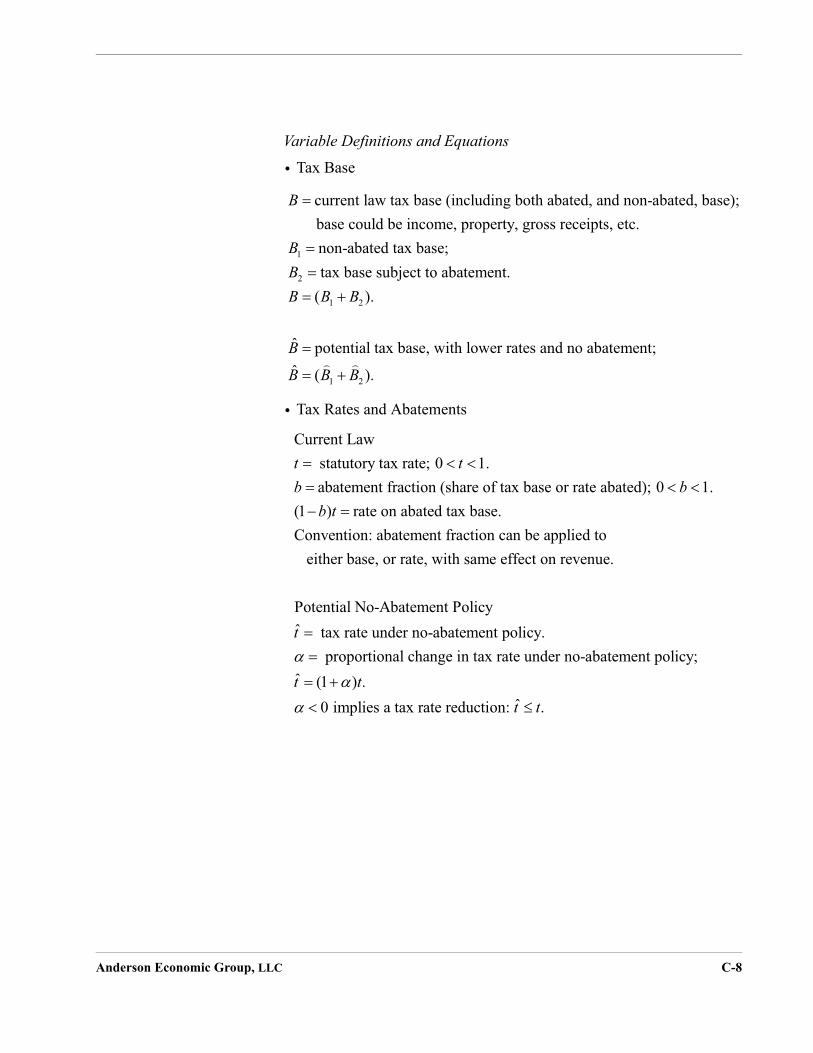
Variable Definitions and Equations
• Tax Base
• Tax Rates and Abatements
1
2
1 2
current law tax base (including both abated, and non-abated, base); base could be income, property, gross receipts, etc.
non-abated tax base;tax base subject to abatement.
( ).
ˆ pot
B
BBB B B
B
1 2
ential tax base, with lower rates and no abatement;ˆ ( ).B B B
Current Law statutory tax rate; 0 1.abatement fraction (share of tax base or rate abated); 0 1.
(1 ) rate on abated tax base.Convention: abatement fraction can be applied to either base, o
t tb b
b t
r rate, with same effect on revenue.
Potential No-Abatement Policyˆ tax rate under no-abatement policy.
proportional change in tax rate under no-abatement policy; ˆ (1 ) .
0 implies a tax rate r
t
t tˆeduction: .t t
Anderson Economic Group, LLC C-8

• Elasticity, Effectiveness, and Policy Change Parameters
• Change in Non-abated Tax Base
tax-price elasticity of supply; normally 0. Tax-price elasticity is defined as proportional change in tax base due to a proportional change in the tax-price.
proportional change in tax rate under no-abatement policy; ˆ 0 , a tax rate reduction.
direct effectiveness of abatement program; defined as share of incentivized tax base that occurs primarily because
t teff
of the incentive. 0 1.eff
1
1
proportional
proportional changechange in tax base change in tax base
in tax rate proportional
change in tax rate
tax base
proportiona
BB
1 1 1
l
change in tax base.
.B B B
Anderson Economic Group, LLC C-9

• Change in Abated Tax Base
2 2
change due to
rate change
share of tax base due
to abatement
change due to
abatement elimination
tax base
change in tax base
B eff B C
change due to
rate change
Assumption: latter term is close enough to zero to ignore, for cases
where abatement fraction is much larger than tax rate change,
or where "effectiveness" param
2 2
2 2 2 2
2 2
eter is estimated with rate
change in mind.
.
1
Revenue from formerly-abated tax base.
B eff B
B B B eff B
R B t
Anderson Economic Group, LLC C-10

Table C‐1. Assumptions and Inputs for Economic Impact Analysis of Key Incentives
OCI BSSC
High-Tech PoolsBSSC-Training Investment Credit
Prim/1 Property Tax Individual Income Tax/2 41,946,795,501$ 54,842,951,172$ /3 41,905,195,501$ 54,833,708,890$ /4 41,600,000$ 9,242,282$ /5 1.1% 5.80%/6 194% 52%/7 5,200,000$ 536,052$
Beh/8 -0.35 -0.20
Emp/9 -0.2% -0.01%/10 1.4760 1.1289
Note/1/2
/3/4 KBI
/5 inery and equipment./6
/7
/8 astic.
/9/10 industries.
An C - 11
KIDA KREDA KJDA KBIary FactorsBase Affected Corporate Income Tax Corporate Income Tax Corporate Income Tax Corporate Income TaxTotal Size of Affected Tax Base (2010) 4,828,391,226$ 4,828,391,226$ 4,828,391,226$ 4,828,391,226$
Non-Abated Tax Base 4,564,842,326$ 4,607,705,409$ 4,770,404,913$ 4,828,362,615$ Abated Tax Base 263,548,900$ 220,685,817$ 57,986,313$ 28,611$
Representative Current Tax Rate 6.0% 6.0% 6.0% 6.0%Abatement as Proportion of Tax Rate 100% 100% 100% 100%Nominal Expenditure/Tax Expenditure 2010 15,812,934$ 66,205,745$ 17,395,894$ 8,583$
avioral ParametersTax Price Elasticity -0.35 -0.35 -0.35 -0.35
loyment ParametersAlternative Tax reduction -5.6% -4.7% -1.2% -0.001%Ratio: Personal Income to Tax Base 12.8227 12.8227 12.8227 12.8227
s:Based on eligibility criteria in enabling statutes.Size of tax base base under current law. Corporate Income Tax base from Council of State Governments, “The Book of the States”, July 2011 . Property and individualincome tax base information from KY Department of Revenue. Approximate property tax base estimated using property tax collections on real and tangible propertyfrom Department of Revenue and effective rates on real and tangible property.Non-abated tax base: (total tax base)-(portion of tax base eligible for abatement).Portion of tax base who received abatement. Sources include treasury documents and AEG estimates based on professional judgment and nominal tax expenditures. Forand predecessors, assumes that nominal tax expenditure is approximately 30% of total investment, based on historical rate.Relevant tax rate used for respective incentives. Property tax rate is a blended rate including average effective rates on real property and commercial and industrial machAbatement shares set based on tax base and rate assumptions such that the model will accurately capture the abatement size for each year the incentive is active.Proportion greater than 100% indicates direct subsidy or refundable credit greated than tax liability.All reported expenditures from KY CED.(Notes continued on next page)Tax price elasticity (Percent change in base receiving abatement/Percent change in tax rate). A value of "-.1" means demand is more inelastic, and "-0.3" means more elValues based on professional judgment.Percentage reduction in tax rate under alternative policy where abatement is canceled and replaced with a reduction in the underlying tax.Ratio of employee income in respective business industry to tax base, annualized. Estimated using professional judgement and based on statewide averages for affected Total wages in industrial and commercial enterprises at private companies from U.S. Census. See Appendix Table C-2.
KBI and Predecessors
derson Economic Group, LLC

PEER ANALYSIS In “Comparison of Kentucky’s Business Environment with Peer States” on page 29, “Kentucky’s Use of Incentives Compared to Peer States” on page 39, “Knowledge-Based Jobs and Focus on Innovation” on page 48, and “Analysis of Process Selecting the CED Secretary” on page 119, we compare Kentucky to 13 peer states that were chosen by the Cabinet for Economic Development. We compare the state on four specific topics that include:
1. The general business environment in each state;
2. Each state’s use of incentives to address business needs;
3. Each state’s targeting of high-tech and knowledge-based firms; and
4. The process for selecting the leader of each state’s economic development pro-gram and that person’s salary.
In order to compare Kentucky and its peers on their respective business environ-ments we first looked at surveys completed by small business owners and CEOs of firms of all sizes to understand major business needs. These surveys are: Area Development, 25th Annual Corporate Survey, 2010; National Federation of Independent Businesses, National Small Business Poll “Problems and Priori-ties,” 2008; and the National Federation of Independent Businesses Small Busi-ness Impact Study, 2009. We identified metrics for the top concerns that business owners face and that governments have some control over when relo-cating a firm, and measured Kentucky and its peers on those metrics.
We also interviewed site selection consultants that had worked previously with firms that had chosen to locate in Kentucky and firms that did not locate in Ken-tucky. These consultants gave us an indication of the types of incentives that are preferred by business owners, the structure of incentive programs, and key busi-ness concerns. These interviews echoed our findings from the above surveys.
Next, we used the business environment metrics to analyze how Kentucky and its peers are addressing business concerns using incentive programs. We found data on each state’s incentive programs in a database from the Council for Com-munity and Economic Research (C2ER.org). We cross-checked their data with each state’s economic development website to ensure that we had the most up-to-date information available on incentives offered in each state. For our com-parison of incentives that target high-tech and knowledge-based firms we per-formed further analysis of each state’s specific incentives for targeting firms of this type and identified states that had special offices in charge of those pro-grams.
Finally, in our comparison analysis on selecting the Cabinet Secretary or com-parable positions, depending on the state, we relied on each state’s economic development website and transparency websites to determine each person’s sal-ary for the most recently available year. Due to a lack of data, we were not able to analyze the responsibilities of each person in all of the peer states.
Anderson Economic Group, LLC C-12

KNOWLEDGE-BASED INDUSTRIES
In “Kentucky’s Knowledge-Based Industries Compared to Peers” on page 49, we compare Kentucky’s performance in knowledge-based industries to that of peer states. Our definition for “knowledge-based” industries is based primarily on previous research in high-tech and knowledge-based fields. We verified the industries selected by comparing them to high-tech industries in a 2005 paper, in which the Bureau of Labor Statistics defined three levels of high-tech indus-
tries using North American Industry Classification System (NAICS) codes.1
Knowledge-based industries consist of three sectors, as we have defined them: advanced manufacturing, life sciences, and information and communication technology. We define each of these sectors as follows. In each case, we use NAICS codes to define the sectors
Advanced Manufacturing. Advanced manufacturing is divided into two sub-sectors: advanced products and processes and relevant research industries. Advanced products and processes are industries that have high and/or quickly increasing productivity, or produce high-tech or precision products. Relevant research industries are not manufacturing industries, but their research output contributes to progress in manufacturing products and processes. See our 2010
report, “The URC’s Support for Advanced Manufacturing in Michigan,”2 for more information on how these sub-sectors were derived, and which industries are included in each.
Life Sciences. The life sciences include research, technology, manufacturing, and services activities that improve human health, such as the production of medicine and health-related devices. Also, life sciences include industries that provide services that utilize these medicines and devices, such as medical labo-ratories. This sector is divided into two sub-sectors, as presented in this report: the biological cluster and the medical cluster. The biological cluster includes research into medicine and medical devices, as well as their manufacture. The medical cluster includes primarily the services that utilize these devices and administer care. See our 2009 report, “Life Sciences Industry in Michigan and
the University Research Corridor,”3 for more information on how these sub-sec-tors were derived, and which industries are included in each.
Information and Communication Technology (ICT). ICT industries include the study, design, development, implementation, maintenance, and management of information and communication systems. Communication systems involve
1. Daniel E. Hecker, “High-technology employment: a NAICS-based update,” Monthly Labor Review, Bureau of Labor Statistics, July 2005, pp. 57-72.
2. Caroline M. Sallee, Erin Agemy, and Alex L. Rosaen, “The URC’s Support for Advanced Manufacturing in Michigan,” Anderson Economic Group, July 2010.
3. Caroline M. Sallee, Hilary A. Doe, and Patrick L. Anderson, “Life Sciences Industry in Mich-igan and the University Research Corridor,” Anderson Economic Group, May 28, 2009.
Anderson Economic Group, LLC C-13

technologies such as the Internet, wireless networks, cell phones, data storage systems, and related electronic devices. Occupations in these industries vary from programmers and designers to engineers and technicians. We break ICT industries into 3 sub-sectors: computer and math, design and engineering, and installation and repair. In a recent AEG report, we defined these sub-sectors
based on occupations rather than industries.1
In order to include these sub-sectors in our definition of knowledge-based industries, we determined the NAICS industries in which the occupations that defined these sub-sectors were particularly concentrated. There is some overlap between the sub-sectors. We show the industries that make up each sub-sector in Table C-2 on page C-15.
To get our overall definition of knowledge-based industries, as presented in the section “Kentucky’s Knowledge-Based Industries Compared to Peers” on page 49, we combined all of these sectors together and eliminate the overlap. In addition, we only included 4-digit NAICS industries, so when there were multi-ple 5-digit or 6-digit NAICS industries under the definitions of the 3 individual sectors discussed above, we used the 4-digit NAICS industries that were com-mon to all of them. All industries included in our definition of knowledge-based industries are shown in Table C-3 on page C-16.
After industries were defined, we used state-level data from the U.S. Census Bureau County Business Patterns survey to aggregate total annual payroll and employment in each industry in each state. Average wage was derived by divid-ing total annual payroll by total employment.
1. Caroline M. Sallee and Erin Agemy, “The University Research Corridor’s Support for Infor-mation and Communication Technology in Michigan,” Anderson Economic Group, May 31, 2011.
Anderson Economic Group, LLC C-14
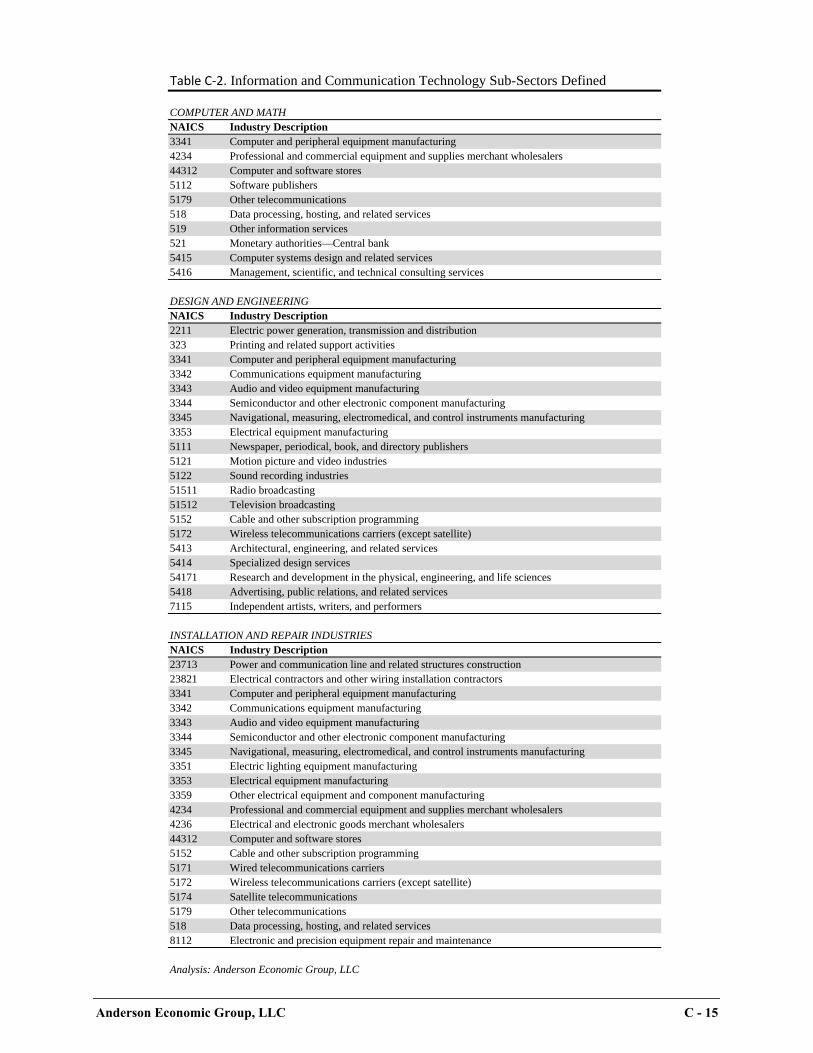
COMPUTER AND MATH
Table C‐2. Information and Communication Technology Sub-Sectors Defined
NAICS Industry Description3341 Computer and peripheral equipment manufacturing4234 Professional and commercial equipment and supplies merchant wholesalers44312 Computer and software stores5112 Software publishers5179 Other telecommunications518 Data processing, hosting, and related services519 Other information services521 Monetary authorities—Central bank5415 Computer systems design and related services5416 Management, scientific, and technical consulting services
DESIGN AND ENGINEERINGNAICS Industry Description2211 Electric power generation, transmission and distribution323 Printing and related support activities3341 Computer and peripheral equipment manufacturing3342 Communications equipment manufacturing3343 Audio and video equipment manufacturing3344 Semiconductor and other electronic component manufacturing3345 Navigational, measuring, electromedical, and control instruments manufacturing3353 Electrical equipment manufacturing5111 Newspaper, periodical, book, and directory publishers5121 Motion picture and video industries5122 Sound recording industries51511 Radio broadcasting51512 Television broadcasting5152 Cable and other subscription programming5172 Wireless telecommunications carriers (except satellite)5413 Architectural, engineering, and related services5414 Specialized design services54171 Research and development in the physical, engineering, and life sciences5418 Advertising, public relations, and related services7115 Independent artists, writers, and performers
INSTALLATION AND REPAIR INDUSTRIESNAICS Industry Description23713 Power and communication line and related structures construction23821 Electrical contractors and other wiring installation contractors3341 Computer and peripheral equipment manufacturing3342 Communications equipment manufacturing3343 Audio and video equipment manufacturing3344 Semiconductor and other electronic component manufacturing3345 Navigational, measuring, electromedical, and control instruments manufacturing3351 Electric lighting equipment manufacturing3353 Electrical equipment manufacturing3359 Other electrical equipment and component manufacturing4234 Professional and commercial equipment and supplies merchant wholesalers4236 Electrical and electronic goods merchant wholesalers44312 Computer and software stores5152 Cable and other subscription programming5171 Wired telecommunications carriers5172 Wireless telecommunications carriers (except satellite)5174 Satellite telecommunications5179 Other telecommunications518 Data processing, hosting, and related services8112 Electronic and precision equipment repair and maintenance
Analysis: Anderson Economic Group, LLC
Anderson Economic Group, LLC C - 15

Table C‐3. Knowledge-Based Industries Defined
NAICS Industry Description
2211 Electric power generation, transmission, and distribution3112 Grain and oilseed milling3113 Sugar and confectionery product manufacturing3115 Dairy product manufacturing3118 Bakeries and tortilla manufacturing3119 Other food manufacturing3121 Beverage manufacturing3221 Pulp, paper, and paperboard mills323 Printing and related support activities3241 Petroleum and coal products manufacturing3251 Basic chemical manufacturing3252 Resin, synthetic rubber, and artificial synthetic fibers and filaments manufacturing3254 Pharmaceutical and medicine manufacturing3255 Paint, coating, and adhesive manufacturing3259 Other chemical product and preparation manufacturing3311 Iron and steel mills and ferroalloy manufacturing3314 Nonferrous metal (except aluminum) production and processing3329 Other fabricated metal product manufacturing3331 Agriculture, construction, and mining machinery manufacturing3332 Industrial machinery manufacturing3333 Commercial and service industry manufacturing3336 Engine, turbine, and power transmission equipment manufacturing3339 Other general purpose machinery manufacturing3341 Computer and peripheral equipment manufacturing3342 Communications equipment manufacturing3343 Audio and video equipment manufacturing3344 Semiconductor and other electronic component manufacturing3345 Navigational, measuring, electromedical, and control instruments manufacturing3351 Electric lighting equipment manufacturing3352 Household appliance manufacturing3353 Electrical equipment manufacturing3359 Other electrical equipment and component manufacturing3361 Motor vehicle manufacturing3364 Aerospace product and parts manufacturing3369 Other transportation equipment manufacturing3372 Office furniture (including fixtures) manufacturing3391 Medical equipment and supplies manufacturing4234 Professional and commercial equipment and supplies merchant wholesalers4236 Electrical and electronic goods merchant wholesalers5111 Newspaper, periodical, book, and directory publishers5112 Software publishers5121 Motion picture and video industries5122 Sound recording industries5151 Radio and television broadcasting5152 Cable and other subscription programming5171 Wired telecommunications carriers5172 Wireless telecommunications carriers (except satellite)5174 Satellite telecommunications5179 Other telecommunications518 Data processing, hosting, and related services519 Other information services521 Monetary authorities - central bank5413 Architectural, engineering, and related services5414 Specialized design services5415 Computer systems design and related services5416 Management, scientific, and technical consulting services5417 Scientific research and development services5418 Advertising, public relations, and related services6215 Medical and diagnostic laboratories7115 Independent artists, writers, and performers8112 Electronic and precision equipment repair and maintenanceAnalysis: Anderson Economic Group, LLC
Anderson Economic Group, LLC C - 16

SURVEY OF REPORTS ON INCENTIVE PROGRAMS
In order to evaluate the monitoring and reporting of information on Kentucky’s incentive programs, we evaluated an exhaustive list of reports related to Ken-tucky’s incentives. We looked at all reports submitted to the Legislature on Ken-tucky’s incentive programs, primarily by the CED, the Tourism Cabinet, and the Personnel Cabinet. A few of these reports are available online, but most of them were provided in hard copy form from the relevant agency. We reviewed the fol-lowing reports.
• Bluegrass State Skills Corporation Annual Report, FY 2010-11
• Kentucky New Energy Ventures Fund FY 2011 Annual Report
• Personnel Cabinet Quarterly Report, October 4, 2011
• Personnel Cabinet 2010 Turnover Reporting/4th Quarter Reports
• Semi-Annual Report of Riverport Marketing Assistance Trust Fund, 4th Quarter 2011
• Kentucky Economic Development Finance Authority Monthly Construction Activity Reports, October 2010-December 2011
• 2011 Programmatic Involvement Report for the Cabinet for Economic Develop-ment
• Kentucky Personnel Cabinet Annual Report 2010-2011
• Office of Commercialization and Innovation Performance Report, July 1, 2010-June 30, 2011
• Kentucky Enterprise Initiative Act (KEIA) Fiscal Year 2011 Annual Report
• Kentucky Investment Fund Act (KIFA) Annual Report, July 1, 2010-June 30, 2011
• Cabinet for Economic Development Report to Personnel Board, October 1, 2010-August 1, 2011
• 2011 Incentives for Energy Independence Act Annual Report
• Business Information Clearinghouse Annual Report, January 1, 2010-December 31, 2010
• Agricultural Warehousing Site Cleanup Fund Annual Report, FY 2011
• Cabinet for Economic Development Linked Deposit Loan Program, FY 2011
• Cabinet for Economic Development Investment Capital Report, FY 2011
• EDB Pool Report for Projects Approved from 7/1/10-6/30/11
• Capital Projects and Bond Oversight Committee Report, 2011
• Quarterly Capital Projects Reports, 2012 1st Quarter, for:
• Commonwealth Office of Technology
• Administrative Office of the Courts
• Finance and Administration Cabinet
• Murray State University
• Northern Kentucky University
• University of Kentucky
Anderson Economic Group, LLC C-17

• University of Louisville
• Western Kentucky University
• Capital Planning Advisory Board Agency Capital Plan, 2012-2018
• Kentucky Production Industry Incentives Annual Report, FY 2011
• Kentucky Tourism Development Act Incentives Annual Report, FY 2011
• Kentucky Economic Development Finance Authority Financial Statements, FY 2001-2011
• Bluegrass State Skills Corporation Financial Statement, FY 2011
Anderson Economic Group, LLC C-18

Appendix D. About the Authors
ANDERSON ECONOMIC GROUP
Anderson Economic Group, LLC is research and consulting firm specializing in economics, public policy, finance and business valuation, and market and indus-try analysis. The firm has offices in Chicago, Illinois and East Lansing, Michi-gan. For more information please visit www.AndersonEconomicGroup.com.
STUDY’S AUTHORS Caroline M. Sallee. Ms. Sallee is a Senior Consultant and Director of the Pub-lic Policy and Economic Analysis practice area.
Ms. Sallee’s recent work includes preparing the report Dollars and Sense, a 2011 citizen’s guide to Michigan’s financial health released by Governor Rick Snyder. Ms. Sallee also completes an annual economic impact assessment for Michigan’s University Research Corridor (Michigan State University, Univer-sity of Michigan, and Wayne State University), and has done work for a number of other universities including the University of Chicago. She is also the lead author of the firm’s annual 50-state business tax burden study.
Prior to joining Anderson Economic Group, Ms. Sallee worked for the U.S. Government Accountability Office (GAO) as a member of the Education, Workforce and Income Security team. She has also worked as a market analyst for Hábitus, a market research firm in Quito, Ecuador and as a legislative assis-tant for two U.S. Representatives.
Ms. Sallee holds a Master of Public Policy degree from the Gerald R. Ford School of Public Policy at the University of Michigan and a Bachelor of Arts degree in economics and history from Augustana College.
Colby W. Spencer. Colby W. Spencer is a Senior Analyst at Anderson Eco-nomic Group, working in the Public Policy and Economic Analysis; and Market and Industry practice areas. Ms. Spencer’s background is in econometrics, pub-lic policy, local government, urban and social policy, and education.
Prior to coming to Anderson Economic Group Ms. Spencer worked with the Michigan Municipal League on the 21st Century Communities project provid-ing consulting services to local governments in Michigan concerning local eco-nomic development initiatives. Ms. Spencer held a fellowship at Columbia University as a teaching assistant for Quantitative Analysis and Operations Management. She has also taught in the District of Columbia Public Schools.
Ms. Spencer holds a Bachelor of Science in Education from New York Univer-sity and a Master of Public Administration from the School of International and Public Affairs at Columbia University.
Jason Horwitz. Mr. Horwitz is a Senior Analyst at Anderson Economic Group, working in the Public Policy and Economic Analysis practice area.
Anderson Economic Group, LLC D-1

Recent projects he has contributed to include a cost-benefit analysis of funding and eligibility changes to Medicaid, an assessment of the effects of personal property tax reform in Michigan, and analyses of the fiscal condition and tax policies of Michigan's state and local governments.
Prior to joining AEG, Mr. Horwitz was the Coordinator of Distribution for the Community Center of St. Bernard near New Orleans, where he oversaw the dis-tribution of donated food, clothes, and household supplies to low-income resi-dents of St. Bernard Parish and New Orleans' Lower Ninth Ward.
Mr. Horwitz holds a Master of Public Policy degree from the Harris School of Public Policy at the University of Chicago and a Bachelor of Arts in Physics and Philosophy from Swarthmore College.
Alex L. Rosaen. Mr. Rosaen is a Consultant at Anderson Economic Group, working in the Public Policy and Economic Analysis practice areas. Mr. Rosaen’s background is in applied economics and public finance.
Mr. Rosaen’s recent work includes several economic and fiscal impact analyses, including of proposed real estate developments, power plants, and infrastructure projects; analysis of tax incentives; an analysis of the impact of federal tax incentives on the freight rail industry; and an analysis of the economic contribu-tion that research universities make in the State of Michigan.
Prior to joining Anderson Economic Group, Mr. Rosaen worked for the Office of Retirement Services (part of the Michigan Department of Management and Budget) for the Benefit Plan Design group. He has also worked as a mechanical engineer for Williams International in Walled Lake, Michigan.
Mr. Rosaen holds a Masters in Public Policy from the Gerald R. Ford School of Public Policy at the University of Michigan. He also has a Masters of Science and a Bachelors of Science in mechanical engineering from the University of Michigan.
Anderson Economic Group, LLC D-2