review of instruments and valuation methods for ... · review of instruments and valuation methods...
TRANSCRIPT
Review of instruments and valuation methods for multifunctional forest policy
Task 1: POLFOREX Project, 2008/2009
Warsaw Ecological Economics Center, Department of Economic Sciences, University of Warsaw (WEEC)
Anna Bartczak Mikołaj Czajkowski Marek Giergiczny Agnieszka Kopańska Tomasz śylicz Forest Research Institute (Instytut Badawczy Leśnictwa, IBL)
Kazimiez Rykowski Ewa Chećko Econ Pöyry
Henrik Lidhjem Kirsten Grønvik Bråten
Supported by a grant from Iceland, Liechtenstein and Norway through the EEA Financial Mechanism and the Norwegian Financial Mechanism and funding by Polish Ministry of Science and Higher Education from science funds
Review of instruments and valuation methods for multifunctional forest policy
Review of instruments and valuation methods for multifunctional forest policy
R-2008-157 Review Task I POLFOREX - final.doc
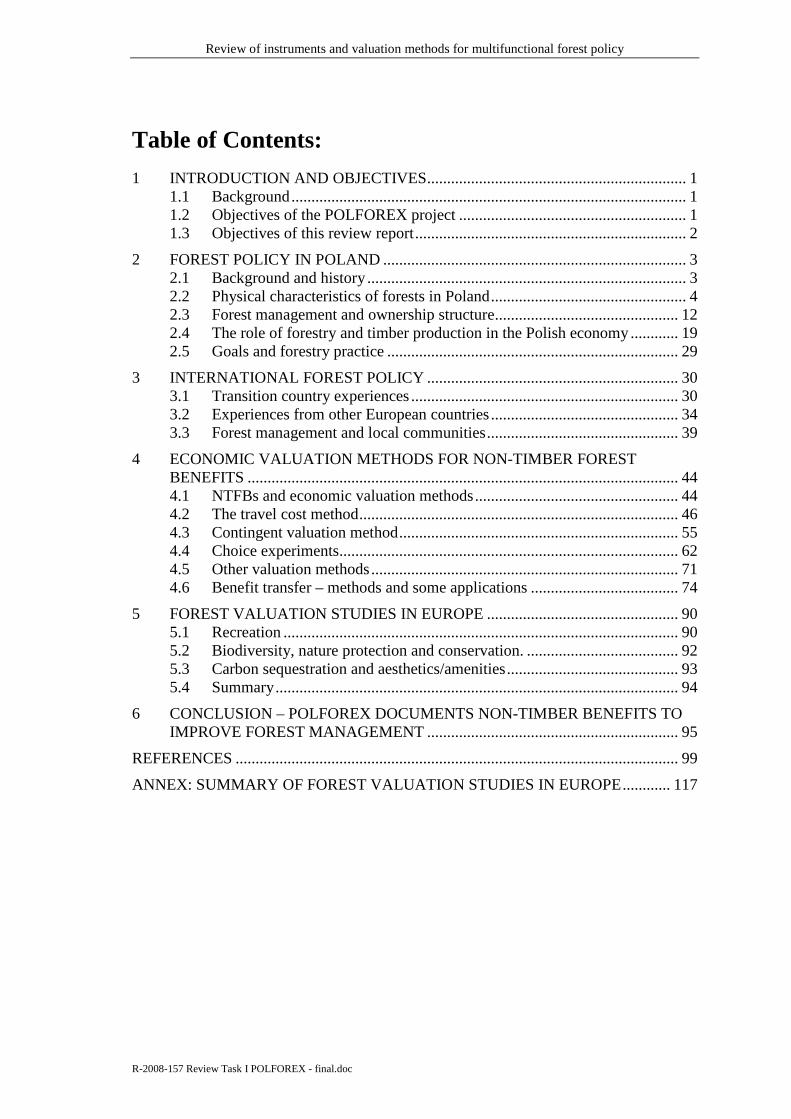
Table of Contents:
1 INTRODUCTION AND OBJECTIVES ................................................................. 1 1.1 Background ................................................................................................... 1 1.2 Objectives of the POLFOREX project ......................................................... 1 1.3 Objectives of this review report .................................................................... 2
2 FOREST POLICY IN POLAND ............................................................................ 3 2.1 Background and history ................................................................................ 3 2.2 Physical characteristics of forests in Poland ................................................. 4 2.3 Forest management and ownership structure .............................................. 12 2.4 The role of forestry and timber production in the Polish economy ............ 19 2.5 Goals and forestry practice ......................................................................... 29
3 INTERNATIONAL FOREST POLICY ............................................................... 30 3.1 Transition country experiences ................................................................... 30 3.2 Experiences from other European countries ............................................... 34 3.3 Forest management and local communities ................................................ 39
4 ECONOMIC VALUATION METHODS FOR NON-TIMBER FOREST BENEFITS ............................................................................................................ 44 4.1 NTFBs and economic valuation methods ................................................... 44 4.2 The travel cost method ................................................................................ 46 4.3 Contingent valuation method ...................................................................... 55 4.4 Choice experiments ..................................................................................... 62 4.5 Other valuation methods ............................................................................. 71 4.6 Benefit transfer – methods and some applications ..................................... 74
5 FOREST VALUATION STUDIES IN EUROPE ................................................ 90 5.1 Recreation ................................................................................................... 90 5.2 Biodiversity, nature protection and conservation. ...................................... 92 5.3 Carbon sequestration and aesthetics/amenities ........................................... 93 5.4 Summary ..................................................................................................... 94
6 CONCLUSION – POLFOREX DOCUMENTS NON-TIMBER BENEFITS TO IMPROVE FOREST MANAGEMENT ............................................................... 95
REFERENCES ............................................................................................................... 99
ANNEX: SUMMARY OF FOREST VALUATION STUDIES IN EUROPE ............ 117
Review of instruments and valuation methods for multifunctional forest policy
1
1 Introduction and objectives
1.1 Background Almost 30% of the land area of Poland is covered by forest. Some of the last remaining low-land, old-growth forests of Europe and much of its biodiversity is also located in Poland. The country has a population which is keen to use forests for resources and recreation. For many years in Poland, like in other countries, the traditional focus of forest management has been on timber harvesting. However, this approach has been changing and nowadays more and more countries, are acknowledging the importance of the full range of benefits from forests (so-called non-timber forest benefits – NTFBs). The provision of some NTFBs may be in conflict with traditional forestry objectives, e.g. protection of sufficiently old and often dead and fallen trees to protect biodiversity. The questions is: Can better knowledge of the full range of benefits from forests help improve the management of forests in Poland, or are current policies and management practices already well balanced? No comprehensive studies have investigated this question in Poland.
In response to this knowledge gap, Warsaw University (Warsaw Ecological Economics Center – WEEC, Department of Economics) in cooperation with the Warsaw Forest Research Institute (FRI), Norwegian University of Life Sciences (Department of Economics and Resource Management) and Econ Pöyry of Norway, jointly applied for funds from the European Economic Area Financing Mechanism1 for a research project entitled:
“Forests as a public good. Evaluation of social and environmental benefits of forests in Poland to improve management efficiency (POLFOREX)”
The current report is the output of the first task of the POLFOREX project, conducted during the autumn of 2008. The duration of the whole project is 2008-2011.
1.2 Objectives of the POLFOREX project The primary objective of the POLFOREX project is to:
• Provide recommendations to improve forest regulation and management in Poland to better match supply and demand for forest goods and services, the aim of which is to increase the social and environmental benefits from forests.
Secondary objectives or concerns important to the project are:
• Forest policy reforms should take rural economic development needs into account in order to reduce resource use conflicts and increases benefits from forests in rural/poor areas.
• Improve valuation methodologies for NTFBs, or at least increase our knowledge about how such methods uncover people’s preferences, with the aim to publish research results in national and international peer reviewed journals.
1 www.eeagrants.org

Review of instruments and valuation methods for multifunctional forest policy
2
• Conduct capacity building and dissemination of methods and results locally and centrally in Poland, with the aim to internalise findings and recommendations, and maybe give a push for using cost benefit analysis in forest policy.
1.3 Objectives of this review report The first task of POLFOREX has been to review forest policy and economic valuation methods for NTFBs. The aim of this review is to identify knowledge and research gaps as basis for the primary research which will be undertaken in Poland during 2009-2010. In more detail, the following areas for review were identified (Chapters of the report in brackets):
• Review physical and institutional characteristics of the forest sector in Poland and current and future (i.e. any long-term plans/strategies) multifunctional forest policy. Describe the economic importance of forestry in Poland. Identify the major policy challenges regarding forest management in Poland (Chapter 2).
• Briefly review forest policy instruments and other countries’ experience with providing non-timber forest benefits vs. “traditional” forestry, especially other transition countries and “best practice” countries (if they exist) (Chapter 3).
• Explain the types of goods and services from forests. Review “state of the art” in economic valuation methods for NTFBs, both theory and applications (Chapters 4 and 5).
• Identify most promising combination of policy-relevant forest policy challenges in Poland and “gaps” in the valuation methods – as input to research plan and detailed design for POLFOREX. Identify areas where the methods can be improved and tested in our surveys. Identify any particular instruments/policies that may be of relevance to Poland (Chapter 6).
In addition, the report contains an Annex with a table list of all the European studies we have found valuing NTFBs.
This report has been jointly written by the research team consisting of Anna Bartczak, Mikolaj Czajkowski, Marek Giergiczny, Agnieszka Kopanska and Tomasz Zylicz, (WEEC), Kazimierz Rykowski and Ewa Chećko (IBL), and Henrik Lindhjem and Kirsten Grønvik Bråten (Econ Pöyry).
Review of instruments and valuation methods for multifunctional forest policy
3
2 Forest policy in Poland This chapter gives a brief background to the forest condition and policy in Poland.
2.1 Background and history
Early history
For centuries, in Poland like elsewhere in Europe, Man’s attitude towards forests was oriented towards exploitation. The forest area was decreasing rapidly as the result of wasteful practices of wood extraction. As early as the mid 16th century, the forest guard was established and 100 years later the forest administrators were obliged to re-afforest exploited areas. Despite that, forest destruction was so significant by the 18th century, that it was necessary to plan for proper utilization and forest regeneration. Just at this time the first forest political regulation was issued by the Polish King – the Proclama-tion on Forest Protection and Management.
The gradual organization of the forest management took place during the 19th century. The first definition of sustainability was formulated by Hartig (1804): “The necessity to guarantee the next generation the chance to benefit from forests to at least the same extent as it is exercised by the present generation”. This definition is not far from the modern concept of sustainable development and use of natural resources of the Brundtland Commission (1986) and is still valid for forest economy. Hartig’s definition has facilitated the development of the fundamentals of modern forestry, based on a deterministic model of so called “normal model forest” that has a balanced age structure of a tree stand. Implementation of this model, which has a clear economic character, negatively changed European forests very deeply from an ecological point of view. Natural broadleaved and mixed forests have been transformed into coniferous monocultures mostly with pine in lowland and spruce in the mountains. That was a destruction of natural forest biodiversity, which has important negative consequences for the stability and health of forests in the future. Forestry focused their interests on timber production and intensification of wood increment (growth) without paying any attention to the forest ecosystem as a whole.
The “normal model forest” and the attempts at its implementation continued, despite extensive deforestation, which occurred in the 19th and early 20th centuries. However it should be mentioned, that this model has had a fundamental significance in increasing wood supply to meet the growing needs of the developing wood and paper industries and building. Wood as the forest’s main product has been an indispensable material in determining the progress of civilization in relation to the human environment. These material aspects of forest production has been a major factor in the cultural development and communication of intellectual ideas through successive generations and have become a significant element of human progress much like architecture, libraries, and museums. At the same time the needs for forest protection and protection of other social and natural forest goods and services has been acknowledged.
Modern forest policy
The first step to change forest policy into a more ecological/social approach was a new Forest Act established by the Polish Parliament in 1991. The new law on forests was the

Review of instruments and valuation methods for multifunctional forest policy
4
first phase of legal regulations concerning many problems of forest and forest manage-ment, which are multiplied in this part of Europe by environmental threats and require-ments of transition to a market economy. The law on forests was part of a package of environmental policy based on the principles of sustainable development (one should remember the elaboration of the new Forest Act period after the Brundland Report (1986)., after the first Conference on the Protection of Forest in Europe held in Strasburg (1990), UNCED Conference in Rio (1992) and after Agenda 21). It defines principles for maintenance, protection and enlargement of forest resources in relation to other environmental components. The most important changes introduced to forestry were the equalizing, in the sense of priority, of three groups of forest functions (production, social and environmental) and establishing a new order of goals for forest economy:
1) Conservation of forests and their positive influence on climate, air, water, soil, conditions of human health and life as well as on whole natural balance of the biosphere;
2) Protection of forests, especially fragments of natural forests valuable for biodiversity, gene pools, landscape and scientific point of view;
3) Protection of soil and areas threatened by pollution presented special social values;
4) Protection of top and ground water, retention of water catchments;
5) Wood and non-wood production as the base of a rational economy.
The shift in importance of forest functions and forest management tasks is an innovative step applied in the Polish forestry regulations. The First decade of political and economical transformation (1990-2000) has been a very active period in the preparation of different new forest documents as well as their amendments. The New Forest Act from 1991 was updated in 1997 and a new definition of Sustainable Forest Management (SFM) was adapted. It recalls the definition of SFM from Helsinki Resolution 1 (1993) almost entirely.The documents most important for the purpose of this study are: The Forest Act (1991 and amendment 1997), The State Forest Policy (1997), Disposition No 14 (1995) and 14a (1999), Disposition No 30 (1994).
2.2 Physical characteristics of forests in Poland
Forest types and climate conditions
Poland is situated on the North European Plain and consists of quite diversified land-scape and ecological conditions: starting from the north where there are depression areas and dunes on the Baltic Sea shore, by mainly lowland and some highlands in the middle of the territory, up to some mountain ranges along the south borders of the country. The climate and weather system are generally transitional and variable, formed by two sources of influence: continental from the east and oceanic from the west. This creates the collision of diverse air masses over the country. Average annual tempera-tures range from 6oC in the north-east to 8oC in the south-west, but temperatures vary widely according to season. Average annual precipitation for the whole country is 600 mm, but ranges up to 1,800 mm in some mountain locations.
The dominant soil types have developed on sands and gravels. Over 60% of the forest soils are rusty podsols and podsolic type soil, and have low water capacity and are nutrient poor. The most distinctive feature of Polish plant cover is its transitional nature
Review of instruments and valuation methods for multifunctional forest policy
5
as compared with neighbouring areas. The c. 2,400 vascular plant species found in Poland are considered a moderately large number by European standards. The countries north and east of Poland have much less diverse plant cover, those to the west and south much more diverse. As you move east, forests become more common with Eurasian features being especially prominent in the far north-east (with boreal elements), while the lowland beech woods and acidophilous oak woods characteristic of western Poland gradually disappear. In lowland regions there are two basic types of habitat: lowland sub-continental mixed pine-oak on fertile soils, and sub-boreal spruce on poorer soils (Matuszkiewicz, 2007).
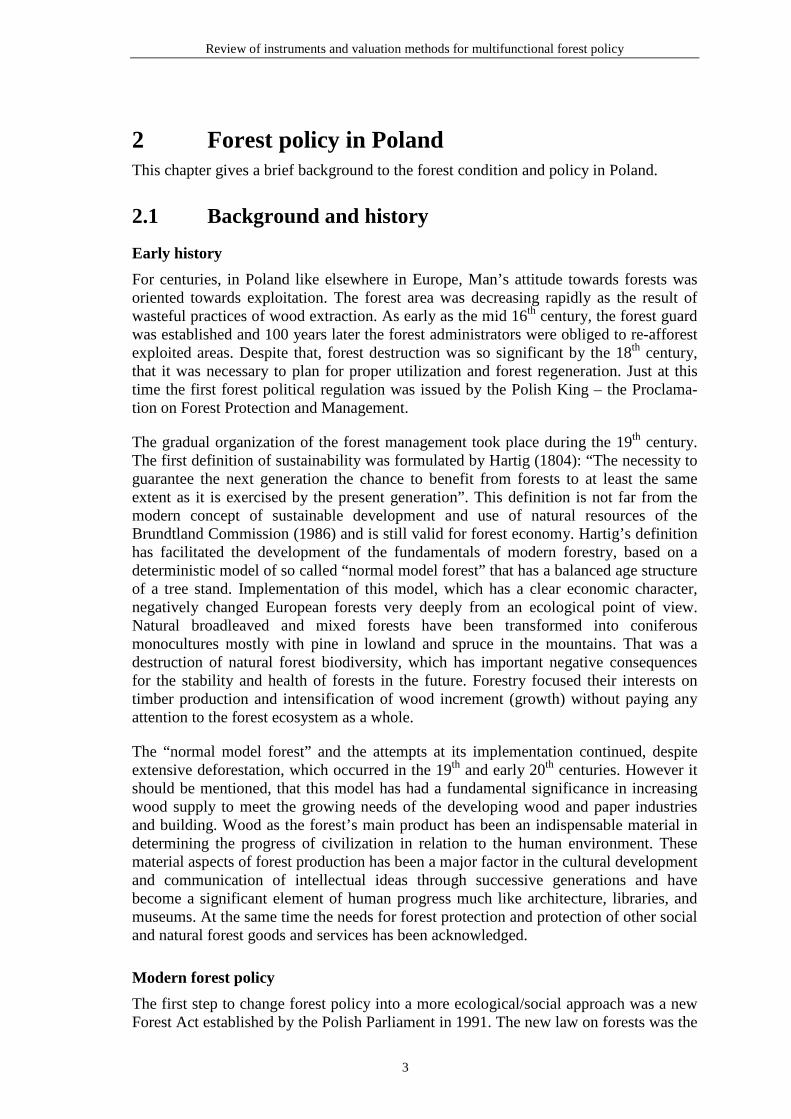
Beside geographical-climatic conditions the structure of polish forests is formed by a natural range of 8 main forest tree species, which have their natural border of appearance in Europe on Polish territory (Figure 2. 1).
Figure 2.1 Natural range of European main tree species on Polish territory
This is an important “landmark” of Polish forests as well as the special responsibility of Polish forestry in relation to other countries. Especially in the light of climate change and likely changes of ecological optimums of tree species that “move” their natural range on north-east direction (Figure 2.2) (Sykes & Prentice 1995).
Review of instruments and valuation methods for multifunctional forest policy
6
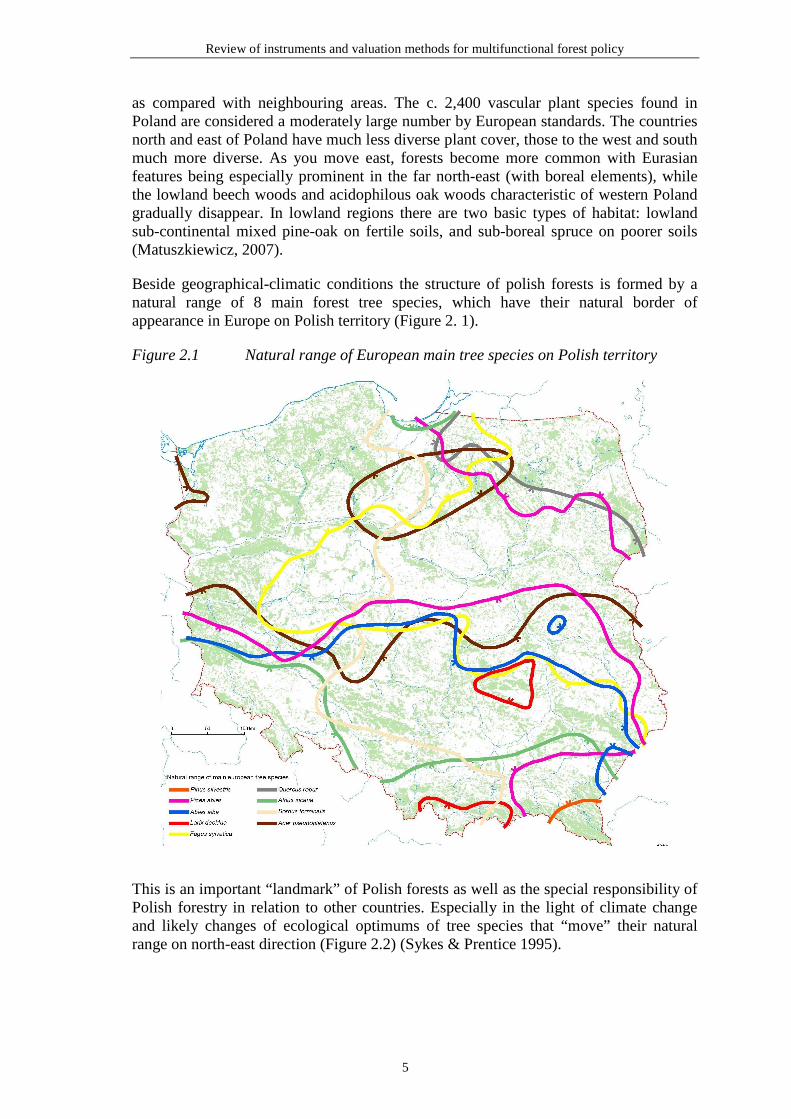
Figure 2.2a Changes in the natural occurrence ranges of Scots pine (Pinus sylvestris) in Europe
A – current status, B – future status, scenario: climate 2xCO2 (dark black colour indicates ecological optimum)
Figure 2.2b Changes in the natural occurrence ranges of Norway spruce (Picea abies) in Europe
A – current status, B – future status, scenario: climate 2xCO2 (dark black colour indicates ecological optimum)
Review of instruments and valuation methods for multifunctional forest policy
7
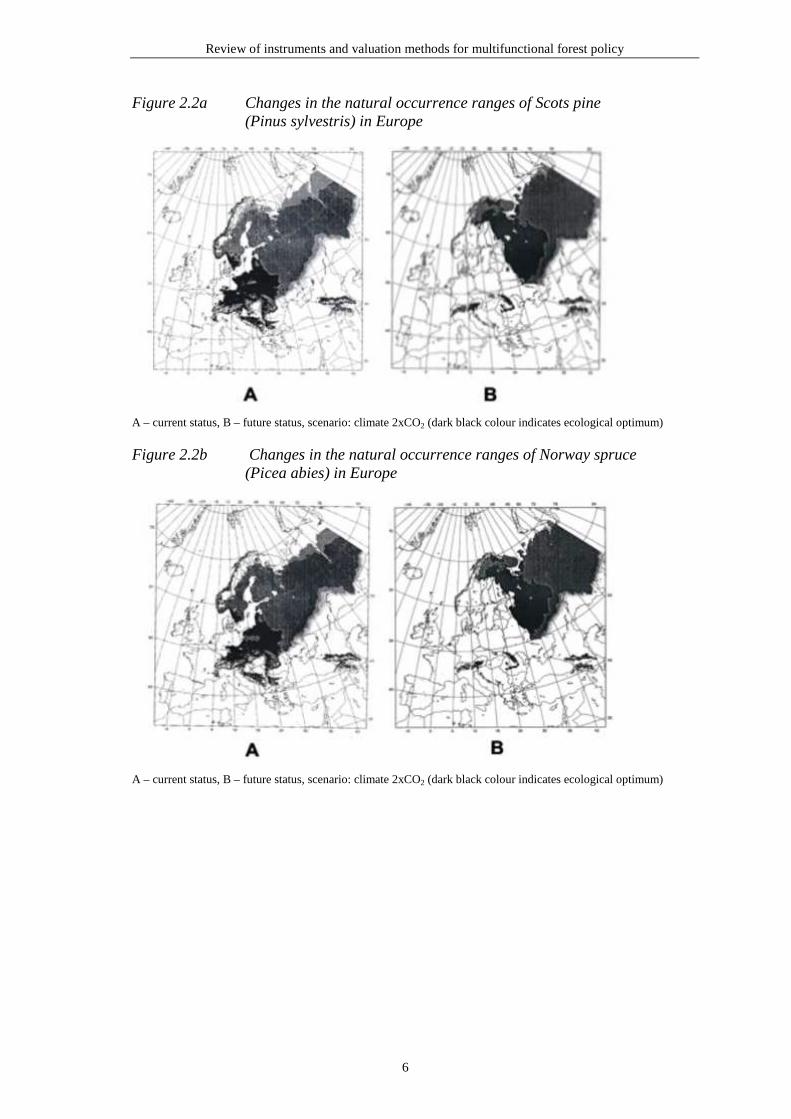
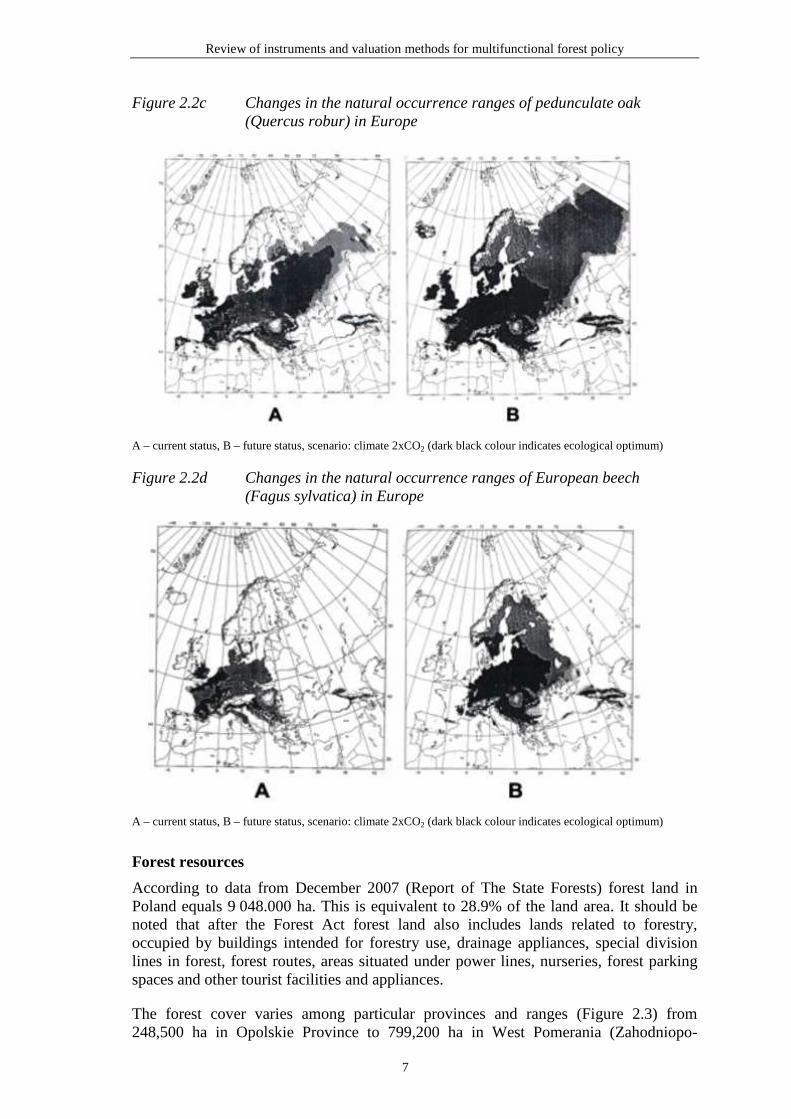
Figure 2.2c Changes in the natural occurrence ranges of pedunculate oak (Quercus robur) in Europe
A – current status, B – future status, scenario: climate 2xCO2 (dark black colour indicates ecological optimum)
Figure 2.2d Changes in the natural occurrence ranges of European beech (Fagus sylvatica) in Europe
A – current status, B – future status, scenario: climate 2xCO2 (dark black colour indicates ecological optimum)
Forest resources
According to data from December 2007 (Report of The State Forests) forest land in Poland equals 9 048.000 ha. This is equivalent to 28.9% of the land area. It should be noted that after the Forest Act forest land also includes lands related to forestry, occupied by buildings intended for forestry use, drainage appliances, special division lines in forest, forest routes, areas situated under power lines, nurseries, forest parking spaces and other tourist facilities and appliances.
The forest cover varies among particular provinces and ranges (Figure 2.3) from 248,500 ha in Opolskie Province to 799,200 ha in West Pomerania (Zahodniopo-

Review of instruments and valuation methods for multifunctional forest policy
8
morskie). The highest level of forest cover appears in Lubuskie Province (41.7%), the lowest in Łódzkie Province (20.7%). Starting from 1945 forest cover has steadily increased. Since 1990 forest cover in Poland has expanded to 332,000 ha, i.e. more than 1.1% (Figure 2.4). Lately, in 2006, compared with 2005, forest cover increased by 26,000 ha.
Figure 2.3 Forest cover by provinces (Central Statistical Office (CSO))
Figure 2.4 Forest area in Poland between 1990-2006 (Central Statistical Office)
Wood reserves and growing stock
According to the “Forest Area and Wood Reserves Revision” updated on January 1, 2006 by the Forest Management and Geodesy Bureau and State Forests NFH, the wood reserves in forests managed by State Forests NFH gained 1,629,300,000 m3 of gross merchantable timber (Figure 2.5). Reserves in the private and commune-owned forests, after Forest Management and Geodesy Bureau’s data (1999) indicate 188,600,000 m3 of gross merchantable timber. The last information regarding the whole country wood growing stock refers to 1997. Taking it into account and referring to experts’ estimation updated on January 2006, one can estimate that the total value of growing stock of Polish forests is approximately 1,909,000,000 m3 of gross merchantable timber at that time.

Review of instruments and valuation methods for multifunctional forest policy
9
Figure 2.5 Volume of timber resources in mln m3 of gross marchantable timber
Tree species structure
Two-thirds of the forest stands are purely coniferous, 15% is purely broadleaved, and the remaining 18% is mixed forest. In approximately 75.6% of the forest area in Poland coniferous species prevail (Figure 2.6). Pine (Pinus silvestris L.) (including larch (Larix sp.) results in a cover of 69,0% of total forest surface) finds the advantageous climatic and site conditions in Poland within its Euro-Asiatic natural range, thus being capable of developing a number of important ecotypes (e.g. The Taborska Pine or Augustowska Pine). Moreover, coniferous species have been favoured by the wood processing industry since the 19th century which added up to their considerable share in the species structure.
Figure 2.6 Areal share of dominant species in the State Forests NFH (CSO, 2007)
The coniferous species share in State Forests NFH is 76,4%, including pine – 69%. Private owned forests indicate lower share of pine. It is the fir (Abies alba L.) that
Review of instruments and valuation methods for multifunctional forest policy
10
prevails having the higher share, and among the broadleaved – alder (Alnus sp.) and birch (Betula sp.). Apart from pine, beech (Fagus silvatica L.) and spruce (Picea abies L.) have considerable share in the area of national parks.
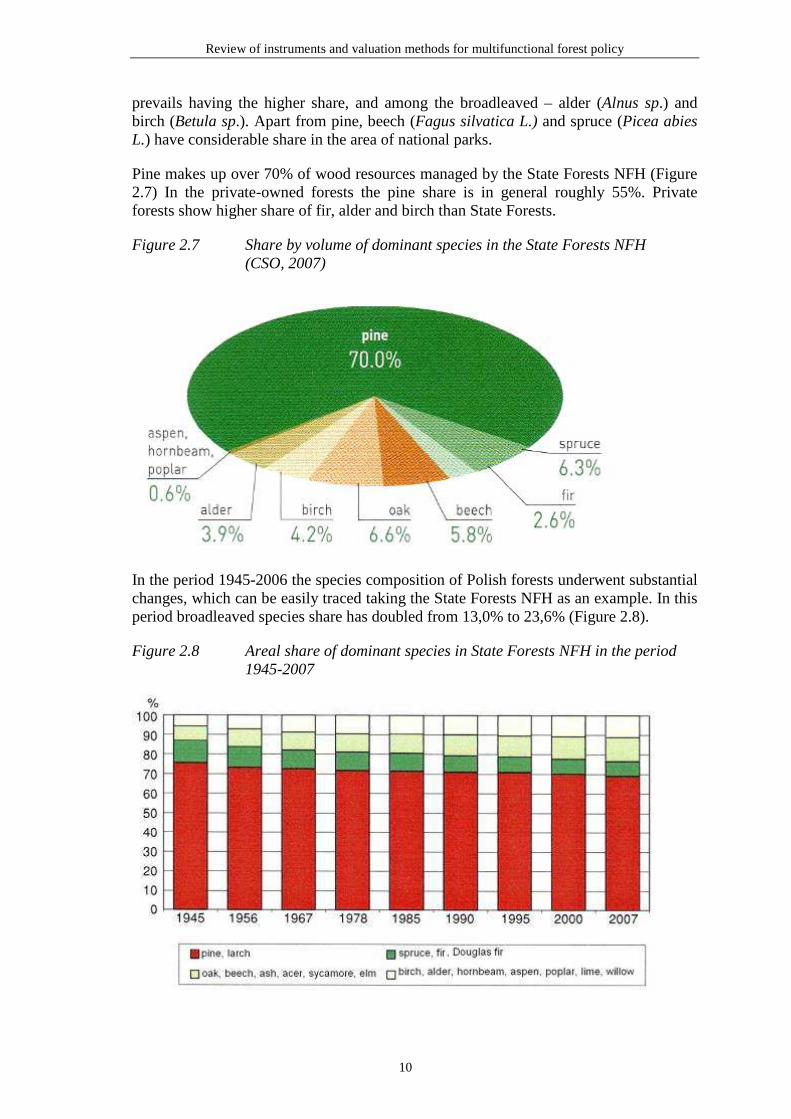
Pine makes up over 70% of wood resources managed by the State Forests NFH (Figure 2.7) In the private-owned forests the pine share is in general roughly 55%. Private forests show higher share of fir, alder and birch than State Forests.
Figure 2.7 Share by volume of dominant species in the State Forests NFH (CSO, 2007)
In the period 1945-2006 the species composition of Polish forests underwent substantial changes, which can be easily traced taking the State Forests NFH as an example. In this period broadleaved species share has doubled from 13,0% to 23,6% (Figure 2.8).
Figure 2.8 Areal share of dominant species in State Forests NFH in the period 1945-2007
Review of instruments and valuation methods for multifunctional forest policy
11
Age structure
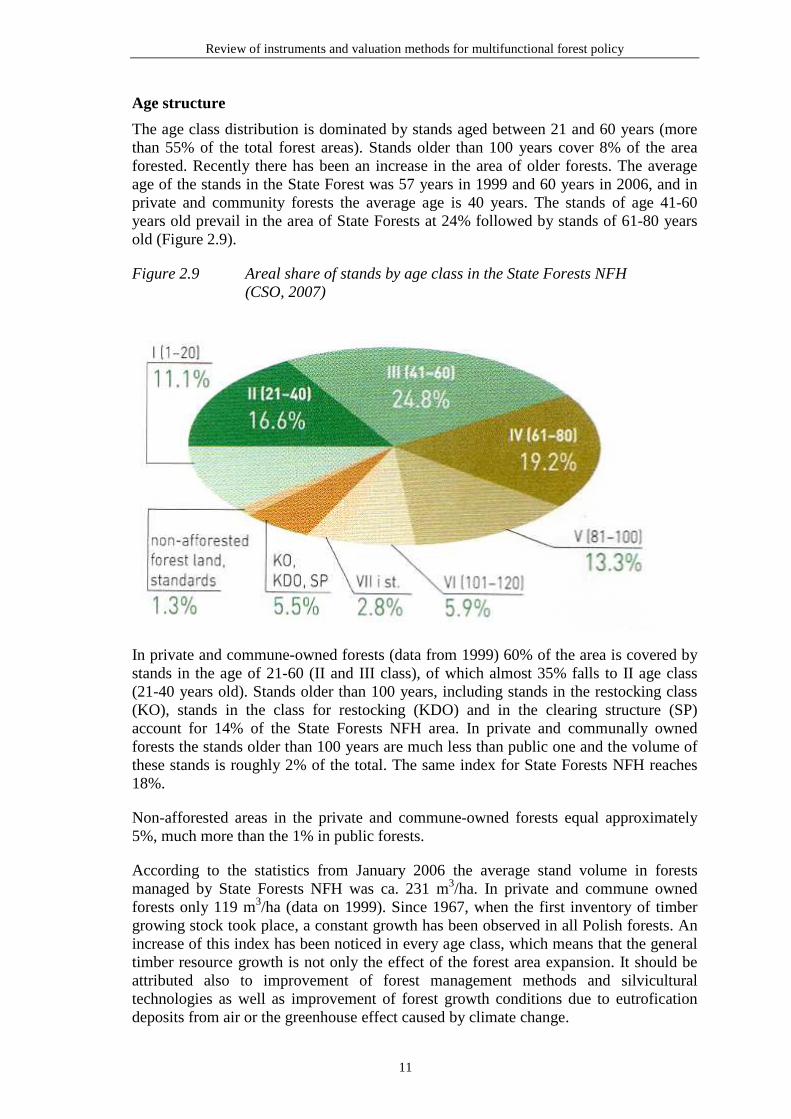
The age class distribution is dominated by stands aged between 21 and 60 years (more than 55% of the total forest areas). Stands older than 100 years cover 8% of the area forested. Recently there has been an increase in the area of older forests. The average age of the stands in the State Forest was 57 years in 1999 and 60 years in 2006, and in private and community forests the average age is 40 years. The stands of age 41-60 years old prevail in the area of State Forests at 24% followed by stands of 61-80 years old (Figure 2.9).
Figure 2.9 Areal share of stands by age class in the State Forests NFH (CSO, 2007)
In private and commune-owned forests (data from 1999) 60% of the area is covered by stands in the age of 21-60 (II and III class), of which almost 35% falls to II age class (21-40 years old). Stands older than 100 years, including stands in the restocking class (KO), stands in the class for restocking (KDO) and in the clearing structure (SP) account for 14% of the State Forests NFH area. In private and communally owned forests the stands older than 100 years are much less than public one and the volume of these stands is roughly 2% of the total. The same index for State Forests NFH reaches 18%.
Non-afforested areas in the private and commune-owned forests equal approximately 5%, much more than the 1% in public forests.
According to the statistics from January 2006 the average stand volume in forests managed by State Forests NFH was ca. 231 m3/ha. In private and commune owned forests only 119 m3/ha (data on 1999). Since 1967, when the first inventory of timber growing stock took place, a constant growth has been observed in all Polish forests. An increase of this index has been noticed in every age class, which means that the general timber resource growth is not only the effect of the forest area expansion. It should be attributed also to improvement of forest management methods and silvicultural technologies as well as improvement of forest growth conditions due to eutrofication deposits from air or the greenhouse effect caused by climate change.
Review of instruments and valuation methods for multifunctional forest policy
12
An important index of the forest condition is the annual increment of the timber. The gross merchantable timber increment is estimated on the basis of the difference in volume by the end and beginning of the year, considering the harvest in a given year. From January 1986 to January 2006 gross merchantable timber increment in the forest managed by State Forests NFH amounted to about 989,000,000 m3. During this period ca. 536,000,000 m3 of gross merchantable timber was harvested which means that about 453,000,000 m3 of wood representing ca. 46% of total increment increased the standing volume. The current annual increment in tree volume of gross merchantable timber is 7.2 m3/ha. It was estimated for the last 20 years (1986-2006) on the basis of the difference in volume by the end (January 2006) and beginning (January 1986) of the period. The average annual increment calculated over the last five years amounts to 9.0 m3/ha.
To summarize, the forests managed by State Forests NFH are particularly characterised by:
• a continuous increase in forest cover since 1945;
• an uninterrupted increase in standing volume at an annual rate of ca. 1,6%;
• an increase of the average annual increment;
• a systematic increase in the share of broadleaves tree species;
• a drop in the total area of clear cutting;
• a growing share of mature stands, i.e. stands aged over 80 years and growing average age of Polish forests as a whole.
2.3 Forest management and ownership structure
Forest management: New ideals, but still old practice
For over 80 years, forest management in Poland has been based on forest management plans. In accordance with the Forest Act of September 28,1991 with later amendments (Dziennik Ustaw no. 45 of 2005, item 435), along with regulations and orders issued on the basis of this Act, the main goal of the forest management is to conduct forest economy according to the principles of common preservation of forests, durability of their maintenance, continuity and balanced usage of all the forest functions and expending forests resources (see also definition of forest management in the amendment of the Forest Act in 1997). Forest management is performed according to 10 years’ long forest management plans, prepared for every Forest District. Management plans are drawn up on the basis of inventories, analysis of last 10 years management period and discussion of forests survey commissions (KTG) with participation of institution and individuals outside of forestry. Participants invited to the discussion by foresters include representatives of different interest groups, which can have influence on the final decisions. Management plans are drawn up by administrative services outside of State Forests NFH names Forest Management and Geodesy Bureau, which is subordinated to the Minister for the Treasury. Plans are approved by the Minister of Environment.
The work of preparing the Management Plan is regulated by a special document: “Instruction for Forest Management” or subtitle “Instruction for preparation of Forest Management Plan for Forest District”), which is elaborated by a team of specialists supervised by State Forests NFH and approved by the General Director of State Forests NFH

Review of instruments and valuation methods for multifunctional forest policy
13
So, we have the situation where the Management Plan is prepared by an independent body from outside of State Forests, which is supervised by another Minister than those who approved this plan, but the work on preparation of this Plan is regulated by Instruction prepared by State Forests and approved by its director. Finally: Management Plan is prepared and realized by the same institution.
The Forest Management Plan describes, sometimes very carefully and in detail, various kinds of forest operations starting from seed collection and production of seedlings in nursery, by preparation of soil and technology of planting, by silvicultural treatments like weed removal, early and late cleaning in the young stands, early and late thinning in the older stands, pruning etc. Final operation of the management of forests is the timber harvesting process.
A good criterion for ecological soundness of forestry and realization of the new ecosystem approach is the relationship between managing, silviculture/breeding and protection of forest and forest’s biological diversity. Beside the “Instruction for Forest Management” or “Instruction for preparation of Forest Management Plan for Forest District” there are two other important documents regulating Polish forestry on the operational level in practice: “Rules for Silviculture/Forest Breeding” and “Instruction for Forest Protection”. All these three documents have been updated (2003) and approved to be applied at least for the next 10 years. The motivation for updating the documents in question was similar - adapting to the requirements of changed forest policy and new approach to forest economy. As we know, the new approach is more open to natural and social values of the forests and is characterized by practical actions that respect natural abundance and ecological rules of forest production, on the operational level of managing, breeding, utilizing and protection of the forests. This is the basis for concepts of “close to nature forestry”, “half-natural forest breeding”, “ecological forestry” and the like. It was necessary to analyze these documents in the light of the new ecological approach declared by forest policy.
Analysis shows that efforts undertaken in order to introduce new contents to the above documents, however clearly visible (the text is very carefully adjusted for correct formulation of all ecological matters, with substantial amounts of terms like “natural processes”, “naturalness”, “ecosystem”, “balance”, “stability” and alike), on the practical level, are in fact largely based on previous regulations and tend to loose its guidance while handling new terminology (especially the relations: tree-tree stand-forest-forest ecosystem). The norms regulating pro-ecological forest management lack consequence. New documents are in many sections internally incoherent. On the one hand there are declarations and ecological vocabulary (rhetoric), on the other,the final resolutions regulating practical implementation, in many cases are copied from previous documents. There are a few areas where the declared intentions are truly realized in form of final regulations (for instance criteria of approval of natural stand regeneration, or tree-group thinning).The structural trap of these documents is incoherency between declared theoretical diversity and practically realized selection. It is most prominent in areas of seed management and forest caring. Attempt to reconcile these conflicting ways, dictated by “ideological” reasons, seem to fail.
Between the Instruction for Forest Management, Rules of Forest Breeding, Instruction for Forest Protection there are a lot of inconsistencies, sometimes in principle areas (like distinguishing forest functions: reserve, natural, managed, biotic, protectional, produc-tion, reproduction, non-production) as well as important categories and divisions (like

Review of instruments and valuation methods for multifunctional forest policy
14
the division of forests into groups: protected forests, protectional forests, economic and production forests). There also is a clear lack of coherency with the forest law and other papers (like National Forest Policy). Used categories and divisions are indivisible, yet different in each document, and only in parts coherent in essence (although bearing different names). With no common criteria and clear goals for choosing particular form of division and proposed actions it is hard to propose a satisfactory harmonization plan for the analyzed documents.
These documents should be conformed to one, clearly formulated idea of future forest economy, where there is room for a whole range of diverse approaches to forests as a resource: from increased wood production to strict protection of forest ecosystems. Distinguishing forest functions in space and time, meaning social-economical regionali-zation of forestry, could be a better guide in setting common goals and directions for management, breeding and protection of forests, as well as properly diversifying them, according to given economical tasks and social expectations. The outcome of the analysis of current documents may initially be concluded by the following points:
1. Biological (biotic) diversity in forests should be treated by forest economy as a feature of forest ecosystems that guarantees their sustainability and ability to adapt and evolve in an ever-changing environment. This diversity should be realized on an inner-species level (in form of gene pool diversity), species diversity level as well as higher levels (ecosystem diversity including landscape level), and should be an instrument of management, breeding and protection of forests on the way to sustainable and balanced management. For the use of forest economy, biological diversity may be interpreted as complexity of forest structure (species, age, height, development phase structure etc.), which is affected by forest economy and within certain boundaries may be shaped by it. Analyzed documents show that forest economy has accepted the need for protection of biological diversity in forests and it does so by introducing numerous new regulations. Often however, it focuses on protecting biological diversity as a management value (potential), or as an object of passive nature protection, thus denying the dynamic character and instrumental potential of this phenomenon.
2. Forest ecosystems that are more complex as to structure and function require more diverse ways of management. Forest management should aim to sustain and enlarge diverse structures, especially site and micro-site structures, thus creating mosaic spatial layouts. A more diverse approach is also valid in larger spatial scale. It would be proper to discuss the need of regionalizing forests economical-social functions, or - to put it differently - regionalizing forest functions, which implicates the need of different approaches for forest areas that have different functions, and setting proper tasks for each of them, according to correct breeding, management, protection and use of forest rules. Such solution needs one document ranked similar to the Forest Code, of strategic character, with additions describing operational practice, regionally diversified.
3. Forest economy of the future, relying on natural models with its main goal being the sustainability of forests (as declared in the documents), needs to integrate to systems that describe forest: tree stand description and ecosystem description. Forestry has long practice in describing forest stands, there is a need however, for parametrizing a forest ecosystem. None of these papers discusses the ecosystem as an object of management.
4. The plan for forest management is described by the forest law as the elementary

Review of instruments and valuation methods for multifunctional forest policy
15
document for forest economy developed for a specific object, containing a description, current state analysis and goals, tasks and methods of conducting forest management. The forest law does not name any other documents of technical-economical nature that should be necessary to conduct forest management. If the forest management plan contains the description and analysis of state as well as the goals, tasks and methods of conducting forest management, there can be no need for additional documents. And if such documents exist, then they should be derived from the Instruction for Forest Management, and not be standalone creations. Harmonization of Instruction for Forest Management, Rules of Forest Breeding and Instruction for Forest Protection should become the postulate for the next revision.
5. The main instrument of influence of forest breeding on forest ecosystems on the operational level, meaning GTD (Gospodarczy Typ Drzewostanu; Economical Tree-stand Types), has not changed in it’s core for half a century. GTD decides about the species selection in plant nurseries, species structure of tree stands, caring practices, and consistency of biocenosis2 with biotope. GTD is in fact the main instrument for both intensifying the forest economy in the past and “ecologizing” it today. Despite significant changes in forest management considering goals and methods of manage-ment (raw material forestry - ecosystem forestry (“multifunctional”), GTD retains its original, raw-material oriented character and no clear evolution of the term is observed. In fact what can be seen is an increase of GTD on one site, and decrease on the other. There is no sustainable tendency here, it is rather the effect of faulty site diagnosis and changing opinions about forest economy (production-protection). It might also be caused by unclear criteria of species composition compatibility and site compatibility. The rules from 2003 propose a higher number of GTD, which is suggesting higher flexibility of breeding rules in comparison to previous regulations.
It seems we have the following scenario unfolding:
• goals of forest breeding are economical types of tree-stands (GTD) agreed upon in forest management plans;
• forest economical types are set in successive management cycles;
• the idea, role and functions of economical tree-stands types in both cycles are the same (see successive issues of ZHL).
In this way the economical type of tree stand (GTD) has become the goal, instrument and product of forest breeding. If GTD accepts and approves KTG thus defining the breeding goals, then assessing the species selection compatibility with the site on such basis is merely assessing the compatibility with “arrangements” of KTG members. If a forest inspection is assessing compatibility of species selection with an operation, it is not taking the actual site into account, but the KTG arrangements. And the circle is closed. There is an urgent need to undertake efforts to verify the concept of Economical Tree-stand Types according to current knowledge and modern concepts of forest economy.
2 Biocenosis – ecological association of all living organisms on given area/space; living/biotic elements of an
ecological site. In contrast with biotop - abiotic part of the ecological site.

Review of instruments and valuation methods for multifunctional forest policy
16
Promotional Forest Complexes
Promotional Forest Complexes (PFC) are a Polish initiative originated on the basis of a Canadian model forest. These are larger contiguous areas of forest, which are created to promote the pro-ecological forest policy and practical management of forests. They were conceived as areas of demonstration of a new ecological approach and examples to learn and educate foresters as well as areas of presentation of forestry to the public and civil society. This aim was outlined in top-rank statutory documents, including Forest Act (updated in 1997) and other legal acts on environmental policy, as well as in the directional political assumptions, e.g. in the National Ecological Policy (1991) and further developed National Ecological Policy II (2000), National Policy on Forests (1997), Polish Policy of Comprehensive Protection of Forest Resources (1997), etc.
In formulating the assumptions of PFC reference was made to the letter and spirit of international adjustments and conventions, such as Agenda 21, CBD (UN Convention on Biological Diversity), UNFCCC, as well as achievements of the Pan-European Process MCPFE. In establishing PFC it was essential that they represent different forest regions, variability of habitat conditions, species composition of stands and different space structures in the landscape. Usually they embrace several whole Forest Districts, sometimes their part, cutting the administration border of Forest District or Regional Directorate of State Forests NFH. The PFC frontiers are artificial and have no relationships with borders of Natural Ecological Regions (Povence) or delimitation of other ecological unites.
Promotional Forest Complexes have no separate administration. All administration issues are dealt with by Regional Forest Inspectorates under the supervision of the territorially competent regional directorates of the State Forests NFH.
A scientific-social council has been appointed in each PFC. Its members include representatives of science, local state administration, local self-governments, media, non-governmental organizations, private companies, denominational unions, or person of high authority among local communities. The Councils are advisory and opinion-making bodies to the directors of regional directorates of the State Forests NFH in the scope of initiating tasks for PFC. This is a valid social factor in the forest management and selection of priorities that will meet the expectations of not only forest managers.
The following tasks have been set for Promotional Forest Complexes:
• Thorough survey of the condition of forest biocoenosis and the direction of the changes occurring there;
• Forest management based on ecological principles aimed at preserving or re-storing the natural variability of the forest environment;
• Close integration of economic factors with nature and landscape protection requirements;
• Analysis of adjustments of forest biocoenosis with habitat conditions, determina-tion of the causes of deformation;
• Detailed survey of geological, soil, climate, hydrological and habitat conditions aimed to draw up new forest management plans or adapt the existing ones to the new principles; in an attempt to these undertakings special preferences are given to natural succession;
Review of instruments and valuation methods for multifunctional forest policy
17
• Sustainable preservation or restoration of forest values by management methods, with a focus on ecological forest engineering methods as a way to increase naturalness, diversity of forest biocoenosis, regeneration, rehabilitation or restitu-tion of ecosystems and their sustainability;
• Integration of sustainable forest management with active, large-area nature protection goals;
• Promotion of forest multifunctionality;
• Development of model solutions as laid down in the forest resources protection policy for the use by all State Forest NFH units and other forest managers;
• Society education in the field of forestry using the infrastructure developed by PFC (educational-exhibition rooms, nature-forest educational trails, etc.) as well as complementary training for Forest Service staff in model management sites;
• Development of tourist base/infrastructure.
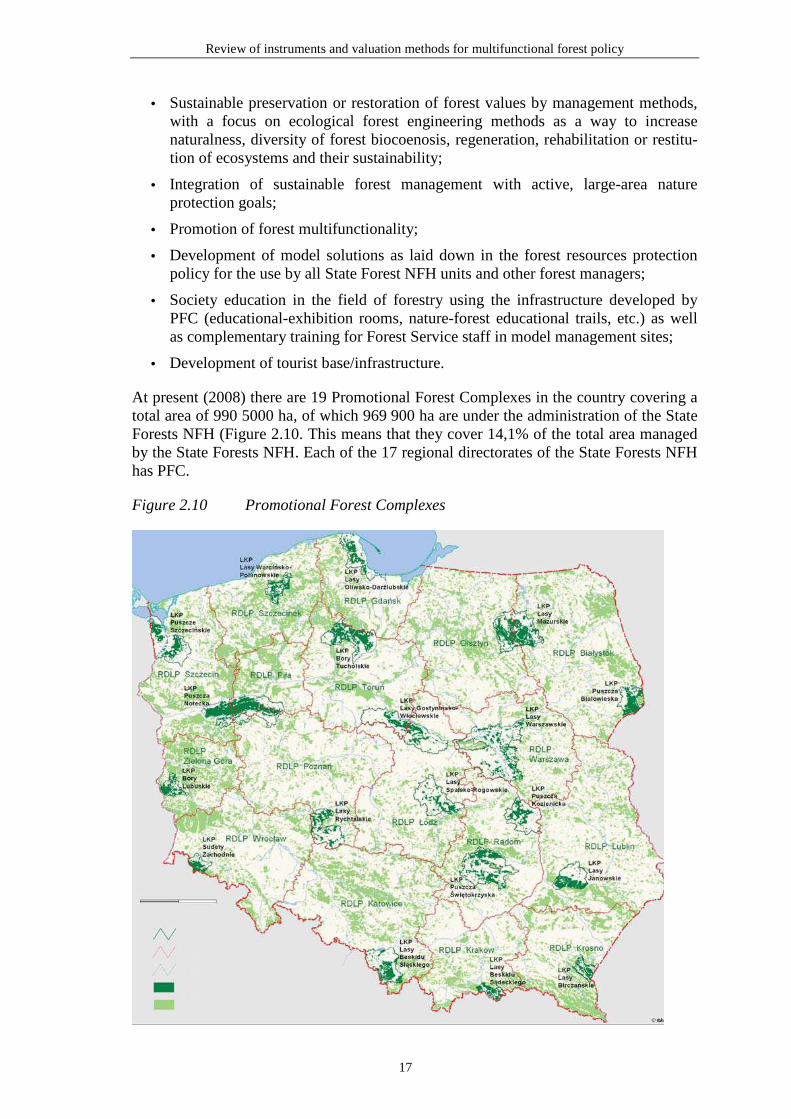
At present (2008) there are 19 Promotional Forest Complexes in the country covering a total area of 990 5000 ha, of which 969 900 ha are under the administration of the State Forests NFH (Figure 2.10. This means that they cover 14,1% of the total area managed by the State Forests NFH. Each of the 17 regional directorates of the State Forests NFH has PFC.
Figure 2.10 Promotional Forest Complexes
Review of instruments and valuation methods for multifunctional forest policy
18
Educational activity is financed mainly from the State Forests NFH’s own funds. Only a small portion of the funds come from the State Budget. This is not only a great financial but also organizational burden, given the infrastructure serving this goal: 16 forest educational centres, 41 forest educational-exhibition rooms, 50 open-sided roofed education areas, 120 forest education trails, 135 education-information points, as well as 247 other facilities e.g. nurseries, small-scale retention structures, parks, or dendro-logical gardens used for forest education.
Ownership structure
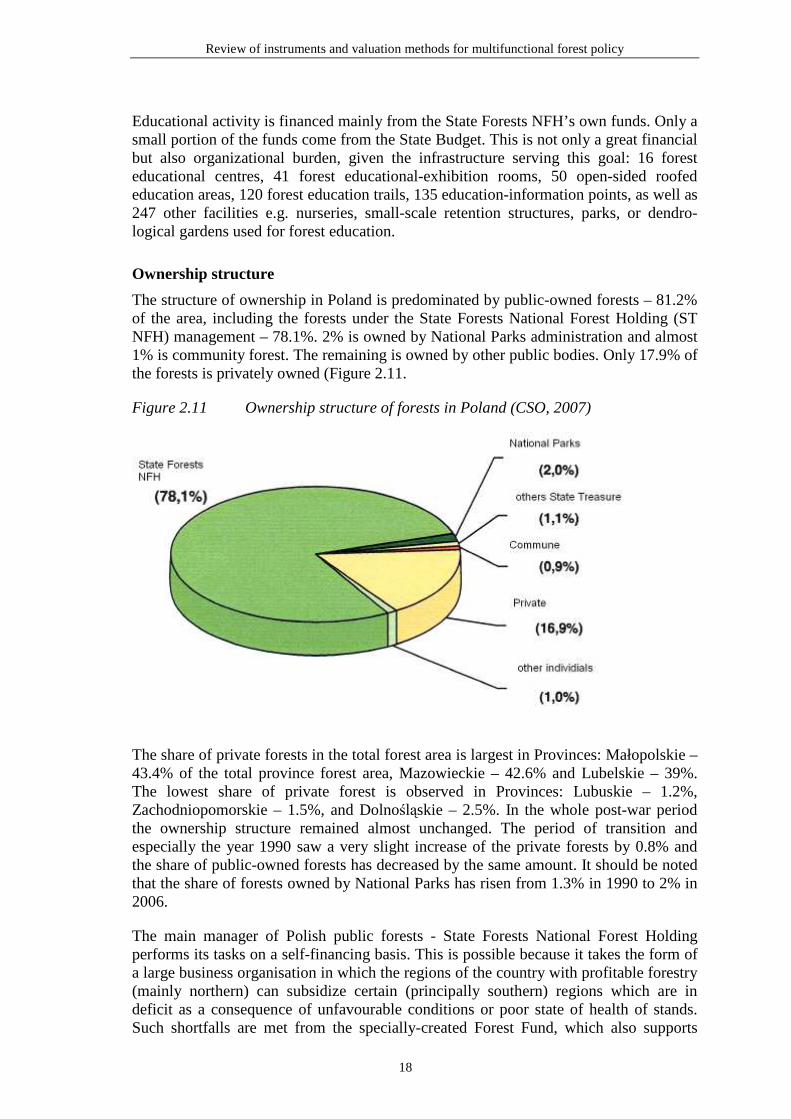
The structure of ownership in Poland is predominated by public-owned forests – 81.2% of the area, including the forests under the State Forests National Forest Holding (ST NFH) management – 78.1%. 2% is owned by National Parks administration and almost 1% is community forest. The remaining is owned by other public bodies. Only 17.9% of the forests is privately owned (Figure 2.11.
Figure 2.11 Ownership structure of forests in Poland (CSO, 2007)
The share of private forests in the total forest area is largest in Provinces: Małopolskie – 43.4% of the total province forest area, Mazowieckie – 42.6% and Lubelskie – 39%. The lowest share of private forest is observed in Provinces: Lubuskie – 1.2%, Zachodniopomorskie – 1.5%, and Dolnośląskie – 2.5%. In the whole post-war period the ownership structure remained almost unchanged. The period of transition and especially the year 1990 saw a very slight increase of the private forests by 0.8% and the share of public-owned forests has decreased by the same amount. It should be noted that the share of forests owned by National Parks has risen from 1.3% in 1990 to 2% in 2006.
The main manager of Polish public forests - State Forests National Forest Holding performs its tasks on a self-financing basis. This is possible because it takes the form of a large business organisation in which the regions of the country with profitable forestry (mainly northern) can subsidize certain (principally southern) regions which are in deficit as a consequence of unfavourable conditions or poor state of health of stands. Such shortfalls are met from the specially-created Forest Fund, which also supports
Review of instruments and valuation methods for multifunctional forest policy
19
joint undertakings of the State Forests, such as measures taken to combat mass outbreaks of harmful insects or the construction of modern nurseries, seed stories or research. Only some of the tasks set out in the Forest Act are financed from the central state budget. These include actions in the field of nature conservation, the removal of the effects of fires and other natural disasters, the afforestation of former agricultural lands, the reconstruction of stands affected by industrial pollution, society’s education within Promotional Forest Complexes and creation and updating of databases on forests. Otherwise, the organization State Forests NFH operates on the basis of financial and economic plans drawn up each year and based on the plan of appropriate tasks resulting from the forest management plans for the harvesting and sale of timber at the level of each individual Forest District.
2.4 The role of forestry and timber production in the Polish economy
Introduction
Principles and ways of forest utilization have been a subject of debate in the forestry for more than two hundreds of years. The issue is as old as the forest resource management itself and is underlined by the necessity to reconcile a virtually unlimited human needs and limited available resources to meet them. Therefore the level of awareness as to the potential and role of forest management in the man’s life finds reflection in the views and concepts of the forest utilization strategy. The problem consists in assuring multiple functions of forests on the one hand, and in maintaining sustainability of these functions on the other. The process is then extremely complex since it requires that many forest functions be reconciled and, at the same time the principle of sustainable timber harvesting to be respected, the principle which itself is hard to be put into practice. This difficulty considerably increases when we require that both productive and non-productive forest functions are fulfilled simultaneously and to the expected (maximal) degree.
Under traditional systems of regulating forest harvest the greatest emphasis was put on productive functions, and specifically on timber production. The timber production was to be maximized by cutting every stand as it reaches the maturity rotation age, what means the age which is optimal from the standpoint of the goal assumed. However, the complexity of the problem will not disappear when we restrict ourselves to one forest function solely. It was approved that even in such a case, the objective formulation may be significantly diversified which makes it possible for multiple stand maturity definitions to function in parallel. Furthermore, the definition of maturity for the same stand may vary within broad limits depending on the method used. The problem will become still more complex for the case when productive and non-productive forest uses are positively correlated, that is when the maximization of the degree of fulfilling by a forest its productive function is accompanied by the increase in its capacity to fulfill non-productive functions.
Simplified, it can be stated that the foresters who have traditionally considered forest resource management from the viewpoint of timber production, always raised a strategic requirement to safeguard the possibility of harvesting maximal volumes of raw timber in a sustainable way. And, typically, economists have been questioning that requirement for a long time (Samuelson 1994)). Reasons for that are numerous. Let us address, in this place, just two of them, of substantial significance as they may seem. The first is

Review of instruments and valuation methods for multifunctional forest policy
20
associated with requirements of market economy while the other results from what the contemporary economics calls “external effects”, which is of special importance when considering forest resource management. The point is that these resources play an increasingly important role in satisfying material needs of humans while, at the same time, the environmental role of these resources receives an ever increasing in-depth recognition what results in the fact that they have internal value in addition to their market value. Hence, both technical and economical criteria are hard to reconcile as the evaluation of effects to the society at large resulting from the implementation of a definite concept of forest harvesting with simultaneous safeguarding of sustainable development of the forest itself.
Of the many products and services produced from forests, timber is the dominant industrial product. In other words: the level of timber harvest constitutes a basic factor which influences the actual economic importance of forestry in the national economy, particularly in rural areas. Strictly speaking, it is the volume of round timber which decides upon the economic importance of forestry. This is related to sawmill and wood processing industries situated mainly within municipalities. Both industries connected with the forest management are important for the economic stability of rural areas, local employment and social situation. Accordingly, much forest management effort is aimed at producing timber for industrial raw material.
Forestry in general economic terms
Forestry contributes to the production sector, thus contributing to GDP. Added value, produced by forestry becomes a part of a new value of goods and services, which form a national product. The structure of this value defines equal producing capacity of forestry, including forests, as well as the market demand for forestry goods and services and the level of consumption of these products by people, and finally, this structure defines inner needs of forestry. The share of forestry in Polish national GDP is rather small (0.3% in 2006) and has a tendency to decrease, as in other developed countries. As a rule, the contribution of forestry sector into the GDP grows, while the level of production decreases.
Starting from 2002, the nominal value of global forestry output has shown an ever increasing trend which is due to a good market situation, as concerns, in particular, the raw timber market. The value of global output estimated to be somewhat beyond PLN 4.9 billion in 2002 increased to the value exceeding PLN 5.7 billion in 2004, and subsequently to nearly PLN 6.3 billion in 2005, while in the following year 2006 – the value exceeded PLN 6.7 billion. This means that over the five year period (2002-2006) the nominal value of forestry output increased by 37%. It is also interesting in this context that the value of forest output as referred to a forest area unit, i.e.1 ha. This value has been increasing, from PLN 550 per ha to PLN 745 per ha over the same period, and a constant increase in the production volume has been noted. On the other hand, a relative decrease was observed in the industrial demand for forest products even though this demand remains still high, attaining about 48%. Timber as well as wood- and pulp industries still remain the main consumers of forest products (GUS - Main Statistical Office – CSO 2004). Values of global forestry output, indirect consumption (transferred value) as well as added value in the forestry over the period of the three successive years 2004-2006 attained the following figures (GUS – CSO – Forestry 2007):
Review of instruments and valuation methods for multifunctional forest policy
21
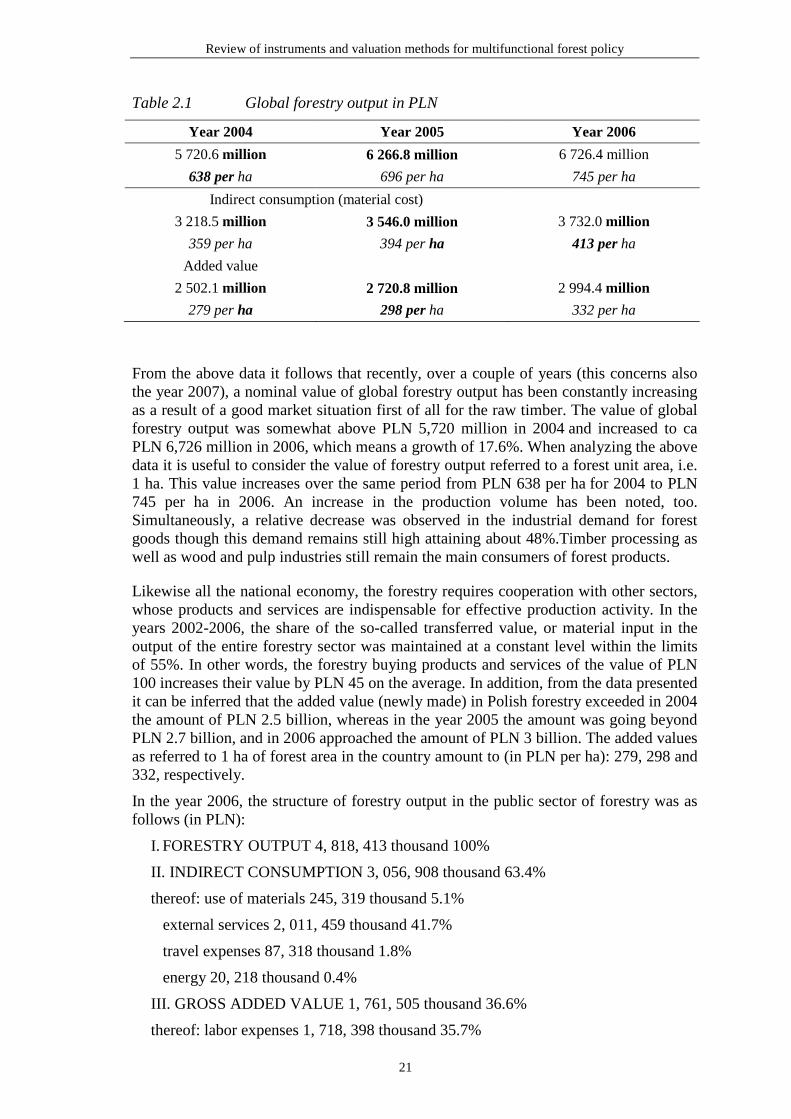
Table 2.1 Global forestry output in PLN
Year 2004 Year 2005 Year 2006
5 720.6 million 6 266.8 million 6 726.4 million
638 per ha 696 per ha 745 per ha
Indirect consumption (material cost)
3 218.5 million 3 546.0 million 3 732.0 million
359 per ha 394 per ha 413 per ha
Added value
2 502.1 million 2 720.8 million 2 994.4 million
279 per ha 298 per ha 332 per ha
From the above data it follows that recently, over a couple of years (this concerns also the year 2007), a nominal value of global forestry output has been constantly increasing as a result of a good market situation first of all for the raw timber. The value of global forestry output was somewhat above PLN 5,720 million in 2004 and increased to ca PLN 6,726 million in 2006, which means a growth of 17.6%. When analyzing the above data it is useful to consider the value of forestry output referred to a forest unit area, i.e. 1 ha. This value increases over the same period from PLN 638 per ha for 2004 to PLN 745 per ha in 2006. An increase in the production volume has been noted, too. Simultaneously, a relative decrease was observed in the industrial demand for forest goods though this demand remains still high attaining about 48%.Timber processing as well as wood and pulp industries still remain the main consumers of forest products.
Likewise all the national economy, the forestry requires cooperation with other sectors, whose products and services are indispensable for effective production activity. In the years 2002-2006, the share of the so-called transferred value, or material input in the output of the entire forestry sector was maintained at a constant level within the limits of 55%. In other words, the forestry buying products and services of the value of PLN 100 increases their value by PLN 45 on the average. In addition, from the data presented it can be inferred that the added value (newly made) in Polish forestry exceeded in 2004 the amount of PLN 2.5 billion, whereas in the year 2005 the amount was going beyond PLN 2.7 billion, and in 2006 approached the amount of PLN 3 billion. The added values as referred to 1 ha of forest area in the country amount to (in PLN per ha): 279, 298 and 332, respectively.
In the year 2006, the structure of forestry output in the public sector of forestry was as follows (in PLN):
I. FORESTRY OUTPUT 4, 818, 413 thousand 100%
II. INDIRECT CONSUMPTION 3, 056, 908 thousand 63.4%
thereof: use of materials 245, 319 thousand 5.1%
external services 2, 011, 459 thousand 41.7%
travel expenses 87, 318 thousand 1.8%
energy 20, 218 thousand 0.4%
III. GROSS ADDED VALUE 1, 761, 505 thousand 36.6%
thereof: labor expenses 1, 718, 398 thousand 35.7%
Review of instruments and valuation methods for multifunctional forest policy
22
thereof: salaries and wages (gross) 1, 300, 679 thousand 27.0%
insurance 262, 719 thousand 5.5%
other costs of labour 155, 000 thousand 3.2%.
The above given value of forestry output of PLN 4.8184 million relates only to the public sector of forestry and is composed of the sum of values of timber harvested, the uses of non-timber forestry products, game and of the remaining goods and services. Thus the above value does not include the value of services in the sphere of forest logging as well as silvicultural operations and forest protection, done by private enter-prises, companies and other economic units outside the public sector. Nearly 72% of the given value of the global forest output fall for the State Forests Enterprise managing the forest area of 7 million ha (data for the year 2007).
The forestry represents a form of economic activity having a relatively low coefficient of direct product input. As can be inferred from the data quoted, the share of material costs (value of goods and services from other sectors transferred to forestry) in the value of total forestry output attains only 5.1%. On the other hand, the demand for services in the public forestry is significant and, as it is shown in the above specification, attaining 41.7% of the forest output. Nevertheless, the direct product input coefficient in the forestry is much lower as compared to that of the entire national economy.
Mutual relationships between the forestry and its economic circles find expression in the input-output tables. The tables reflect the stream of goods and services flowing from the forestry to other sectors of national economy and institutions of public life, and inversely - from other sectors to the forestry. Both processes are illustrated in the figure presenting links between the forestry and other sectors of Polish economy, which contains the data for the year 2006 (Fig 12).
Review of instruments and valuation methods for multifunctional forest policy
23
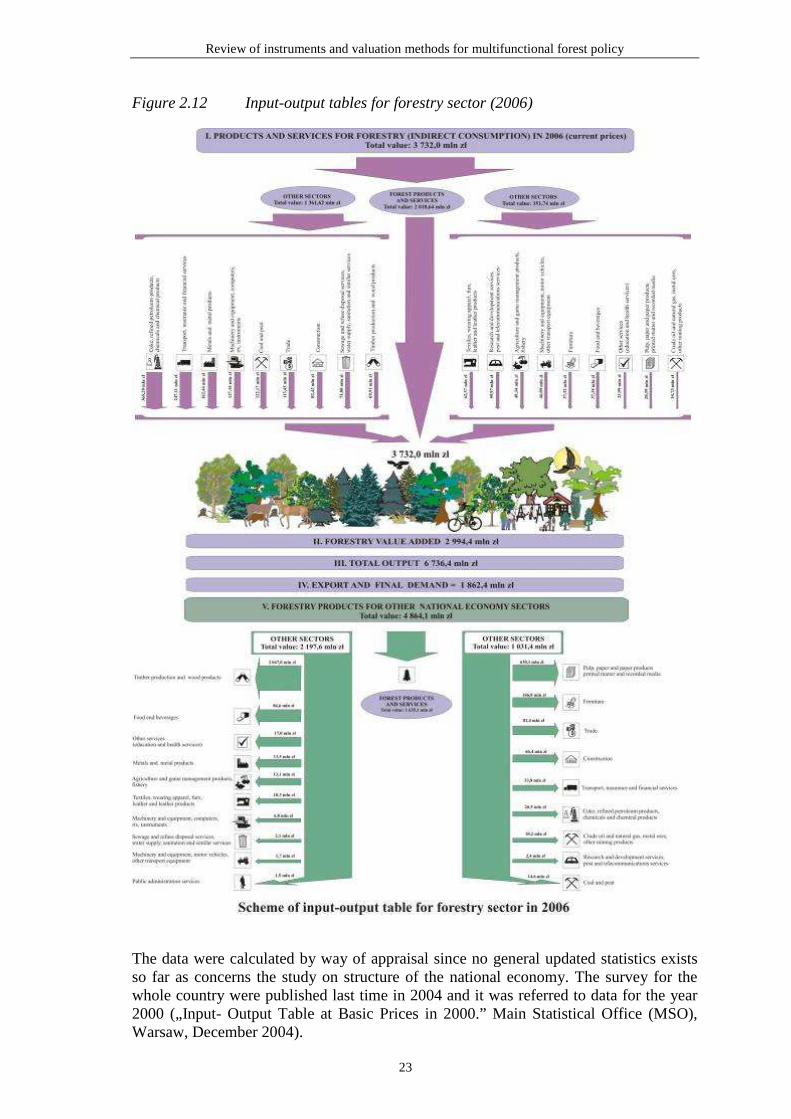
Figure 2.12 Input-output tables for forestry sector (2006)
The data were calculated by way of appraisal since no general updated statistics exists so far as concerns the study on structure of the national economy. The survey for the whole country were published last time in 2004 and it was referred to data for the year 2000 („Input- Output Table at Basic Prices in 2000.” Main Statistical Office (MSO), Warsaw, December 2004).
Review of instruments and valuation methods for multifunctional forest policy
24
The above mentioned publication, which includes input-output tables at basic prices, is continuation in principle of the first elaboration of the Central Statistical Office (CSO) on the input-output table at purchasers’ prices and together with supply and use tables create input-output system. The surveys constitute an integral part of activities performed by the Central Statistical Office for the purpose of implementation of the national accounts system consistent with System of National Accounts ESA’95 (European System of Accounts). The input-output tables at basic prices for the entire national economy in the year 2000 were developed according to the recommendations of the System of National Accounts. Data taken from the input-output table were used as a base for calculations given in the scheme attached. To facilitate the presentation, some modifications were introduced, such as combining in one column those sectors, issued from the Polish Classification of Activities, whose share in supplying the forestry is inconsiderable (or simply symbolic) or those that can not be considered within the scale of values assumed in the presented balance.
From the data quoted (see Figure 2.12) it results that products and services supplied by the forestry are consumed by all the branches of the national economy. In 2006, the total output of the forestry sector at the level of PLN 6.7 billion generated a demand for products of other branches and sectors at the level of PLN 3.7 billion, which constituted around 56% of the total forest output. This index approximates the country’s average index. It means that forestry sector has considerable ability, as compared to that of other sectors, to “self-reproduction”. It is characterized by the value of cumulative forest products (goods and services) inputs indispensable to produce the given total output. From the data given in the Figure 2.12 it also follows that the forest product coefficient attains 30%.
The share of private sector in the total forestry output is small but it is constantly going up. For example in 2004 the output in private forestry sector attained about PLN 1 364 million which then constituted ca 24% of the value of the total forestry output in the country. Three years later (in 2006) the output of the private forestry sector reached the value of PLN 1 908 million and its share was 28,4%.The development of total forest output, indirect consumption and gross added value in private forestry sector as well as the share of those values in national forestry in the period of 2004-2006 was as follows (Table 2.2):
Review of instruments and valuation methods for multifunctional forest policy
25
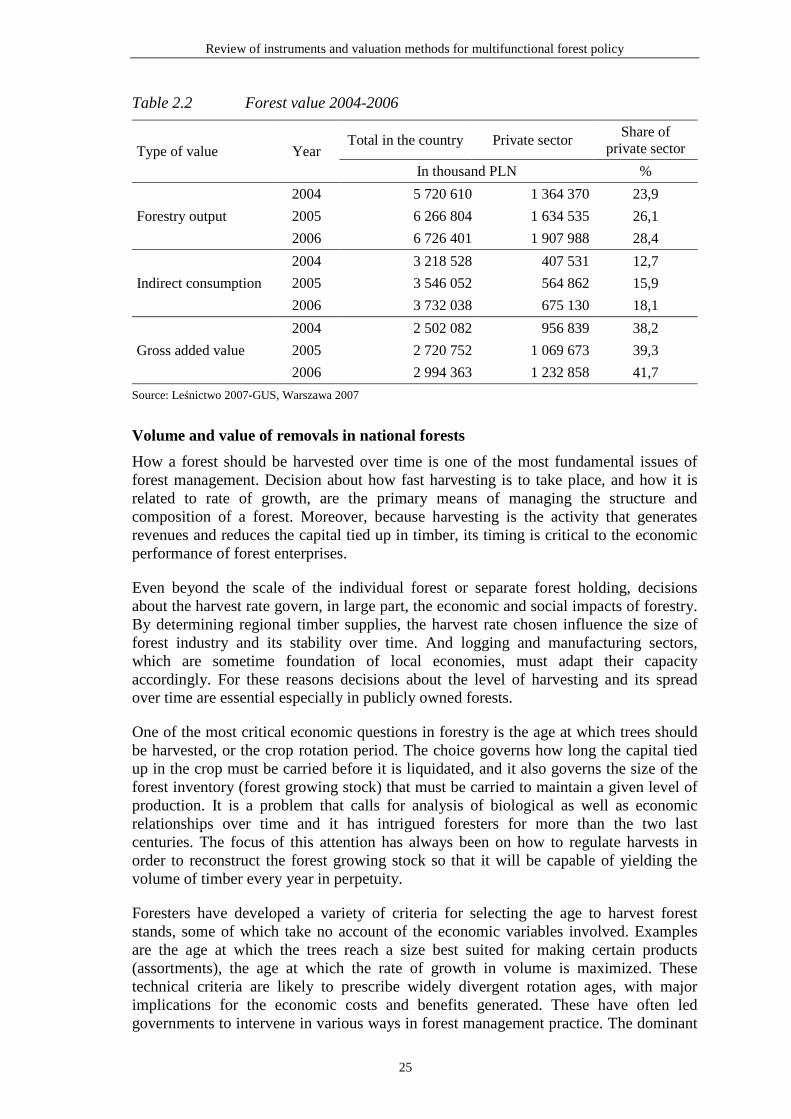
Table 2.2 Forest value 2004-2006
Type of value Year Total in the country Private sector
Share of private sector
In thousand PLN %
Forestry output
2004 5 720 610 1 364 370 23,9
2005 6 266 804 1 634 535 26,1
2006 6 726 401 1 907 988 28,4
Indirect consumption
2004 3 218 528 407 531 12,7
2005 3 546 052 564 862 15,9
2006 3 732 038 675 130 18,1
Gross added value
2004 2 502 082 956 839 38,2
2005 2 720 752 1 069 673 39,3
2006 2 994 363 1 232 858 41,7
Source: Leśnictwo 2007-GUS, Warszawa 2007
Volume and value of removals in national forests
How a forest should be harvested over time is one of the most fundamental issues of forest management. Decision about how fast harvesting is to take place, and how it is related to rate of growth, are the primary means of managing the structure and composition of a forest. Moreover, because harvesting is the activity that generates revenues and reduces the capital tied up in timber, its timing is critical to the economic performance of forest enterprises.
Even beyond the scale of the individual forest or separate forest holding, decisions about the harvest rate govern, in large part, the economic and social impacts of forestry. By determining regional timber supplies, the harvest rate chosen influence the size of forest industry and its stability over time. And logging and manufacturing sectors, which are sometime foundation of local economies, must adapt their capacity accordingly. For these reasons decisions about the level of harvesting and its spread over time are essential especially in publicly owned forests.
One of the most critical economic questions in forestry is the age at which trees should be harvested, or the crop rotation period. The choice governs how long the capital tied up in the crop must be carried before it is liquidated, and it also governs the size of the forest inventory (forest growing stock) that must be carried to maintain a given level of production. It is a problem that calls for analysis of biological as well as economic relationships over time and it has intrigued foresters for more than the two last centuries. The focus of this attention has always been on how to regulate harvests in order to reconstruct the forest growing stock so that it will be capable of yielding the volume of timber every year in perpetuity.
Foresters have developed a variety of criteria for selecting the age to harvest forest stands, some of which take no account of the economic variables involved. Examples are the age at which the trees reach a size best suited for making certain products (assortments), the age at which the rate of growth in volume is maximized. These technical criteria are likely to prescribe widely divergent rotation ages, with major implications for the economic costs and benefits generated. These have often led governments to intervene in various ways in forest management practice. The dominant
Review of instruments and valuation methods for multifunctional forest policy
26
concern of governments in regulating harvest rates is industrial stability, arising from fears that uncontrolled producers reacting freely in forest products markets will cause unstable employment and incomes. A longer term concern is that unregulated exploitation may lead to resource depletion, eroding employment opportunities and the economic base of regional economies.
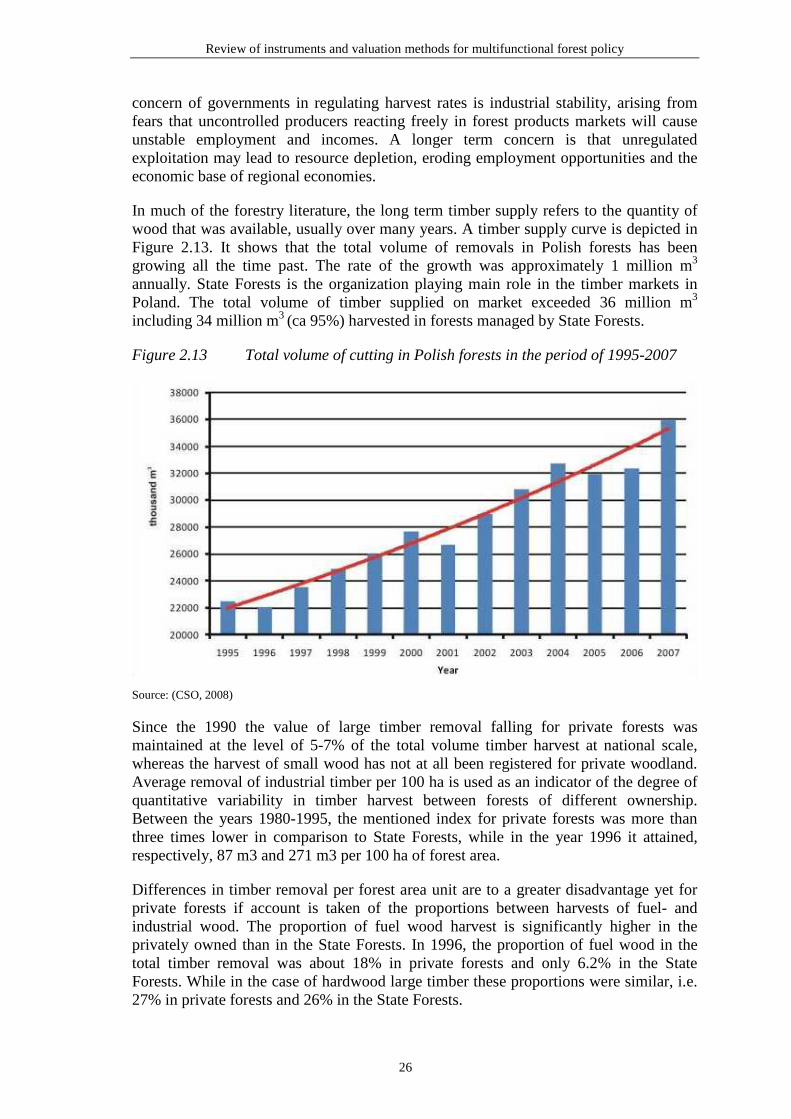
In much of the forestry literature, the long term timber supply refers to the quantity of wood that was available, usually over many years. A timber supply curve is depicted in Figure 2.13. It shows that the total volume of removals in Polish forests has been growing all the time past. The rate of the growth was approximately 1 million m3 annually. State Forests is the organization playing main role in the timber markets in Poland. The total volume of timber supplied on market exceeded 36 million m3
including 34 million m3 (ca 95%) harvested in forests managed by State Forests.
Figure 2.13 Total volume of cutting in Polish forests in the period of 1995-2007
Source: (CSO, 2008)
Since the 1990 the value of large timber removal falling for private forests was maintained at the level of 5-7% of the total volume timber harvest at national scale, whereas the harvest of small wood has not at all been registered for private woodland. Average removal of industrial timber per 100 ha is used as an indicator of the degree of quantitative variability in timber harvest between forests of different ownership. Between the years 1980-1995, the mentioned index for private forests was more than three times lower in comparison to State Forests, while in the year 1996 it attained, respectively, 87 m3 and 271 m3 per 100 ha of forest area.
Differences in timber removal per forest area unit are to a greater disadvantage yet for private forests if account is taken of the proportions between harvests of fuel- and industrial wood. The proportion of fuel wood harvest is significantly higher in the privately owned than in the State Forests. In 1996, the proportion of fuel wood in the total timber removal was about 18% in private forests and only 6.2% in the State Forests. While in the case of hardwood large timber these proportions were similar, i.e. 27% in private forests and 26% in the State Forests.
Review of instruments and valuation methods for multifunctional forest policy
27
Noteworthy is a high stake of sawmill wood in the amount of large timber removal in private forests, the level of which exceeded 60% in 1996, which was markedly higher than that of the State Forests (45%). Therefore it can be inferred that timber in private forests is used in a much less rational way since even more valuable timber sorts such as e.g. plywood and match wood are classified as sawmill timber. In 2002, the total volume of harvested timber in private forests was 1,110,870 m3 including 875,058 m3 of softwood (692,786 m3 bole wood + 182,272 m3 pile wood) and 235,812 m3 of hardwood (151,694 m3 bole wood + 84,118 m3 pile wood). Largest amounts of timber were harvested in the following Voivodeships: Małopolskie - 235,201 m3, Lubelskie – 180,372 m3, Mazowieckie -111,809 m3, Podkarpackie – 98,361 m3 and Śląskie – 91,327 m3. The least volumes were removed in the Zachodniopomorskie and Opolskie Voivodeships, 5,972 m3 and 7, 905 m3 respectively. In the Podlaskie Voivodeship - 67,511 m3 were then harvested.
The level of timber harvest is the basic factor determining the actual economic importance of forestry in the national economy, especially in rural areas. In other words, it is the volume of round timber which provides for the economic importance of forestry together with the sawmill and wood processing industries which are situated largely within municipalities. Both industries in combination with forest economy are important for economic stability of rural areas, local employment and social situation.
Very specific problems concern small scale forestry. In relation to roundwood produc-tion small scale forestry is characterized by limited opportunities of mechanization unless the equipment can be used on more than one holding. The single small-scale forest owner acting on his own has a marginal influence on the roundwood market, as well on other possible forestry goods markets. The single owners have no updated information about market conditions, in particular under rapid market changes.
The Polish private forest sector calls for the new pattern of district (region) organiza-tion. The regional organizations, which should operate as independent legal and economics units, buy the roundwood from their members, converting a great number of small quantities into small number of great quantities according to contracts with the buyers. The membership would be voluntary, and it has not to be based upon the law. Once a forest owner is a member, he is obliged to sell the roundwood to – or through his association. About 18% of the country’s forest cover (1,5 million ha) belongs to ca 700 thousand of the owners who are potential members of the district forest owners’ association.
The mentioned organization should also provide professional information and advice and other assistance in management including management plans as well as in silvicul-ture and harvesting operations.
The challenge for the Polish small-scale forestry is to develop and maintain a system of co-operation with staff who is good in market operations on behalf of the forest owners. The forms of small-scale forest owners’ co-operation may differ among regions within the country, due to traditions, economy and forest situation. Probably the model presented above does not suit everywhere in Poland. However, the main challenges are connected first of all with the wood market. The challenge is also to use being small. Small scale forestry also means many holdings and many owners and many decision-makers. This renders a valuable diversification possible.
Review of instruments and valuation methods for multifunctional forest policy
28
Forestry as an employment place
Specific situation and role of forestry in the national economy results from the role of forest as a workplace. There is a general assumption that forest production is highly labor consuming, which in part is reflected in its still insufficient equipment as concerns production assets, and, in particular, engineering equipment and installations. This notwithstanding, forestry provides employment for many people. At the half of 1980, forestry sector employed almost 163 000 persons, timber industry - more than 82 000 while pulp- and wood industry - nearly 48 000. Thus the total number of workers in the forest sector and timber industry attained 400 000 persons. This implies that, from the macroeconomic angle, almost every 45 person was then employed in the forest-timber sector.
In contrast, in the year 2000, the forestry employed only somewhat more than 60 000 persons, thus the number decreased by more than 103 000 since 1985. Close to 148 000 persons were employed by timber industry and 41 000 - by pulp- and wood industry. Thus the number of persons employed by timber- and wood and pulp industries decreased by 41 000 since 1985. The total number of persons employed by the two above sectors was estimated to be 292,000, otherwise only every 52 person was employed by the forest-timber sector.
From the regional angle it is the industry, commerce and services which have a dominating role in the economic life. Locally, both forestry and timber industry are important especially in rural areas which is understandable since, apart from other things, a significant part of wood processing industry is situated in small and medium size towns.
From the study made at the Krynki Forest District (Regional Directorate of State Forests in Białystok) it follows that the forestry holding of an area of 14,000 ha was capable of providing 587 jobs. The direct employment in that number was estimated to be at the level of 90 persons, the indirect one - 471 persons while the induced employment attained the value equal to 26 persons. As a result of economic activities in forestry, the amount totaling PLN 578,000 has been transferred annually to the local authorities budgets of the Krynki and Szudziałowo communities, whereas more than PLN 536,000 - to the State Treasury. It was also found that the employment at Krynki Forest District examined provides a sole source of maintenance for three time the number of persons who are directly employed there.
A quite a number of people still earns their life directly working in the forestry or for the forestry providing investment goods to the above production domains, or else being employed in many ways including transportation and trade in ready made products generated by the wood industry.
The forestry continues to play a prominent role in the economy of a region not only in terms of its stake in the generation of the Domestic Product but also in view of its every other advantages whose value cannot be easily expressed in money terms.
Forests provide not only timber alone, but also wild berries and fruits, mushrooms, game as well as multiple other benefits. Woodland has been used as amenity land and hunting ground, as a refuge and shelter for gene banks with prospects that they will be used by future generations.
Review of instruments and valuation methods for multifunctional forest policy
29
Forest management activities enjoy high attention at the policy agenda as measures for carbon sequestration in order to mitigate climate change. The decrease of agricultural viability and the objective to increase forest cover in order to ensure soil protection, the supply with forest products and reduction of forest fragmentation also trigger affore-station of former agricultural land. However, the establishment of new forested areas can endanger other environmental and social services, including biological diversity.
Therefore, there is a need for a comprehensive approach to forestry problems, which should consider carbon sequestration, soil protection, as well as sustainable provision of timber for wood processing industries and other goods and services in a sustainable way. The special attention in this context should be paid to the role of forests and forestry in rural development.
2.5 Goals and forestry practice As one of the “main threats to the country’s forest resources” the National Policy on Forests (1997) points to “consequences of schematic forest management based on a raw material model”. Raw material model of forestry should be replaced with “model of pro-ecological and economically balanced, multi-functional forest management”. In a framework task list for forest management (Enclosure no 2 to Disposition no 30 DGLP, 1994) it is stated that “The basic goals of forest growth and protection (…) are: a) preservation of the whole natural variability of forests environment and functioning of forest ecosystems in an approximate natural state with the consideration of natural evolution tendencies”. According to the demands of semi-natural silviculture (closed to nature forestry) the overall management goal is to “shape a stable forest with consideration of forest ecosystem rules” (Bernadzki 1995).
The main task of forest policy, forest science as well as forest practice in Poland at present is to prepare forest ecosystems for the altered global environment, to promote and create ecological systems with a sufficient degree of variability that would be particularly resistant to different pressures. These suggest the following tasks:
• maintenance of biodiversity on all levels: genetics, species, ecosystems and land-scape;
• adjustment of forest ecosystems to the changing environmental conditions;
• development and practical use of environmentally and ecologically sound technologies of forestry operations.
These tend to reduce ecological risk in the new ecosystem approach which is trying to be implemented in forestry.
Review of instruments and valuation methods for multifunctional forest policy
30
3 International forest policy This chapter provides a brief overview of some experiences and developments in international forest policy, with a focus on Europe and the former Soviet Union. The last part of the chapter explains ways to include local community concerns in forestry.
3.1 Transition country experiences This section discusses some of the experiences of the transition countries in Europe and former Soviet Union. Since 1990, after the changes of the former Soviet Union, the forest authorities in the transition countries have faced a number of difficulties. These include:
• A sharp decline in markets for forest products in most countries caused by the economic downturn and confusion following transition in the early 1990s.
• An increase in illegal timber extraction caused partly by increasing poverty and the need for fuel wood (the Balkans) or by opportunities for trade (Russia, Bulgaria); phenomenon of “black market” and destruction of private forests partially occurs also in Poland after regulation (Forest Act, 1992) concerning timber harvest in private forests.
• Difficulties with adopting a forest resource pricing regime which reflects the real value of the resource and allows development of markets, in an environment where there are many barriers to the development of these markets.
• The need to create entirely new legislation (for the newly independent countries), which provides on the one hand sustainable forest management (SFM), and on the other opportunities for the emerging private sector within a clear regulatory framework.
• Reorganization of forest sector institutions, often without adequate provision for funding.
• Increasing conflicts between central as well as local ecological groups and organizations in the field of forest/nature conservation; in Poland it revealed itself in form of a dramatic conflict in the case of enlarging of forest protected areas and national parks (BiałowieŜa NP), creation of new national parks (Mazurski NP) as well as in the case of establishing of the EU Natura 2000 network on forested areas.
• Restitution of a relatively large portion of forest land to owners who may not have a tradition for sustainable management and who may wish to maximize short term revenue (especially Czech Republic, Slovenia).
• Rapid privatization of forest industries through deals which, frequently, under-value assets and do not provide for adequate recapitalization. In Poland privatiza-tion concerned wood industry as well as forestry services (forest operations) which have been privatized in the form of private forest enterprises (ZUL).
• Declining central government budgets for forest regulation and management, more complicated tasks, and frequently, budget allocation systems which do not provide incentives for efficient management.
Review of instruments and valuation methods for multifunctional forest policy
31
• The need to address the appropriate balance between “private” and “public” forest goods and services through regulatory, tax and other incentive measures.
There are many differences in institutional arrangements between the countries in transition. In Russia virtually all forest land is and is likely to continue to be owned by the state, while in Slovenia 80% of forest land has now been privatized. In several countries (e.g. Croatia) the main forestry organization operates similarly to a commercial “State Forest Enterprise”, in other countries all forest utilization has been divested to privatized enterprises while the Forestry Service is funded from the federal budget.
Great variation exists between the countries, and one should be cautious in generalizing. But a first step could preferably be to structure the countries in transition into groups which are more homogeneous in relation to criteria like types of main forest ecosystems, ownership structure (size and types of ownership), importance of forestry, forestry tradition, social condition (degree of unemployment, income level), legal and institutional setting, development of wood industries. One could suggest the following groups (Solberg and Rykowski 2000):
• Armenia, Azarbaijan, Kazakhstan, Uzbekistan, Moldovia, Georgia, Kyrgyzstan, Turkmenistan: need almost everything new related to forest policy and sustainable forest management: legislation, forest conservation, protection, and management, education, research and exchange of information, wood processing industry, non-wood forest products.
• Albania, Belarus, Bulgaria, Bosnia-Herzegovina, Croatia, Romania, Russia, Ukraine: are still subject to deep economic and political recessions.
• Czech Republic, Estonia, Hungary, Latvia, Lithuania, Poland, Slovakia, Slovenia: are the most advanced in the process of reformulation of forest policies and improvements of institutional and legal instruments as well as practical changes (partly because of the adaptation and screening process before and after accession to EU).
In general for the group of transition countries the following policy issues (with corresponding policy options) are the most important (Solberg and Rykowski 2000):
Goals for sustainable forest management (SFM): The goals for forestry should be as clear as possible, and derived consistently from the overall development goals of the respective country. It is important to utilize the comparative advantages of the countries. For example the labour costs are still relatively cheap compared to capital costs, and this should stimulate to the use of more labour intensive (and domestically produced) harvesting and processing technology than the newest and most capital intensive equipment imported from high-income countries.
Rights of property regimes/land tenure: The rights of property/land tenure regimes have to be clearly defined and followed. If not, the effects of the other forest policy instruments will easily be negligible.
Forest policy responsibilities between government institutions: Overlapping and unclear legal and institutional arrangements between governmental institutions are major stumble blocks for forest policies.
Review of instruments and valuation methods for multifunctional forest policy
32
Forest investments: A problem facing most countries is to secure that investments in forestry for long-term industrial wood production and environmental services are kept at a sufficient level. Regarding wood production, a certain part of the surplus generated from wood sales could be earmarked for such investments. Regarding environmental services, various legal and financial policy means could be used. For the state forest service it will in most countries be necessary to find new income sources than wood sales (case of Poland). Increasing the amount of the deficit spending for the state forest service, which is common in many European states, will become more politically difficult in the future. Economists are developing new procedures to sell non-wood goods and services, but the size of achievable income from these activities is still rather uncertain, and it may have politically difficult distributional impacts. An alternative is a special budget (financed by public resources) for non-wood goods and services, or a combination of these two approaches.
Fragmentation of forest estates: Due to the ongoing privatization process in many countries, fragmentation of properties is an important challenge facing forestry there (Lithuania, Czech, Slovenia). But it is not the case of Poland. Forest fragmentation (ca. 26 000 separated forest pieces of surface more that 1 ha) in Poland is due to agricultural activity as well as afforestation actions in the past as well as today thanks to the Country Programme of Forest Extension started in 1996. The challenge is to create appropriate legal framework for private forest management in this situation while securing important public environmental services from private forests, and efficient forestry practices according to SFM.
Forest owner associations and extension services: Forest owner associations are a very important instrument for knowledge dissemination to and support of small and medium sized forest holdings. In most of the transition countries this kind of organizations are rather few and limited in scope, and public financial support for such organizations could be preferable at least in an initial phase. In Poland there are 6 forest owners associations: the oldest one „Witów” on the Tatra region and “Bukowsk”, 4 new associations Zawoja, Kamienna in Gorce region, Słopnice and Wieliczka, which have been organized in 2002 thanks to pilot Projects before accessing the EU and co-financed by Sweden and Ireland. Polish Associations principles goals are: (1) increase of profit generated from forests, (2) to get certificates for timber production, (3) increase the chance to have allowance from EU budget provided for structural funds.
Public participation and conflict resolution: Forestry provides many types of goods and services, and the various stakeholders rank them differently. It is therefore quite natural that conflicts occur regarding what is optimal forest management. To get a reasonable balance between competing views, it is important that appropriate institutional arrangements are created for public participation and conflict resolution in forestry. Polish forestry represented by State Forests NFH created some possibilities for this purpose. Firstly, during the preparation of forest management plans there is an obligation to consult these plans with local society, environmental/conservation groups, civil society and with all stakeholders interested in goals and forest management methods in the area. Secondly, each Promotional Forest Complexes – a new form of forestry organization of State Forests NFH – has their Scientific-Social Council - a new public consultation group of experts composed with representative of science, state administration, local governments, media, non-governmental organization, private companies or persons of high authority among local communities. The Councils are advisory opinion-making bodies to the directors of Regional Directorates of the State Forests NFH. The scope is to initiate tasks for the Promotional Forest Complexes and
Review of instruments and valuation methods for multifunctional forest policy
33
local Forest Districts. The next openness of polish forestry to public participation is the very large programme of forest public education, especially in Promotional Forest Complexes, as well as organization periodically the open Forest Forum and annually a Forest Day with a large participation of civil society.
The relationship between forest authorities and interest groups is important in this context. Associations of forest industry private owners and interest groups (ecology/ environmental/nature conservation groups) are new for the forest authorities in most of the transition countries. In a system with more private ownership and a market economy the interest groups are important for formulating and securing the interests of the various stakeholders. Strong forest authorities, centralized like in Poland, recognize this in information for policy making, but they insist on the right of the state on the final decision, which generates conflicts. The forest authority cooperates with the interest groups and exchange compromises in the programs for promises to support policy implementations. It can also for example invite the interest groups to participate in the formulation of forestry programs. It happened in the case of elaboration of Natura 2000 network, nature inventory in forests managed by State Forests NFH or in preparation of the Program of Small Water Retention in Forests. It should be noted that all these activities did not stop conflicts and their resolution are far from satisfactory.
Experiences from several countries show that changing the forest law has to be supplemented with proper regulation and monitoring policy measures in other sectors in order to secure forests and environmental public services. It is also important that the different policy instruments related to forests do not seriously conflict with each other.
In most transition countries forestry and forest industries are just small parts of the total economic activity (average for Europe amounts to ca. 1.0%; for Poland 1.6% (2005)), whereas their importance regarding regional/rural development and environmental aspects are high. Consequently, the policies implemented in other sectors of the economy are in most of these countries very important for the forest sector. In particular the policies related to agriculture (land use), energy, environment, trade, transport, and the general economy heavily influence the functioning and potential of the forest sector. When considering forest policy changes, it is important to include analyses of policies/ policy instruments in these other sectors.
Overall coordination – National Forest Programs: The combination of single forest policy instruments and their coordination with policies in the other sectors of the economy to fulfil overall development objectives of the society is a great challenge for forest policy. Few countries, if any, have yet managed that balancing act properly. Unclear objectives, special interests, conflicting preferences, financial shortages, and historical/institutional constraints are examples of factors which make an appropriate coordination difficult. The concept of National Forest Programs (NFP) being introduced in several countries now is a promising coordination tool for covering the main stages of the whole policy formulation and implementation process for sustainable forest development. However, the NFP concept is defined and practiced differently in different countries, and might easily develop into another “paper-tiger” in the inter-national forestry debate if not properly followed up. In Poland it became really a “paper-tiger” because the work on it has been given up in 2005 after failure of Operational Regional Programs of National Policy on Forests.
Review of instruments and valuation methods for multifunctional forest policy
34
3.2 Experiences from other European countries The Ministeral Conference on the Protection of Forests in Europe (MCPFE) has been working for Sustainable Forest Management (SFM) since early 1990s. Main concepts of SFM were first defined during the Helsinki Conference in 1993, and by 1995 criteria and indicators of SFM were agreed on in order to guide and monitor progress towards SFM in European countries. The six criteria for SFM that have been identified by MCPEF are:
Criterion 1: Maintenance and Appropriate Enhancement of Forest Resources and their contribution to Global Carbon Cycles
Criterion 2: Maintenance of Forest Ecosystem Health and Vitality
Criterion 3: Maintenance and Encouragement of Productive Functions of Forests (Wood and Non-Wood)
Criterion 4: Maintenance, Conservation and Appropriate Enhancement of Biological Diversity in Forest Ecosystems
Criterion 5: Maintenance and Appropriate Enhancement of Protective Functions in Forest Management (notably soil and water)
Criterion 6: Maintenance of Other Socio-Economic Functions and Conditions
Good, comprehensive and up-to-date descriptions of multifunctional forest policy in Europe is presented in the MCPFE (2007) report on sustainable forest management in Europe. The report was prepared for the fifth Ministerial Conference on the Forest Protection in Europe held in Warsaw in November 2007. The report presents state of the art as well as achievements in implementation of SFM in Europe as a whole and in respective countries (MCPFE, UNECE and FAO, 2007).3 Where nothing else is indicated, the following section is based on findings presented in that report.
National Forest Program (NFP)
MCPFE has developed a common European approach to NFP, and provides a platform for the exchange of experiences related to NFP work. NFP is a structured process approach to development and implementation of forest policies in a country or a state. Three characteristic NFP elements are often seen as most significant by participating countries:
• a broad concept of SFM
• stakeholder participation
• efforts to strengthen cross-sectoral coordination and collaboration
NFPs can be distinguished along a number of dimensions, including to what extent they are formal or informal governmental processes, or whether the documents developed through the process are formally adopted or not. In some countries the national NFP
3 45 European Countries including the Russian Federation.
Review of instruments and valuation methods for multifunctional forest policy
35
comprises a set of policies or strategies addressing SFM, and is not a NFP process in a strict sense but may be denoted as “equivalents” to NFPs.
An increasing number of countries are implementing NFPs, and the EU Forest Action Plan identifies the NFP as a suitable framework for implementing international forest-related commitments in the context of the EU. Two-thirds of the countries reporting on their NFP work to the MCPFE (2007) states that they are currently implementing an NFP or equivalent, and several other countries are reporting to be in the process of developing an NFP. Due to the diversity of the role of forests and forestry across different European countries, a large variation in the interpretation and application of general policy-making concept is expected. This is similar to the situation for transition countries discussed in the previous section. Only ten countries report to have taken the MCPFE approach to NFPs fully into account, while most countries describe their NFPs as following the spirit but not the letter of the concept and principles of NFPs. It should be noted that NFP processes have started at different points in time across Europe, and that several countries report to have started NFP processes prior to the MCPFE introduction of the concept.
Feedback from the participating countries indicate that the broad concept of SFM is generally accepted and widely used as a reference and framework for forest policies covering the economic, ecologic and social dimensions of forestry. MCPFE criteria and indicators for SFM are by many countries referred to as useful tools in their NFP work. Benefits from a broader stakeholder participation in forest policy making has been discovered by countries implementing NFPs. The form and extent of this stakeholder participation vary across the countries due to different contexts and political cultures with the most common form of participation being an exchange of information and consultation during the formulation process. Stakeholder participation and cross-sectoral coordination and collaboration are dependent on the willingness and ability of relevant user groups and other sectors to participate. In cases where political support for the NFP is weak, cross-sectoral collaboration is often hampered due to limited interest in the NFP process from other sectors.
For most countries, the NFP approach to creation of forest management policy includes new elements that differ considerably from traditional approaches to forest policy making. Given these differences and the relatively short time period since the new approach was introduced, great progress has been made in adopting and integrating some of these new elements. Still, most countries experience that it takes time to experiment and learn how to use the various elements in en effective manner, and how it is suitable to integrate them into prevailing national cultures and processes of public and private forest management (see Box 3.1 for an example).
Review of instruments and valuation methods for multifunctional forest policy
36
Box 3.1 The Austrian Forest Dialogue - an example of a formal NFP process
The Austraian Forest Dialogue (“Walddialog”) is a good example of a long-term oriented, participatory, cross-sectoral NFP process. The Forest Dialogue was launched by the Austrian Federal Minister of Agriculture, Forestry, Environment and Water Management in 2003. At the beginning, all Forest Dialogue participants jointly elaborated the rules of cooperation, the principles of process structure and procedure, and adopted them by consensus. These rules and principles provide a foundation for the work undertaken in the Forest Dialogue.
The purpose of the Forest Dialogue is to enhance sustainable management, managing and protecting Austrian forests. The economic, ecological and social aspects of forests are addressed as equally important pillars in respect to SFM. The Austrian Forest Programme is structured into seven Action Areas. Six of these areas are related to the six critera for sustainable forest management identified by MCPFE (presented above). The seventh Action Area was added on request from the Forest Dialogue participants and is related to “Austria’s international responsibility for sustainable forest management”.
Source: MCPFE, UNECE and FAO (2007)
Legal issues and international commitments in forest policy
In Europe forest regulations have a long tradition, and it is worth noting that most regulations stemmed from wood shortages occurring throughout medieval to modern times. Most laws governing forestry in Europe are originally designed to ensure continuous tree cover and harvests to provide timber products. The last 10-20 years this has changed dramatically, and many countries have during the last decade either changed their forest laws or started the process of changing, to include environmental benefits like recreation, biodiversity protection and water catchments, avalanche protection etc.
Forest related laws have over time moved from local restrictions and usage rules towards more comprehensive provisions that organise and regulate sustainable wood production, and subsequently, SFM. Changes and amendments to forest laws are undertaken from time to time in order to get the regulatory framework align with new conditions and requirements. Half of the reporting countries have revised their main forest legislation since 1990 and several other countries report to be in a process of doing so. This large number of forest laws adopted from 1990 is a clear indication of two major changes that have occurred: the transition of Central and Eastern European countries to market economies (as discussed in the previous section) and the broadening of the concept of SFM. Some amendments to forest legislation are also directly driven by the accession of ten countries to the EU in 2004 and another two countries in 2007.
There are mainly three kinds of legal documents that are used to regulate land use with regard to forests and forest area in European countries. These documents are: forest laws, different kinds of general land use legislation, and in some cases also the constitution addresses forest issues. Figure 3.1 shows that forest law is the main legal document related to forest use in most countries, while several countries report that general territorial land use and land use planning laws are used to regulate forest areas.
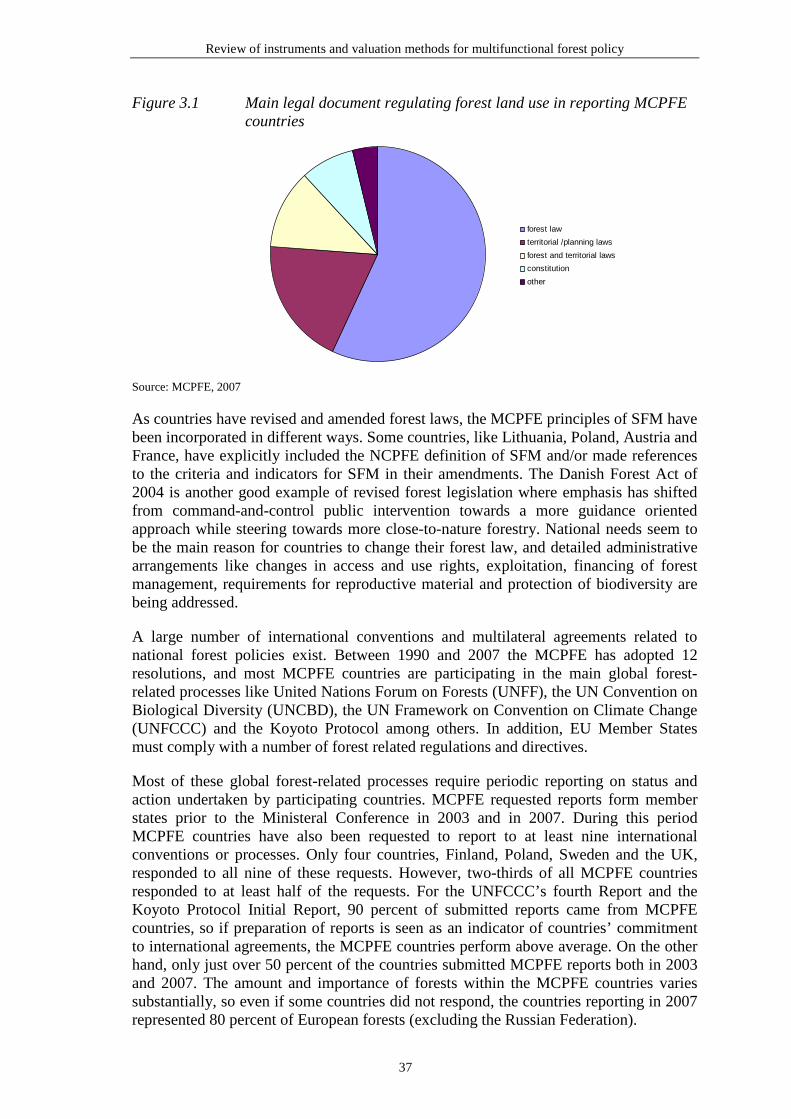
Review of instruments and valuation methods for multifunctional forest policy
37
Figure 3.1 Main legal document regulating forest land use in reporting MCPFE countries
forest law
territorial /planning laws
forest and territorial laws
constitution
other
Source: MCPFE, 2007
As countries have revised and amended forest laws, the MCPFE principles of SFM have been incorporated in different ways. Some countries, like Lithuania, Poland, Austria and France, have explicitly included the NCPFE definition of SFM and/or made references to the criteria and indicators for SFM in their amendments. The Danish Forest Act of 2004 is another good example of revised forest legislation where emphasis has shifted from command-and-control public intervention towards a more guidance oriented approach while steering towards more close-to-nature forestry. National needs seem to be the main reason for countries to change their forest law, and detailed administrative arrangements like changes in access and use rights, exploitation, financing of forest management, requirements for reproductive material and protection of biodiversity are being addressed.
A large number of international conventions and multilateral agreements related to national forest policies exist. Between 1990 and 2007 the MCPFE has adopted 12 resolutions, and most MCPFE countries are participating in the main global forest-related processes like United Nations Forum on Forests (UNFF), the UN Convention on Biological Diversity (UNCBD), the UN Framework on Convention on Climate Change (UNFCCC) and the Koyoto Protocol among others. In addition, EU Member States must comply with a number of forest related regulations and directives.
Most of these global forest-related processes require periodic reporting on status and action undertaken by participating countries. MCPFE requested reports form member states prior to the Ministeral Conference in 2003 and in 2007. During this period MCPFE countries have also been requested to report to at least nine international conventions or processes. Only four countries, Finland, Poland, Sweden and the UK, responded to all nine of these requests. However, two-thirds of all MCPFE countries responded to at least half of the requests. For the UNFCCC’s fourth Report and the Koyoto Protocol Initial Report, 90 percent of submitted reports came from MCPFE countries, so if preparation of reports is seen as an indicator of countries’ commitment to international agreements, the MCPFE countries perform above average. On the other hand, only just over 50 percent of the countries submitted MCPFE reports both in 2003 and 2007. The amount and importance of forests within the MCPFE countries varies substantially, so even if some countries did not respond, the countries reporting in 2007 represented 80 percent of European forests (excluding the Russian Federation).
Review of instruments and valuation methods for multifunctional forest policy
38
Economic and financial policy
Economic policies related to forestry in European countries are generally aiming at strengthening the economic viability of forestry and SFM, often focusing explicitly on achieving a balanced production of the multiple goods and services from forests. In most MCPFE countries both private and state owned forests exist, so forest-related economic policies need to promote goals that are relevant for both these categories of forest owners. In addition, the different role of forestry and varying society needs across European countries lead to different approaches, policy priorities and modes of implementation. Even though forests are important economic assets and important in order to provide income and employment in many countries, few countries explicitly report that the goal of their forest-related economic policies is to use the forests efficiently in order to develop forests as a source of economic growth and employment.
Reforestation and afforestation of degraded or marginal land are directly addressed through economic policies by a number of countries in order to increase the total area of forests. This is for example done in Iceland, Ireland, Denmark, Hungary, Romania and the UK. For eligible EU countries economic incentives for reforestation and affore-station are provided particularly through co-funding by the EU Rural Development Regulation 2000-2006.
In countries with private forest owners economic policies are directed towards enhancing the economic situation of private forest enterprises, sometimes with an explicit goal to encourage private forest owners to remain active in forest management and to maintain multifunctional production and services. Some countries have set up public funds especially to promote private investment in forestry (e.g. forestry savings funds in France and Norway) or entrepreneurship (Finland) (see text box 3.2 for an example). Some countries have implemented policies and measures intended to increase the demand for wood. Initiatives like “enhancing the sound use of wood” in France, “promoting renewable resources” in Belgium and measures supporting small and medium size enterprises in the forest wood-processing industry in the UK, France, Finland and Greece indicate that the scope of economic policies are broadening to cover more comprehensive value-added production chains important for rural development in general.
Box 3.2 The Norwegian Forest Trust Fund (FTF)
The Norwegian Forest Trust Fund (FTF) is the main financial instrument in Norwegian forestry. The objective of FTF is to ensure the funding of a sustainable management of forest resources, for instance through building a better foundation for long-term investments. The fund is built through compulsory deposits made by all forest owners when selling timber and biofuels.
Each forest property has its own fund account, and the funds are tied to the specific property. From 2007, 85% of the capital used from the fund is excempted tax. Consequently, for each 1000 NOK invested from the fund, only 150 NOK are taxed. The size of the transfers to the fund is decided when the timber contract is agreed, and is in the range between 4 to 40 % of the gross value of the timber, depending on the need for new investments at the specific property.
The Forest Trust Fund can fund for instance planting of forest, building and maintenance of forest roads, environmental actions and insurance of forest.
Source: Bergseng and Solberg (2007) and SLF (2009)
Economic viability of forestry is highlighted as a goal for economic policies in many countries, and some countries, like Iceland and Sweden, are steering towards making
Review of instruments and valuation methods for multifunctional forest policy
39
SFM self-financing. There is no clear trend indicating whether the emphasis on economic policy and financial support (subsidies) is increasing or decreasing in Europe. Some countries, like Norway, indicate the use of more supportive measures, while other countries reduce the support from public sources. Still, a move towards more flexible governmental economic and financial arrangements and increased emphasis on market based mechanisms and private commercial funding in SFM is seen in Europe. An indication of this is for example that the public UK Forestry Commission in 2005 was empowered to enter into joint commercial ventures and to commercially exploit its research.
Financial instruments are used across Europe to promote both the economic, ecological and social component of SFM. The design of funding instruments differs between countries and measures in question, but common forms of support are state subsidies and grants, loans or credits. Also tax exemption schemes are employed in some countries. Economic viability of SFM is only one of the components financial instruments are used to promote. Also the ecological and social components are targeted, especially forest protective services, special measures to maintain and increase forest biodiversity, and nature and landscape protection. Specific programmes are in some countries in place to provide forest owners with economic incentives to protect ecosystems and biodiversity, for instance the Forest Biodiversity Programme for Southern Finland (METSO) and the Nature Conservation Agreement in Sweden. Examples of supportive measures used to promote the use of indigenous tree species, improve degraded land, or secure provision of protective services like avalanche and torrent control as well as measures against fire, pests and diseases are found across Europe. In addition, many countries finance or co-finance research and development, advisory or extension services, education and training of forest owners and managers. Forest inventories and monitoring is also typically covered by public funds.
Data collected on public budget spending in Europe in the forestry area show huge variation between countries, and ranges from more than EUR 100 per hectare per year in some countries to only a few EUR per hectare per year in other countries. The highest expenditures are found in countries pursuing an active afforestation policy, like Iceland and Ireland, or countries with high expenditures for public services such as protection or recreation for urban societies, like for example the Netherlands.
A wide range of funding sources exists. General funds support sustainable forest management and implementation of new legal provisions while ear marked funds address specific issues within a set time frame. Although most funds stem from domestic sources, the EU is also a large provider of funding. The EU funding is reported to be significant in the development of forestry in many countries, especially in Central, Eastern and Southern Europe. Since 2000 EU forestry funding has come from the EU rural development funds. Between 2000 and 2006 EU contributions were EUR 4.7 billion in total. About half of this was allocated to co-fund afforestation activities, while the other half is used for other forestry measures.
3.3 Forest management and local communities Forest management must not be performed separate of the issues concerning local communities living in the forest surrounding areas. Forest in rural areas plays a specific role in this regard where it has essential economic and social functions to fulfil. In contemporary outlook of the rural areas and the grounds of their multi-functional development, forest forms a component of broader changes (Sikor; 2006). Declaration
Review of instruments and valuation methods for multifunctional forest policy
40
of awareness of these issues can be seen in a number of documents. For instance “The FAO strategic plan for forestry” indicates that:
The forests have economic, social and cultural value for the indigenous people who live in them and also for the rural poor and disadvantaged. Institutional failures have led in many cases to insecure resource access rights for forest dependent communities and a lack of transparency in forest resource pricing and allocation processes. These issues need to be considered in national policies and, most importantly, given proper consideration in balancing the relationship between economic and environmental interests. (FAO, 2000)
“Sustainable forestry and the European Union” indicates:
With their many functions, forests are essential to rural areas and constitute a major component of an integrated rural development policy, particularly because of their contribution to income and employment and their ecological and social value (EU; 2003).
Adequate and sustainable forest use for the purpose of local economic development requires that the local communities be involved in forest management processes. Such an approach writes into idea of co-management and civil society that during the recent decades has entered into economic theory of the public sector4.
Contemporary forest management has become a forum for settling local conflicts between stakeholders (Kennedy et al. 2001). Besides the local communities and the forest owners, those are the forest enterprises (e.g. timber industry) and the associations of their employees, forest managers on regional (or national) level, self-governmental authorities, environmental organisations, and hunting associations. Building of partnerships between these stakeholders involves a broader approach to the co-management idea and it is an important element of the state-of-art understanding of forest management (Jeanrenaud 2001).
Examples of co-management and partnership in forest management
Each particular case of partnership and forest co-management is specific, related to varying local circumstances. The nature of a given forest area shall be decisive for each such case, and the composition of the stakeholders will be of importance, as well, including the local communities, strength and directions of their relations with the forest, and also expectations regarding forest management. Finally, also the tradition and legislation shaping these relations (particularly the ownership issue) between all entities will be essential.
A number of examples is presented below which prove that even under mostly differentiated conditions implementation of the partnership has been feasible, although not always with the same success. Brief historical circumstances of these partnerships have been outlined, including their basic objectives and financing methods and the co-management formula.
4 Classical (already) indication of the role of active communities in local development is outlined in book by
Putnam that analyses the Italian case; cf. Putnam 1993.

Review of instruments and valuation methods for multifunctional forest policy
41
Western Europe
According to a long lasting tradition in Italy that originates from the Middle Ages, the co-ownership and co-management of forests, particularly in mountain areas5, are until now being preserved by such specific communities which several hundred years ago established foundations for that and those are especially focused on rational forest management. That is exemplified by the Magnifica Comunità di Fiemme founded in 1111 which manages the area of di Fiemme Valley in Northern Italy. All residents dwelling in the valley are co-owners of its land. Supervision over the ownership is exercised by a democratically elected local authority. The economy within this community is based primarily on forest areas (covering more than a half of the valley land), and as early as in 1529 the following were mentioned among the rights and obligations of the Comunità, including:
• several forests were to be reserved strictly for protection purposes - only limited fuel wood collection and wood harvesting for house repair were to be permitted;
• each community member could harvest and sell every year, upon authorization, ten trees, to be processed and sold only in prescribed dimensions. If they were sold, they had to bear the brand of the Comunità (a practice that still continues today);
• trees were to be felled no later in the growing season than June; branches and waste were to be removed from the forest and further processing was permitted only outside the forest.
The Comunità finances its activities while based on the income raised from sales of wood. The resources so acquired are then being spent not only for sustainable forest development, but also for the common purposes of the residents in the valley (in 1997, wood from the Fiemme Valley was granted the FSC Certificate).
Unlike the long lasting tradition of the partnership as presented in the Italian example, the story of The Borders Forest Trust (BFT) in Scotland is quite new6. This trust was established in 1996 as a non profit organization. The Borders lost the larger part of their forests during previous Centuries. The idea of projects being implemented by the BFT consists in restoration of natural interrelations between forest and the residents by means of halting the further degradation of the forest areas and establishment of new ones. This requires both the investment and educational activities to be implemented. The BFT's projects are financed with public and private subsidies. The activities pursued by the BFT involved the local authorities being the owners of existing forest areas. Also other organisations interested in forest management have been invited to participate. The trust supports initiatives carried out by other NGOs and also informal social groups that are aimed at development of forest management. The assistance consists not only in sole financing, but primarily in coordination of the bottom-up initiatives which would have never been raised and/or even failed without this support.
Unlike in case of the examples presented above, the forest partnership and co-management in Finland is performed as mandatory legal obligation. The reason for this was originally thought as the method to avoid conflicts between the Finnish Forest and Park Service (FFPS) and private forest owners (who possess about 70% of the Finnish
5 Prepared following Morandini 1996; Jeanrenaud 2001 and Zingari 2000. 6 Prepared following Jeanrenaud 2001 and http://www.bordersforesttrust.org
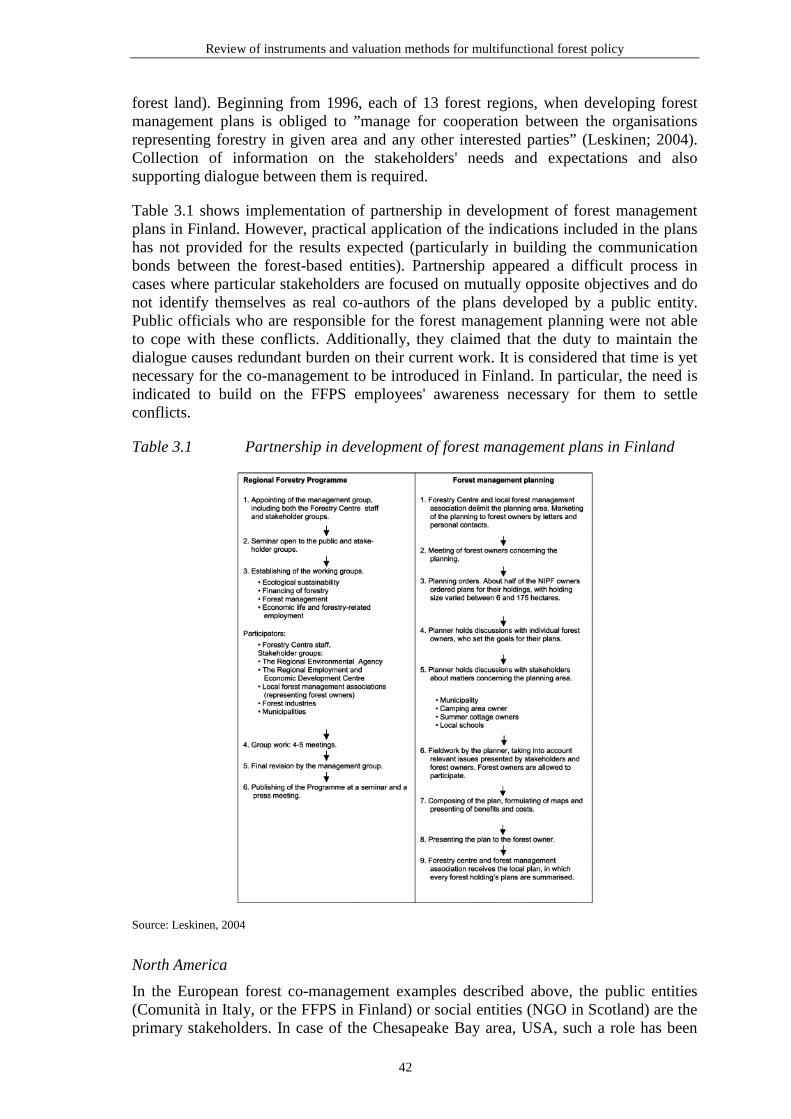
Review of instruments and valuation methods for multifunctional forest policy
42
forest land). Beginning from 1996, each of 13 forest regions, when developing forest management plans is obliged to ”manage for cooperation between the organisations representing forestry in given area and any other interested parties” (Leskinen; 2004). Collection of information on the stakeholders' needs and expectations and also supporting dialogue between them is required.
Table 3.1 shows implementation of partnership in development of forest management plans in Finland. However, practical application of the indications included in the plans has not provided for the results expected (particularly in building the communication bonds between the forest-based entities). Partnership appeared a difficult process in cases where particular stakeholders are focused on mutually opposite objectives and do not identify themselves as real co-authors of the plans developed by a public entity. Public officials who are responsible for the forest management planning were not able to cope with these conflicts. Additionally, they claimed that the duty to maintain the dialogue causes redundant burden on their current work. It is considered that time is yet necessary for the co-management to be introduced in Finland. In particular, the need is indicated to build on the FFPS employees' awareness necessary for them to settle conflicts.
Table 3.1 Partnership in development of forest management plans in Finland
Source: Leskinen, 2004
North America
In the European forest co-management examples described above, the public entities (Comunità in Italy, or the FFPS in Finland) or social entities (NGO in Scotland) are the primary stakeholders. In case of the Chesapeake Bay area, USA, such a role has been

Review of instruments and valuation methods for multifunctional forest policy
43
also performed by a private entity.7 This forest area in Maryland being the largest catchment area in the USA has undergone permanent corrosion due to continuously growing and uncontrolled volumes of municipal and agricultural waste water. Unfortunately, both the local and the regional public authorities had neither sufficient financial resources nor technical backup to cope with that situation. The public-private partnership concluded that a timber industry company could be a solution. The company was granted the opportunity to felling a definite part of forest (and to gain respective profit on this), and it assumed the obligation to manage the whole area instead, however under strict supervision as exercised by the public authority. Besides that authority (i.e. the Maryland forest management agency) and the private company, yet the social stakeholders, i.e. environmental organisations, were involved in the project in question. These organisations drew up the Chesapeake management plan which identified, inter alia, these forest areas where felling trees does not affect the ecosystem. Appointment of the Advisory Committee was an essential component of the partnership establishment process. Composition of the Committee which took part in development of the plans of changes and forest management included the representatives of the local residents, authorities and private companies in the Chesapeake Bay area.
Summary
Forest co-management provides for a more in-depth consideration of the social aspect of forest management. Its implementation is possible under various forms of the forest management and ownership systems. However, it is the activity of the public and their willingness and ability to carry out dialogue between all stakeholders that forms the foundations for the final success.
In Poland, the idea of forest co-management reveals primarily in the formula of the public consultation procedure as required where the regional operational programmes under the national forest policy are being established. A number of examples could be cited where in-depth cooperation between the representatives of the "State Forests" National Holding or those of the National Parks, on one hand, and the local communities, on the other hand, is carried out. However, as the other countries' experience shows, a wider institutional support is also necessary in this field, and implementation of the financial and organisational assistance instruments is also required to make easier the consideration of differentiated social needs and expectations which are addressed to forests.
7 Prepared following http://ncppp.org/undp/chesapeake.html
Review of instruments and valuation methods for multifunctional forest policy
44
4 Economic valuation methods for non-timber forest benefits
The previous two chapters have discussed forest policy approaches and experiences. Many of these have the last couple of decades put more emphasis on providing other benefits from forests than timber. Such benefits typically have no economic value in markets. Therefore the economics discipline has developed several methods to value such non-timber forest benefits (NTFBs) in economic terms. This chapter presents a review of the main economic valuation methods used to value NTFBs in economic terms. Section 4.1 gives an overview of the main types of NTFBs and how these relate to the categories of economic values, and the main methods used to value them. Sections 4.2 – 4.4 present the three most important valuation methods (the travel cost, contingent valuation and choice experiment or choice modelling methods). Section 4.5 discusses briefly a few other, less common, methods also used to value NTFBs. Chapter 5 presents an overview (details in the Annex) of valuation studies that have been carried out in Europe using the methods discussed in the current chapter.
Section 4.6 describes what policy-makers can do if there is no time or budget to conduct a valuation study based on any of the primary valuation methods, i.e. transfer values to a policy context of interest from a similar context or contexts were one or more valuation studies have been carried out (so-called benefit or value transfer). This is increasingly done in practice, and section 4.6 presents studies that try to test how reliable benefit transfer is in the forest context.
4.1 NTFBs and economic valuation methods Forest ecosystems generate a wide range of goods and services, in addition to timber. Broadly defined, these forest functions are the benefits people obtain from forests (Barbier and Heal, 2006, Pearce, 2001). Many classifications of them have been used at times at different geographical levels: regional, national and international.8 We follow the division suggested by Navrud and Brouwer (2007) and distinguish, apart from timber production, four other main forest functions: recreation, non-timber commercial products, ecosystem services, and non-use values of forests (Figure 4.1). We call them non-timber benefits (NTB).
8 For example: Costanza et al. (1997) and De Groot et al. (2002) propose a classification of ecosystem functions,
and summarize ecosystem services into no less than 23 major categories that are all relevant to forest ecosystems.
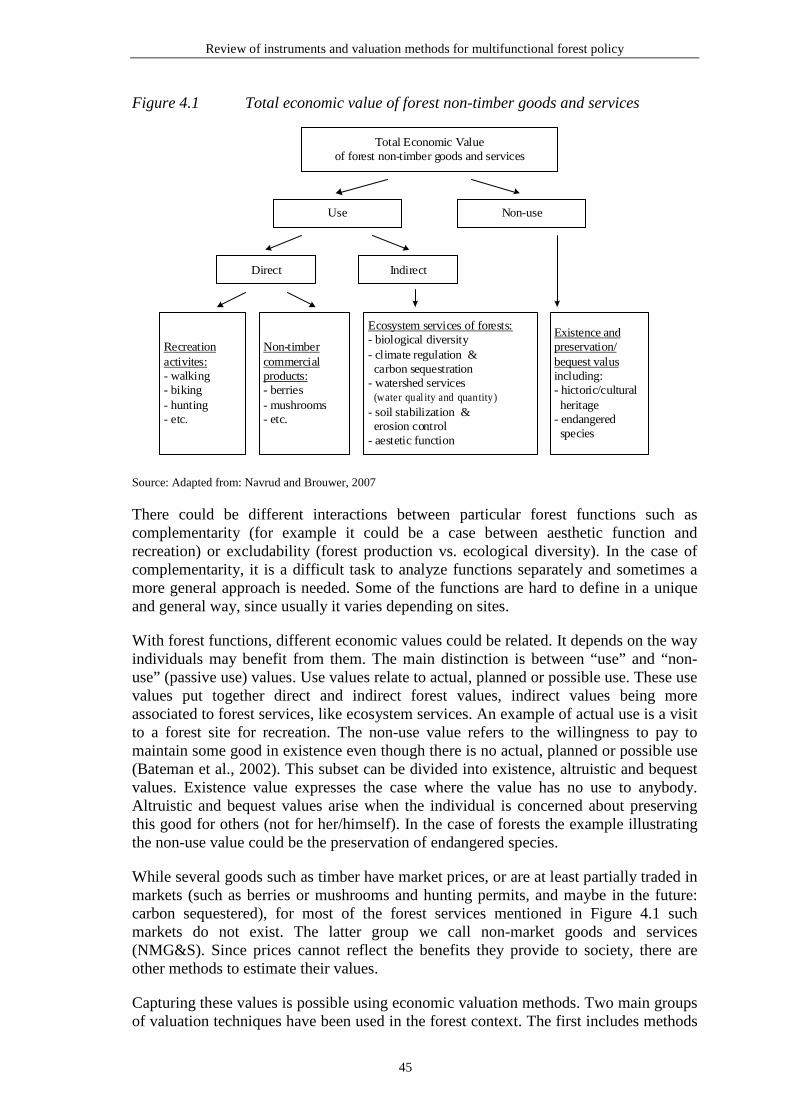
Review of instruments and valuation methods for multifunctional forest policy
45
Figure 4.1 Total economic value of forest non-timber goods and services
Total Economic Valueof forest non-timber goods and services
Direct Indirect
Use Non-use
Recreationactivites:- walking- biking- hunting- etc.
Non-timbercommercialproducts:- berries- mushrooms- etc.
Ecosystem services of forests:- biological diversity- climate regulation & carbon sequestration- watershed services (water qual ity and quantity)- soil stabilization & erosion control- aestetic function
Existence andpreservation/bequest valusincluding:- hictoric/cultural heritage- endangered species
Source: Adapted from: Navrud and Brouwer, 2007
There could be different interactions between particular forest functions such as complementarity (for example it could be a case between aesthetic function and recreation) or excludability (forest production vs. ecological diversity). In the case of complementarity, it is a difficult task to analyze functions separately and sometimes a more general approach is needed. Some of the functions are hard to define in a unique and general way, since usually it varies depending on sites.
With forest functions, different economic values could be related. It depends on the way individuals may benefit from them. The main distinction is between “use” and “non-use” (passive use) values. Use values relate to actual, planned or possible use. These use values put together direct and indirect forest values, indirect values being more associated to forest services, like ecosystem services. An example of actual use is a visit to a forest site for recreation. The non-use value refers to the willingness to pay to maintain some good in existence even though there is no actual, planned or possible use (Bateman et al., 2002). This subset can be divided into existence, altruistic and bequest values. Existence value expresses the case where the value has no use to anybody. Altruistic and bequest values arise when the individual is concerned about preserving this good for others (not for her/himself). In the case of forests the example illustrating the non-use value could be the preservation of endangered species.
While several goods such as timber have market prices, or are at least partially traded in markets (such as berries or mushrooms and hunting permits, and maybe in the future: carbon sequestered), for most of the forest services mentioned in Figure 4.1 such markets do not exist. The latter group we call non-market goods and services (NMG&S). Since prices cannot reflect the benefits they provide to society, there are other methods to estimate their values.
Capturing these values is possible using economic valuation methods. Two main groups of valuation techniques have been used in the forest context. The first includes methods
Review of instruments and valuation methods for multifunctional forest policy
46
based on revealed preferences (RP) such as the travel cost method (TCM) and the hedonic price method (HPM). The second group is based on stated preferences (SP), and includes the contingent valuation method (CVM) and Choice Experiments (CE)9.
RP methods derive a measure of consumer surplus (CS) – an expression of the benefit (or utility) of the consumer over and above what she has to pay for the good – based on existing markets and demand curves of some private goods. When expenditures on a private good vary with levels of environmental amenities, under certain conditions a value of the environmental amenity can be derived (Young, 2004). SP methods use constructed/hypothetical markets. Based on specially prepared questionnaires, it is possible to obtain in a direct way the respondents’ willingness to pay (WTP) for non-market goods and services.
Whereas the application of RP methods is restricted to particular forest functions connected with use values (TCM for recreation, HPM for e.g. aesthetic functions), the SP methods have no such limitations. SP methods can estimate both use and non-use values related to a variety of functions. What is in general valued by those methods are environmental changes (in quality or quantity) but not total economics values.
Studies that are designed and carried out for selected forest sites which use either RP or SP methods we call primary studies. Many primary studies exist on recreation, biodiversity, watershed benefits or climate benefits. The next three subsections will explain the travel cost method, contingent valuation and choice experiments.
4.2 The travel cost method
What is TCM?
The travel cost method (TCM) is claimed to be the oldest from all non-market valuation techniques. The basis of TCM was created by Harold Hotelling in 1947, when the National Park Service in the USA wanted to know the economic value of recreation in national parks. Hotelling suggested to measure different travel costs according to travel distances of visitors to a park. Investigating the negative empirical relationship between increased travel distances (and costs) and number of visits makes it possible to estimate the demand for recreation at a site. The estimated demand function permits calculation of the consumer surplus (CS), a measure of the benefits generated to park visitors (i.e. the difference between the amount a consumer is willing to pay and the amount he/she actually pays).
TCM belongs to a group of valuation methods based on individuals’ revealed preferences and it is an example of the indirect valuation approach means - it seeks to place a value on non-market goods by using consumption behaviour in related markets. This method is based on solid economics principles – the theory of consumer choice. Hotelling’s original suggestion was developed principally later on by Clawson (1959) and Clawson and Knetsch (1966). Over the last 60 years hundreds of TCM studies have been carried out and the original idea has been elaborated theoretically and empirically by many other researchers.
9 CE is a subset of a wider group of SP methods called choice modelling. We focus on CE, as it is the most
commenly used method.
Review of instruments and valuation methods for multifunctional forest policy
47
What can be valued by TCM?
TCM can estimate use values that can be obtained by visiting a site. Usually this method is applied to value access to recreational sites, scenic, and cultural destinations. Examples of such sites are: parks, forests, lakes, fishing areas, hiking tracks, and cultural heritage sites. Travel costs models can be used to assess:
• the value of access to a site, which can be interpreted as the welfare effects of elimination of a site (i.e. due to a change in land use) or a closure of the site to the public (i.e. due to a change from public to private ownership).
• the value of a change in the site attributes/quality, e.g. as paid for by an increased entry fee.
In a forest context, TCM can be used to estimate the total recreation value of a site, or the value of some specific recreation activity in the forest, e.g. cycling, bird watching etc., or changes in forest characteristics which could be associated with different types of forest management.
Travel costs calculation
An application of TCM requires that travel costs connected with reaching a site are significant and they differ between individuals. Travel costs are a sum of all expenditures needed to make a round trip to a site. It usually consists of:
1) Transportation costs
In this case two approaches are possible. Transportation costs could either be stated by respondents or calculated by researchers based on information of transport mode used by respondents, travelled distance, cost of fuel, number of people covering these costs (last two factors for the private transport case), cost of tickets (for a public transport). The latter approach is more commonly used for two main reasons: first, it ensures that more homogenous data are acquired, second it gives more complete data from respondents since it is easier for them to declare details of their trips such as transport mode and distance rather than cost of these trips.
Although in some TCM models transportation costs are assumed to be equal for people travelling from the same place and using the same transport mode, recently there is a tendency to collect more detailed information which shows that people’s travel cost may vary for a given trip distance (e.g. size of cars’ engines, age of cars, different price of tickets for different groups of passengers).
2) Entrance fees to a site (if it is chargeable)
3) Equipment costs (needed for some recreation activities)
Cost of equipment that can be used also in other occasions and other costs that are not directly associated with the travel in question should not be included (SEPA, 2006).
4) Travel time
One of the most crucial elements of TCM is the cost of travel time. This element is also the most controversial one. It is possible to distinguish three main approaches to assess value of travel time:

Review of instruments and valuation methods for multifunctional forest policy
48
a) A conservative one – value of travel time equals zero. This approach could be based on an assumption that travel time does not provide any utility or disutility on its own, e.g. a person does not choose a site because the travel itself to the site provides utility (Thiene and Signorello, 2008). The other explanation is that the value of travel time for individuals can vary depending on many factors such as, e.g. whether is it a work day or a weekend, the length and route of the trip, transport mode or weather conditions, and - in some cases - travel may even increase the wellbeing of visitors (e.g. travelling a scenic route to the site).
b) Opportunity cost of time in terms of lost income, where travel time is valued at the marginal fixed rate e.g. per hour or day. This approach is derived from the economic theory that individuals can trade off work time and leisure time, in other words that all of them work and have flexible working agreements. So, if they decide to travel, they are at least willing to give up their salary which could be earned during time spent travelling.
c) Some proportion of the wage rate based on an individual’s willingness to pay to save time in a non-working situation, typically his journey to work. In this case, separate studies are conducted to estimated value of travel time using e.g. non-market valuation methods such as CV and CE or factor analysis. Many such studies find that the value of travel time equals around one-third of the individual’s wage rate.
5) Time on site
The same problem as with estimation the travel time arises when we want to compute value of time spent on a site. On-site time should also be an element in the travel costs calculation in the same way as travel time, since both have an opportunity cost. In practice, it is often assumed that time on site can be estimated in the same way as travel time. But some researchers advocate that cost of travel time should have a higher value giving that travelling can generate some disutility whereas time spent on site does not (since it is the purpose of the visit).
The TCM survey phases
In most cases, the phases of survey being carried out with application of the TCM method could be structured as follows:
1. Identification of what would be valued
2. Definition of target population
3. Sampling strategy
4. Model specification
5. Survey implementation
6. Calculation of travel costs
7. Model estimation
8. Welfare estimates
Since some of the issues starting at point 4 were discussed above, this section covers discussion of issues 1-3.

Review of instruments and valuation methods for multifunctional forest policy
49
1. Identification of what would be valued
At this point, the scope of valuation has to be decided; whether it would be the recreational valuation of the site in question, or the specific recreational function, or valuation, with use of the multi-site models, of the change in characteristics which describe a given good. To this end, also delimitation of the physical boundaries of this good has to be performed. Sometimes, it may be an easy task, e.g. in case of the boundaries of a forest, national park, or lake, however, this task involves certain problems, e.g. when the value of a hunting area, or another one being used for recreational purpose is estimated that constitutes a part of a larger environmental site. In case when multi-sites survey is performed, all the sites under analysis have to be defined and one has to make sure that these sites reflect the real choice set for the respondents. In order to be able to survey the changes in the quality of the characteristics, the sites under analysis have to differ in the levels of these characteristics (unless, only hypothetical changes concerning the sites being analysed are presented to the respondents).
2. Definition of target population
Very often a target population in TCM surveys can be restricted only to visitors to sides. However in some studies non-visitors as well are included, which gives a more detailed picture of recreational behaviour for society. If a sample consist only on visitors of the sites, the achieved results can not be extrapolated to the general public. Those studies usually concentrate on the specific recreational activity types, such as biking, walking, horse riding or picking mushrooms.. When performing valuation which relates to a given environmental site it has to be kept in mind that it involves outdoor type recreation, which is heavily dependent upon seasonal features. And the question concerns not only frequency of visits, but also that the visitors who enter the sites in question in various seasons of the year could differ by various socio-economic characteristics, what should be taken into account in the results interpretation. Defining the target population determines choosing the sampling strategy.
3. Sampling strategy
The two most prevalent sampling schemes are a random sample of population of individuals and an on-site sample of intercept users (Haab and McConnell, 2002). Off-site sampling covers both users (visitors of a site) and potential users (potential visitors). An example could be a random mail or phone survey. In this case we could get data representative for the total population. If researchers are interested in the welfare implication for a particular group of users, than for example a list of people with hunting licenses could be considered.
On-site sampling is a quicker and less costly method, however allows only investigating users of the site. Since the survey takes place during a recreation activity of respondents, it could be difficult for him/her to remain focused on the interview especially when it is long. The key problem is connected with representativeness of the sample. In this case the sampling frame is not representative of the population. Those who visit the site more often are more likely to be surveyed. This can be corrected in the statistical analysis.
The major groups of TCM
Modelling the demand for recreation may be performed with use of travel costs data on the grounds of microeconomic theory. It is assumed that the individuals are able to
Review of instruments and valuation methods for multifunctional forest policy
50
express in a rational way their preferences and that the choices they make have optimised the utility in the framework of their budgetary limits. In case of the TC models that involves the choice to be made between, on the one hand, the services/goods being provided by a site, to which they used to travel, and any other goods and/or services, on the other hand. Certain other important assumptions are also being made. First, the method assumes weak complementarity between the site asset and consumption expenditure. It implies that when consumption expenditure is zero (no one makes trips to an analyzed site), the marginal utility of the public good (the site or its quality) is also zero. Since TCM uses this assumption, it is clear that applying this method only use value can be estimated. The next key assumption is the “separability assumption”. It means that the utility function underlying the TCM must also be separable with respect to different forest activities (Garrod and Willis, 2001). In other words, the demand of recreation on a site in question (e.g. walking) is in no way related to the demand of any other forms of leisure (e.g. demand of cinema tickets).
Selection of statistical models for estimation depends first of all upon the survey objective (i.e., whether the total recreational value, or a specific recreation activity, or the changes in the quality of characteristic feature of a given site are surveyed), and also on specific data features (i.e., whether individual or aggregated data is available). That involves the question of the number of the sites to be analysed. Generally, if a single site only undergoes analysis, the present recreational value of this site will be the non-market good under valuation. Where this the case, either the consumer surplus – which, following the neo-classical economic theory, is accounted for as the area under the demand curve – over the present market value, or the access value to this site, will be the measure of well-being.
In case of the multi-site models, both the access value, and the value of changes in characteristics of the sites under analysis can be estimated. Where forests are concerned, the forest species composition, the age of tree stands, the area or volume and quality of tourism infrastructure, could be these characteristic features. If several sites are analysed, the group to consider must not be restricted only to the individuals visiting the sites under evaluation.
Table 4.1 includes division of the TCM into three major groups following methodo-logical assumptions and data and functions specification. They include zonal travel cost models, individual models relating to valuation of primarily single sites (individual single-site models), and multi-site models which are not based on a “quantity demanded approach”, and describes the demand for recreation as a problem of choice among alternatives.
When considering these models, the further deeper breakdown could be done that indicates a direct determination of the demand functions rather than specifying a utility function and the models in which the analysis begins by assuming a functional form for the utility function and then deriving the demand functions for the site-specific activities of interest. The utility function approach usually deals with discrete-choice models based on random utility maximization (Thiene and Signorello, 2008). The former approach will apply primarily for single-site valuation, whereas the latter for multi-site models.
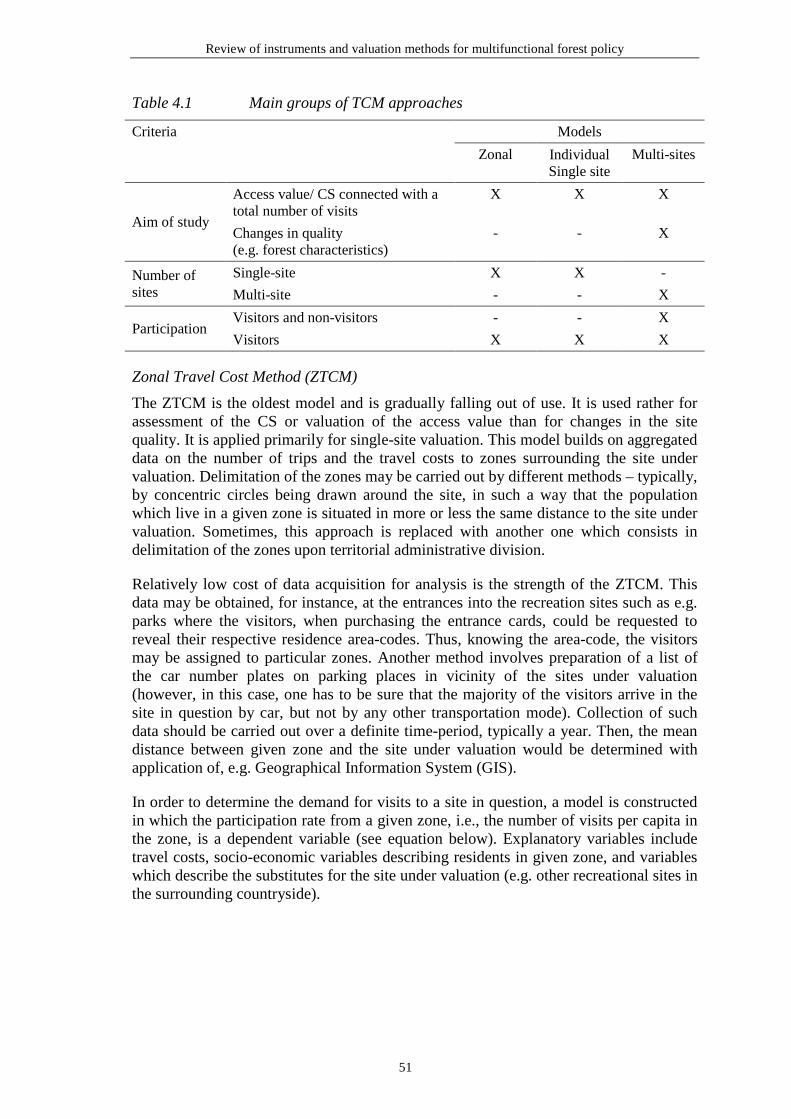
Review of instruments and valuation methods for multifunctional forest policy
51
Table 4.1 Main groups of TCM approaches
Criteria Models
Zonal Individual Single site
Multi-sites
Aim of study
Access value/ CS connected with a total number of visits
X X X
Changes in quality (e.g. forest characteristics)
- - X
Number of sites
Single-site X X -
Multi-site - - X
Participation Visitors and non-visitors - - X
Visitors X X X
Zonal Travel Cost Method (ZTCM)
The ZTCM is the oldest model and is gradually falling out of use. It is used rather for assessment of the CS or valuation of the access value than for changes in the site quality. It is applied primarily for single-site valuation. This model builds on aggregated data on the number of trips and the travel costs to zones surrounding the site under valuation. Delimitation of the zones may be carried out by different methods – typically, by concentric circles being drawn around the site, in such a way that the population which live in a given zone is situated in more or less the same distance to the site under valuation. Sometimes, this approach is replaced with another one which consists in delimitation of the zones upon territorial administrative division.
Relatively low cost of data acquisition for analysis is the strength of the ZTCM. This data may be obtained, for instance, at the entrances into the recreation sites such as e.g. parks where the visitors, when purchasing the entrance cards, could be requested to reveal their respective residence area-codes. Thus, knowing the area-code, the visitors may be assigned to particular zones. Another method involves preparation of a list of the car number plates on parking places in vicinity of the sites under valuation (however, in this case, one has to be sure that the majority of the visitors arrive in the site in question by car, but not by any other transportation mode). Collection of such data should be carried out over a definite time-period, typically a year. Then, the mean distance between given zone and the site under valuation would be determined with application of, e.g. Geographical Information System (GIS).
In order to determine the demand for visits to a site in question, a model is constructed in which the participation rate from a given zone, i.e., the number of visits per capita in the zone, is a dependent variable (see equation below). Explanatory variables include travel costs, socio-economic variables describing residents in given zone, and variables which describe the substitutes for the site under valuation (e.g. other recreational sites in the surrounding countryside).

Review of instruments and valuation methods for multifunctional forest policy
52
)SUB,SOC,P(fN
Vhhhj
h
hj =
h - zone j - site V - number of trips N - number of individuals P - travel cost SOC - vector of socio-economic characteristics SUB - vector of substitute recreational site characteristics
The major critics according to the ZTCMs is that, that these models operate on aggregated data for particular zones and use an assumption that estimation of the demand is generated by a “representative consumer” whose behaviour reflects the average behaviour in the population (Haab and McConnell, 2002). Secondly, data on both the number of trips and the residence areas of those visiting the site in question are often unavailable.
Individual single-site models
These models, unlike the ZTCMs, build on individual data (being sometimes household data) on travel to the site in question and the socio-economic variables concerning the individuals examined. Data is collected in a direct way, i.e. by means of carrying out, most often, a on-site questionnaire survey with the respondents.
),,( siii SUBSOCPfV = ,
Where Vij is the number of visits made by individual i to the site, Pi is the cost of travelling to this site incuding the travel time cost, SOCi is a vector of soci-economic characteristics including income, Sc is a vector of the characteristics of available substitutes sites.
The function above may take various forms depending on the assumed stochastic structure of the demand function. This, in turn, depends on whether the dependent variable, an individual’s trips to a site, is assumed to be distributed continuously or as a count variable. For the former case, a linear, square, semi-logarithmic, or the log-log form can be assigned to the demand function, using the Ordinary Least Squares (OLS) method to estimate the function. Making a choice of the most suitable form is a very challenging task, since the various forms of the function might result in different estimates of the consumer surplus. Economic theory is unclear as to the preferred choice here. Functional matching is then based upon statistical grounds. This data is used to derive a demand curve from which the consumer surplus may be estimated.
However, it is noteworthy that the TCM involves a specific variable that is the number of trips which is being truncated and censored. Truncated means that as only visitors to the site are recorded, there is no information on the determinants of the decision to visit the site. Another issue is that data collected in one period can not reflect preferences of people visiting this place in the other season. Censored stands for the fact that less than one visit cannot be observed so it implies that the depended variable is censored at one. This implies that OLS estimates of demand parameters will be biased (Hanley and Spash, 1998). The solution to truncation problem is to use a Maximum Likelihood (ML) estimator instead of OLS.
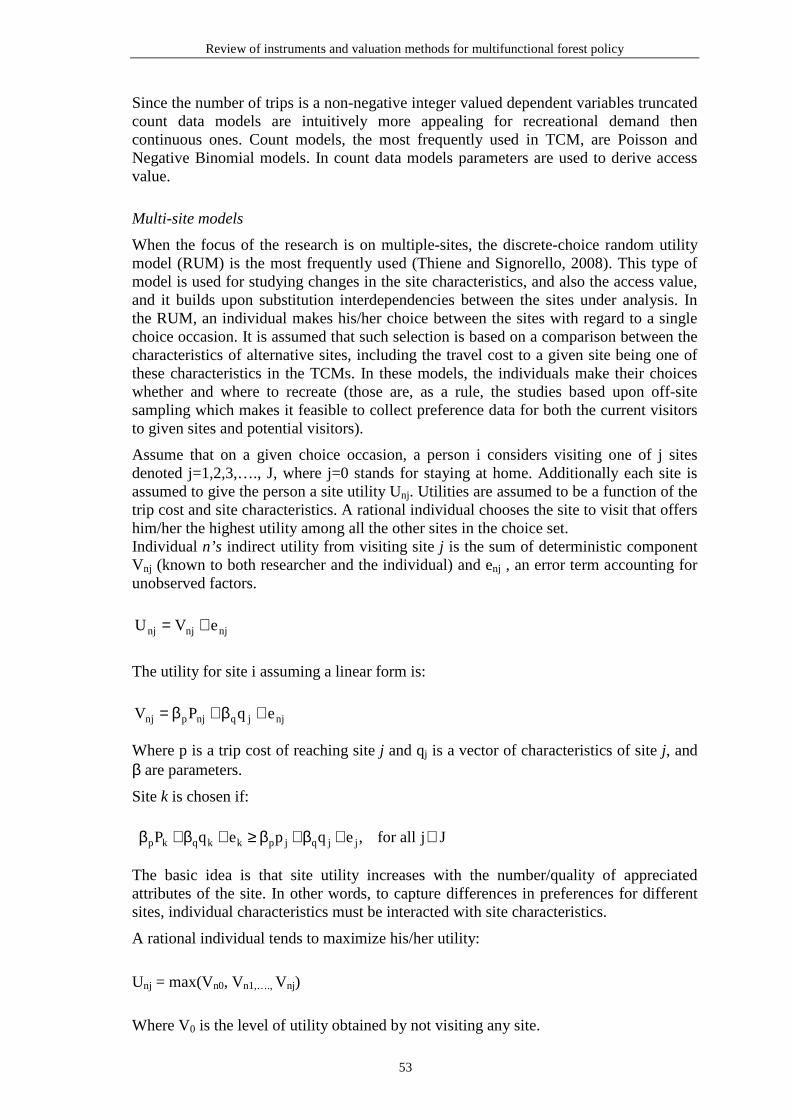
Review of instruments and valuation methods for multifunctional forest policy
53
Since the number of trips is a non-negative integer valued dependent variables truncated count data models are intuitively more appealing for recreational demand then continuous ones. Count models, the most frequently used in TCM, are Poisson and Negative Binomial models. In count data models parameters are used to derive access value.
Multi-site models
When the focus of the research is on multiple-sites, the discrete-choice random utility model (RUM) is the most frequently used (Thiene and Signorello, 2008). This type of model is used for studying changes in the site characteristics, and also the access value, and it builds upon substitution interdependencies between the sites under analysis. In the RUM, an individual makes his/her choice between the sites with regard to a single choice occasion. It is assumed that such selection is based on a comparison between the characteristics of alternative sites, including the travel cost to a given site being one of these characteristics in the TCMs. In these models, the individuals make their choices whether and where to recreate (those are, as a rule, the studies based upon off-site sampling which makes it feasible to collect preference data for both the current visitors to given sites and potential visitors).
Assume that on a given choice occasion, a person i considers visiting one of j sites denoted j=1,2,3,…., J, where j=0 stands for staying at home. Additionally each site is assumed to give the person a site utility Unj. Utilities are assumed to be a function of the trip cost and site characteristics. A rational individual chooses the site to visit that offers him/her the highest utility among all the other sites in the choice set. Individual n’s indirect utility from visiting site j is the sum of deterministic component Vnj (known to both researcher and the individual) and enj , an error term accounting for unobserved factors.
The utility for site i assuming a linear form is:
Where p is a trip cost of reaching site j and qj is a vector of characteristics of site j, and β are parameters.
Site k is chosen if:
The basic idea is that site utility increases with the number/quality of appreciated attributes of the site. In other words, to capture differences in preferences for different sites, individual characteristics must be interacted with site characteristics.
A rational individual tends to maximize his/her utility:
Unj = max(Vn0, Vn1,…., Vnj)
Where V0 is the level of utility obtained by not visiting any site.
njnjnj eVU +=
njjqnjpnj eqPV +β+β=
Jjallfor,eqpeqP jjqjpkkqkp ∈+β+β≥+β+β
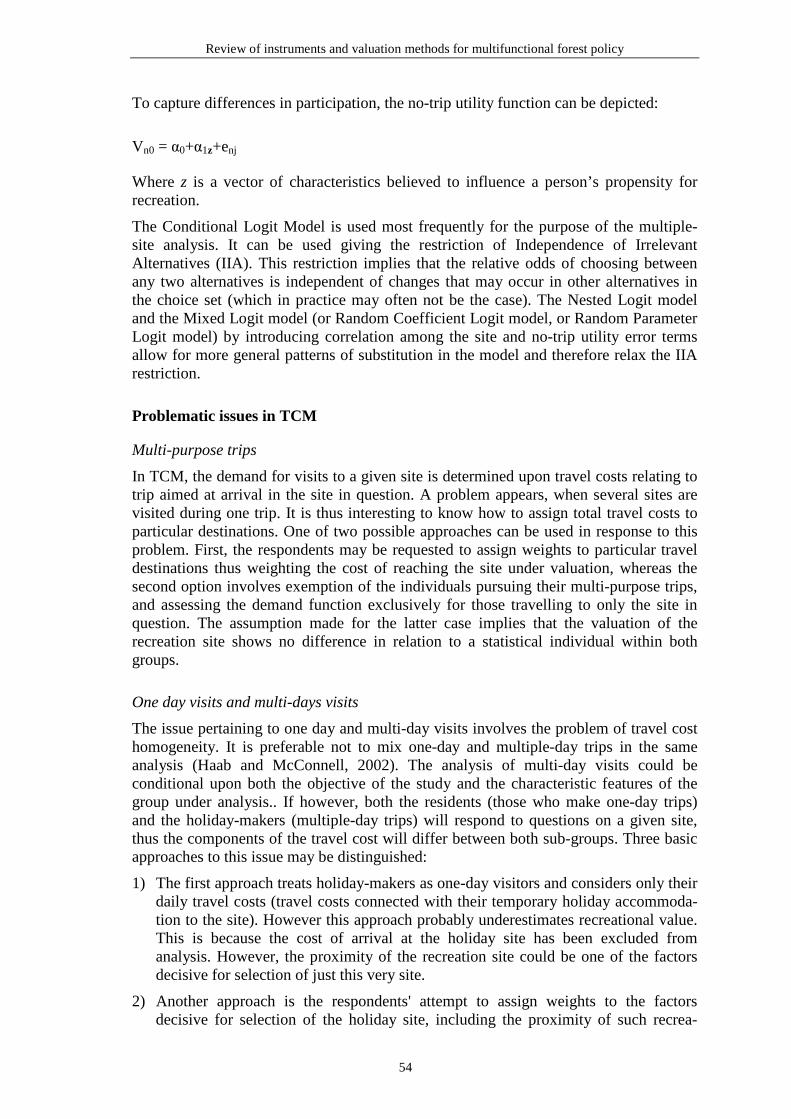
Review of instruments and valuation methods for multifunctional forest policy
54
To capture differences in participation, the no-trip utility function can be depicted:
Vn0 = α0+α1z+enj
Where z is a vector of characteristics believed to influence a person’s propensity for recreation.
The Conditional Logit Model is used most frequently for the purpose of the multiple-site analysis. It can be used giving the restriction of Independence of Irrelevant Alternatives (IIA). This restriction implies that the relative odds of choosing between any two alternatives is independent of changes that may occur in other alternatives in the choice set (which in practice may often not be the case). The Nested Logit model and the Mixed Logit model (or Random Coefficient Logit model, or Random Parameter Logit model) by introducing correlation among the site and no-trip utility error terms allow for more general patterns of substitution in the model and therefore relax the IIA restriction.
Problematic issues in TCM
Multi-purpose trips
In TCM, the demand for visits to a given site is determined upon travel costs relating to trip aimed at arrival in the site in question. A problem appears, when several sites are visited during one trip. It is thus interesting to know how to assign total travel costs to particular destinations. One of two possible approaches can be used in response to this problem. First, the respondents may be requested to assign weights to particular travel destinations thus weighting the cost of reaching the site under valuation, whereas the second option involves exemption of the individuals pursuing their multi-purpose trips, and assessing the demand function exclusively for those travelling to only the site in question. The assumption made for the latter case implies that the valuation of the recreation site shows no difference in relation to a statistical individual within both groups.
One day visits and multi-days visits
The issue pertaining to one day and multi-day visits involves the problem of travel cost homogeneity. It is preferable not to mix one-day and multiple-day trips in the same analysis (Haab and McConnell, 2002). The analysis of multi-day visits could be conditional upon both the objective of the study and the characteristic features of the group under analysis.. If however, both the residents (those who make one-day trips) and the holiday-makers (multiple-day trips) will respond to questions on a given site, thus the components of the travel cost will differ between both sub-groups. Three basic approaches to this issue may be distinguished:
1) The first approach treats holiday-makers as one-day visitors and considers only their daily travel costs (travel costs connected with their temporary holiday accommoda-tion to the site). However this approach probably underestimates recreational value. This is because the cost of arrival at the holiday site has been excluded from analysis. However, the proximity of the recreation site could be one of the factors decisive for selection of just this very site.
2) Another approach is the respondents' attempt to assign weights to the factors decisive for selection of the holiday site, including the proximity of such recrea-

Review of instruments and valuation methods for multifunctional forest policy
55
tional areas as e.g. forests or lakes. One could however imagine how difficult the task is to the respondents.
3) The final approach excludes holiday-makers and assumes during aggregation that their average valuation of the site is no less or no more than that of day-trippers (Hanley and Spash, 1998).
4.3 Contingent valuation method
What is CVM?
The contingent valuation method (CVM) can value a wide spectrum of goods and services (including their quantitative and/or qualitative changes) which are not valued in a direct way by the market. It can also value both the use value and the passive value of these goods and services. This method involves valuation on hypothetical markets; thus the declared or stated, but not revealed preferences of individuals, are used for determining the value of non-market goods and services. The essence of the CVM consists in questionnaire surveying among a sample selected on random in order to get to know the individual's opinions on the value of a given good and to infer from the sample to a larger population. Thus, statements of value of non-market goods can be acquired directly just in this way. The name – contingent valuation – refers to a condition that the valuation will be suitable, provided a scenario is implemented under which the good is to be delivered. Practical application of this method has already a more than 40-year history. Originally it was proposed by Davis (1963).
In the beginning, when the method was first used, economists were reluctant towards the CVM because of its hypothetical nature which - as they claimed - can undermine the reliability of the results obtained. In their opinion, on the one hand, a part of the respondent group, using the hypothetical nature of the market presented to them, could be prone to light-hearted overestimation of their preferences, since they will not actually have to pay. However, on the other hand, the nature of a significant portion of non-market goods is characteristic of so called public commodities thus suggesting that a part of the respondents could tend towards "free riding" and will never reveal their preferences while awaiting that someone else will lead to delivery of the good in question, and they could be in no way excluded from consumption thereof.
A breakthrough in the attitudes towards CVM came as late as in 1993, once a report was published by a special US Governmental Commission appointed to prepare an opinion on the assessment method for the losses in Alaskan ecosystem that resulted from the ecological disaster caused by the Exxon Valdez tanker oil spill. In this case, concerns raised by CVM critics over the reliability of this approach led the National Oceanic and Atmospheric Administration (NOAA) to convene a panel of eminent experts co-chaired by Nobel Prize winners Kenneth Arrow and Rober Solow to examine the issue (Carson, 2000). Upon a number of discussions, they produced a report, which concluded that “CV studies can produce estimates reliable enough to be a starting point for judical or administrative determination of natural resource damage – including lost passive-use value10..” (Arrow et al., 1993). In order to obtain reliable valuation results by applica-tion of the CVM, the panel also recommended some principles which have to be met
10 ”Passive-use value” is another name for ”non-use value”.
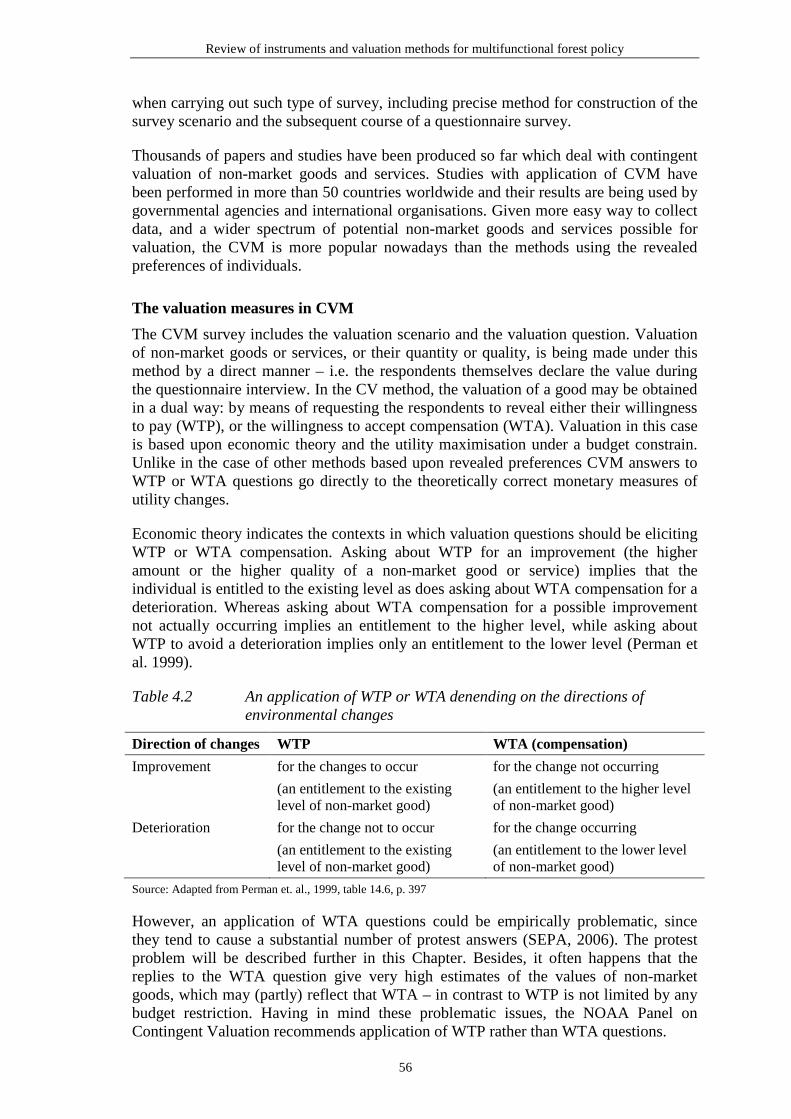
Review of instruments and valuation methods for multifunctional forest policy
56
when carrying out such type of survey, including precise method for construction of the survey scenario and the subsequent course of a questionnaire survey.
Thousands of papers and studies have been produced so far which deal with contingent valuation of non-market goods and services. Studies with application of CVM have been performed in more than 50 countries worldwide and their results are being used by governmental agencies and international organisations. Given more easy way to collect data, and a wider spectrum of potential non-market goods and services possible for valuation, the CVM is more popular nowadays than the methods using the revealed preferences of individuals.
The valuation measures in CVM
The CVM survey includes the valuation scenario and the valuation question. Valuation of non-market goods or services, or their quantity or quality, is being made under this method by a direct manner – i.e. the respondents themselves declare the value during the questionnaire interview. In the CV method, the valuation of a good may be obtained in a dual way: by means of requesting the respondents to reveal either their willingness to pay (WTP), or the willingness to accept compensation (WTA). Valuation in this case is based upon economic theory and the utility maximisation under a budget constrain. Unlike in the case of other methods based upon revealed preferences CVM answers to WTP or WTA questions go directly to the theoretically correct monetary measures of utility changes.
Economic theory indicates the contexts in which valuation questions should be eliciting WTP or WTA compensation. Asking about WTP for an improvement (the higher amount or the higher quality of a non-market good or service) implies that the individual is entitled to the existing level as does asking about WTA compensation for a deterioration. Whereas asking about WTA compensation for a possible improvement not actually occurring implies an entitlement to the higher level, while asking about WTP to avoid a deterioration implies only an entitlement to the lower level (Perman et al. 1999).
Table 4.2 An application of WTP or WTA denending on the directions of environmental changes
Direction of changes WTP WTA (compensation)
Improvement for the changes to occur
(an entitlement to the existing level of non-market good)
for the change not occurring
(an entitlement to the higher level of non-market good)
Deterioration for the change not to occur
(an entitlement to the existing level of non-market good)
for the change occurring
(an entitlement to the lower level of non-market good)
Source: Adapted from Perman et. al., 1999, table 14.6, p. 397
However, an application of WTA questions could be empirically problematic, since they tend to cause a substantial number of protest answers (SEPA, 2006). The protest problem will be described further in this Chapter. Besides, it often happens that the replies to the WTA question give very high estimates of the values of non-market goods, which may (partly) reflect that WTA – in contrast to WTP is not limited by any budget restriction. Having in mind these problematic issues, the NOAA Panel on Contingent Valuation recommends application of WTP rather than WTA questions.
Review of instruments and valuation methods for multifunctional forest policy
57
Valuation scenario
In general, a CVM survey (scenario and questionnaire) should include the following parts (Carson, 2000):
a) an introductory section that helps set the general context for the decision to be made
b) a detailed description of the good to be offered to the respondent
c) the institutional setting in which the good will be provided
d) the manner in which the good will be paid for
e) a method by which the survey elicits the respondent’s preferences with respect to the good
f) debriefing questions about why respondents answered certain questions the way that they did
g) a set of questions regarding respondent socio-economic characteristics
Description of the good
The survey scenario has to be clear, not too lengthy, and realistic, presenting the good to be valued, and justifying any possible cost to be incurred by the respondent in a manner which is eligible and acceptable by him/her. Where a change in the level of a good is valued, then this change has to be described not only with regard to its direction (e.g. deterioration of, or improvement in the situation), but also has to be ”measured”. In some cases, it is possible to make a quantitative description (e.g. enhancement of a recreational area, as expressed in hectares). However, the presentation of the changes as expressed solely in physical units is not sufficient, as for instance in case of change in noise level shown in decibels (dB), a respondent might be not aware of the effect which particular noise levels have on his/her health and frame of mind. In those cases the description has to be more qualitative. For example, various physiological responses could be assigned to noise arduousness depending upon its particular intensities, e.g. nervousness, sleeping problems partial loss of hearing, etc. In order to bring closer to the respondents the valuation of the effects described, also photos or other forms of graphical presentation may be used to this end besides verbal descriptions.
When describing a good, a balance has to be retained between huge number of details, the listening to which may be boring to respondent, and too scarce quantity of information they contain, and which could appear insufficient to him/her in order to take optimal decisions. The description has to include information on the occurrence and characteristic features of the substitutes for the good in question (that is, whether the good under evaluation is unique at a regional, national etc. scales, or whether its closer or farther substitutes are available, and what is the cost of these substitutes).
The issue, whether the good provision scenario, and the good as such, and/or the changes therein are presented to the individuals questioned in an eligible and acceptable manner, could be checked by asking the respondents directly during the survey. Comments on the degree of the respondents' involvement in and their understanding of the questionnaire could have been expressed also by the persons who have carried out the interviews with respondents. Additionally, in order to verify whether the good was in a clear manner presented to the respondents the questions could be put in the questionnaire that provide for so called “scope test”. Where the respondents value both
Review of instruments and valuation methods for multifunctional forest policy
58
the minor and considerably bigger quantities of the good in question (e.g. enlargement of the number of specimens by several, in the first indent, and by several dozen, in the second indent), then it means that the survey has been constructed wrongly and the valuation itself has been insensitive to scope.
Description of the policy, project or program change of interest.
The survey scenario has to present in apparent manner any potential method for delivery of the good on the market. The CVM scenario could then include description of realistic policy, project or programme, including description of its necessary implementation conditions. One of such key conditions is that implementation of the project will be launched when the total benefits it generates exceed the costs incurred to implement it. An element being also essential is a precise description of the qualitative/quantitative level featuring given non-market good at the moment, i.e. the starting level from which potential changes are to be introduced. Another important information is what happens when the project has not been undertaken, i.e. information on the “zero” (status quo) alternative. It is noteworthy to emphasise here that this “zero” alternative does not mean that the level of a non-market good in question will in the future remain unchanged, since in case of certain environmental goods the desisting of a protective programmes could relate to reduction in the quantity thereof.
Payment and a provision of the good
A choice of the method by which the non-market valuation could be performed under real conditions, i.e. definition of a payment vehicle which fits the type of survey scenario assumed, is mostly important when constructing the scenario. Examples of the payment vehicle are the following:
• Increase in existing or introduction of new charges (e.g. water fees);
• Increase in existing or introduction of new taxes (e.g. an ear-marked environmental tax);
• Increase in prices of market goods that results from growing quality/quantity of a non-market good linked to given market good (e.g. being one of characteristics of the market good);
• Increase in prices of all market goods;
• Payments for funds.
For a payment vehicle, it is essential that the payment frequency (one-off, monthly, annual payments, etc.) and the duration of the period over which the payments have to be made (e.g. for the subsequent 10 years, or by the end of life) be determined. Also, the date must be fixed on which levying the payment has to be started.
In theory, the payment vehicle should be realistic, reliable, neutral and enforceable. However in practice, it is very difficult to find the payment vehicles meeting the neutrality condition. For example - mechanisms such as income taxes or water rates are clearly- non-neutral and it is relatively common to find respondents refusing to answer the valuation question on the grounds that they object in principle to paying higher taxes or water rates, in spite of the fact that the proposed change is welfare enhancing (Bateman, 2002).
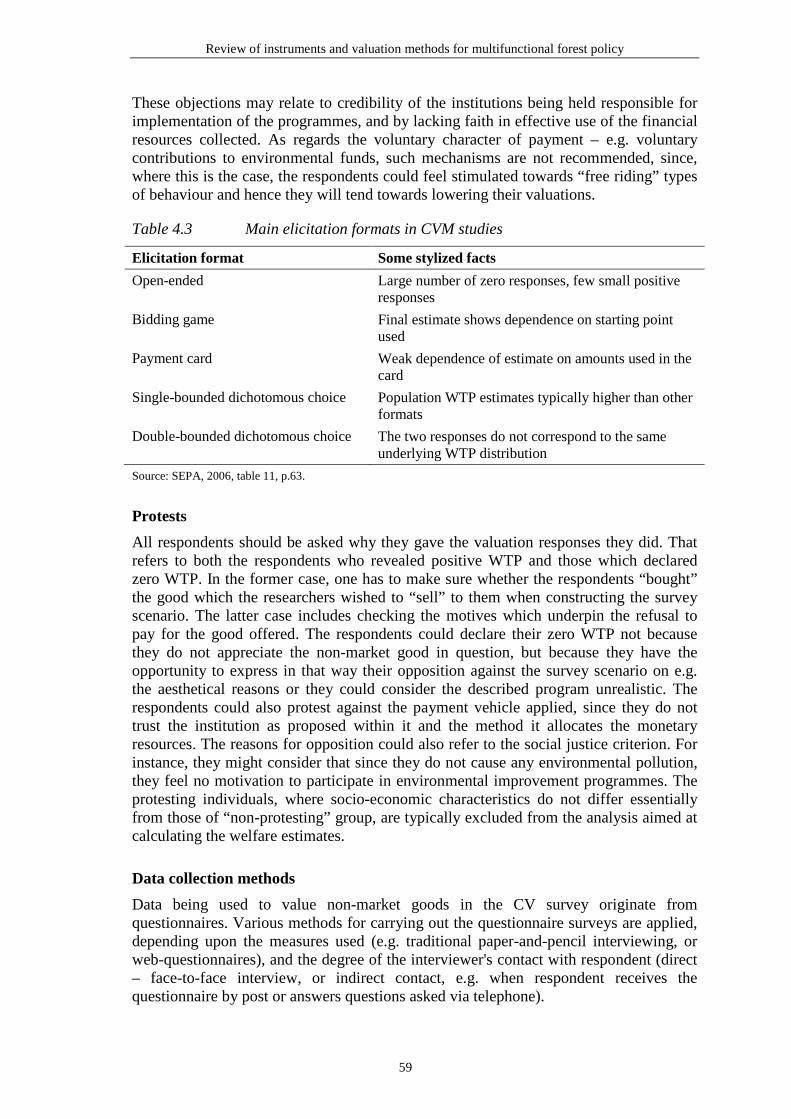
Review of instruments and valuation methods for multifunctional forest policy
59
These objections may relate to credibility of the institutions being held responsible for implementation of the programmes, and by lacking faith in effective use of the financial resources collected. As regards the voluntary character of payment – e.g. voluntary contributions to environmental funds, such mechanisms are not recommended, since, where this is the case, the respondents could feel stimulated towards “free riding” types of behaviour and hence they will tend towards lowering their valuations.
Table 4.3 Main elicitation formats in CVM studies
Elicitation format Some stylized facts
Open-ended Large number of zero responses, few small positive responses
Bidding game Final estimate shows dependence on starting point used
Payment card Weak dependence of estimate on amounts used in the card
Single-bounded dichotomous choice Population WTP estimates typically higher than other formats
Double-bounded dichotomous choice The two responses do not correspond to the same underlying WTP distribution
Source: SEPA, 2006, table 11, p.63.
Protests
All respondents should be asked why they gave the valuation responses they did. That refers to both the respondents who revealed positive WTP and those which declared zero WTP. In the former case, one has to make sure whether the respondents “bought” the good which the researchers wished to “sell” to them when constructing the survey scenario. The latter case includes checking the motives which underpin the refusal to pay for the good offered. The respondents could declare their zero WTP not because they do not appreciate the non-market good in question, but because they have the opportunity to express in that way their opposition against the survey scenario on e.g. the aesthetical reasons or they could consider the described program unrealistic. The respondents could also protest against the payment vehicle applied, since they do not trust the institution as proposed within it and the method it allocates the monetary resources. The reasons for opposition could also refer to the social justice criterion. For instance, they might consider that since they do not cause any environmental pollution, they feel no motivation to participate in environmental improvement programmes. The protesting individuals, where socio-economic characteristics do not differ essentially from those of “non-protesting” group, are typically excluded from the analysis aimed at calculating the welfare estimates.
Data collection methods
Data being used to value non-market goods in the CV survey originate from questionnaires. Various methods for carrying out the questionnaire surveys are applied, depending upon the measures used (e.g. traditional paper-and-pencil interviewing, or web-questionnaires), and the degree of the interviewer's contact with respondent (direct – face-to-face interview, or indirect contact, e.g. when respondent receives the questionnaire by post or answers questions asked via telephone).
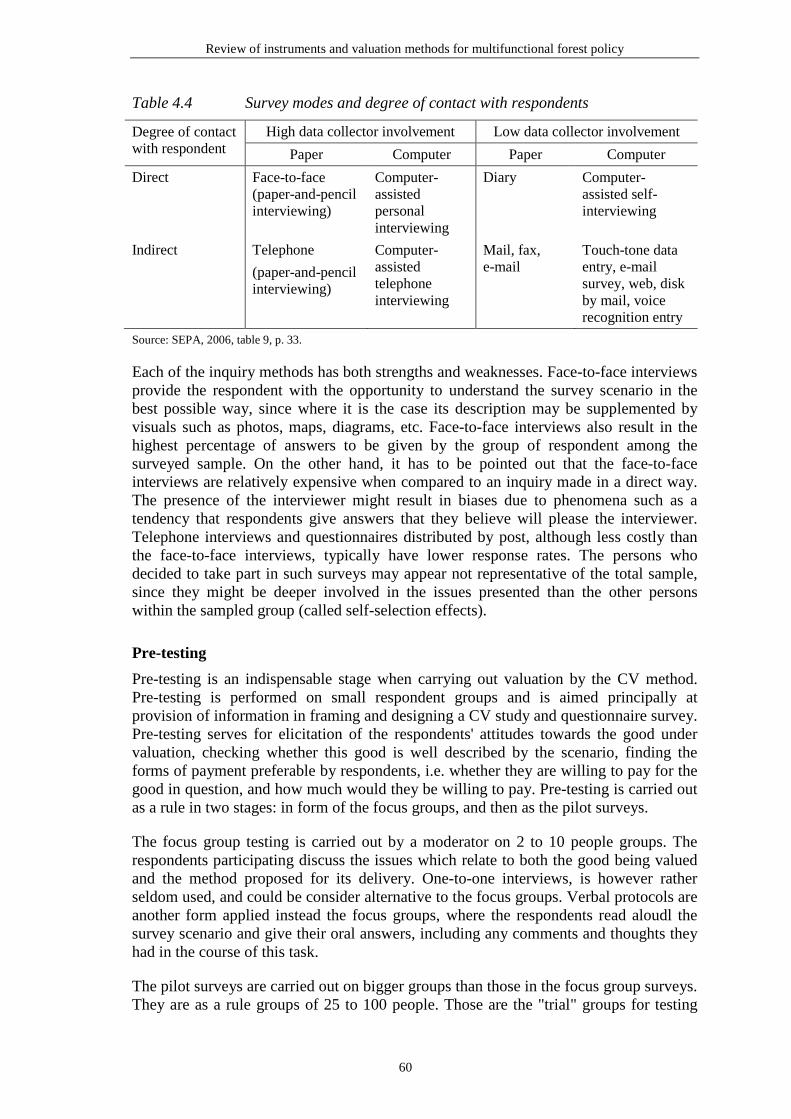
Review of instruments and valuation methods for multifunctional forest policy
60
Table 4.4 Survey modes and degree of contact with respondents
Degree of contact with respondent
High data collector involvement Low data collector involvement
Paper Computer Paper Computer
Direct Face-to-face (paper-and-pencil interviewing)
Computer-assisted personal interviewing
Diary Computer-assisted self-interviewing
Indirect Telephone
(paper-and-pencil interviewing)
Computer-assisted telephone interviewing
Mail, fax, e-mail
Touch-tone data entry, e-mail survey, web, disk by mail, voice recognition entry
Source: SEPA, 2006, table 9, p. 33.
Each of the inquiry methods has both strengths and weaknesses. Face-to-face interviews provide the respondent with the opportunity to understand the survey scenario in the best possible way, since where it is the case its description may be supplemented by visuals such as photos, maps, diagrams, etc. Face-to-face interviews also result in the highest percentage of answers to be given by the group of respondent among the surveyed sample. On the other hand, it has to be pointed out that the face-to-face interviews are relatively expensive when compared to an inquiry made in a direct way. The presence of the interviewer might result in biases due to phenomena such as a tendency that respondents give answers that they believe will please the interviewer. Telephone interviews and questionnaires distributed by post, although less costly than the face-to-face interviews, typically have lower response rates. The persons who decided to take part in such surveys may appear not representative of the total sample, since they might be deeper involved in the issues presented than the other persons within the sampled group (called self-selection effects).
Pre-testing
Pre-testing is an indispensable stage when carrying out valuation by the CV method. Pre-testing is performed on small respondent groups and is aimed principally at provision of information in framing and designing a CV study and questionnaire survey. Pre-testing serves for elicitation of the respondents' attitudes towards the good under valuation, checking whether this good is well described by the scenario, finding the forms of payment preferable by respondents, i.e. whether they are willing to pay for the good in question, and how much would they be willing to pay. Pre-testing is carried out as a rule in two stages: in form of the focus groups, and then as the pilot surveys.
The focus group testing is carried out by a moderator on 2 to 10 people groups. The respondents participating discuss the issues which relate to both the good being valued and the method proposed for its delivery. One-to-one interviews, is however rather seldom used, and could be consider alternative to the focus groups. Verbal protocols are another form applied instead the focus groups, where the respondents read aloudl the survey scenario and give their oral answers, including any comments and thoughts they had in the course of this task.
The pilot surveys are carried out on bigger groups than those in the focus group surveys. They are as a rule groups of 25 to 100 people. Those are the "trial" groups for testing
Review of instruments and valuation methods for multifunctional forest policy
61
the questionnaire. The pilot surveys serve the purpose of fine-tuning the questionnaire and sometimes they are used to train the interviewers.
WTP elicitation formats
In the CV surveys, asking the questions about the respondents' WTP (or WTA) for a given good may be done in several ways. Selection of the question format may be decisive for the results to be obtained. However, none of these ways could be recommended as the best one at the present state of the art. They all have their advantages and disadvantages.
In the beginning, so called open question format was used when querying the WTP in CVM surveys, i.e. respondents were simply asked their maximum WTP as a single number response. At present, a tendency to desist of such type of question formats has been noted. All other elicitation formats involve monetary amounts that the respondent is asked to consider. Their advantage is that those are closer to the market choices which the respondents encounter everyday. Some of these formats provide for respondent's choice of his/her WTP from various amounts proposed (payment card). In other cases, the respondent has only one amount to consider whether he/she will be, or will not be, willing to pay (closed-ended questions, ”yes”/”no” answers). The amount (the “bid”) is varied among different respondents, which means that respondents’ “yes”/”no” answers together give information on WTP distribution (SEPA, 2006).
Estimating welfare measure in CV
Both parametric and non-parametric methods may be used to estimate the value of a good in CV surveys. The latter ones involve mainly the calculation of the mean or median WTP (or WTA) value. The mean value is the more adequate measure in view of economic theory, as a cardinal measure of utility the individuals derive from the non-market good. It traditionally applies for cost-benefit analysis. The median, on the other hand (that represents the price for which the probability of the bid rejections equals 0.5) is not so sensitive as the mean to the very high rates which could be suggested by a small respondent group. Additionally, while based on the closed question survey and the acceptance or rejection of the bid proposed, the median corresponds to the amount of money which a one-person-one-vote system would allocate to the policy or public good. Simplicity is an evident advantage of the non-parametric approach. Mean and median can be calculated from raw data without assuming any distribution for the unobserved component of preferences. The calculation can be made without resort to computers (Haab and McConnell, 2002). For example, the mean from a CV survey using the open ended format is a non-parametric estimate, as it is the sum of max WTP across the sample divided by the number of respondents.
However, there are situations where it is desirable to estimate the relations between WTP and other variables, e.g. the socio-economic characteristics of respondents, or the characteristics of a good, the value of which has to be assessed. For example, a knowledge of such relations is necessary when we want to extrapolate our results to the general public. The non-parametric approach allows for surveying such interdependencies to only limited scope. The role of parametric models better fits such cases. This approach involves the estimation of a so-called valuation function as a way of relating the respondents’ answer to the valuation question to various explanatory variables. The shape of valuation function depends on, inter alia, the framing of the valuation question (SEPA, 2006).
Review of instruments and valuation methods for multifunctional forest policy
62
Problem areas associated with CVM
The CV surveys are sensitive to biases which result from a conditional survey scenario. The problem emerges when these biases are of systematic nature and lead to systematic overestimation or underestimation of the real value of a non-market good. Several major types of systematic biases could be distinguished (Hanley and Spash, 1998):
1) Strategic bias – occurs primarily in two situations. The first appears when the respondents underestimate the value of non-market good while being aware that it is a public good and nobody would be excluded from its consumption once it is provided. On the other hand, where the respondents are convinced about hypothetical nature of the questionnaire, they would overestimate the value systematically in their answers. The likelihood of the occurrence of strategic bias may be reduced by means of application of the following procedure:
• remove all outliers (those who declare non-proportionally high WTP when compared to other participants to the survey or as percentage of income)
• stress that payment by others is guaranteed
• conceal other’s bids
• make the nonmarket good change dependent on the bid (that is, prevent the respondents from taking the change automatically forthcoming irrespective of their bids) (Mitchell and Carson, 1989).
2) Design bias – could relate to choice of payment vehicle. As mentioned above, the respondents could declare a lower WTP reflecting their reluctance to the payment vehicle proposed. Information on whether the payment method is neutral to the respondents may be obtained from pre-testing. The starting point bias is another one in this group. In bidding games, the starting point given to respondents can influence the final bid given. Application of other elicitation formats brings about a solution. The misspecification bias is the last one in this group. It occurs when the respondent does not understand the scenario as researcher intends it to be understood. And again, pre-testing is helpful to avoid this bias.
3) Mental account bias – appears, e.g. when the respondents declare a given amount of money to an environmental good that at the same time they are in position to spend for the whole protection of the environment, and hence, they do not consider any other options of expenses in their decisions, because such options have not been considered also in the research scenario. Where it is the case, a two-stage valuation could bring about solution, i.e. wider-context question is asked first, and then another one about the good as itself follows.
4.4 Choice experiments
What is CM/CE?
Application of the choice experiment (CE) method, (named also the contingent choice method, stated choice method, or attribute-based method) provides for eliciting the consumer preferences by means of their participation in a survey containing hypo-thetical choice sets. CE allows to model consumers’ preferences, provides an insight into which attributes consumers see the most important. Based on these, a researcher is able to model demand and predict welfare or market share changes resulting from implementing a policy. In particular, the choice experiment method provides for
Review of instruments and valuation methods for multifunctional forest policy
63
modelling of the utility function, hence, the formal description of interdependencies between the features of the alternatives available to the consumer and the socio-demographic variables which are specific for him/her, on the one hand, and the choices made by the consumer and the utility (satisfaction) which the choices (or choice set) could generate, on the other hand.
A choice set always appears when the consumer is confronted with more than one alternative. Those could be both the simple, everyday choices, and the serious decisions which involve multi-year consequences. The choice experiment method consists in presenting to the consumers the respectively prepared, hypothetical choices. The choices they make provide and insight into their preferences. The choice experiment method consists in that each of the alternatives may be precisely and fully described by means of a number of attributes. These attributes may be any characteristic of the goods or situations which the consumers have chosen. Hence, particular alternatives could differentiate each other by levels of the attributes. Irrespective of whether the alternatives concern the choice of goods, services, or any other situations (hereafter "the goods") which could impact the consumer, his/her decisions reveal the importance which particular attributes of the goods feature by to satisfy (i.e. provide usefulness to) the consumer. Once having in place a respectively abundant collection of such information, the usefulness function of typical consumer may be outlined, the significance of particular attributes may be specified, the combinations of the attribute levels being mostly desirable to consumer may be estimated, and also the choices which the consumer could make, may be predicted.
In practice, the choice experiment method appears extremely simple and flexible thanks to hypothetical nature of the choices being presented to the consumers. Therefore, it has been continuously more commonly applied in economic, marketing, transport, environmental, health protection, and other studies. Where a researcher is interested in choices being made by consumers (or any other entities) the choice experiment method can be applied to identify and analyse the factors which have influenced the choices. The most frequent applications of this method include the simulation of the effects of changes in the levels of certain attributes, the calculation of the final substitution rates between the attributes, the estimation of their values when one of the attributes (e.g. cost) is measured by monetary units, and the modelling of the usefulness function.
The research carried out by the choice experiment method are as a rule being performed in form of questionnaire survey where those questioned are asked to make certain choices. Therefore, the questioning must meet a number of requirements in order to secure that the conclusions to be drawn up thereupon are representative and significant. Moreover, given the hypothetic nature of the choice sets being presented to the respondents, the questionnaires must be so designed that the information provided by the respondents minimise any difference between the answers obtained to hypothetic questions, and the behaviour the consumers would have assumed under real choice sets. This requires that the survey be prepared following a specific methodology – application of the technique which cause that the respondents' answers are significant. The outlay of the choice sets, including the choice alternative's attributes and their levels, as presented to the respondents is essential for the final survey result. Often, several or a dozen of the alternatives have to be chosen from the infinity of potential ones that the respondent could be in position to choose only those adequate which will include the most possible information on his/her preferences. Finally, the data collected by the choice experiment method is subject to statistical analysis. A lot of statistical tools are available which provide for obtaining information interesting to researcher.
Review of instruments and valuation methods for multifunctional forest policy
64
Selection of a proper model for analysis of data acquired under survey is also of essential importance for general methodological correctness of the survey.
CE in practice
The survey by the choice experiment method may cover any group of consumers. The features of the population in question are usually the focus of researcher, since definition of the population has to be the primary step when designing a survey. Where the features of a specific good are considered, there for instance, its users or the individuals bearing the cost of its acquisition could be the populations (while these groups are not necessarily the same ones).
The population subject to survey is, as a rule, so numerous that surveying all its members is unfeasible. That causes the need to surveying a respective sample of this population the will represent is as the whole. From the statistical point of view, this involves the need to provide for, firstly, avoiding any burden which could affect the results (i.e. the survey results to be generated on a representative sample have to be free of any burden in relation to such results which would be obtained in case when the whole population undergoes surveying); and secondly, the sample has to be so selected that the variance be minimised (that will provide for the results sufficiently precise enough in relation to the real features which characterise the population). Apart form the sampling error, i.e. that eventually resulting from the fact that just the sample, but not the whole population is surveyed, yet the non-response error could be generated on the grounds that certain respondents selected to questioning have not participated (e.g. due to their refusal or unavailability).
Two basic - non-probabilistic and probabilistic - sampling methods are practiced. Those in the former group are easier and cheaper, and they are particularly useful for the preliminary survey or that aimed at elicitation of certain general interdependencies. The probabilistic sampling methods are usually applied in cases where the higher accuracy of the results is required. Its benefits include the opportunity to use statistics for the purpose of setting out the features of the estimators obtained upon the sample, the design of the credibility intervals, as well as the correction of the non-response error and the sample-selection bias.
The non-probabilistic sampling methods include the convenience samples which are the least accurate, but the most easily available. Such a sample is taken on a random basis and hence without any control over the process of selecting the participants to questioning. A questionnaire survey carried by a tutor among students may be exemplification of such type of sampling, where he expects that the conclusions to be drawn be characteristic for all students of the university, or at the country scale. The judgement sample, named also the purposive sample, could provide for slightly higher accuracy where the respondents are so selected that they would represent the major groups of the population covered by the survey. Finally, by the quota sampling method, the participants to the survey are so controlled by the researchers that the sample includes definite proportions of particular types of respondents, by their characteristic features (e.g. sex, age, income, provenience, etc.).
Among the probabilistic methods, the random sampling method is the simplest one by which the identical likelihood to participate in given survey is attributed to every member of the population. Under another method, i.e. stratified sampling, the target population is divided into non-overlapping subgroups, each of them being called a
Review of instruments and valuation methods for multifunctional forest policy
65
stratum, and respectively - two or more subgroups are named strata. (With known size of each stratum, the strata may differ by specific features.). Then, a random sample is taken from each stratum. For the proportionate stratification, the sample size of each stratum is proportionate to the population size of this stratum. This means that each stratum has the same sampling fraction (while, the sampling fraction is the proportion of a population to be included in a sample; and the sampling fraction is equal to the sample size divided by the total population size). For the disproportionate stratification, the sample size of each stratum does not have to be proportionate to the population size of the stratum. This means that two or more strata will have different sampling fractions.
The results obtained on each of the samples are then respectively weighted in order to provide for drawing the conclusions concerning the whole population. Finally, among the probabilistic methods, the cluster sampling is to be mentioned here that consists in preliminary stratification of the population, and then one stratum is selected on a random basis for surveying all the representatives of this stratum by use of a questionnaire.
Several ways are possible when conducting the questionnaire survey by the choice experiment method. Those mostly often applied ones include distribution of questionnaires by post, telephone interviews, face-to-face interviews, group interviews and publishing the questionnaires on the Internet. Each of these methods has some advantages and disadvantages. Application of either method influences the size of the measurement error (due to receiving the various percentage of the sample-selection bias, the researcher's influence on the results etc.), the cost of questioning, the opportunity to use additional materials and the quantity of data collected. The face-to-face interviews are considered the most reliable (and suggested by the NOAA Panel; Arrow et al. 1993), but also the most costly ones, and are recommended for carrying out at the respondent's place or in the research centres. Meanwhile, the Internet-published questionnaires are considered the most difficult with regard to the feasibility of controlling the sample, but those are mostly cost-effective, instead. Selection of each of the questionnaire implementation method inseparably involves the balance to be retained between its particular features, on one hand, and the need to its adjustment to the research objective, on the other hand.
The choice of the method for sample selection and implementation of the questionnaires influences the minimum sample size, the choice of which has always been a compromise between the survey cost and the accuracy thereof. The final sample size depends upon the quantity and the size of the population strata, for which the estimation of the results is to be known, the required estimation accuracy (the maximum tolerance credibility interval), and the differentiation of the population under survey with regard to the features being surveyed. The statistical methods are available which depending upon those parameters provide for setting out the minimum sample size as necessary to achieve the specific research objectives. The final sample size applied in a survey has to take due account of the answers which (e.g. when incomplete) do not fit the purpose of the further analysis, or are non-responding, or are so called opponents' answers.
In the valuation research, the most frequently encountered sample sizes for the contingent valuation method reach 250-500 for open format questions and 500-1,000 for closed format questions. When surveying by the choice experiment method, the sample size could be lesser, since the more information can be elicited from single respondent and he/she may be yet invited to take part in a more than one choice set.
Review of instruments and valuation methods for multifunctional forest policy
66
The way by which the questionnaires are prepared is of essential importance for the quality of data collected. Well designed questionnaire should present in a manner clear, concise and eligible to respondent all the relevant aspects related to the choice. As the surveys show, the sole manner by which the questions are formulated in the questionnaire influences the answers provided by the respondents. Therefore, both the phrasing of the question and the vocabulary used in the questionnaires has to be applied intentionally to secure the maximum objective response data. Also, such aspects are essential as formulation of questions in an open or closed form, avoiding double questions, optimum form of questions on the respondent's activity in the past, etc. The issues of the optimum formulation of questions in questionnaires are broadly addressed in literature (Sudman and Bradburn 1982; Sheatsley 1985; Converse and Presser 1986).
Finally, the outlay of the questionnaire and sequencing of questions is important. The most intimate questions are usually placed at the end of the sequence with the aim to avoid the risk that the interview could be desisted of when filling in the questionnaire. However, such initial questions involving the basic information which could make the respondent further interested and introduced into the survey issues are place at the beginning. Placing the choice set which is the essence and culmination of the questionnaire must be preceded by delivery of all information required to this end, so that the choices being made by the respondent are full of awareness and significance an that the respondents could understand the choice set in a manner stemming form the researcher's intention. In order to keep the respondent concentrated and interested, the longer portions of the information presented have to be diversified with extra- questions (or even quizzes) and presentation of supplementary materials, such as photos, diagrams, etc.
Preparation of the final version of a questionnaire that will meet the goal assumed by the researcher is a time-consuming process. This is because the qualitative analysis has to be preformed with regard to testing various solutions on particular stages of its designing. The analysis is usually being carried out in form of one-on-one surveys and/or verbal protocols with respondents. Finally, such multi-stage process of refining the questionnaires will provide for obtaining the results as required. Carrying out pilot questionnaire survey, hence proven final version of the questionnaires on a sample sized lesser than the target sample, is also a practice often applied, for instance to verify the correctness of the thresholds assumed for the closed questions. The questioning phase, as itself, is only the final stage of this process.
A broader discussion of the issues pertaining to designing the questionnaires and their application in carrying out research by the choice experiment method may be found at Bateman et al. (2004), Champ (2004), Champ and Welsh (2007), and Dillman et al. (2008).
Incentive compatibility and survey design for the choice experiment method
The research mechanism is considered correct in terms of motivation if its principles provide that participants are stimulated by the respective incentives which cause them to reveal their real preferences, being yet complete. Designing a motivation-correct questionnaire or laboratory testing aimed at elicitation the respondents' willingness to pay for certain goods is theoretically possible, however designing it for the choices including two or more alternatives brings about a lot of difficulties, or even becomes unfeasible. While some studies show that under certain circumstances the absence of the motivation correctness that is caused by, inter alia, the hypothetical nature of the
Review of instruments and valuation methods for multifunctional forest policy
67
questions asked, must not be any relevant problem, it poses however an essential objection against carrying out surveys by the choice experiment method. The basic implications are discussed below which relate to the optimum design of the research scenarios for the choice experiment method, as regards the provision of the motivation correctness.
When carrying out a survey by the choice experiment method, the hypothetical bias and the free riding effect are the factors primarily influencing the authenticity of the respondents' answers. The former effect causes that, given the hypothetical nature of the questions asked; the respondent could give other answers, than he/she would when the choices made by him/her would have caused the real effects. The consequence of the latter is that the respondent while believing that the goods will be in any case delivered is motivated rather to reducing in the answers his/her willingness to pay for these goods. In practice, it can be hardly resolved which of these results has the stronger impact. Hopefully, there are the methods which provide for minimising the impacts of these effects on the answers being given by the respondents (Carson and Groves 2007).
Fixing the payment method is the basic way to minimise the free riding effect, where, in case when a project is to be implemented or the goods delivered which all the users or all members of a given group will be obliged to pay for, irrespective of the answers they have given. An increase in a commonly levied tax for financing the provision of certain public good is the exemplification of such a form of payment. Unfortunately, some common forms of payment involve certain level of reluctance on part of those participants which could consider them unfair or reveal other negative emotions towards them, as reflected in the answers they have given.
Designing the survey that enables for elimination of the burden imposed by the hypothetical nature of the choices being presented to consumers is yet a more complex challenge. It appears that in the most cases the "hypothesised" burden cannot be entirely eliminated. Nevertheless, as the studies show, its impact in case of the respectively designed surveys could be made insignificant. Two basic methods to minimise the "hypothesised" burden include a priori calibration of the research instrument, and ex post statistical calibration of the results obtained.
The first of these methods consists primarily in suitable choice of the phrases and instructions being used in surveying. As the studies show, depending on the survey entourage, the results could more or less deviate from the decisions being, in reality, made by the respondents under the same circumstances. Unfortunately, it is very difficult to asses a priori what type of entourage will cause that the impact of the "hypothesised" burden be minimised. Therefore, the surveys performed by the choice experiment method are as a rule conducted in course of a time-consuming process of testing and refining the research instrument. The choice of suitable phrasing is made primarily upon the focus research, verbal protocols, pilot surveys and laboratory tests all enable for making comparisons of the answers to hypothetical questions against those received in result of the motivation-correct mechanisms feasible to apply only at the laboratory scale (such as e.g. Vickrey auction, Groves-Clarke mechanism, BDM procedure, etc.). Interesting effects stem, amongst others, from making the respondents informed on the problems which occur in case of the majority of them as regards overestimating their willingness to pay (cheap talk), reiterated reminding them about their budgetary limitations, and enabling them to respond while being aware of the credibility interval provided, which they attach to an answer.
Review of instruments and valuation methods for multifunctional forest policy
68
Statistical calibration is another method to correct the "hypothesised" burden. It assumes that the results obtained from the respondents include true information, being however affected by such burden. The issue in question consists then in evaluation of the burden function which would provide for such a correction of the answers received that they could better reflect the true respondents' preferences. Again, this method requires additional testing, in particular, the application of laboratory tests in order to compare the answers received with those obtained under fully correct motivation mechanisms. The credibility interval, as determined by the respondents that relates to the answer they provide, is an essential predictor of the degree of the "hypothesised" burden.
One necessary precondition underpinning the motivation correctness of eliciting the preferences is that the participants thereto be convinced that the final results of these preferences are significant for their usefulness. For example, if a participant to a questionnaire survey believes that his/her behaviour influences implementation of a specific alternative, while implementation of this alternative is of importance for his/her wellbeing, such participant will be adequately motivated to give true answer. So called epsilon-truthfulness is a slightly more powerful and the more frequently encountered assumption under which, if a respondent sheers towards indifference towards both laying and truthfulness, he/she will choose the latter (i.e. true) option. However, pertinence of the grounds for this assumption still remains an open research question (Harrison 2007).
Well designed survey has to make the respondent convinced that: (1) the survey objective is of importance from the social point of view and that the effects of this survey influence wellbeing of a population (i.e. the effects being either decisive for implementation of a specific project, or at least, will provide a supportive output); (2) the respondent's answers are significant for the output of the survey performed (the respondent have to consider positive the likelihood of him/her being a decisive voter); (3) the vote of a respondent when drawn by lot is essential for representativeness of the population segment he/she represents (while being essential especially in a questionnaire survey when encouraging the respondent to participate to questioning, and when aiming at enhancement of the response rate); (4) the respondent's answers be anonymous.
Also, the quantity, the quality of and the method for delivering information about the scenario, the choice set, the attributes and their levels are of special importance for the results to be produced by the survey carried out by the choice experiment method, since the respondents will give answers based primarily on the aforementioned information types. If the answers to be provided are to be significant, one has to make sure that the bulk of indispensable information has been respectively accepted, understood and processed by the respondent. However, too huge information quantity or to lengthily survey duration may be boring, and this, in turn, could have led to raising objections against the reliability of the results produced. Hence, the optimum quantity of information and its delivery method have been inseparably linked to the preliminary survey and the iterated refining of the research instrument (Mathews et al. 2007).
The opportunity to address a wide spectrum of respondents is an essential feature of surveying by the choice experiment method. Hence, one has to be aware that in many cases also those will be among the respondents who have neither university education nor technical knowledge. Therefore, the language applied in designing the question-naires, the manner of phrasing information included therein and the assumptions

Review of instruments and valuation methods for multifunctional forest policy
69
concerning the preliminary information have to be tailored to the context of the research.
The adequacy of information being delivered to respondents is an essential issue. It must be not only eligible by them (i.e. expressed in a simple way), but also conforming to the current state-of-art and reliable, since on the basis of just this information the respondents will make their choices first and foremost. If the information included in the survey distorts the truth, the survey results will not adhere to the reality.
The method for, the quantity and quality of the information provided play hence an essential role in surveys carried out by the choice experiment method. Unfortunately, one can hardly decide a priori on the way to matching the information. Therefore, again the importance of testing and refining the instrument has to be emphasised. The analysis of the rationale of the respondents' answers is one method to verify whether the information was adequately provided by them. This may be done by means of verifying the monotonousness of their preferences (the higher levels of desirable attributes of the goods should be preferred over the lower ones), their transitivity (where the consumer preferred A in relation to B and B over C, than he/she should prefer A more than C), and stability (i.e. the respondents' preferences should not vary over the duration time of an individual survey).
Designing the choice set
Performing research by the choice experiment method involves a series of variants. The most popular ones include: the discrete choice where the respondents are asked to chose mostly preferred alternative from a set of two or more alternatives differing in the attribute levels of the goods; the contingent ranking where the respondents are asked to line up the alternatives from the most to the least preferred ones; and the contingent rating where the respondents are additionally asked to specify, how much do they prefer a given alternative, pursuant to a synthetic, scored scale. Irrespective of the methodo-logy variant used, the respondents' choices undergo statistical analysis which enables for determination of the form and parameters of the usefulness function matching the best the choices observed. Drawing up the consumers' (or their sub-groups') usefulness function provides a widespread field for the further analysis, since that enables for reading out: the attributes which are relatively most relevant, the variability of the consumers' usefulness stemming from change in their levels, or whether the individual attributes and their levels are mutually interrelated, as well as what are the effects of the respondents' choices made upon their individual socio-demographic features.
Likewise in case of the contingent valuation method, the choice experiment method uses certain scenario introducing the respondent into the choice which has to be made, and therefore it requires prior careful planning, testing and implementation aimed at delivery of correct results. Nevertheless, since this method requires that the respondents make a relative comparison of the alternatives, instead expressing the acceptance for only one scenario, the contingent valuation method provides for considerably higher flexibility of making conclusions based upon the results obtained.
Undoubted advantages of the choice experiment method include that it enables setting out both the effect of the hypothetical change in certain attributes of the goods, as the whole, and their specific constituent components. Moreover, it is believed that many respondents consider the situation in which they have the opportunity to declare their preferences on relative basis, e.g. choosing the most preferable alternative, as the easier
Review of instruments and valuation methods for multifunctional forest policy
70
one, and the more comfortable and natural, than any other direct setting out the value of the goods in monetary units.
Research based upon the contingent valuation method requires rather not mostly detailed description of a single scenario, under which the changes in characteristics of analysed goods are proposed in a comprehensive manner, but a description of many choices possible which differ mutually by particular attributes. This approach applies various and carefully designed series of changes in the features to be presented to the respondent when asking him/her to make a choice of a preferable set. Therefore, the choice experiment method requires precision and of the attributes, the changes of which have to describe a new situation.
The fundamentals of the choice experiment method consist in that each good could be characterised by means of respective chosen series of the attributes describing it (Lancaster 1966). That has to be started from identifying the series of all essential attributes (including manipulated variables, factors, independent variables, explanatory variables) and then their number has to be confined to only such ones which could be considered in parallel, at the same time, by an average respondent. Then, an adequate mode of quantification has to be identified for each of the attributes that means a functional unit which enables for their description. The attribute levels (or factor levels, treatments) may be described by both their physical values (e.g. weight – in kilograms, cost – in monetary units), or descriptive values (e.g. comfort – in a descriptive or score scale). Now, recalling the survey objective a definite numbers of the attribute levels have to be identified, by which the various variants of the goods will be presented to the respondents.
Further, the experimental design is to be developed. The choice presented to the respondent consists of several alternatives which are described by means of various attributes (i.e. their levels). The number of alternatives in single choice set may differ, as a rule between 2 (i.e. paired comparison) to 4, since the respondent could hardly compare a higher number of them at once (Batsell and Louviere 1991). Principally, the number of 2 or 3 alternatives is sufficient enough to describe the status quo and various opportunities to change. The choice design consists in creation of so called treatment combinations, or profiles which could provide alternatives to the choice (or sets thereof).
The process of matching the levels of attributes under particular alternative to be presented in the survey, as well as the sets of alternative to be presented for one choice set is merely complicated. This is because the researcher's goal is to find an optimum between the highest possible quantity of information gathered on a single choice set (therefore, the alternatives have to present possibly close usefulness values), and the least possible variance of the parametric estimates being obtained (since, when the alternatives are mutually too close with regard to their usefulness, then they could cause that the respondents will be not in position to select apparently the best one, or will make their choices on a random basis, or refuse participation to the survey, at all).
The full factorial design is the simplest method for designing the choice set, under which the alternatives created feature by all possible combinations of all the attribute levels. However, this method features by two major disadvantages. First, it is ineffective, since a part of the alternatives prepared in that way would be never chosen by the respondents, whereas, in turn, the other ones could be always chosen, and that is the reason why a part of the choice set does not involve the information which could be

Review of instruments and valuation methods for multifunctional forest policy
71
of use for the further modelling. Second, already with several attributes at several levels, the quantity of all possible combinations considerably exceeds the number of the alternatives which could be presented to the respondents.
Having said the above, only certain possible combinations of the attribute levels fit the selection needs of the survey, and they are being finally chosen. Such type of design is called fractional design. The choice of certain combinations of the attribute levels must however feature by adequate statistical characteristics, as indispensable for the further development of the model and estimation of its parameters (e.g. the parameters which reflect the significance of particular attribute levels in the consumer usefulness function). To this end, the orthogonal factorial design is the method applied most frequently nowadays. The essence of this method consists in noncolinear occurrence of the changes in particular attribute levels under various alternatives, hence the analysis of various alternatives provides for independent estimation of the influence of each of them on the consumer choice.
Application of the orthogonal factorial design enables to reduce to a dozen or several dozens the number of alternatives used for surveying. However, it has to be noted that many options of the orthogonal factorial design exists that could yet mutually differ in their effectiveness. The comparison of the effectiveness is possible thanks to so called effective partial design, which encompasses a wide group of approaches to designing the choice sets those while using the more or less precise expectations concerning the form and parameters of the usefulness function enable for a priori creation of the choice sets which are capable of maximising so called D, A, C and S effectiveness types; while, with the D-effectiveness, the matrix determinant of the model parameters variances and co-variances matrix is minimised, hence so are also the variances and co-variances of the parameters; with the A-effectiveness, the trace of the variance-co-variance matrix is minimised, hence so are also the variance parameters); with the C-effectiveness, the variance of specific parameters is minimised, being usually those used to setting out the marginal rate of substitution, i.e., for instance, the willingness to pay for a specific attribute level; and finally, with the S-effectiveness, the sample size is minimised that enables for obtaining specific statistical features of the parameters, or any mix thereof. While this approach theoretically provides for reduction of the number of observations (or increase in the quality of the estimations obtained), it inseparably links to certain assumptions concerning the form and parameters of the usefulness function that as a rule are unknown prior to commencing the survey.
Application of several subsequent sets of choice for a single respondent is the factor which distinguishes between the choice experiment method and the contingent valuation method. And it is not necessary that the number of the choice set presented to single respondent be equal to the total number of the sets of choice prepared. In case when the lesser number the choice set is presented, the blocking the design is applied (i.e. blocking the choice sets) in order to aggregate them into packages, so that only one package be presented to individual respondent. Once the choice design is complete, the survey scenario can be developed to provide "casing" for the design, and then the model will be estimated, once collection of data is complete.
4.5 Other valuation methods In addition to the three primary valuation methods discussed above, there are three methods that are less frequently used to value non-timber forest benefits: (1) The
Review of instruments and valuation methods for multifunctional forest policy
72
hedonic method, (2) The damage cost methods, and (3) The replacement cost method. We will briefly review these methods below, and provide a few examples.
The hedonic method
The hedonic method (HM) is a revealed preference method which uses information about prices of goods people buy to infer the marginal value of different characteristics or attributes of that good. Typically, a good consists of many attributes the consumer values when purchasing that good. If two goods differ only along one dimension, for example two cars that have similar sizes, colours, designs etc, except for the power of the engine, the price difference between the two goods can be assumed to be due to the difference in that particular characteristic. Given data of market prices of tradable goods which has variation in prices and types of characteristics we are interested in, the marginal values of each characteristic can be derived. So, why would this approach be relevant for valuing NTFBs?
The HM has been used in many areas of consumer research, but importantly in environmental economics in two main areas: (1) Valuing environmental amenities based on price data for houses; (2) Valuing risks based on wage differentials between safe and more risky jobs, to derive a measure for value of statistical life. The latter measure is typically used in cost-benefit analysis to rank policy interventions that save (statistical) lives, e.g. improved road standards.
The first application, using property market data, is based on the simple idea above that the price of a house can be explained by (1) Characteristics of the house itself and its lot (number of rooms, size, number of bedrooms, floor etc); (2) Characteristics of the neighbourhood (e.g. quality of schools, level of crime, environmental health etc); (3) Characteristics of the property’s location, e.g. proximity to a recreational area. Some of the characteristics can be called “environmental amenities” and will have implicit prices valued by people through the market for properties.
Many types of amenities can be valued, such as noise, air pollution, odour, views, proximity to forests and green space (e.g. parks) etc. HM has been used both for recreational properties and for urban properties. The HM involves collecting a fairly extensive dataset of public records of house prices (which typically includes the variables describing the house characteristics). This dataset is then coupled with statistics and sometimes GIS data on the attributes of neighbourhoods and environ-mental quality and amenity data – that often has to be crudely proxied. In comparison with the stated preference methods (CV and CE) and TCM, HM can be laborious and expensive.
Given sufficient data on house prices and the amenities and characteristics explaining the market prices, implicit amenity prices can be derived using statistical methods. An important condition making this possible is that the data contains sufficient variation in amenitity levels. Through a second step, aggregate welfare measures for the environ-mental amenities can be derived, e.g. for environmental changes such as increasing the green spaces in a city, reducing noise from traffic etc. These are benefits of proposed policies which in turn can be compared with costs in a cost benefit analysis.
A few studies use the HM method to value forested areas within and around cities, for example Tyrväinen (1998) and Tyrväinen and Miettinen (2000). Houses near forests typically have higher prices than otherwise similar properties located away from forests.
Review of instruments and valuation methods for multifunctional forest policy
73
The HM method can only value so-called use values, as house owners directly benefit from the amenities they pay for. It is not easy to disentangle which NTFBs that people value through this method, as data is not detailed enough to give implicit prices for different NTFBs. It can be assumed that it is particularly recreational aspects of the forest that are important, but also presence of birds and other wildlife, views and other benefits related to a forest proximity.
Although the HM is relatively popular, particular in the USA, for valuing water quality, noise and other environmental amenities (and disamenities), forests and NTFBs are still relatively rarely explored in HM applications (see Annex for studies conducted in Europe). A good reference for further discussion of the MH is Taylor (2003).
The damage cost method
The damage cost method aims to estimate direct and indirect economic costs caused by environmental pollution. Air pollution, for example, will cause health problems for people (especially particulate emissions and sulphur dioxide), create damage to buildings and cultural monuments, damage crops and sometimes forests. When used to value people’s health, the method estimates cost of illness, which includes all outlays people have related to disease caused by pollution (e.g. medicines), lost working days and productivity etc, and increased likelihood of premature death. Increase in disease prevalence is typically estimated using so-called dose response functions.
In a similar way, damage to growth and quality of forests (and their NTFBs) from different types of pollution, can be estimated using dose response functions from the literature. The acid rain problem in many areas of Europe a few decades ago, for example, had an economic costs per tonne sulphur emitted. This cost could be approxi-mated with the value of trees for the timber values, but had a significant cost also in terms of NTFBs. The NTFBs would have to be estimated using some of the other methods discussed above.
Currently, acid rain is less of a problem, but global warming has taken over as the main global environmental concern. When trees that bind carbon are cut, that has a cost, which is equal to the damage the carbon that was bound to that tree, has when instead released into the atmosphere. Typically, as no better estimate is available, this cost would be approximated using the price of carbon in international markets.
The replacement cost method
A method sometimes used, when time and budgets for primary valuation studies are short, is the replacement cost method. If a forest is cleared, the value of that forest can be approximated with what it would cost to plant and maintain a similar forest some-where else. This method strongly assumes that all types of habitats can be replaced without loss of functions or values – in physical and biological terms and in the eyes of people. The more unique and complex a habitat is, the harder it is to justify the use of this valuation method, as it would be almost impossible (almost by definition) to copy and replace the habitat in question. However, if a forest is a monoculture (plantation) it may still be important and valuable in terms of some core ecosystem functions and as a recreational area for people, and valuing it using the replacement cost method may be a useful approximation.
Review of instruments and valuation methods for multifunctional forest policy
74
4.6 Benefit transfer – methods and some applications11 The previous sections in this chapter have discussed primary valuation methods, where a specific forest (or changes to that forest) is valued using data collected from users and non-users who have preferences for that forest. If there is neither time nor sufficient budget to conduct a primary study, the value for the forest of interest can be approximated by using so called benefit (or value) transfer where value estimates from a primary study (or studies) of a similar forest in the literature is used. This section goes through the BT methods in some detail and provides a brief review BT studies in the forest context.
What is benefit transfer (BT)?
Benefit transfer (BT) uses existing values as an approximation for a new, primary study. The specific site from which information or data are derived is typically called the “study” site, while the site to which they are transferred is called the “policy” site.12 The two main advantages of performing BT instead of conducting new valuation studies are the lower cost and the shorter estimation time. This is why BT techniques are of great interest to practitioners and have contributed to rapid growth of BT applications over the last two decades. However, the use of BT introduces additional uncertainty about welfare estimates to the level already present in primary valuation results. Because of this, BT is regarded as a “second-best” strategy, compared to primary valuation surveys conducted to address valuation needs for specific resources and policies in terms of space, specific target population and time.
In an economic theory framework, for the two populations of the study and policy sites to have the same utility derived from increased provision of an environmental good, it requires the same form of utility functions,13 prices (of market goods), income levels, and vectors describing both the change in environmental qualities/quantities and the environmental situation before and after the change. In the indirect utility function, individual’s A and B willingness to pay (WTP) for a change in forest quality/quantity can be presented in equations (1) and (2), which are equal if equation (3) is true:14
(1) VA(p, I, Qo) = VA(p, I - WTP, Q1)
(2) VB(p, I, Qo) = VB(p, I - WTP, Q1)
(3) VA(p, I - WTP, Q1) = VB(p, I - WTP, Q1)
where: p – vector of prices of goods and services, I – the individual’s income, Q – vector describing forest quality/quantity, indices: 0, 1 – before and after changes, respectively.
11 This chapter draws heavily from Bartczak et al. (2008). 12 It is also possible to transfer values for a particular policy (for example – a national preservation policy of X% of
forests) that may or may not be related to specific sites. We use the terms “study” and “policy” sites for the sake of simplicity.
13 Which are typically assumed to be constant over time (or to vary with time in the same way) for both. In practice, individuals' preferences are typically not stable over longer periods (depending for example on cultural changes or technological developments).
14 This follows the standard neoclassical environmental economics approach.

Review of instruments and valuation methods for multifunctional forest policy
75
For forests the Q in the indirect utility function is quite difficult to specify, but several dimensions of forest characteristics may be important (see Figure 4.2.). Which forest attributes influence individuals' utility function, and their WTP or CS, are not fully understood. Matthews et al. (2007) claim that, for example, in the forest recreation context, WTP may plausibly be related to measurements of site quality, forest size and other attributes, such as the percentage of woodland area covered by broadleaf trees; but in fact, there have not been many studies that allow the pooling of data across a sufficiently large number of sites to safely establish such a relationship.
Figure 4.2 Valuation elements in the forest context
Type of good Target group/reciepients
Function:- recreation- environmental services- existence, altruistic and preservation/ bequest
Site characteristics:- type of forest (coniferous, broadleaf, mixed)- size- age- location: urban/rural- physical quality- management- existence of other tourist attractions inside forest (like: lakes, mountains, etc.)- substitute sites
- socio-economics characteristics- cultural background and behavioural patterns
Environmentalchanges
- magnitude- directions- time disperssion
Value estimates
- CS- WTP
Depending on the exact aim and the utilization of a BT application we can deal with an evaluation of the change in quality or quantity of: (a) a particular forest service/good, (b) a particular value, e.g. a non-use value or (c) a set of functions and values, when a complex policy scenario is presented. The latter case could be depicted by a scenario describing an increase in the natural protection system, where respondents can value either biological diversity or improvement in recreation due to more interesting surroundings or endangered species or other factors.
Economic theory has developed a number of BT approaches that try to adjust values for the differences that typically exist in practice between study and policy sites. Therefore, in some of these approaches the requirement of similarities can be relaxed if we have sufficient data from several sites or studies allowing us to adjust for existing differences between “study” and “policy” sites.
BT approaches can be divided into two main groups: unit value transfer (UVT) and benefit function transfer (BFT). Unit value transfers can be divided into: naïve (unadjusted) and adjusted benefit transfers (see Table 1). The naïve unit transfer is simply a single point estimate transfer which could be based on one or more valuation
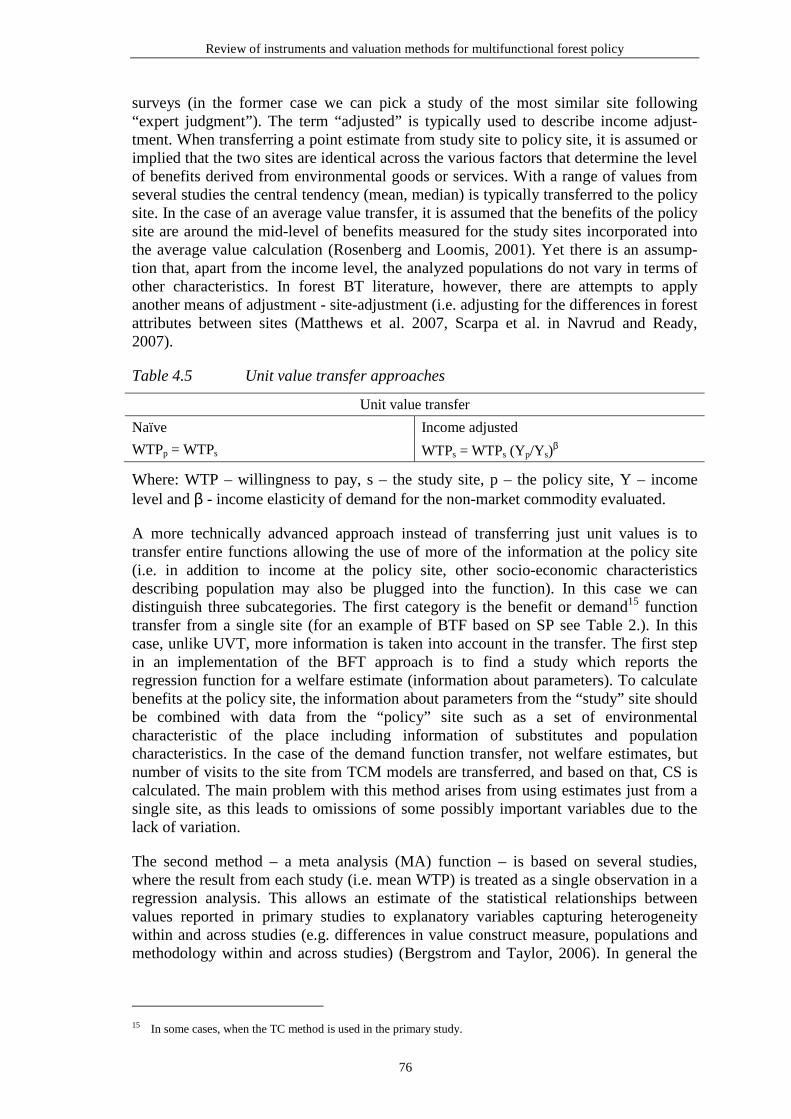
Review of instruments and valuation methods for multifunctional forest policy
76
surveys (in the former case we can pick a study of the most similar site following “expert judgment”). The term “adjusted” is typically used to describe income adjust-tment. When transferring a point estimate from study site to policy site, it is assumed or implied that the two sites are identical across the various factors that determine the level of benefits derived from environmental goods or services. With a range of values from several studies the central tendency (mean, median) is typically transferred to the policy site. In the case of an average value transfer, it is assumed that the benefits of the policy site are around the mid-level of benefits measured for the study sites incorporated into the average value calculation (Rosenberg and Loomis, 2001). Yet there is an assump-tion that, apart from the income level, the analyzed populations do not vary in terms of other characteristics. In forest BT literature, however, there are attempts to apply another means of adjustment - site-adjustment (i.e. adjusting for the differences in forest attributes between sites (Matthews et al. 2007, Scarpa et al. in Navrud and Ready, 2007).
Table 4.5 Unit value transfer approaches
Unit value transfer
Naïve Income adjusted
WTPp = WTPs WTPs = WTPs (Yp/Ys)β
Where: WTP – willingness to pay, s – the study site, p – the policy site, Y – income level and β - income elasticity of demand for the non-market commodity evaluated.
A more technically advanced approach instead of transferring just unit values is to transfer entire functions allowing the use of more of the information at the policy site (i.e. in addition to income at the policy site, other socio-economic characteristics describing population may also be plugged into the function). In this case we can distinguish three subcategories. The first category is the benefit or demand15 function transfer from a single site (for an example of BTF based on SP see Table 2.). In this case, unlike UVT, more information is taken into account in the transfer. The first step in an implementation of the BFT approach is to find a study which reports the regression function for a welfare estimate (information about parameters). To calculate benefits at the policy site, the information about parameters from the “study” site should be combined with data from the “policy” site such as a set of environmental characteristic of the place including information of substitutes and population characteristics. In the case of the demand function transfer, not welfare estimates, but number of visits to the site from TCM models are transferred, and based on that, CS is calculated. The main problem with this method arises from using estimates just from a single site, as this leads to omissions of some possibly important variables due to the lack of variation.
The second method – a meta analysis (MA) function – is based on several studies, where the result from each study (i.e. mean WTP) is treated as a single observation in a regression analysis. This allows an estimate of the statistical relationships between values reported in primary studies to explanatory variables capturing heterogeneity within and across studies (e.g. differences in value construct measure, populations and methodology within and across studies) (Bergstrom and Taylor, 2006). In general the
15 In some cases, when the TC method is used in the primary study.
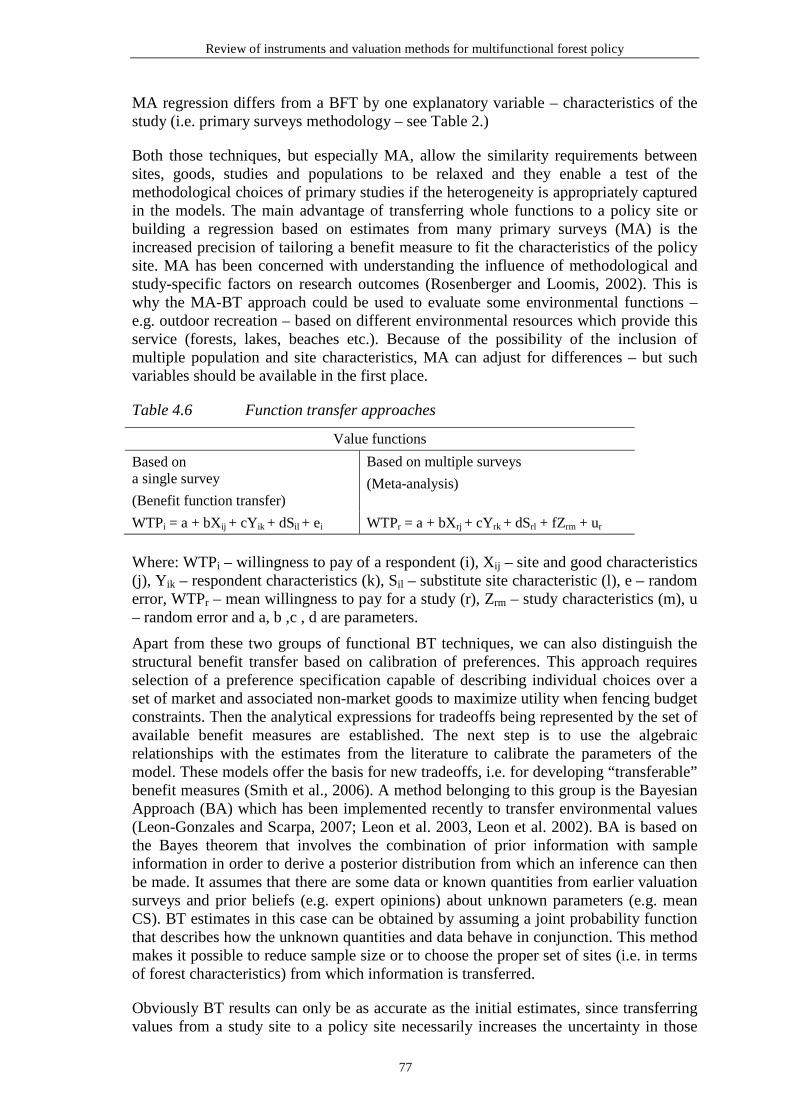
Review of instruments and valuation methods for multifunctional forest policy
77
MA regression differs from a BFT by one explanatory variable – characteristics of the study (i.e. primary surveys methodology – see Table 2.)
Both those techniques, but especially MA, allow the similarity requirements between sites, goods, studies and populations to be relaxed and they enable a test of the methodological choices of primary studies if the heterogeneity is appropriately captured in the models. The main advantage of transferring whole functions to a policy site or building a regression based on estimates from many primary surveys (MA) is the increased precision of tailoring a benefit measure to fit the characteristics of the policy site. MA has been concerned with understanding the influence of methodological and study-specific factors on research outcomes (Rosenberger and Loomis, 2002). This is why the MA-BT approach could be used to evaluate some environmental functions – e.g. outdoor recreation – based on different environmental resources which provide this service (forests, lakes, beaches etc.). Because of the possibility of the inclusion of multiple population and site characteristics, MA can adjust for differences – but such variables should be available in the first place.
Table 4.6 Function transfer approaches
Value functions
Based on a single survey
(Benefit function transfer)
Based on multiple surveys
(Meta-analysis)
WTPi = a + bXij + cYik + dSil + ei WTPr = a + bXrj + cYrk + dSrl + fZrm + ur
Where: WTPi – willingness to pay of a respondent (i), Xij – site and good characteristics (j), Y ik – respondent characteristics (k), Sil – substitute site characteristic (l), e – random error, WTPr – mean willingness to pay for a study (r), Zrm – study characteristics (m), u – random error and a, b ,c , d are parameters.
Apart from these two groups of functional BT techniques, we can also distinguish the structural benefit transfer based on calibration of preferences. This approach requires selection of a preference specification capable of describing individual choices over a set of market and associated non-market goods to maximize utility when fencing budget constraints. Then the analytical expressions for tradeoffs being represented by the set of available benefit measures are established. The next step is to use the algebraic relationships with the estimates from the literature to calibrate the parameters of the model. These models offer the basis for new tradeoffs, i.e. for developing “transferable” benefit measures (Smith et al., 2006). A method belonging to this group is the Bayesian Approach (BA) which has been implemented recently to transfer environmental values (Leon-Gonzales and Scarpa, 2007; Leon et al. 2003, Leon et al. 2002). BA is based on the Bayes theorem that involves the combination of prior information with sample information in order to derive a posterior distribution from which an inference can then be made. It assumes that there are some data or known quantities from earlier valuation surveys and prior beliefs (e.g. expert opinions) about unknown parameters (e.g. mean CS). BT estimates in this case can be obtained by assuming a joint probability function that describes how the unknown quantities and data behave in conjunction. This method makes it possible to reduce sample size or to choose the proper set of sites (i.e. in terms of forest characteristics) from which information is transferred.
Obviously BT results can only be as accurate as the initial estimates, since transferring values from a study site to a policy site necessarily increases the uncertainty in those
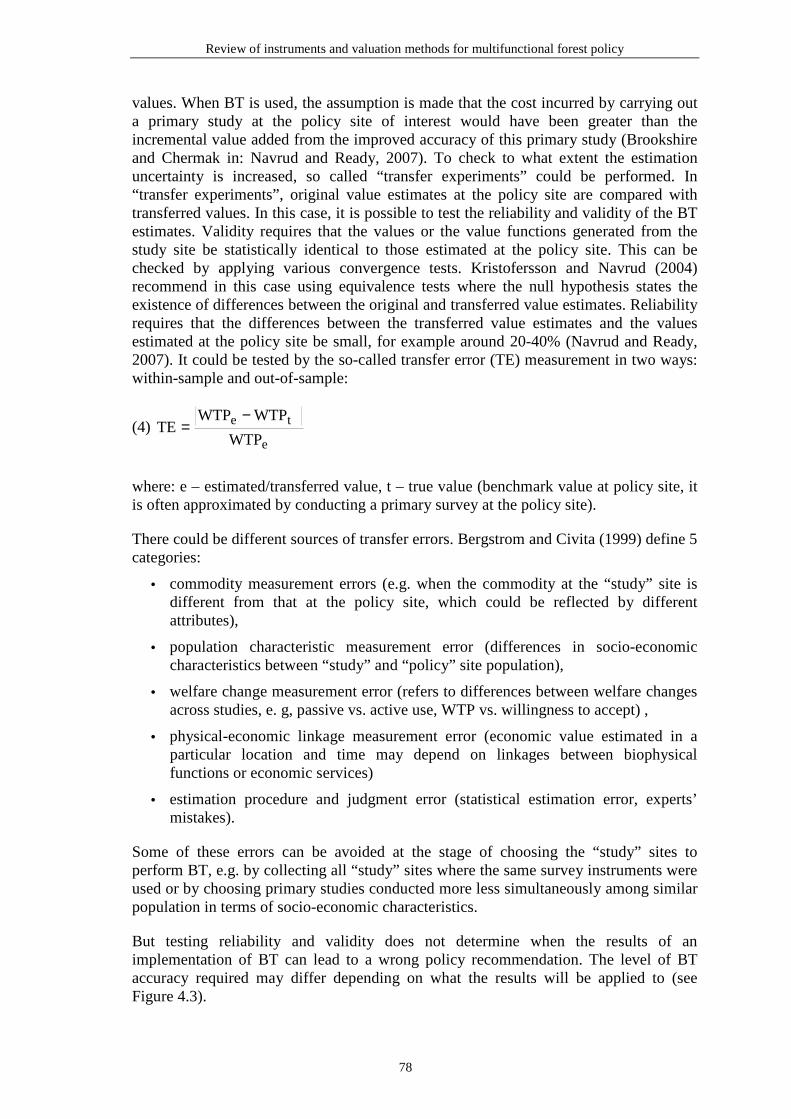
Review of instruments and valuation methods for multifunctional forest policy
78
values. When BT is used, the assumption is made that the cost incurred by carrying out a primary study at the policy site of interest would have been greater than the incremental value added from the improved accuracy of this primary study (Brookshire and Chermak in: Navrud and Ready, 2007). To check to what extent the estimation uncertainty is increased, so called “transfer experiments” could be performed. In “transfer experiments”, original value estimates at the policy site are compared with transferred values. In this case, it is possible to test the reliability and validity of the BT estimates. Validity requires that the values or the value functions generated from the study site be statistically identical to those estimated at the policy site. This can be checked by applying various convergence tests. Kristofersson and Navrud (2004) recommend in this case using equivalence tests where the null hypothesis states the existence of differences between the original and transferred value estimates. Reliability requires that the differences between the transferred value estimates and the values estimated at the policy site be small, for example around 20-40% (Navrud and Ready, 2007). It could be tested by the so-called transfer error (TE) measurement in two ways: within-sample and out-of-sample:
(4) e
te
WTP
WTPWTPTE
−=
where: e – estimated/transferred value, t – true value (benchmark value at policy site, it is often approximated by conducting a primary survey at the policy site).
There could be different sources of transfer errors. Bergstrom and Civita (1999) define 5 categories:
• commodity measurement errors (e.g. when the commodity at the “study” site is different from that at the policy site, which could be reflected by different attributes),
• population characteristic measurement error (differences in socio-economic characteristics between “study” and “policy” site population),
• welfare change measurement error (refers to differences between welfare changes across studies, e. g, passive vs. active use, WTP vs. willingness to accept) ,
• physical-economic linkage measurement error (economic value estimated in a particular location and time may depend on linkages between biophysical functions or economic services)
• estimation procedure and judgment error (statistical estimation error, experts’ mistakes).
Some of these errors can be avoided at the stage of choosing the “study” sites to perform BT, e.g. by collecting all “study” sites where the same survey instruments were used or by choosing primary studies conducted more less simultaneously among similar population in terms of socio-economic characteristics.
But testing reliability and validity does not determine when the results of an implementation of BT can lead to a wrong policy recommendation. The level of BT accuracy required may differ depending on what the results will be applied to (see Figure 4.3).
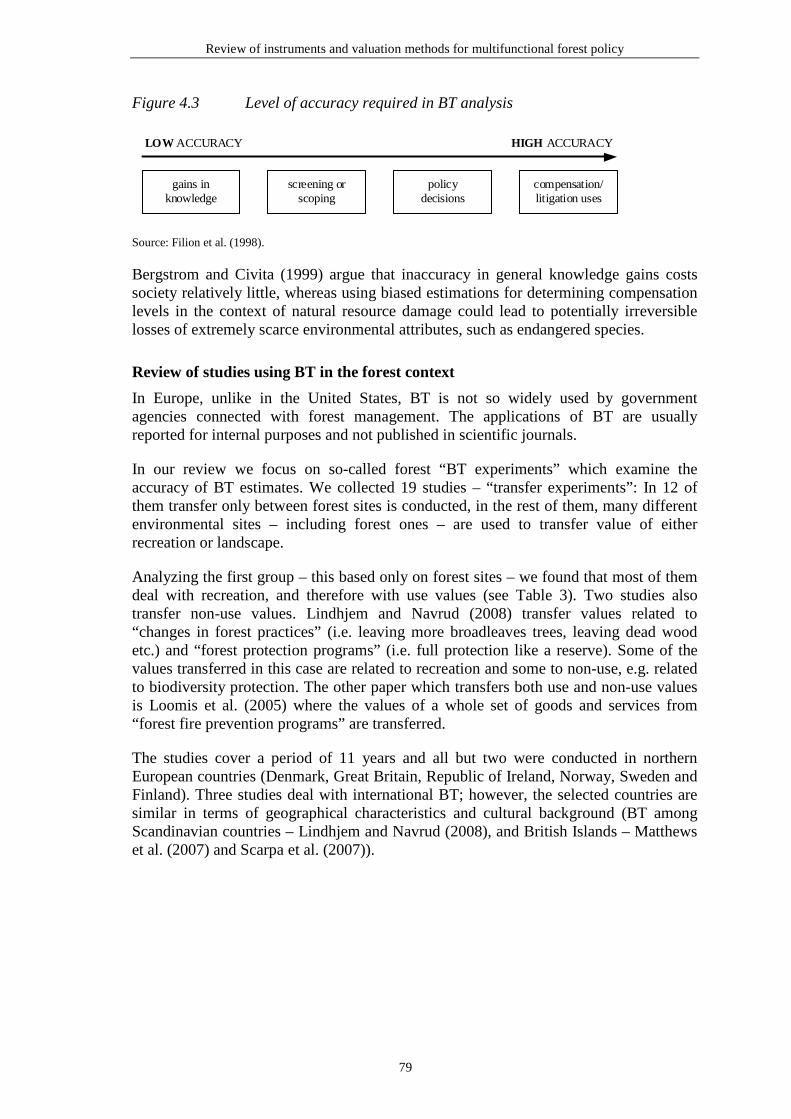
Review of instruments and valuation methods for multifunctional forest policy
79
Figure 4.3 Level of accuracy required in BT analysis
gains inknowledge
screening orscoping
policydecisions
compensation/litigation uses
LOW ACCURACY HIGH ACCURACY
Source: Filion et al. (1998).
Bergstrom and Civita (1999) argue that inaccuracy in general knowledge gains costs society relatively little, whereas using biased estimations for determining compensation levels in the context of natural resource damage could lead to potentially irreversible losses of extremely scarce environmental attributes, such as endangered species.
Review of studies using BT in the forest context
In Europe, unlike in the United States, BT is not so widely used by government agencies connected with forest management. The applications of BT are usually reported for internal purposes and not published in scientific journals.
In our review we focus on so-called forest “BT experiments” which examine the accuracy of BT estimates. We collected 19 studies – “transfer experiments”: In 12 of them transfer only between forest sites is conducted, in the rest of them, many different environmental sites – including forest ones – are used to transfer value of either recreation or landscape.
Analyzing the first group – this based only on forest sites – we found that most of them deal with recreation, and therefore with use values (see Table 3). Two studies also transfer non-use values. Lindhjem and Navrud (2008) transfer values related to “changes in forest practices” (i.e. leaving more broadleaves trees, leaving dead wood etc.) and “forest protection programs” (i.e. full protection like a reserve). Some of the values transferred in this case are related to recreation and some to non-use, e.g. related to biodiversity protection. The other paper which transfers both use and non-use values is Loomis et al. (2005) where the values of a whole set of goods and services from “forest fire prevention programs” are transferred.
The studies cover a period of 11 years and all but two were conducted in northern European countries (Denmark, Great Britain, Republic of Ireland, Norway, Sweden and Finland). Three studies deal with international BT; however, the selected countries are similar in terms of geographical characteristics and cultural background (BT among Scandinavian countries – Lindhjem and Navrud (2008), and British Islands – Matthews et al. (2007) and Scarpa et al. (2007)).
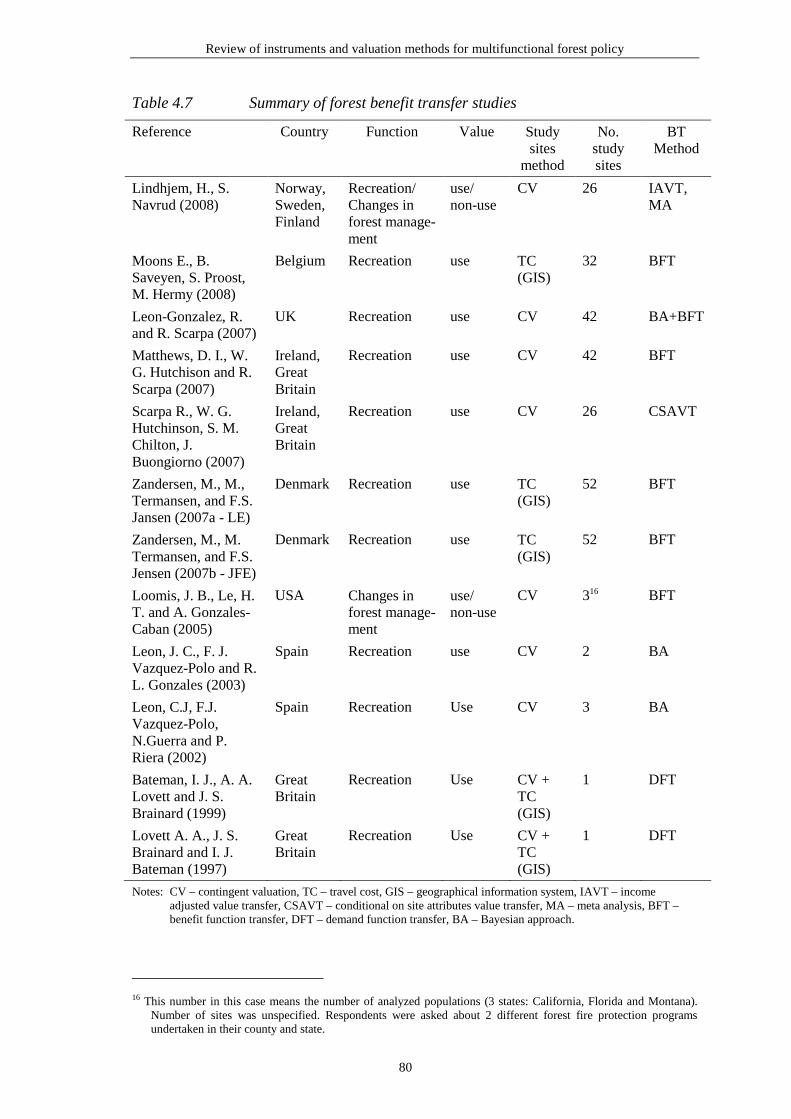
Review of instruments and valuation methods for multifunctional forest policy
80
Table 4.7 Summary of forest benefit transfer studies
Reference Country Function Value Study sites
method
No. study sites
BT Method
Lindhjem, H., S. Navrud (2008)
Norway, Sweden, Finland
Recreation/ Changes in forest manage-ment
use/ non-use
CV 26 IAVT, MA
Moons E., B. Saveyen, S. Proost, M. Hermy (2008)
Belgium Recreation use TC (GIS)
32 BFT
Leon-Gonzalez, R. and R. Scarpa (2007)
UK Recreation use CV 42 BA+BFT
Matthews, D. I., W. G. Hutchison and R. Scarpa (2007)
Ireland, Great Britain
Recreation use CV 42 BFT
Scarpa R., W. G. Hutchinson, S. M. Chilton, J. Buongiorno (2007)
Ireland, Great Britain
Recreation use CV 26 CSAVT
Zandersen, M., M., Termansen, and F.S. Jansen (2007a - LE)
Denmark Recreation use TC (GIS)
52 BFT
Zandersen, M., M. Termansen, and F.S. Jensen (2007b - JFE)
Denmark Recreation use TC (GIS)
52 BFT
Loomis, J. B., Le, H. T. and A. Gonzales-Caban (2005)
USA Changes in forest manage-ment
use/ non-use
CV 316 BFT
Leon, J. C., F. J. Vazquez-Polo and R. L. Gonzales (2003)
Spain Recreation use CV 2 BA
Leon, C.J, F.J. Vazquez-Polo, N.Guerra and P. Riera (2002)
Spain Recreation Use CV 3 BA
Bateman, I. J., A. A. Lovett and J. S. Brainard (1999)
Great Britain
Recreation Use CV + TC (GIS)
1 DFT
Lovett A. A., J. S. Brainard and I. J. Bateman (1997)
Great Britain
Recreation Use CV + TC (GIS)
1 DFT
Notes: CV – contingent valuation, TC – travel cost, GIS – geographical information system, IAVT – income adjusted value transfer, CSAVT – conditional on site attributes value transfer, MA – meta analysis, BFT – benefit function transfer, DFT – demand function transfer, BA – Bayesian approach.
16 This number in this case means the number of analyzed populations (3 states: California, Florida and Montana).
Number of sites was unspecified. Respondents were asked about 2 different forest fire protection programs undertaken in their county and state.
Review of instruments and valuation methods for multifunctional forest policy
81
All the reviewed papers use primary studies based either on CV or TC methods. In most cases primary studies were carried out on-site. In the CV surveys, a payment vehicle is introduced as an entrance fee, and the elicitation method is the single or double bounded dichotomous choice (apart from Lindhjem and Navrud, 2008, the MA study). TCM is supported by the Geographical Information System (GIS) tool. In most studies the benefit functional transfer is used based on quite a large number of analyzed sites (in 7 articles, the number of sites varies from 26 to 52, and in the remaining 3 cases there are 1 to 2 sites). The authors of all studies from this group, in which the TCM approach is used in primary surveys, carry out demand function transfer rather than benefit transfer. There are also examples of the Bayesian approach (2 studies: Leon-Gonzales and Scarpa (2007) and Leon et al. (2003)). In two articles, unit value transfer was applied (Lindhjem and Navrud (2008) and Scarpa et al. (2007)).
The BT forest literature which we collected varies very much in terms of the objectives of the research being presented, in spite of a relatively small number of articles and an investigation, in almost all cases, of the same type of good – forest recreation. Generally, the collected literature can be grouped into four broad categories according to the focus of study (some of the articles deal with more than one of these subjects):
(1) time aspect in transferring values,
(2) BT site adjustment for differences in forest physical attributes,
(3) the role of population characteristics in forest BT, and
(4) methodological improvements (GIS, Bayesian Approach).
Apart from BT, carried out purely for forest sites, we found a few studies investigating environmental value transfer in a wider natural resource context. Mainly in these studies the value of outdoor recreation has been transferred (see Table 4.8) using MA regression. In all cases information was gathered from the United States and covers valuation studies in more or less a 30-year period. The main focus was on use value estimates for recreation activities defined by USDA Forest Service documents (21 activities17). The environmental sites distinguished other than forests were: lakes/ reservoirs, estuaries/bays, river-based sites and parks (incl. mountains). This wide range of recreation categories can be linked with particular environmental sites (i.e. rock climbing, fishing) or seasons (i.e. cross-country skiing) or can refer to multiple sites (i.e. camping, picnicking). Depending on the recreation activities, forest recreation had higher or lower estimates than other sites (e.g. biking lower). Since forest sites specifically were not the main area of interest in carrying out MA in these cases, forest characteristics were not collected in the database and therefore not analyzed (apart from broad categories such as wilderness areas, public vs. private lands).
17 Camping, picnicking, swimming, sightseeing, off-road driving, motor boating, float boating, hiking, biking,
downhill skiing, cross-country skiing, snowmobiling, big game hunting, small game hunting, waterfowl hunting, fishing, wildlife viewing, horseback riding, rock climbing, general recreation, other recreation.

Review of instruments and valuation methods for multifunctional forest policy
82
Table 4.8 Summary of outdoor recreation BT studies including forest sites
Reference Country Sites No. studies
No. of estimates
Primary study
methods
BT
Method
Shrestha, R. K., R. Rosen-berger, and J. Loomis (2007)
1) USA
2) internat.18
Forests,
lakes/
reservoirs, estuaries/
bays, river based sites, parks
1) 145
2) 159
1) 726
2) 765
CV, TC MA
Shrestha, R. K. and J. B. Loomis (2002)
USA 131 682
Rosenberger, R. S. and J. B. Loomis (2002)19
USA 131 701
Shrestha, R. K. and J. B. Loomis (2001)
International 159 765
Rosenberger, R. S. and J. B. Loomis (2001)
USA 131 682
BT results were compared based on different aggregation levels showing for example that the national benefit transfer outperforms the regional one. Two international BT were conducted using a USA database and transferring values to each of the international studies collected (studies from 28 countries differ significantly in terms of economic and cultural situations as well as geographical location: Canada, Australia, New Zealand, Italy, UK, Belgium, Finland, Spain, Madagascar, South Africa, Kenya, Costa Rica, South Korea). In most cases the explanatory power of the meta regression function was relatively low, around 0.3. Some other studies were aimed at methodology and, for example, were investigating different convergent validity tests.
In addition we found two studies dealing with landscape value transfer based on different environmental sites, including forest sites (see Table 4.9). These studies were based on CV estimates (Santos in Navrud and Ready, 2007) or on CE estimates (Colombo and Hanley, 2008). Both were carried out for a UK “policy” site.
18 Out-of-sample transfer based on MA for USA studies to “abroad” (28 studies from 14 countries, 83 estimates). 19 Single point and average value estimates from the literature for hypothetical mountain biking were transferred as
well.

Review of instruments and valuation methods for multifunctional forest policy
83
Table 4.9 Summary of landscape BT studies including forests sites.
Reference Country Sites Primary study methods
BT Method
Colombo, S. and N. Hanley (2008)
UK Heather moorlands and bogs, rough grasslands, broad and mixed woodlands, field boundaries, cultural heritage
CE VT, BFT
Santos, J. M. L (2007)
UK/ international
Flower rich meadows, broadleaf woods, stone walls
CV VT, I&FAVT 20*, BFT, MA
* Income and CV format adjusted value transfer.
Reliability and validity in all collected studies are tested in various ways by using different convergence tests or measuring marginal or average transfer errors. The authors usually perform a few subset transfer experiments, dividing collected studies according to the methodology used and estimations used in primary studies (e.g. median vs. mean, single bound vs. double bounded format), differences in BT methodology (e.g. different forms of BT functions, different BT approaches, an acknowledgment of forest characteristics vs. lack of it, updating information on the demand function in temporal transfer vs. unchanged information) in environmental programs (i.e. mechanical fuel reduction vs. prescribed burning), differences in forests attributes (i.e. most valuable vs. less valued, closer to cities vs. further away), or information concerning target groups (e.g. socio-economic differences between inhabitants of three states). To test the accuracy of estimates, most authors used different convergence validity tests to check the equality of BTF predicted and original mean WTP/CS values, and to test correlation and regression. No one performed the equivalence test recommended by Kristoferson and Navrud (2002) (hypothesis zero – there is a difference between surveys). In a few cases, analyses were performed using percentage differences (transfer error measure) within or out of sample.
Experiences and challenges from the transfer of NTFBs
Why has the value of recreation so far been mostly transferred in the forest context?
Looking at articles dealing with BT in the forest context, it is easy to note that in most of them the value of recreation has been transferred and other non-timber goods and services have been omitted, with the small exception of biological diversity. There could be several alternative explanations for this:
• Recreation is the most important non-timber forest function for practitioners and planners, since individuals value this function the highest. This statement can be supported by some evaluation results, for example Willis et al. (2003) where in a British national forest survey, recreation was found as the most precious item in terms of annual value among forest non-market goods and services (the other functions considered were landscape value, biodiversity, carbon sequestration and air pollution absorption). However this ranking can vary in different countries, since for some countries historical and social circumstances may imply higher
20 I & FAVT based either on estimations from a single best study or multiple studies.
Review of instruments and valuation methods for multifunctional forest policy
84
frequencies of forest visits or higher values placed on these visits than in the others.
• Recreation is the easiest to value of all non-timber goods and services using valuation methods based on either RP or SP. Recreation belongs to the group of direct-use forest NTBs values, whereas the rest of forest non-market functions have either indirect use values (ecosystem services) or non-use values. Apart from that, outdoor recreation, unlike the rest of NTBs (especially biological diversity21), is not so controversial to define. Both of these factors indicate why it is relatively easy to construct valuation survey and estimate values, in this case comparing with the rest of forest non-market functions. But at the same time there could be strong linkages between recreation and the other forest functions, such as aesthetic value or biological diversity. Additionally, with recreation, the values can be achieved by carrying out TCM surveys and, as mentioned before, RP functions characterized by higher explanatory power in general than SP ones, and it could be another argument for basing BT experiments on recreation instead of other NTBs.
• The third reason can be derived from the previous ones: the majority of forest non-market primary studies concentrate on recreation, so if one wants to do BT experiments here is the biggest set of surveys to choose from. For example, Elsasser et al. (2008) state that from 86 data sets for France, Germany, Austria and Switzerland more than half refer to recreation. In the case of some forest functions like watershed services, the evaluation methods like avoided, damage or substitute costs are often used, which are not so costly and time consuming as methods based on RP or SP and in this case conducting BT would not be justified.
It is an important issue to be aware of different interactions between forest functions (substitutable or complementary) but above all, clear definitions of them are needed. Sometimes – in primary valuation surveys the whole “package” of different forest functions is valued – there is no way for a reasonable division of achieved outcomes into subcategories. In this case, coding results in non-market valuation databases according to all categories could be subject to interpretation of results and then it could make later BT outcomes biased. If we deal with non-use values – e.g. an evaluation of endangered species – it is more difficult to conduct BT due to problems with establishing the proper unit measurements which can in many cases be strongly linked to the initial level of environmental quality.
How to deal with the time issue in forest BT context
In BT, the time aspect is often present since in most cases is based on using historic data to transfer present values – so we actually deal with a temporal transfer. The problem of time differences between study site and policy site can only be avoided when both of them take place in the same period – which is rare. While in BFT and a value transfer based on one survey the time adjustment would refer only to one period of time, with MA-BT and value transfer based on many surveys there would be more time differences to deal with.
The time aspect is important for at least three variables: differences in income level, differences in consumption preferences and behavioral patterns, and changes in
21 For the discussion see e.g. Nunes and van den Bergh (2001).
Review of instruments and valuation methods for multifunctional forest policy
85
environment. All these aspects are linked with each other. Where the first issue can be relatively easy to correct (using the elasticity index between environmental value and the income level22), the other two constitute big challenges for researchers since:
• preferences are known to be unstable over time. This concerns the forest in terms of individuals’ preferences towards some forest attributes such as species diversity and age over a long period (Zandersen et al. 2007a). However, Loomis (1989) finds that WTP is relatively stable over the period of nine months which he investigated,
• behavioral patterns depend on many factors – one of them could be technological development (e.g. visiting more distant places because of the change in transport modes allowing faster travel and time saving),
• changes in environment and their welfare estimates vary in time and a lot of environmental projects – including forest – have long-term durations (40-80 years after project start, for example: afforestation, wilderness preservation, or eco-system restoration).
When future projects are considered, an evaluation of their benefits is not possible by applying the revealed preference methods such as TCM. Navrud and Brouwer (2007) claim that in general, WTP functions based on SP surveys – especially CV – have much lower explanatory power than functions using RP methods, so it could be more relevant to use revealed preference primary studies than transfer estimates. So if one places more trust in RP estimations than stated preference methods, the only solution in this case is to transfer welfare estimates from primary TC or HP studies. This issue in the forest context is very important, for example when BT estimates are going to be used in CBA for establishing new recreation sites. And since many of forest projects are characterized by a long duration, the correct capture of changes over time in a relationship between environmental value and individuals’ income and preferences remains a crucial aspect.
There is an impression that in forest BT exercises, not enough attention has yet been devoted to the time aspect. In most of the reviewed papers the data used comes from the same period (e.g. Scarpa et al. (2007) test BT based on almost simultaneous – a period of a few weeks– collections of CVM data from 26 forest sites) or there is an assumption regarding the lack of time differences (e.g. Moons et. al (2008) assume in their model of optimal allocation of a new forest site that all projects started at the same point in time). Lindhjem and Navrud (2008) consider the time aspect only as a change in income levels and adjustment values in their MA and unit value transfer according to the inflation (implicit price deflator) and addining a time trend (year as an explanatory variable) to the regression function. The same approach is used in all outdoor recreation BT papers collected.
But there are a few studies testing temporal transferability. The time aspect in a forest recreation transfer is the main topic of two Danish papers (Zandersen et al. (2007a) and (2007b)). They test the reliability of benefit transfer of forest recreation values over a 20-year time horizon. Both studies are based on a survey carried out in 1977 among respondents visiting 52 selected forest sites. The benefit function is used to estimate a recreation value of one these forests in 1997. In the first paper (Zandersen et al.
22 Navrud and Brouwer (2007) claim that income elasticity of WTP for different environmental goods are typically
smaller than 1, and often in the 0.4-0.7 range.

Review of instruments and valuation methods for multifunctional forest policy
86
(2007a)), the authors conduct two different transfers based on two different models: in one of them only the information collected in the 1977 survey is used to assess the recreation value in 1997, whereas the other one includes updated information about demand structures using information from a national household survey in 1994 (but keeping trip patterns from 1977). The authors find that preferences for some forest attributes, such as species diversity and age as well as transport mode, have changed significantly over this period and updating transfer models by including more recent information about demand for forest recreation allows significant reduction in transfer error (improvements in error margins by an average of 282%). They conclude that the BT over time can be reliable (may produce acceptable errors23) as long as it is adjusted to changes in preferences and behavioral patterns.
In the other paper (Zandersen et al. (2007b)), the authors concentrate on changes attributed to forest recreation values along with a time flow. They find that the recreation value over a 20-year period of a large, newly established fringe forest increased 70 times, mainly due to the maturing of the forest. The second reason is related to a change in the patterns of visitors’ behavior. The benefit transfer estimations over time give results of between 57% underestimations and 349% overestimations depending on the sampling of the choice set used as the study site.
Heterogeneity of forest sites and environmental changes
It is hard to find two environmental goods which are identical, and forest sites are no exception. In BT methodology, the important issue is how the physical differences between forests sites affect the accuracy of a value transfer. Even though we know fairly well which types of forest attributes people generally prefer from many quantitative surveys (Gundersen, V. S. and L. H. Frivold (2005), Lindhagen and Hørnsten (2000), Ribe R. G. (1989)), people's WTP for such attributes are less well known. So the first question is: what forest characteristics influence individuals’ WTP for forest non-market good and services? Another would be: how to deal with forest heterogeneity when performing BT? Regarding the first problem, there is still no sufficient evidence about a relationship between forest attributes and the WTP or CS of certain forest functions (recreation, ecological services etc.) The results from primary studies are usually based on one or a few sites, which is not enough to establish such general relationships reliably. Size of forest site is a good example here. Some authors claim that it could be positively related with WTP for forest recreation (Mattews et al, 2007), but others (Lindhjem, 2007) find that there is no such dependence. Moons et al. (2008) say that small forests (less than 20ha) attract few to no visitors and in the case of large forests (more than 300ha) an increase of 1 ha causes negligible change in visitor numbers. But their statement is based on a forester’s opinion, not on empirical research. Even less attention in the literature is devoted to the forest management role and to the existence of other natural tourist attractions inside forests, like lakes or mountains, and their impacts on outdoor recreation. At the same time it is worth noting that a single forest might not be homogenous itself. A single site can consist of different parts which could vary in terms of biological diversity or management regime (this could be a case of either study site or policy site or both), making BT an even more complicated task.
Colombo and Hanley (2008) point out that the inclusion of three similarity indicators (disposable income, land cover and geographical distance) in the selection of study site
23 Average error of the best transfer model was around 25%.
Review of instruments and valuation methods for multifunctional forest policy
87
may lead to a reduction in transfer errors, although no clear pattern emerged. However, they also note that there are no clear criteria that define the concept of required “similarities” between study and policy sites. They show that adding more information to BT does not always reduce transfer error (the experiment of adding new sites which are more different in disposable income and landscape abundance makes transfer error worse). Santos (2007), applying different BT approaches and models, finds that the most accurate transfers are the VT based on single best study (chosen by experts – qualitative landscape change is similar in “study” and “policy” case, and additionally the visual presentations in both cases are almost identical) adjusted to DC format and meta-analytic models when predicting the DC format.
In part of our reviewed studies, forest characteristics are neglected in the analysis (Moons et al. 2006, Bateman et al. 1999, Lovett et al. 1997), however they are the main subject of a few others. Scarpa et al. (2007) and Matthews et al. (2007) investigate site-adjusted benefit transfer in a forest recreation context. In the first case, it is a site-adjusted value transfer (the transfer takes place after an adjustment which accounts for differences between attributes relevant to recreation across study and policy sites). The other study focuses on the site-adjusted benefit transfer function approach (this approach attempts to explain variations in WTP for forest recreation on the basis of variations in forest attributes).
Scarpa at el. (2007) claim that unlike the unconditional value transfer, value transfers conditional on site-specific recreation attributes are mostly transferable (reliable when forest attributes are used as predictors). They found that forest attributes show significant and plausibly signed coefficients. The forest attributes analyzed in this case were size of forest, conservation regime (nature reserve vs. others), age and share of tree coverage. Matthews et al. (2007) notice that insufficient data collection explaining the relationship of benefits to change in site attributes remains the main limitation of BT studies so far. They conclude that for a benefit function to perform well, the function must capture differences in welfare values between sites and if the site attributes are poorly chosen, or the BTF is poor, than the pool of sites needs to be large enough to incorporate the range of available sites. Scarpa at el. (2007) also point out that when benefits are determined by site attributes their omission from the econometric specification of BT results in mis-specification errors: but on the other hand, the inclusion of these attributes may cause co-linearity since all observations from the same site are associated with the same set of value attributes and for this reason the BTF estimation in this case should be achieved with data from a sufficiently large number of sites. Leon-Gonzales and Scarpa (2007) also note that reliable estimates in BT can be obtained when the heterogeneity between sites is appropriately captured by the model but at the same time they propose a Bayesian Model Averaging Approach which, if the sample size for a particular site is small, provides credible intervals by combining a BT estimate with a site specific estimate. Zandersen et al (2007a) and (2007b) implemented the Random Utility Model (RUM) in their calculation to solve the problem of non-similarity across sites since it can include multiple site characteristics.
Not only can differences in physical forest attributes influence the credibility of BT results, but also the environmental changes described in “study” and “policy” sites. And again in rare cases analyzed, environmental changes can be expected to do the same. They can vary in terms of magnitude and direction. Navrud and Brouwer (2007) claim that people place a higher value on keeping the original/undisturbed environmental good than on restoring it. Particularly, this problem can apply to “study” estimates collected from many studies such as a MA-BT case.
Review of instruments and valuation methods for multifunctional forest policy
88
Spatial considerations
Benefit transfer is intrinsically concerned with space, because it consists in taking into account two different sites, the study site and the policy site, which differ by their location. This issue is particularly present when we consider international transfers, since there is a higher probability that in this case we will find more difficulties connected with the different geographical locations of analyzed sites. Firstly because of differences in forest characteristics such as density, dispersions, types of forest, the quality of forest ecosystems etc., and secondly because of cultural differences and forest use traditions (including the distribution of public and private forests and their availability to the public), and thirdly because of differences in income levels between countries.
This last factor is relatively easy to correct by using Purchase Power Parity (PPP) corrected exchange rates. The first one refers to the problem of the relationship between WTP or CS and forest characteristics including forest location and the existence of substitute sites (forest dispersion). Geographical Information Systems (GIS) can be a helpful tool to analyze this aspect.24 The GIS approach put together spatial data, software applications and quantitative analysis and represents a means to organize and to store information that is referenced to the earth. Troy and Wilson (2006) note that this tool allows comparisons between study sites and policy sites considering three critical factors: the biogeographical similarity of the two sites, the human population characteristics and links with the environmental service, and the level of scarcity of the service (existence of substitutes). Viewing forest ecosystems on a spatial dimension allows analysis of them in terms of location, distribution and characteristics, in other words better accuracy in the site description. Elaboration of spatial scales when valuing ecosystem services also seems important to understand WTP in primary studies.
In the forest context, an estimation of the recreation demand function using GIS has been developed by Lovett et al. (1997) and Bateman et al. (1999). Their results show that an application of GIS in BT improves efficiency and consistency. In Lovett et al (1997) the analysis is extended by including such factors as availability of substitutes to the demand function. In both papers, the analysis is limited to establishing one forest site. Moons et al. (2008) transfer the estimated forest recreation demand function to the multiple new forest sites. They also check how recreation benefit depends on substitute sites, concluding that the availability of substitutes has a significant effect on the recreation value of a forest.
Troy & Wilson (2006) note a difference between spatial data and economic valuation data, the first being more and more precise and of high quality and the second not being sufficiently representative of a large variation. The consequence of these inadequacies in quantity and quality does not allow any relevant transfer.
The last factor – cultural differences and differences in traditions of using forest - seems to be an unsolved problem, however. Not considering this issue can lead to wrong inferences. An example could be the UNECE/FAO [2005] report which concludes that the value of a recreational visit to forests in Eastern Europe is 0.25 EUR, based on simple unit value transfer adjusted only to income level from estimates from Western Europe. Bartczak et al. (2008) find this value to be around 7 Euro from a TCM primary
24 GIS can be used to collect information concerning a traveled distance using e.g. registration plate numbers of cars
parked near forest sites.

Review of instruments and valuation methods for multifunctional forest policy
89
study administered on-site, in ten selected forest areas in Poland. It seems reasonable to restrict environmental value transfer between countries to those that are similar in terms of geographical location, cultural and social background, as well as in forest manage-ment methods.
Summary and conclusions
The benefit transfer approach has become an increasingly practical way to assist in decision-making when primary data collection is not feasible due to budget and time constraints, or when resource impacts are expected to be low or insignificant. However, the academic debate on the validity of the methods still continues. We decided to investigate the BT application in the forest context analyzing “transfer experiments” where original benefit estimates at the policy site were compared to estimates trans-ferred from other sites. Evaluating different environmental services – not only timber production – is an important aspect of multifunctional forest policy.
Although the forest delivers many environmental functions, reviewing forest BT studies we found out that recreation is a topic of most of them whereas less attention is devoted to other forest function– especially those connected with non-use values. Because all primary valuation estimates but one came from either CV or TC surveys. The only study using Choice Experiment benefit estimates concentrates on landscape value and performs a transfer among different environmental sites, one group of which constitutes forest sites. In the context of “pure” forest transfers, the preferred technique was functional transfer based on estimation from many sites, although some authors (Colombo and Hanley (2008), Lindhjem and Navrud (2008)) find that value transfers are not consistently outperformed.
In some cases, collecting a wide range of data helped to deal with site heterogeneity, which is one of the key issues in forest BT as well as in BT in general. Nobody disputes that adjusting BT to site characteristics improves the transfer results, but which forest attributes have an important influence on welfare estimation still needs further investigation. Similarity not only between sites but spatial location should be considered in BT as well, since, for example, not only the aggregated area of forest sites but also their different dispersion can bias the BT outcomes. In this context, tools like GIS can be very helpful. At the same time, selection of the study sites from which the value is transferred can affect BT validity. However, adding more information to benefit transfer estimations will not always reduce transfer errors. The studies based on many environmental sites (other than just forests) do not highlight the role of forest site characteristics.
The time aspect is another important issue for BT in general as it is known that preferences and behavioral patterns vary over time. In the forest context, additional problems appear with the fact that values evolve with environmental changes, e.g. forest age. And a lot of forest planning is long term, so variations in benefit estimates have to be expected. So far, only two forest BT papers have been devoted to this matter (Zandersen et al. 2007a and 2007b). In other cases, time gaps were “cured” by an adjustment to the inflation index, without using the WTP/CS elasticity according to income changes. Our review summarizes 12 years of research on BT application in the forest context and shows the challenges remaining in this area to increase the precision, accuracy and reliability of transferred estimates.
Review of instruments and valuation methods for multifunctional forest policy
90
5 Forest valuation studies in Europe25 This chapter presents the summary of forest valuation studies performed over the past 20 years in Europe. This work is limited only to the studies where forest goods and services were the main valuation object. To make the overview more transparent, the studies were grouped according to the valued good or service. The following groups were created:
• Recreation
• Biodiversity, nature protection and conservation
• Aesthetics
• Carbon sequestration
• Other
Some studies were difficult to classify due to broad scope, e.g. some choice experiment studies included many services or goods, not just one. Unless the focus was not aimed at one of the listed above a given study was classified as: Other.
There are only a few studies that aimed at estimating the social value of sequestered carbon. However, since these studies provide a wide range of estimates for different forest types, they were grouped separately.
Altogether 140 studies carried out in the following countries: Austria, Belgium, Czech Republic, Denmark, Finland, France, Hungary, Ireland, Italy, Norway, Poland, Sweden, Spain and United Kingdom were taken into account. These studies provided 280 estimates of different non timber benefits offered by forests.
The Annex to this report provides a table listing of the studies.
5.1 Recreation Recreation is by far the most frequently valued forest non-market service, which is also the reason such values are also the most commonly transferred (see Chapter 4.6). In most cases, the primary aim of recreation studies is to estimate consumer surplus (or willingness to pay) per person/ per visit.
The estimation of recreational value can be conducted with the use of both revealed and stated preference methods (RP, SP). Contingent valuation is the most frequently used technique applied for this purpose. In case of SP studies respondents are usually asked for WTP to access a given forest. Almost all studies use face to face, on-site interviewing. Entrance fee is, in the context of recreation, routinely used as a payment vehicle.
25 Working on this chapter I benefited from the report prepared within EXIOPOL Project: “Identification of forest
externalities” by Giergiczny, Mavsar, Wenchao, also materials presented by Henrik Lindhjem, Jurgen Meyerhoff and Maria De Salvo during the COST Action E45 meeting in Catania were used, source: http://www.medforex.net/e45/present.htm
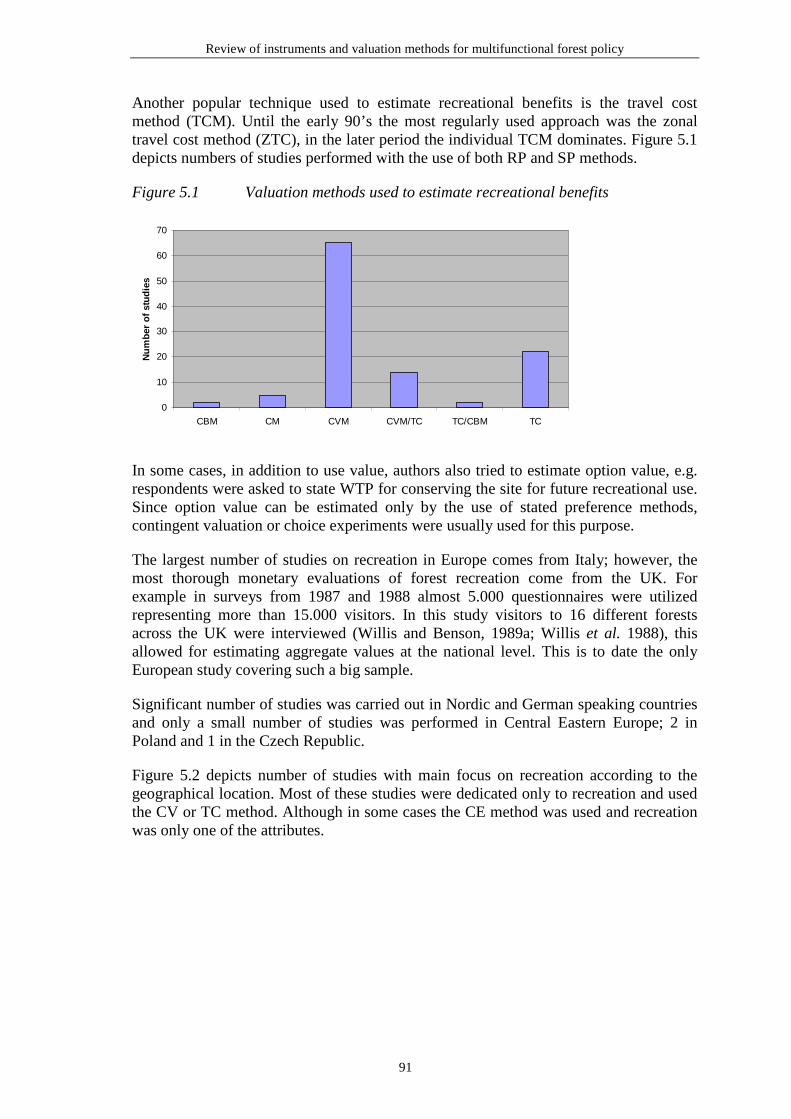
Review of instruments and valuation methods for multifunctional forest policy
91
Another popular technique used to estimate recreational benefits is the travel cost method (TCM). Until the early 90’s the most regularly used approach was the zonal travel cost method (ZTC), in the later period the individual TCM dominates. Figure 5.1 depicts numbers of studies performed with the use of both RP and SP methods.
Figure 5.1 Valuation methods used to estimate recreational benefits
0
10
20
30
40
50
60
70
CBM CM CVM CVM/TC TC/CBM TC
Nu
mb
er o
f st
ud
ies
In some cases, in addition to use value, authors also tried to estimate option value, e.g. respondents were asked to state WTP for conserving the site for future recreational use. Since option value can be estimated only by the use of stated preference methods, contingent valuation or choice experiments were usually used for this purpose.
The largest number of studies on recreation in Europe comes from Italy; however, the most thorough monetary evaluations of forest recreation come from the UK. For example in surveys from 1987 and 1988 almost 5.000 questionnaires were utilized representing more than 15.000 visitors. In this study visitors to 16 different forests across the UK were interviewed (Willis and Benson, 1989a; Willis et al. 1988), this allowed for estimating aggregate values at the national level. This is to date the only European study covering such a big sample.
Significant number of studies was carried out in Nordic and German speaking countries and only a small number of studies was performed in Central Eastern Europe; 2 in Poland and 1 in the Czech Republic.
Figure 5.2 depicts number of studies with main focus on recreation according to the geographical location. Most of these studies were dedicated only to recreation and used the CV or TC method. Although in some cases the CE method was used and recreation was only one of the attributes.
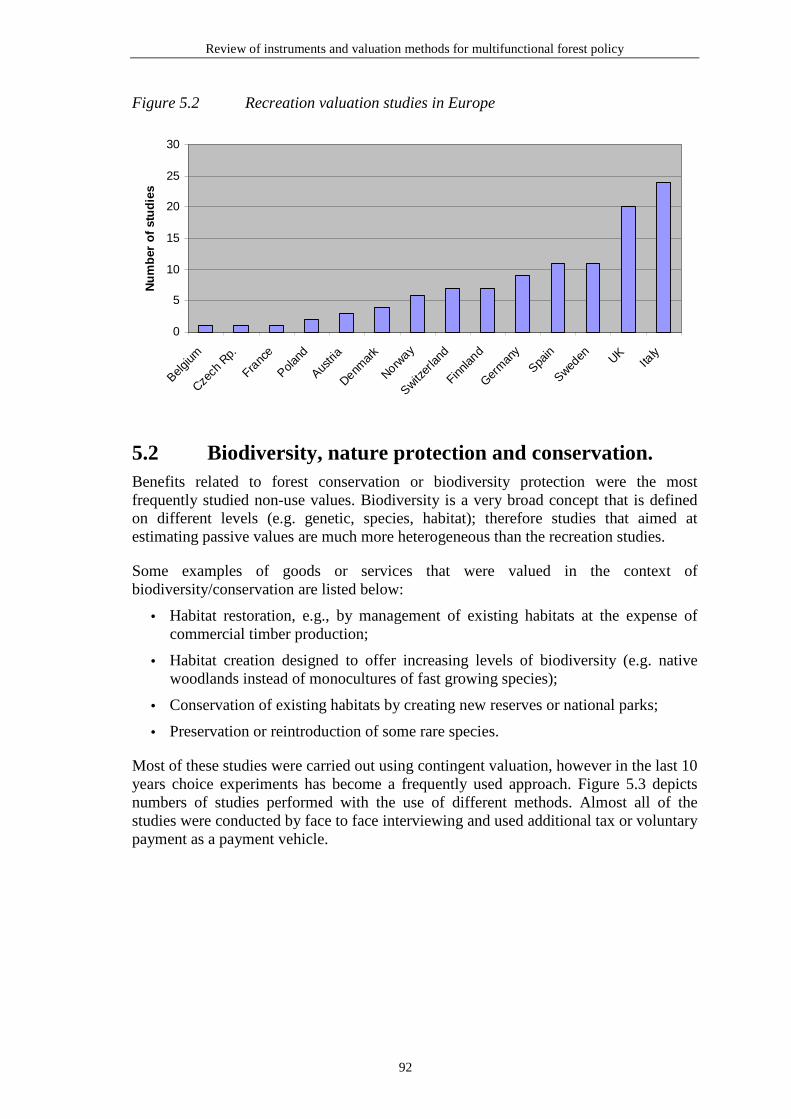
Review of instruments and valuation methods for multifunctional forest policy
92
Figure 5.2 Recreation valuation studies in Europe
0
5
10
15
20
25
30
Belgium
Czech
Rp.
Franc
e
Poland
Austri
a
Denmar
k
Norway
Switzer
land
Finnlan
d
Germ
any
Spain
Sweden UK
Italy
Nu
mb
er o
f st
ud
ies
5.2 Biodiversity, nature protection and conservation. Benefits related to forest conservation or biodiversity protection were the most frequently studied non-use values. Biodiversity is a very broad concept that is defined on different levels (e.g. genetic, species, habitat); therefore studies that aimed at estimating passive values are much more heterogeneous than the recreation studies.
Some examples of goods or services that were valued in the context of biodiversity/conservation are listed below:
• Habitat restoration, e.g., by management of existing habitats at the expense of commercial timber production;
• Habitat creation designed to offer increasing levels of biodiversity (e.g. native woodlands instead of monocultures of fast growing species);
• Conservation of existing habitats by creating new reserves or national parks;
• Preservation or reintroduction of some rare species.
Most of these studies were carried out using contingent valuation, however in the last 10 years choice experiments has become a frequently used approach. Figure 5.3 depicts numbers of studies performed with the use of different methods. Almost all of the studies were conducted by face to face interviewing and used additional tax or voluntary payment as a payment vehicle.
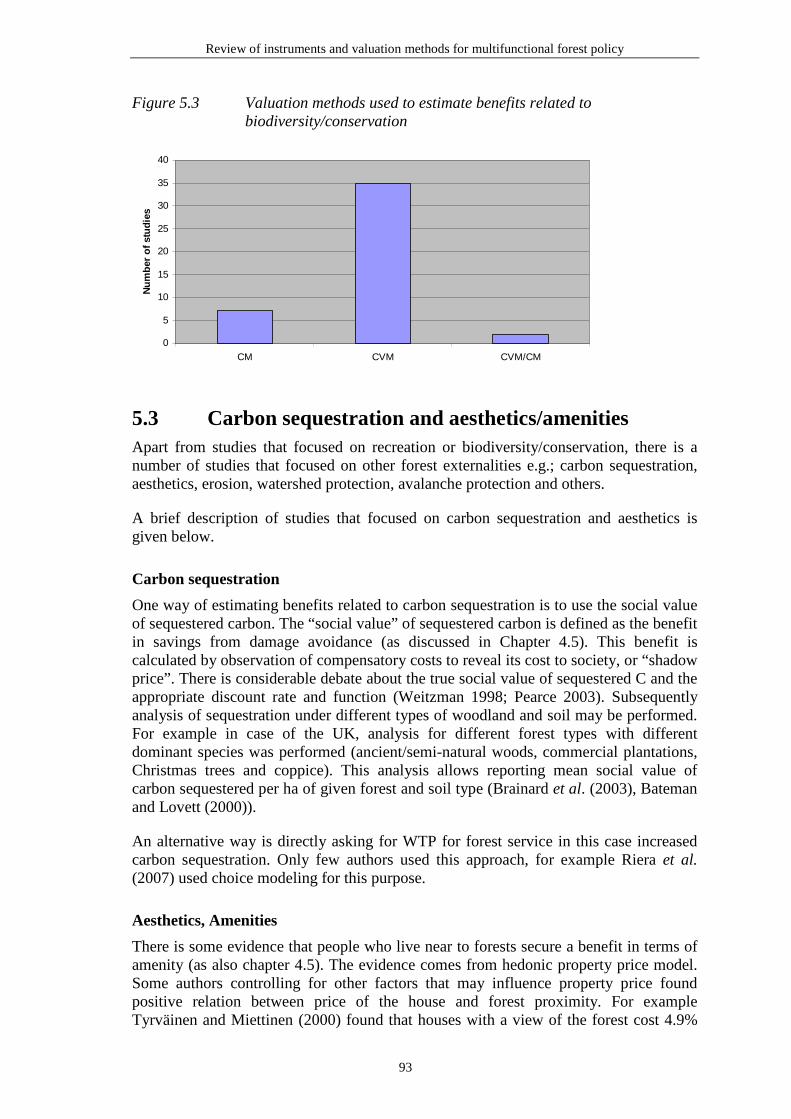
Review of instruments and valuation methods for multifunctional forest policy
93
Figure 5.3 Valuation methods used to estimate benefits related to biodiversity/conservation
0
5
10
15
20
25
30
35
40
CM CVM CVM/CM
Nu
mb
er o
f st
ud
ies
5.3 Carbon sequestration and aesthetics/amenities Apart from studies that focused on recreation or biodiversity/conservation, there is a number of studies that focused on other forest externalities e.g.; carbon sequestration, aesthetics, erosion, watershed protection, avalanche protection and others.
A brief description of studies that focused on carbon sequestration and aesthetics is given below.
Carbon sequestration
One way of estimating benefits related to carbon sequestration is to use the social value of sequestered carbon. The “social value” of sequestered carbon is defined as the benefit in savings from damage avoidance (as discussed in Chapter 4.5). This benefit is calculated by observation of compensatory costs to reveal its cost to society, or “shadow price”. There is considerable debate about the true social value of sequestered C and the appropriate discount rate and function (Weitzman 1998; Pearce 2003). Subsequently analysis of sequestration under different types of woodland and soil may be performed. For example in case of the UK, analysis for different forest types with different dominant species was performed (ancient/semi-natural woods, commercial plantations, Christmas trees and coppice). This analysis allows reporting mean social value of carbon sequestered per ha of given forest and soil type (Brainard et al. (2003), Bateman and Lovett (2000)).
An alternative way is directly asking for WTP for forest service in this case increased carbon sequestration. Only few authors used this approach, for example Riera et al. (2007) used choice modeling for this purpose.
Aesthetics, Amenities
There is some evidence that people who live near to forests secure a benefit in terms of amenity (as also chapter 4.5). The evidence comes from hedonic property price model. Some authors controlling for other factors that may influence property price found positive relation between price of the house and forest proximity. For example Tyrväinen and Miettinen (2000) found that houses with a view of the forest cost 4.9%
Review of instruments and valuation methods for multifunctional forest policy
94
more than otherwise similar houses. Positive correlation between forest and price of the houses was also found in study by Powe et al. (1997).
Some authors question reliability of estimates obtained in hedonic property price model. They claim that there are so many factors that may potentially influence house prices that controlling all of them is very difficult. Therefore the positive relation between price and forest proximity does not have to reflect the true one and may be an effect of ignoring other important variables. This critique is often levelled at the hedonic approach, yet a similar pattern was found in stated preference studies (e.g. Willis et al. 2003).
5.4 Summary Chapter 5 presents summary of forest valuation studies performed over the past 20 years in Europe. This work is limited only to the studies where forest goods and services were the main valuation object. Altogether 140 studies carried out in the following countries: Austria, Belgium, Czech Republic, Denmark, Finland, France, Hungary, Ireland, Italy, Norway, Poland, Sweden, Spain and United Kingdom were taken into account. These studies provided 280 estimates of different non timber benefits offered by forests.
Recreation is by far the most frequently valued forest non-market service. In most cases, the primary aim of recreation studies is to estimate consumer surplus (or willingness to pay) per person/ per visit in the forest. Relatively large number of studies focus on non-use values related to biodiversity, nature protection and conservation.
Only few studies focus on other non-market goods or services.
Review of instruments and valuation methods for multifunctional forest policy
95
6 Conclusion – POLFOREX documents non-timber benefits to improve forest management
The forest policies and experiences discussed in Chapters 2-3 of this report all show a trend towards a larger emphasis on non-timber benefits in forest management. Recreational values as well as ecosystem benefits such as biodiversity and carbon sequestration are becoming more important. Though forestry is still important in many areas, especially in rural areas, for local economic development, the value of the wider benefits is often large and increasing. However, the speed at which policy reforms are being implemented generally do not reflect the change in people’s preferences towards non-timber forest benefits (NTFBs). The economic valuation methods discussed in Chapters 4 and 5 are important in documenting such benefits, to compare with timber values in policy decisions affecting forests. There is a long way before forest policies are based on a careful balancing of benefits and costs. There are several reasons why, as discussed below. We stress the need to continue the effort to value non-timber benefits in economic terms – based on people’s preferences – and to gradually introduce such values into the decision processes of foresters and policy-makers. This will generally contribute to better decisions and increase the overall welfare benefits from forests. That is the aim of the POLFOREX project.
Even though the topic seems to have been researched thoroughly, the collaboration of foresters and economists in Poland reveals a number of disagreements on the question of benefits provided by forestry. Economists take it for granted that money metric offers the most universal reference for assessing benefits. In contrast, foresters typically do not appreciate economic values based on human decisions. They trust that the natural capital must have some "intrinsic" value that is independent of how people view it.
There are a number of alternative non-economic approaches to valuing benefits provided by natural ecosystems. The one which is closest to natural scientists' expectation is the energy theory of value. The theory is simple and consistent. The energy "value" of commodities refers to the amount of solar energy embodied in the product. For plants it is calculated by looking at the photosynthesis; any tissue contains a certain amount of energy (that allows using it as an energy source); given the efficiency of photosynthesis, one can easily determine the input of solar energy that was necessary for this tissue to be created. It is called embodied solar energy. For herbivores, the embodied solar energy is determined by calculating the necessary energy input embodied in plants eaten. For carnivores and next trophic levels the same approach applies. As a rule, the higher the level, the larger the "value" in terms of embodied solar energy.
This a beautiful theory, but absolutely useless in explaining how people act in economic systems. For instance, salmon is a herbivore, while cod is a carnivore. Therefore the latter has higher embodied solar energy than the former. Nevertheless, the prices people are willing to buy them for indicate the converse.
While it is possible to build a theory where things have "values" reflecting some physical characteristics, economics is – by definition – anthropocentric. Hence economic values reflect human preferences which may or may not correspond to the roles these things perform in natural systems. Both economists and foresters

Review of instruments and valuation methods for multifunctional forest policy
96
acknowledge that timber is but a small fraction of benefits provided by forestry. Nevertheless, they often disagree on how non-timber benefits can be evaluated.
The POLFOREX project includes several economic valuation exercises aimed at capturing benefits derived from non-timber products and services provided by forests. Some of them were carried out already at the outset of the project in 2008. They reveal that the value people attach to forest ecosystems is much higher than the value of timber itself. The latter is estimated roughly at 120 euro per hectare per annum. Of course, it can be temporarily increased in an unsustainably managed forest, but in the long run it is determined by the market value of timber and natural conditions. At the same time, the values of non-timber products and services – which possess the characteristics of a public good – are definitely higher. Willingness to pay values through CVM surveys conducted through the project will supplement these initial value findings.
Project estimates are consistent with how the Polish foresters perceive the societal role of the ecosystems they manage. However, they would prefer to have this conclusion supported by "scientific" evidence, independent of people's preferences as the latter can be irrational or inconsistent with ecological functions of forest components and processes. Gradually a consensus is built with forest management practitioners that the only values contemporary economics recognizes are those that reflect people's preferences. In fact, some people may be poorly educated or unaware of important ecological functions performed by the forest. Nevertheless this is not specific for the natural resource management; strange or even harmful preferences are observed elsewhere as well. There are a number of ways that people's preferences could or should be changed, but this is not the role for economists. Economics is about how ordinary people view things and – in particular – how they behave when confronted with choice situations. Professionals and well-educated citizens tend to behave differently than an average person. Yet it is only the latter that economists refer to when estimating values.
Like in many other countries, foresters in Poland acknowledge that forests perform multiple functions, and consequently they require an adequate management regime. At the same time, actual management reflects the key role attached to timber production. Even when they try to estimate non-timber benefits, Polish foresters look at the price of timber as a reference. A typical approach to evaluate non-timber benefits is to augment the timber revenues by a coefficient (mark-up) reflecting specific qualities of the site in question. While this approach is followed in many analyses and practical guidelines, it has no foundations in economics. It has been preferred by some foresters, since it combines economics (the market price of timber) and ecology (assessment of environmental functions performed by various forest stands). Unfortunately it cannot be accepted by economists, as coefficients used are established by professionals, and they do not necessarily reflect people's preferences. The technique seems to be objectionable for non-economists either, as the outcome depends on timber price. Any change in the latter implies changes in the overall "value", which is unjustified since the benefits the society derives from a forest are largely independent of what happens in the market for timber.
It will take a lot of time before foresters switch from the current coefficient-based approach to the one which is based in economics. POLFOREX is but a small step in this direction. The authors try to convince foresters and policy makers in general to look at how people perceive public forests and what decisions they take that might be relevant for forest management. Of course there is no direct link between people's stated preferences (the valuation technique used in most of our surveys) and their actual
Review of instruments and valuation methods for multifunctional forest policy
97
contribution to meeting certain costs of forest management. Nevertheless the link between "values" based on coefficients or embodied energy and policy or business decisions is even less direct. Perhaps some foresters are convinced that coefficient-based or energy-based estimates can justify policy actions. However, most policy makers are not. If at all, they try to sense what their constituencies – consisting of average individuals rather than professionals – are concerned about.
Sound forest management should start with an assessment of what benefits forestry provides. It will turn out that timber production (private good) is important but it yields to other services, some of which (public goods) cannot be easily commercialized. Some non-timber products can be sold as private commodities. For instance, camping opportunities is an example of a service that is close to a private good. Selling local products and souvenirs, as well as hunting rights are additional examples of commercial revenue raising activities that might be of interest to forest managers. Yet studies demonstrate that some benefits – those that are the source of non-use values – cannot materialize in commercial flows easily. Economic theory suggests that such benefits should trigger compensations paid from public budgets.
Environmental protection in Poland has several potential funding sources. Like in any country, the provision of environmental services (public goods) can be financed from the central state or regional budgets. In addition, a number of environmental funds operate. These funds originate from pollution and resource fees that are earmarked in Poland. Sometimes the fees are to be recirculated exactly on what they were levied on; for instance sulphur dioxide fees can be spent on sulphur abatement only. But apart from that, environmental fees enjoy certain flexibility in spending. In particular, they can be spent on habitat protection and environmental education – something that foresters struggle to finance from their own revenues coming from timber sales.
There are several non-commercial activities that State Forests in Poland try finance from timber sales. There exists so-called Forestry Fund (Fundusz Lesny) which redistributes profits among administrative units (nadlesnictwo) which otherwise should be self-financing. The Fund helps to have the ends meet in units where timber sales are low while habitat protection and environmental education needs are high. As a result, the State Forest is capable of providing public goods apparently for free. However, the units that are more profitable complain about the fund drain that leaves them without adequate assets to reward labour and invest in the future.
These systems reflect the prevailing philosophy which makes timber production the focal point of forest management. POLFOREX aims at demonstrating that social benefits provided by forests are much higher than timber sale revenues. If accepted, this observation can significantly change the focus of forest management. Instead of maximizing tree harvests, foresters may start to systematically explore how to maximize social benefits from forestry. To some extent these benefits may be commercialized. Those that resemble pure public goods will justify claims on public funds. Although it is not realistic to expect a major involvement of the state budget in financing the provision of non-commercial products and services in forestry, it is realistic to expect that forestry may effectively apply to environmental funds. Increasingly the funds require that their beneficiaries demonstrate the efficiency of the projects planned. In the case of forestry, the efficiency necessitates to assess benefits in monetary terms rather than quoting coefficient- or energy-based calculations.

Review of instruments and valuation methods for multifunctional forest policy
98
Thus our early valuation exercises can be seen as an important introduction to reorient forestry management schemes. It is a prerequisite for developing structures and procedures that ultimately may lead to managing the Polish forests in a way that is sustainable and commercially feasible while providing the society with services that are most desired.

Review of instruments and valuation methods for multifunctional forest policy
99
References
Anthon, S., and B.J. Thorsen (2002): Valuing afforestation, a hedonic approach - Værdisætning af statslig skovrejsning. En husprisanalyse. the Forest and Nature Agency, Ministry of the Environment, Denmark.
Asciuto A., Fiandaca F., Schimmenti E. (2005): Formati di domanda nella valutazione contingente. Estimo e Territorio n. 2 (pp. 9-21)
Barbier, E B. and G. M. Heal (2006): Valuing ecosystem services, The Economists’
Barreiro, J. and L. Perez y Perez (1997): El valor de uso recreativo del Parque Nacional de Ordesa y Monte Perdido. Diputación General de Aragón, Servicio de Investigación Agroalimentaria
Bartczak, A., H. Lindhjem, S. Navrud, M. Zandersen, and T. Zylicz (2008): Valuing forest recreation on the national level in a transition economy: The case of Poland, Forest Policy and Economics, in press
Bartczak, A, H. Lindhjem and A. Stenger (2009): Review of benefit transfer studies in the forest context". Published in Bergseng, E., G. Delbeck and H. F. Hoen (eds) Proceedings of the Biennial Meeting of the Scandinavian Society of Forest Economics, Lom, Norway, 6th – 9th April, 2008: pp 276-305.
Bateman, I. J., A. A. Lovett, and J. S. Brainard (1999): Developing a methodology for benefit transfers using geographical information systems: Modeling demand for woodland recreation, Regional studies 33(3): 191-205
Bateman, I. J., R. T. Carson, B. Day, M. Hanemann, N. Hanley, T. Hett, M. Jones-Lee, G. Loomes, S. Mourato, E. Ozdemiroglu, D. W. Pearce, R. Sugden, and J. Swanson (2002): Economic Valuation with Stated Preference Techniques. A manual. Edward Elgar
Bateman, I.J. (1996): An economic comparison of forest recreation, timber and carbon fixing values with agriculture in Wales: a geographical information systems approach, Ph.D. Thesis, Department of Economics, University of Nottingham.
Bateman, I.J. and A.A. Lovett (2000): "Estimating and Valuing the Carbon Sequestered in Softwood and Hardwood trees, timber products and forest soils in Wales", Journal of Environmental Management 60, 301-323.
Bateman, I.J. and Langford, I.H. (1997): Budget constraint, temporal and ordering effects in contingent valuation studies, Environment and Planning A, 29(7): 1215-1228.
Bazzani G.M. (1998): The Economic Value of Hunting Activity: A CVM study at Tonezza del Cimone. Environmental Resource Valuation: Applications of the Contingent Valuation Method in Italy-Studies in Risk and Uncertainty, Part III; pp.155-172.
Review of instruments and valuation methods for multifunctional forest policy
100
Bazzani G.M., Viaggi D. (2001): Disponibilità a pagare e gestione dell'attività venatoria in una riserva alpina. Atti del Convegno "La valutazione dei beni ambientali come supporto alle decisioni pubbliche. Una riflessione alla luce della noemativa comunitaria e nazionale", Agripolis-Legnaro (PD)
Bellù L.G., Cistulli V. (1997): Economic Valuation of Forest Recreation facilities in the Liguria Region (Italy). CSERGE Working Paper GEC 97-08
Benson, J.F. and Willis, K.G. (1990): The aggregate value of the non-priced recreation benefits of the Forestry Commission estate. Report to the Forestry Commission, Department of Town and County Planning, University of Newcastle upon Tyne.
Benson, J.F. and Willis, K.G. (1992): Valuing informal recreation on the Forestry Commission estate, Bulletin 104, Forestry Commission, Edinburgh.
Benson, J.F. and Willis, K.G. (1993): Implications of recreation demand for forest expansion in Great Britain, Regional Studies, 27(1):29-39.
Bergsen, E. and Solberg, B. (2007): Evaluating Financing of Forestry in Europe (EFFE): Country Report – Norway. The Department of Ecology and Natural Resource Management, Norwegian University of Life Sciences.
Bergstrom, J. C. and L. O. Taylor (2006): Using meta-analysis for benefits transfer: Theory and practice, Ecological Economics 60: 351-360
Bernadzki, E., (1995): Półnaturalna hodowla lasu. In: Ochrona róŜnorodności biologicznej w zrównowaŜonej gospodarce lesnej, PTL and IBL, Warszawa
Bernetti I., Romano S. (1996): La valutazione dei progetti di sviluppo turistico nei parchi naturali. Genio Rurale, n.4
Bishop, J.T. (1999): Valuing forests: A review of methods and applications in developing countries, London, Environmental Economics Program, International Institute for Environment and Development
Bishop, K.D. (1990): Multi-purpose woodlands in the countryside around towns, PhD thesis, University of Reading.
Bishop, K.D. (1992): Assessing the benefits of community forests: an evaluation of the recreational use benefits of two urban fringe woodlands. Journal of Environmental Planning and Management, 35(1):63-76.
Bishop, K.D. and Stabler, M.J. (1991): The concept of community forests in the UK: the assessment of the benefits, unpublished paper, presented at the annual conference of European Association of Environmental and Resource Economists, June 10-14th, 1991, Stockholm School of Economics, Sweden.
Bjørner, T., C.F. Russel, A. Dubgaard, C. Damgaard, and L.M. Andersen (2000): Public and private preferences for environmental quality in Denmark. AKF forlaget.
Bojö, J. (1985): Kostnadsnyttoanalys av fjällnära skogar: Fallet Vålådalen. The Economic Research Institute.
Review of instruments and valuation methods for multifunctional forest policy
101
Bostedt, G., and L. Mattson (1991): Skogens betydelse för turismen: En samhällsekonomisk pilotstudie. Department of Forest Economics, Swedish University of Agricultural Sciences. Report 141.
Bostedt, G., and L. Mattson (1995): The value of forests for tourism in Sweden. Annals of Tourism Research 22:671-680
Brainard, J., Lovett, A. and Bateman, I. (2003): Carbon Sequestration Benefits of Woodland: Social and Environmental Benefits of Forestry: Phase 2. Report to the Forestry Commission, Social and Environmental Benefits of Forestry: Phase 2. Report to the Forestry Commission, Edinburgh.
Brookshire, D. and J. Chermak (2007): Benefit and informational transfer, in: S. Navrud and R. Ready, ed., Environmental value transfer: issues and methods, Springer
Brouwer, R. (2000): Environmental value transfer: state of the art and future prospects, Ecological Economics 32: 137-152.
Brundtland Commission (1986)
Campos, P., A. Caparrós and E. Sanjurjo (2005): Spain. In: "Valuing Mediterranean Forests: Towards Total Economic Value", (eds:Merlo M. and Croitoru L.), Solsona and Padova
Campos, P., P. Riera, R. De Andrés and E. Urzainqui (1996): El valor económico total de un espacio de interés natural. La dehesa del área de Monfragüe. In: D. Azqueta y L. Pérez (Eds), Gestión de espacios naturales. La demanda de servicios recreativos. McGraw-Hill, Madrid, pp. 192-215.
Caparrós Gass, A. and P. Campos Palacín (2002): Valoración de los usos recreativo y paisajístico en los pinares de la sierra de Guadarrama. studios Agrosociales y Pesqueros, nº 195 (pp.121-146)
Christensen, J.B. (1985): An economic approach to assessing the value of recreation with special reference to forest areas, PhD thesis, Department of Forestry and Wood Science, University College of North Wales, Bangor.
Christensen, J.B. (1988): An economic approach to assessing the value of recreation with special reference to forest areas. Ph.D. Thesis, University Col-lege of North Wales, Bangor. p123-178, Published as Reports fromDepartment of Forestry, Series 122: Research, No. 121, The RoyalVeterinary and Agricultural University, Department of Forestry,Copenhagen.
Christensen, J.B., Humphreys, S.K. and Price, C. (1985): A revised Clawson method: one part-solution to multidimensional disaggregation problems in recreation evaluation, Journal of Environmental Management, 20:333-346.
Christie M., Hanley N., Hyde T., Garrod B., Swales K., Lyons N., Keirle I., Bergmann A., (2005): Forest Recreation Activities: Phase 2, Report to the Forestry Commission
Christie, M., Hanley, N., Warren, J., Murphy, K., Wright R. and Hyde, (2006): T. Valuing the diversity of biodiversity, Ecological Economics 58, 304- 317.
Review of instruments and valuation methods for multifunctional forest policy
102
Colombo, S. and N. Hanley (2008): How can we reduce the errors from benefits transfer? An investigation using the choice experiment method, Land Economics 84(1): 128-147
Cooper J.C., Hanemann M., Signorello G. (2002): One-And-One-Half-Bound Dichotomous Choice Contingent Valuation. The Review of Economic Statistics, November 2002, 84(4): 742-750
Cooper J.C., Perali F., Tommasi N., Veronesi M. (2005): A contingent valuation method incorporating fairness and citizen participation. Integrated Assessment and Management of Public Resources, pp. 70-92
Corsi A., Novelli S. (2005): Il valore d'uso dell'ambiente come supporto alla didattica. Rivista di Economia Agraria, a. LX, n.1 (pp. 71-101)
Cubbage, F., Harou, P., Sills, E., (2007): Policy instruments to enhance multi-functional forest management, Forest Policy and Economics 9: 833-851.
De Battisti, R, De Val, A and Rosato, P (1997): Il valore economico dell'attività venatoria nella montagna veneta. Ric. Biol. Selvaggina XXVII (pp.471-482)
De Fano, G. and Grittani, G. (1992): La valutazione monetaria di due beni ambientali. Genio Rurale, n.6 (pp.9-20)
De Groot R. S., M. A. Wilson, and R.M.J. Boumans (2002): A typology for the classification, description and valuation of ecosystem functions, goods and services. Ecological Economics 41: 393-408
Del Saz, S. (1996): La demanda de servicios recreativos de espacios naturales: aplicación del método de valoración contingente al Parque Natural de L'AlbuferaUniversidad de Valencia: PhD dissertation
Dubgaard, A. (1998): Economic valuation of recreational benefits from Danish Forests. P. 53-64 in The Economics of Landscape and Wildlife Conservation, S. Dabbert, A.D., L. Slangen, M. Whitby (ed.). CAB International, Wallingford, UK.
Elsasser, P., J. Meyerhoff, J., C. Montagné, and A. Stenger, (2008): A bibliography and database on forest benefit valuation studies from Austria, France, Germany and Switzerland - a possible base for a concerted European approach, Journal of Forest Economics, forthcoming
Everett, R.D. (1979): The monetary value of the recreational benefits of wildlife, Journal of Environmental Management, 8:203-213.
Fredman, P., L. Emmelin (2001): Wilderness purism, willingness to pay and management preferences: a study of Swedish mountain tourists. Tourism Economics 7(1):5-20
Garrod, G.D. and K.G. Willis (1994): Valuing biodiversity and nature conservation at a local level. Biodiversity and Conservation 3, 555-565.
Garrod, G.D. and K.G. Willis (1997): "The Non-use Benefits of Enhancing Forest Biodiversity: A Contingent Ranking Study", Ecological Economics, 21, 45-61
Review of instruments and valuation methods for multifunctional forest policy
103
Garrod, G.D. and Willis, K.G. (1991): Some empirical estimates of forest amenity value. Countryside Change Working Paper 13, Countryside Change Unit, University of Newcastle upon Tyne.
Garrod, G.D. and Willis, K.G. (1991a): The hedonic price method and the valuation of countryside characteristics. Working Paper 14, Countryside Change Unit, University of Newcastle upon Tyne.
Garrod, G.D. and Willis, K.G. (1991b): The environmental economic impact of woodland: a two stage hedonic price model of the amenity value of forestry in Britain. Working Paper 19, Countryside Change Unit, University of Newcastle upon Tyne.
Garrod, G.D. and Willis, K.G. (1992a): Valuing goods' characteristics: an application of the hedonic price method to environmental attributes. Journal of Environmental Management, 34:59-76.
Garrod, G.D. and Willis, K.G. (1992b): The environmental impact of woodland: a two-stage hedonic price model of the amenity value of forestry in Britain. Applied Economics, 24:715-728.
Garrod, G.D. and Willis, K.G. (1992c): The amenity value of woodland in Great Britain: a comparison of economic estimates. Environmental and Resource Economics, 2:1-20.
Gatto, P. (1988): La valutazione economica del paesaggio forestale. Monti e Boschi, n.1 (pp.28-34)
Giergiczny M., (2006): Rekreacyjna wartość Białowieskiego Parku Narodowego [Recreational value of Bialowieza National Park], Working paper, Warsaw University 2006
Gundersen, V. S. and L. H. Frivold (2005): Integrating visual structures in urban siviculture: A review of Fennoscandian preference studies and a proposal for a zoning model. In V. S. Gundersen. Urban woodland management in Norway: Integrating aesthetic and ecological elements in siviculture. PhD Thesis 2005:34. Norwegian University of Life Sciences.
H.M. Treasury (1972): Forestry in Great Britain: An Interdepartmental Cost/Benefit Study, HMSO, London.
Hanley, N D and Ruffell, R J (1991): Recreational use values of woodland features. Report to the Forestry Commission, University of Stirling.
Hanley, N D and Ruffell, R J (1992): The valuation of forest characteristics, Working Paper 849, Institute for Economic Research, Queen's University, Kingston, Canada.
Hanley, N. and C. Spash. (1993): "The Protection of Ancient Woodlands", "Cost-benefit Analysis and the Environment," Nick Hanley and Clive Spash, Edward Elgar Publishing, Cheltenham, UK, 219-227 , 1993
Review of instruments and valuation methods for multifunctional forest policy
104
Hanley, N., K. Willis, N. Powe and M. Anderson (2002): "Valuing the Benefits of Biodiversity in Forests", Report to the Forestry Commission, Centre for Research in Environmental Appraisal and Management (CREAM), University of Newcastle.
Hanley, N.D. (1989): Valuing rural recreation benefits: an empirical comparison of two approaches, Journal of Agricultural Economics, 40(3): 361-374.
Hanley, N.D. and Common, M. (1987a): Estimating the recreation, wildlife and landscape benefits of forestry: preliminary results from a Scottish study, Department of Economics Discussion Paper 4o.141, Universityof Stirling.
Hanley, N.D. and Common, M. (1987b): Queen Elizabeth Forest Park Research Project: Final Report, Forestry Commission, Edinburgh.
Hanley, N.D. and Craig, S. (1991): Wilderness development decisions and the Krutilla-Fisher model: the case of Scotlands Flow Country. Ecological Economics, 4:145-164.
Hanley, N.D. and Ecotec Ltd (1990): Valuation of Environmental Effects: Final Report Stage One. Industry Department for Scotland and the Scottish Development Agency, Edinburgh.
Hanley, N.D. and Ecotec Ltd (1990): Valuation of Environmental Effects: Final Report Stage One. Industry Department for Scotland and the Scottish Development Agency, Edinburgh.
Hanley, N.D. and Ecotec Ltd (1991): The Valuation of Environmental Effects: Stage Two Final Report. The Scottish Office Industry Department and Scottish Enterprise, Edinburgh.
Hanley, N.D. and Munro, A. (1991): Design bias in contingent valuation studies: the impact of information, Discussion Paper in Economics 91/13, Department of Economics, University of Stirling.
Hanley, N.D. and Ruffell, R.J. (1991): Recreational use values of woodland features. Report to the Forestry Commission, University of Stirling.
Hartig (1804):
Hasler, B., C.K. Damgaard, E.H. Erichsen, J.J. Jørgensen, and H.E. Kristoffersen (2002): The Recreational Values of Forest, Lake and Nature Restoration, valuation of nature goods using the hedonic price method - De rekreative værdier af skov, sø og naturgenopretning. - værdisætning af naturgoder med husprismetoden". AKF Forlaget.
Hoen, H.F., and G. Winther (1993): Multiple-use forestry and preservation of coniferous forests in Norway: a study of attitudes and willingness-to-pay. Scandinavian Journal of Forest Research 8:266-280
Hoen, H.F., and K. Veisten (1994): A survey of the users of Oslomarka: attitudes towards forest scenary and forestry practices. Skogforsk 6/94.
Review of instruments and valuation methods for multifunctional forest policy
105
Holgen, P., L. Mattsson, and C.Z. Li (2000): Recreation values of boreal forest stand types and landscapes resulting from different silvicultural systems: an economic analysis. Journal of Environmental Management 60(2):173–180
Holmes, T. P., Boyle, and J. Kevin (2003): Stated Preference Methods for Valuation of Forest Attributes in: Sills, Erin O., Abt, Karen, Lee, eds. Forests in a market economy. Dordrecht, The Netherlands: Kluwer Academic Publishers.
Horne, P. (2006): Forest Owners’ Acceptance of Incentive Based Policy Instruments in Forest Biodiversity Conservation – A Choice Experiment Based Approach. Silva Fennica 40(1):169-178
Horne, P., P.C. Boxall, and W.L. Adamowicz (2005): Multiple-use management of forest recreation sites: a spatially explicit choice experiment. Forest Ecology and Management 207:189-199
Hörnsten, L., and P. Fredman (2000): On the distance to recreational forests in Sweden. Landscape and Urban Planning 51:1-10
Huhtala, A. (2004): What Price Recreation in Finland?-A Contingent Valuation Study of Non-Market Benefits of Public Outdoor Recreation Areas. Journal of Leisure Research 36(1):23-44
Humphreys, S.K. (1981): The socio-economic characteristics of respondents to recreation questionnaires in Gwydyr Forest, unpublished BSc dissertation, Department of Forestry and Wood Science, University College of North Wales, Bangor.
Hutchinson, W.G., (1995): "How Public Preferences Affect Non-Market Values For Afforestation in Ireland", Paper Presented to the Agricultural Economics Society of Ireland, Monday, 25 September 1995.
Johansson, P.O. (1989): Valuing public goods in a risky world: an experiment. P. 37-48 in Valuation Methods and Policy Making in Environmental Economics, Folmer, H., van Ierland, E.C. (ed.). Elsevier.
Johnston, R., J. (2007): Choice experiments, site similarities and benefit transfer, Environmental Resources Economics 38: 331-351
Kniivilä, M. (2004): Contingent valuation and cost-benefit analysis of nature conservation: a case study in North Karelia, Finland. D.Sc, University of Joensuu.
Kniivilä, M., V. Ovaskainen, and O. Saastamoinen (2002): Costs and benefits of forest conservation: regional and local comparisons in Eastern Finland. Journal of Forest Economics 8:131-150
Kristofersson, D. and Navrud, S. (2005): Validity Tests of Benefit Transfer – Are We Performing the Wrong Tests? Environmental and Resource Economics 30: 279-286
Kriström, B. (1989): On the benefits of preserving virgin forests in Sweden. Scandinavian Journal of Forest Research 30:141-166
Review of instruments and valuation methods for multifunctional forest policy
106
Kriström, B. (1990a): A nonparametric approach to the estimation of welfare measures in discrete response valuation studies. Land Economics 66(2):135–139
Kriström, B. (1990b): Valuing environmental benefits using the contingent valuation method - an econometric analysis. Ph.D., Umeå University, Umeå.
Le Goffe, P. (2000): "Hedonic Pricing of Agriculture and Forestry Externalities", Environmental and Resource Economics, 15 397-401
Lehtonen, E., J. Kuuluvainen, E. Pouta, M. Rekola, and C.-Z. Li (2003): Non-market benefits of forest conservation in southern Finland. Environmental Science & Policy 6:195-204
Lehtonen, E., J. Kuuluvainen, V. Ovaskainen, E. Pouta, and M. Rekola (2005): Influence of Logit Model Assumptions on Estimated Willingness to Pay for Forest Conservation in Southern Finland. Department of Forest Economics, University of Helsinki. Reports 35.
Leidal, K. (1996): Verdsetting av et bynært rekreasjonsområde: en betinget verdsettingsundersøkelse av området rundt Eigevannet i Kristiansand kommune (Valuation of an urban recreation area: a contingent valuation study of the Eige Lake area in Kristiansand municipality). Master Thesis, Norwegian University of Life Sciences.
León, C. (1994): La valoración contingente del paisaje de los parques naturales del centro-occidente de Gran Canaria. Universidad de las Palmas de Gran Canaria: PhD dissertation.
Leon, C.J, F.J. Vazquez-Polo, N. Guerra, and P. Riera (2002): A Bayesian model for benefit transfer: application to national parks in Spain, Applied Economics 34: 749-757
Leon, J. C., F. J. Vazquez-Polo, and R. L. Gonzales (2003): Elicitation of Expert Opinion in Benefit Transfer of Environmental Goods, Environmental and Resource Economics 26: 199-210
Leon-Gonzalez, R. and R. Scarpa (2008): Improving multi-site benefit functions via Bayesian model averaging: A new approuch to benefit transfer, Journal of Environmental Economics and Management, in press
Li, C. (1996): Semiparametric estimation of the binary choice model for contingent valuation. Land Economics 72:462-473
Li, C., and L. Mattson (1995): Discrete choice under preference uncertainty: An improved structual model for contingent valution. Journal of Environmental Economics and Management 28:256-269
Li, C., J. Kuuluvainen, E. Pouta, M. Rekola, and O. Tahvonen (2004): Using Choice Experiments to Value the Natura 2000 Nature Conservation Programs in Finland. Environmental & Resource Economics 29:361-374
Lindhagen, A. and L. Hörnsten (2000): 'Forest recreation in 1977 and 1997 in Sweden: Changes in public preferences and behaviour', Forestry 73: 143-153
Review of instruments and valuation methods for multifunctional forest policy
107
Lindhjem, H. (2007): 20 Years of stated preference valuation of non-timber benefits from Fennoscandian forests: A meta-analysis, Journal of Forest Economics 12: 251-277
Lindhjem, H. and S. Navrud (2008): How reliable are meta-analyses for international benefit transfers?, Ecological Economics 66 (2-3): 425-435.
Loomis J. B., H. T Le, A. Gonzales-Caban (2005): Testing transferability of willingness to pay for forest fire prevention among three states of California, Florida and Montana, Journal of Forest Economics 11: 125-140
Loomis, J. B. (1989): Test-retest reliability of the Contingent Valuation Method: A comparison of general population and visitor responses, American Journal of Agricultural Economics 71: 76-84
Loomis, J. B. (2005): Updated outdoor recreation use values on national forests and other public lands, U.S. Department of Agriculture & Forest Service
Lovett A. A., J. S. Brainard, and I. J. Bateman (1997): Improving benefit transfer demand functions: A GIS Approach Journal of Environmental Management 51: 373-389
Macmillan, D.C., E. Duff and D.A. Elston, (2001): "Modelling the Non-Market Environmental Costs and Benefits of Biodiversity Projects Using Contingent Valuation Data", Environmental and Resource Economics, 18(4), 391-410.
Mäntymaa, E., M. Mönkkönen, J. Siikamäki, and R. Svento (2002): Estimating the Demand for Biodiversity - Vagueness Band and Open-Ended Questions. in Risk and Uncertainty in Environmental and Resource Economics, Van Ierland, E.C., Weikard, H.P., Wesseler, J. (ed.).
Marangon F., Gottardo E. (2001): La valutazione monetaria del danno ai boschi del Friuli-Venezia Giulia. La valutazione dei beni ambientali come supporto alle decisioni pubbliche, pp.207-234.
Marangon F., Tempesta T., Visintin F. (2002): Stima del valore faunistico-venatorio del bosco in Friuli Venezia GiuliaNuove tipologie di impresa nell'agricoltura italiana. Atti del XXXIX Convegno di Studi SIDEA, Firenze, 12-14 settembre 2002.
Marinelli A., D. Romano (1984): L'analisi della domanda di recreazione all'aperto in foresta. Studi di Economia e di Diritto (2): 123-53
Marinelli, A., L. Casini, D. Romano (1990): Valutazione economica dell'impatto aggregato e dei benefici diretti della ricreazione all'aperto in un Parco Naturale della Toscana. Genio Rurale, n.9 (pp.51-58)
Matthews, D. I., W. G. Hutchison, and R. Scarpa (2007): Testing the stability of the benefit transfer function for discrete choice contingent valuation data, Working Paper in Economics 8/07, University of Waikato
Mattsson, L., and C. Li (1993): The non-timber value of Northern Swedish forests - an economic analysis. Scandinavian Journal of Forest Research 8:426-434
Review of instruments and valuation methods for multifunctional forest policy
108
Mattsson, L., and C.Z. Li (1994a): How do different forest management-practices affect the non-timer value of forests - an economic-analysis. Journal of Environmental Management 41:79-88
Mattsson, L., and C.Z. Li (1994b): Sample non-response in a contingent valuation survey – an empirical test of the effect on value inference Journal of Leisure Research 26(182-189)
Mavsar, R. and P. Riera (2007): Valoración económica de las principales externalidades de los bosques Mediterráneos Españoles. Final project report for the Ministry for environment of Spain.
Maxwell, S. (1992): Valuation of rural environmental improvements: a case study of the Marston Vale Community Forest Project using contingent valuation methodology, MSc Thesis, Department of Land Use, Silsoe College, Cranfield Institute of Technology.
MCPFE, UNECE and FAO (2007): State of Europe’s Forests 2007: The MCPFE report on sustainable forest management in Europe
Melichar J. (2007): Economic Valuation of Forest Quality Change in the Jizerske hory Mountains: the Evidence from Contingent Behavior Study, Paper submitted for presentation at the Ninth Annual Bioecon Conference, Kings College Cambridge, 20 - 21 September 2007.
Melichar, J., (2001): Ekonomická stránka problematiky kurovce v NP Šumava. (Infestation of the Spruce Bark-beetle - Economic View). In Šauer, P. et al., (eds.) Environmentální ekonomie, politika a vnejší vztahy Ceské republiky. 3. seminár doktroandských studentu a mladých vedeckých a výzkumných pracovníku. (Environmental Economics, Policy and International Environmental Relations. 3rd Seminar of Postgraduate Students, Young Scientists and Researchers). Prague: Nakladatelství a vydavatelství litomyšlského semináre, 2001. ISBN: 80-902168-7-0. 176-192. (in Czech)
Merlo M. (1982): Una valutazione della funzione ricreazionale dei boschi. Rivista di Economia Agraria/a. XXXVII, n.2, giugno 1982
Merlo M. (1982): Valutazione dei servizi ricreativo-ambientali dei boschi. Economia Montana (4): 3-11.
Merlo M., Signorello G. (1989): Alternative estimates of outdoor recreational benefits in Italy. Annual meeting of the European Association of Environmental and Resource Economists, Venezia.
Mill, G.A., T.M. van Rensburg, S. Hynes and C. Dooley (2007): "Preferences for Multiple Use Forest Management in Ireland: Citizen and Consumer Perspectives", Ecological Economics 60, no. 3, pp. 483-666.
Mogas, J. and P. Riera (2003): Validación del experimento de elección en la transferencia de beneficios. Hacienda Pública Española/Revista de Economía Pública 165-(2/2003):79-95

Review of instruments and valuation methods for multifunctional forest policy
109
Moons E., B. Saveyen, S. Proost, and M. Hermy (2008): Optimal location of New forests in a suburban region, Journal of Forest Economics 14: 5-27
Moons, E (1999): "Estimation of the Recreational Value of a Forest", Master of Science in Economics thesis, Department of Economics, Catholic University Leuven, Belgium.
Nagypal, N. C., (2005): Review of Environmental Valuation Studies in Hungary (records based on own research of Szerényi, M. and Nagypal, N. C.). Department of Environmental Economics, Budapest University of Technology and Economics, March 2005.
Navrud, S. and R. Brouwer (2007): Good practise guidlelines in benefis transfer of forest externalities, COST Action E45, European Forest Externalities, Euroforex
Navrud, S. and R. Ready, ed. (2007): Environmental value transfer: issues and methods, Springer
Nielsen, A.B., S.B. Olsen, and T. Lundhede (2007): An economic valuation of the recreational benefits associated with nature-based forest management practices. Landscape and Urban Planning 80:63-71
Notaro S., Raffaelli R., Gios G. (2001): Una valutazione economica del valore paesaggistico del cipresso (Cupressus sempervirens) nell’Alto Garda. Atti del Convegno "La valutazione dei beni ambientali come supporto alle decisioni pubbliche. Una riflessione alla luce della noemativa comunitaria e nazionale", Agripolis-Legnaro (PD)
Notaro S., Signorello G. (1999): Elicitation effects in contingent valuation: a comparison among MB, DB, SB and OE formats. Working paper.
Nunes, P. , J. Van den Bergh, and P. Nijkamp (2003): The ecological economics of biodiversity: Methods and policy applications., Edward Elgar
Nuvoli, F., S.M. Pittalis, and P. Pulina (1997): L'applicazione della "contingent valuation" ad un bene ambientale: il caso della pineta di Platamona nel sassarese. Annali della Facoltà di Economia, Università di Sassari, Nuova serie, vol.XII, Anno Accademico 1996-1997.
Olsen, S.B., and T. Lundhede (2005): Rekreative værdier ved konvertering til naturnær skovdrift. En ærdisætningsunder-søgelse udført vha. metoden Discrete Choice Experiments. Akf-forlaget.
Olsson, C. (1993): Linbanan i Norsjö - en skogsinriktad turistattraktion. En undersökning av besökarnas betalningsvilja för att uppleva skog och natur. Master, Umeå University, Umeå.
Oosterhuis, F.H. and J.W. van der Linden, (1987): "Benefits of Preventing Damage to Dutch Forests: An Application of the Contingent Valuation Method", Paper presented at the congress "Environmental Policy in a Market Economy" Wageningen , 1987
Review of instruments and valuation methods for multifunctional forest policy
110
Ovaskainen, V., and M. Kniivilä (2005): Consumer versus citizen preferences in contingent valuation: evidence on the role of question framing. The Australian Journal of Agricultural and Resource Economics 49:379-394
Ovaskainen, V., J. Mikkola, and E. Pouta (2001): Estimating Recreation Demand with On-site Data: An Application of Truncated and Endogenously Stratified Count Data Models. Journal of Forest Economics 7(2):125-144
Pearce D. (2001): Valuing biological diversity: issues and overview. In: OECD, Valuation of Biodiversity Benefits: Selected Studies, OECD,Paris, Chapter 2.
Pearce D. and C. Pearce (2001): the value of forest ecosystems: a report to the secretariat convention on biological diversity. University College London, London
Perali F. (1998): Analisi integrata della Valutazione dei Beni Pubblici. Studio di Metodologie per la Pianificazione e la Gestione Multifunzionale dei Complessi Demaniali e delle Riserve Naturali gestite dell'Azienda Regionale delle Foreste Regione Lombardia
Pérez y Pérez, L. (1997): Tipología de visitantes y valoración ambiental del Parque Natural Posets-Maladeta. Diputación General de Aragón, Servicio de Investigación Agroalimentaria
Pérez y Pérez, L., J. Barreiro, M. Sánchez and M. Azpilicueta (1996): La valeur d'usage à des fins de loisir des espaces protégés en Espagne. Comparision entre méthode des côuts de déplacement et méthode d'evaluation contingente. Cahiers d'Economie et Sociologie Rurales, nº 41, pp. 40-56
Pouta, E. (2004): Attitude and belief questions as a source of context effect in a contingent valuation survey. Journal of Economic Psychology 25:229-242
Pouta, E. (2005): Sensitivity to scope of environmental regulation in contingent valuation of forest cutting practices in Finland. Forest Policy and Economics 7:539– 550
Pouta, E., M. Rekola, J. Kuuluvainen, C.-Z. Li, and O. Tahvonen (2002): Willingness to pay in different policy-planning methods: insights into respondents' decision-making processes. Ecological Economics 40:295-311
Pouta, E., M. Rekola, J. Kuuluvainen, O. Tahvonen, and C. Li (2000): Contingent valuation of the Natura 2000 nature conservation programme in Finland. Forestry 73:119-128
Powe, N. A. and K. G. Willis. (2004): Mortality and Morbidity Benefits of Air Pollution (SO2 and PM10) Absorption Attributable to Woodland in Britain. Journal of Environmental Management 70 (2): 119-128.
Price, C., Christensen, J.B. and Humphreys, S.K. (1986): Elasticities of demand for recreation site and recreation experience, Environment and Planning A, 18:1259-1263.
Review of instruments and valuation methods for multifunctional forest policy
111
Ready, R. and Navrud, S. (2006): International benefit transfer: Methods and validity tests, Ecological Economics 60: 429-434.
Rebolledo, D. and L. Pérez y Pérez (1994): Valoración contingente de bienes ambientales: aplicación al Parque Natural de la Dehesa del Moncayo. Diputación General de Aragón, Servicio de Investigación Agraria, Unidad de Economía y Sociología Agrarias (Documento de trabajo 94/6)
Rekola, M., and E. Pouta (2005): Public preferences for uncertain regeneration cuttings: a contingent valuation experiment involving Finnish private forests. Forest Policy and Economics 7:635-649
Rekola, M., E. Pouta, J. Kuuluvainen, O. Tahvonen, and C.Z. Li (2000): Incommensurable preferences in contingent valuation: the case of Natura 2000 Network in Finland. Environmental Conservation 27(3):260-268
Ribe, R. G. (1989): The aesthetics of forestry: what have empirical preference research taught us? Environmental Management 13: 55-74.
Riera, P. and J. Mogas (2004): Evaluation of a risk reduction in forest fires in a Mediterranean region. Forest Policy and Economics 6 (2004) 521-528
Riera, P., C. Descalzi and A. Ruiz (1995): El valor de los espacios de interés natural en España. Aplicación de los métodos de valoración contingente y el coste del desplazamiento. Revista Epañola de Economía. Número monográfico sobre Recursos Naturales y Medio Ambiente
Rittmaster R., W.L. Adamowicz, B. Amiro and R.T. Pelletier (2006): Economic analysis of health effects from forest fires, Canadian Journal of Forest Research 36: 868-877
Romano D., Rossi M. (1994): La valutazione economica del trekking sull'appennino tosco-romagnolo: un confronto fra approcci non di mercato. Ce.S.E.T.
Rosenberger, R. S. and J. B. Loomis (2000): Using meta-analysis for benefit transfer: In-sample convergent validity tests of an outdoor recreation database, Water Resources Research 36(4): 1097-1107
Rosenberger, R. S. and Loomis, J. B. (2001): Benefit transfer of outdoor use values. A technical document supporting the Forest Strategic Plan (2000 revision), U.S. Department of Agriculture & Forest Service
Rosenberger, R. S. and T. D. Stanley (2006): Measurement, generalization, and publication: Sources of error in benefit transfers and their management, Ecological Economics 60: 372-378
Sandsbråten, L. (1997): Verdsetting av miljøgoder i Oslomarka: en betinget verdsettingsundersøkelse i privat og kommunal skog i Indre Oslomarka (Valuation of environmental goods in Oslomarka: a contingent valuation survey of private and municipality owned forest in inner Oslomarka). Master Thesis, Norwegian University of Life Sciences.
Review of instruments and valuation methods for multifunctional forest policy
112
Santos, J. M. L. (2007): Transferring landscape values: How and how accurately?, in: S. Navrud and R. Ready, ed., Environmental value transfer: issues and methods, Springer
Scarpa R., W. G. Hutchinson, S. M. Chilton, J. Buongiorno (2007): Benefit value transfers conditional on site attributes: some evidence of reliability from forest recreation, in: S. Navrud and R. Ready, ed., Environmental value transfer: issues and methods, Springer
Scarpa, R. (2003): “The Recreational Value of Woodland In Great Britain” Report to The Forestry Commission, Edinburgh, by Centre for Research in Environmental Appraisal & Management, University of Newcastle.
Scarpa, R., Hutchinson W. G. and Chilton S.M. (2000a): Benefits From Forest Recreation: Flexible Functional Forms For WTP Distributions. Journal of Forest Economics, 6(1): 41-54.
Scarpa, R., Hutchinson, W.G., Chilton, S. and Buongiorno, J. (2007): Reliability of Benefit Value Transfers from Contingent Valuation Data with Forest-Specific Attributes. Chapter 10 in Environmental value transfer: issues and methods. Edited by Ståle Navrud and Richard Ready, Springer Publisher.
Scarpa, R., S.M. Chilton, W.G. Hutchinson, J. Buongiorno (2000a): "Valuing the Recreational Benefits from the Creation of Nature Reserves in Irish Forests", Ecological Economics 33, 237-250 ,
Scarpa, R., W. G. Hutchinson, S. M. Chilton and J. Buongiorno. (2000b). Importance of Forest Attributes in the Willingness To Pay for Recreation: A Contingent Valuation Study of Irish Forests. Forest Policy and Economics. December, 1(3-4):315-329
Scherrer S. (2002): "Les pertes d'usage récréatif du patrimoine forestier après les tempêtes de 1999: le cas de la forêt de Fontainebleau", Economie et Statistique n°357-358, 153-171
Scherrer, S. (2003): "Evaluation économique des aménités récréatives d'une zone humide intérieure : le cas du lac du Der", Working paper, Department of economic studies and environmental valuation, French Ministry of Environment
Shrestha, R. K. and J. B. Loomis (2001): Testing a meta-analysis model for benefit transfer in international outdoor recreation, Ecological Economics 39: 67-83
Shrestha, R. K. and J. B. Loomis (2003): Meta-analytic benefit transfer of outdoor recreation economic values: testing out-of-sample convergent validity, Environmental & Resource Economics 25: 79-100
Signorello G. (2005a): Analisi Costi-Benefici della trasformazione di un'area boschiva degradata a parco ricreativo. Sintesi degli studi di valutazione economica del valore d'uso per fini ricreativi delle risorse naturali in Sicilia
Signorello G. (2005b): La valutazione dei benefici economici della Riserva Naturale "Monte Soro" (ME). Sintesi degli studi di valutazione economica del valore d'uso per fini ricreativi delle risorse naturali in Sicilia

Review of instruments and valuation methods for multifunctional forest policy
113
Signorello G. (2005c): Stima della disponibilità a pagare per la fruizione della pineta di Randello (RG). Sintesi degli studi di valutazione economica del valore d'uso per fini ricreativi delle risorse naturali in Sicilia
Signorello G. (2005d): Stima del valore ricreativo dell'area attrezzata "Ronza" (EN). Sintesi degli studi di valutazione economica del valore d'uso per fini ricreativi delle risorse naturali in Sicilia
Siikamaki, J., and D.F. Layton (2006): Discrete choice survey experiments: A comparison using flexible methods. Journal of Environmental Economics and Management 53:122-139
Simensen, K., and M. Wind (1990): Holdninger til og betalingsvillighet for ulike skogbehandlinger i fjellskog: En empirisk undersøkelse av hirkjølen statsallmenning (attitudes and wtp for different forestry practices in mountainous forests: a survey of the hirkjolen common). Master Thesis, Norwegian University of Life Sciences.
Šišák, L., Pulkrab, K., Kalivoda, V. (1997): Význam návštevnosti lesa a sberu hlavních lesních plodin obyvateli území s lesy výrazne postiženými imisemi. (Importance of Forest Frequentation and of Main Non-wood Forest Product Collection by Inhabitants in Regions with Forests Considerably Afflicted by Immissions). Lesnictví - Forestry, 43, 245-258.
Skagestad, E. (1996): Friluftsliv og Skogbruk – En spørreundersøkelse blant turgjengere i ytre Oslomarka, Romeriksåsen, på vinterstid (Recreation and forestry – a survey of hikers in the outer Oslomarka, Romeriksåsen, in the winter time). Master Thesis, Norwegian University of Life Sciences.
SLF (2009): Norwegian Agricultural Authority (Statens landbruksforskning) http://www.slf.dep.no (accessed 09.11.09)
Smith, V. K., Pattanayak, S. K. and G., L., Van Houtven (2006): Structural benefit transfer: An example using VSL estimates, Ecological economics 60: 361-371
Soini, E., and P. Horne. (2005): Status Quo Bias in Choice Experiment Method - A Case Study of Forest Owners' Acceptance of Biodiversity Conservation Contracts. in the 7th International BIOECON Conference on Economics and the Analysis of Ecology and Biodiversity, Kings College Cambridge.
Solberg, B., Rykowski, K., (2000): Institutional and Legal Framework for Forest Policies in ECA Region and Selected OECD Countries - a Comparative Analysis, The World Bank Group, Forest Policy and Strategy Development: Analytical Studies/Issues Paper; http://wbln0018.worldbank.org/essd/forestpol-e.nsf
Sykes, M.T. and Prentice,I.C. (1995): Boreal forest future: modeling the controls on tree species range limits and transient responses to climate change. Water, Air and Soil Pollution, No 2: 415-428
Tempesta T. (1996): Il valore turistico-ricreativo del Bosco della Fontana (MN). Criteri e metodi di analisi del valore ricreativo del territorio (pp.85-116).

Review of instruments and valuation methods for multifunctional forest policy
114
Tempesta T., Thiene M. (1998): Problematiche metodologiche ed operative nella stima dei beni ambientali. Atti convegno Ce.S.E.T., Padova.
Tempesta T., Marangon F. (2004): Stima del valore economico totale dei paesaggi forestali italiani tramite valutazione contingente. Genio Rurale, n. 11 (pp. 32-43)
Tempesta T., Visintin F., Rizzi L., Marangon F. (2002): Il valore ricreativo dei paesaggi forestali. Rivista di Economia Agraria
Tirendi D. (2003): Valutazione di contingenza per la stima delle risorse culturali ed ambientali. Genio Rurale, n.5
Tranter, R.B., Bennett, R.M. and Beard, N.F. (1994): Valuing woodland walks, Countryside Recreation Network News, 2(2):4-5.
Troy, A. and M., Wilson (2006): Mapping ecosystem services: Practical challenges and opportunities in linking GIS and value transfer, Ecological economics 60: 435-449
Tyrväinen, L. (1997): The amenity value of the urban forest: an application of the hedonic pricing method. Landscape and Urban Planning 37(3-4):211-222
Tyrväinen, L. (2001): Economic valuation of urban forest benefits in Finland. Journal of Environmental Management 62:75-92
Tyrvainen, L., and A. Miettinen (2000): Property Prices and Urban Forest Amenities. Journal of Environmental Economics and Management 39:205-223
Tyrväinen, L., and H. Väänänen (1998): The economic value of urban forest amenities: an application of the contingent valuation method. Landscape and Urban Planning 43:105-118
UNECE/FAO European Forest Sector Outlook Study (2005): 1960 – 2000 – 2020. Main report, Geneva
Van Houtven, G., J. Powers and S. K. Pattanayak (2007): Valuing water quality improvements using meta-analysis: Is the glass half-full or half-empty for national policy analysis?, Resource and Energy Economics 29 (3): 206-228
Veisten, K. (1993): Samfunnsøkonomisk verdsetting av (a oppretthalde artsmangfaldet i norske skogar: med testing for feilkilder ved betinga verdsetting (Social valuation of the preserving biodiversity in Norwegian forests: with multiple bias testing). SNF. 8/1993.
Veisten, K., and H.F. Hoen (1994): Om haldningar til - og betalingsvilje for endringar i skogbehandlinga i Noreg: resultat frå to nasjonale undersøkingar (On attitudes and WTP for changes in forest practices in Norway: Resukts from two national surveys). Skogforsk. 4/94.
Veisten, K., and S. Navrudb (2006): Contingent valuation and actual payment for voluntarily provided passive-use values: Assessing the effect of an mechanism and elicitation formatsinduced truth-telling. Applied Economics 38:735-756
Review of instruments and valuation methods for multifunctional forest policy
115
Veisten, K., H.F. Hoen, and J. Strand (2004b): Sequencing and the Adding-up Property in Contingent Valuation of Endangered Species: Are Contingent Non-Use Values Economic Values? . Environmental & Resource Economics 29:419-433
Veisten, K., H.F. Hoen, S. Navrud, and J. Strand (1993): Valuing biodiversity in Norwegian forests: a contingent valuation study with multiple bias testing. Department of Economics, University of Oslo.
Veisten, K., H.F. Hoen, S. Navrud, and J. Strand (2004a): Scope insensitivity in contingent valuation of complex environmental amenities. Journal of Environmental Management 73:317-331
White, P.C.L. and J.C. Lovett (1999): "Public Preference and Willingness-to-Pay for Nature Conservation in North York Moors National Park, UK", Journal of Environmental Management 55, 1-13.
Whiteman, A. and Sinclair, J. (1994): The Costs and Benefits of Planting Three Community Forests: Forest of Mercia, Thames Chase and Great North Forest, Policy Studies Division, Forestry Commission, Edinburgh.
Willis K.G., Benson, J.F and Whitby, M.C. (1988): Values of user benefits of forest recreation and wildlife. Report to the Forestry Commission, Department of Town and County Planning, University of Newcastle upon Tyne.
Willis K.G., Benson, J.F and Whitby, M.C. (1988): Values of user benefits of forest recreation and wildlife. Report to the Forestry Commission, Department of Town and County Planning, University of Newcastle upon Tyne.
Willis, K. G., G. Garrod, R. Scarpa, N. Powe, A. Lovett, I. Bateman, N. Hanley and D. Macmillan, (2003): "The Social and Environmental Benefits of Forests in Great Britain", Centre for Research in Environmental Appraisal & Management, University of Newcastle. Landscape Value of Forests and Woodland.
Willis, K., G. Garrod, R. Scarpa, N. Powe, A. Lovett, J. I. Bateman, N. Hanley, and D. C. Macmillan (2003): The social and environmental benefits of forests in Great Britain, Report to Forestry Commission, Edinburgh
Willis, K.G. (1990): Aggregate recreation benefits of forestry, in Whitby, M.C. and Dawson, P.J. (eds) Land Use for Agriculture, Forestry and Rural Development. Proceedings of the 20th Symposium of the European Association of Agricultural Economists, July 1989, Newcastle upon Tyne. Department of Agricultural Economics and Food Marketing, The University, Newcastle upon Tyne.
Willis, K.G. (1991): The recreational value of the Forestry Commission estate in Great Britain: a Clawson-Knetsch travel cost analysis. Scottish Journal of Political Economy, 38(1):58-75.
Willis, K.G. and Benson, J.F. (1989): Recreational Values of Forests, Forestry, Vol 62, No. 2, 1989
Willis, K.G. and Benson, J.F. (1989): Values of user benefits of forest recreation: some further site surveys. Report to the Forestry Commission, Department of Town and County Planning. University of Newcastle upon Tyne.
Review of instruments and valuation methods for multifunctional forest policy
116
Willis, K.G. and Benson, J.F. (1989b): Values of user benefits of forest recreation: some further site surveys. Report to the Forestry Commission, Department of Town and County Planning. University of Newcastle upon Tyne.
Willis, K.G. and Garrod, G.D. (1991): An individual travel cost method of evaluating forest recreation, Journal of Agricultural Economics, 42(1):33-41.
Wilson, M. and J. Hoehn (2006): Valuing environmental goods and services using benefit transfer: The state-of-the art and science, Ecological economics 60: 335-342
Young, R. A. (2004): Determining the economic value of water. Concepts and methods, Resources for Future, Washington, DC, USA
Zandersen, M., M. Termansen, and F.S. Jensen (2007b): Evaluating approaches to predict recreation values of new forest sites, Journal of Forest Economics 13: 103-128
Zandersen, M., M., Termansen, and F.S. Jansen (2007a): Testing benefits transfer of forest recreation values over a 20-year time horizon, Land Economics 83(3): 412-440
EU; (2003): Sustainable forestry and the European Union; European Communities, 2003
FAO,( 2000): FAO strategic plan for forestry; FAO; Rome 2000
Jeanrenaud S. (2001): Communities and forest management in western Europe: A Regional Profile of the Working Group on Community Involvement in Forest Management (Forests, people and policies); ICUN; 2001
Kennedy J.; Thomas W.; Glueck P. (2001): Evolving forestry and rural development beliefs at midpoint and close of the 20th century; Forest Policy and Economics 3 (2001) 81-85
Morandini, R. (1996): A modern forest-dependent community: the Magnifica Comunità di Fiemme in Italy. Unasylva FAO, vol. 47 no 186; p. 47-52
Płotkowski L. (2005): Geneza, cel i synteza wyników badań nad znaczeniem leśnictwa w rozwoju obszarów wiejskich; Sylwan no 2: 60−72, 2005
Putnam, R. D (1993): Making democracy work: Civic traditions in modern Italy. Princeton, NJ: Princeton University Press
Sikor T. (2006): Analyzing community-based forestry: local, political and agrarian perspectives; Forest Policy and Economics 8(2006) 339-349 Leskinen L. A. (2004); Purposes and challenges of public participation in regional and local forestry in Finland; Forest Policy and Economics, Volume 6, Issue 6, October 2004, Pages 605-618
Zingari P. (2000): Sustainably Balancing Downstream and Upstream Benfits in
European Mountain Forest Communities
Review of instruments and valuation methods for multifunctional forest policy
117
ANNEX: Summary of forest valuation studies in Europe
A brief summary of most European forest externalities studies is presented in this paragraph (Annex 1). Meaning of the acronyms and a brief summary of the used descriptors is provided below (descriptors names in capital letters).
• AUTHOR - author and year of publication
• COUNTRY - country where the study took place
• FOREST NAME
• VALUATION METHOD
CVM – contingent valuation method, a method determining money measures of change in welfare by describing a hypothetical situation to respondents and eliciting how much they would be willing to pay either to obtain or to avoid a situation.
CBM – contingent behaviour method, CB studies present individuals with scenarios in which they are asked about what they would do if they were faced with a hypothetical situation.
CE – choice experiment - a stated preference technique for valuing ecosystems or environmental resources that presents a series of alternative resource or ecosystem use options, each of which is defined by various attributes including price, and uses the choices of respondents as an indication of the value of attributes. In CE exercise respondents are asked to select the most preferred alternative. Choice experiments do not directly ask for willingness to pay; this is inferred from tradeoffs that include cost as an attribute
CR - Contingent Ranking, is a variant of CE; instead of selecting one most preferred alternative, respondents are asked to order them.
TCM – Travel Cost Method, derives values by evaluating expenditures of recreators. Travel costs are used as proxy for price in deriving demand curves for the recreation site. There are different variants of TCM, two most popular ones are:
ITC – Individual Travel Cost (dependant variable: trips to a site by individual people)
ZTC – Zonal Travel Cost (dependant variable: trips to a site by classes of people)
AE/MP – Actual Expenditure/ Market price
HP – Hedonic pricing - Derives values by decomposing market prices into components encompassing environmental and other characteristics through studying property values, wages and other phenomena. The premise of the approach is that the value of an asset depends on the stream of benefits derived, including environmental amenities.
• ELICITATION METHOD

Review of instruments and valuation methods for multifunctional forest policy
118
DC - Dichotomous choice – (or referendum style) presents respondents with a single bid value that they can either accept or reject. There are following variants of DC elicitation method: DB-DC Double bounded dichotomous choice – if respondent answered Yes/No to first question is asked to accept or reject a higher/lower bid; OOHB - One and One half bound Dichotomous Choice variant of DB-DC in which respondents only approximately in 50% cases are asked second valuation question; MB-DC is like DB-DC with the only difference that valuation question is repeated more than two times.
IB - Iterative bidding game - respondents are asked whether they would be willing to pay a given amount. Depending upon whether the respondent says yes or no to the initial amount, it is successively doubled or halved until the respondent switches his response from inclusion or exclusion (or vice versa)
OE - Open ended – approach in which respondents are asked to state their maximum willingness to pay.
PC - payment card – respondents are presented with a range of values and are asked to choose their maximum willingness to pay out of it.
• MEAN WTP,
In case of both revealed and stated preference studies, obtained estimates of WTP or CS depend on different factors: functional form, including or excluding some variables, assumptions with respect to the error term and many others. Since main aim of this chapter is to give a general overview, only ranges of estimates are reported, without specifying methodological details. In case of some studies mean WTP or CS was derived for more than just one forest. Also in these cases only ranges of estimates are reported.
• YEAR , year in which WTP or CS measure were derived
• CURRENCY
• WHAT IS VALUED, brief description of the valuation object
WTP - Willingness To Pay: Maximum amount of money one would give up to buy some good.
CS - Consumer Surplus : the difference between what a person would be willing to pay and what he actually has to pay to buy a certain amount of a good
• WHO PAYS
p/pers/v – per person per visit
p/housh – per haushold, one-off payment
p/pers - per person, one-off payment
p/pers/m – per person per month
p/pers/y - per person per year
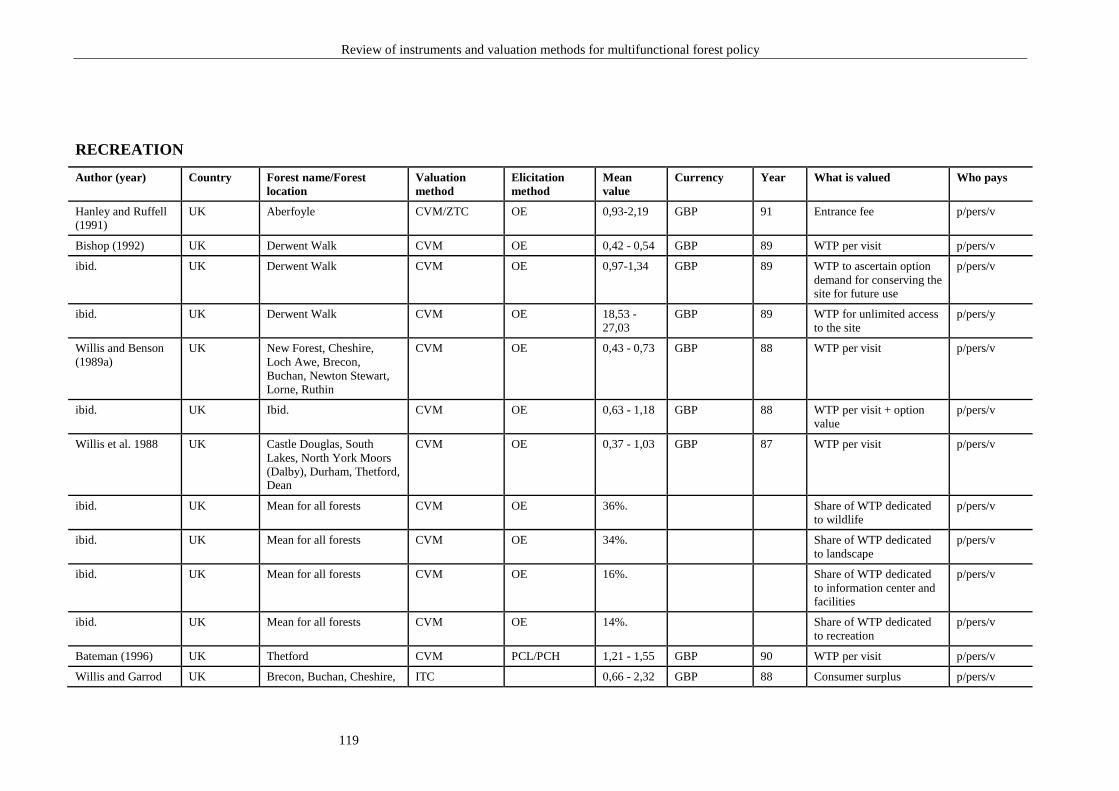
Review of instruments and valuation methods for multifunctional forest policy
119
RECREATION
Author (year) Country Forest name/Forest location
Valuation method
Elicitation method
Mean value
Currency Year What is valued Who pays
Hanley and Ruffell (1991)
UK Aberfoyle CVM/ZTC OE 0,93-2,19 GBP 91 Entrance fee p/pers/v
Bishop (1992) UK Derwent Walk CVM OE 0,42 - 0,54 GBP 89 WTP per visit p/pers/v
ibid. UK Derwent Walk CVM OE 0,97-1,34 GBP 89 WTP to ascertain option demand for conserving the site for future use
p/pers/v
ibid. UK Derwent Walk CVM OE 18,53 - 27,03
GBP 89 WTP for unlimited access to the site
p/pers/y
Willis and Benson (1989a)
UK New Forest, Cheshire, Loch Awe, Brecon, Buchan, Newton Stewart, Lorne, Ruthin
CVM OE 0,43 - 0,73 GBP 88 WTP per visit p/pers/v
ibid. UK Ibid. CVM OE 0,63 - 1,18 GBP 88 WTP per visit + option value
p/pers/v
Willis et al. 1988 UK Castle Douglas, South Lakes, North York Moors (Dalby), Durham, Thetford, Dean
CVM OE 0,37 - 1,03 GBP 87 WTP per visit p/pers/v
ibid. UK Mean for all forests CVM OE 36%. Share of WTP dedicated to wildlife
p/pers/v
ibid. UK Mean for all forests CVM OE 34%. Share of WTP dedicated to landscape
p/pers/v
ibid. UK Mean for all forests CVM OE 16%. Share of WTP dedicated to information center and facilities
p/pers/v
ibid. UK Mean for all forests CVM OE 14%. Share of WTP dedicated to recreation
p/pers/v
Bateman (1996) UK Thetford CVM PCL/PCH 1,21 - 1,55 GBP 90 WTP per visit p/pers/v
Willis and Garrod UK Brecon, Buchan, Cheshire, ITC 0,66 - 2,32 GBP 88 Consumer surplus p/pers/v
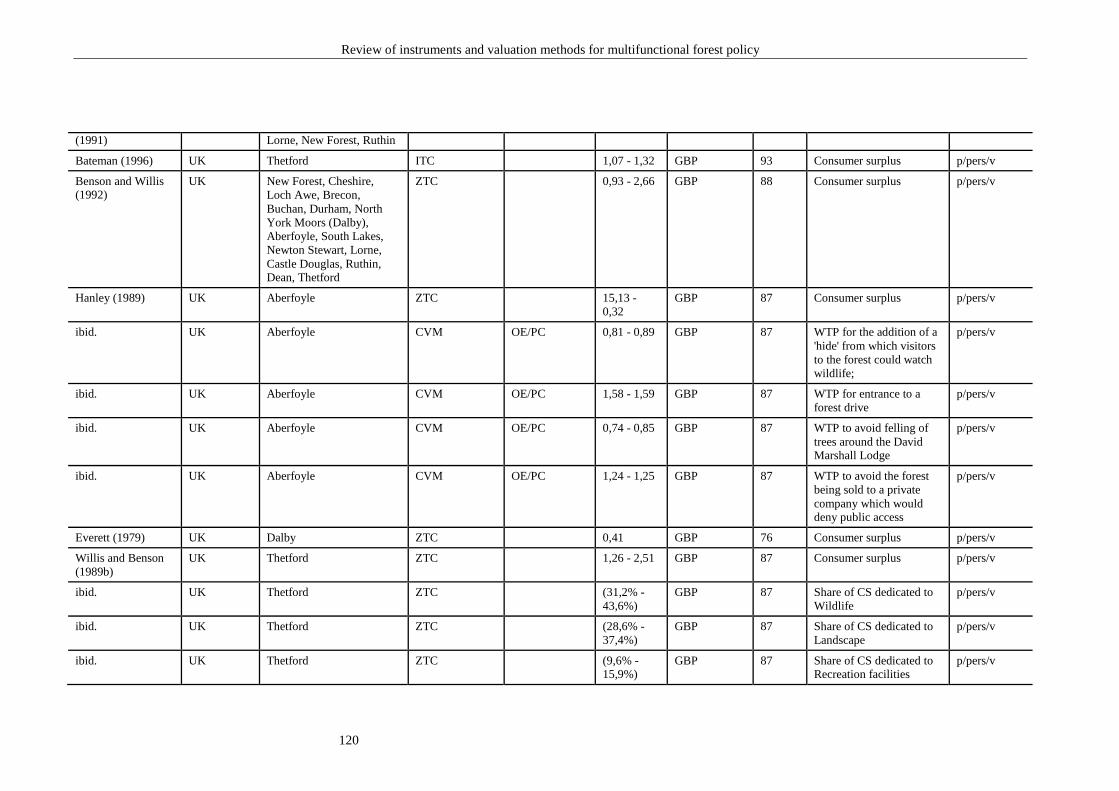
Review of instruments and valuation methods for multifunctional forest policy
120
(1991) Lorne, New Forest, Ruthin
Bateman (1996) UK Thetford ITC 1,07 - 1,32 GBP 93 Consumer surplus p/pers/v
Benson and Willis (1992)
UK New Forest, Cheshire, Loch Awe, Brecon, Buchan, Durham, North York Moors (Dalby), Aberfoyle, South Lakes, Newton Stewart, Lorne, Castle Douglas, Ruthin, Dean, Thetford
ZTC 0,93 - 2,66 GBP 88 Consumer surplus p/pers/v
Hanley (1989) UK Aberfoyle ZTC 15,13 - 0,32
GBP 87 Consumer surplus p/pers/v
ibid. UK Aberfoyle CVM OE/PC 0,81 - 0,89 GBP 87 WTP for the addition of a 'hide' from which visitors to the forest could watch wildlife;
p/pers/v
ibid. UK Aberfoyle CVM OE/PC 1,58 - 1,59 GBP 87 WTP for entrance to a forest drive
p/pers/v
ibid. UK Aberfoyle CVM OE/PC 0,74 - 0,85 GBP 87 WTP to avoid felling of trees around the David Marshall Lodge
p/pers/v
ibid. UK Aberfoyle CVM OE/PC 1,24 - 1,25 GBP 87 WTP to avoid the forest being sold to a private company which would deny public access
p/pers/v
Everett (1979) UK Dalby ZTC 0,41 GBP 76 Consumer surplus p/pers/v
Willis and Benson (1989b)
UK Thetford ZTC 1,26 - 2,51 GBP 87 Consumer surplus p/pers/v
ibid. UK Thetford ZTC (31,2% - 43,6%)
GBP 87 Share of CS dedicated to Wildlife
p/pers/v
ibid. UK Thetford ZTC (28,6% - 37,4%)
GBP 87 Share of CS dedicated to Landscape
p/pers/v
ibid. UK Thetford ZTC (9,6% - 15,9%)
GBP 87 Share of CS dedicated to Recreation facilities
p/pers/v
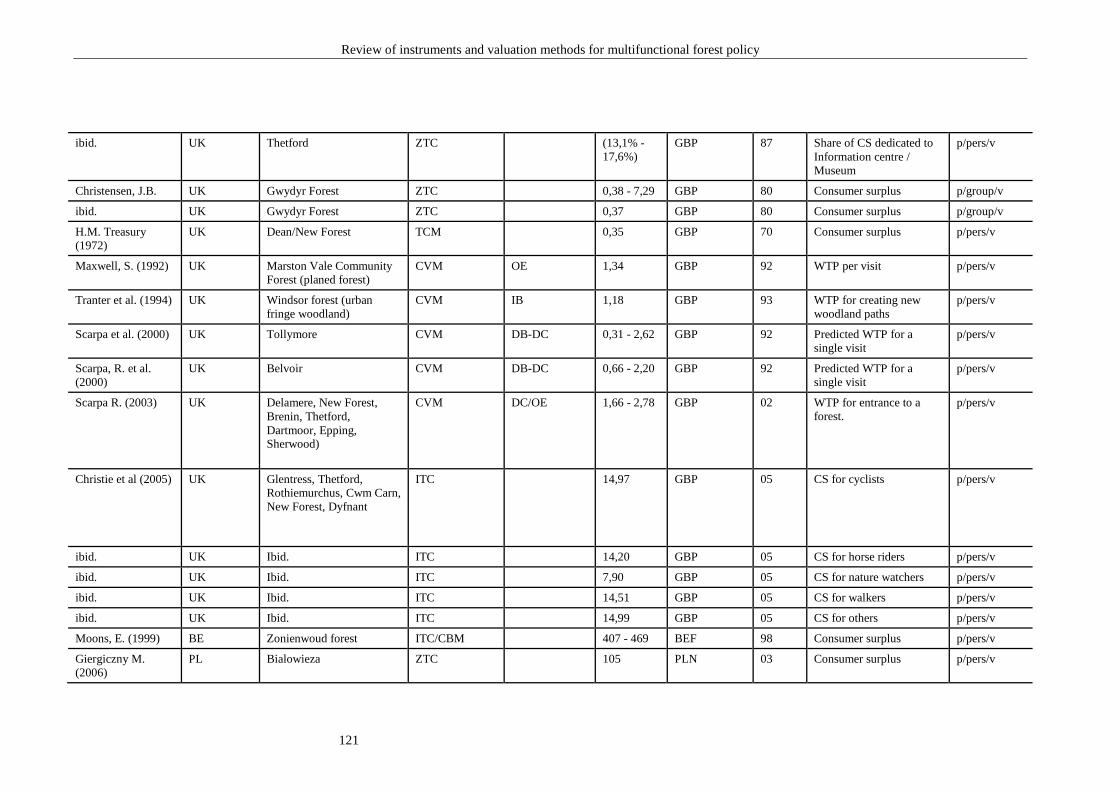
Review of instruments and valuation methods for multifunctional forest policy
121
ibid. UK Thetford ZTC (13,1% - 17,6%)
GBP 87 Share of CS dedicated to Information centre / Museum
p/pers/v
Christensen, J.B. UK Gwydyr Forest ZTC 0,38 - 7,29 GBP 80 Consumer surplus p/group/v
ibid. UK Gwydyr Forest ZTC 0,37 GBP 80 Consumer surplus p/group/v
H.M. Treasury (1972)
UK Dean/New Forest TCM 0,35 GBP 70 Consumer surplus p/pers/v
Maxwell, S. (1992) UK Marston Vale Community Forest (planed forest)
CVM OE 1,34 GBP 92 WTP per visit p/pers/v
Tranter et al. (1994) UK Windsor forest (urban fringe woodland)
CVM IB 1,18 GBP 93 WTP for creating new woodland paths
p/pers/v
Scarpa et al. (2000) UK Tollymore CVM DB-DC 0,31 - 2,62 GBP 92 Predicted WTP for a single visit
p/pers/v
Scarpa, R. et al. (2000)
UK Belvoir CVM DB-DC 0,66 - 2,20 GBP 92 Predicted WTP for a single visit
p/pers/v
Scarpa R. (2003) UK Delamere, New Forest, Brenin, Thetford, Dartmoor, Epping, Sherwood)
CVM DC/OE 1,66 - 2,78 GBP 02 WTP for entrance to a forest.
p/pers/v
Christie et al (2005)
UK
Glentress, Thetford, Rothiemurchus, Cwm Carn, New Forest, Dyfnant
ITC
14,97
GBP
05
CS for cyclists
p/pers/v
ibid. UK Ibid. ITC 14,20 GBP 05 CS for horse riders p/pers/v
ibid. UK Ibid. ITC 7,90 GBP 05 CS for nature watchers p/pers/v
ibid. UK Ibid. ITC 14,51 GBP 05 CS for walkers p/pers/v
ibid. UK Ibid. ITC 14,99 GBP 05 CS for others p/pers/v
Moons, E. (1999) BE Zonienwoud forest ITC/CBM 407 - 469 BEF 98 Consumer surplus p/pers/v
Giergiczny M. (2006)
PL Bialowieza ZTC 105 PLN 03 Consumer surplus p/pers/v
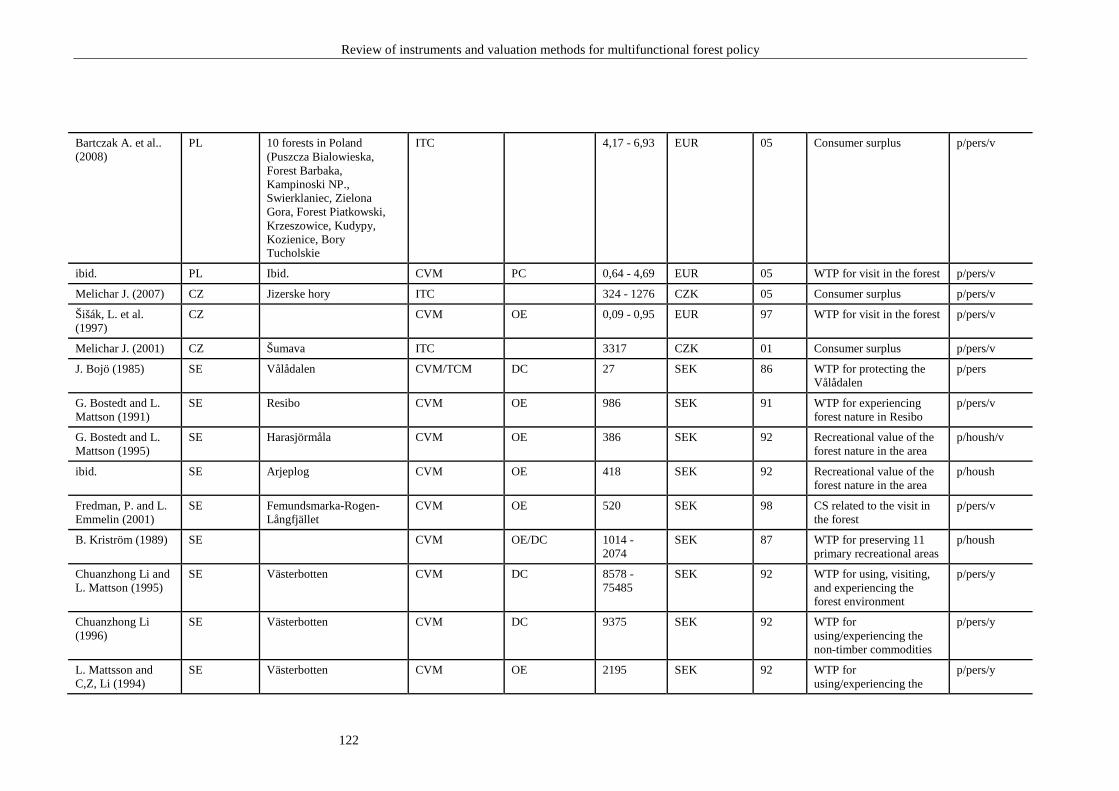
Review of instruments and valuation methods for multifunctional forest policy
122
Bartczak A. et al.. (2008)
PL 10 forests in Poland (Puszcza Bialowieska, Forest Barbaka, Kampinoski NP., Swierklaniec, Zielona Gora, Forest Piatkowski, Krzeszowice, Kudypy, Kozienice, Bory Tucholskie
ITC 4,17 - 6,93 EUR 05 Consumer surplus p/pers/v
ibid. PL Ibid. CVM PC 0,64 - 4,69 EUR 05 WTP for visit in the forest p/pers/v
Melichar J. (2007) CZ Jizerske hory ITC 324 - 1276 CZK 05 Consumer surplus p/pers/v
Šišák, L. et al. (1997)
CZ CVM OE 0,09 - 0,95 EUR 97 WTP for visit in the forest p/pers/v
Melichar J. (2001) CZ Šumava ITC 3317 CZK 01 Consumer surplus p/pers/v
J. Bojö (1985) SE Vålådalen CVM/TCM DC 27 SEK 86 WTP for protecting the Vålådalen
p/pers
G. Bostedt and L. Mattson (1991)
SE Resibo CVM OE 986 SEK 91 WTP for experiencing forest nature in Resibo
p/pers/v
G. Bostedt and L. Mattson (1995)
SE Harasjörmåla CVM OE 386 SEK 92 Recreational value of the forest nature in the area
p/housh/v
ibid. SE Arjeplog CVM OE 418 SEK 92 Recreational value of the forest nature in the area
p/housh
Fredman, P. and L. Emmelin (2001)
SE Femundsmarka-Rogen-Långfjället
CVM OE 520 SEK 98 CS related to the visit in the forest
p/pers/v
B. Kriström (1989) SE CVM OE/DC 1014 - 2074
SEK 87 WTP for preserving 11 primary recreational areas
p/housh
Chuanzhong Li and L. Mattson (1995)
SE Västerbotten CVM DC 8578 - 75485
SEK 92 WTP for using, visiting, and experiencing the forest environment
p/pers/y
Chuanzhong Li (1996)
SE Västerbotten CVM DC 9375 SEK 92 WTP for using/experiencing the non-timber commodities
p/pers/y
L. Mattsson and C,Z, Li (1994)
SE Västerbotten CVM OE 2195 SEK 92 WTP for using/experiencing the
p/pers/y
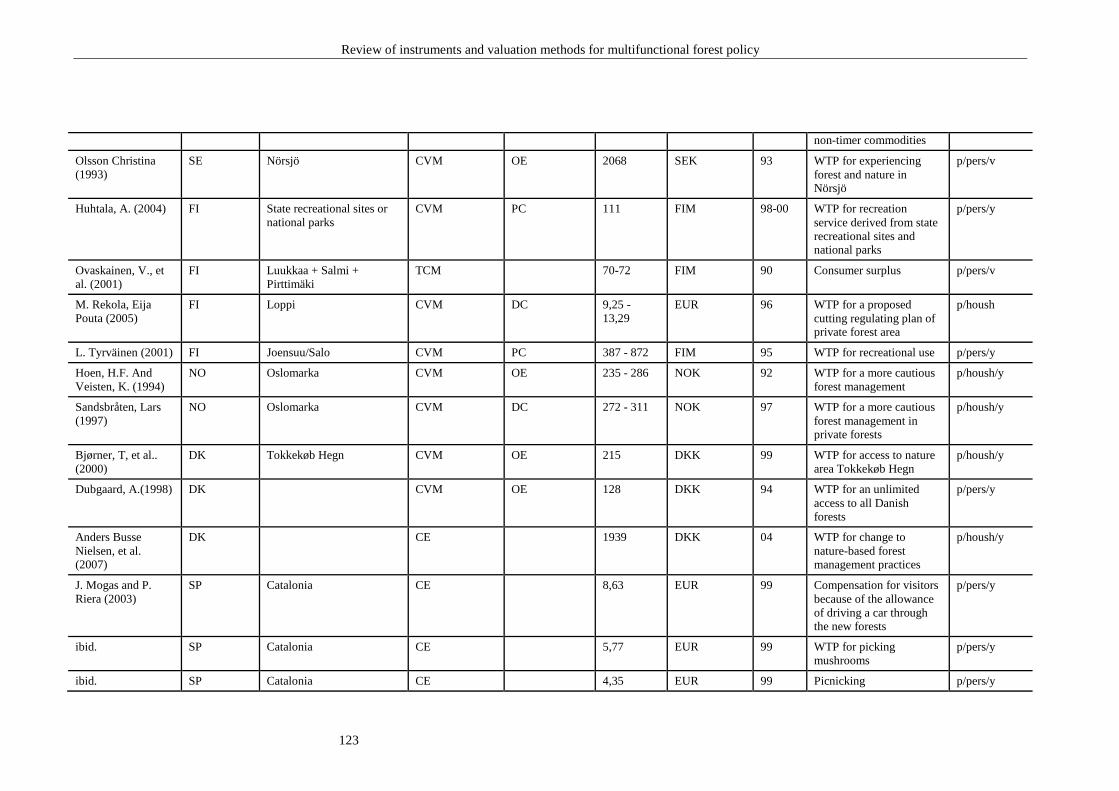
Review of instruments and valuation methods for multifunctional forest policy
123
non-timer commodities
Olsson Christina (1993)
SE Nörsjö CVM OE 2068 SEK 93 WTP for experiencing forest and nature in Nörsjö
p/pers/v
Huhtala, A. (2004) FI State recreational sites or national parks
CVM PC 111 FIM 98-00 WTP for recreation service derived from state recreational sites and national parks
p/pers/y
Ovaskainen, V., et al. (2001)
FI Luukkaa + Salmi + Pirttimäki
TCM 70-72 FIM 90 Consumer surplus p/pers/v
M. Rekola, Eija Pouta (2005)
FI Loppi CVM DC 9,25 - 13,29
EUR 96 WTP for a proposed cutting regulating plan of private forest area
p/housh
L. Tyrväinen (2001) FI Joensuu/Salo CVM PC 387 - 872 FIM 95 WTP for recreational use p/pers/y
Hoen, H.F. And Veisten, K. (1994)
NO Oslomarka CVM OE 235 - 286 NOK 92 WTP for a more cautious forest management
p/housh/y
Sandsbråten, Lars (1997)
NO Oslomarka CVM DC 272 - 311 NOK 97 WTP for a more cautious forest management in private forests
p/housh/y
Bjørner, T, et al.. (2000)
DK Tokkekøb Hegn CVM OE 215 DKK 99 WTP for access to nature area Tokkekøb Hegn
p/housh/y
Dubgaard, A.(1998) DK CVM OE 128 DKK 94 WTP for an unlimited access to all Danish forests
p/pers/y
Anders Busse Nielsen, et al. (2007)
DK CE 1939 DKK 04 WTP for change to nature-based forest management practices
p/housh/y
J. Mogas and P. Riera (2003)
SP Catalonia CE 8,63 EUR 99 Compensation for visitors because of the allowance of driving a car through the new forests
p/pers/y
ibid. SP Catalonia CE 5,77 EUR 99 WTP for picking mushrooms
p/pers/y
ibid. SP Catalonia CE 4,35 EUR 99 Picnicking p/pers/y
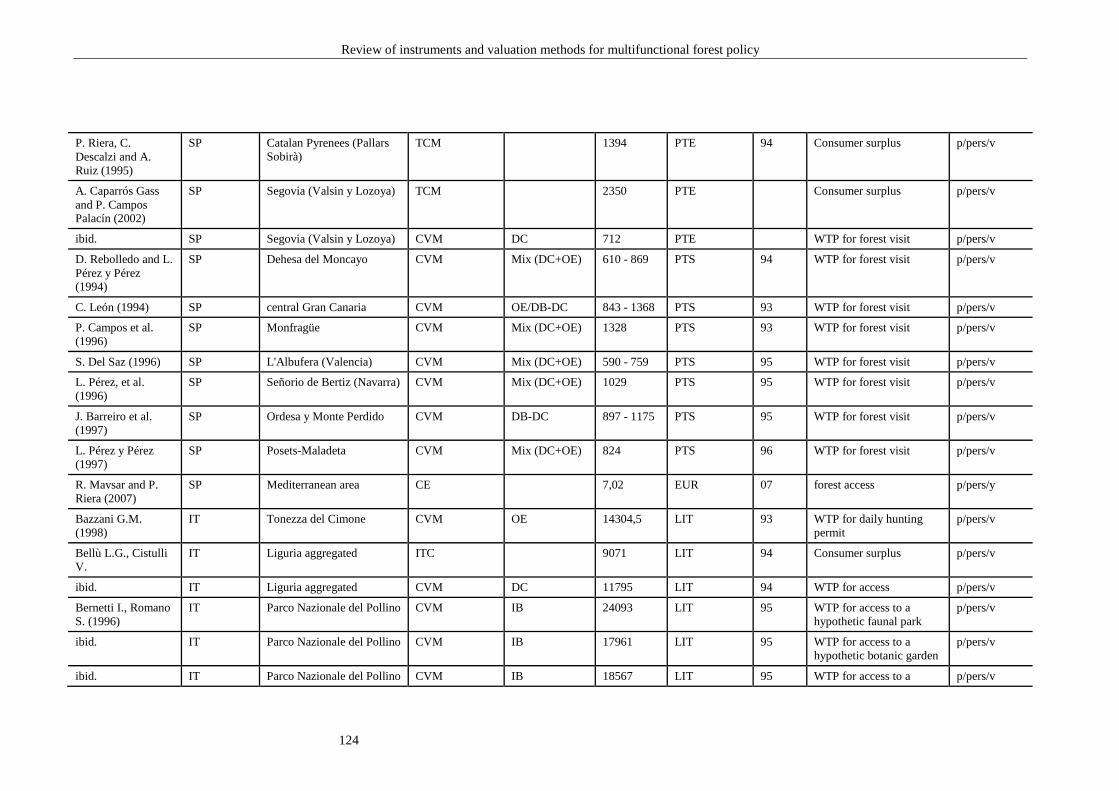
Review of instruments and valuation methods for multifunctional forest policy
124
P. Riera, C. Descalzi and A. Ruiz (1995)
SP Catalan Pyrenees (Pallars Sobirà)
TCM 1394 PTE 94 Consumer surplus p/pers/v
A. Caparrós Gass and P. Campos Palacín (2002)
SP Segovia (Valsin y Lozoya) TCM 2350 PTE Consumer surplus p/pers/v
ibid. SP Segovia (Valsin y Lozoya) CVM DC 712 PTE WTP for forest visit p/pers/v
D. Rebolledo and L. Pérez y Pérez (1994)
SP Dehesa del Moncayo CVM Mix (DC+OE) 610 - 869 PTS 94 WTP for forest visit p/pers/v
C. León (1994) SP central Gran Canaria CVM OE/DB-DC 843 - 1368 PTS 93 WTP for forest visit p/pers/v
P. Campos et al. (1996)
SP Monfragüe CVM Mix (DC+OE) 1328 PTS 93 WTP for forest visit p/pers/v
S. Del Saz (1996) SP L'Albufera (Valencia) CVM Mix (DC+OE) 590 - 759 PTS 95 WTP for forest visit p/pers/v
L. Pérez, et al. (1996)
SP Señorio de Bertiz (Navarra) CVM Mix (DC+OE) 1029 PTS 95 WTP for forest visit p/pers/v
J. Barreiro et al. (1997)
SP Ordesa y Monte Perdido CVM DB-DC 897 - 1175 PTS 95 WTP for forest visit p/pers/v
L. Pérez y Pérez (1997)
SP Posets-Maladeta CVM Mix (DC+OE) 824 PTS 96 WTP for forest visit p/pers/v
R. Mavsar and P. Riera (2007)
SP Mediterranean area CE 7,02 EUR 07 forest access p/pers/y
Bazzani G.M. (1998)
IT Tonezza del Cimone CVM OE 14304,5 LIT 93 WTP for daily hunting permit
p/pers/v
Bellù L.G., Cistulli V.
IT Liguria aggregated ITC 9071 LIT 94 Consumer surplus p/pers/v
ibid. IT Liguria aggregated CVM DC 11795 LIT 94 WTP for access p/pers/v
Bernetti I., Romano S. (1996)
IT Parco Nazionale del Pollino CVM IB 24093 LIT 95 WTP for access to a hypothetic faunal park
p/pers/v
ibid. IT Parco Nazionale del Pollino CVM IB 17961 LIT 95 WTP for access to a hypothetic botanic garden
p/pers/v
ibid. IT Parco Nazionale del Pollino CVM IB 18567 LIT 95 WTP for access to a p/pers/v
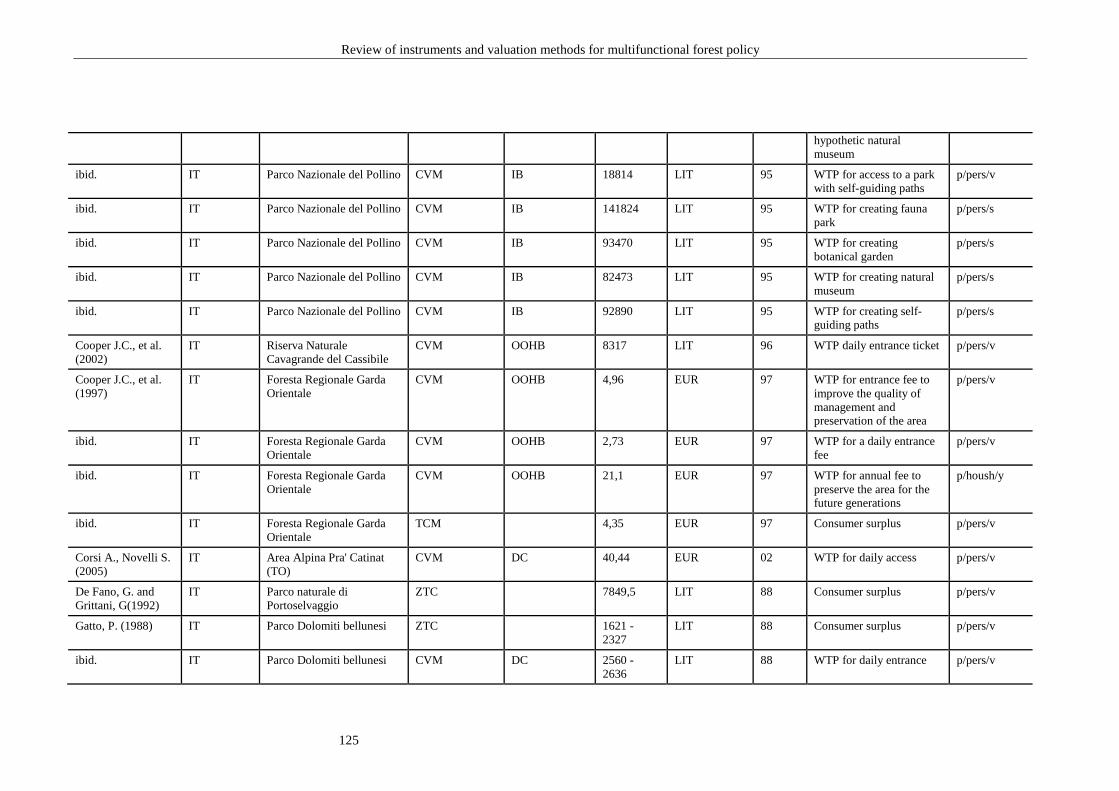
Review of instruments and valuation methods for multifunctional forest policy
125
hypothetic natural museum
ibid. IT Parco Nazionale del Pollino CVM IB 18814 LIT 95 WTP for access to a park with self-guiding paths
p/pers/v
ibid. IT Parco Nazionale del Pollino CVM IB 141824 LIT 95 WTP for creating fauna park
p/pers/s
ibid. IT Parco Nazionale del Pollino CVM IB 93470 LIT 95 WTP for creating botanical garden
p/pers/s
ibid. IT Parco Nazionale del Pollino CVM IB 82473 LIT 95 WTP for creating natural museum
p/pers/s
ibid. IT Parco Nazionale del Pollino CVM IB 92890 LIT 95 WTP for creating self-guiding paths
p/pers/s
Cooper J.C., et al. (2002)
IT Riserva Naturale Cavagrande del Cassibile
CVM OOHB 8317 LIT 96 WTP daily entrance ticket p/pers/v
Cooper J.C., et al. (1997)
IT Foresta Regionale Garda Orientale
CVM OOHB 4,96 EUR 97 WTP for entrance fee to improve the quality of management and preservation of the area
p/pers/v
ibid. IT Foresta Regionale Garda Orientale
CVM OOHB 2,73 EUR 97 WTP for a daily entrance fee
p/pers/v
ibid. IT Foresta Regionale Garda Orientale
CVM OOHB 21,1 EUR 97 WTP for annual fee to preserve the area for the future generations
p/housh/y
ibid. IT Foresta Regionale Garda Orientale
TCM 4,35 EUR 97 Consumer surplus p/pers/v
Corsi A., Novelli S. (2005)
IT Area Alpina Pra' Catinat (TO)
CVM DC 40,44 EUR 02 WTP for daily access p/pers/v
De Fano, G. and Grittani, G(1992)
IT Parco naturale di Portoselvaggio
ZTC 7849,5 LIT 88 Consumer surplus p/pers/v
Gatto, P. (1988) IT Parco Dolomiti bellunesi ZTC 1621 - 2327
LIT 88 Consumer surplus p/pers/v
ibid. IT Parco Dolomiti bellunesi CVM DC 2560 - 2636
LIT 88 WTP for daily entrance p/pers/v
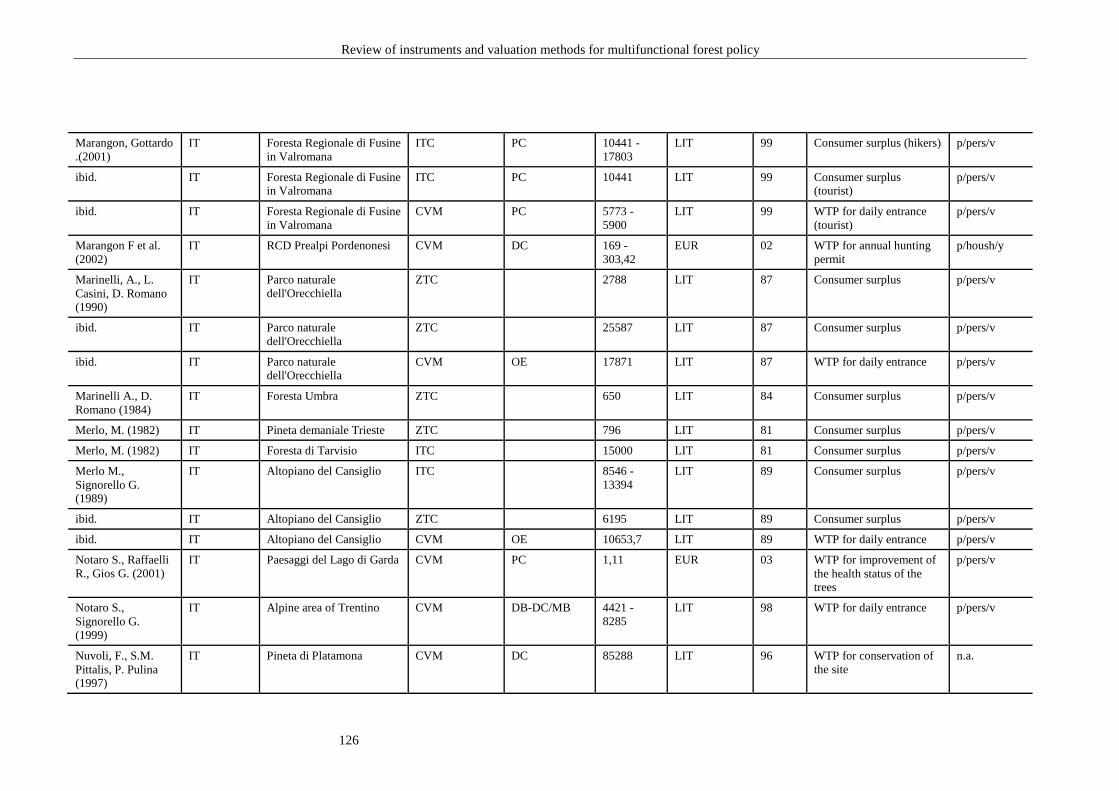
Review of instruments and valuation methods for multifunctional forest policy
126
Marangon, Gottardo .(2001)
IT Foresta Regionale di Fusine in Valromana
ITC PC 10441 - 17803
LIT 99 Consumer surplus (hikers) p/pers/v
ibid. IT Foresta Regionale di Fusine in Valromana
ITC PC 10441 LIT 99 Consumer surplus (tourist)
p/pers/v
ibid. IT Foresta Regionale di Fusine in Valromana
CVM PC 5773 - 5900
LIT 99 WTP for daily entrance (tourist)
p/pers/v
Marangon F et al. (2002)
IT RCD Prealpi Pordenonesi CVM DC 169 - 303,42
EUR 02 WTP for annual hunting permit
p/housh/y
Marinelli, A., L. Casini, D. Romano (1990)
IT Parco naturale dell'Orecchiella
ZTC 2788 LIT 87 Consumer surplus p/pers/v
ibid. IT Parco naturale dell'Orecchiella
ZTC 25587 LIT 87 Consumer surplus p/pers/v
ibid. IT Parco naturale dell'Orecchiella
CVM OE 17871 LIT 87 WTP for daily entrance p/pers/v
Marinelli A., D. Romano (1984)
IT Foresta Umbra ZTC 650 LIT 84 Consumer surplus p/pers/v
Merlo, M. (1982) IT Pineta demaniale Trieste ZTC 796 LIT 81 Consumer surplus p/pers/v
Merlo, M. (1982) IT Foresta di Tarvisio ITC 15000 LIT 81 Consumer surplus p/pers/v
Merlo M., Signorello G. (1989)
IT Altopiano del Cansiglio ITC 8546 - 13394
LIT 89 Consumer surplus p/pers/v
ibid. IT Altopiano del Cansiglio ZTC 6195 LIT 89 Consumer surplus p/pers/v
ibid. IT Altopiano del Cansiglio CVM OE 10653,7 LIT 89 WTP for daily entrance p/pers/v
Notaro S., Raffaelli R., Gios G. (2001)
IT Paesaggi del Lago di Garda CVM PC 1,11 EUR 03 WTP for improvement of the health status of the trees
p/pers/v
Notaro S., Signorello G. (1999)
IT Alpine area of Trentino CVM DB-DC/MB 4421 - 8285
LIT 98 WTP for daily entrance p/pers/v
Nuvoli, F., S.M. Pittalis, P. Pulina (1997)
IT Pineta di Platamona CVM DC 85288 LIT 96 WTP for conservation of the site
n.a.
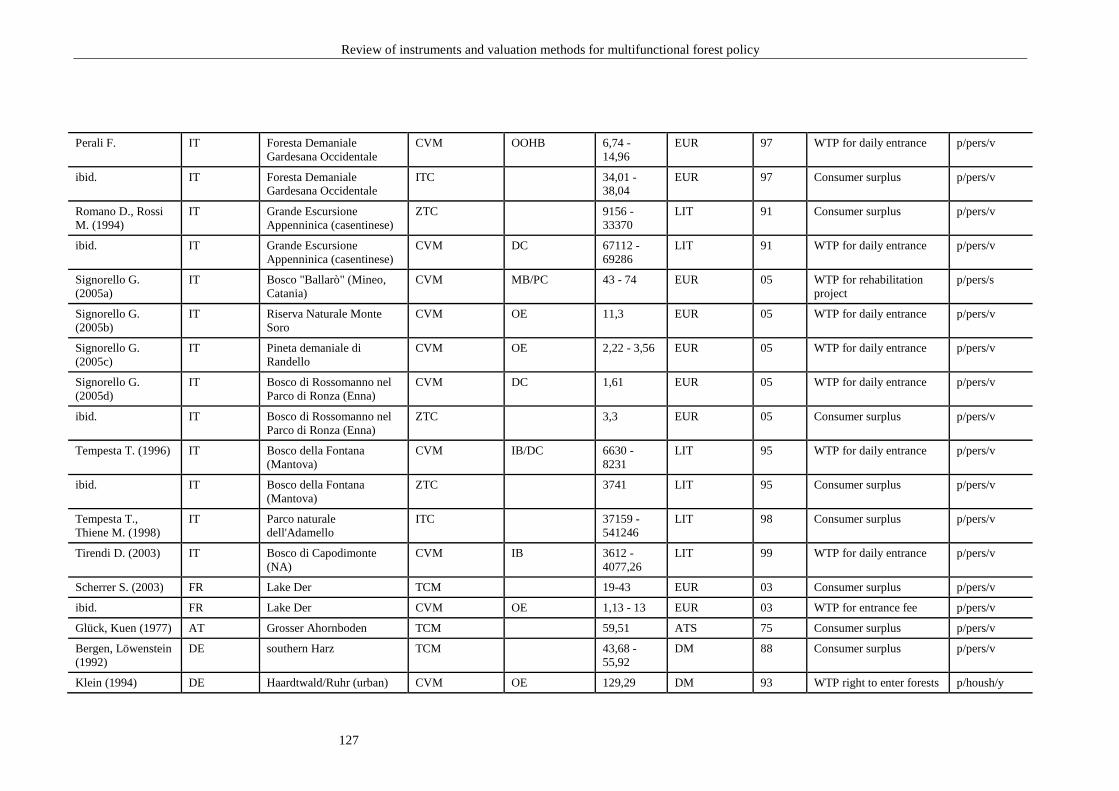
Review of instruments and valuation methods for multifunctional forest policy
127
Perali F. IT Foresta Demaniale Gardesana Occidentale
CVM OOHB 6,74 - 14,96
EUR 97 WTP for daily entrance p/pers/v
ibid. IT Foresta Demaniale Gardesana Occidentale
ITC 34,01 - 38,04
EUR 97 Consumer surplus p/pers/v
Romano D., Rossi M. (1994)
IT Grande Escursione Appenninica (casentinese)
ZTC 9156 - 33370
LIT 91 Consumer surplus p/pers/v
ibid. IT Grande Escursione Appenninica (casentinese)
CVM DC 67112 - 69286
LIT 91 WTP for daily entrance p/pers/v
Signorello G. (2005a)
IT Bosco "Ballarò" (Mineo, Catania)
CVM MB/PC 43 - 74 EUR 05 WTP for rehabilitation project
p/pers/s
Signorello G. (2005b)
IT Riserva Naturale Monte Soro
CVM OE 11,3 EUR 05 WTP for daily entrance p/pers/v
Signorello G. (2005c)
IT Pineta demaniale di Randello
CVM OE 2,22 - 3,56 EUR 05 WTP for daily entrance p/pers/v
Signorello G. (2005d)
IT Bosco di Rossomanno nel Parco di Ronza (Enna)
CVM DC 1,61 EUR 05 WTP for daily entrance p/pers/v
ibid. IT Bosco di Rossomanno nel Parco di Ronza (Enna)
ZTC 3,3 EUR 05 Consumer surplus p/pers/v
Tempesta T. (1996) IT Bosco della Fontana (Mantova)
CVM IB/DC 6630 - 8231
LIT 95 WTP for daily entrance p/pers/v
ibid. IT Bosco della Fontana (Mantova)
ZTC 3741 LIT 95 Consumer surplus p/pers/v
Tempesta T., Thiene M. (1998)
IT Parco naturale dell'Adamello
ITC 37159 - 541246
LIT 98 Consumer surplus p/pers/v
Tirendi D. (2003) IT Bosco di Capodimonte (NA)
CVM IB 3612 - 4077,26
LIT 99 WTP for daily entrance p/pers/v
Scherrer S. (2003) FR Lake Der TCM 19-43 EUR 03 Consumer surplus p/pers/v
ibid. FR Lake Der CVM OE 1,13 - 13 EUR 03 WTP for entrance fee p/pers/v
Glück, Kuen (1977) AT Grosser Ahornboden TCM 59,51 ATS 75 Consumer surplus p/pers/v
Bergen, Löwenstein (1992)
DE southern Harz TCM 43,68 - 55,92
DM 88 Consumer surplus p/pers/v
Klein (1994) DE Haardtwald/Ruhr (urban) CVM OE 129,29 DM 93 WTP right to enter forests p/housh/y
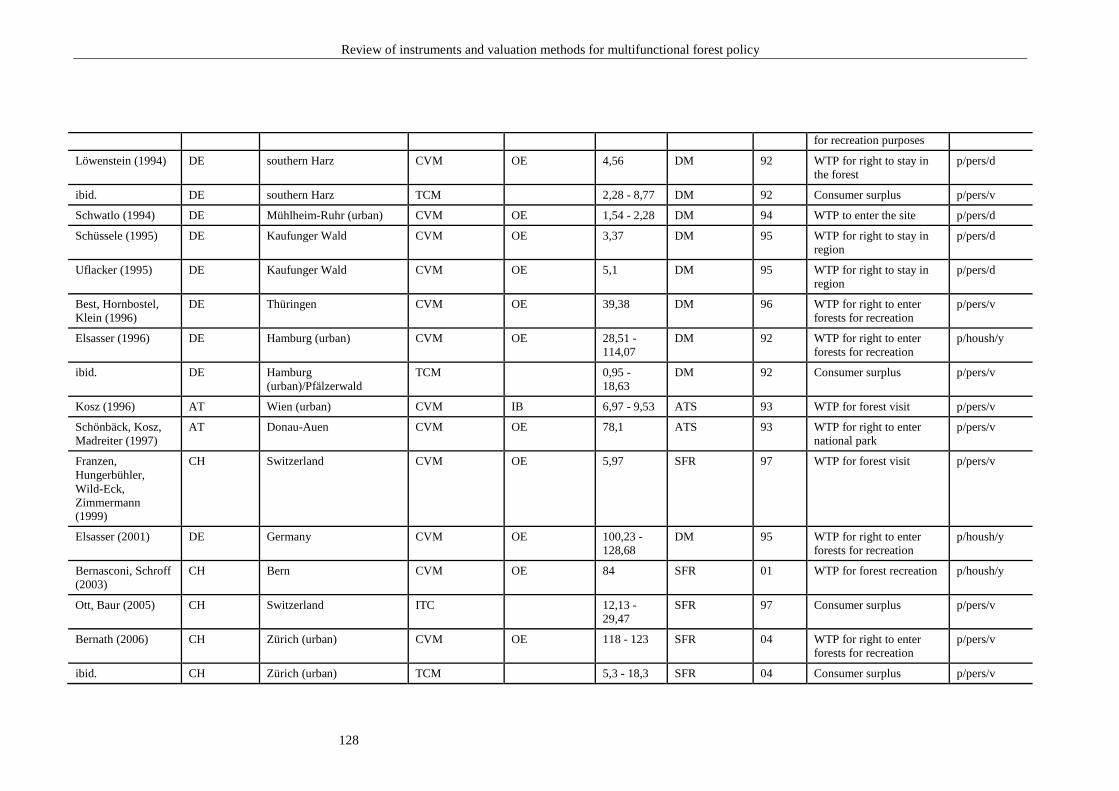
Review of instruments and valuation methods for multifunctional forest policy
128
for recreation purposes
Löwenstein (1994) DE southern Harz CVM OE 4,56 DM 92 WTP for right to stay in the forest
p/pers/d
ibid. DE southern Harz TCM 2,28 - 8,77 DM 92 Consumer surplus p/pers/v
Schwatlo (1994) DE Mühlheim-Ruhr (urban) CVM OE 1,54 - 2,28 DM 94 WTP to enter the site p/pers/d
Schüssele (1995) DE Kaufunger Wald CVM OE 3,37 DM 95 WTP for right to stay in region
p/pers/d
Uflacker (1995) DE Kaufunger Wald CVM OE 5,1 DM 95 WTP for right to stay in region
p/pers/d
Best, Hornbostel, Klein (1996)
DE Thüringen CVM OE 39,38 DM 96 WTP for right to enter forests for recreation
p/pers/v
Elsasser (1996) DE Hamburg (urban) CVM OE 28,51 - 114,07
DM 92 WTP for right to enter forests for recreation
p/housh/y
ibid. DE Hamburg (urban)/Pfälzerwald
TCM 0,95 - 18,63
DM 92 Consumer surplus p/pers/v
Kosz (1996) AT Wien (urban) CVM IB 6,97 - 9,53 ATS 93 WTP for forest visit p/pers/v
Schönbäck, Kosz, Madreiter (1997)
AT Donau-Auen CVM OE 78,1 ATS 93 WTP for right to enter national park
p/pers/v
Franzen, Hungerbühler, Wild-Eck, Zimmermann (1999)
CH Switzerland CVM OE 5,97 SFR 97 WTP for forest visit p/pers/v
Elsasser (2001) DE Germany CVM OE 100,23 - 128,68
DM 95 WTP for right to enter forests for recreation
p/housh/y
Bernasconi, Schroff (2003)
CH Bern CVM OE 84 SFR 01 WTP for forest recreation p/housh/y
Ott, Baur (2005) CH Switzerland ITC 12,13 - 29,47
SFR 97 Consumer surplus p/pers/v
Bernath (2006) CH Zürich (urban) CVM OE 118 - 123 SFR 04 WTP for right to enter forests for recreation
p/pers/v
ibid. CH Zürich (urban) TCM 5,3 - 18,3 SFR 04 Consumer surplus p/pers/v
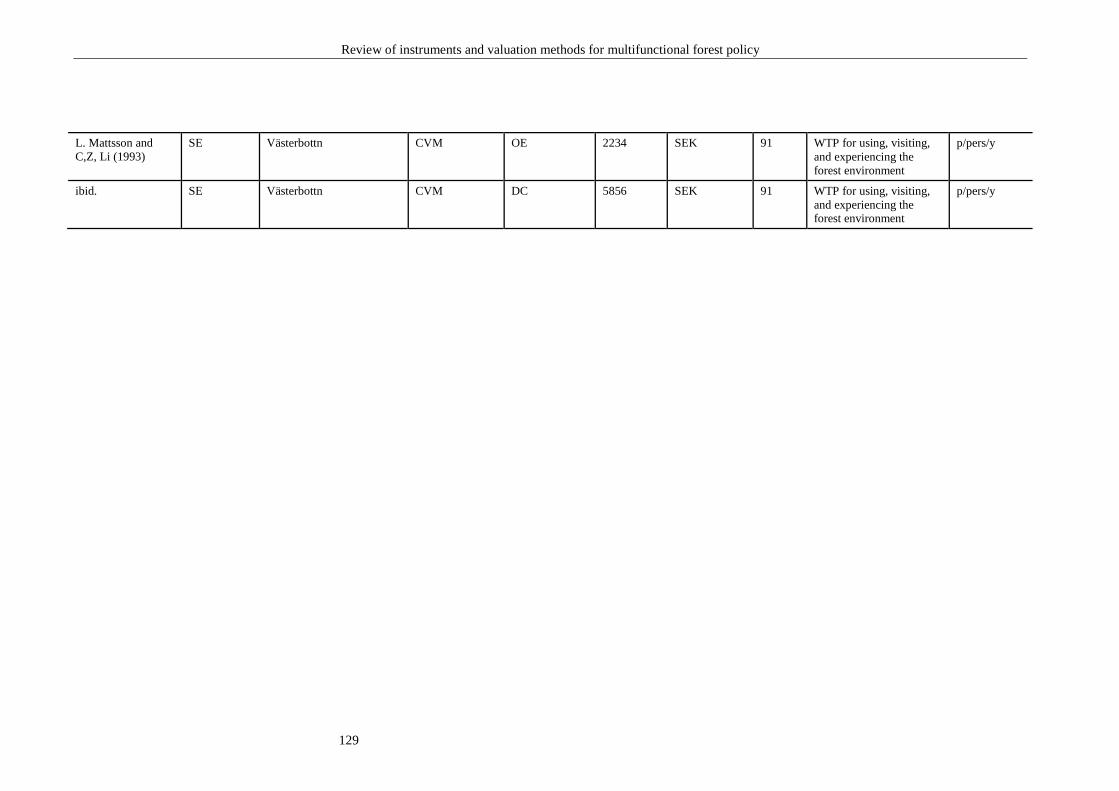
Review of instruments and valuation methods for multifunctional forest policy
129
L. Mattsson and C,Z, Li (1993)
SE Västerbottn CVM OE 2234 SEK 91 WTP for using, visiting, and experiencing the forest environment
p/pers/y
ibid. SE Västerbottn CVM DC 5856 SEK 91 WTP for using, visiting, and experiencing the forest environment
p/pers/y

Review of instruments and valuation methods for multifunctional forest policy
130
BIODIVERSITY/ NATURE PROTECTION/ CONSERVATION
Author (year) Country Forest name/ Forest location
Valuation method
Elicitation method
Mean value Currency Year What is valued Who pays
Garrod, G.D. and K.G. Willis (1997)
UK CR 0,43 - 0,52 GBP 95 WTP for an additional 1% of forest cover of Standard B (the 'desired' standard of biodiversity conservation)
p/housh/y
ibid. UK CR 0,10 - 018 GBP 95 WTP for an additional 1% of forest cover of Standard C (conversion to a native woodland)
p/housh/y
Hanley et al. (2002) UK CVM OE 0,35 GBP 01 WTP for increasing the area of Upland Conifer forest by 12000ha
p/housh/y
ibid. UK CVM OE 0,33 GBP 01 WTP for increasing the area of Lowland Conifer forest by 12000ha
p/housh/y
ibid. UK CVM OE 1,13 GBP 01 WTP for increasing the area of Lowland Ancient Semi-Natural Broadleaved forest by 12000ha
p/housh/y
ibid. UK CVM OE 0,84 GBP 01 WTP for increasing the area of Lowland New Broadleaved Native Forest by 12000ha
p/housh/y
ibid. UK CVM OE 0,90 GBP 01 WTP for increasing the area of Upland Native Broadleaved Woods by 12000ha
p/housh/y
ibid. UK CVM OE 0,61 GBP 01 WTP for increasing the area of Upland New Native Broadleaved Woods by 12000ha
p/housh/y
Garrod, G.D. and K.G. Willis (1994)
UK CVM OE 0,29 GBP 93 WTP for one additional reserve in Conifer forest habitat
p/pers/y
ibid. UK CVM OE 2,32 GBP 93 WTP for one additional reserve in Broadleaved woodland habitat
p/pers/y
ibid. UK CVM OE 0,67 GBP 93 WTP for one additional reserve in Heather moorland habitat
p/pers/y
ibid. UK CVM OE 0,79 GBP 93 WTP for one additional reserve in Peat bog habitat p/pers/y
ibid. UK CVM OE 1,44 GBP 93 WTP for one additional reserve in hay meadow habitat
p/pers/y
ibid. UK CVM OE 0,68 GBP 93 WTP for one additional reserve in Marsh and fen habitat
p/pers/y
ibid. UK CVM OE 0,85 GBP 93 WTP for one additional reserve in Ponds habitat p/pers/y
ibid. UK CVM OE 0,28 GBP 93 WTP for one additional reserve in Large manmade p/pers/y
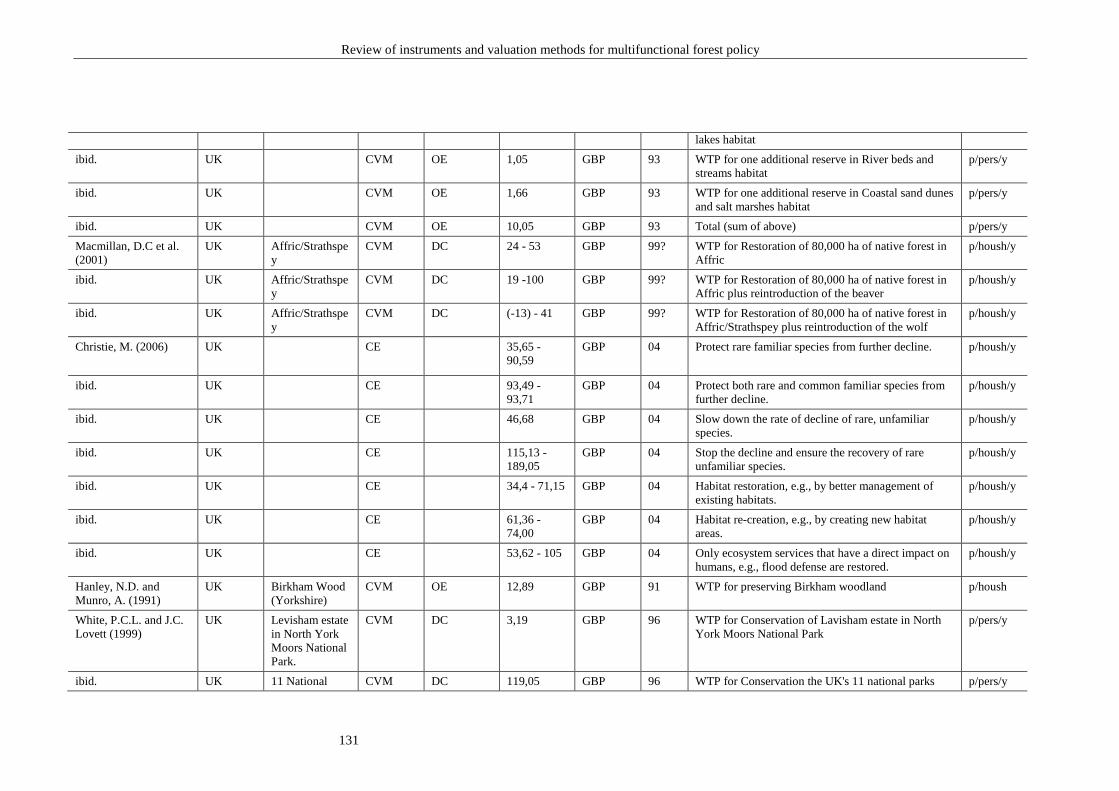
Review of instruments and valuation methods for multifunctional forest policy
131
lakes habitat
ibid. UK CVM OE 1,05 GBP 93 WTP for one additional reserve in River beds and streams habitat
p/pers/y
ibid. UK CVM OE 1,66 GBP 93 WTP for one additional reserve in Coastal sand dunes and salt marshes habitat
p/pers/y
ibid. UK CVM OE 10,05 GBP 93 Total (sum of above) p/pers/y
Macmillan, D.C et al. (2001)
UK Affric/Strathspey
CVM DC 24 - 53 GBP 99? WTP for Restoration of 80,000 ha of native forest in Affric
p/housh/y
ibid. UK Affric/Strathspey
CVM DC 19 -100 GBP 99? WTP for Restoration of 80,000 ha of native forest in Affric plus reintroduction of the beaver
p/housh/y
ibid. UK Affric/Strathspey
CVM DC (-13) - 41 GBP 99? WTP for Restoration of 80,000 ha of native forest in Affric/Strathspey plus reintroduction of the wolf
p/housh/y
Christie, M. (2006)
UK CE 35,65 - 90,59
GBP 04 Protect rare familiar species from further decline. p/housh/y
ibid. UK CE 93,49 - 93,71
GBP 04 Protect both rare and common familiar species from further decline.
p/housh/y
ibid. UK CE 46,68 GBP 04 Slow down the rate of decline of rare, unfamiliar species.
p/housh/y
ibid. UK CE 115,13 - 189,05
GBP 04 Stop the decline and ensure the recovery of rare unfamiliar species.
p/housh/y
ibid. UK CE 34,4 - 71,15 GBP 04 Habitat restoration, e.g., by better management of existing habitats.
p/housh/y
ibid. UK CE 61,36 - 74,00
GBP 04 Habitat re-creation, e.g., by creating new habitat areas.
p/housh/y
ibid. UK CE 53,62 - 105 GBP 04 Only ecosystem services that have a direct impact on humans, e.g., flood defense are restored.
p/housh/y
Hanley, N.D. and Munro, A. (1991)
UK Birkham Wood (Yorkshire)
CVM OE 12,89 GBP 91 WTP for preserving Birkham woodland p/housh
White, P.C.L. and J.C. Lovett (1999)
UK Levisham estate in North York Moors National Park.
CVM DC 3,19 GBP 96 WTP for Conservation of Lavisham estate in North York Moors National Park
p/pers/y
ibid. UK 11 National CVM DC 119,05 GBP 96 WTP for Conservation the UK's 11 national parks p/pers/y
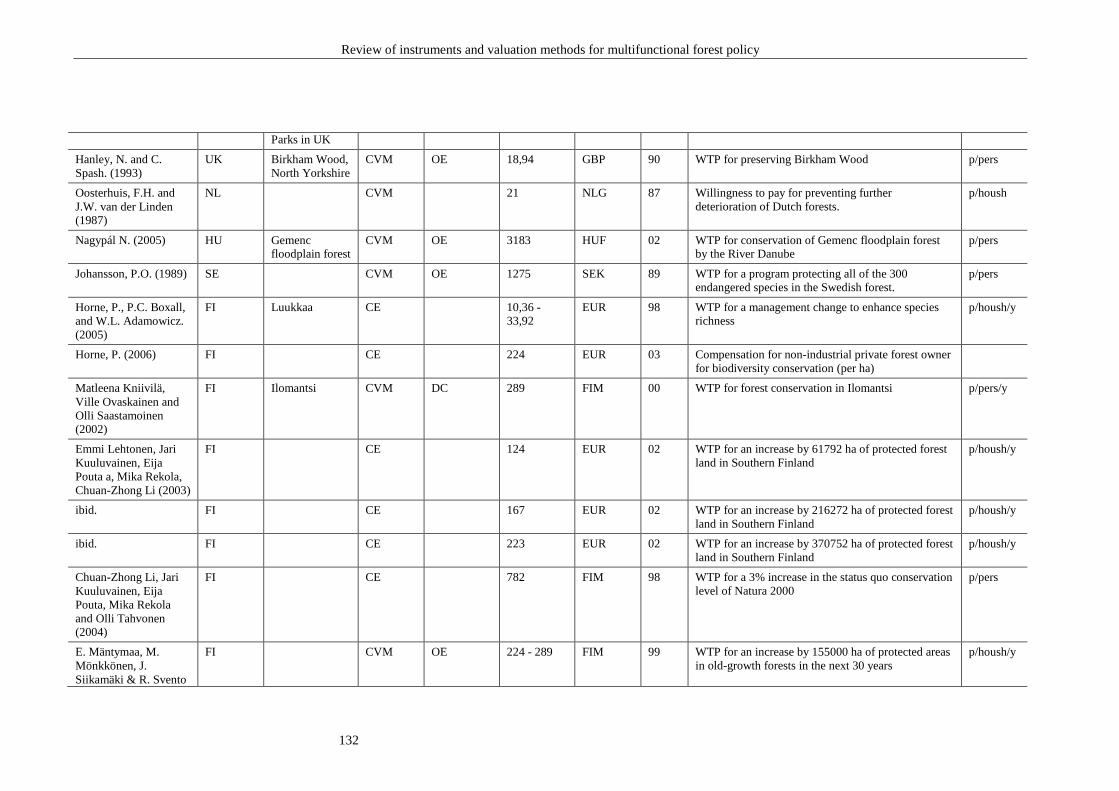
Review of instruments and valuation methods for multifunctional forest policy
132
Parks in UK
Hanley, N. and C. Spash. (1993)
UK Birkham Wood, North Yorkshire
CVM OE 18,94 GBP 90 WTP for preserving Birkham Wood p/pers
Oosterhuis, F.H. and J.W. van der Linden (1987)
NL CVM 21 NLG 87 Willingness to pay for preventing further deterioration of Dutch forests.
p/housh
Nagypál N. (2005) HU Gemenc floodplain forest
CVM OE 3183 HUF 02 WTP for conservation of Gemenc floodplain forest by the River Danube
p/pers
Johansson, P.O. (1989) SE CVM OE 1275 SEK 89 WTP for a program protecting all of the 300 endangered species in the Swedish forest.
p/pers
Horne, P., P.C. Boxall, and W.L. Adamowicz. (2005)
FI Luukkaa CE 10,36 - 33,92
EUR 98 WTP for a management change to enhance species richness
p/housh/y
Horne, P. (2006) FI CE 224 EUR 03 Compensation for non-industrial private forest owner for biodiversity conservation (per ha)
Matleena Kniivilä, Ville Ovaskainen and Olli Saastamoinen (2002)
FI Ilomantsi CVM DC 289 FIM 00 WTP for forest conservation in Ilomantsi p/pers/y
Emmi Lehtonen, Jari Kuuluvainen, Eija Pouta a, Mika Rekola, Chuan-Zhong Li (2003)
FI CE 124 EUR 02 WTP for an increase by 61792 ha of protected forest land in Southern Finland
p/housh/y
ibid. FI CE 167 EUR 02 WTP for an increase by 216272 ha of protected forest land in Southern Finland
p/housh/y
ibid. FI CE 223 EUR 02 WTP for an increase by 370752 ha of protected forest land in Southern Finland
p/housh/y
Chuan-Zhong Li, Jari Kuuluvainen, Eija Pouta, Mika Rekola and Olli Tahvonen (2004)
FI CE 782 FIM 98 WTP for a 3% increase in the status quo conservation level of Natura 2000
p/pers
E. Mäntymaa, M. Mönkkönen, J. Siikamäki & R. Svento
FI CVM OE 224 - 289 FIM 99 WTP for an increase by 155000 ha of protected areas in old-growth forests in the next 30 years
p/housh/y
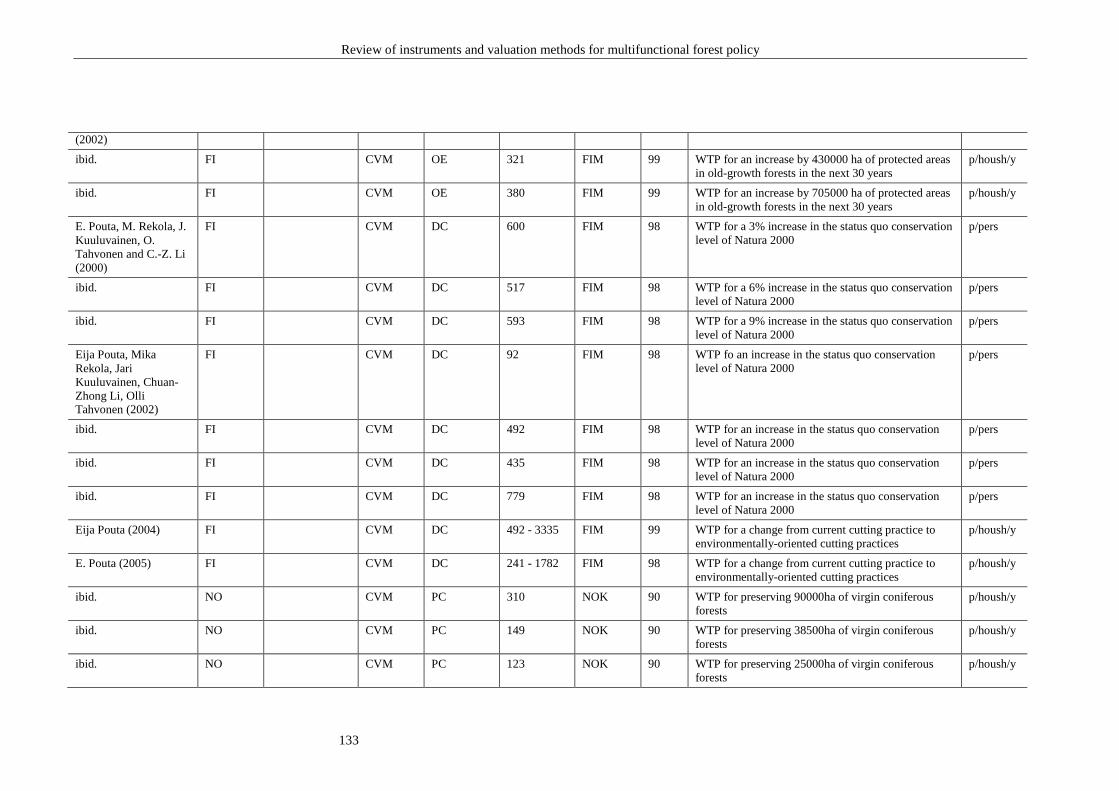
Review of instruments and valuation methods for multifunctional forest policy
133
(2002)
ibid. FI CVM OE 321 FIM 99 WTP for an increase by 430000 ha of protected areas in old-growth forests in the next 30 years
p/housh/y
ibid. FI CVM OE 380 FIM 99 WTP for an increase by 705000 ha of protected areas in old-growth forests in the next 30 years
p/housh/y
E. Pouta, M. Rekola, J. Kuuluvainen, O. Tahvonen and C.-Z. Li (2000)
FI CVM DC 600 FIM 98 WTP for a 3% increase in the status quo conservation level of Natura 2000
p/pers
ibid. FI CVM DC 517 FIM 98 WTP for a 6% increase in the status quo conservation level of Natura 2000
p/pers
ibid. FI CVM DC 593 FIM 98 WTP for a 9% increase in the status quo conservation level of Natura 2000
p/pers
Eija Pouta, Mika Rekola, Jari Kuuluvainen, Chuan-Zhong Li, Olli Tahvonen (2002)
FI CVM DC 92 FIM 98 WTP fo an increase in the status quo conservation level of Natura 2000
p/pers
ibid. FI CVM DC 492 FIM 98 WTP for an increase in the status quo conservation level of Natura 2000
p/pers
ibid. FI CVM DC 435 FIM 98 WTP for an increase in the status quo conservation level of Natura 2000
p/pers
ibid. FI CVM DC 779 FIM 98 WTP for an increase in the status quo conservation level of Natura 2000
p/pers
Eija Pouta (2004) FI CVM DC 492 - 3335 FIM 99 WTP for a change from current cutting practice to environmentally-oriented cutting practices
p/housh/y
E. Pouta (2005) FI CVM DC 241 - 1782 FIM 98 WTP for a change from current cutting practice to environmentally-oriented cutting practices
p/housh/y
ibid. NO CVM PC 310 NOK 90 WTP for preserving 90000ha of virgin coniferous forests
p/housh/y
ibid. NO CVM PC 149 NOK 90 WTP for preserving 38500ha of virgin coniferous forests
p/housh/y
ibid. NO CVM PC 123 NOK 90 WTP for preserving 25000ha of virgin coniferous forests
p/housh/y
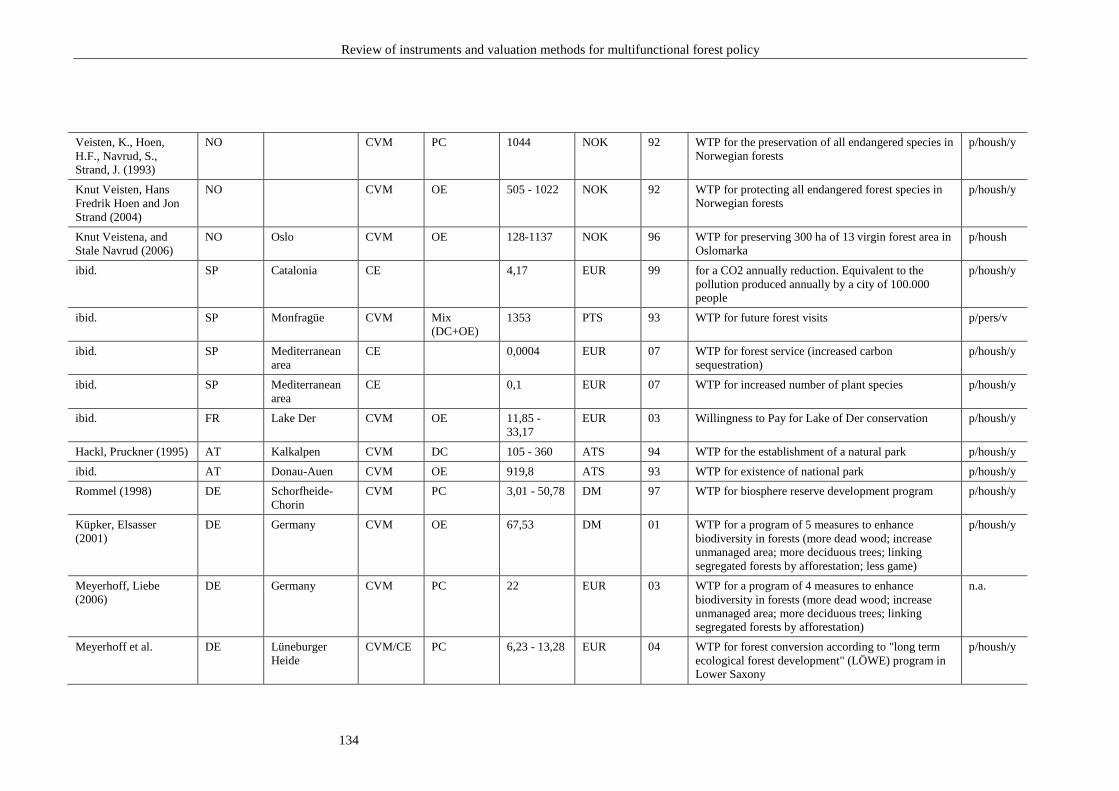
Review of instruments and valuation methods for multifunctional forest policy
134
Veisten, K., Hoen, H.F., Navrud, S., Strand, J. (1993)
NO CVM PC 1044 NOK 92 WTP for the preservation of all endangered species in Norwegian forests
p/housh/y
Knut Veisten, Hans Fredrik Hoen and Jon Strand (2004)
NO CVM OE 505 - 1022 NOK 92 WTP for protecting all endangered forest species in Norwegian forests
p/housh/y
Knut Veistena, and Stale Navrud (2006)
NO Oslo CVM OE 128-1137 NOK 96 WTP for preserving 300 ha of 13 virgin forest area in Oslomarka
p/housh
ibid. SP Catalonia CE 4,17 EUR 99 for a CO2 annually reduction. Equivalent to the pollution produced annually by a city of 100.000 people
p/housh/y
ibid. SP Monfragüe CVM Mix (DC+OE)
1353 PTS 93 WTP for future forest visits p/pers/v
ibid. SP Mediterranean area
CE 0,0004 EUR 07 WTP for forest service (increased carbon sequestration)
p/housh/y
ibid. SP Mediterranean area
CE 0,1 EUR 07 WTP for increased number of plant species p/housh/y
ibid. FR Lake Der CVM OE 11,85 - 33,17
EUR 03 Willingness to Pay for Lake of Der conservation p/housh/y
Hackl, Pruckner (1995) AT Kalkalpen CVM DC 105 - 360 ATS 94 WTP for the establishment of a natural park p/housh/y
ibid. AT Donau-Auen CVM OE 919,8 ATS 93 WTP for existence of national park p/housh/y
Rommel (1998) DE Schorfheide-Chorin
CVM PC 3,01 - 50,78 DM 97 WTP for biosphere reserve development program p/housh/y
Küpker, Elsasser (2001)
DE Germany CVM OE 67,53 DM 01 WTP for a program of 5 measures to enhance biodiversity in forests (more dead wood; increase unmanaged area; more deciduous trees; linking segregated forests by afforestation; less game)
p/housh/y
Meyerhoff, Liebe (2006)
DE Germany CVM PC 22 EUR 03 WTP for a program of 4 measures to enhance biodiversity in forests (more dead wood; increase unmanaged area; more deciduous trees; linking segregated forests by afforestation)
n.a.
Meyerhoff et al. DE Lüneburger Heide
CVM/CE PC 6,23 - 13,28 EUR 04 WTP for forest conversion according to "long term ecological forest development" (LÖWE) program in Lower Saxony
p/housh/y
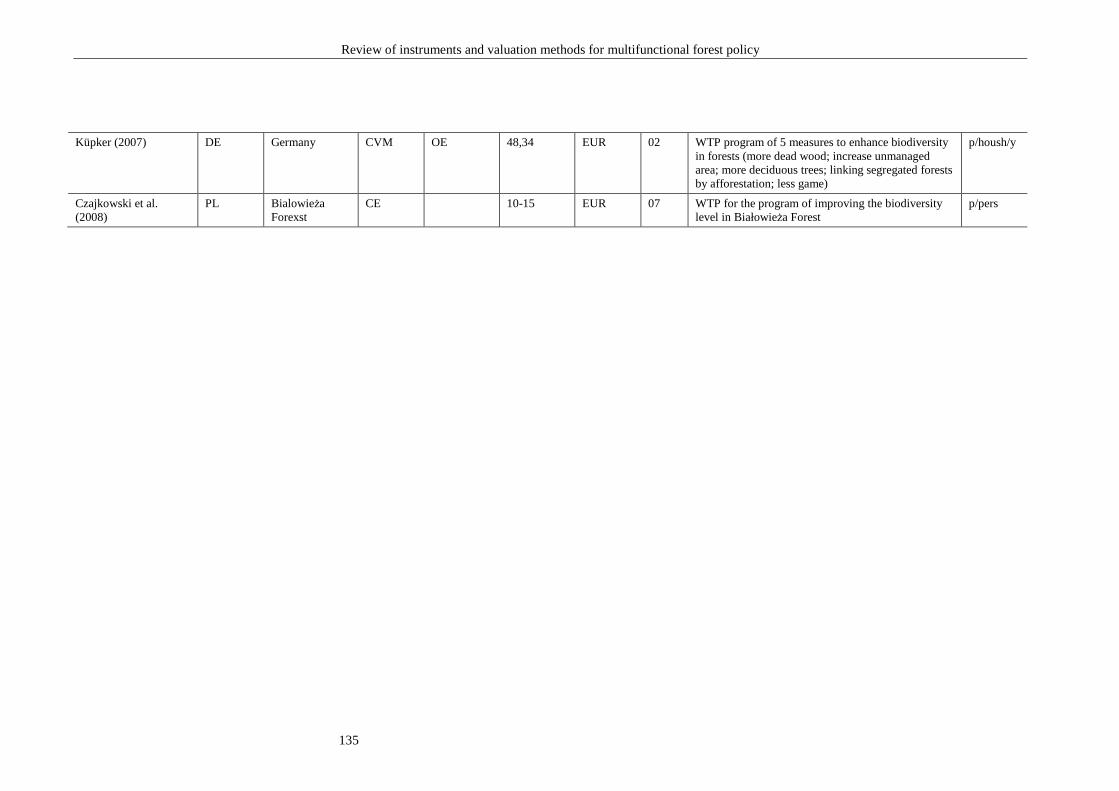
Review of instruments and valuation methods for multifunctional forest policy
135
Küpker (2007) DE Germany CVM OE 48,34 EUR 02 WTP program of 5 measures to enhance biodiversity in forests (more dead wood; increase unmanaged area; more deciduous trees; linking segregated forests by afforestation; less game)
p/housh/y
Czajkowski et al. (2008)
PL BialowieŜa Forexst
CE 10-15 EUR 07 WTP for the program of improving the biodiversity level in BiałowieŜa Forest
p/pers

Review of instruments and valuation methods for multifunctional forest policy
136
CARBON SEQUESTRATION
Author (year) Country Valuation method
Mean value
Currency Year What is valued
Bateman, I.J. and A.A. Lovett (2000)
UK AE/MP 2859,75 GBP 90 Mean Net Present Value (NPV) in pounds for per hectare for soil carbon flux for Sitka spruce at 1% discount rate.
ibid. UK AE/MP 2907,06 GBP 90 Mean Net Present Value (NPV) in pounds per hectare for soil carbon flux for Beech at 1% discount rate.
ibid. UK AE/MP 742,91 GBP 90 Mean Net Present Value (NPV) in pounds per hectare for soil carbon flux for all tree species at 1,5% discount rate at non-peaty soils.
Brainard, J., Lovett, A. and Bateman, I.(2003)
UK AE/MP 2250,00 GBP 03 Per hectare mean social value carbon sequestered in FC beech woodland
ibid. UK AE/MP 1629,00 GBP 03 Per hectare mean social value carbon sequestered in FC oak woodland
ibid. UK AE/MP 2311,00 GBP 03 Per hectare mean social value carbon sequestered in FC sitka woodland
ibid. UK AE/MP 1409,00 GBP 03 Per hectare mean social value carbon sequestered in FC other than listed above broadleaf woodland
ibid. UK AE/MP 1414,00 GBP 03 Per hectare mean social value carbon sequestered in FC other conifer woodland
ibid. UK AE/MP 2098,00 GBP 03 Per hectare mean social value carbon sequestered in FC woodland
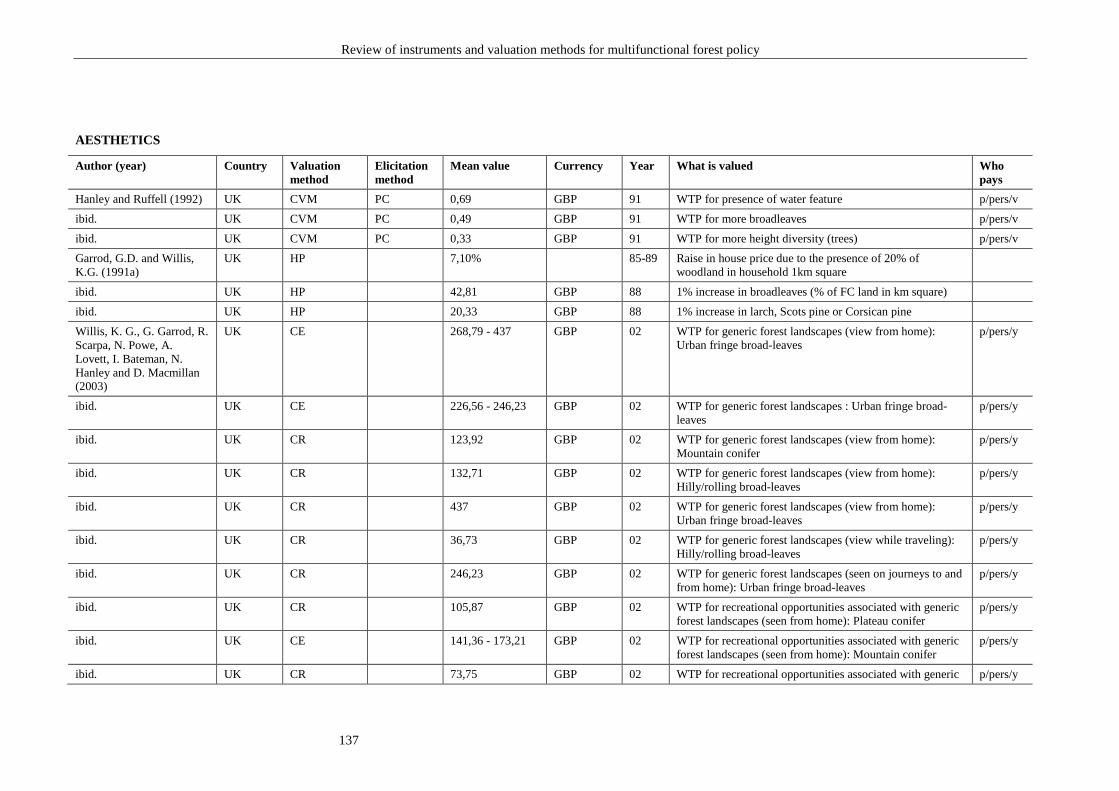
Review of instruments and valuation methods for multifunctional forest policy
137
AESTHETICS
Author (year) Country Valuation method
Elicitation method
Mean value Currency Year What is valued Who pays
Hanley and Ruffell (1992) UK CVM PC 0,69 GBP 91 WTP for presence of water feature p/pers/v
ibid. UK CVM PC 0,49 GBP 91 WTP for more broadleaves p/pers/v
ibid. UK CVM PC 0,33 GBP 91 WTP for more height diversity (trees) p/pers/v
Garrod, G.D. and Willis, K.G. (1991a)
UK HP 7,10% 85-89 Raise in house price due to the presence of 20% of woodland in household 1km square
ibid. UK HP 42,81 GBP 88 1% increase in broadleaves (% of FC land in km square)
ibid. UK HP 20,33 GBP 88 1% increase in larch, Scots pine or Corsican pine
Willis, K. G., G. Garrod, R. Scarpa, N. Powe, A. Lovett, I. Bateman, N. Hanley and D. Macmillan (2003)
UK CE 268,79 - 437 GBP 02 WTP for generic forest landscapes (view from home): Urban fringe broad-leaves
p/pers/y
ibid. UK CE 226,56 - 246,23 GBP 02 WTP for generic forest landscapes : Urban fringe broad-leaves
p/pers/y
ibid. UK CR 123,92 GBP 02 WTP for generic forest landscapes (view from home): Mountain conifer
p/pers/y
ibid. UK CR 132,71 GBP 02 WTP for generic forest landscapes (view from home): Hilly/rolling broad-leaves
p/pers/y
ibid. UK CR 437 GBP 02 WTP for generic forest landscapes (view from home): Urban fringe broad-leaves
p/pers/y
ibid. UK CR 36,73 GBP 02 WTP for generic forest landscapes (view while traveling): Hilly/rolling broad-leaves
p/pers/y
ibid. UK CR 246,23 GBP 02 WTP for generic forest landscapes (seen on journeys to and from home): Urban fringe broad-leaves
p/pers/y
ibid. UK CR 105,87 GBP 02 WTP for recreational opportunities associated with generic forest landscapes (seen from home): Plateau conifer
p/pers/y
ibid. UK CE 141,36 - 173,21 GBP 02 WTP for recreational opportunities associated with generic forest landscapes (seen from home): Mountain conifer
p/pers/y
ibid. UK CR 73,75 GBP 02 WTP for recreational opportunities associated with generic p/pers/y
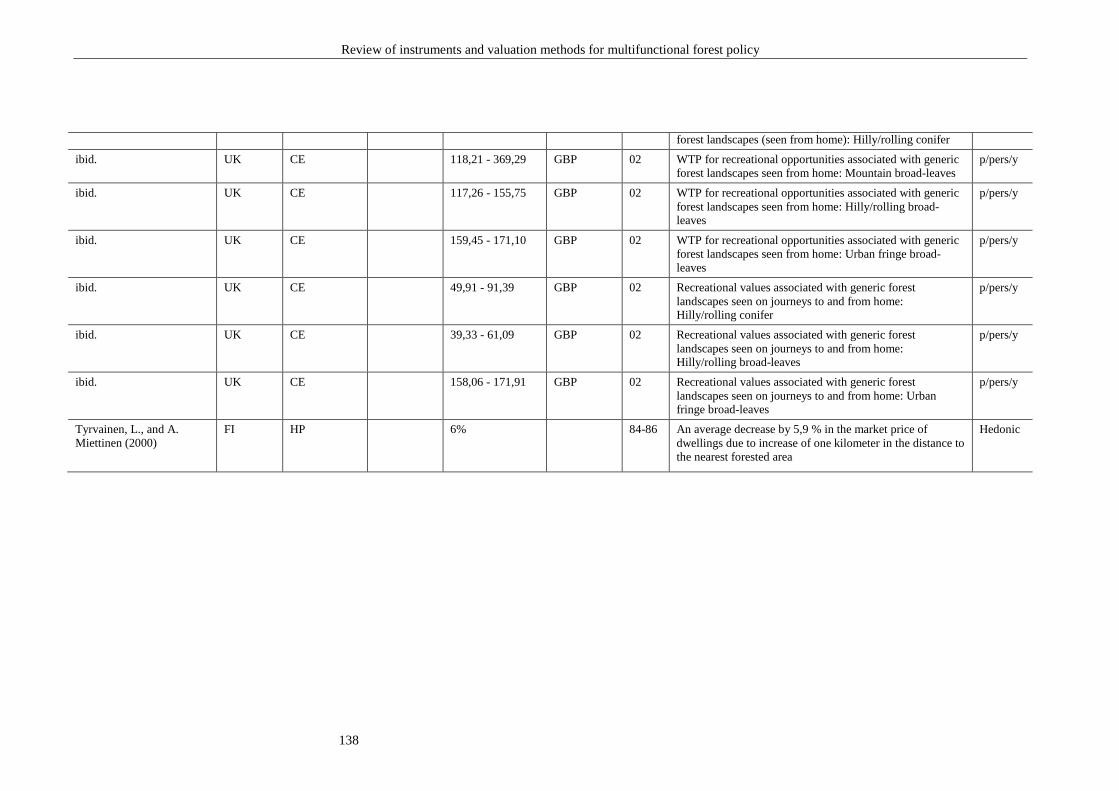
Review of instruments and valuation methods for multifunctional forest policy
138
forest landscapes (seen from home): Hilly/rolling conifer
ibid. UK CE 118,21 - 369,29 GBP 02 WTP for recreational opportunities associated with generic forest landscapes seen from home: Mountain broad-leaves
p/pers/y
ibid. UK CE 117,26 - 155,75 GBP 02 WTP for recreational opportunities associated with generic forest landscapes seen from home: Hilly/rolling broad-leaves
p/pers/y
ibid. UK CE 159,45 - 171,10 GBP 02 WTP for recreational opportunities associated with generic forest landscapes seen from home: Urban fringe broad-leaves
p/pers/y
ibid. UK CE 49,91 - 91,39 GBP 02 Recreational values associated with generic forest landscapes seen on journeys to and from home: Hilly/rolling conifer
p/pers/y
ibid. UK CE 39,33 - 61,09 GBP 02 Recreational values associated with generic forest landscapes seen on journeys to and from home: Hilly/rolling broad-leaves
p/pers/y
ibid. UK CE 158,06 - 171,91 GBP 02 Recreational values associated with generic forest landscapes seen on journeys to and from home: Urban fringe broad-leaves
p/pers/y
Tyrvainen, L., and A. Miettinen (2000)
FI HP 6% 84-86 An average decrease by 5,9 % in the market price of dwellings due to increase of one kilometer in the distance to the nearest forested area
Hedonic

Review of instruments and valuation methods for multifunctional forest policy
139
OTHER
Author (year) Country Forest name/ Forest location
Valuation method
Elicitation method
Mean value
Currency Year What is valued Who pays
Mill, G.A., T.M. van Rensburg, S. Hynes and C. Dooley (2007)
IE Portumna forest CVM DC 38,43 EUR 03 WTP for replanting of 100ha of mixed conifer and broadleaved forest instead of sitka spruce (private perspective)
p/pers/y
ibid. IE Portumna forest CVM DC 46,46 EUR 03 WTP for replanting of 100ha of Native semi-natural forest instead of sitka spruce (private perspective)
p/pers/y
ibid. IE Portumna forest CVM DC 27,78 EUR 03 WTP for replanting of 100ha of Native pine forest instead of sitka spruce (private perspective)
p/pers/y
ibid. IE Portumna forest CVM DC 32,44 EUR 03 WTP for replanting of 100ha of mixed conifer and broadleaved forest instead of sitka spruce (social perspective)
p/pers/y
ibid. IE Portumna forest CVM DC 31,08 EUR 03 WTP for replanting of 100ha of Native semi-natural forest instead of sitka spruce (social perspective)
p/pers/y
ibid. IE Portumna forest CVM DC 35,29 EUR 03 WTP for replanting of 100ha of Native pine forest instead of sitka spruce (social perspective)
p/pers/y
ibid. CZ Jizerske hory CBM 67 CZK 05 The decrease in CS associated with the impacts of air pollution on the quality of forest ecosystems
p/pers/v
Hoen, H.F. And Winther, G. (1993)
NO CVM PC 277 NOK 90 WTP for a more cautious forest management p/housh/y
ibid. SP Catalonia CE 4,17 EUR 99 for a CO2 annually reduction. Equivalent to the pollution produced annually by a city of 100.000 people
p/housh/y
ibid. SP Catalonia CE 0,02 EUR 99 for increasing the productivity soil for 1 year p/housh/y
P. Riera and J. Mogas (2004)
SP Catalonia CVM DC 63% of the sampled population would be WTP 6 EUR/person/a to reduce the risk of
EUR 99 a proposed policy that involves a 50% reduction of the risk of fires in the north east of Spain
p/housh/y
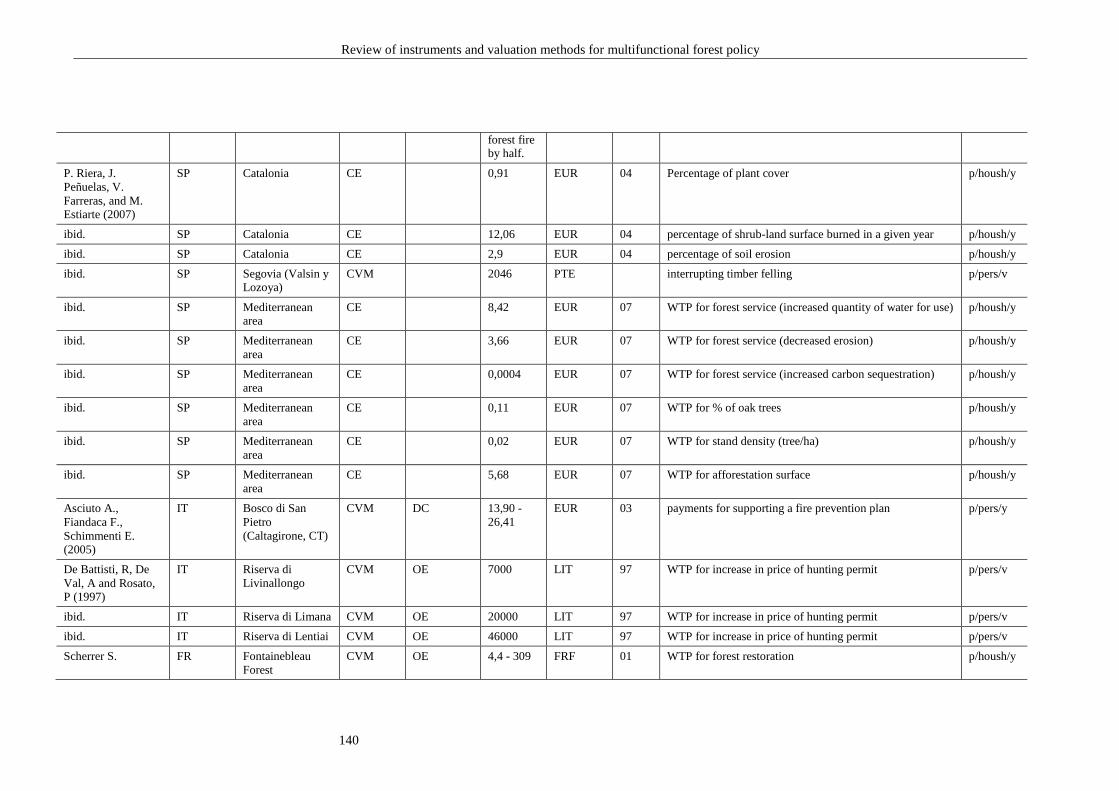
Review of instruments and valuation methods for multifunctional forest policy
140
forest fire by half.
P. Riera, J. Peñuelas, V. Farreras, and M. Estiarte (2007)
SP Catalonia CE 0,91 EUR 04 Percentage of plant cover p/housh/y
ibid. SP Catalonia CE 12,06 EUR 04 percentage of shrub-land surface burned in a given year p/housh/y
ibid. SP Catalonia CE 2,9 EUR 04 percentage of soil erosion p/housh/y
ibid. SP Segovia (Valsin y Lozoya)
CVM 2046 PTE interrupting timber felling p/pers/v
ibid. SP Mediterranean area
CE 8,42 EUR 07 WTP for forest service (increased quantity of water for use) p/housh/y
ibid. SP Mediterranean area
CE 3,66 EUR 07 WTP for forest service (decreased erosion) p/housh/y
ibid. SP Mediterranean area
CE 0,0004 EUR 07 WTP for forest service (increased carbon sequestration) p/housh/y
ibid. SP Mediterranean area
CE 0,11 EUR 07 WTP for % of oak trees p/housh/y
ibid. SP Mediterranean area
CE 0,02 EUR 07 WTP for stand density (tree/ha) p/housh/y
ibid. SP Mediterranean area
CE 5,68 EUR 07 WTP for afforestation surface p/housh/y
Asciuto A., Fiandaca F., Schimmenti E. (2005)
IT Bosco di San Pietro (Caltagirone, CT)
CVM DC 13,90 - 26,41
EUR 03 payments for supporting a fire prevention plan p/pers/y
De Battisti, R, De Val, A and Rosato, P (1997)
IT Riserva di Livinallongo
CVM OE 7000 LIT 97 WTP for increase in price of hunting permit p/pers/v
ibid. IT Riserva di Limana CVM OE 20000 LIT 97 WTP for increase in price of hunting permit p/pers/v
ibid. IT Riserva di Lentiai CVM OE 46000 LIT 97 WTP for increase in price of hunting permit p/pers/v
Scherrer S. FR Fontainebleau Forest
CVM OE 4,4 - 309 FRF 01 WTP for forest restoration p/housh/y
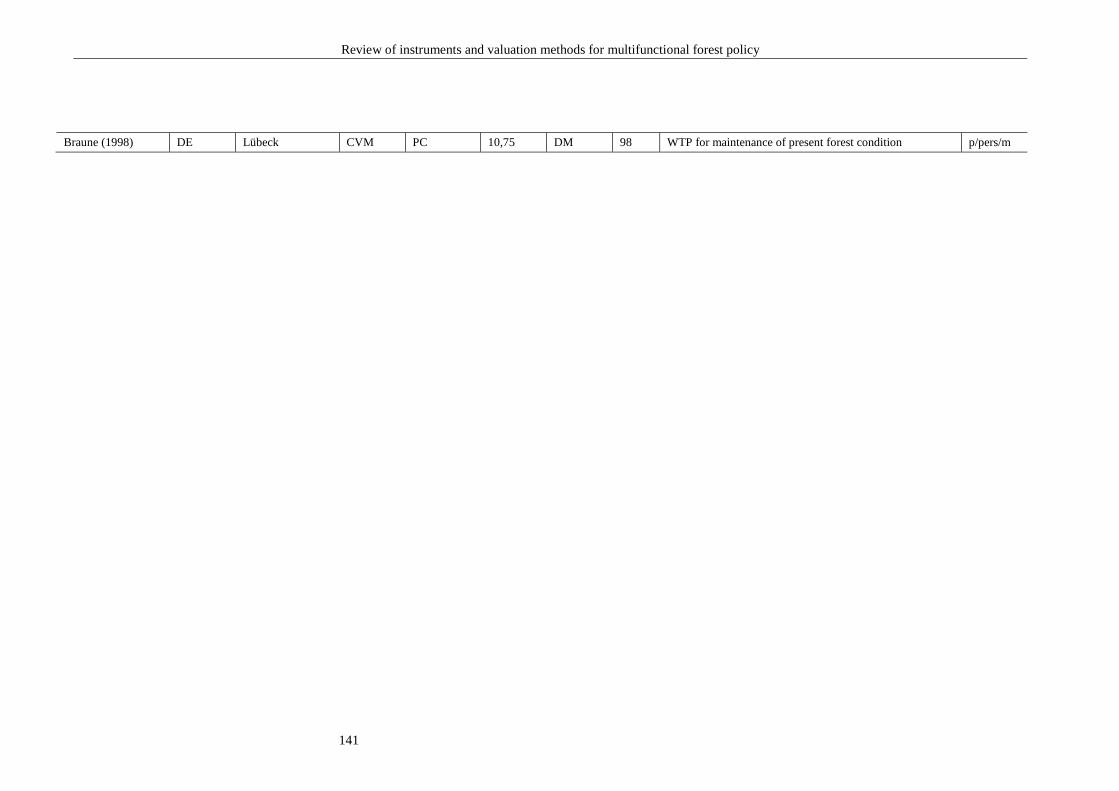
Review of instruments and valuation methods for multifunctional forest policy
141
Braune (1998) DE Lübeck CVM PC 10,75 DM 98 WTP for maintenance of present forest condition p/pers/m