review of idr inventory control processes and...
TRANSCRIPT

Review of IDR Inventory Control
Processes and Implementation of
Procedures to Minimize Future
Discrepancies
Submitted by Karen Young

A case study presentation from
the ASQ Healthcare Division:
www.asq.org/health.
Copyright © 2009, Karen Young.
Used with permission.
Submit your own case study
to be considered for publication.
What other content would you like to see
on the Healthcare Division site? Let us know!
About the Organization
• Materials management division of a large
university health system.
• System includes 900-bed hospital, a level-one
trauma center, nine neighborhood health centers,
and two medical schools.
• Materials management division mission: To meet
the supply needs of the health system in the most
efficient, expedient, and cost-effective manner by
providing proficient, professional, and productive
customer service.

The Project Team
• Champions: CEO and VP, Materials Management
• Team:
– Certified Six Sigma Black Belt (ASQ), team leader
– Director of operations, Materials Management
– Inventory control manager, Materials Management
– Information systems coordinator, Materials Management
– Operations manager, Materials Management
– Operations manager, Primary Vendor

The Problem
• Business case: Inventory distribution and receiving
(IDR)
– IDR fill rates fell to 32 percent below the minimum customer
requirement of 98 percent.
– There was no clearly defined inventory control procedure.
– An independent audit revealed a significant discrepancy in the
inventory recorded in the general ledger and the actual IDR
inventory on hand.
– The auditors recommended that management review processes
related to IDR inventory control and implement procedures to
decrease opportunities for future discrepancies.

The Problem (cont’d.)
• Problem statement:
– IDR fill rates for the past three months
averaged 66 percent complete for the more
than 22,000 lines ordered in ProClick during
that time period.
– The top 20 percent of the “stock out” inventory
items accounted for more than 80 percent of
the unfilled lines.

Project Goals
• Initiate a more efficient process of tracking supplies from
point of order to final distribution.
• Establish “just-in-time” inventory maintenance and
delivery schedule.
• Reorganize the stockroom and identify “par” levels to
adequately meet required support demands.
• Eliminate the cost of noncompliance within the Pyxis
process.
• Increase fill rates for all orders received to 98 percent or
better within six months.
Root Cause Analysis
• The project required the efforts of a six-member team and
12 to 15 inventory technicians and lasted approximately
11 months.
• First the team assessed the voice of the customer to
determine training, cycle time, resource, budget, and
service-level needs and requirements. Survey results
indicated that:
– The just-in-time process was not capable of meeting demand or
demand was not accurately being captured.
– The on-hand storeroom inventory seemed excessive considering
the just-in-time process was set up to restock the Pyxis units six
nights per week.

Root Cause Analysis (cont’d.)
• Next the team used “cause-and-effect” and
“five whys” to help identify opportunities to
optimize the just-in-time process and
reduce storeroom SKUs for noncritical
pipeline items. A key finding was:
– The significant impact of “end-user”
noncompliant behavior was an unexpected
cause of many of the demand discrepancies.
Addressing Root Causes
Actions taken to address the root causes of the problems:• Write standard operating procedures for key process inputs in each
department
– Conduct annual review of procedures by management and staff
– Store each department’s procedure manual on a shared drive
– Place a copy at the work site
• Reduce storeroom inventory by 100 items every two weeks
– Total reduction 1,154 items
– Phase 1 reduction – 551 items
– Phase 2 reduction – 603 items
– Monitor vendor fill rates for each group
• ABC inventory cycle count
– Organize and label shelves
– Input product locations in ProClick
– Print and update daily counts
Addressing Root Causes (cont’d.)
Actions taken to address the root causes of the problems:• Staff development
– Supply chain continuing education and in-house training
– Training checklists
– Annual competency assessment tests (open book)
• Shipment validation
– Check shipment quantities and descriptions for accuracy upon arrival
– Update receipt of orders in real time
– Process discrepancies in real time
• Communication
– Establish interdepartmental communication protocols
– Identify cross-functional interdependencies
– Create algorithm flowcharts
– Use problem logs
• Measurement system
– Monitor key performance indicators
– Measure customer satisfaction after each service call
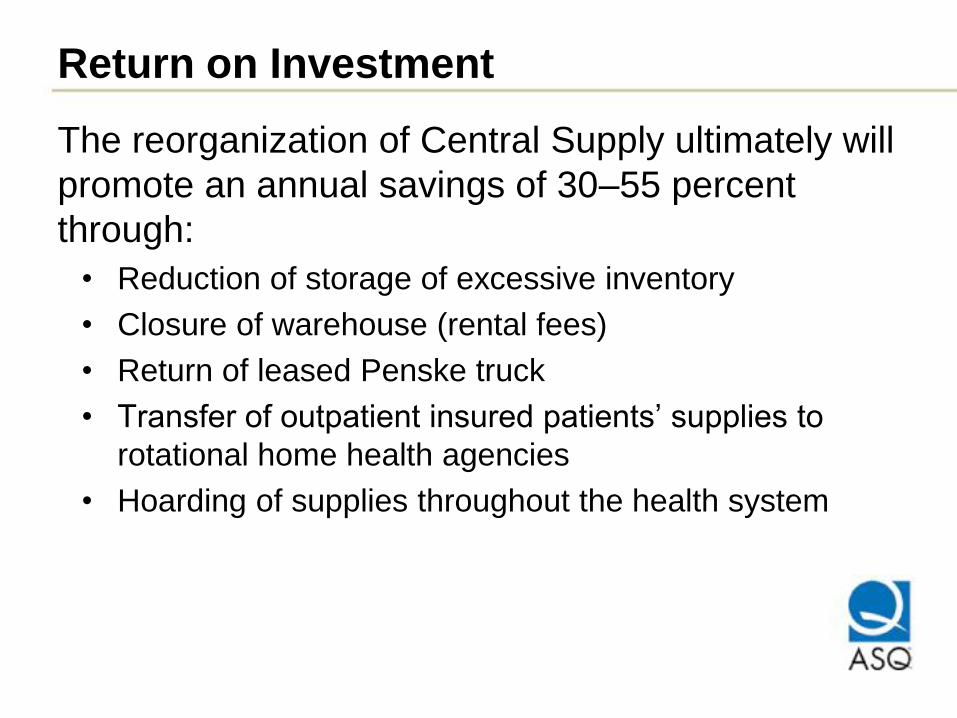
Return on Investment
The reorganization of Central Supply ultimately will
promote an annual savings of 30–55 percent
through:
• Reduction of storage of excessive inventory
• Closure of warehouse (rental fees)
• Return of leased Penske truck
• Transfer of outpatient insured patients’ supplies to
rotational home health agencies
• Hoarding of supplies throughout the health system
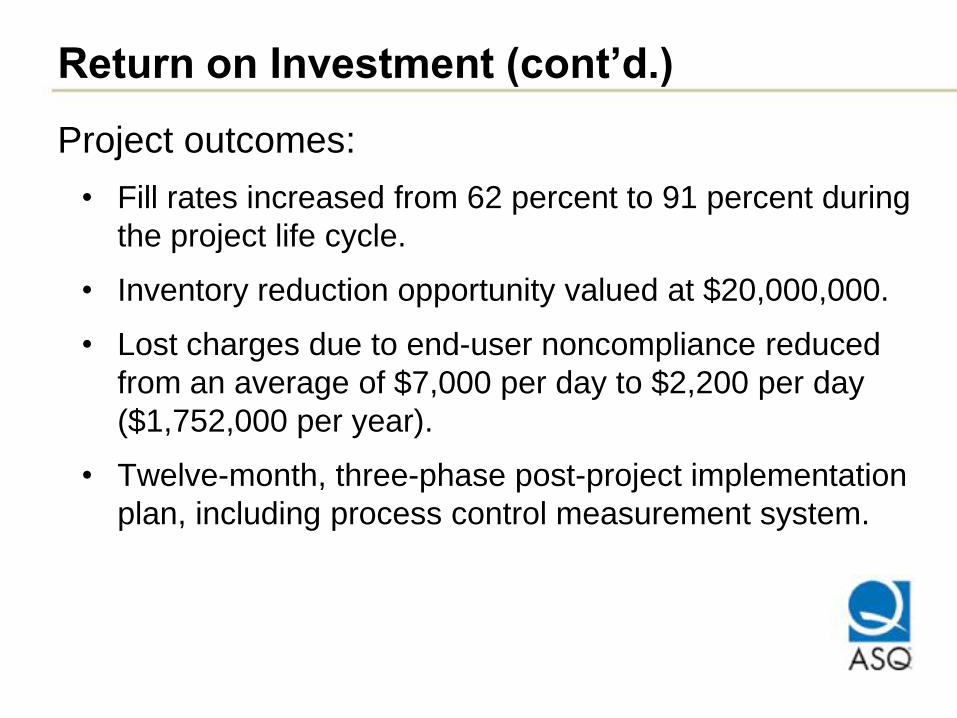
Return on Investment (cont’d.)
Project outcomes:
• Fill rates increased from 62 percent to 91 percent during
the project life cycle.
• Inventory reduction opportunity valued at $20,000,000.
• Lost charges due to end-user noncompliance reduced
from an average of $7,000 per day to $2,200 per day
($1,752,000 per year).
• Twelve-month, three-phase post-project implementation
plan, including process control measurement system.

Monitoring and Evaluating Over Time
• Process performance was monitored using Median, X-
bar, and S charts of “fill rates” and Pareto charts of
“noncompliant” cost centers and vendors of “stock-out”
items.
• A measurement system protocol was put in place to
capture key process variable data.
• Metrics aligned with strategic goals, the purpose of the
measure defined, success indicators identified and each
metric was assigned a process owner(s).

Cause and Effect Diagram
> 1000 unique
items in IDR
inventory
Process Inventory
MeasurementMan
Too few staff available to
identify items for removal
Inadequate skill
levels
End Users
Not ordering directly
from vendors
Changing products
without proper review
Too many no-move
items
>120 days in inventory
Obsolete items
Items end users can order
directly from vendors
Too many
Valuelink items
Non medicaid
reimbursable items
Inaccurate inventory
counts
Items not listed in
inventory database
Unauthorized
Activation of items
Too many manual
process steps
Inventory reduction
process is not clearly
defined
No inventory reduction
process owner
Inadequate documentation
procedures
No notification when
products are obsolete
Lack of communication
No clearly defined
protocol

Root Cause Analysis – Inventory Reduction
Inventory
• Why are there > 1000 unique items in the storeroom inventory database?
• Why are there too many discontinued, no-move, non-reimbursable, non-outpatient Valuelink and multiple SKU items in the storeroom?
• Why are the inventory records not updated regularly?
• Why are there no clearly defined protocols for the identification and removal of non-mission critical items from the storeroom?
• Why is there no process owner for the design and implementation of these protocols?
Process
• Why is the inventory control process inefficient?
• Why are there too many manual process steps?
• Why is there inadequate use of existing ProClick functions and other inventory control technologies?
• Why are there not more required trainings to expand staff skill levels?
• Why are there no documented competency evaluations to assess training needs and post-training effectiveness?
• Why is there no process owner for the design and implementation of a staff development program?

Root Cause Analysis – Inventory Reduction
SOLUTIONS
• Inventory
– ABC Analysis cycle count
– Reduce on-hand SKUs by ≥45 percent
– Identify items for Valuelink- JIT
– Identify items for vendor buy-back
• Staff Development
– SOP manuals at the workbench
– Quick-reference flip charts
– Supply chain in-services
– Training checklists and competency assessment documents
– Regular staff meetings
• Processes
– Quarterly inventory needs assessment
– Reimbursement criteria review
– Customer satisfaction review
– Strengthen GHS-vendor partnerships and lines of communication
• Approval Protocols
– Inventory status change authorization
– Inventory addition authorization
– SOP change authorization

Inventory Reduction Opportunities
PHASE 1 PHASE 2
$4,535,146.45 Annual dollar usage $10,769,648.96 Annual dollar usage
$1,587,301.22 Carrying costs (35%) $ 3,769,377.14 Carrying costs (35%)
$6,122,447.57 Inventory reduction $14,539,026.10 Inventory reduction opportunity opportunity
$-
$2,000,000.00
$4,000,000.00
$6,000,000.00
$8,000,000.00
$10,000,000.00
$12,000,000.00
$14,000,000.00
$16,000,000.00
Phase 1 Phase 2
Annual Dollar
Usage
Estimated Total
Opportunity
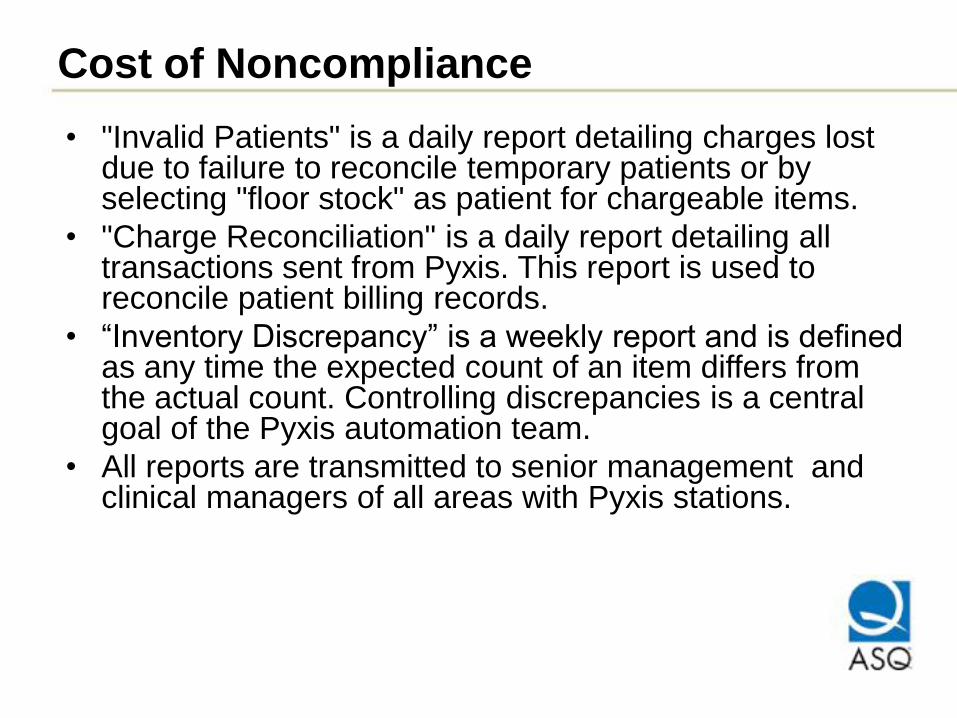
Cost of Noncompliance
• "Invalid Patients" is a daily report detailing charges lost due to failure to reconcile temporary patients or by selecting "floor stock" as patient for chargeable items.
• "Charge Reconciliation" is a daily report detailing all transactions sent from Pyxis. This report is used to reconcile patient billing records.
• “Inventory Discrepancy” is a weekly report and is defined as any time the expected count of an item differs from the actual count. Controlling discrepancies is a central goal of the Pyxis automation team.
• All reports are transmitted to senior management and clinical managers of all areas with Pyxis stations.
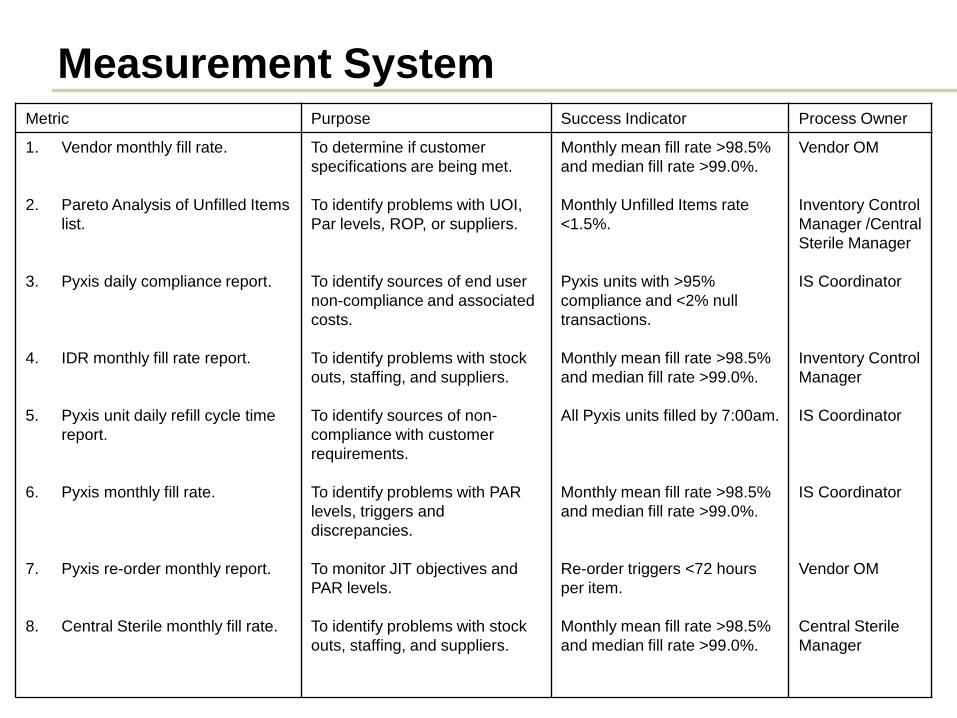
Measurement SystemMetric Purpose Success Indicator Process Owner
1. Vendor monthly fill rate.
2. Pareto Analysis of Unfilled Items
list.
3. Pyxis daily compliance report.
4. IDR monthly fill rate report.
5. Pyxis unit daily refill cycle time
report.
6. Pyxis monthly fill rate.
7. Pyxis re-order monthly report.
8. Central Sterile monthly fill rate.
To determine if customer
specifications are being met.
To identify problems with UOI,
Par levels, ROP, or suppliers.
To identify sources of end user
non-compliance and associated
costs.
To identify problems with stock
outs, staffing, and suppliers.
To identify sources of non-
compliance with customer
requirements.
To identify problems with PAR
levels, triggers and
discrepancies.
To monitor JIT objectives and
PAR levels.
To identify problems with stock
outs, staffing, and suppliers.
Monthly mean fill rate >98.5%
and median fill rate >99.0%.
Monthly Unfilled Items rate
<1.5%.
Pyxis units with >95%
compliance and <2% null
transactions.
Monthly mean fill rate >98.5%
and median fill rate >99.0%.
All Pyxis units filled by 7:00am.
Monthly mean fill rate >98.5%
and median fill rate >99.0%.
Re-order triggers <72 hours
per item.
Monthly mean fill rate >98.5%
and median fill rate >99.0%.
Vendor OM
Inventory Control
Manager /Central
Sterile Manager
IS Coordinator
Inventory Control
Manager
IS Coordinator
IS Coordinator
Vendor OM
Central Sterile
Manager
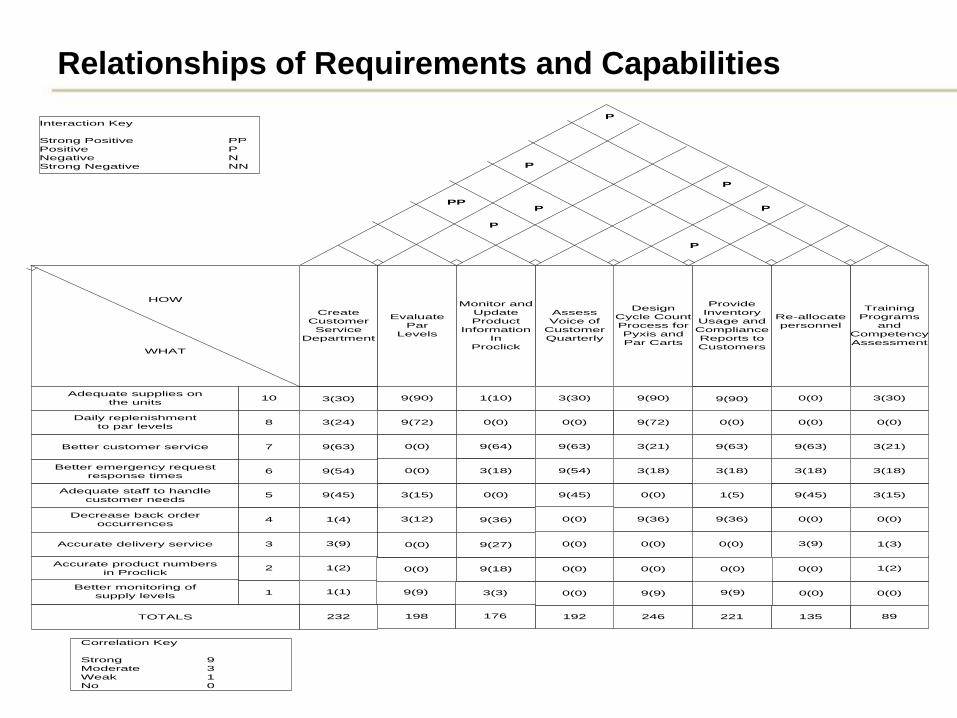
Relationships of Requirements and Capabilities
P
HOW
WHAT
Adequate supplies on
the units
Daily replenishment
to par levels
Better customer service
Better emergency request
response times
Adequate staff to handle
customer needs
Decrease back order
occurrences
Accurate delivery service
Accurate product numbers
in Proclick
Better monitoring of
supply levels
Create
Customer
Service
Department
Evaluate
Par
Levels
Design
Cycle Count
Process for
Pyxis and
Par Carts
Assess
Voice of
Customer
Quarterly
Monitor and
Update
Product
Information
In
Proclick
Training
Programs
and
Competency
Assessment
Re-allocate
personnel
Provide
Inventory
Usage and
Compliance
Reports to
Customers
10
4
5
2
3
6
7
8
1
3(30)
9(72)
9(90)
1(1)
1(2)
3(9)
1(4)
9(45)
9(54)
9(63)
3(24)
9(64)
0(0)
1(10)
9(9)
0(0)
0(0)
3(12)
3(15)
0(0)
0(0)
0(0)
9(90)9(90)3(30)
3(3)
9(18)
9(27)
9(36)
0(0)
3(18)
0(0)9(45)
3(18)3(18)9(54)
9(63)3(21)9(63)
0(0)9(72)
3(9)0(0)
0(0)
9(45)
3(18)
9(63)
0(0)
0(0)
9(36)
1(5)
9(36)0(0)
0(0)
0(0)
9(9)
0(0)
9(9)
0(0)
0(0)
0(0)
0(0)0(0)
3(15)
3(18)
3(21)
0(0)
3(30)
0(0)
1(2)
1(3)
0(0)
246192176198232 89135221TOTALS
Correlation Key
Strong 9
Moderate 3
Weak 1
No 0
Interaction Key
Strong Positive PP
Positive P
Negative N
Strong Negative NN
P
PP
P
P
P
P
P
HOUSE OF QUALITY
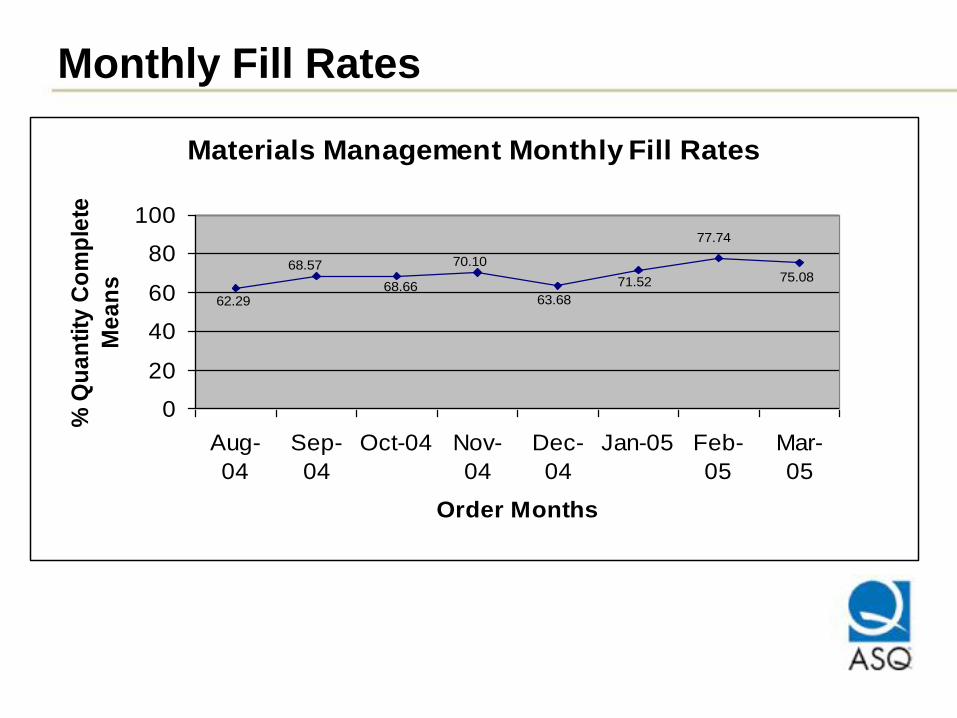
Monthly Fill Rates
Materials Management Monthly Fill Rates
62.29
68.57
68.66
70.10
63.68
71.52
77.74
75.08
0
20
40
60
80
100
Aug-
04
Sep-
04
Oct-04 Nov-
04
Dec-
04
Jan-05 Feb-
05
Mar-
05
Order Months
% Q
ua
nti
ty C
om
ple
te
Me
an
s

For More Information
• More case study presentations are available from the ASQ Healthcare Division: www.asq.org/health/quality-information/library.
• Read healthcare case study articles from ASQ: www.asq.org/healthcare-use/why-quality/case-studies.html.
• To find articles, books, courses, and other resources on healthcare quality, search the ASQ Knowledge Center:
www.asq.org/knowledge-center/search.