review of basic skills 1. scientific notation what do you know about scientific notation? the earth...
TRANSCRIPT

Review of Basic Skills 1. Scientific Notation
What do you know about scientific notation?
The earth is 4 500 000 000 years old and a human hair is 0.000045 meters in diameter – both these numbers are a hassle to write, so we need to use a method called scientific notation.
The age of earth and size of a hair can be represented by 4.5 x 10⁻⁵ and 4.5 x 10⁹. Which represents the age of the earth and the size of a human hair? What clues did you use?
Age of Earth: ____________________
Size of a hair: ____________________
What clues did you use? 4.5 x 10⁹
4.5 x 10⁻⁵ Positive exponents are for larder numbers and negative exponents for smaller numbers
Scientific notation gives us a compact way of expressing extremely large or small numbers. For example the distance from the earth to the sun is 147 100 000 km. A shorter way to write this is 1.471 x 10⁸ km.

Did you know…• Hair grows faster in warmer weather
• From one strand of hair, scientists can determine what you eat, if you smoke, and your ethnic origin.
• What they can’t tell: your gender
• A single strand of healthy hair can support 100 grams of weight. That’s about 20 Hersey kisses
• Studies show that boy’s hair grows faster than girls.

To write a number to scientific notation:1. Move the decimal point until it is behind the first non-zero number2. Count how many times you had to move the decimal point to do this3. Multiply the number by the appropriate power of 10
a. Use a positive exponent if the original number is larger than one (or if you moved the decimal to the left)
b. Use a negative exponent if the original number is smaller than one (or if you moved the decimal to the right)
Example 1 Convert 93 000 000 to scientific notation
93 000 000.
7 digits to the left
Example 2 Convert 0.000 000 047 5 to scientific notation
= 9.3 x 10⁷ 0.000 000 047 5 = 4.75 x 10⁻⁸
8 digits to the right
Note: Numbers in scientific notation must be between 1 and 10, multiplied by the proper power of 10.
Which of the following is the correct way to write 255 000 in scientific notation? (circle the correct one)
2.55 x 10⁵ or 25.5 x 10⁴

Convert the following numbers to scientific notation.
a) 0.123 = _____________________
b) 890 000 000 = _____________________
c) 240 = _____________________
d) 0.000 123 = ________________________
e) 45 000 = ________________________
f) 0.00547 = ________________________
1.23 x 10⁻¹
8.9 x 10⁸
2.4 x 10²
1.23 x 10⁻⁴
4.5 x 10⁴
5.47 x 10⁻³

Converting Scientific Notation to Decimal Number 1. Move the decimal the same number of places as the exponent.
a. If the exponent is positive, move the decimal to the right (to make a BIG number)
b. If the exponent is negative, move the decimal to the left (to make a SMALL number)
Example 1 Convert 9.5 x 10⁴ to a decimal number
9.5 x 104 = 95 000
Example 2 Convert 9.5 x 10⁻⁴ to scientific notation
9.5 x 10-4 = 0.000 95
Convert the following to decimal notation.
a) 2.3 x 10-6 = _______________ d) 1.0 x 10-4 = ______________
b) 6.75 x 108 = _______________ e) 1.52 x 107 = _____________
c)4.5 x 105 = _______________ f) 2.54 x 10-5 = _______________
0.000 002 3675 000 000450 000
0.000 0115 200 0000.000 025 4

2. Significant Digits A key skill in Science is to count the number of significant digits in a scientific quantity and then express your answer in significant digits.
Rule for Measured Quantities• Locate the first non-zero digit from the left (i.e. the leftmost digit)• This digit, and all digits to the right, are significant
0.00720 m = _______ 28 000 kg = ________
Don’t forget that zeros before are NOT
significant, but zeros AFTER are!
Try these:
First non zero number
3 significant digits
First non zero number
5 significant digits
State the number of significant digits in each of the following measurements.
a) 43.2 cm_____ b) 0.003 m _______ c) 1.030 km ______
d) 273.00 K ______ e) 0.0200 g _______ f) 12 eggs _________
3 1 4
5 3 2
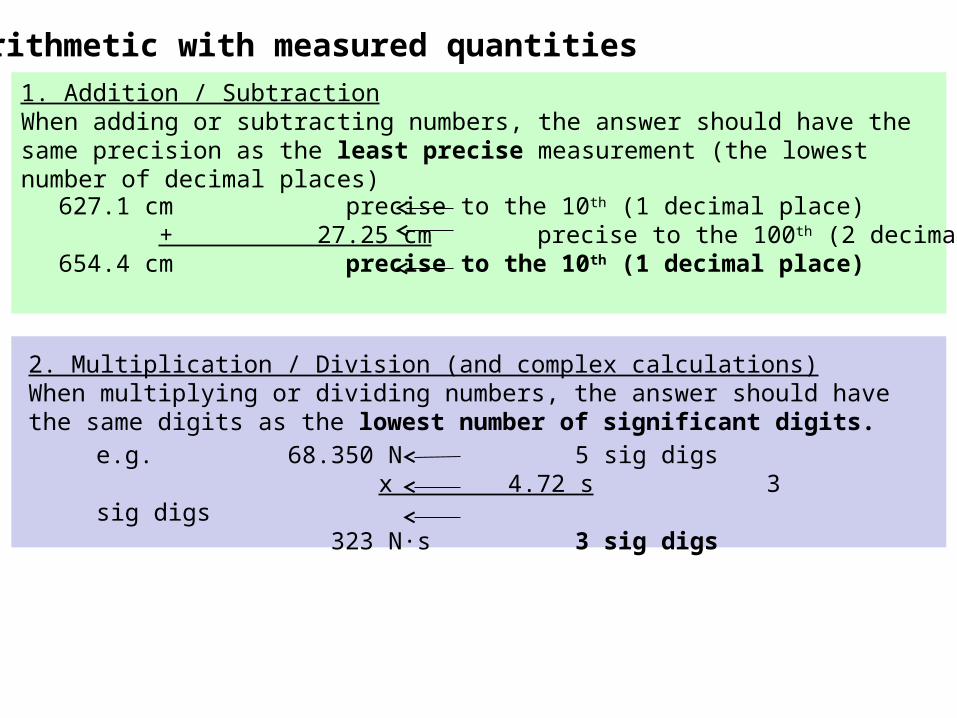
1. Addition / SubtractionWhen adding or subtracting numbers, the answer should have the same precision as the least precise measurement (the lowest number of decimal places)
e.g. 627.1 cm precise to the 10th (1 decimal place) + 27.25 cm precise to the 100th (2 decimal places)
654.4 cm precise to the 10th (1 decimal place)
2. Multiplication / Division (and complex calculations)When multiplying or dividing numbers, the answer should have the same digits as the lowest number of significant digits.
3. Arithmetic with measured quantities
e.g. 68.350 N 5 sig digs x 4.72 s 3 sig digs 323 N s∙ 3 sig digs

Solve the following and express your answer with proper significant digits.
a) 9.0 cm + 7.66 cm + 5.48 cm = _______________
b) 10.07 g - 3.1 g = _______________
c) 2.80146 s + 11.59 s = _______________
d) 2.674 m ÷ 2.0 m = _______________
e) 5.25 L x 1.3 L = _______________
f) 0.00708 kg x 48.020 m/s = _______________
g) 3.407 x 10⁸ m - 1.06 x 10⁸ m = _______________
h) 9.200 x 10⁻⁶ m ÷ 2.3x 10⁵ s = _______________
22.1 cm (since the lowest decimal place is a 10th)
7.0 g (since the lowest decimal place is a 10th)
14.39 s (since the lowest decimal place is a 100th)
1.3 m (since the lowest sig. dig. is 2)
6.8 L (since the lowest sig. dig. is 2)
10.340 kgm/s (since the lowest sig. dig. is 3)
2.35 x 10⁸ m (since the lowest decimal place is a 100th)
4.0 x 10⁻¹¹ m/s (since the lowest sig. dig. is 2)

4. Converting SI and non SI units
The number one most important resource will be your DATA BOOKLET. Don’t lose it, REFER to it regularly!
When converting units, you can set up ratios and then cross multiply.
Example Convert 2.2 minutes to seconds
1 min = 2.2 min x = 132s 60s x
We always put like units together as the numerator or denominator.

Convert the following units.
1.Britney Spears lip syncs for 2.5 hours. How many seconds is this?
1.Ringo Starr plays drums for 7200 s. He’s a drumming machine. How many hours is this?
1.The average person sleeps 2738 hours a year. How many second does the average person spend sleeping?
1 h = 2.5 h 3600 s x
since we set up our ratio with hours as the numerator, we put
the 2.5h in the numerator as well
X = 3600s x 2.5 h = 9000 s 1h
1 h = x 3600 s 7200s
X = 7200s x 1 h = 2 h 3600s
1 h = 2738h 3600 s x
X = 3600s x 2738 h = 9 856 800 s 1h

The middle! (Highlight this)
X
X
÷
÷
To convert from the common base unit to anything else, divide by the factor given!
To convert any unit to the common base, multiply by the factor given!
Or think of it as, •If you are moving into the middle, you are multiplying your stuff! •If you are moving out of the middle, you will be dividing your stuff!

Practice your conversion skills.
a.Eberle and Hall skate about 4075 metres in an Oiler hockey practice. How many kilometers is this?
a.Mr. Morris walks 0.467 km to the parkade. Ooo, what a workout. How many meters does he walk?
a.Einstein moved a 158 cm stack of books in 3.5 min. He is incredibly strong. i. How many km tall is the stack of books?
i. How many seconds did it take?
We are converting from a common base unit to something else (moving out) so we divide by the factor
4075 m ÷ 103 = 4.075 km
We are converting to the common base unit from something else (moving in) so we multiply by the factor
0.467 km x 103 = 467 m
Hint: you need to convert twice using the table. Answer: 0.00158 km
Answer: 210s

The Nature of Science
In your groups, complete the “How scientific is it activity”

What is Science?
• An activity devoted to making sense out of events in the natural world that often seem unrelated and confusing.
• In science, what we claim to know depends on connections between what we observe and what we think we already know.

The sneezing monkey (Rhinopithecus strykeri), is one of 10 newly discovered species that sneezes when it rains
The Pancake Batfish (H. intermedius) found in the Gulf of Mexico Oil Spills can walk with their arm like fins
The mind control fungus (Ophiocordyceps camponoti-balzani) grows out of an ants brain until it kills the ant itself
Science is cool

• In every experiment there is always a control group and experimental group. What is the difference?
• Consider this: A scientist wants to study the relationship between high caffeine energy drinks and the claim that they negatively affect heart rates.
Essential Skills to Experimentation
Taurine
Caffeine Did you hear about this death?


Essential Skills to Experimentation• In every experiment there is always a control group and
experimental group. What is the difference?
Controlled group: a group of participants that are kept under “normal conditions
Experimental group: a group of participants that you test something on
The larger the study sample, the more valid and reliable our data becomes!

Essential Skills: Variables• Most scientific experiments have a specific set of
variables. These are: – Manipulated variable – Responding variable – Controlled variables
These are really important!

Essential Skills: Variables
Manipulated Variable
Responding Variable
Controlled Variable
Condition that you are testing on the experimental group•Ex. Energy drinks is what we are testing in the experimental group
Condition that you are observing/recording (What are you measuring?)•Ex. Heart rate of subjects is what you will record
Conditions that must be kept the same in both groups •Ex. Gender, age and health of participants, also the amount of energy drink per day

Essential Skills: Hypothesis• Every experiment needs to have a hypothesis which
is stated before an experiment begins• What is a hypothesis?

Essential Skills: Hypothesis• What is a hypothesis and what things does it
include? • Hypothesis: educated guess based on
scientific ideas that provides a reasonable explanation for why a result is expected • Generally written as “If…then…because”
• A good hypothesis should also be testable

Essential Skills: Evidence (Data Collection)
Types of Data in Science:
Qualitative data Quantitative data

Essential Skills: Evidence (Data Collection)Types of Data in Science:
Qualitative data Quantitative data
A description of what you see
Ex. Color, texture, hot/cold, bright, smell
Data that includes numbers and can be measured
Ex. Temp, volume, distance and weight

Essential Skills: Data Analysis• Data collected is generally manipulated, transformed and
presented in a way that makes it easier to read and understand
• Analysis of data includes:– Graphs– Tables– Labeled drawings

Essential Skills: Graphing• There are two main types of graphs:
Line Graph Bar Graph
You need to be able to decide which type of graph to use

Essential Skills: Graphing• There are two main types of graphs:
Line Graph Bar Graph
• Line graphs are used when we measure something over time (time in on the x-axis)
• Data collected is continuous and we can have 2 lines on a graph
• Bar graphs are used to compare discrete data
• Bar graphs are used when we are not collecting data over time

Eight Rules of Graphing1. The title of the graph is written across the ___________ of the graph paper. The title should describe the
graph to someone who doesn’t know what the experiment is about. The word "versus should not be included.
2. On the horizontal axis place the name of the ___________________ variable and its unit of measure.
3. On the vertical axis place the name of the ______________________ variable and its unit of measure.
top
Manipulated (time)
Responding

Eight Rules of Graphing4. Calculate the values for the ___________ so the plotted data extends over _______ of the graph. All plotted points must fit on the graph paper.
5. In most cases the scales should _________________________. If not, use the zigzag at the start of the axis.
6. Plot the coordinate points for the manipulated and responding variables on the graph.
scalemost
Start at zero

Eight Rules of Graphing7. The points are joined by a smooth curve or line rather than joining the dots if necessary.
8. If you are plotting two or more variables, a legend should be placed in the _____________________________ of the graph. The legend should identify each of the lines on the graph
Bottom right hand corner

Sample Graph
Legend
Title
Lines should show the trend in the graph, but we don’t necessarily need to connect all the points

Practice Questions: Use the following information to answer the next question
To determine the effect of acid rain on corn plants, a solution of H2SO4(aq) with a pH of 4.3 was used to water a plot of two-month-old corn plants. More corn plants were grown on another plot under similar conditions but were watered with distilled water that had a pH of 7.
Experimental Variables 1 Type of soil 2 Substance used to water plants 3 Amount of light 4 Growth of plant
Match each of the experimental conditions numbered above with one of the variables given below.
Conditions: __________ __________ __________ __________ Variables: Manipulated Responding Controlled Controlled
variable variable variable variable
Answer: 2413 or 2431

For each of the following decide which of the variables would be placed on the x axis and which would be placed on the y axis.
A. You keep track of the average price of gas per week over a one year period.
(____) average price of gas per week (____) week
What type of graph would work best to show the trend of gas prices? _______________ Why did you choose this graph?
Y x
Line graph
A line graph would be used since time is continuous. Also since we are recording the price of gas, this would be our responding variable (on the y axis)
B. You measure the amount of toxin found in various animals found in the Pacific Ocean.
(____) amount of toxin (____) type of animal
What type of graph would work best to show amount of toxin is animals? ____________
Y x
Bar graph