review of applications - ndt.net · •research interest: mechatronics ... (ndt). the tsr method is...
TRANSCRIPT
Thermography of Metallic
and Composite Structures
review of applications
Jakub Roemer, Lukasz Pieczonka, Mariusz Szwedo, Tadeusz Uhl,
Wieslaw J. Staszewski
Faculty of Mechanical Engineering and Robotics
Department of Robotics and Mechatronics

Outline
• Introduction
• Application case: composite plate
• Pulsed thermography
• Vibrothermography
• Advance image processing
– Thermal Signal Reconstruction
– Principal Component Thermography
• Other applications
• Welds
• Rivets
• Wind turbine blades
• Summary

3
The former capital, now a center of science, art, culture, and higher education over 220 000 students at Krakow universities
KRAKÓW – Center of Science and Culture
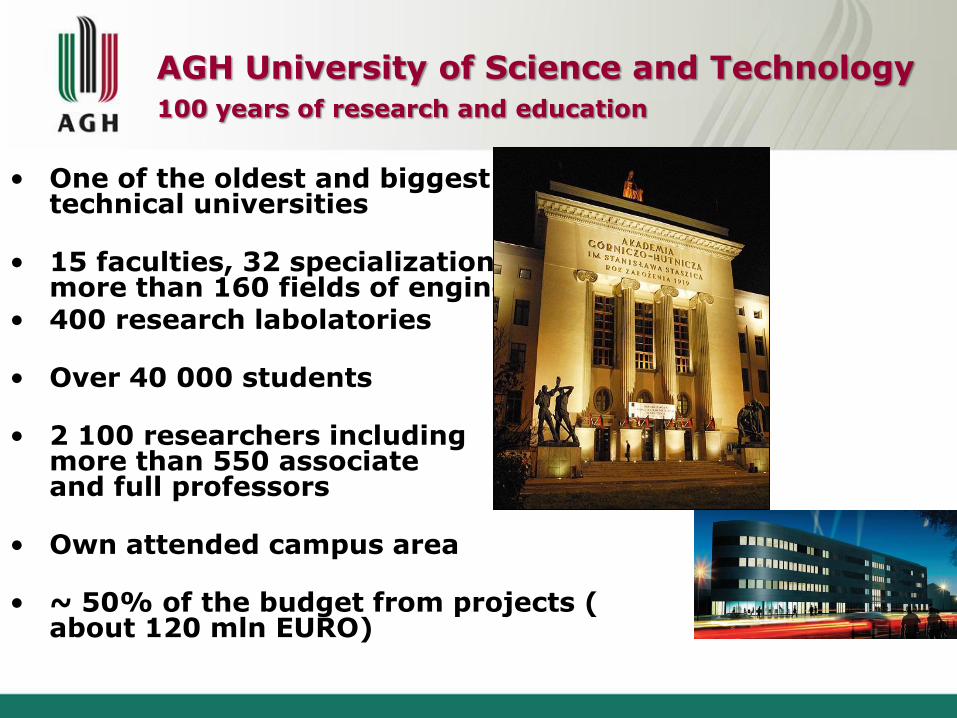
• One of the oldest and biggest Polish technical universities
• 15 faculties, 32 specializations, more than 160 fields of engineering
• 400 research labolatories
• Over 40 000 students
• 2 100 researchers including more than 550 associate and full professors
• Own attended campus area
• ~ 50% of the budget from projects ( about 120 mln EURO)
AGH University of Science and Technology 100 years of research and education
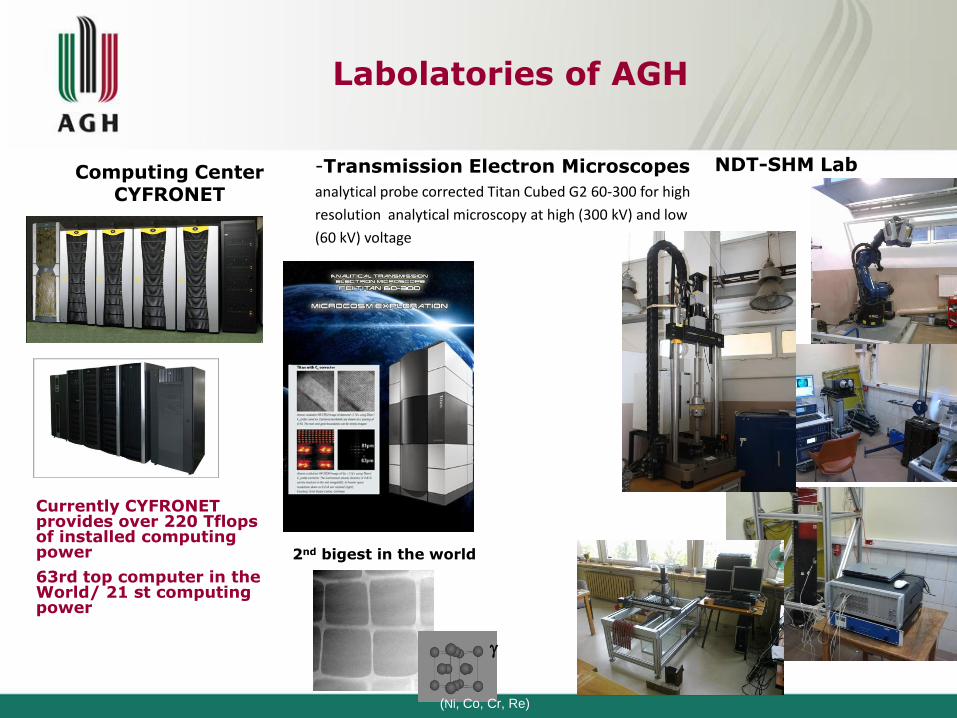
Currently CYFRONET provides over 220 Tflops of installed computing power
63rd top computer in the World/ 21 st computing power
Labolatories of AGH
Computing Center CYFRONET
NDT-SHM Lab -Transmission Electron Microscopes
analytical probe corrected Titan Cubed G2 60-300 for high
resolution analytical microscopy at high (300 kV) and low
(60 kV) voltage
2nd bigest in the world
(Ni, Co, Cr, Re)

Department of Robotics and Mechatronics
Head: Prof. Tadeusz UHL
22 permanent staff,
48 PhD students
150 postgraduate students (60 in english)
4 laboratories:
- Structural dynamics
- SHM and diagnostics
- Mechatronics and Robotics
- Numerical modeling and simulation
3 - 7 PhD thesis per year
60 MSc thesis per year
• Professor of Mechanical Engineering – Department of
Robotics and Mechatronics (since 2009)
• BEng and MSc -Technical University of Poznań - 1985/86;
PhD – University of Manchester – 1994; DSc – Polish
Academy of Sciences - 2001;
WIESLAW J. STASZEWSKI
• Research interest: structural dynamics, structural health monitoring and
condition monitoring , smart structures and materials, advanced signal
processing;
• 22 years of research experience in England (Manchester University, Sheffield
University – Professor of Mechanical Engineering since 2005);
• Contributed to almost $6M of research funding (Airbus, Alenia, Astrium, BAE
SYSTEMS, DSTL, EADS, EPSRC, EU,ESA, FNP, Fiat, Messier-Dowty, QinetiQ,
Rolls-Royce);
• Over 250 research publications (includes 11 book contributions and over 80 peer-
reviewed journal papers); citation – h=22;
Structural Health Monitoring
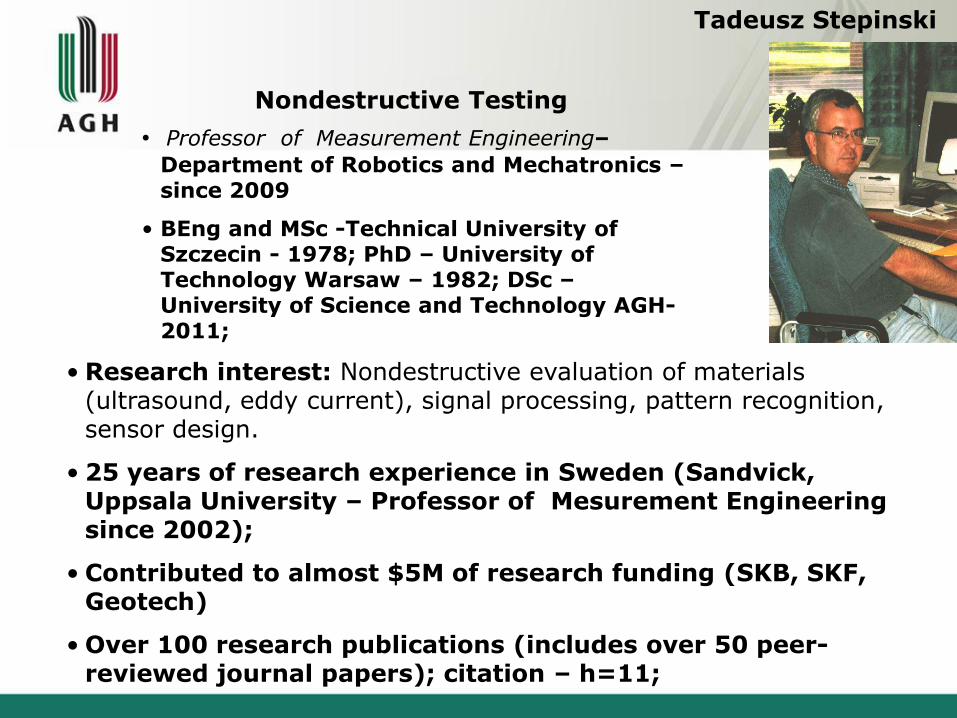
• Professor of Measurement Engineering–
Department of Robotics and Mechatronics – since 2009
• BEng and MSc -Technical University of Szczecin - 1978; PhD – University of Technology Warsaw – 1982; DSc – University of Science and Technology AGH- 2011;
• Research interest: Nondestructive evaluation of materials (ultrasound, eddy current), signal processing, pattern recognition, sensor design.
• 25 years of research experience in Sweden (Sandvick, Uppsala University – Professor of Mesurement Engineering since 2002);
• Contributed to almost $5M of research funding (SKB, SKF, Geotech)
• Over 100 research publications (includes over 50 peer-reviewed journal papers); citation – h=11;
Tadeusz Stepinski
Nondestructive Testing

Research interests:
- vibration signal analysis
- automated machinery monitoring
- fault detection in varying speed and load conditions
- development of new IT technologies for M&D
- embedded systems
- large data centers
22 years of research and industrial experience
Contributed to over $3.5M of research funding (FP6, FP7:
Alstom Power, Solaris, Vulcan, IFFM)
Over 200 research publications; citation – h=6
Tomasz BARSZCZ
Condition Monitoring

• Professor of Mechatronics – Department of
Robotics and Mechatronics – since 1990
• BEng and MSc –AGH - University of Science and Technology 1980; PhD – AGH - University of Science and Technology – 1983; DSc – University of Science and Technology AGH- 1990;
• Research interest: Mechatronics – measuring systems design, Modeling and simulation – multiphysics, multiscale, Identification, structural dynamics, SHM of composite and metalic structures, smart structures and materials, signal processing
• 25 years of research experience in Poland (AGH - University of Science and Technology, EC Group – Professor of Mechatronics since 1991); 3 yeras of experience in France (INSA Lyon) 1 year in Belgium (LMS), 1 year in The Netherland Eindhoven Institute of Technology, 2 years in IIT (USA)
• Contributed to almost $10M of research funding (EU FP5 (SNECMA, Rolls-Royce, MAN Turbo, Alstom) , FP6 (Airbus, Dassault, Onera, LMS) , FP7 (FIAT, RENAULT, LMS, Bombardier Transportation, Alstom Transport, ABB, Alstom Power, Solaris, FIAT)
• Over 600 research publications (includes over 40 peer-reviewed journal papers); citation – h=10;
Tadeusz Uhl Mechatronics

Our department activities
Research projects: Sinopsys (Eureka), Helisafe (Copernicus), MechCont (Copernicus) FLITE (Eureka), CAME GT –gas turbine monitoring 5FP MONIT, MADUSE, EndOfLine, CIDAF, CHASING, THERMOMAT Polish Ministry of Higher Education and Scientific Research - 15 projects Universities – project partners Sheffield University, Universität Innsbruck, Katolieke Universiteit Leuven, Vrije Universiteit Brussel, Universite de Technologie de Compiegne, INRIA, IRISA, Universität Stuttgart, University of Stavanger, Georgia Tech, UCSD, Bristol, Trinity College, Hong Kong Poly, Los Alamos Laboratories; Fraunhofer Institute, DLR (space robotics), Cleveland University (rotors) Strong cooperation with: International industry – Delphi, ALSTOM Power, Valeo, ABB, FESTO, HTL, ALSTOM Transport, Bombardier Transportation, TEAC, Ratier, Fiat, Renault, Airbus, Dassault, Onera, LMS, FUCHOSA, TRW, UTC, Teneco (SIKORSKY, P&W), Motorola, VULCAN (SEAcom GmbH), EBCC, Swidnik (Augusta/Westland), Volkswagen, Solaris, Stomil Sanok, [Airbus, Alenia, Astrium, BAE SYSTEMS, DSTL, EADS, EPSRC, EU,ESA, FNP, Fiat, Messier-
Dowty, QinetiQ, Rolls-Royce – prof. Staszewski references]
Polish industry – aviation, rail transport, power plants, oil & gas, air force Spin-off company; EC Group, EC System, UAVS Poland, MONIT SHM sp. z o.o
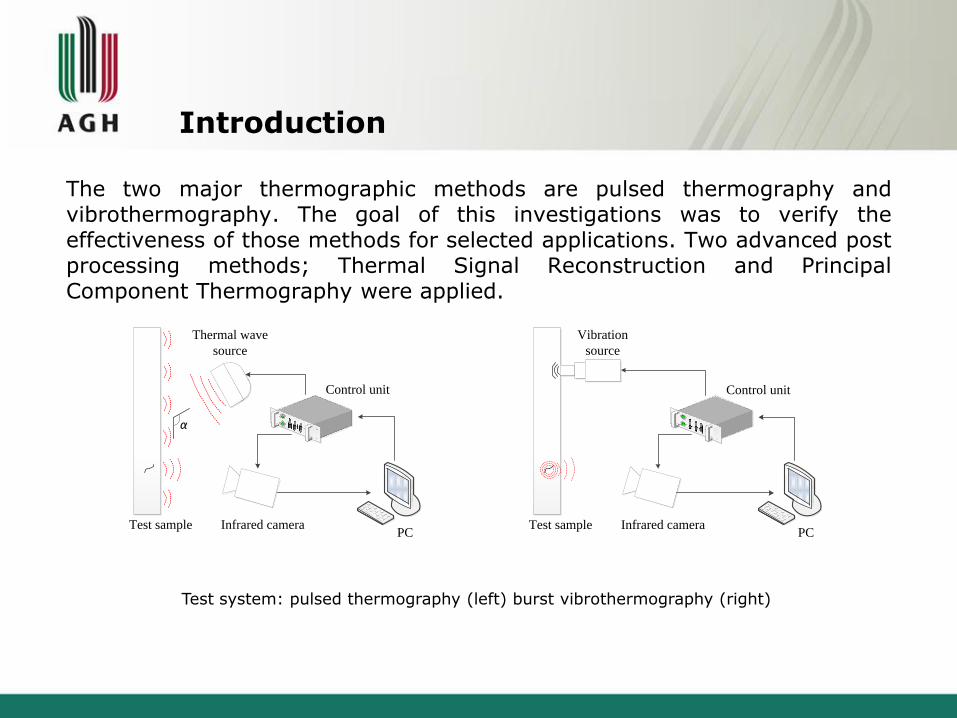
Introduction
The two major thermographic methods are pulsed thermography and vibrothermography. The goal of this investigations was to verify the effectiveness of those methods for selected applications. Two advanced post processing methods; Thermal Signal Reconstruction and Principal Component Thermography were applied.
Thermal wave
source
PC
Control unit
Infrared cameraTest sample
α
Vibration
source
PC
Control unit
Infrared cameraTest sample
Test system: pulsed thermography (left) burst vibrothermography (right)
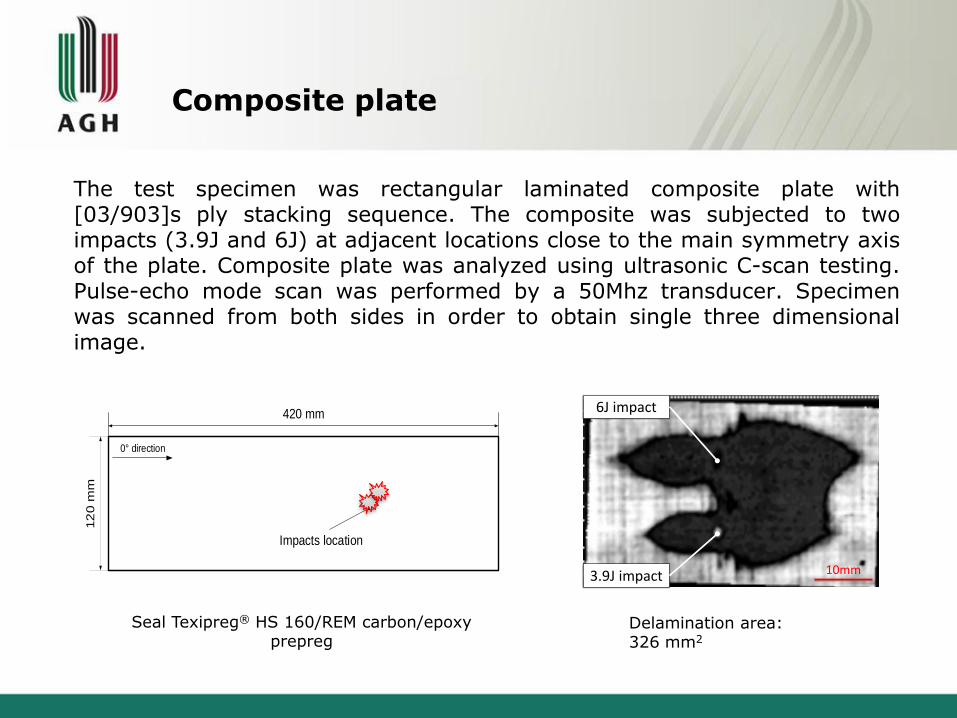
Composite plate
The test specimen was rectangular laminated composite plate with [03/903]s ply stacking sequence. The composite was subjected to two impacts (3.9J and 6J) at adjacent locations close to the main symmetry axis of the plate. Composite plate was analyzed using ultrasonic C-scan testing. Pulse-echo mode scan was performed by a 50Mhz transducer. Specimen was scanned from both sides in order to obtain single three dimensional image.
420 mm
12
0 m
m
Impacts location
0° direction
Seal Texipreg® HS 160/REM carbon/epoxy prepreg
6J impact
3.9J impact 10mm
Delamination area: 326 mm2

Experimental measurements
Experiments were performed using both pulsed thermography and vibrothermography. Temperature maps of the damaged area were obtained from measurements and are shown below. Three dimensional temperature maps were obtained using ThermoAnalysis® software package (MONIT SHM Ltd.).
TNDT results: pulsed thermography in reflection mode thermal background subtracted(a) burst vibrothermography (b)
(a) (b)

ThermoAnalysis® software
MONIT SHM LLC Ul. Lublanska 34 31-476 Krakow, Poland http://www.monitshm.pl

Vibrothermographic test system
Laboratory test system
Field test system

Vibrothermography
Vibrothermographic measurements were performed with a 35kHz ultrasonic source working for 500ms. Increase of temperature on the damaged area is shown below. Marker p1 is placed over damaged area, marker p2 is placed over healthy area. Behavior of the two cases is completely different and there is no problem in distinguishing between damaged and healthy areas.
p1
p2
Tem
pera
ture
[a.u
.]
0 1 2 3 4 5Time [s]
Response
Mechanical excitation
p2
p1
Power: 600W Time: 500ms Frequency: 35kHz
p1 – defect p2 – sound area

Pulsed thermography
Pulsed thermography were performed in the reflection mode. Markers p1-p4 are located over damaged areas, marker p5 is placed over healthy area. The presence of damage can be easily identified, but the evaluation of the extent of damage is not straightforward. Additional thermal image processing steps have been conducted.
Tem
pera
ture
[a.u
.]
0 5 10Time [s]
Optical excitation
Power: 2000W Time: 1s
Time
Tem
p.
Time
Tem
p.
P5
P1
p1-p4 – defects p5 – sound area
Response
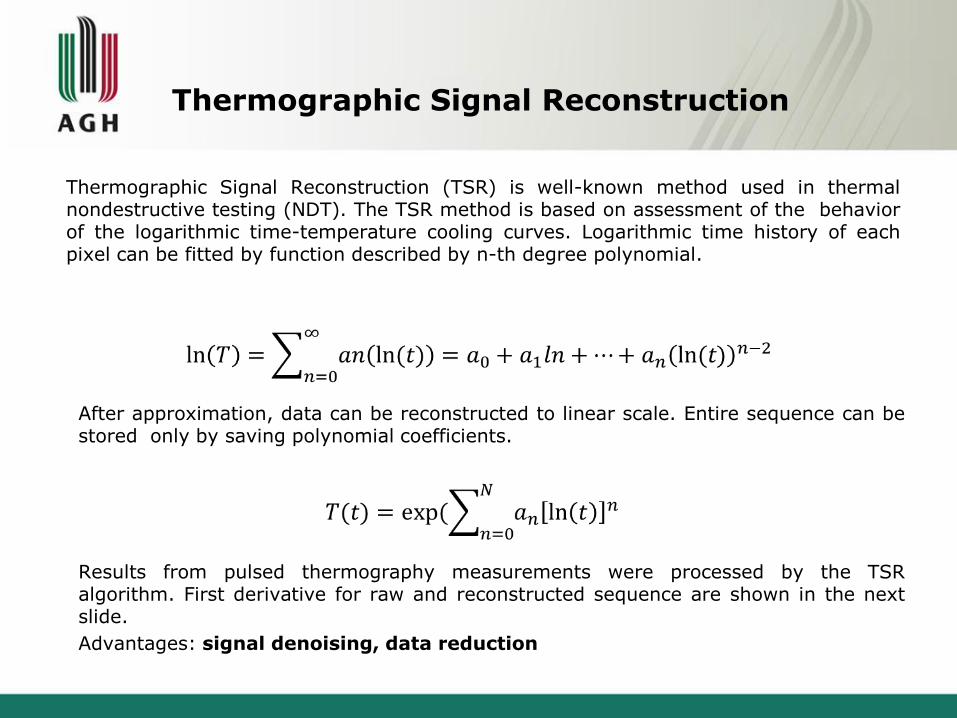
Thermographic Signal Reconstruction
Thermographic Signal Reconstruction (TSR) is well-known method used in thermal nondestructive testing (NDT). The TSR method is based on assessment of the behavior of the logarithmic time-temperature cooling curves. Logarithmic time history of each pixel can be fitted by function described by n-th degree polynomial.
Results from pulsed thermography measurements were processed by the TSR algorithm. First derivative for raw and reconstructed sequence are shown in the next slide.
Advantages: signal denoising, data reduction
After approximation, data can be reconstructed to linear scale. Entire sequence can be stored only by saving polynomial coefficients.

Thermographic Signal Reconstruction
TSR algorithm
Data acquisition Cold image subtraction
Scaling to natural logarithm
Linear regression
Invert scaling operation + thresholding
Reconstructed data image
0 1 2 3 4 5 6-0.8
-0.6
-0.4
-0.2
0
0.2
0.4
0.6
Time (s)
dT
/dt
(DL/s
)
1 2 3 4 520
40
60
80
100
120
140
160
Time (s)
Tem
pera
ture
(K
)
1 2 3 4 520
40
60
80
100
120
140
160
Time (s)
Tem
pera
ture
(K
)
S. M. Shepard, J. R. Lhota, B. A. Rubadeux, D. Wang, and T. Ahmed, Reconstruction and enhancement of active thermographic image sequences,”Optical Engineering, vol. 42, no. 5, pp. 1337–1342
Thermographic Signal Reconstruction
0 1 2 3 4 5 6-0.8
-0.6
-0.4
-0.2
0
0.2
0.4
0.6
Time (s)
dT
/dt
(DL
/s)
0 1 2 3 4 5 6-0.4
-0.35
-0.3
-0.25
-0.2
-0.15
-0.1
-0.05
0
Time (s)
dT
/dt
(DL/s
)
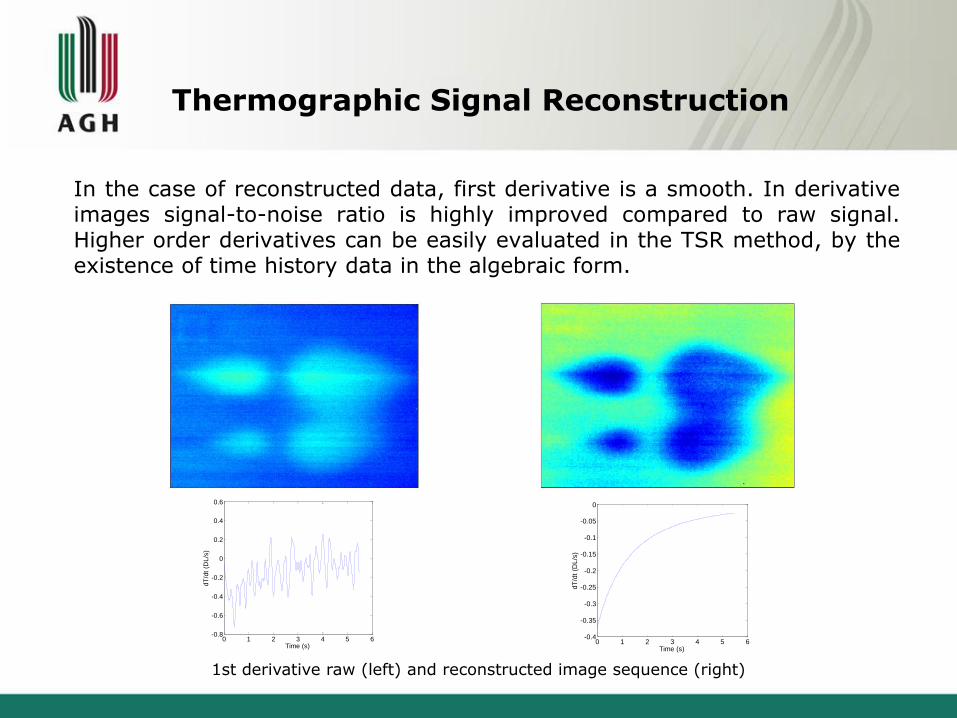
1st derivative raw (left) and reconstructed image sequence (right)
In the case of reconstructed data, first derivative is a smooth. In derivative images signal-to-noise ratio is highly improved compared to raw signal. Higher order derivatives can be easily evaluated in the TSR method, by the existence of time history data in the algebraic form.

Weld testing
The effectiveness of vibrothermography was verified on a welded steel sample. The test sample was a steel plate 200×100×10mm. Two types of defects were manufactured: 21mm long crack at the root of the weld (a) and 19mm long lack of root fusion (b). Vibrothermographic test have revealed position and sizes of both root crack and lack of root fusion. Defects are clearly visible and can be easily evaluated.
Root crack
Lack of root fusion
Butt weld
Welded plate 200x100x10mm
Fidelity: Root crack – 89,5% Lack of root fusion – 95,5%

Rivets testing
Vibrothermography were also carried out in order to test the ability to identify loose rivets. Test were performed using the mobile vibrothermographic test system, directly on the aircraft, without disassembling the panels. The measurements were conducted on the fuselage and wing panels of Mikoyan MiG-29.
Mikoyan MiG-29 The measurements conducted directly on the aircraft

Rivets testing
Results of vibrothermographic tests are shown in figure below. White circles illustrate the location of all rivets in the analyzed region. An increase temperature was detected in the area around one of the rivets. Temperature immediately increase after the application of ultrasonic excitation.
Power: 500W Time: 500ms Frequency: 35kHz
Identified loose rivet and the related temperature evolution
Principal Component Thermography
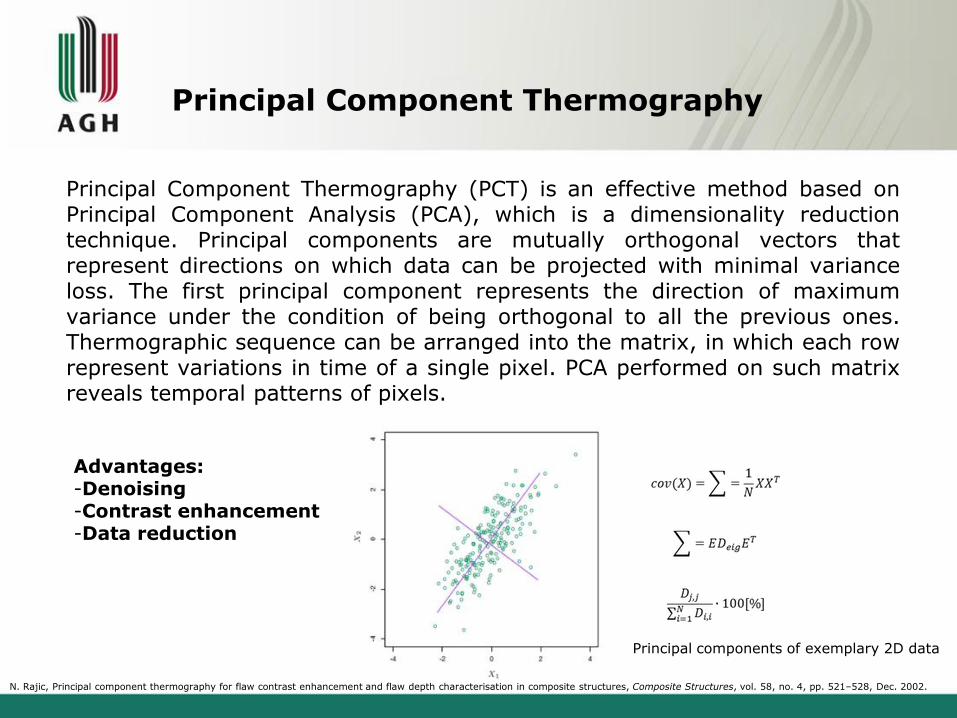
Principal Component Thermography (PCT) is an effective method based on Principal Component Analysis (PCA), which is a dimensionality reduction technique. Principal components are mutually orthogonal vectors that represent directions on which data can be projected with minimal variance loss. The first principal component represents the direction of maximum variance under the condition of being orthogonal to all the previous ones. Thermographic sequence can be arranged into the matrix, in which each row represent variations in time of a single pixel. PCA performed on such matrix reveals temporal patterns of pixels.
Principal components of exemplary 2D data
Advantages: -Denoising -Contrast enhancement -Data reduction
N. Rajic, Principal component thermography for flaw contrast enhancement and flaw depth characterisation in composite structures, Composite Structures, vol. 58, no. 4, pp. 521–528, Dec. 2002.

Principal Component Thermography
PCT was originally designed for pulse thermography, but its fundamental concept is perfectly applicable to burst vibrothermography. Vibrothermographic measurements were performed for riveted plates. The principal components show clear images of thermal features. We have developed an accelerated PCT algorithm allowing for an efficient computation of principal components with minimal computational effort.
Figures below show comparison between images obtained from cold frame subtraction and 2nd principal component.
Raw image with cold frame subtraction
2nd principal component
R. Cycoń, Post-processing and inference techniques in vibrothermography nondestructive testing, MSc Thesis, AGH University, Krakow, 2013
Wind turbine blade
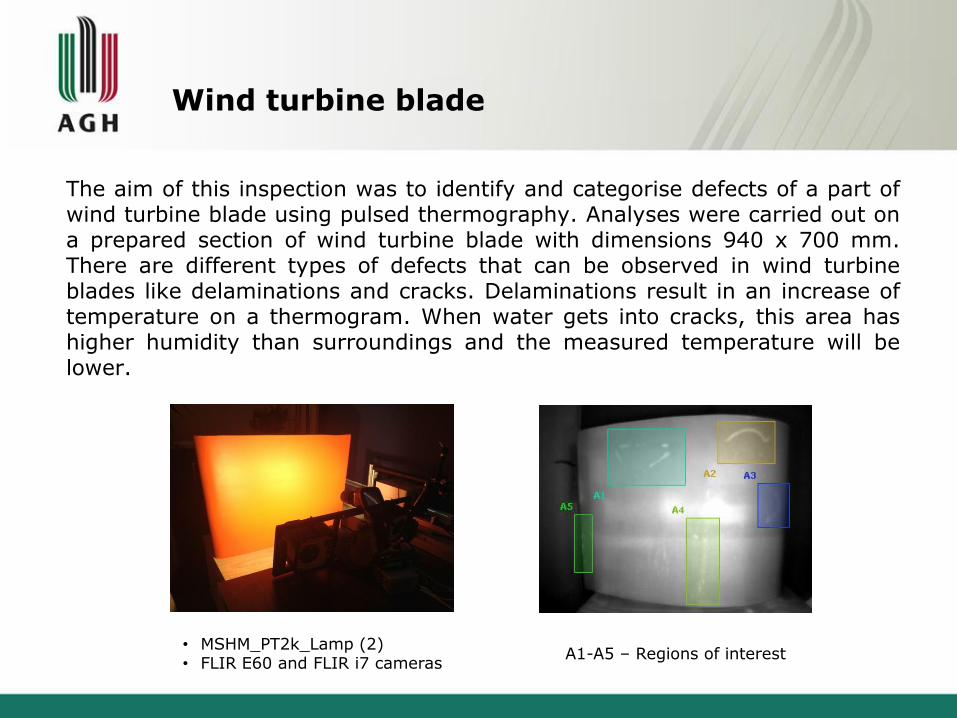
The aim of this inspection was to identify and categorise defects of a part of wind turbine blade using pulsed thermography. Analyses were carried out on a prepared section of wind turbine blade with dimensions 940 x 700 mm. There are different types of defects that can be observed in wind turbine blades like delaminations and cracks. Delaminations result in an increase of temperature on a thermogram. When water gets into cracks, this area has higher humidity than surroundings and the measured temperature will be lower.
A1-A5 – Regions of interest • MSHM_PT2k_Lamp (2) • FLIR E60 and FLIR i7 cameras
Summary
• Selected applications of thermographic nondestructive testing were
presented
• We have developed hardware and software solutions for TNDT including
pulsed thermography and vibrothermography test setup.
• Case studies for weld testing in steel samples, rivet testing in aluminum
and composite wind turbine blade testing were shown
• The tests confirmed the effectiveness of thermographic methods for
composite, steel and aluminum structures
• An improvement in the diagnostic image quality was achieved using the
classical Thermal Signal Reconstruction method and by the accelerated
Principal Component Thermography method.

Thermography of Metallic
and Composite Structures
review of applications
Jakub Roemer, Lukasz Pieczonka, Mariusz Szwedo, Tadeusz Uhl,
Wieslaw J. Staszewski
Faculty of Mechanical Engineering and Robotics
Department of Robotics and Mechatronics