review article foliar litter decomposition: a conceptual
TRANSCRIPT

Review ArticleFoliar Litter Decomposition A Conceptual Model withFocus on Pine (Pinus) LittermdashA Genus with Global Distribution
Bjoumlrn Berg
Department of Forest Sciences University of Helsinki FIN-00014 Helsinki Finland
Correspondence should be addressed to Bjorn Berg bb0708212424gmailcom
Received 17 November 2013 Accepted 12 December 2013 Published 27 April 2014
Academic Editors J Kaitera and S F Shamoun
Copyright copy 2014 Bjorn Berg This is an open access article distributed under the Creative Commons Attribution License whichpermits unrestricted use distribution and reproduction in any medium provided the original work is properly cited
The genus Pinus encompasses c 120 species and has a global distribution Today we know more about the decomposition of pineneedle litter than litter from any other genus This paper presents a developed conceptual three-phase model for decompositionbased on pine needle litter starting with newly shed litter and following the process until a humus-near stable residue The paperfocuses on themass-loss dynamics and factors regulating the process in the early phase the late one and the humus-near phase Forthe late phase the hampering influence of N and the rate-enhancing effect of Mn on the decomposition are given extra attentionEmpirical factors related to the limit valuestable residue are discussed as well as the decomposition patterns and functions forcalculating limit values The climate-related litter concentrations of N and Mn are discussed as well as their possible influence onthe size of the stable residue which may accumulate and sequester carbon for example in humus layers The sequestration ofcarbon in humus layers is discussed as well as the effect of tree species on the process Although the paper focuses on litter of pinespecies there are comparisons to studies on other litter genera and similarities and differences are discussed
1 Introduction
The process ldquoplant litter decompositionrdquo is quantitatively aslarge as the photosynthesis The process is necessary forthe recirculation of nutrients and a continued buildup ofplant biomass as well as for the maintenance of food websthrough the energy released by the degradation of organiccompounds
The main process which we a bit simplified call ldquoplantlitter decompositionrdquo is extremely complex and can besubdivided into a multitude of subprocesses These includenot only release of nutrients but also a stepwise degradation ofthemain chemical compounds present in the shed litter Alsosynthesis processes are included in the concept resultingin new compounds which in turn may recombine oftencreating a recalcitrance of the remaining litter mass In spiteof its importance this system of subprocesses is mainlyunknown
The concept ldquoplant litterrdquo is wide both regarding com-ponents and their chemical composition and foliar litterappears to be the litter fraction that has been most stud-ied Still with foliar litter of different species having very
different chemical composition (eg DELILA III data basehttpwwwekoujedupldeco) we may expect differentdecomposition patterns among species or at least amonggenera Also bark twig branch root and foliar litter fromthe same plant may have different chemical composition andthus follow different decomposition patterns
To create a first comprehensive image of the decomposi-tion process as such we may need to create at least a concep-tual model ideally based on one litter species or one genusSuch amodel should include influences of litter nutrients andorganic components as well as rate-regulating factors and thelitterrsquos contribution to accumulation of soil organic carbonTo do this we need to formulate basic questions about theprocess simple questions that are reflecting what we need toknow
An example for a long time there was a generallyaccepted assumption that litter decomposed completely andthus decomposition rates were considered to be not onlyof high interest but also a main parameter as discussed byPrescott [1] However questions based on such assumptionswere of less value as it has shown that rates may range from ahigh one for newly shed litter to close to zero at a later stage
Hindawi Publishing CorporationISRN ForestryVolume 2014 Article ID 838169 22 pageshttpdxdoiorg1011552014838169
2 ISRN Forestry
well before the litter is completely decomposed At presentwe may describe such changes in rate in just general termsand for just a few species
By tradition there appears to be a general opinion andimage that climate rules decomposition on a regional scalewhereas litter chemical composition dominates the processon a local oneThe picturemay bemore complicated thoughand is not entirely correct Meentemeyer [2] and later Berg etal [3] and Kang et al [4] demonstrated a large-scale effectof climate on decomposition rate of newly shed plant litterHowever such an effect is not general to all litter species [56] and not to all decomposition stages [7] but the changedsubstrate composition may dominate decomposition ratesmdashat least for some foliar litter species
The influence of the substrate on the decomposition pro-cess may thus be such that the proposed climate change anda suggested raise in temperature may be without influenceon the mineralization rate of soil organic matter (SOM)Such a substrate influence is due to the changed chemicalcomposition during decomposition What may cause theincreasing recalcitrance of partly decomposed litter and thedecrease in decomposition rate is today not clear althoughthe well-established decrease in rate has been related toconcentration of gravimetric lignin in litter (Acid Unhydro-lyzable ResiduemdashAUR) This relationship was observed byFogel and Cromack [8] and later developed [2 7] to differentclimate situations However new analytical techniques havemade it clear that the concept AUR may be complex andappears to encompass native lignin waxes tannins cutinsas well as newly synthesized compounds [9 10]
A subdivision of AUR into different components maybe of help to distinguish what compounds that accumulatein litter and what factors that influence their degradationWe cannot exclude that the developing 13C-NMR techniquemay change the concept of native lignin as a recalcitrantcompound
In most Nordicboreal coniferous forests the number ofsoil animals is low [11] which means that the decompositionis mainly microbial and more than 90 is carried outby microorganisms The dominant microbial degradationmay facilitate the interpretation of decomposition data aswell as the application of microbial mechanisms to thedecomposition process Further the lack of burrowing soilanimals creates intact humus layers which facilitates thedetermination of carbon (C) sequestration
A help parameter for decomposition studies was foundby Howard and Howard [12] as they estimated a level ofthe accumulated mass loss with the decomposition rate zerowhich later has been called a ldquolimit valuerdquo for decompositionThey used a function giving an asymptote Their studywas confirmed by Wieder and Lang [13] who introduced amore handable function (Equation 3 Section 334) Laterthe concept was developed [14 15] including the suggestionof a negative influence of nitrogen (N) concentration onthe limit value The pattern described by (3) means that theaccumulatedmass loss approaches a limit value which can bedescribed by an asymptotic function
So far such limit values have been described mainly forlitter in forest systems in boreal and temperate areas andrecently also for subtropical and tropical ones [16 17] Litter atthis stage may be assumed to be close to SOM as discussed byBerg et al [18] who used litter N concentration as an internalmarker
Limit values for 106 sets of 21 species of decomposingfoliar litter from natural forest systems were estimated [19]using litters representing a wide range in chemical composi-tion A highly significant negative relationship between limitvalues and initial litter N concentrations was found [19]Limit values for pine (Pinus) species have also been positivelyrelated to initial concentrations of manganese (Mn) [20 21]
With the massive information in the data base fromthe Long-term Intersite Decomposition Experiment Team(LIDET) confirming that decomposing foliar litter leaves astable residue [16 17] we may expect that the focus of interestfor decomposition studies may change to be more directedtowards (i) explaining the retardation of the decompositionprocess (ii) developing the concept limit value that definesthe stable fraction and (iii) explaining the stability of theresidue Hopefully future studies will be more directedtowards single species or genera as was suggested in a recentsynthesis paper [22]
That long-term humus buildup and storage are possiblewas shown by Wardle et al [23] when they determined sucha buildup to have taken place for close to 3000 years Thebuildup was reconstructed quantitatively [24] using foliarlitter fall and the remaining stable fraction Such a buildupis not uncommon and the property of humus-layer depthhas been presented as a dominant property of a humus formldquoTangelhumusrdquo [25] This humus form with up to c 1mdeep humus layers has been described for the Alps and formountains in Central Europe
The reconstruction of humus layers has been extended toencompass the sequestration of N [26 27] The approach ofusing limit values seemed to make it possible to quantify theremaining recalcitrant mass in the very late stages and mayallow a further evaluation Such a relative stability may beimportant for the sequestration of carbon dioxide (CO
2) in
humusAs regards the long-term stability of humus the infor-mation is scarce and to some extent contradictoryThus Bergand Matzner [28] report that increasing N concentrationsin humus decrease the decomposition rate That report wasbased on a study of Bringmark and Bringmark [29] coveringa gradient along Sweden In contrast there are reports onextremely active humus disintegration that may be related tohumus N concentrations [30]
The aim of this paper is to review and organize existingknowledge of the decomposition of foliar litter with focuson pine species (Pinus) needle litter The information will beorganized into a structure to create a system of influencingfactors on the decomposition process starting with newlyshed litter and following it to SOM and C sequestration Tothis purpose I have reviewed existing information on Scotspine (Pinus sylvestris) needle litter and other pine species Areason to this choice is thatwe seem to havemore informationabout pine needle litter and its decomposition than of anyother litter species or genus Further with c 105 to 125
ISRN Forestry 3
Table 1 Some abbreviations acronyms and specific terms used inthis paper
Acronym MeaningMAT Mean annual temperature (∘C)MAP Mean annual precipitation (mm)AET Annual actual evapotranspiration (mm) acc to [2]PET Potential evapotranspiration (mm) acc to [2]
AURAcid Unhydrolyzable Residue or gravimetric lignin(refers to different methods eg sulfuric acidlignin Effland lignin acid detergent lignin) Seefor example [9 10]
identified pine species now with global distribution andoccurring in boreal temperate and subtropical forests weappear to have a model substrate decomposing in severalenvironments and climate situations Pine litter alreadyhas been suggested as a reasonable model substrate [22]Throughout the paper I will focus on the components NMnAUR and native lignin As far as we know today these are keycomponents in the decomposition process not excluding thatfurther factors may be identified
Further I discuss (i) what parameters that may be ofimportance for a characterization of a given decompositionpattern (ii) if the presented conceptual model may be of usefor further genera of foliar litter and (iii) if developing analyt-ical tools may change basic findings about the decompositionprocess
Data and information is taken from the literature withfocus on foliar litter of Scots pine and other pine speciesI repeatedly quote the DELILA database (DELILA II andDELILA III httpwwwekoujedupldeco)
2 Terminology
Abbreviations acronyms and specific terms are collected inTable 1 and in part explained below
Accumulated Mass Loss The total amount of litter mass lostfrom a decomposing litter substrate normally expressed as apercentage of initial mass
AUR (Acid Unhydrolyzable Residue) refers to gravimetriclignin such as sulfuric-acid lignin and Effland lignin
Decomposition Pattern refers to the general development ofaccumulated litter mass loss with time Often the decompo-sition rate slows down and ceases with the consequence thatthe accumulated mass loss does not increase At the rate zerowe may estimate a ldquolimit valuerdquo with a so far known rangefrom c 42 to 100 See also [21]
Holocellulose A term covering cellulose plus hemicellulosesand thus the polymer carbohydrates in litter
Limit Value is the calculated value for the extent of decompo-sition of a given litter type at which the decomposition rateapproaches zeroLimit value may be given as accumulated
mass loss () or as a fraction It may also be calculated usingremaining amount and then given as percentage remainingamount
3 Discussion
31 The Chemical Composition of Pinus Foliar Litter withFocus on Nutrients and AUR
311 Organic-Chemical Composition
Some Comments There is limited information on organiccompounds in foliar litter Cellulose hemicellulose and AURare the quantitatively dominant ones (Tables 2 and 3) witha variation in proportions between annual litter falls andamong species The developing 13C-NMR technique hasgiven us a tool that may open new possibilities to work onplant litter although so far this technique gives the quantityof specific bonds rather than compounds and we will discussboth the new method and the more traditional ones
Several studies on chemical composition have beenmadeusing extractions of hemicellulose and cellulose based onsolubility in alkaline solutions (eg acid detergent lignin) andalthough useful they are not included in this review as theyare less specific
Traditional Techniques Available detailed data on organiccomponents in foliar litter is old today and few studies havebeen carried out which separates the specific components[31] Separating solid substance and different soluble frac-tions the authors identified 44 organic compounds in Scotspine needle litter
We may see that there is not much variation in themain compounds among the investigated five litter species(Table 2) still there is a certain variation in soluble substancesand AUR Some variations in proportions of hemicellulosesand cellulose have been observed with glucans and mannanshaving higher concentrations in the three coniferous speciesIn contrast silver birch (Betula pendula) has higher levels ofxylans and rhamnans
As regards AUR Johansson et al [7] found a concen-tration that ranges from 223 to 288mg gminus1 when analyzingnewly shed Scots pine needle litter collected in the same standover 17 consecutive years Although the concept AUR is notvery specific and includes native lignin waxes cutins andtannins [9 10] it still deserves to be discussed as it has beenwidely used as an index of recalcitrance for litter Availabledata [34]shows a range in AUR between 234mg gminus1 in Chirpine (Pinus roxburghii) and Scots pine to 432 in Khesi pine
An empirical general and positive relationship has beenfound between concentrations of AUR and N in pine needlelitter (Figure 1) as well as for specific groups like coniferousand broadleaf litter species [39] A similar observation wasmade in N fertilization experiments for Scots pine andNorway spruce (Picea abies) [32 40 41]
13C-NMR TechniqueNew analytical techniques such as 13C-NMR may in part replace the traditional time consumingones and provide new information So far 13C-NMR rather
4 ISRN Forestry
Table 2 Initial composition of organic-chemical components and nutrients in five litter species Data from [14 31ndash33]
Concentrations of components (mg gminus1)Substances soluble in AUR Relative proportions of carbohydratesWater Ethanol Rhamnan Xylan Galactan Mannan Araban Glucans
Scots pine 164 113 231 3 23 32 75 36 245Scots pine1 92 120 240 1 23 30 64 43 214Lodgepole pine 103 42 381 6 34 46 90 48 254Norway spruce 32 48 318 7 33 28 105 40 288Silver birch 241 57 330 16 77 44 14 49 166Grey alder 254 39 264 9 30 32 10 44 1161Recalculated from [31]
Table 3 Concentrations of seven main nutrients and AUR in foliar litter of a few pine species Available data From [34]
Litter sp Concentration (mg gminus1)N P S K Ca Mg Mn AUR Lit ref
Scots pinea 42 023 044 079 53 045 103 249 [7]Lodgepole pine 39 034 062 056 64 095 179 360 [15]Maritime pine 68 054 101 195 31 190 059 326 lowast
Red pine 60 036 073 140 89 200 073 265 lowastlowast
White pine 59 021 068 070 72 110 080 256 lowastlowast
Jack pine 78 064 077 230 40 210 025 329 lowastlowast
Limber pine 43 043 052 110 53 110 021 258 lowastlowast
Ponderosa pine 55 045 056 15 38 122 020 294 lowastlowast
Stone pine 30 057 136 59 71 24 019 312 [35]Corsican pine 47 054 071 35 78 13 050 276 lowastlowast
Monterey pine 56 022 070 13 19 093 047 406 lowastlowast
Aleppo pine 43 038 13 173 252 233 003 341 [58]Virginia pine 65 076 137 18 51 105 148 347 lowastlowast
Black pine 61 035 112 08 106 16 086 280 [43]Chir pine 67 nd nd nd nd nd nd 234 [49]Khasi pine 98 nd nd nd nd nd nd 432 [49]aAverage values over 17 years at one Scots pine standlowastDELILA III data base (httpwwwekoujedupldeco)lowastlowastB Berg and C McClaugherty (unpubl)
gives information about specific bonds than compoundswhich may open up for new interpretations of data At thepresent development stage however the concentration of achemical compound is given as that of a certain C-bondA bond is identified as the response in a certain frequencyinterval andwemay expect such responses to be complex [10](Table 4)
Some recent papers [10 42 43] have reported initialchemical composition of whole litter (Table 4) We may seerather wide ranges in response signals among species Forexample a range factor of more than 4 for Methoxy-Ca factor of c 2 for Aromatic-C and Phenolic-C and c 3for Carbonyl-C Among the three pine species there was avariation too but smaller These studies encompassed wholelitter thus including extractives
Alkyl-C or Aliphatic-C This frequency interval (0ndash50 ppm) indicates long chains with -CH
2-units A side chain
in hemicellulose namely an acetate group belongs here aswell as C in side chains of lignin Available data (Table 4) givesa clear variation among litter species (from 157 to 258)
Methoxy-C (50ndash60 ppm) shows the methoxyl carbon inlignin However this frequency interval also includes thealkyl carbon bound to N in proteins A clear variation is seenranging from 15 to 661
O-Alkyl-C (60ndash93 ppm) encompasses mainly carbohy-drate carbon namely that in cellulose andhemicelluloses butalso the side chains of lignin going from carbon 3 Furthersome signals from tannins come in this interval
Di-O-Alkyl-C (93ndash112 ppm) mainly encompasses cellu-lose plus hemicelluloses and thus carbohydrate carbon butshows no difference between the different carbohydrates Wemay see (Table 4) that the highest frequencies are found forO-Alkyl-C followed by Di-O-Alkyl-C which mainly reflectcellulose plus hemicellulose These appear to be highest forScots pine and beech The intensity for O-Alkyl-C rangesfrom 394 for black spruce (Picea mariana) to 614 for blackpine (Pinus nigra) litter
Aromatic-C or Aryl-C The intensity in this interval (112ndash140 ppm) comes from the aromatic carbon in both lignin andcondensed tannins It may also show the guaiacyl group oflignin
ISRN Forestry 5
Table 4 Relative contribution ( of total area) of different groups of C-bonds as derived from 13C CP-NMR spectra of newly shed foliar litter
Litter species Alkyl-C Methoxy-C O-alkyl-C Di-O-alkyl-C Aromatic-C Phenolic-C Carbonyl-C Lit ref0ndash50 50ndash60 60ndash93 93ndash112 112ndash140 140ndash165 165ndash190
Scots pine 158 528 509 125 732 582 239 [42]Scots pine 164 546 514 124 680 535 220 [42]Jack pine 234 22 448 105 86 59 46 [10]Black pinea 161 50 614 mdash mdash 50 36 [43]Norway spruce 172 621 449 116 965 730 313 [42]Black spruce 205 44 394 99 124 67 67 [10]Douglas fir 232 15 452 87 94 64 55 [10]Tamarack 159 17 433 165 80 111 35 [10]White birch 258 24 437 117 71 63 29 [10]Silver birch 230 558 436 121 613 556 398 [42]Aspen 228 15 394 122 73 75 66 [10]Beech 157 32 487 119 96 60 50 [10]aThe investigated intervals were somewhat different
0
100
200
300
400
500
0 5 10 15
R2 = 0168n = 51
P lt 001
Litter N concentration (mg gminus1)
AUR
conc
entr
atio
n (m
g gminus1)
Figure 1 A positive relationship between N and AUR concentra-tions in needle litter of 51 samples of 10 pine (Pinus) species Datafrom [39] and theDELILAdatabasehttpwwwekoujedupldeco
Phenolic-CThe intensity in this interval comes from phe-nolic C (140ndash165 ppm) in both lignin and condensed tanninsItmay also show the syringyl group of lignin Aromatic-C andPhenolic-C reflecting aromatic carbon show a clear variationamong litter species with a range from 124 for black spruceto 613 for silver birch litter Phenolic-C ranged from 111 fortamarack (Larix laricina) to 50 for black pine
Carboxyl-C or Carbonyl-C (165ndash190 ppm) This regionincludes carboxylic acids amides and estersThe intensity forCarbonyl-C ranged from 67 for black spruce to 22 for Scotspine
So far relatively few studies have been carried out whichlimits the possibilities to draw conclusions
312 Two Main Nutrients and Heavy Metals
What Factors Influence Litter Concentrations of N and MnIt appears that concentrations of nutrients in pine litterand several other genera vary along at least three axes onebeing speciesgenus another climate and a third one soil
properties at the site of growth We cannot exclude that theseare linked and when a given species is dependent on bothclimate and soil properties both influence the litter chemistrysimultaneously
Pine SpeciesmdashAvailable Data Newly shed needle litter hasbeen analyzed for just a few pine species and the analysesare rather incomplete encompassing mainly the seven mainnutrients In general the nutrient levels are low for examplefor N with a range from 30 to a highest value of 98 for Khesipine (Table 3) Pines normally grow on nutrient-poor soilwhich in part may explain this generally low level
The natural variation over 17 years at one stand of Scotspine ranged from 29 to 48mg gminus1 [7] with an occasional104mg gminus1 possibly due to an interruption in the retranslo-cation process Still occasionally high N levels (230mg gminus1)have been observed for example for black pine [43] whenthe trees grew in a system supporting the dinitrogen-fixingMount Etna broom (Genista aetnensis)
The variation among speciesgenera increases when weleave the genusPinus So far there has not been any systematicgrouping of generaspecies versus nutrient concentrations sowhat nutrients such a variation encompasses in addition toN is not possible to say The large global approach of Kanget al [33] indicates a difficulty already for N and P AlthoughN and P are mainly correlated there were differences both inconcentrations and the N-to-P ratio among continents andmain functional groups An alternative approach is that ofTyler [47] using no less than 58 macro- and micronutrientsas well as rare earth metals possibly over a limited area
Variation with Climate The chemical composition of thenewly shed pine litter varies considerably with climate In1995 Berg et al [48] reported positive relationships betweenN P S and K and the climate indices MAT and AET Theyusedmainly Scots pine needle litter but also those of 7 furtherpine species collected over Western Europe Later a positiverelationship was reported between N and MAT for eightspecies of pine litter (119899 = 56) in a gradient from the Equator
6 ISRN Forestry
0123456789
10
300 400 500 600 700AET (mm)
n = 61
P lt 0001
N co
ncen
trat
ion
(mg g
minus1)
R2 = 0561
(a)
0 5 10 15 200
05
1
15
2
25
3
35
4
n = 43P lt 0001
minus5
Site MAT (∘C)
Mn
conc
entr
atio
n (m
g gminus1) R2 = 0527
(b)
Figure 2 All available data for newly shed pine (Pinus) needle litter in a climatic gradient ranging from northernmost Fennoscandia to southSpain and south Italy Nitrogen and Mn were analyzed on the same litter samples (a) increasing N concentration with increasing site AET(b) decreasing Mn concentration with increasing site MAT Data from [21 48] and the DELILA database httpwwwekoujedupldeco
0
05
1
15
2
25
3
0 5 10 15Nitrogen concentration (mg gminus1)
P co
ncen
trat
ion
(mg g
minus1)
R2adj = 0219n = 88
P lt 0001
Figure 3 Relationship between concentrations of N and P in pine(Pinus) species needle litter collected in stands over Europe Asiaand North America The data encompasses 22 pine species BBerg unpublished Data from [7 48] and the DELILA databasehttpwwwekoujedupldeco
in Southeast Asia to the Arctic Circle in Scandinavia with aMAT range from 0 to 28∘C [49] Using standardized datathey could confirm that MAT (119875 lt 0001) and not MAPgave a highly significant relationship We may see (Figure 2)that the available data for pine needle litter gives a highlysignificant relationship (1198772 = 0561 119899 = 61 119875 lt 0001) toAET
That the main nutrients are related not only to climatefactors but to each other may be seen over the climategradient as discussed by Berg et al [48] An example is thatof N and P For 22 pine species (119899 = 88) in the northernhemisphere the concentrations of N and P are well correlated(Figure 3) The variation may be due to the different speciesor environmental factors possibly MAT For one speciesnamely Scots pine with 38 samples the correlation wasconsiderably better (1198772adj = 0830 119875 lt 0001) as compared
to 1198772adj = 0219 (119875 lt 0001) for the 22 different species(Figure 3) This emphasizes that also for litter the conceptspecies is important This kind of relationship (N versus P)has been confirmed on a global level for several litter species[33]
A further nutrient that may be related to climate indicesis Mn Negative relationships between Mn concentrationsand AETMAT have been reported for pine litter [21 48](Figure 2(b)) We may see that there is a highly significantnegative relationship to MAT for eight pine species (119899 = 43)covering the area from northernmost Scandinavia to NorthAfrica
The relationship between Mn concentration and MATwas clearly stronger than that to AET Both relationships werenegative indicating that the higher the average temperaturethe lower was the Mn concentration in the litter The highestMn levels were found in Scots pine in north Scandinavia(367mg gminus1) and the lowest (003mg gminus1) in Aleppo pine(Pinus halepensis) in North Africa (Figure 2(b)) This rela-tionship is still empirical
With the relationship for N being positive to MAT andthat for Mn being negative there was a negative relationshipbetween N and Mn in the pine needle litter with R2 = 0145119899 = 42 119875 lt 005 (Figure 4) Thus with increasing MAT(AET) there is an increasing N-to-Mn quotient in the litterThe concentrations of these two nutrients important forlignin degradation thus vary strongly over a climatic gradientwith a range in MAT from minus17 to 17∘C and a geographicalrange of 4200 km
A certain variation among species possibly due to placeof growth or deviating site conditions may be seen for Caand Mg (Table 3) In their analyses Berg et al [48] found norelationship to climate factors for Ca and Mg and concludedthat soil factors were ruling their concentrations in litter
313 A Covariation in AUR and Nitrogen Concentrations inNewly Shed Litter There appears to be a positive relationshipbetween concentrations of N and AUR in foliar litter for
ISRN Forestry 7
0
05
1
15
2
25
3
35
4
0 2 4 6 8 10
P lt 005n = 42R2 = 0145
Mn
conc
entr
atio
n (m
g gminus1)
N concentration (mg gminus1)
Figure 4 Within the genus Pinus there appears to be a negativerelationship between concentrations of N and Mn in newly shedneedle litter along a climate gradient ranging from 17 to 17∘CB Berg unpublished Data from [48] and the DELILA databasehttpwwwekoujedupldeco
both coniferous and broadleaf litter (both at 119875 lt 00001)as well as for pine needle litter [39] (Figure 1) The latterrelationship was based on 10 pine species (119899 = 51) with 119875 lt001 This relationship is empirical and we cannot excludethat it will be subdivided as AUR will be using 13C-NMRIt may be mentioned that after N fertilization both Scotspine and Norway spruce shed needle litter with increasedAUR concentrations [40 41] The concentration of AUR alsohas been shown to vary with climate Thus Berg et al [48]reported positive relationships between AUR in pine needlelitter and bothMAT and potential evapotranspiration (PET)Also this relationship is empirical
314 Relative Amounts of N andMn in Litter Fall Therelativecomposition of foliar litter fall for pine species changes withMAT andAET as does the amount of litter fallThus litter fallis positively related to AET and in northern Europe also toMAT where temperature rather than precipitation is limiting[50] This was seen also by Liu et al [51] for pine litter overEurasia
As the concentration of N in needle litter fall increaseswith for example MAT and AET the amounts of N that arereturned to the soil in litter fall are predictable and there is aheavy increase with increasing AET
For Mn the situation is less clear but largely the con-centration decreases with MAT and AET Still there isa high variation in concentration among years and siteswhich makes the amounts less predictable Wemay howeverestimate proportions between N and Mn for a few casesUsing real data for pine needle litter gives for a stand witha MAT of 0∘C an N-to-Mn ratio of 25 at a MAT of 10∘C theratio becomes 256 and at aMATof 17∘C it becomes 133Thusthe relative amount of N increases considerably with MAT ascompared to that of Mn
Accumulated mass loss ()
100
150
200
250
300
350
400
450
500
0 20 40 60 80
AUR
conc
entr
atio
n (m
g gminus1)
Figure 5 During decomposition the concentration of AURincreases The AUR concentration may be plotted versus accumu-lated litter mass loss By doing that we obtain a linear relationshipwhich is readily comparable for litter incubated in different climatezones and among different litter species Scots pine (e) lodgepolepine (◼) Norway spruce (998771) Data from [31 52 53] figure from [32]
32 The Long-Term Decomposition Process
321 How Do Concentrations and Amounts of Solubles Holo-cellulose AUR and Native Lignin Develop with Accumu-lated Mass Loss
Long-Term Development of Some Main Processes Some litterspecies allow us to follow the decomposition process untilrather high values of accumulated mass loss or until thedecomposition process appears to go very slowly Severalstudies using pine needle litter have recorded values foraccumulated mass loss of 80 and above Such mass lossesmay be reached in shorter or longer periods to some extentdepending on climateWe discuss the concept long termwithreference to accumulated mass loss
The concept long term is not directly related to thethree identified stages [28] (below) The three stages wereintroduced to describe some main steps in litter degradationnamely what components and factors that dominate andin part regulate the decomposition rate The stages mayalso help to distinguish what nutrients that are limiting thedecomposition in the different steps
In the course of decomposition when the more easilydegradable compounds are decomposed AUR remains rel-atively intact for a long time and the amount may evenincreaseThismeans that the litter becomes enriched inAURits concentration increases and may reach even above 50(Figure 5)
The AUR analysis gives normally a clear increase inconcentration and is a useful index for litter recalcitranceHowever in decomposing litter AUR integrates the mosthydrolysis-resistant organic structures and is an analyticalfraction derived from lignin condensed tannins cutins and
8 ISRN Forestry
waxes [10] As an index of litter recalcitrance and age it maybe useful However we must call it an empirical index
Soluble Substances Foliar litter may contain considerablelevels of soluble substances For example concentrations ofwater-solubles ranging between 7 in Scots pine needles[7] and 30 in grey alder (Alnus incana) leaves have beenreported [14] So far four principal groups of soluble organicmaterial in pine needle litter have been identified namelysugars phenolics hydrocarbons and glycerides The solublesugars are predominantly mono- and oligosaccharides thatwere involved in metabolic processes of the plant Thesoluble phenolics are low-molecular weight compounds thatserve either as defensive agents against herbivory are ligninprecursors or waste products hydrolysable tannins are acommon example of soluble phenolics Phenolics are highlyvariable in their solubility and many have a tendency tocondense into less soluble forms or to react with largermolecules
Part of these substances may be leached out of the litter[54 55] and part may be degraded in the litter structure Fewattempts have been made to follow the degradation of simplesoluble components in litter and it should be pointed outthatmost studies describe net disappearance onlyThe solublefraction is challenging to study due to the complexities oftracing the formation of new solubles during decompositionand the disappearance of the same solubles due to leaching ormetabolism
Compounds such as triglycerides and hydrocarbons thatare soluble in light petroleum ether may disappear quicklywhereas fatty acids and diterpene acids remain for longerperiods Simple sugars for example glucose and fructose orcompounds related to simple sugars such as glycosides andpinitol are also degraded very early and at a high rate [31]Still as an example glucose which is present initially in newlyshed litter is also produced from decomposing cellulose andis thus found even in the later stages of decomposition Thesame applies to the simple sugars of hemicelluloses Alsoseveral phenolic substances that are found in newly shedlitter are produced but later during the degradation of forexample native lignin
Solubles are mainly studied as compounds soluble inwater and ethanolacetone and generally the water solu-ble fraction is quickly decomposed and consequently itdecreases in concentrationThis has been generally observedfor the few litter species that have been studied in somedetail The ethanolacetone soluble fraction which containsphenolics and higher fatty acids may remain more constantor even increase in concentration although there appears tobe a clear variation among litter species
Cellulose and Hemicelluloses Based on traditional analyticaltechniques [31 32] the components cellulose hemicellulosesand AUR have been shown to be degraded at different ratesmdashin the early stages of decomposition Still throughout thedecomposition process there are no drastic changes in theconcentration of cellulose Berg et al [31] found for Scots pineneedle litter a slight increase followed by a decrease to aboutthe initial concentration For pine litter part of the cellulose is
lignified when the needle litter is newly shed and part is notThis may be common among litters although it has been littleinvestigated Some litters such as Norway spruce needle litterand that of common oak (Quercus robur) appear to have verylittle if any cellulose that is not lignified
Themost commonhemicelluloses decompose in a similarfashion in litter For the most part they behave like cellulosealthough they may have different positions in the decompos-ing fiber tissue The concentrations of for example xylansmannans arabinans and galactans with smaller variationsremain about constant as far as the decomposition processhas been followed Considering the structure and complexityof the hemicelluloses we may simplify our discussion andregard them as a group When considered together we maysee that in Scots pine needle litter their concentration at 70accumulated mass loss is about the same as at the start of theincubation [31] Like cellulose hemicelluloses appear to be inpart lignified and in part not
Using a long-term incubation of needle litter of Japanesecedar (Cryptomeria japonica) and Hinoki cypress (Chamae-cyparis obtusa) Ono et al [56] showed an initially fastloss of Alkyl-C and O-Alkyl-C bonds corresponding tocarbohydrates It appears that the decomposition rates forO-Alkyl-C were higher in the first incubation year Theycompared the rates to those of Aromatic-C representinglignin and Carbonyl-C (below)
ldquoLigninrdquo Is Often Determined as Acid Unhydrolyzable Residue(AUR) Native lignin is not a very clear concept either infresh or decomposing litter and so far lignin has been definedon the basis of proximate (gravimetric) analytical methodsrather than purely chemical criteria When applied on newlyshed litter some proximate methods yield results which maybe close to chemically defined lignin However in decom-posing plant litter lignin is modified by the humificationprocesses including condensation reactions and by partialdegradation bymicroorganismsThe formation of such decayproducts which are included in the AUR fraction mayraise arguments about the extent to which true lignin ismeasured in decomposing litter when analyzed as AURIn addition gravimetric lignin (AUR) will contain amongother compounds cutin waxes and tannins [10] Further aninorganic fraction (ash) can be of considerable magnitudeAlthough the latter fraction for for example Scots pine litteris about 1 of the total litter mass it may amount to somepercent in the gravimetric lignin analysis The ash content ofnewly shed deciduous litter can be much higher going above10 in some cases [57] Furthermore ash concentrationsmay increase during decay and should be considered whenreporting AUR contents of decomposing litter In an extremecase [36] fine particles ofmineral soil were found to penetratethe litter and ldquoashrdquo increased from 53 to 156
There are some clear differences betweenAUR andNMR-determined lignin which need to be clarified Although whatis determined as AUR is not true lignin but a mixed chemicalfraction with compounds some of which have similarities totrue lignin It is important to note that even native lignin ishighly variable among and even within species Thus native
ISRN Forestry 9
Table 5 Mean intensity distributions ( of total area) as well as mean ratio Alkyl-to-O-Alkyl Data which originates from [10] give ratiosfor 75MHz 13C CP NMR of spectra of newly-shed litter and after 2 and 6 years of decomposition Mean values refer to 10 foliage litter
Litter species Alkyl-C Methoxy-C O-Alkyl-C Di-O-Alkyl-C Aromatic-C Phenolic-C Carbonyl-C AlkylO-Alkyl0ndash47 47ndash58 58ndash92 92ndash112 112ndash140 140ndash160 160ndash185
Mean newly shed 189 45 423 123 98 66 56 032Mean 2 years 230 55 366 100 109 65 76 045Mean 6 years 222 66 337 101 124 69 81 044
lignin cannot be described with the same chemical precisionas cellulose or other plant polymers
Lignin is not a well-defined compound when it isproduced and it remains a poorly defined compound asit is decomposing The nomenclature for lignin that hasbeen modified during decomposition is still in question andeven misleading terms like ldquoAcid-Insoluble Substancerdquo areseen in the literature One suggestion is ldquoNon-HydrolyzedRemainsrdquo (NHR) [58] The more recent suggestion ldquoAcidUnhydrolyzable Residuerdquo (AUR) [10] appears to have won amore general acceptance
It should be pointed out that although the terminologysometimes is misleading the gravimetric lignin or AURthat contains chemically recalcitrant matter is still todayan important concept to litter decomposition It has turnedout that AUR also represents a biologically recalcitrant unitAlthough we also need methods to identify native lignin aswell as to identify the compounds included in AUR we maystill use AUR as an index for degradability [34]
Two approaches have been made to describe the changein concentrations of cellulose and hemicellulose versus thatof AUR In the long term the concentration of holocellulosedecreases whereas that of AUR increases and as observedthere is a level at which the relative amounts remain constantBerg et al [59] suggested the term holocellulose-to-ligninquotient (HLQ) Two such quotients are as follows
HLQ = holocellulose(AUR + holocellulose)
(1)
(see [59]) Another was suggested by Melillo et al [60] asfollows
LCI = AUR(AUR + holocellulose)
(2)
The upper relationship [59] approaches aminimum valueasymptotically which may be different for different littertypes For example Berg et al [59] found a clear differencebetween the HLQ values for Scots pine and silver birchindicating a difference in the quality of the carbon source
The purpose of the two approaches was to obtain a qualitymeasure for the litter carbon source With a new analyticaltool namely the 13C-NMR we cannot exclude that theindices will be more useful
True Lignin The old concept that lignin concentrationincreases during decomposition has been efficiently ques-tioned [10 61] We cannot exclude that an increase may bedifferent among litters and depend on the main degrading
organism (eg white rot versus brown rot) According tosome papers it thus appears that concentrations of nativelignin itself do not increase during the decompositionprocess but rather the sum of components that may berecalcitrant as seen when analyzing for AUR (eg sulfuric-acid lignin) On the other hand Ono et al [56] found anincrease in concentrations of Aromatic-C when followingthe decomposition dynamics over four years of Japanesecedar needle litter and that of Hinoki cypress Consideringthe faster loss of O-Alkyl-C and Alkyl-C such an increaseis reasonable We cannot exclude that contradictory reportsreflect a difference in composition of decomposing organisms(eg white rot versus brown rot)
When using 13C-NMR analysis bonds such as Methoxy-C Aromatic-C and Phenolic-C may indicate the concentra-tion of lignin Aromatic-C and Phenolic-C are also found incondensed tannins [10] In their CIDET study Preston et al[10] reported intensity spectra for decomposition of 10 foliarlitter species withmeasurements at 0 2 and 6 years (Table 5)For Aromatic-C and Phenolic-C there were clear increases inconcentration
Considering the discussion in the above papers [10 61]we cannot exclude that in a near future it will be possible todistinguish litter decomposition by white rot versus that bybrown rot and their relative participation in lignin degrada-tion
322 Dynamics of Two Main Nutrients N and Mn
Some Comments In decomposition studies just total concen-trations of nutrients are normally usedThe information valueof total concentrations is limited for evident reasons and doesnot tell us how these nutrients are bound in litter and thedecomposing material nor what fraction that is availableSome nutrients are in part bound with covalent bonds toorganicmolecules and thus belong to organic complexes andsome of those in ion form are readily leachable for examplepotassium (K) Thus N P and S are bound in proteins andthe nucleic acids that remain in the litter when shed Duringdecomposition also the developing microbial biomass needsthe N P and S for building proteins and nucleic acids andwhen following their total concentrations with accumulatedmass loss we may see that their concentrations increasein linear proportion Their concentrations need to be inproportion in the microbial biomass and this has been notedespecially for the relationship between N and P which hasbeen well studied [62]
Nitrogen dynamics appears to have been more studiedthan that of other nutrients and there are several synthesis
10 ISRN Forestry
Mass loss ()
2
4
6
8
10
12
14
0 20 40 60 80
Nitr
ogen
conc
entr
atio
n (m
g gminus1)
Figure 6 Linear relationship between increasing concentrations ofN and accumulated mass loss for decomposing Scots pine needlelitter Incubations were made at one site a nutrient-poor Scotspine forest Data are pooled from 14 studies each representing anincubation of local litter sampled in a different year (R2 = 0843119899 = 131 119875 lt 0001) Figure from [32] data from [44 67]
works [63 64] Basic syntheses may also be found in text-books [65 66]
The discussion below is limited to the main nutrients NandMn which have been found to be important for the long-term decomposition of litter Heavy metals in natural andclean environments have been suggested to be important forregulating decomposition at the very late stages [9 34] Stillthe literature on for example Fe Pb Zn and Cu dynamics isvery limited
Nitrogen Concentrations Increase as Decomposition ProceedsThat concentrations of total N increase in decomposinglitter is well known Berg and McClaugherty [32] relatedthe increasing N concentrations to litter accumulated massloss for several litter types resulting in a linear increase[32 44 67] (Figure 6) possibly until the limit value fordecomposition is reached [18] This type of relationship isuseful and may be used for analytical purposes Such a linearincrease has been found for many species including foliarlitter of pine species Norway spruce as well as for broadleaflitters [67 69]
For one Scots pine stand there was a limited variabil-ity among decomposition studies (Figure 6) The litter wasnaturally produced from a Scots pine monocultural systemand the variation in initial N concentration was the observedannual variation Similar comparisons were made for needlelitter of lodgepole pine and Norway spruce litter with ratherlittle variation The increase in N concentration duringdecomposition may be considerable Thus for Scots pine alinear increase was found in concentration from an initial4mg gminus1 up to 12 to 13mg gminus1 N at about 75 accumulatedmass loss (R2 = 099 119899 = 16 119875 lt 0001) [70]
Some deciduous litter species such as silver birch alsogive linear relationships although much of the mass is lostinitially resulting in a fast increase in N relative to mass
Actual evapotranspiration (mm)350 400 450 500 550 600 650
Nitr
ogen
conc
entr
atio
n in
crea
se ra
te
006
008
010
012
014
016
018
020R2adj = 0569
n = 53
P lt 0001
Figure 7 Linear relationship between the climatic index actualevapotranspiration (AET) and Nitrogen Concentration IncreaseRate (NCIR) for decomposing needle litter of (e) Scots pine (◼)Norway spruce and (998771) other pines (lodgepole pine andwhite pine)Figure from [32] data from [67]
loss This linearity is empirical and the reasons for the linearrelationship are far from clear given the simultaneous in- andoutflows of N during the decomposition process [66 71]Thisrelationship has also been elaborated [18 67]
Some Influences on N Dynamics May Be Systematized Usingthe linear relationship betweenN concentration and accumu-lated mass loss Berg and McClaugherty [32 34] comparedthe slopes of the linear relationships among several litterspecies and among several studies of decomposing Scots pineneedle litter in one forest system (Figure 7) They called theslope of the relationship Nitrogen Concentration IncreaseRate (NCIR) An advantage with linear relationships is thatthey may be readily and simply compared and Berg andMcClaugherty [32 34] found a set of factors influencingthe NCIR One factor appeared to be litter species anotherwas the influence of initial litter N concentrations and athird the influence of climateThus the NCIR increased withincreasing initial N concentration a propertywhich appearedto be in common for different species They found this to bevalid for at least a few pine species and for Norway spruceBerg and Cortina [69] also noticed this when comparingNCIR for seven very different litter types incubated in onesystem
One mechanism for conserving N in decomposing littercould be via covalent bonds to macromolecules during thehumification process A first step is the ammonium fixationdescribed by Nommik and Vahtras [72] When the initialamount of N in the litter is higher there will be more Navailable for fixation giving a higherNCIR Such a conclusionis reasonable since Axelsson and Berg [73] found that the Navailability is limiting the rate of the process
Earlier studies suggested that quinones were formedwith N in the heterocyclic rings [74] Two recent papersgive further compounds [45 75] The study of Knicker [75]
ISRN Forestry 11
NH
N
N
NH
Indole Pyrrole Pyridine
O
C
CR
OH
OH
NH2
NH2
Amide Aminohydroquinone Benzonitrile
Figure 8 Products detected by 15N-NMR after reaction of 15N-labeled ammonium hydroxide with humic material after oxidativeammonolysis of lignin model compounds Figure from [75]
suggested several heterocyclic components (Figure 8) whichmay be part of the recalcitrant complexes formed
Influence of climate on NCIR For local Scots pine needlelitter and a unified Scots pine needle litter preparationthe relationship between NCIR and AET was investigatedacross a climatic gradient with AET ranging from 380 to520mm There was a highly significant positive relationship(1198772adj = 0640 119899 = 31 119875 lt 0001) indicating that theN concentration will increase faster relative to accumulatedmass loss under awarmer andwetter climateThis correlationwas significantwhen local and unified needle litterswere usedin combination as well as when using only local needle litter(1198772adj = 0517 119899 = 18 119875 lt 0001) Also for litter of Norwayspruce the NCIR values increased with increasing AETvalues and the relationship was well significant (1198772adj = 0534119899 = 14119875 lt 001) Combining data for brown coniferous litterresulted in a highly significant linear relationship with 1198772adj =0569 119899 = 53 119875 lt 0001 (Figure 7)
Thus climate as indexed by AET is a significant factor inaffecting the rate of N concentration increase in decomposingleaf litter As the increases were calculated on the basis ofaccumulatedmass loss rather than time the resultsmean thatat a given accumulated mass loss a particular litter decayingin an areawith higherAETwill containmoreN than the samelitter decaying in an area with lower AET
Manganese Concentrations Change with Accumulated MassLossThere are few reviews andor syntheses onMndynamicsin decomposing litter As seen from a comparison of Scotspine andNorway spruce needle litter the former has not onlylowerMn concentration in newly shed litter but there is also aclear difference in Mn dynamics during decomposition Berget al [76] compared the two genera in two approaches (i)by using information from 8 paired stands with Scots pineand Norway spruce and (ii) by using available data for Mndynamics for 3 pine species and Norway spruce They used63 decomposition studies in which Mn was analysed in eachlitter sampling (546 data points) and related concentrationsand remaining amounts of Mn in litter to accumulated massloss
0
2
4
6
8
10
12
0 20 40 60 80 100Accumulated mass loss ()
Norwayspruce
n = 214
P lt 0001
Mn
conc
entr
atio
n (m
g gminus1)
R2 = 0348
(a)
0 20 40 60 80 100Accumulated mass loss ()
Pine sppn = 330
P lt 0001
0
05
1
15
2
25
3
35
4
Mn
conc
entr
atio
n (m
g gminus1)
R2 = 0071
(b)
Figure 9 Manganese concentration in decomposing needle litterof Norway spruce (a) Scots pine lodgepole pine and Aleppo pine(b) Data originates from a climatic gradient A quadratic functionof the type 1198832minus X fitted both data sets reasonably well Data from[58 69 76] Please note the different scales on the 119884 axis
For both the pine (37 studies) and the spruce litter (26studies) the pattern for Mn concentration with accumulatedmass loss varied among the single studies The variation maydepend on initial concentration ranging from an increase atlow initial concentrations to a clear decrease at high initiallevels
For both litters a high initial Mn concentration resultedin a decrease in concentration as decomposition proceededMainly it appeared that the concentration decreased and at c15ndash20 accumulated mass loss Mn concentrations reached aminimum after which the concentrations increased followingaccumulated litter mass loss (Figure 9)
Scots Pine versus Norway Spruce in Paired Stands as well asAvailable Data for Pine spp and Norway Spruce In theirsynthesis Berg et al [76] investigated how litter Mn con-centration changed with accumulated mass loss in 8 pairedstands withNorway spruce and Scots pine (pairwise the samesoil and the same climate) The resulting patterns showed aclear difference between them with a not very clear patternfor Scots pine (cf Figure 9) As decomposition proceeded theMn concentration reached a minimum followed by a slight
12 ISRN Forestry
increase which was significant but not very pronouncedIn contrast the Norway spruce litter showed a very clearand strong increase in concentration which was significantlystronger than for litter of Scots pine (119875 lt 00001) Foreach group of litter Mn concentration followed a significantpositive quadratic function (1198832 minus 119883) The average Mnconcentration at 80 accumulated mass loss was 626mg gminus1for Norway spruce litter and 147mg gminus1 for that of Scots pineThe quotient in Mn concentration at 80 mass loss betweenNorway spruce and Scots pine was 43
In the same study they combined all available data forpine species and Norway spruce and the pattern (Figure 9)was similar to that for the paired stands Pine litter did notgive a very clear pattern for changes in concentration and at60ndash70 accumulated mass loss the range in concentrationswas about as wide as for the newly shed litter A quadraticfunction was highly significant (R2 = 0070 119899 = 330 119875 lt0001) but indicated a very low increase in concentration ForNorway spruce litter on the other hand there was a clearincrease in concentration (Figure 9) and significantly higherthan for pine species
Manganese Release Patterns during Decomposition Man-ganese release from litter was generally linear to accumulatedmass lossThis was investigated for 63 decomposition studiesencompassing Scots pine lodgepole pine Aleppo pine andNorway spruce and found to be linear for each individualstudy [76] This linearity was used for comparing the Mnrelease rates for some litters with different initial concentra-tions
The slope of such a linear relationship gives the releaserate and the slopes for the 63 relationships were related tolitter initial Mn concentration It appeared that the releaserate was in proportion to the littersrsquo initial concentration ofMn (119875 lt 0001) and this relationship was highly significantin spite of the different genera Although the species groupsfitted a common function there were significant differencesamong them Thus the functions for the groups Norwayspruce and pine species were significantly different (119875 lt0001) [76] with a clearly lower release rate forMn inNorwayspruce litter (Figure 10)
33 A Conceptual Model Based on Three Identified Stages
331 Some Introductory Comments
Two Phases Have Developed to Three Based on traditionalanalytical techniques Berg and Staaf [40] set up a conceptualtwo-phase model for decomposition of Scots pine needlelitter and included N as a rate-retarding factor for AURdecomposition in the late stage Later the model was devel-oped to encompass three identifiable stages [28] In additionto N this modified model included Mn as an influencingfactor for the late stage
The early phase was based on the decomposition of non-lignified carbohydrates and mass-loss rate was enhanced byhigher levels of themain nutrients N P and S Further in thisphase there was a direct effect of climate on decompositionThe late phase started when a net loss of AUR was observed
0 1 2 3 4 5
Slop
e coe
ffici
ent
Norway spruce
Pine spp
minus007
minus006
minus005
minus004
minus003
minus002
minus001
0
001
P lt 0001n = 26
P lt 0001
Initial Mn concentration (mg gminus1)
R2 = 0905 R2 = 0448n = 37
Figure 10 Net releaseuptake in foliar litter of pine species andNorway spruce using Mn release coefficients for linear functionsAvailable data for pine species was used (119899 = 37) as well as forNorway spruce (119899 = 26) The resulting linear function for pine andspruce litter combinedwas highly significant (R2= 0635 119899 = 63119875 lt0001) The figure shows that the data set could be subdivided aftergenus with the two functions significantly different at 119875 lt 0001Pine species (X) Norway spruce (◼) Data recalculated from [76]
and in contrast to the early phase a raised N concentrationwould have a rate-suppressing effect whereas a higher Mnconcentration would increase the litter mass-loss rate Theeffect of climate would decrease and possibly disappear Thethird stage or humus-near stage [28] was defined by the limitvalue which identified a stable litter fraction
Both new data and additional analytical work on ligninin litter [61] have made it necessary to clarify and developthe definition of the phases considering the new information[34]
In a new approach Hobbie et al [77] followed the devel-opment of enzymatic activities during decomposition of leaflitter of white pine (Pinus strobus) and pin oak (Quercus ellip-soidalis) providing further support to the model A furtherstudy [78] encompassed flowering dogwood (Cornus florida)red maple (Acer rubrum) and red oak (Quercus rubra) Alsoin this case studies on enzyme activities supported themodel
332 Early Stage What Factors May Regulatethe Decomposition Rate
Substrate Chemical Composition In the early phase amountsand concentrations of water-soluble substances decreasequickly before reaching relatively similar and stable levels[31] Also free unshielded holocellulose is degraded in thisphase In the first work based on AUR no net loss of AURwas seen in the early phase Recently Klotzbucher et al havefound [61] that also in the early phase there is some lignindegradation (cf Figure 11) Their data set included Scots pineneedle litter Still although there is some degradation oflignin this appears not to influence the effects of the mainnutrients and the degradation of carbohydrates appears todominate the early phase
The recent finding of Klotzbucher et al [61] has shownthat part of the native lignin thus may be degraded in
ISRN Forestry 13
SolublesNon-lignified carbohydrates
Mn MnN
Mn NN
+ + +
+
+
Time
Phase 1Regulated by
nutrient level andreadily available
carbon
Phase 2Regulated by AURndecomposition rate
Phase 3Finalstages
Lignified carbohydratesAUR
Mas
s rem
aini
ng (
)
N P Ssolubles
minus
minus
minus minus
minus minus
Figure 11 Conceptual model for rate-regulating factors and chem-ical changes during decomposition modified from [28 34] Thedecomposition of water-soluble substances and unshielded cellu-losehemicellulose is stimulated by high levels of themajor nutrientssuch as N P and S (early stagemdashphase 1) When the main partof all unshielded holocellulose is decomposed lignin-encrustedholocellulose and lignin remainThe early phase has been suggestedto last for even up to c 40 accumulated mass loss for somepine litters [34] For other foliar litters for example spruce andoak the early phase has been found to be very short or possiblynonexisting In the late stagemdashphase 2 the degradation of lignindominates the litter decomposition rate Nitrogen hampers thedegradation of lignin and higher N concentrations suppress thedecomposition whereas Mn appears to have a stimulating effect onthe degradation of lignin and thus on litter Finally in the humus-near stage (phase 3) the litter decomposition rate is (close to) zeroand the accumulated mass loss reaches its limit value The model ismodified according to a suggestion of Klotzbucher et al [81] Theyfound that there is a loss of lignin from the start of the incubationStill it appears that for for example Scots pine and other pine littersthe early phase is not dominated by lignin degradation
the early stage We may speculate that the lignin in the foliarlitter tissue is not evenly distributed As the lignification of theliving tissue goesmore slowly than the growth of the celluloseand hemicellulose part of the carbohydrates is not lignifiedor only to a low extent when the litter is shed It would bereasonable to assume that Klotzbucher et al found that ligninin less lignified tissue was degraded [61]
Although this lignin mainly appears not to have anydominant role for the decomposition or for the phases wemay accept new results [42] suggesting that there was a neg-ative correlation between the frequency of bonds related tofor example lignin and tannins (Aromatic-C and Phenolic-C) and respiration rate from newly incubated whole litter
This study based on 13C-NMR needs further confirmationbut appears to be a good example that all rate-suppressingeffects in the early phase simply cannot be measured usinggravimetric determinations (eg using litterbags) Furtherit indicates an effect encompassing all bonds including boththose in solubles and in solid components
In the early phase the mass-loss rate still may be posi-tively related to total concentrations of the major nutrientssuch as N P and S which often are limiting for decompo-sition rates over several species [14] among them Scots pine[40] We may note a recent discovery by Kaspari et al [79]that even the highly soluble sodium (Na) has been found tobe limiting for litter decomposition in areas at inland sitesnamely at a distance from sea-spray Such an effect may applyto at least the early stage in addition to that of the mainnutrients
The stimulating effects of N in the early stage and itssuppression of decomposition in the late one has beenconfirmed experimentally in three recent studies increasingthe number of litter species for which themodel is applicableUsing green leaves and leaf litter of white pine and pinoak with different initial concentrations of N Hobbie et aladded inorganic N and organic N as well as a mix of thenutrients P K calcium (Ca) magnesium (Mg) and iron(Fe) to incubated litter [77] They also incubated litter in astandwith long-termN additions Calculating 119896init (k119860) usingan asymptotic function adapted for remaining amount theyobtained a significantly higher rate after N addition We maysee that decomposition of litter that had received N additionswas stimulated and significantly faster Effects of addition ofinorganic N were not quite significant
Perakis et al [80] using Douglas fir (Pseudotsuga men-ziesii) needle litter with different concentrations of N con-firmed also for this species that N is a limiting nutrient inthe early stage By adding N fertilizer (ammonium nitrateand urea) they found that the mass loss in the first 8 monthsincreased as compared to the unfertilized litterThey obtaineda significant relationship between mass loss and initial litterMn concentration inN-fertilized plots but not in unfertilizedThe initial P concentrations were similar among their eightlitter preparations and appear not to have been limiting
In their study Carreiro et al [78] used flowering dog-wood red maple and red oak and confirmed the stimulatingeffect of added N in the early stage and a repressing effect inthe late one
Appearance Pattern of Enzyme Activities Hobbie et al [77]determined both cellulolytic and lignolytic enzyme activ-ities after 6 months and 1 2 and 3 years We may see(Figures 12 and 13) that after six monthsrsquo incubation cellu-lolytic activity was well measurable and that positive effectsof added N were observed indicating a higher productionof these enzymes by the decomposing microorganisms Theactivity of 120573-glucosidase and cellobiohydrolase increasedand reached a maximum after one year of incubation afterwhich a clear decrease took place As regards phenol oxidaseand peroxidase the activity was just measurable at the firstsampling (after 6months) but increasedwith incubation time(Figure 13)
14 ISRN Forestry
0123456789
Harvest time (yrs)05 1 2 3
lowastlowastlowast lowast
120573-glucosidase
1234
567
EC en
zym
e act
ivity
(120583
mol
gminus1
hminus1)
(a)
0
1
2
3
4
5
Harvest time (yrs)
1234
567
05 1 2 3
Cellobiohydrolase
lowastlowastlowast lowast
EC en
zym
e act
ivity
(120583
mol
gminus1
hminus1)
(b)
Figure 12 Hydrolytic enzyme activity (120573-glucosidase and cellobiohydrolase) in white pine and pin oak foliar litter harvested during the firstthree years of a decomposition experiment Values are given by treatment as averaged over sites and substrates An asterisk indicates thata particular treatment differed significantly from the control treatment at a particular harvest time Values are means with standard errorbars Overall model R2 values from 3-way analysis of variance (ANOVA) including treatment site and substrate as main effects were doneseparately for each harvest date and ranged from 025 to 058 for 120573-glucosidase 024 to 069 for cellobiohydrolase (1) Control (2) carbonaddition (255 g Cmminus2 yminus1 as glucose) (3) addition of inorganic N (10 gNmminus2 yminus1 as NH
4NO3) (4) addition of carbon (255 g Cmminus2 yminus1 as
glucose) and inorganicN (10Nmminus2 yminus1 asNH4NO3) (5) long-termN additions (10 gNmminus2 yminus1 asNH
4NO3since 1999) (6) addition of non-N
nutrients (P K Ca Mg S Fe) (7) addition of organic N (10 gNmminus2 yminus1 as amino acids) From [77]
0
1
2
3
4
5
Harvest time (yrs)05 1 2 3
Phenol oxidase
lowast
lowastlowast
lowast
EC en
zym
e act
ivity
(120583
mol
gminus1
hminus1)
1234
567
(a)
0
1
2
3
4
5
Harvest time (yrs)
1234
567
05 1 2 3
Peroxidase
EC en
zym
e act
ivity
(120583
mol
gminus1
hminus1)
(b)
Figure 13 Oxidative enzyme activities (phenoloxidase and peroxidase) in white pine and pin oak foliar litter harvested during the first threeyears of a decomposition experiment Values are given by treatment and averaged over sites and substrates Statistical comparisons were onlydone for the 2- and 3-year harvests because of high numbers of zero values in prior harvests An asterisk indicates that a particular treatmentdiffered significantly from the control treatment at a particular harvest time Values are means with standard error bars Overall model R2values from 3-way analysis of variance (ANOVA) including treatment site and substrate as main effects were 034 and 024 for phenoloxidaseand 022 and 023 after 2 and 3 years of decomposition respectively (1)Control (2) carbon addition (255 g Cmminus2 yminus1 as glucose) (3) additionof inorganic N (10 gNmminus2 yminus1 as NH
4NO3) (4) addition of carbon (255 g Cmminus2 yminus1 as glucose) and inorganic N (10Nmminus2 yminus1 as NH
4NO3)
(5) long-termN additions (10 gNmminus2 yminus1 as NH4NO3since 1999) (6) addition of non-N nutrients (P K CaMg S Fe) (7) addition of organic
N (10 gNmminus2 yminus1 as amino acids) From [77]
ISRN Forestry 15
Climate Influence For newly shed litter it appears that climatemay influence litter mass-loss rate For local needle litterof Scots pine it has been possible to demonstrate a clearinfluence of climate on decomposition rate using the rangein climate within a 2000 km-long gradient [7] The mass lossin the first year ranged from about 109 in northern Finland(close to Barents Sea) to about 437 in northern GermanyThe dominant rate-regulating factor was the climate asindexed by annual actual evapotranspiration (AET) or bymean annual temperature (MAT) and none of the substrate-quality factors alone was significant Using unified Scots pinelitter Berg et al [3] showed the climate relationship in agradient from northern Finland to southern United States(southern Georgia) Such effects of climate could thus berecorded for local and unified pine needle litter in pine forestswith their relatively open canopy covers
Still a more general relationship was demonstrated [4]By combining available data for broadleaf and coniferouslitter the authors found a relationship between first-yearmassloss and MAT The geographic range was considerable andextended from the Equator to north Scandinavia Howeverwhen investigating separate functional groups the authorsfound clear differences among pine species spruce and oakspecies Thus mass-loss rate for pine litter was in highlysignificant and positive linear relationship to MAT whereasthat of spruce showed no relationship
The Extent of the Early Phase and a Possible Transition Stagebetween the Early and the Late Stages The extent of the earlystage has been suggested to be c 25ndash27 accumulated massloss [40 82] and later Berg andMcClaugherty [34] suggestedthat it may extend to c 40 accumulated mass loss Theseresults were based on the response of the decomposition tonutrient concentration versus that to AUR concentrationWe cannot exclude however that both the extent of a well-defined early phase and a less clear transition phase to thelate stage aremore unclear and possibly there is in addition atemporal variation over a wide range even within one speciesFirst the lignification in the green leaf even within onespecies may be variable among years and place of growthwhich may be reflected in the litter We do not know thesize of this variation Further we cannot exclude that thetransition between the early and the late stage will be lessdistinguishable with a less clear response to both climate andto concentrations ofN P and S Also a negative response toNand a positive one to Mnmay be less distinguishable (B Bergand J Kjoslashnaas unpubl) Such a transition stage is reasonableto expect and we can expect that new analytical techniquesmay improve the possibility to distinguish it
333 The Late Stage What Factors May Regulate Decompo-sition Rate Berg and Staaf [40] defined a late stage as theone in which the decomposition of gravimetric ligninAURdominated the mass loss of litter This definition was laterimproved by Berg and Matzner [28] In both studies AURwas used instead of lignin Although AUR is not really anacceptable replacement to native lignin we may use it as anindex of increasing recalcitrance In their model Berg and
0 1 2 3 4 5 6 7 8Mn concentration (mg gminus1)
0
10
20
30
40
50
Ann
ual m
ass l
oss (
)
R 2 = 0151n = 136P lt 0001
Figure 14 All available data (Norway spruce lodgepole pine Scotspine Aleppo pine silver birch grey alder) for annual mass loss offoliar litter in late stages were related to litter Mn concentration atthe start of each year Mass-loss data originate from sites distributedover Sweden plus from two sites in northern Libya From [85]
Matzner [28] included the effect of N concentration as a rate-retarding agent of lignin decomposition (above)The positiveeffect ofMn on production of lignolytic enzymes [83 84] wasfollowed by a report on positive relationships between Mnconcentration and litter mass-loss rate [85] (Figure 14) Sucheffects were found for litter of lodgepole pine and Norwayspruce as well as for a mix of litter species [85]
Incubating leaves and leaf litter of white pine and pinoak in N-fertilized plots Hobbie et al followed the incubatedlitter over time After 1 year they found clearly reduced ratesfor the litter that had received N additions [77] In their studyon the development of cellulolytic and lignolytic enzymes inthe sampled litter they noted (i) a heavy increase in lignolyticenzymes after one year of incubation and (ii) a decrease oflignolytic enzymes afterN additionsThat study [77] supportsthe proposed phases
In a study using needle litter of Douglas fir [80] asignificant decrease (late stage) was found in mass-loss ratesafter additions of ammonium nitrate
334 The Very Late Stages and the Concept ldquoLimit ValuerdquoFirst in the study of Howard and Howard [12] and later intwo independent ones [13 14] the concept limit value wasdescribed (Figure 15) Further it was found that the limitvalues were different among litter species A ldquolimit valuerdquo isestimated using a function that gives an asymptotic valuefor the accumulated mass loss The following one has beensuggested [13 14]
119871119905= 119898(1 minus 119890
minus119896119905119898) (3)
where 119871119905is the accumulated mass loss (in percent) 119905 time in
days 119896 the decomposition rate at the beginning of decay and119898 the asymptotic level that the accumulated mass loss willultimately reach normally not 100 and often considerably
16 ISRN Forestry
Time
Dec
ompo
sitio
n (
)
k-initial
Potential limit value
Domain of decreasing k
Figure 15 Decomposition rates for decomposing litter graduallydecrease and the accumulated mass loss may approach an asymp-tote a limit value The process may be described using (3) whichmay be used to estimate the decomposition rate at any point in timeThe initial decomposition rate (119896-initial) gives the rate at time 0 from[34]
less From a high initial value at time zero its value decreasesas the process proceeds and the rate may reach the value zeroat the limit value (Figure 15)The 119896 of this function should notbe directly compared to rate constants estimated with othermodels
Available literature data [19] allowed the estimation ofall 106 limit values for foliar litter decomposing in naturalsystems When regressing these against the initial N con-centrations a highly significant and negative relationshipwas obtained (1198772 = 0323 119899 = 106 119875 lt 0001) Later[76] a highly significant relationship was found between 149limit values and initial N concentration The possible causalbackground to this relationship between limit values and Nhas been discussed (above) The fact that in this large dataset the relationship to N concentration was significant mayindicate a general effect of N over a good number of speciesin that case 16 ones Thus it may encompass both deciduousand coniferous litter and ecosystems in boreal and temperateforests
However in a study on limit values for just one littergenus namely pine (Pinus spp) needle litter mainly thatof Scots pine Berg et al [41] using backward eliminationand local litter in a climatic gradient found that initial Mnconcentration was the only significant factor for limit valuesThe backward elimination procedure simply removed thenon-significant factors stepwise and out of ten ones namelyMATMAP water solubles AUR and six main nutrients onlyMn was selected as a significant factor Using the same dataset Berg andMcClaugherty [34] applied a quadratic functionof the type minus1198832 + 119883 and obtained a highly significant andimproved relationship That relationship was based on litterfrom four pine species and a range in litterMn concentrationsfrom 003mg gminus1 to 31mg gminus1 That data set originated froma climate gradient with MAT ranging from minus07 to 17∘C Incontrast to the above finding for 16 deciduous and coniferousspecies [76] there was no significance for N in that data setusing exclusively pine litter Of the eight substrate-quality
factors and two environmental ones Mn concentration wasleft as the single factor
The limit value as such is still mainly an empiricalfinding althoughwe have both causal relationships and highlysignificant relationships toMn concentrations Further usinga single genus (Pinus) supported the relationship to Mn
In order to determine specific factors that influence thelimit values it appears reasonable to study separate genera orpossibly litter species Thus for common oak leaf litter therewas no relationship to litter Mn concentration but to that ofCa [6] An attempt to relate limit values for Norway spruceto litter Mn concentration was not successful However Berg[86] found a significant and positive relationship for limitvalues and Ca concentration for Norway spruce litter Thuswith two studies giving similar results we cannot exclude thatan effect of Ca on limit values may be related to at least theselitter species
Still using available data wemay see some general trendsBerg et al [76] using a data set with 149 limit values toinitial litter concentrations of bothN andMn obtained highlysignificant relationships in both cases (Figure 17)
We have mentioned (above) that the litter becomesincreasingly enriched in the AUR complex including recom-bination products the stability of which appears to berelated to both N and Mn However of substrate-qualityfactors we cannot neglect the possible role of the increasingconcentrations of heavy metals such as Cu Pb Fe and ZnThere are few data revealing the dynamics of these four heavymetals but some data has been published for decomposingScots pine needle litter [32 34] For Scots pine litter allfour heavy metals increased in concentration when related toaccumulated mass loss Such concentration increases may becorrelated to that ofN and could explain part of the significantrelationships
Pine litter appears in general to have linear net release ofMn [76] With Mn release being linear to accumulated massloss itmaywell be correlated to the increasing concentrationsof N and to the increasing concentrations of the above heavymetals For all cases (Mn N and heavy metals) we may seepotential causal relationships to a retarded decompositionStill the roles of the main heavy metals need to be clarifiedalthoughwemay keep inmind that such a rolemay be relatedto site properties too
34 Decomposition Patterns
Patterns Functions and Influences The decomposition pat-terns or the shape of accumulated mass loss plotted versustimemay develop following different functions One has beendiscussed namely (3) a further one is (4) [88 89] whichdescribes total decomposition as follows
ln(119872119905
1198720
) = minus119896119905 (4)
in which1198720is initial mass and119872
119905mass at time 119905 119896 is the rate
constant and 119905 is time
ISRN Forestry 17
40
50
60
70
80
90
100
Lim
it va
lue (
)
0 05 10 15 20 25 30 35
Initial Mn concentration (mg gminus1)
y = minus3556x2 + 23047x + 62366
R2 = 0404n = 53
P lt 0001
Figure 16 The level of the limit value given as accumulated massloss The limit value for needle litter of pine (Pinus) species appearsto be related to litterMn concentrationDecomposition studies fromfour pine litter species mainly Scots pine were combined into aclimatic gradient and limit values estimated using litter accumulatedmass loss A backward elimination procedure removed factors thatwere not significant Of MAT and MAP and eight substrate-qualityfactors namely water solubles AUR N P K Ca Mg and Mnmanganese was selected as the single significant factor Figure from[34] based on data from [21]
Equation (3) (above) allows the calculation of a stablefraction identified by the mass-loss rate of zero thus sep-arating the readily decomposed organic matter from thestabilized fraction which may be of different sizes Thismeans that a graph describing the accumulated mass lossmay approach very different limit values (Figure 15) Thusthe litters with different limit values (Figure 16) may beconsidered to have different patterns
To discuss decomposition pattern we may use an indexand I have used the limit value as provisional index Thedecomposition pattern thus differs depending on the level ofthe limit value A complete decomposition with a limit valueof 100 and one with a lower at say 45would give differentpatterns or differing curvatures of the graph
Pattern versus Litter Nutrients It appears that the decom-position patterns for pine litter may be related to initialMn concentrations Manganese appears to be the dominantfactor determining limit values at least in pine ecosystems(Figure 16) In a study [21] on local transplanted andexperimental pine needle litter in all 56 decompositionstudies (ldquosequencesrdquo) the role of Mn versus limit valuewas determined Using backward elimination Berg et alinvestigated the eight substrate-quality variables N P K CaMg Mn AUR and water solubles plus MAT and MAP Thelitter was mainly that of Scots pine but the set includedlodgepole pine stone pine and Aleppo pine
The positive relationship between initial concentrationsof Mn and limit values for pine needles (Figure 16) isempirical as is the more general relationship between N andlimit values found in earlier studies [19] although both are
based on causal relationships In addition the effect ofMn onthe degradation of lignin and thus on lignified tissue as wellas on the degradation of secondary products such as humicacid [84 90] has been demonstrated with highly decomposedlitter (Figure 14) [85]
We may speculate that the positive relationship betweenthe limit value and the total concentration of Mn in highlydecomposed litter arises because higher Mn concentrationsenable the decomposition to proceed further before a recal-citrant fraction is developed The formation of a very slowlydecomposing fraction may occur when litter approaches itslimit value because the remaining Mn at this stage is boundin a form that is relatively unavailable to the degradingmicroorganisms The dynamics of total Mn in decomposingfoliar litter are variable over litter types but have been littlestudied [69 76]
In earlier investigations [19 20] N was significantly (119875 lt0001) and negatively related to limit values and the causalrelationships are well established [72 84]These relationshipswere based on available data including 16 species (Figure 17)AlthoughMnwas selected for pine litter [21] Berg et al foundthat N was the last variable to be eliminated The reason forN not being included in the final model for pine litter couldbe that N has no essential relationship with the limit valueand alternatively that the concentration range in N was toolimited in the studied material
Thus we cannot exclude that N simply may have a lowerinfluence on limit values than Mn in decomposition of pineneedle litter possibly because the range of initial litter Nconcentrations was relatively narrow among substrates Bycontrast the negative relationship betweenN and limit valuesobserved by Berg [19] using 106 limit values was based on21 different litter speciestypes with a wide range in initial Nconcentrations (29 to 307mg gminus1) However in both casesthere are strong general causal relationships betweenMnorNand the microbial degradation of lignin (and lignified tissue)that could explain these empirical relationships [84 91]
Can climate influence the pattern The parameter MATmay deserve to be commented upon There is a relationshipbetween litter Mn concentration in foliar litter and MAT aswell as one betweenMATAET andN concentration Alreadyin 1995 a highly significant and negative relationship wasfound betweenMn concentration in the newly shed pine nee-dle litter and MAT suggesting that litter Mn concentrationmay also reflect the local climate [48] The correspondingrelationship to N concentration was positive
These results suggest that higher MAT is associated withlowerMnandhigherN concentrations in the needle litter thatis formed at a given site Although themechanism underlyingthese relationships needs further studies an effect of MATon Mn and N concentrations in litter may influence thefraction of organic matter that becomes recalcitrant leadingto a regional and climate-related variation in the formation ofrecalcitrant organic matter from Pinus
We discussed the strong variation in the quotient N-to-Mn in newly shed litter over a climatic gradient and gavethe ratio of 25 at a MAT of 0∘C at 10∘C it was 10 timesas high and at 17∘ more than 50 times higher Using the
18 ISRN Forestry
0
20
40
60
80
100
120
0 10 20 30 40
Lim
it va
lue (
)
Nitrogen concentration (mg gminus1)
R2 = 0151n = 149P lt 0001
(a)
0
20
40
60
80
100
120
0 1 2 3 4 5
Lim
it va
lue (
)
Manganese concentration (mg gminus1)
R2 = 0184n = 149
P lt 0001
(b)
Figure 17 Relationships (power function) between initial litterconcentration of N and Mn and limit values (a) Nitrogen (b)Manganese In both cases the same set of data was used with 149decomposition studies and 16 species included (DELILA II databasehttpwwwekoujedupldeco) Figure from [87]
available information of the roles of N and Mn the litterchemical composition thus would influence the pattern andgive a less degradable litter at a warmer climatemdashunless so farunknown factors influence the litterrsquos degradability So far thedecomposition studies appear to have confirmed this for pinelitter
35 Carbon Sequestration Amounts and Patterns
351 Can We Use Limit Values to Estimate C SequestrationRates in Humus Layers We defined the limit value based onaccumulated litter mass loss (3) Although we have definedthe limit value by estimating the accumulated mass lossat which the rate becomes 0 for a given fraction it doesnot mean that the ldquostablerdquo fraction is completely stable orbiologically undegradable We may only conclude that thebiological degradation is slow [82] Although we appear tohave very little direct information we may speculate abouthow slow it may be and if this rate may change Couteaux etal [82] comparing decomposition rates of Scots pine humusand far-decomposed litter (close to the limit value) obtaineda rate of ldquoless than 00001dminus1rdquo or less than 0037 per year
For our discussion we may call the remaining stablefraction ldquohumusrdquo and ask about what factors that influenceits stability Berg and Matzner [28] quoting Bringmark andBringmark [29] reported that a high N concentration wasrate-suppressing for respiration from humus-layer samplescollected over a region Still total N concentration was justone factor andwehave no answer to howmany further factorsthere are
If a sample of a humus layer is taken out from itsenvironment wemaymeasure its respiration rate and severalstudies give rates that sometimes correspond to 100 decom-position in a short time even less than a year Still with thehumus undisturbed the humus layer will last and grow andundisturbed humus layers have been found to develop forclose to 3000 years reaching a depth of almost 15 meters [23]
Although foliar litter is not the only litter componentforming humus layers it is a major one and in some ecosys-tems even the dominant one Using data from a Scots pinemonoculture c 120 years old with a humus layer developedon ashes from the latest forest fire it has been possible toreconstruct the amount of stored carbon in the humus layer[24 26] using extensive litter-fall data and an average limitvalue of 890 (119899 = 8) A similar calculation was made forthe close to 3000 year-old humus layers described by Wardleet al [23] and a quantitative reconstructionwasmade of threegroups of humus layers with the average age of 1106 2081 and2984 years [24 26]
352 Tree Species Influence the C Sequestration Rate Severalattempts have been made to study the accumulation rate ofhumus in humus layers the ldquoprimary sequestrationrdquo [46] Inmost cases this appears to have been made in monoculturesor tree species trials The experiment of Ovington [92]showed clearly that there was a linear relationship betweenstand age and the increase in mass (and C) in the LFH layeron top of mineral soil
The rate of C sequestration in a well-developed humuslayer is easily determined using gravimetric measurementsof the humus-layer C and a comparison to the time for itsbuildup Still there are relatively few such values reported inthe scientific literature possibly due to the long accumulationtime and the absolute request for good information aboutstand history and the humus layer when the buildup started
To evaluate the effect of tree species on C sequestrationrates Berg and McClaugherty [34] made an evaluation ofexisting data and focused on two larger studies one inDenmark [37] and one in theUK [38] together encompassing10 trials with c 16 tree species in paired stands Each of thesestudies was made with the purpose of evaluating several treespecies which also were occurring in both studies With asimilarity in climate this allowed an evaluation of the speciesability to sequester C in the humus layer Site history wasgiven [38 93]
An analysis of variance gave a rather clear response inspite of a high variation in sequestered carbon Berg andMcClaugherty [34] distinguished that coniferous speciesgenera had a significantly higher sequestration ratemdashtwiceas highmdashas deciduous species (Figure 18) They found threemain groups with pine and spruce species having the highest
ISRN Forestry 19
Pine SpruceFir Larch Beech
Grand fir Other decid Oak spp
481 355 266 283 227 196 112 103
Sequestration rate in LFH layers (kg C haminus1 yrminus1)
Figure 18 Data from 7 tree species trials in Denmark [37] and 3 inEngland [38] Each of the studies reported a carefully determinedamount of soil organic matter on top of the mineral soil in mono-cultural stands ldquoprimary sequestrationrdquo [46] Data were combinedto analyse and determine the variation among genera [34] The fullline underlining genus names givesC accumulation rates that are notsignificantly different Ash was subtracted and 50 C was assumedfor the organic matter of Ovingtonrsquos study [38] Compiled data andfigure are from [34]
sequestration rate followed by fir larch and beech and inthe third place ldquoother deciduousrdquo A similar observation wasthe evaluation of Berg [94] based on existing data [9596] comparing sequestration rates over 30 years in pairedstands and observing about twice as high a rate in a Norwayspruce stand as compared to one with common beech (Fagussylvatica)
353 Regional Approach to Determine C Sequestration RatesinWell-Developed Humus Layers Wemay argue that seques-tration rates should be related to both foliar litter fall and thesize of the stable residue However in a comparison of litterfall from Scots pine andNorway spruce over Sweden [50 97]a higher foliar litter fall was found for Norway spruce thanfor Scots pine Still the C sequestration rate in humus layerswas higher in Scots pine stands when rates were compared forSweden as a region [98]
In two attempts to calculate the C sequestration in thehumus layer over a region using countrywide (Sweden)directly measured data Berg et al obtained sequestrationrates [98] that were close to those estimated for the sameregion using limit values [97] In a comparison [99] threedifferent approaches were compared for the same region (theforested land of Sweden) providing similar results
Although the numbers obtained by a calculation usinglimit values can be verified by direct measurements wecannot exclude the possibility that calculations using litter falldata and limit values rather give an index for C sequestrationWe may consider that there are several litter componentsthat may be degraded with different decomposition patternswhich additionally may differ among species and ecosystems
Conflict of Interests
The author declares that there is no conflict of interestsregarding the publication of this paper
References
[1] C E Prescott ldquoDo rates of litter decomposition tell us anythingwe really need to knowrdquo Forest Ecology and Management vol220 pp 66ndash74 2005
[2] V Meentemeyer ldquoMacroclimate and lignin control of litterdecomposition ratesrdquo Ecology vol 59 pp 465ndash472 1978
[3] B Berg M P Berg P Bottner et al ldquoLitter mass loss ratesin pine forests of Europe and Eastern United States somerelationships with climate and litter qualityrdquo Biogeochemistryvol 20 no 3 pp 127ndash153 1993
[4] H Kang B Berg C Liu and C JWestman ldquoVariation inmass-loss rate of foliar litter in relation to climate and litter quality ineurasian forests differences among functional groups of litterrdquoSilva Fennica vol 43 no 4 pp 549ndash575 2009
[5] B Berg M-B Johansson and V Meentemeyer ldquoLitter decom-position in a transect ofNorway spruce forests substrate qualityand climate controlrdquo Canadian Journal of Forest Research vol30 no 7 pp 1136ndash1147 2000
[6] M P Davey B Berg B A Emmett and P Rowland ldquoDecom-position of oak leaf litter is related to initial litter Mn concen-trationsrdquo Canadian Journal of Botany vol 85 no 1 pp 16ndash242007
[7] M B Johansson B Berg and V Meentemeyer ldquoLitter mass-loss rates in late stages of decomposition in a climatic transectof pine forests Long-term decomposition in a Scots pine forestIXrdquo Canadian Journal of Botany vol 73 no 10 pp 1509ndash15211995
[8] R Fogel and K Cromack ldquoEffect of habitat and substratequality on Douglas fir litter decomposition in western OregonrdquoCanadian Journal of Botany vol 55 pp 1632ndash1640 1977
[9] C M Preston J R Nault J A Trofymow C Smyth and TheCIDET Working Group ldquoChemical changes during 6 years ofdecomposition of 11 litters in some Canadian forest sites Part1 elemental composition tannins phenolics and proximatefractionsrdquo Ecosystems vol 12 no 7 pp 1053ndash1077 2009
[10] C M Preston J R Nault J A Trofymow and The CIDETWorking Group ldquoChemical changes during 6 years of decom-position of 11 litters in some Canadian forest sites Part 2 13Cabundance solid-state 13CNMR spectroscopy and themeaningof lsquoligninrsquordquo Ecosystems vol 12 no 7 pp 1078ndash1102 2009
[11] T Persson E Baath M Clarholm et al ldquoTrophic structurebiomass dynamics and carbonmetabolismof soil organisms in aScots pine forestrdquo Ecological Bulletins vol 32 pp 419ndash462 1980
[12] P J A Howard and D M Howard ldquoMicrobial decompositionof tree and shrub leaf litter I Weight loss and chemicalcomposition of decomposing litterrdquo Oikos vol 25 no 3 pp341ndash352 1974
[13] R K Wieder and G E Lang ldquoA critique of the analyticalmethods used in examining decomposition data obtained fromlitter bagsrdquo Ecology vol 63 no 6 pp 1636ndash1642 1982
[14] B Berg and G Ekbohm ldquoLitter mass-loss rates and decompo-sition patterns in some needle and leaf litter types Long-termdecomposition in a Scots pine forest VIIrdquo Canadian Journal ofBotany vol 69 no 7 pp 1449ndash1456 1991
[15] B Berg and G Ekbohm ldquoDecomposing needle litter in Pinuscontorta (lodgepole pine) and Pinus sylvestris (Scots pine)monocultural systemsmdashis there a maximum mass lossrdquo Scan-dinavian Journal of Forest Research vol 8 no 4 pp 457ndash4651993
[16] W S Currie M E Harmon I C Burke S C Hart W JParton and W Silver ldquoCross-biome transplants of plant littershow decomposition models extend to a broader climatic rangebut lose predictability at the decadal time scalerdquo Global ChangeBiology vol 16 no 6 pp 1744ndash1761 2010
[17] M E Harmon W L Silver B Fasth et al ldquoLong-term patternsofmass loss during the decomposition of leaf and fine root litter
20 ISRN Forestry
an intersite comparisonrdquo Global Change Biology vol 15 no 5pp 1320ndash1338 2009
[18] B Berg R Laskowski and A Virzo De Santo ldquoEstimatednitrogen concentrations in humus based on initial nitrogenconcentrations in foliar litter a synthesis XII Long-termdecomposition in a Scots pine forestrdquo Canadian Journal ofBotany vol 77 no 12 pp 1712ndash1722 1999
[19] B Berg ldquoLitter decomposition and organic matter turnover innorthern forest soilsrdquo Forest Ecology and Management vol 133no 1-2 pp 13ndash22 2000
[20] B Berg G Ekbohm M Johansson C McClaugherty FRutigliano and A V De Santo ldquoMaximum decompositionlimits of forest litter types a synthesisrdquo Canadian Journal ofBotany vol 74 no 5 pp 659ndash672 1996
[21] B Berg A DeMarco M P Davey et al ldquo Limit values for foliarlitter decompositionmdashpine forestsrdquo Biogeochemistry vol 100no 1 pp 57ndash73 2010
[22] B Berg ldquoScots pine needle littermdashcan it give a mechanism forcarbon sequestrationrdquoGeografia Polonica vol 85 no 2 pp 13ndash23 2012
[23] D A Wardle O Zackrisson G Hornberg and C Gallet ldquoTheinfluence of island area on ecosystem propertiesrdquo Science vol277 no 5330 pp 1296ndash1299 1997
[24] B Berg C McClaugherty A Virzo De Santo and D JohnsonldquoHumus buildup in boreal forests effects of litter fall and its Nconcentrationrdquo Canadian Journal of Forest Research vol 31 no6 pp 988ndash998 2001
[25] K E Rehfuss Waldboden Entwicklung Eigenschaften undNutzung vol 29 of Pareys Studientexte Parey Hamburg Ger-many 2nd edition 1990 (German)
[26] B Berg and N Dise ldquoCalculating the long-term stable nitrogensink in northern European forestsrdquo Acta Oecologica vol 26 no1 pp 15ndash21 2004
[27] B Berg and N Dise ldquoValidating a new model for N sequestra-tion in forest soil organic matterrdquoWater Air and Soil Pollutionvol 4 no 2-3 pp 343ndash358 2004
[28] B Berg and E Matzner ldquoEffect of N deposition on decompo-sition of plant litter and soil organic matter in forest systemsrdquoEnvironmental Reviews vol 5 no 1 pp 1ndash25 1997
[29] E Bringmark and L Bringmark ldquoLarge-scale pattern of morlayer degradation in Sweden measured as standardized res-pirationrdquo in Humic Substances in the Aquatic and Terres-trial Environments Proceedings of an International SymposiumLinkoping Sweden August 1989 vol 33 of Lecture notes in earthsciences pp 255ndash259 Springer Berlin Germany 1991
[30] G Guggenberger ldquoAcidification effects on dissolved organicmatter mobility in spruce forest ecosystemsrdquo EnvironmentInternational vol 20 no 1 pp 31ndash41 1994
[31] B Berg K Hannus T Popoff and O Theander ldquoChanges inorganic chemical components of needle litter during decom-position Long-term decomposition in a Scots pine forest IrdquoCanadian Journal of Botany vol 60 no 8 pp 1310ndash1319 1982
[32] B Berg and C McClaugherty Plant Litter DecompositionHumus Formation Carbon Sequestration Springer Berlin Ger-many 2nd edition 2008
[33] H Kang Z Xin B Berg et al ldquoGlobal patterns of leaf litternitrogen and phosphorus stoichiometry in woody plants withlatitude and climatic factorsrdquo Annals of Forest Science vol 67pp 811ndash818 2010
[34] B Berg and C A McClaugherty Plant Litter DecompositionHumus Formation Carbon Sequestration Springer Berlin Ger-many 3rd edition 2014
[35] B Berg A Virzo De Santo F A Rutigliano A Fierro andG Ekbohm ldquoLimit values for plant litter decomposing in twocontrasting soilsmdashinfluence of litter elemental compositionrdquoActa Oecologica vol 24 no 5-6 pp 295ndash302 2003
[36] B Wessen and B Berg ldquoLong-term decomposition of barleystraw chemical changes and ingrowth of fungal myceliumrdquo SoilBiology and Biochemistry vol 18 no 1 pp 53ndash59 1986
[37] L Vesterdal and K Raulund-Rasmussen ldquoForest floor chem-istry under seven tree species along a soil fertility gradientrdquoCanadian Journal of Forest Research vol 28 no 11 pp 1636ndash1647 1998
[38] J D Ovington ldquoStudies on the development of woodlandconditions under different trees IIThe forest floorrdquoThe Journalof Ecology vol 42 pp 71ndash80 1954
[39] B Berg C Liu R Laskowski et al ldquoRelationships betweennitrogen AUR and climate among tree foliar littersrdquo CanadianJournal of Forest Research vol 43 pp 103ndash107 2013
[40] B Berg and H Staaf ldquoDecomposition rate and chemicalchanges of Scots pine needle litter II Influence of chemicalcompositionrdquo in Structure and Function of Northern ConiferousForests AnEcosystemStudy T Persson Ed vol 32 pp 373ndash390Ecological Bulletins Stockholm Sweden 1980
[41] B Berg and C O Tamm ldquoDecomposition and nutrientdynamics of litter in long-termoptimumnutrition experimentsIINutrient concentrations in decomposing Picea abies needlelitterrdquo Scandinavian Journal of Forest Research vol 9 no 2 pp99ndash105 1994
[42] B Erhagen M Oquist T Sparrman et al ldquoTemperatureresponse of litter and soil organic matter decomposition isdetermined by chemical composition of organic materialrdquoGlobal Change Biology 2013
[43] A De Marco R Spaccini P Vittozzi et al ldquoDecomposition ofblack locust and black pine leaf litter in two coeval forest standson Mount Vesuvius and dynamics of organic componentsassessed through proximate analysis and NMR spectroscopyrdquoSoil Biology and Biochemistry vol 51 pp 1ndash15 2012
[44] B Berg H GW Booltink A Breymeyer et al ldquoData on needlelitter decomposition and soil climate as well as site character-istics for some coniferous forest sites 2nd ed Section 2 Dataon needle litter decompositionrdquo Report 42 Departments ofEcology and Environmental Research Swedish University ofAgricultural Sciences 1991
[45] K A Thorn and M A Mikita ldquoAmmonia fixation by humicsubstances a nitrogen-15 and carbon-13 NMR studyrdquo Science ofthe Total Environment vol 113 no 1-2 pp 67ndash87 1992
[46] B Berg CMcClaugherty andA VirzoDe Santo ldquoPracticalitiesof estimating carbon sequestrationrdquoCABReviews vol 3 no 84pp 1ndash15 2008
[47] G Tyler ldquoChanges in the concentrations of major minor andrare-earth elements during leaf senescence and decompositionin a Fagus sylvatica forestrdquo Forest Ecology andManagement vol206 pp 167ndash177 2005
[48] B Berg R Calvo de Anta A Escudero et al ldquoThe chemicalcomposition of newly shed needle litter of Scots pine andsome other pine species in a climatic transect X Long-termdecomposition in a Scots pine forestrdquo Canadian Journal ofBotany vol 73 no 9 pp 1423ndash1435 1995
[49] C Liu B Berg W Kutsch et al ldquoLeaf litter nitrogen concen-tration as related to climatic factors in Eurasian forestsrdquo GlobalEcology and Biogeography vol 15 no 5 pp 438ndash444 2006
ISRN Forestry 21
[50] B Berg and V Meentemeyer ldquoLitter fall in some Europeanconiferous forests as dependent on climate a synthesisrdquo Cana-dian Journal of Forest Research vol 31 no 2 pp 292ndash301 2001
[51] C Liu C J Westman B Berg et al ldquoVariation in litterfall-climate relationships between coniferous and broadleaf forestsin Eurasiardquo Global Ecology and Biogeography vol 13 no 2 pp105ndash114 2004
[52] B Berg and J E Lundmark ldquoDecomposition of needle litter inPinus contorta and Pinus sylvestris monoculturesmdasha compari-sonrdquo Scandinavian Journal of Forest Research vol 2 pp 3ndash121987
[53] B Berg and C O Tamm ldquoDecomposition and nutrient dynam-ics of Norway spruce needle litter in a long-term optimumnutrition experiment I Organic matter decompositionrdquo TechRep 39 Department of Ecology and Environmental SciencesSwedish University of Agricultural Sciences 1991
[54] C AMcClaugherty ldquoSoluble polyphenols and carbohydrates inthroughfall and leaf litter decompositionrdquo Acta Oecologia vol4 pp 375ndash385 1983
[55] L Bogatyrev B Berg and H Staaf ldquoLeaching of plant nutrientsand total phenolic substances from some foliage litters Alaboratory studyrdquo Tech Rep 33 Swedish Coniferous ForestProject 1983
[56] K Ono S Hiradate S Morita K Ohse and K HiraildquoHumification processes of needle litters on forest floors inJapanese cedar (Cryptomeria japonica) and Hinoki cypress(Chamaecyparis obtusa) plantations in Japanrdquo Plant and Soilvol 338 no 1 pp 171ndash181 2011
[57] J D Aber C A McClaugherty and J M Melillo Litter Decom-position inWisconsin Forests-Mass Loss Organic-Chemical Con-stituents and Nitrogen vol R3284 of University of WisconsinResearch Bulletins University of Wisconsin Madison WisUSA 1984
[58] M Y Faituri ldquoSoil organic matter in Mediterranean andScandinavian forest ecosystems and dynamics of nutrients andmonomeric phenolic compoundsrdquo Silvestra vol 236 136 pages2002
[59] B BergG Ekbohm andCMcClaugherty ldquoLignin andholocel-lulose relations during long-term decomposition of some forestlitters Long-term decomposition in a Scots pine forest IVrdquoCanadian Journal of Botany vol 62 no 12 pp 2540ndash2550 1984
[60] J M Melillo J D Aber A E Linkins et al ldquoCarbon andnitrogen dynamics along the decay continuum plant litter tosoil organic matterrdquo in Ecology of Arable Lands M Clarholmand L Bergstrom Eds pp 53ndash62 Kluwer Dordrecht TheNetherlands 1989
[61] T Klotzbucher T R Filley K Kaiser and K Kalbitz ldquoA studyof lignin degradation in leaf and needle litter using 13C-labelledtetramethylammonium hydroxide (TMAH) thermochemoly-sis comparison with CuO oxidation and van Soest methodsrdquoOrganic Geochemistry vol 42 no 10 pp 1271ndash1278 2011
[62] S Gusewell and J T A Verhoeven ldquoLitter N P ratios indicatewhether N or P limits the decomposability of graminoid leaflitterrdquo Plant and Soil vol 287 no 1-2 pp 131ndash143 2006
[63] B Berg and H Staaf ldquoLeaching accumulation and release ofnitrogen in decomposing forest litterrdquo in Terrestrial NitrogenCycles Processes Ecosystem Strategies andManagement ImpactsF E Clark and T Rosswall Eds vol 33 pp 163ndash178 EcologicalBulletins Stockholm Sweden 1981
[64] S Manzoni R B Jackson J A Trofymow and A PorporatoldquoThe global stoichiometry of litter nitrogen mineralizationrdquoScience vol 321 no 5889 pp 684ndash686 2008
[65] J D Aber and J M Melillo Terrestrial Ecosystems CengageLearning Emea 1991
[66] B Berg and R Laskowski Litter Decomposition A Guide toCarbon and Nutrient Turnover vol 38 of Advances in EcologicalResearch Elsevier San Diego Calif USA 2006
[67] B Berg C McClaugherty and M B Johansson ldquoChemicalchanges in decomposing plant litter can be systemized withrespect to the litterrsquos initial chemical compositionrdquo Reportsfrom the Departments in Forest Ecology and Forest SoilsSwedish University of Agricultural Sciences Report 74 1997
[68] J D Aber and J M Melillo ldquoNitrogen immobilization indecaying hardwood leaf litter as a function of initial nitrogenand lignin contentrdquo Canadian Journal of Botany vol 60 no 11pp 2263ndash2269 1982
[69] B Berg and J Cortina ldquoNutrient dynamics in some decom-posing leaf and needle litter types in a Pinus sylvestris forestrdquoScandinavian Journal of Forest Research vol 10 no 1 pp 1ndash111995
[70] H Staaf and B Berg ldquoAccumulation and release of plantnutrients in decomposing Scots pine needle litter Long-termdecomposition in a Scots pine forest IIrdquo Canadian Journal ofBotany vol 60 no 8 pp 1561ndash1568 1982
[71] B Berg ldquoDynamics of nitrogen (15N) in decomposing Scotspine (Pinus sylvestris) needle litter Long-term decompositionin a Scots pine forest VIrdquo Canadian Journal of Botany vol 66no 8 pp 1539ndash1546 1988
[72] H Nommik and K Vahtras ldquoRetention and fixation of ammo-nium and ammonia in soilsrdquo inNitrogen in Agricultural Soils FJ Stevenson Ed vol 22 of Agronomy Monographs pp 123ndash171Agronomy Society of America Madison Wis USA 1982
[73] G Axelsson and B Berg ldquoFixation of ammonia (15N) toScots pine needle litter in different stages of decompositionrdquoScandinavian Journal of Forest Research vol 3 pp 273ndash2801988
[74] M R Lindbeck and J I Young ldquoPolarography of intermediatesin the fixation of nitrogen by p-quinone-aqueous ammoniasystemsrdquo Analytica Chimica Acta vol 32 pp 73ndash80 1965
[75] H Knicker ldquoStabilization of N-compounds in soil and organic-matter-rich sedimentsmdashwhat is the differencerdquoMarine Chem-istry vol 92 pp 167ndash195 2004
[76] B Berg B Erhagen M B Johansson et al ldquoManganesedynamics in decomposing foliar litterrdquo Canadian Journal ofForest Research vol 43 pp 1ndash10 2013
[77] S Hobbie W C Eddy C R Buyarski et al ldquoResponse ofdecomposing litter and its microbial community to multipleforms of nitrogen enrichmentrdquo Ecological Monographs vol 82pp 389ndash405 2012
[78] M M Carreiro R L Sinsabaugh D A Repert and DF Parkhurst ldquoMicrobial enzyme shifts explain litter decayresponses to simulated nitrogen depositionrdquo Ecology vol 81 no9 pp 2359ndash2365 2000
[79] M Kaspari S P Yanoviak R Dudley M Yuan and N A ClayldquoSodium shortage as a constraint on the carbon cycle in aninland tropical rainforestrdquo Proceedings of the National Academyof Sciences of the United States of America vol 106 no 46 pp19405ndash19409 2009
[80] S Perakis J J Matekis and D E Hibbs ldquoInteractions of tissueand fertilizer nitrogen on decomposition dynamics of lignin-rich litterrdquo Ecosphere vol 3 no 6 article 54 2012
[81] T Klotzbucher K Kaiser G Guggenberger C Gatzek andK Kalbitz ldquoA new conceptual model for the fate of lignin in
22 ISRN Forestry
decomposing plant litterrdquo Ecology vol 95 no 5 pp 1052ndash10622011
[82] M M Couteaux K B McTiernan B Berg D Szuberla PDardenne and P Bottner ldquoChemical composition and carbonmineralisation potential of Scots pine needles at different stagesof decompositionrdquo Soil Biology and Biochemistry vol 30 no 5pp 583ndash595 1998
[83] J Perez and T W Jeffries ldquoRoles of manganese and organicacid chelators in regulating lignin degradation and biosynthesisof peroxidases by Phanerochaete chrysosporiumrdquo Applied andEnvironmental Microbiology vol 58 no 8 pp 2402ndash2409 1992
[84] A Hatakka ldquoBiodegradation of ligninrdquo in Biopolymers Volume1 Lignin Humic Substances and Coal M Hofman and A SteinEds pp 129ndash180 Wiley Weinheim Germany 2001
[85] B Berg K T Steffen and C McClaugherty ldquoLitter decompo-sition rate is dependent on litter Mn concentrationsrdquo Biogeo-chemistry vol 82 no 1 pp 29ndash39 2007
[86] B Berg ldquoInitial rates and limit values for decomposition ofScots pine and Norway spruce needle litter a synthesis for N-fertilized forest standsrdquoCanadian Journal of Forest Research vol30 no 1 pp 122ndash135 2000
[87] B Berg ldquoDecomposition patterns for foliar littermdasha theory forinfluencing factorsrdquo manuscript submitted
[88] J S Olson ldquoEnergy storage and the balance of producers anddecomposers in ecological systemsrdquo Ecology vol 44 pp 322ndash331 1963
[89] H Jenny S P Gessel and F T Bingham ldquoComparative study ofdecomposition rates of organicmatter in temperate and tropicalregionsrdquo Soil Science vol 68 pp 419ndash432 1949
[90] K T Steffen A Hatakka and M Hofrichter ldquoDegradation ofhumic acids by the litter-decomposing basidiomycete CollybiadryophilardquoApplied and EnvironmentalMicrobiology vol 68 no7 pp 3442ndash3448 2002
[91] K E Eriksson R A Blanchette and P Ander Microbialand Enzymatic Degradation of Wood and Wood ComponentsSpringer Berlin Germany 1990
[92] J D Ovington ldquoThe circulation of minerals in plantations ofPinus sylvestris Lrdquo Annals of Botany vol 23 no 2 pp 229ndash2391959
[93] E Holmsgaard and C Bang ldquoEt traeartsforsoslashg med naletraeerboslashg og eg De Foslashrste 10 arrdquo Forstlig Forsoslashgsvaesen no 35 pp159ndash196 1977 (Danish)
[94] B Berg ldquoSequestration rates for C and N in humus at four N-polluted temperate forest standsrdquo in Biogeochemistry of ForestedCatchments in a Changing Environment A German Case StudyE Matzner Ed vol 172 of Ecological Studies pp 361ndash376Springer Berlin Germany 2004
[95] H Meesenburg K J Meiwes and H Bartens ldquoVeranderungder Elementvorrate im Boden von Buchen- undFichtenokosystemen in Sollingrdquo Berichte Freiburger ForstlicheForschung vol 7 pp 109ndash114 1999 (German)
[96] K J Meiwes H Meesenburg H Bartens et al ldquoAccumulationof humus in the litter layer of forest stands at Solling Possiblecauses and significance for the nutrient cyclingrdquo Forst undHolzvol 13-14 pp 428ndash433 2002 (German) English summary
[97] C Akselsson B Berg V Meentemeyer and O WestlingldquoCarbon sequestration rates in organic layers of boreal andtemperate forest soilsmdashSweden as a case studyrdquo Global Ecologyand Biogeography vol 14 no 1 pp 77ndash84 2005
[98] B Berg M Johansson A Nilsson P Gundersen and LNorell ldquoSequestration of carbon in the humus layer of Swedish
forestsmdashdirect measurementsrdquo Canadian Journal of ForestResearch vol 39 no 5 pp 962ndash975 2009
[99] B Berg P Gundersen C Akselsson M Johansson A Nilssonand L Vesterdal ldquoCarbon sequestration rates in Swedish forestsoilsmdasha comparison of three approachesrdquo Silva Fennica vol 41no 3 pp 541ndash558 2007
Submit your manuscripts athttpwwwhindawicom
Forestry ResearchInternational Journal of
Hindawi Publishing Corporationhttpwwwhindawicom Volume 2014
Environmental and Public Health
Journal of
Hindawi Publishing Corporationhttpwwwhindawicom Volume 2014
Hindawi Publishing Corporationhttpwwwhindawicom Volume 2014
EcosystemsJournal of
Hindawi Publishing Corporationhttpwwwhindawicom Volume 2014
MeteorologyAdvances in
EcologyInternational Journal of
Hindawi Publishing Corporationhttpwwwhindawicom Volume 2014
Marine BiologyJournal of
Hindawi Publishing Corporationhttpwwwhindawicom Volume 2014
Hindawi Publishing Corporationhttpwwwhindawicom
Applied ampEnvironmentalSoil Science
Volume 2014
Advances in
Hindawi Publishing Corporationhttpwwwhindawicom Volume 2014
Environmental Chemistry
Atmospheric SciencesInternational Journal of
Hindawi Publishing Corporationhttpwwwhindawicom Volume 2014
Hindawi Publishing Corporationhttpwwwhindawicom Volume 2014
Waste ManagementJournal of
Hindawi Publishing Corporation httpwwwhindawicom Volume 2014
International Journal of
Geophysics
Hindawi Publishing Corporationhttpwwwhindawicom Volume 2014
Geological ResearchJournal of
EarthquakesJournal of
Hindawi Publishing Corporationhttpwwwhindawicom Volume 2014
BiodiversityInternational Journal of
Hindawi Publishing Corporationhttpwwwhindawicom Volume 2014
ScientificaHindawi Publishing Corporationhttpwwwhindawicom Volume 2014
OceanographyInternational Journal of
Hindawi Publishing Corporationhttpwwwhindawicom Volume 2014
The Scientific World JournalHindawi Publishing Corporation httpwwwhindawicom Volume 2014
Journal of Computational Environmental SciencesHindawi Publishing Corporationhttpwwwhindawicom Volume 2014
Hindawi Publishing Corporationhttpwwwhindawicom Volume 2014
ClimatologyJournal of
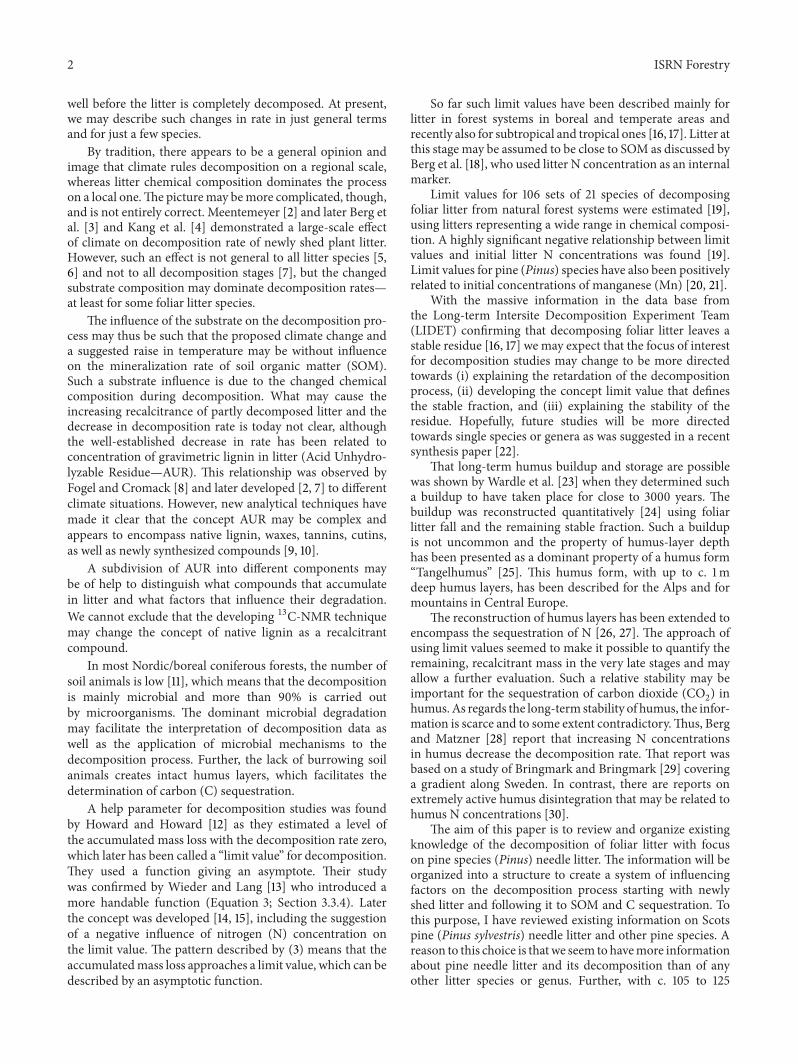
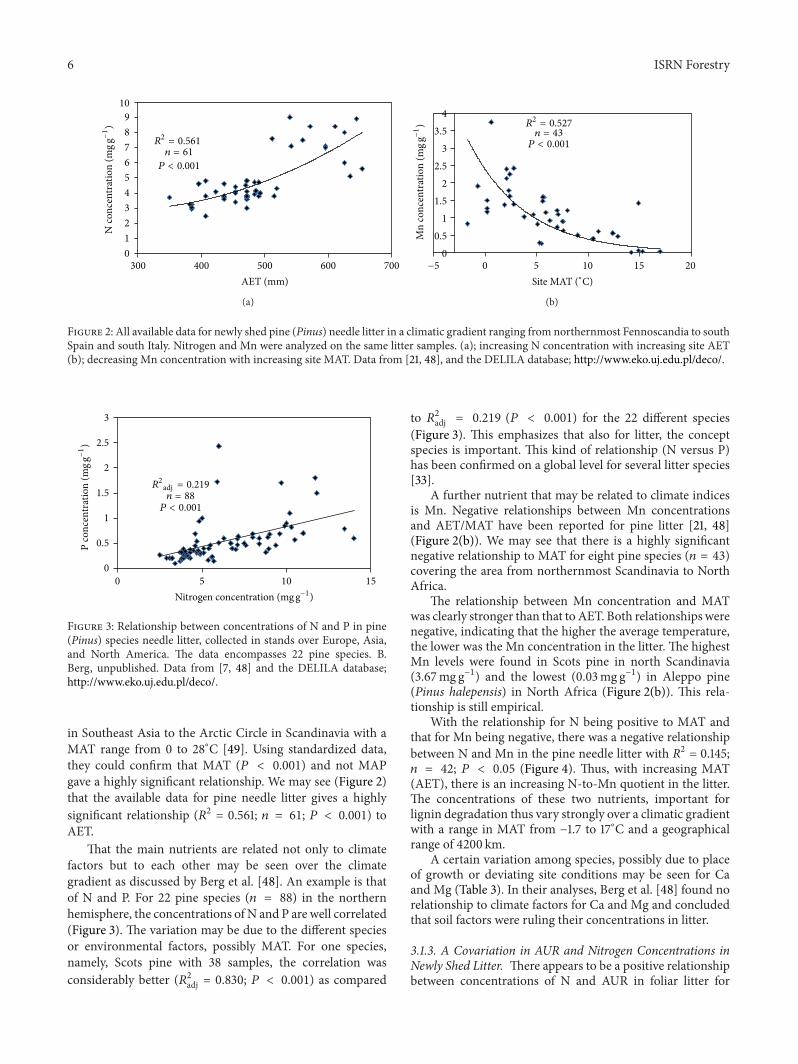
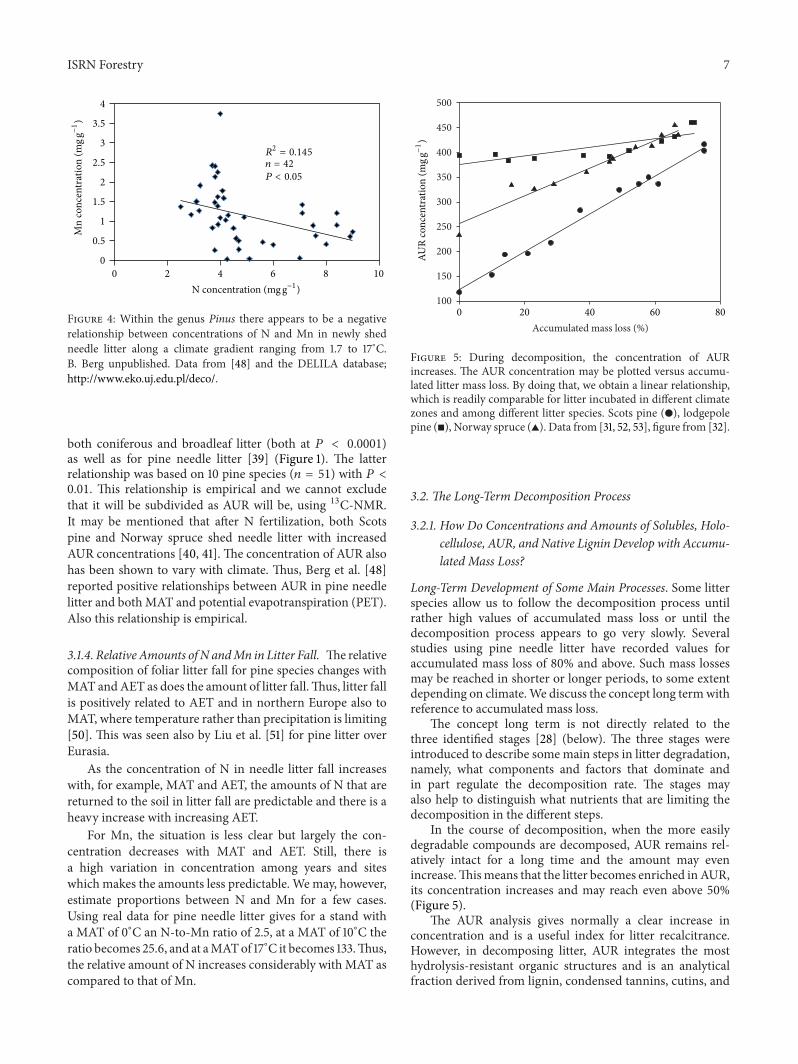
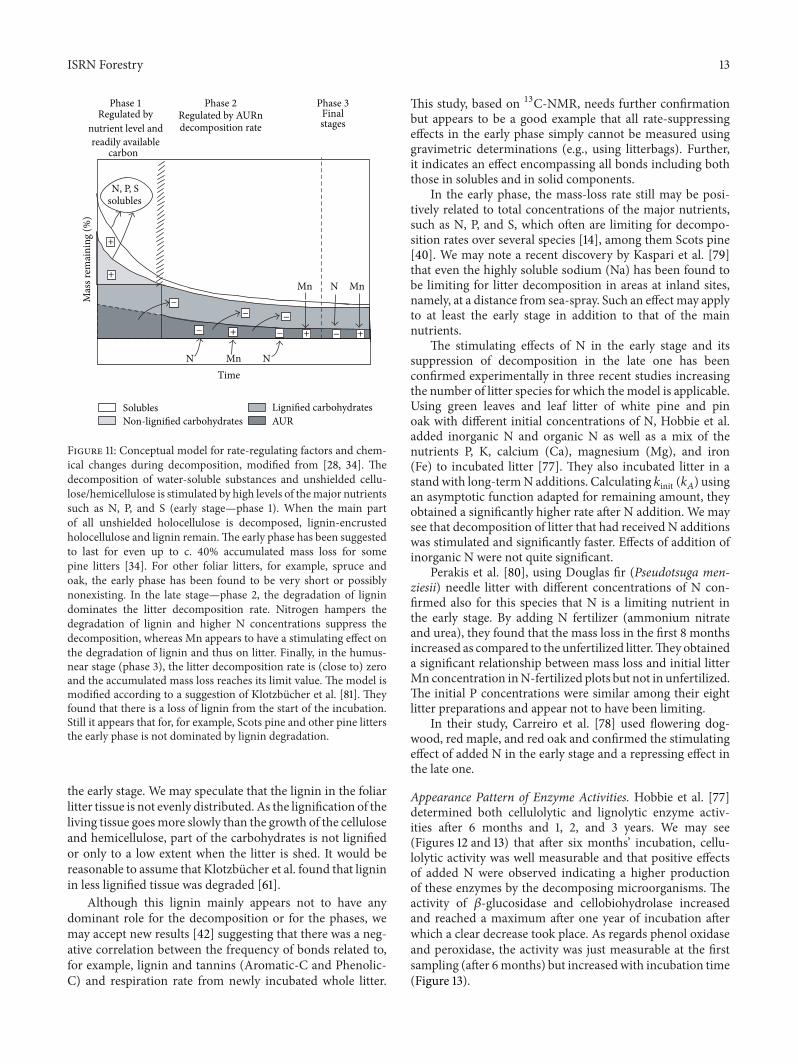
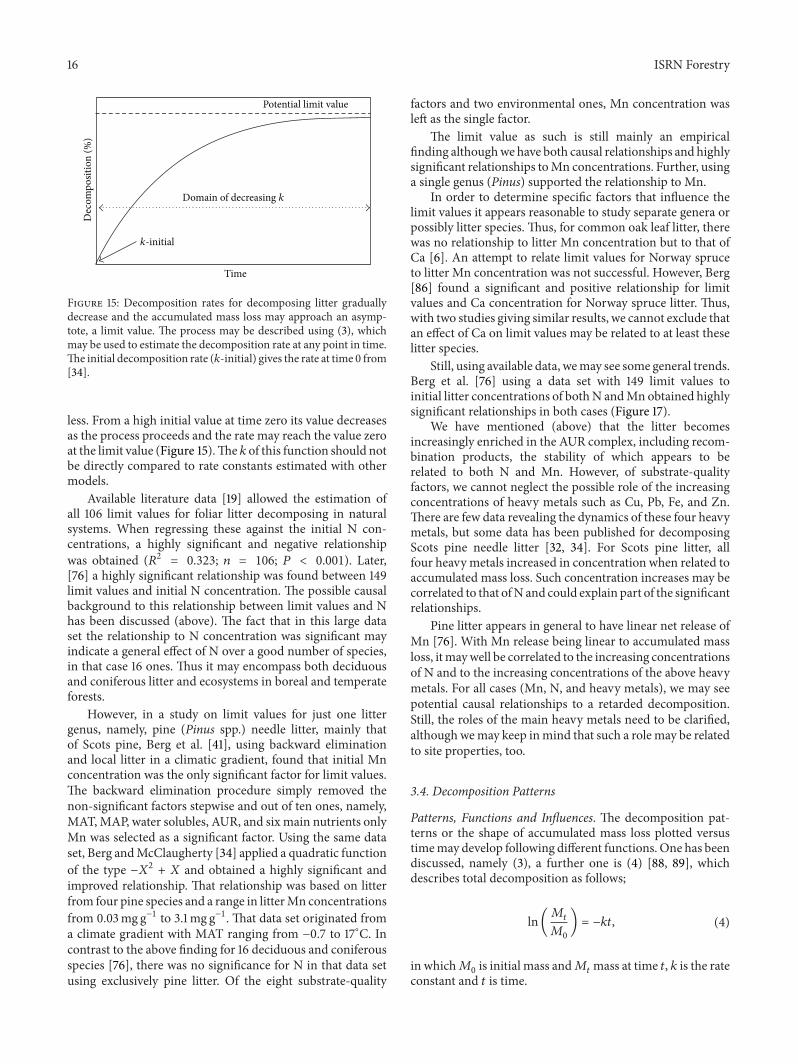
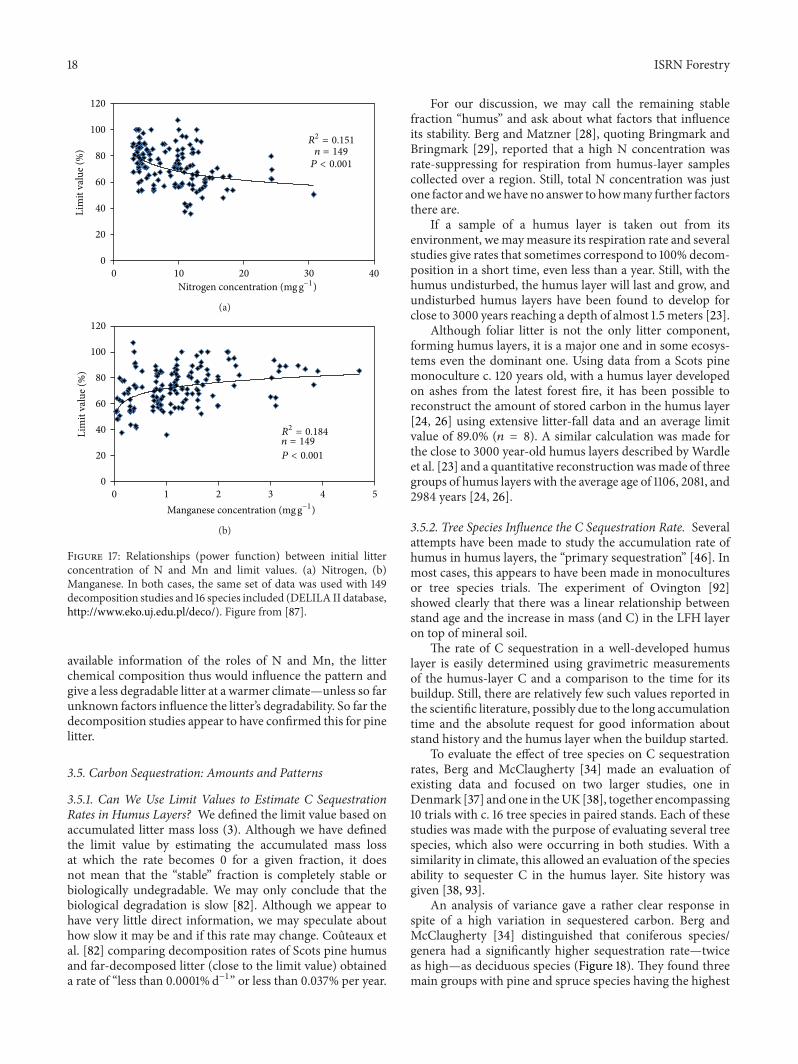
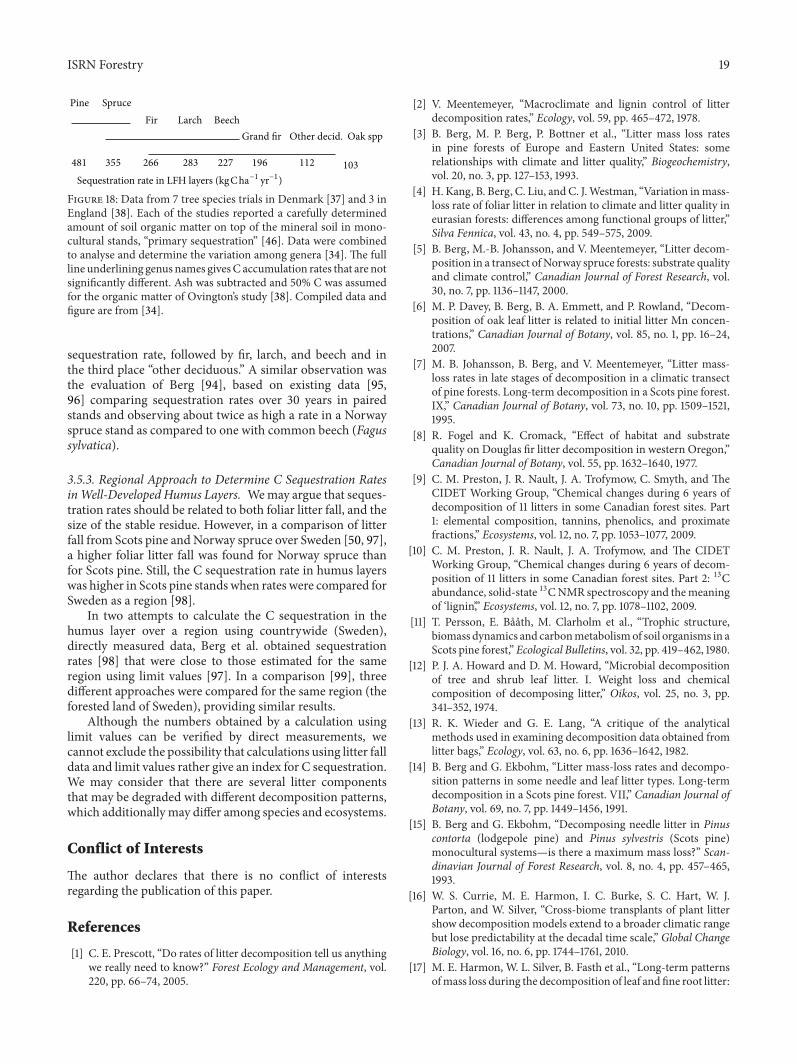