reverse osmosis recovery maximization · desalination and water purification research and...
TRANSCRIPT

Desalination and Water Purification Research and Development Program Report No. 119
Reverse Osmosis Recovery Maximization
U.S. Department of the Interior Bureau of Reclamation March 2008

REPORT DOCUMENTATION PAGE Form Approved OMB No. 0704-0188
Public reporting burden for this collection of information is estimated to average 1 hour per response, including the time for reviewing instructions, searching existing data sources, gathering and maintaining the data needed, and completing and reviewing this collection of information. Send comments regarding this burden estimate or any other aspect of this collection of information, including suggestions for reducing this burden to Department of Defense, Washington Headquarters Services, Directorate for Information Operations and Reports (0704-0188), 1215 Jefferson Davis Highway, Suite 1204, Arlington, VA 22202-4302. Respondents should be aware that notwithstanding any other provision of law, no person shall be subject to any penalty for failing to comply with a collection of information if it does not display a currently valid OMB control number. PLEASE DO NOT RETURN YOUR FORM TO THE ABOVE ADDRESS.
T1. REPORT DATE (DD-MM-YYYY) T
March 2008 T2. REPORT TYPE T
Final T3. DATES COVERED (From - To)T
January 2004 – August 2006 5a. CONTRACT NUMBER
Agreement No. 02-FC-81-0837 5b. GRANT NUMBER
T4. TITLE AND SUBTITLE Reverse Osmosis Recovery Maximization
5c. PROGRAM ELEMENT NUMBER
5d. PROJECT NUMBER
5e. TASK NUMBER G
6. AUTHOR(S) Dr. Graham Juby
5f. WORK UNIT NUMBER
7. PERFORMING ORGANIZATION NAME(S) AND ADDRESS(ES) Carollo Engineers 10540 Talbert Avenue, Suite 200E Fountain Valley CA 92708
8. PERFORMING ORGANIZATION REPORT NUMBER
10. SPONSOR/MONITOR’S ACRONYM(S)
9. SPONSORING / MONITORING AGENCY NAME(S) AND ADDRESS(ES) U.S. Department of the Interior, Bureau of Reclamation, Denver Federal Center, PO Box 25007, Denver CO 80225-0007
11. SPONSOR/MONITOR’S REPORT NUMBER(S)
DWPR Report No. 119 12. DISTRIBUTION / AVAILABILITY STATEMENT
Available from the National Technical Information Service (NTIS), Operations Division, 5285 Port Royal Road, Springfield VA 22161
13. SUPPLEMENTARY NOTES T
Report can be downloaded from Reclamation Web site: http://www.usbr.gov/pmts/water/publications/reports.html
14. ABSTRACT (Maximum 200 words) Two potential brackish potable water sources in the Phoenix area were tested at pilot scale with reverse osmosis (RO) to determine the maximum water recovery that could be obtained. A dendrimer-based scale inhibitor was used to try to enhance water recovery. One water source, with a largely surface water component from agricultural run-off (Western Canal water) was tested in Phase 1 of the project. Ultrafiltration (UF) was used as pretreatment to the RO during this phase, and the pilot system was operated for approximately 160 days between September 2004 and February 2005. In Phase 2 of the study a local ground water was tested with RO only, for approximately 130 days, between July 2005 and January 2006. During Phase 1, the UF system performed well, but the RO process was not stable while operating at 90-percent recovery. There was a decrease in membrane performance after less than 30 days of operation. During Phase 2, the RO process showed better performance at 90-percent recovery. However, there was a decline in the system performance with time. A membrane autopsy confirmed the presence of high concentrations of silica, calcium, iron, and aluminum on the membrane surface. Future testing is recommended prior to designing a full-scale system.
15. SUBJECT TERMS Brackish Water, Dendrimer, Desalination, Desalting, Ground Water, Membrane Autopsy, Pretreatment, Reverse Osmosis, Surface Water, Ultrafiltration, Water Recovery
16. SECURITY CLASSIFICATION OF: UL
19a. NAME OF RESPONSIBLE PERSON T
Erik Jorgensen a. REPORT b. ABSTRACT
c. THIS PAGE
17. LIMITATION OF ABSTRACT
SAR (same as report)
18. NUMBER OF PAGES
150 19b. TELEPHONE NUMBER (include area code)
303-445-3604 SS Standard Form 298 (Rev. 8/98)
P Prescribed by ANSI Std. 239-18

U.S. Department of the Interior Bureau of Reclamation Technical Service Center Water and Environmental Resources Division Water Treatment Engineering Research Team Denver, Colorado March 2008
Desalination and Water Purification Research and Development Program Report No. 119
Reverse Osmosis Recovery Maximization
Prepared for Reclamation Under Agreement No. 02-FC-81-0837
by
Dr. Graham Juby
Carollo Engineers Fountain Valley, California

Disclaimer The views, analysis, recommendations, and conclusions in this report are those of the authors and do not represent official or unofficial policies or opinions of the United States Government, and the United States takes no position with regard to any findings, conclusions, or recommendations made. As such, mention of trade names or commercial products does not constitute their endorsement by the United States Government.
MISSION STATEMENTS
The mission of the Department of the Interior is to protect and provide access to our Nation's natural and cultural heritage and honor our trust responsibilities to Indian tribes and our commitments to island communities.
The mission of the Bureau of Reclamation is to manage, develop, and protect water and related resources in an environmentally and economically sound manner in the interest of the American public.

Acknowledgments Carollo Engineers wishes to thank the Bureau of Reclamation and the City of Phoenix, Arizona for sponsoring this project as well as the following organizations and individuals for their support of this project: the City of Phoenix for providing the site and utilities for the pilot plant; Brandy Kelso, P.E., and Paul Kinshella, Superintendent, Treatment Plant Engineering, with the City of Phoenix Water Services Department; and Erik Jorgensen, Harry Remmers, and Ellen Abart (posthumously) of Reclamation, for their guidance and assistance throughout this project. Appreciation is also extended to the FilmTec Corporation, subsidiary of Dow Chemical Company, for the post-testing autopsy of the membrane elements.
The Carollo team was lead by Graham Juby as the Partner in Charge and William Newhouse as the Project Manager. Jenna Manuszak and Martin Ramirez provided day-to-day pilot operations and monitoring functions. Tom Seacord, Sandeep Sethi, Susanna Li, Jerry Russell, Christian Tasser, Charlie He, and Mark Urban provided technical support.

v
Table of Contents Page
Abbreviations and Acronyms .................................................................. xi
1. Executive Summary ............................................................................ 1
2. Background......................................................................................... 3
2.1 General........................................................................................... 3
2.2 Need for Research ......................................................................... 3
2.2.1 City of Phoenix Water Supplies .............................................. 3
2.2.2 Basis for Reverse Osmosis Design Models............................. 4
2.2.3 Scale Inhibitor Development................................................... 5
2.2.4 Hypochlorite Generation Technologies .................................. 5
2.3 Economic Value ............................................................................ 6
2.4 Project Objectives.......................................................................... 6
2.5 Contributing Agencies................................................................... 7
3. Conclusions and Recommendations ................................................... 9
4. Technical Approach ............................................................................ 11
4.1 General........................................................................................... 11
4.2 Surface Water Testing (Phase 1) ................................................... 11
4.2.1 Scale Inhibitor Selection ......................................................... 11
4.2.2 Membrane Selection................................................................ 12
4.2.2.1 UF Membrane Selection ................................................... 12
4.2.2.2 RO Membrane Selection................................................... 13
4.2.3 Equipment Setup ..................................................................... 13
4.2.3.1 UF Pilot............................................................................. 16
4.2.3.2 RO Pilot ............................................................................ 17
4.2.3.3 Site Layout ........................................................................ 20
4.2.4 Normal Operation.................................................................... 21
4.2.4.1 UF for RO Pretreatment.................................................... 21
4.2.4.2 RO Operation.................................................................... 25

vi
Table of Contents (continued) Page
4.2.5 Data Collection (Phase 1)........................................................ 27
4.2.5.1 Manual Data Collection .................................................... 27
4.2.5.2 Automatic Data Collection ............................................... 28
4.2.5.3 Onsite Testing ................................................................... 28
4.2.5.4 Water Quality Laboratory Data ........................................ 29
4.3 Ground Water Testing (Phase 2) ................................................... 30
4.3.1 Scale Inhibitor Selection ......................................................... 30
4.3.2 Membrane Selection................................................................ 30
4.3.3 Equipment Setup ..................................................................... 31
4.3.4 Normal RO Operation ............................................................. 32
4.3.5 Data Collection (Phase 2)........................................................ 32
4.3.6 Membrane Autopsies............................................................... 33
5. Test Results and Discussion................................................................ 35
5.1 Surface Water Test Results (Phase 1)............................................ 35
5.1.1 Feed Water Quality (Phase 1) ................................................. 35
5.1.2 Ultrafiltration System Performance ........................................ 35
5.1.2.1 UF System Flux ................................................................ 35
5.1.2.2 UF System Transmembrane Pressure ............................... 39
5.1.2.3 Permeate Water Quality and UF Membrane Integrity...... 39
5.1.2.4 UF Backwash Duration, Frequency, and Overall Recovery 40
5.1.2.5 UF Membrane Cleaning Requirements ............................ 42
5.1.3 Reverse Osmosis System Performance ................................... 44
5.1.3.1 Feed Water Quality ........................................................... 44
5.1.3.2 RO Hydraulic Performance............................................... 45
5.1.3.3 Water Quality................................................................... 514
5.1.4 Cleaning Requirements ........................................................... 56
5.1.5 Summary of Phase 1 Testing Results...................................... 56

vii
Table of Contents (continued) Page
5.2 Ground Water Test Results (Phase 2)............................................ 57
5.2.1 Feed Water Quality ................................................................. 57
5.2.2 Hydraulic Performance (Phase 2) ........................................... 58
5.2.2.1 Performance Equations ..................................................... 59
5.2.2.2 Test Runs .......................................................................... 59
5.2.2.3 Normalized Permeate Flow............................................... 60
5.2.2.4 Net Driving Pressure......................................................... 62
5.2.3 Water Quality .......................................................................... 62
5.2.3.1 Normalized Salt Rejection ................................................ 62
5.2.3.2 Permeate Water Quality.................................................... 65
5.2.3.3 Concentrate Water Quality ............................................... 65
5.2.3.4 Cleaning Requirement ...................................................... 65
5.2.3.5 Summary for Phase 2 ........................................................ 67
5.2.3.6 Membrane Autopsy........................................................... 67
5.3 Comparison of LSI and CCPP Indices .......................................... 68
6. Summary and Conclusions ................................................................. 71
6.1 Ultrafiltration Pretreatment System............................................... 71
6.2 Reverse Osmosis System............................................................... 72
6.3 Overall Conclusions ...................................................................... 73
7. References........................................................................................... 75
Appendices
A FilmTec RO Membranes B RO Model Projections - Phase 1 C RO Cleaning Products and Procedures D RO Model Projections - Phase 2 E Raw Water Quality - Phase 1 F UF Permeate Water Quality - Phase 1 G Membrane Autopsy
viii
List of Tables Table Page
4.1 Scale Inhibitor Applications for the Western Canal ......................... 12
4.2 UF Pilot Plant Specifications............................................................ 12
4.3 RO Membrane Selection for the Western Canal ............................. 13
4.4 UF Membrane Module Specifications.............................................. 17
4.5 RO Pilot Plant Specifications ........................................................... 20
4.6 UF Operating Conditions.................................................................. 24
4.7 RO Operating Conditions (Phase 1 – Surface Water) ...................... 26
4.8 Recommended RO Cleaning Chemicals (Phase 1 – Surface Water) ................................................................................. 27
4.9 Onsite Water Quality Analyses (Phase 1- Surface Water) ............... 29
4.10 Laboratory Analyses (Phase 1 - Surface Water) Performed by City of Phoenix.............................................................................. 29
4.11 RO Operating Conditions (Phase 2 – Brackish Ground Water) ............................................................................................ 31
4.12 Onsite Water Quality Testing (Phase 2 – Brackish Ground Water) ............................................................................... 32
4.13 Laboratory Analyses (Phase 2 - Brackish Ground Water) performed by City of Phoenix ....................................................... 33
5.1 Raw Water Quality of the Western Canal (Phase 1) ........................ 36
5.2 UF Permeate Water Quality - Western Canal Water (Phase 1)........ 40
5.3 UF Membrane Cleaning Requirements - Western Canal Water (Phase 1)....................................................................................... 42
5.4 RO Feed Water Quality – UF-Treated Surface Water (Phase 1)...... 45
5.5 RO Permeate Water Quality - Surface Water (Phase 1)................... 54
5.6 RO Concentrate Water Quality - Surface Water (Phase 1) .............. 56
5.7 Raw Water Quality of Well Utilized for Study (Phase 2) ................ 57
5.8 Water Quality of Ground Water near Gila River (Phase 2).............. 58
5.9 Water Quality Data for RO Concentrate .......................................... 69

ix
List of Figures Figure Page
4.1 Western Canal Membrane Pilot Plant Site Map ............................... 14
4.2 Process Flow Diagram (Western Canal Site) ................................... 15
4.3 Western Canal Membrane Pilot Plant Site Plan ............................... 16
4.4 Programmable Logic Controller (PLC) of the UF Pilot System ...... 17
4.5 UF Pilot Process and Instrumentation Diagram ............................... 18
4.6 RO Pilot Plan and Instrumentation Diagram.................................... 19
4.7 Picture of RO Pilot Plant Skid .......................................................... 20
4.8 Pilot Plant Layout with the Trailers.................................................. 22
4.9 Photo of Western Canal Pilot Site .................................................... 23
4.10 Raw Water Intake Piping ................................................................ 23
4.11 Site Security Equipment ................................................................. 24
5.1 UF Feed Water Quality (Turbidity and Particle Counts).................. 37
5.2 UF Hydraulic Performance............................................................... 38
5.3 UF Permeate Water Quality.............................................................. 41
5.4 Plot with Cleaning Frequencies ........................................................ 43
5.5 Close-up of Silt and Mud Build-up on UF Membrane ..................... 44
5.6 Western Canal RO Normalized Permeate Flow - Phase 1 ............... 49
5.7 Western Canal RO Flux Balance - Phase 1 ...................................... 51
5.8 Net Driving Pressure - Phase 1......................................................... 52
5.9 Western Canal RO NDP Versus NPF - Phase 1 ............................... 53
5.10 Normalized Salt Rejection - Phase 1 .............................................. 55
5.11 Normalized Permeate Flow (NPF) - Phase 2.................................. 61
5.12 Net Driving Pressure (NDP) - Phase 2 ........................................... 63
5.13 Normalized Salt Rejection (NSR) - Phase 2 ................................... 64
5.14 Permeate Total Dissolved Solids (TDS) - Phase 2 ......................... 66

xi
Abbreviations and Acronyms µg/L micrograms per liter µS/cm microsiemens per centimeter CCPP Calcium Carbonate Precipitation Potential CEB chemically enhanced backwash CIP clean-in-place City City of Phoenix cm centimeters DOC dissolved organic carbon DWPR Desalination and Water Purification Research ft feet gal gallon GB gigabytes gfd gallons per square foot per day gph gallons per hour gpm gallons per minute ICPES inductively coupled plasma emission spectroscopy ICP-MS inductively coupled plasma mass spectrometry kPa kilopascals Lmh liters per square meter per hour L/s liters per second LSI Langelier Saturation Index m meters MF microfiltration mgd million gallons per day mg/L milligrams per liter NDP net driving pressure NPF normalized permeate flow NSP normalized salt passage NSR normalized salt rejection NTU nephelometric turbidity unit O&M operation and maintenance PLC programmable logic controller

xii
psi pounds per square inch psig pound per square inch gauge PWT Professional Water Technologies RO reverse osmosis ROSA Reverse Osmosis System Analysis scfm standard cubic feet per minute SDI silt density index SOC synthetic organic compound SRP Salt River Project SU standard units TDS total dissolved solids TMP transmembrane pressure TOC total organic carbon TSS total suspended solids TTHM total trihalomethanes UF ultrafiltration VFD variable frequency drive

1
1. Executive Summary The Bureau of Reclamation (Reclamation) awarded a project to Carollo Engineers for the study of wastewater desalination for ground water replenishment in the Las Vegas Valley. However, after the partnering organization withdrew from the project, funding was redirected to the Phoenix area for the study of recovery maximization of two water resources that would require desalination: Western Canal surface water and brackish ground water. The City of Phoenix (City) agreed to provide matching funds for the project.
This report presents the pilot test results obtained from two performance evaluations of a treatment train consisting of ultrafiltration (UF) and a three-stage reverse osmosis (RO) system to treat Western Canal surface water (Phase 1) and a three-stage RO system treating brackish ground water (Phase 2).
Historically, the Western Canal has not been used as a drinking water supply because it is relatively far from the population center of Phoenix. Also, it has water quality issues (large turbidity fluctuations; average salinity of about 800 milligrams per liter (mg/L); total hardness of 250 mg/L as CaCO3; and total organic carbon (TOC) of 2.8 mg/L) from agricultural runoff and brackish ground water that is pumped into the Western Canal as a supplemental supply.
A second new source of drinking water for the Phoenix area that is currently unused is brackish ground water. This water has an average salinity of about 1,500 mg/L; total hardness of 120 mg/L as CaCO3; and a TOC of 0.7 mg/L).
The management of concentrate disposal is a significant challenge to using either of these waters as a potable source. In fact, without a suitable means of concentrate disposal at this inland location, it would not be possible to reduce the salinity of these sources. Therefore, operating RO at the highest recovery possible would limit the volume of concentrate for disposal and increase the potential of a viable future desalination project.
Initially, this project had three main objectives:
• Examine alternative scale prediction models for predicting maximum RO recovery and the precipitation of calcium carbonate and other scale forming salts.
• Evaluate the use of a newly developed dendrimer scale inhibitor to maximize recovery and reduce the amount of concentrate for disposal.
• Examine the potential for beneficial reuse of the concentrate stream as a brine source in chlorine generation.

2
The last of these three objectives was initiated, but never completed due to budget limitations and the inability to find a suitable chlorine generator for the pilot test. Three vendors of onsite chlorine generators were contacted about participating in the project, but none agreed to do so. Therefore, the focus of the study was limited to the first two objectives.

3
2. Background 2.1 General
In order to meet rising water demands across the country, many communities have begun to investigate the feasibility of developing brackish ground water and seawater as supplemental sources of water supply. RO has rapidly emerged as the preferred method for desalination of these waters. However, RO is more expensive than conventional treatment techniques and generates a saline concentrate that ultimately requires disposal. Disposal of the concentrate can present serious challenges, especially at inland locations where ocean discharge is not available (Zacheis and Juby, 2002). In areas where water resources are scarce, there is also a strong desire to get the most product out of the source water used. Therefore, maximization of recovery (the ratio of treated water produced to source water used) has become an important challenge to make RO economically feasible for communities with few source water supplies and/or limited concentrate disposal resources.
In 2002, Reclamation advertised for proposals of research and pilot-scale system studies through the Desalination and Water Purification Research program. A project was awarded to Carollo Engineers for the study of wastewater desalination for ground water replenishment in the Las Vegas Valley. However, after the partnering organization withdrew from the project, funding was redirected to the Phoenix Area for the study of recovery maximization of two water resources that require desalination: Western Canal surface water and brackish ground water. This report presents the pilot test results obtained from treating these two brackish source waters.
2.2 Need for Research
2.2.1 City of Phoenix Water Supplies Phoenix is our Nation’s fifth largest city (based on population) and is located in the second fastest growing county (based on annual population increase). One of the most significant challenges that the City faces is the development of water resources to support this rapid growth phenomenon.
Historically, the Western Canal has not been used as a drinking water supply due to its geospatial location in relation to the population center of Phoenix. It also has water quality issues associated with agricultural runoff and the brackish ground water that is pumped into the Canal as a supplemental supply during high irrigation demand periods. Water from the Western Canal is also susceptible to

4
turbidity fluctuations and requires pretreatment before it can be treated using RO. During this pilot study, a UF treatment system was selected for pretreatment of the RO feed water.
Associated with the desalination of the Western Canal, which inherently produces a concentrated waste stream, is the challenge of developing an economically and politically acceptable disposal management strategy.
Several of the typical disposal options for inland desalination plants may not be practical for Phoenix. Evaporation ponds, which are often a viable disposal option for arid climates, may be considered as a waste of a still valuable water source in this region of limited water resources and would not likely be supported by the general public. Deep-well injection may also be impractical due to the compact nature of the local geology and regulatory limitations.
Considering the difficulty and cost of concentrate disposal, as well as the limited supply of water resources in the Phoenix area and other inland desert communities, recovery maximization would be a key parameter in achieving a successful RO design. Further, implementation of concentrate reuse strategies would also support the City's overall philosophy of maximizing use of its water resources.
2.2.2 Basis for Reverse Osmosis Design Models Typically, the design recovery for a new RO system is calculated using one of several modeling programs developed by the membrane manufacturers. RO design models calculate the maximum design recovery that can be achieved based on salt saturation indices derived from the feed water quality. If recovery is pushed significantly beyond the design value, the RO concentrate will become saturated with salts and scale will begin to form on the membrane surfaces. Typical scale-forming salts include calcium carbonate, calcium sulfate, barium sulfate, strontium sulfate, calcium fluoride, and silica. Iron, manganese, and aluminum also become concentrated and can foul RO membranes and/or contribute to scale formation; for example, in the case of silica.
Traditionally, desalination engineers have used the Langelier Saturation Index (LSI) to assess the saturation limit of calcium carbonate, which can be the most scaling, and, therefore, most recovery-limiting, salt in the desalination of certain brackish water sources. Corrosion engineers, however, promote the use of an alternative scaling index, called the Calcium Carbonate Precipitation Potential (CCPP). While the LSI is a qualitative index of whether calcium carbonate will dissolve or precipitate, the CCPP is proportional to the kinetics of precipitation and thus considered to be a better estimate of the amount of calcium carbonate

5
that will precipitate (Seacord and Zander, 2003). The use of the LSI in RO design modeling often results in a conservative design recovery, which can limit maximization of water resources.
2.2.3 Scale Inhibitor Development Saturation limits can significantly hinder recovery maximization on more saline source waters. While effective pretreatment methods, such as softening or pH adjustment, can aid in controlling scale formation, most RO installations rely on chemical scale inhibitors to improve the solubility of important scaling salts.
Several types of scale inhibitor chemicals exist, including threshold inhibitors, distorting agents, and dispersants. Threshold inhibitors retard precipitation of salts by binding with ionic charges. Distorting agents alter crystal growth to make them weaker and more prone to fracture, which, in turn, makes the scale that does form easier to clean from the membrane surface. Polymer dispersants add charge to the crystals, causing them to repel one another and making it more difficult for scale buildup to form.
Dendrimers, one type of polymer dispersant, have gained attention in the RO market for their ability to be applied at higher concentrations without fouling the membrane, especially in water with high total dissolved solids concentration and containing iron and manganese (two chemicals that can cause interference with scale inhibitors). While conventional inhibitors begin to form a film on the membrane surface at accumulated levels over 50 mg/L in the RO concentrate, dendrimer limits may exceed 1,000 mg/L. As such, there is an opportunity to increase the application of these inhibitors in an attempt to reach higher RO recovery rates.
2.2.4 Hypochlorite Generation Technologies In addition to recovery maximization, beneficial reuse of the RO concentrate has become an important aspect of desalination, especially in more economically challenged areas or inland regions with limited disposal options. Historically, the most widely used reuse technique has been land application for irrigation purposes (Kenna and Zander, 2000). However, dilution is usually required before application, and other reuse techniques warrant attention.
Conventional chlorine generators employed at many water and wastewater treatment facilities use electrolytic processes to convert high purity sodium chloride brine solutions into sodium hypochlorite for disinfection. Recent advances in generator technology were expected to allow the use of less pure brine sources, while still avoiding electrode fouling. RO concentrate contains a range of salts, including sodium chloride, present at levels directly proportional to

6
their concentration in the feed stream and the performance characteristics of the membrane. However, limited testing has been done to analyze the feasibility of using RO concentrate as a brine source. Given the current prohibitive cost of most RO concentrate disposal options for inland communities, the additional concentration and/or purification that may be required to turn the RO concentrate into an acceptable brine feed solution for a chlorine generator may be less costly than the cost of conventional disposal. Furthermore, the chlorine generated from this process could be used for disinfection at existing or future water and wastewater treatment facilities.
Unfortunately, during the execution of this project, no commercial pilot system could be obtained to evaluate the technical feasibility of RO brine concentration and brine treatment for conversion to hypochlorite.
2.3 Economic Value
Concentrate disposal is a costly component of desalination treatment and presents challenges, especially for inland regions. A reduction in the concentrate volume resulting from process recovery maximization can result in significant capital and operating cost savings. Based on estimates of capital and operating costs for a 10-million-gallons-per-day (mgd) RO treatment plant, an increase in recovery from 70 to 90 percent can result in as much as $13 million in capital cost savings and $2 million annually in operation and maintenance costs savings (GE, 2003). Although increased recovery rates can sometimes require more frequent chemical cleaning of the membranes, the projected cost of increased chemical cleaning from once every 4 months to once per month is relatively insignificant when compared to the concentrate disposal savings of $1.5 million annually in chemical costs for a 10-mgd RO system.
2.4 Project Objectives
Based on the above research needs, three main project objectives emerged:
• Examine alternative scale prediction models for predicting maximum RO recovery and the precipitation of calcium carbonate and other scale forming salts.
• Evaluate the use of a newly developed dendrimer scale inhibitor chemical to maximize recovery and reduce the amount of concentrate requiring disposal.
• Examine the potential for beneficial reuse of the concentrate stream as a brine source in chlorine generation.
7
The technical approach sections provide further details on how the first two of these objectives were to be achieved. The third objective of examining the potential for beneficial reuse of the concentrate stream was initiated, but no pilot testing could be performed. Three vendors of onsite chlorine generators were contacted. However, in-kind contributions from the three vendors could not be obtained, and a pilot system for onsite chlorine generation could not be provided. Because of budget limitations, this task could not be completed.
2.5 Contributing Agencies
The costs for the preparation of the pilot site and the necessary infrastructure were paid for by the City. Carollo operated the pilot plant and collected the samples and delivered them to the City laboratory for analysis. The infrastructure provided by the City included sewer and potable water service, telephone service, raw feed water from the Western Canal, and ground water from a well near the Gila River. The City also purchased the RO cleaning unit and provided a trailer to house the RO unit.

9
3. Conclusions and Recommendations The pilot plant equipment was operated for approximately 160 days during Phase 1 (between September 2004 and February 2005) and approximately 130 days during Phase 2 (between July 2005 and January 2006).
The UF pretreatment system used during Phase 1 demonstrated its ability to adequately remove suspended solids from the Western Canal water to a level suitable for RO treatment. Some insoluble iron was also removed from the water. A key finding of the investigation is that chemically enhanced backwashes were an effective way to maintain the membrane flux between full chemical cleaning events.
During Phase 1, RO test results showed that operating at 90-percent recovery was not feasible under the test conditions encountered. There was a decrease in membrane performance as indicated by a loss of permeate production and salt rejection after less than 30 days of operation at 90-percent recovery. Pilot testing did indicate stable operation at a recovery level of 85 percent, although this testing period was short (only 12 days).
During Phase 2, RO testing on local brackish ground water (without UF pretreatment) showed better performance at 90-percent recovery. However, there was a decline in system performance with time. A membrane autopsy confirmed the presence of high concentrations of silica, calcium, iron, and aluminum on the membrane surface. This confirmed that scale formation was occurring in the tail end membranes, resulting in the declining performance observed during the testing.
The study results show that the predictions for the performance of a newly developed dendrimer scale inhibitor for operating RO at 90-percent recovery and above could not be achieved under the dosages and system conditions encountered. This was the case for both water sources tested.
The study has provided valuable insight into the challenges associated with operating RO at high recovery levels on these source waters and also confirmed the value of such testing for evaluating model predictions. Future testing is recommended prior to designing a full-scale system, and such tests should include an extended period of operation to confirm stable performance at a recovery of 85 percent before testing at higher recovery levels. Future tests should also include periods of operation with different scale inhibitors to determine the optimum chemical and dose for each water source.

11
4. Technical Approach 4.1 General
Phase 1 focused on reverse osmosis (RO) recovery maximization when treating surface water from the Western Canal; Phase 2 focused on brackish ground water. The first step in the technical approach was to use modeling programs (Reverse Osmosis System Analysis [ROSA] Version 5 by Dow Chemical Company) to predict the RO performance. These modeling results were then compared with the performance of the pilot RO system. Furthermore, dendrimer antiscalants were used, which, compared to other antiscalants, appeared to offer the highest RO recovery. Manufacturer-recommended doses were used at the start of Phase 1 and were subsequently increased to higher concentrations in order to reach higher RO recovery rates.
In order to reach a steady RO performance, the surface water had to be pretreated. A hollow-fiber ultrafiltration (UF) system was run for a minimum of 30 days prior to the start of the RO system. Upon reaching stable feed water quality, the RO system was operated at a baseline recovery of 85 percent, which seemed to be a conservative operating condition based on the results of RO modeling projections (see Sections 4.2.4.2 and 4.3.4). The project test plan called for the system recovery to be increased to 90 percent after the baseline RO performance was stabilized and run accordingly for approximately 3 months in order to obtain long-term performance results and to establish the chemical cleaning frequency needed. After 3 months, the recovery was going to be further increased to 92 percent or more. The scale inhibitor dose was to be increased during this period, depending on RO performance and in accordance with manufacturer recommendations.
4.2 Surface Water Testing (Phase 1)
4.2.1 Scale Inhibitor Selection Three vendors were contacted and asked to evaluate the given water quality and to propose the appropriate type and dosage of antiscalant. The names and dosages of the proposed antiscalants are presented in table 4.1.
Based on the vendors’ projections for the highest anticipated recovery, Professional Water Technologies’ SpectraGuard™ was chosen. SpectraGuard™ is a dendrimer-based scale inhibitor with a molecular geometry that was anticipated to result in enhanced solubility over conventional linear or cross-linked polymers. The dosage of the antiscalant was predetermined by the

12
chemical antiscalant supplier and was based on the water quality of the canal water. The maximum water recovery with this antiscalant was expected to be 92 percent.
Table 4.1 Scale Inhibitor Applications for the Western Canal
Chemical Supplier Scale Inhibitor Product Suggested
Dose Anticipated Recovery
Professional Water Technologies
SpectraGuard™ 4.2 mg/L 92%
King-Lee Technologies Pretreat Plus™ 0100 3.0 mg/L 90% Nalco PermaTreat ® PC-510T 2.2 mg/L 91% Note: mg/L = milligrams per liter.
4.2.2 Membrane Selection 4.2.2.1 UF Membrane Selection The UF membrane chosen for pretreatment on the Western Canal was selected on a basis of availability, compatibility with Carollo’s UF pilot skid, and cost. Under these criteria, the decision was made to use a Polymem™ UF membrane module from WesTech Engineering, Inc. As noted previously, the UF system was used solely for pretreatment for the RO testing. RO recovery maximization was the main focus of this project, not UF recovery.
Table 4.2 outlines the specifications of the UF pilot plant. Continuous fiber breakage resulted in a reduced permeate water quality, and the UF membrane module was replaced after 120 days of testing on January 6, 2005, with the same type of UF membrane.
Table 4.2 UF Pilot Plant Specifications Parameter Value
Dimensions 64 inches x 74 inches x 79 inches Electrical requirement 3-phase, 480-volt, 40-ampere circuit breaker Feed pump capacity 45 gpm Backwash pump capacity 150 gpm at 55 psi Backwash water tank 200 gal Air scour pressure capacity 120 psi Chemical dosing pump capacity 0.75 gph Chemical cleaning pump capacity Three 1.25-gph pumps Chemical storage tanks Three 10-gallon polyethylene tanks Chemical cleaning solution heater 2-kW inline immersion heater Recirculation pump capacity 10 gpm at 16 psig Note: gpm = gallons per minute, gal = gallons, psi = pounds per square inch, gph = gallons per hour, kW = kilowatt, psig = pounds per square inch gauge.

13
4.2.2.2 RO Membrane Selection As shown in table 4.3, the Dow FILMTEC™ BW30LE-4040 membranes were selected for RO Stages 1 and 2. This is a polyamide membrane configured in a 4-inch (10.16-centimeter [cm]) diameter and 4-foot (ft) (1.22-meter [m]) long spiral membrane element. For the third stage of the RO system, a Dow FILMTEC™ LP2540 was selected. This is a 2.5-inch (64-millimeter [mm]) diameter element with lower surface area. See Appendix A, “Filmtec RO Membranes,” for complete membrane specifications. The RO array chosen for Phase 1 testing was 2:1:1. There were six 4-inch (102-mm) diameter elements per vessel in Stage 1, six elements in Stage 2, and six 2.5-inch (64-mm) diameter elements in Stage 3. During the testing, it was observed that the third stage elements did not have the required minimum feed flow rate; therefore, the RO array was modified during Phase 2 to address this issue.
Table 4.3 RO Membrane Selection for the Western Canal
Stage Vessels/ Elements
Membrane Manufacturer Product Name
Surface Area (ft2)
1 1/6 Dow FILMTEC™ BW30LE-4040 82 2 1/6 Dow FILMTEC™ BW30LE-4040 82 3 1/6 Dow FILMTEC™ LP2540 28
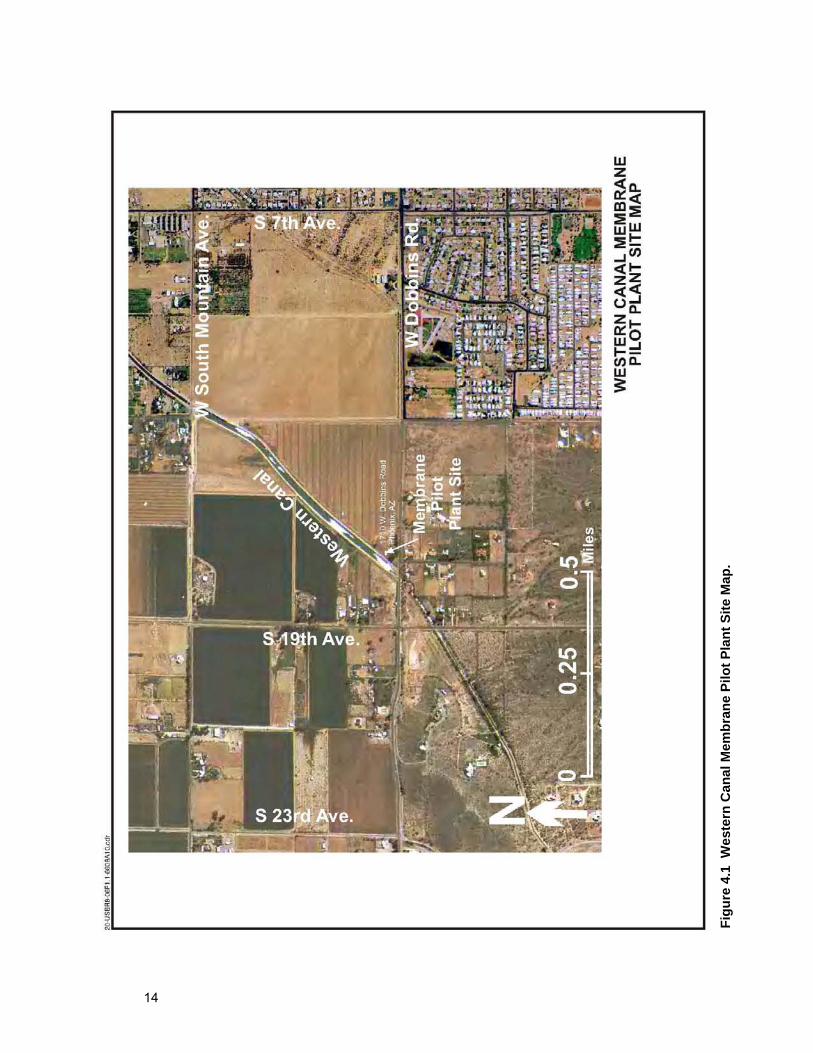
4.2.3 Equipment Setup The Western Canal test site is located at 1710 W. Dobbins Road in Phoenix (figure 4.1). The site is part of a larger property owned by the City of Phoenix (City) and intended for future construction of a Western Canal Water Treatment Plant. The UF and RO pilot equipment was installed in the southwestern portion of the property, adjacent to the Western Canal.
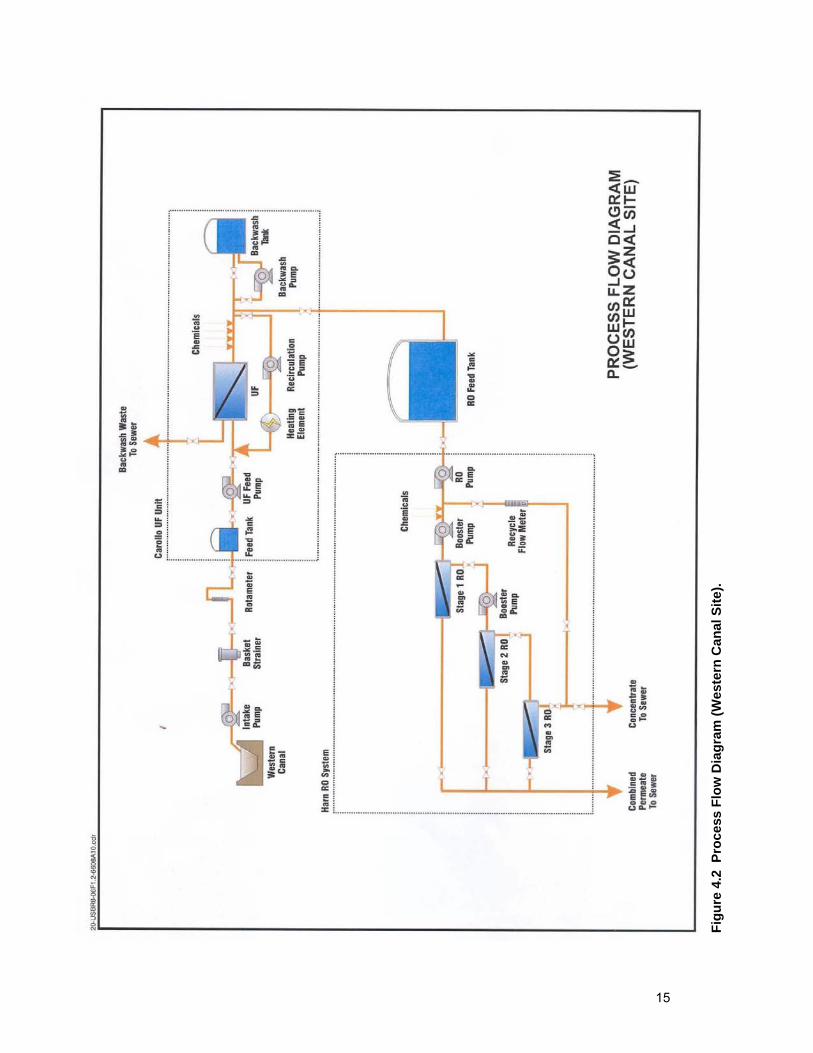
Raw water was taken directly from the Canal, using a centrifugal intake pump. Suspended material and algae were removed upstream of the UF unit using a 500-micron, automatic backwash in-line strainer. Water from the strainer was then collected in the UF feed tank that was mounted on the UF pilot skid. The permeate from the UF pilot system was collected in an intermediary 1,200-gal (4,500-liter) RO feed tank and then processed through the RO pilot system. The UF backwash water, RO concentrate, and RO permeate were combined and fed to a partially buried waste tank. A submersible pump transferred the combined water and wastewater streams to the sewer.
Figure 4.2 shows the Phase 1 process flow diagram, while figure 4.3 depicts the pilot plant site plan. Positioning of the pilots in this manner used minimal space and prevented the long side of the pilot trailers from exposure to the hot afternoon sun.
14
Figu
re 4
.1 W
este
rn C
anal
Mem
bran
e Pi
lot P
lant
Site
Map
.
15
Figu
re 4
.2 P
roce
ss F
low
Dia
gram
(Wes
tern
Can
al S
ite).

16
4.2.3.1 UF Pilot The UF system that operated at the Western Canal was a custom-built pilot plant owned by Carollo and designed to operate with a pressurized membrane module. The UF pilot operated using a programmable logic controller (PLC) and a human machine interface (figure 4.4). UF feed and backwash flows were controlled by variable frequency drives (VFD). Figure 4.5 presents the UF pilot process and instrumentation diagram. Table 4.4 outlines the technical specifications of the Polymem™ UF membrane module.
A chemically enhanced backwash (CEB) procedure was used at regular intervals to remove absorbed foulants. It was performed by dosing chemicals with a dosing pump during backwashing, followed by soaking the unit for a preset time and rinsing the unit by performing another backwash. The dosing chemicals included sodium hypochlorite (for removal of biological fouling) and hydrochloric acid (for removal of scaling). The chemical cleaning cycle consisted of a backwash combined with a chemical soak.
Figure 4.3 Western Canal Membrane Pilot Plant Site Plan.

17
Table 4.4 UF Membrane Module Specifications Parameter Value
UF membrane Polymem™ UF120S2 module Membrane material Polysulfone Module diameter 12 inches Module length 37.4 inches Flow configuration Hollow fiber outside-in, dead end Fiber external diameter 0.028 inch (0.72 mm) Fiber internal diameter 0.015 inch (0.38 mm) Membrane surface area 1205.6 ft2 (114 m2) Membrane cutoff 0.01 micron (nominal) Operating temperature 32 to 95 ˚F (0 to 35 ˚C) Operating pH 2 to 12
4.2.3.2 RO Pilot The RO pilot plant was leased from Harn RO Systems, Inc. The pilot skid (figures 4.6 and 4.7) consisted of three stages of RO membranes, organized in a 2:1:1 array of three- and four-element pressure vessels operated in series. The RO pilot had a maximum feed capacity of 30 gpm (1.9 liters per second (L/s)). The unit measured approximately 60 inches (1.52 m) in width by 144 inches (3.66 m) in length by 72 inches (1.8 m) in height. Table 4.5 outlines the technical specifications of the Harn RO pilot plant.
Figure 4.4 Programmable Logic Controller (PLC) of the UF Pilot System.

18
Figu
re 4
.5 U
F Pi
lot P
roce
ss a
nd In
stru
men
tatio
n D
iagr
am.

19
Figu
re 4
.6 R
O P
ilot P
lan
and
Inst
rum
enta
tion
Dia
gram
(Typ
ical
).

20
Table 4.5 RO Pilot Plant Specifications Parameter Value
Feed pump capacity 30 gpm Chemical tanks Two 30-gal tanks Pretreatment chemicals Acid and antiscalant Scale inhibitor pump capacity 0.42 gph Acid pump capacity 0.42 gph
Stage 1: (2) CodeLine 40A30-3, (2) Protec PRO-4-300
Stage 2: (1) CodeLine 40A30-3, (1) Protec PRO-4-300
Pressure vessels
Stage 3: (2) CodeLine 2.5B-3
Stages 1 and 2: 4 inches Membrane element diameter
Stage 3: 2.5 inches
Flow control Booster pump between first and second stages; permeate throttling available on all stages
4.2.3.3 Site Layout For security reasons and to protect the pilot equipment from extreme heat, the UF and RO pilots were housed within climate-controlled trailers. The UF system, including the UF product/RO feed tank, was housed in a 24-ft (7.32-m) by 8.75-ft
Figure 4.7 Picture of RO Pilot Plant Skid.

21
(2.67-m) by 9-ft (2.74-m) equipment trailer leased from Wastewater Resources, Inc. The RO pilot unit was housed in a 32-ft (9.75-m) by 8.5-ft (2.59-m) by 9-ft (2.74-m) custom trailer owned by the City. The City trailer had an attached work room, which was equipped with potable water and a sewer connection for performing simple onsite laboratory analyses. Both trailers were equipped with air conditioning to maintain temperatures below 100 °F (38 °C). Figure 4.8 provides a layout of the pilot equipment within the two trailers, figure 4.9 provides a photograph of the Western Canal pilot site, and figure 4.10 is a photograph of the raw water intake piping.
The Western Canal pilot site was equipped with multiple security measures, including security cameras, grills for the trailer doors, outdoor light fixtures, a motion detector, and screening for the roof-mounted air conditioning units. Figure 4.11 shows photographs of some of this equipment. All of the equipment, including the power transformers, pumps, waste tanks, and trailers, were enclosed within a 6-ft (1.83-m) construction fence with barbed wire. The fence had a 20-ft (6.1-m) double gate for access.
4.2.4 Normal Operation In order to reach stable pretreatment conditions for the RO unit, the UF system was operated for 30 days at the start of the test program. During this time, the UF system was monitored for declining transmembrane pressure and adjusted to reach stabilized operation. Only after the UF unit had provided a continuously high-quality UF permeate was the RO system brought online. Chemical cleaning of the UF system and the recovery of the RO system were optimized to achieve the highest overall recovery.
4.2.4.1 UF for RO Pretreatment Table 4.6 outlines the starting operating conditions for the UF pretreatment unit. The UF system was to be operated at a flux of approximately 47 gallons per square foot per day (gfd) (80 liters per square meter per hour [Lmh]). Feed flow was controlled using a VFD. Periodic backwashing with sodium hypochlorite was to be used to control membrane fouling. In addition to that, air scour was used during the backwash process to loosen the cake formed on the surface of the membranes. If the UF unit did not reach stable operation under the conditions shown in table 4.6, the flux was to be reduced and the backwash frequency and duration were to be increased.

22
Figure 4.8 Pilot Plant Layout with the Trailers.

23
Figure 4.9 Photo of Western Canal Pilot Site.
Figure 4.10 Raw Water Intake Piping.

24
Table 4.6 UF Operating Conditions Parameter Value
System flux 47 gfd (80 Lmh) Feed flow 40 gpm (219 m3/d) Maximum feed pressure 29 psi (2.0 bar) Backwash frequency 30 minutes Backwash duration 60 seconds Maximum BW pressure 52.2 psi (3.6 bar) Chemical addition Sodium hypochlorite, 5 mg/L as Cl2 BW Flow configuration Reverse filtration, with air scour 1.5-3 scfm Overall system recovery 90% Notes: m3/d = cubic meters per day, scfm = standard cubic feet per minute.
4.2.4.1.1 Air Integrity Testing Air integrity testing was performed on a routine basis to detect any fiber breakage in the UF modules, which would lead to lower permeate water quality with higher turbidity and particle counts. An airflow test was used to determine the integrity of the membranes. The feed side was drained and pressurized as the filtrate side was left open to the atmosphere. Any broken fiber allowing a rapid escape of the pressurized air would result in an airflow rate higher than with an integral system. Broken fibers were identified and manually repaired.
Figure 4.11 Site Security Equipment.

25
4.2.4.1.2 Chemical Cleaning The chemical cleaning sequence for the UF pilot was programmed in the PLC system, which controlled the three different chemical cleaning protocols: acid, bleach, and caustic. Cleaning was initiated based on time or after an increase in transmembrane pressure, declining flux, and reduced permeability. The sequence for cleaning of the UF was to first clean with hypochlorite and sodium hydroxide and then follow with citric acid. Raw water was used to make up the chemical cleaning solution.
The sodium hypochlorite cleaning backwash was set at 20 seconds. The cleaning solution was recirculated for 7,200 seconds. Thereafter, a sodium hypochlorite cleaning backwash was performed for 30 seconds (with recirculation for 7,200 seconds). The dosage of sodium hypochlorite was 200 mg/L.
4.2.4.2 RO Operation Based on the test plan, the RO system was to be operated at a recovery of 85 percent and run at this condition for approximately 1 week. This startup period was chosen to allow time for the pilot operator to optimize operation without causing any irreversible damage or fouling to the new membranes. Only after successful results had been achieved within the first week was the recovery to be increased to 90 percent. Increasing the recovery further to 92 percent was also planned. The unit was to be operated at the higher recovery for approximately 3 months. During this longer testing period, more data were collected to evaluate the RO performance and the chemical cleaning requirements.
Table 4.7 outlines the overall RO system operating conditions at each recovery rate. Appendix B includes detailed results of the RO model projections for Phase 1 testing.
The RO modeling software predicts, as indicated in table 4.7 by the Langelier Saturation Index (LSI) and percent saturation values for BaSO4, CaF2, and SiO2, that scaling conditions exist even at 85-percent recovery. As expected, the extent of the scaling potential increases as the recovery increases. The table also shows the dose of scale inhibitor predicted by the chemical manufacturer.

26
Table 4.7 RO Operating Conditions (Phase 1 – Surface Water) Parameter Value
RO array 7:7:6:6 Total number of elements 26 Adjusted feed water pH 6.5 Estimated acid dose (mg/L 100% H2SO4) 80.0 RO system recovery1 85% 90% 92% Scale inhibitor dose (mg/L SpectraGuard™)2 2.4 3.5 4.2 Raw water flow to RO system (gpm) 18.8 17.8 17.4 RO feed pressure (psi) 153 154 150 Permeate flow (gpm) 16.0 16.0 16.0 Average system flux (gfd) 14.0 14.0 14.0 Brine conditions2 85% 90% 92% TDS (mg/L) 7,560 11,220 13,990 LSI 1.14 1.59 1.82 BaSO4 (% saturation) 2,897 4,361 5,487 CaF2 (% saturation) 332 1,090 2,113 SiO2 (% saturation) 123 184 229 HCO3 (mg/L) 1,166 1,720 2,134
Note: TDS = total dissolved solids. 1 RO system modeled using ROSA Version 5.4 (The Dow Chemical Company). 2 Scale inhibitor dose and recommended RO recovery modeled using PROdose32 Version 2.12.67 (Professional Water Technologies (PWT), Inc.).
4.2.4.2.1 Chemical Cleaning Chemical cleaning of the RO system with low and high pH cleaners (Lavasol I™ and Lavasol II™) was to be performed when one or more of the following operational parameters had deviated:
• Normalized permeate flow dropped by 10 percent or more • Normalized salt passage increased by 5 percent or more • Normalized differential pressure increased by 15 percent or more
Table 4.8 summarizes the manufacturer-recommended chemicals for cleaning the FILMTECTM membranes. Several cleanings are typically used in combination to remove the multiple layers of foulants from the membrane surface. One or more cycles of soaking and cleaning in recirculation may be required, depending on the nature of the foulant. Appendix C provides more detailed specifications for the commercial cleaning products.
The general sequence for cleaning was low pH cleaning to remove all inorganics, followed by high pH cleaning to remove organics. Starting with a high pH clean is generally not recommended because it can increase the severity of the scaling

27
through the precipitation of calcium and magnesium hydroxides. Cleaning of the RO Stage 1 membranes was to be performed separately, followed by cleaning of Stages 2 and 3. All chemical cleaning wastes from the UF and RO cleanings were collected, diluted with RO permeate water, and fed slowly to the sewer system in accordance with local regulations.
Table 4.8 Recommended RO Cleaning Chemicals (Phase 1 – Surface Water)
Suspected Foulant Cleaning Chemicals
Equivalent Commercial Product
(PWT, Inc.) Inorganic colloids (silt), silica, biofilms, organic fouling, and some sulfate scales
High pH cleaning, 0.1% sodium hydroxide, 0.25% sodium dodecylsufate,pH 12, 30 °C
Lavasol II™ - high pH and/or Lavasol V™ - for silica removal
Inorganic salts (CaCO3) Low pH cleaning, 0.2% hydrochloric acid, pH 2, 30-35 °C
Lavasol I™ - low pH
Metal oxides (i.e., iron) 1.0% sodium hydrosulfite Lavasol I™ - low pH
4.2.5 Data Collection (Phase 1) 4.2.5.1 Manual Data Collection UF and RO performance data were manually recorded into log books. The UF parameters included:
• Date, time, and operator initials
• Time to the next backwash cycle
• Pressure readings - feed, lower module, upper module, permeate, transmembrane, and backwash
• Flow readings - feed, permeate, and backwash
The following RO operational parameters were monitored and recorded daily:
• Date, time, and “run time” from the hour meter
• Pressure readings - cartridge filter inlet, cartridge filter outlet, system feed, system concentrate, system permeate, Stage 1 concentrate, Stage 2 feed, Stage 2 concentrate, Stage 2 permeate, Stage 3 feed, Stage 3 concentrate, and Stage 3 permeate
• Flow readings - system permeate, system concentrate, Stage 1 permeate, Stage 2 permeate
• Feed pump speed
• Scale inhibitor tank volume and flow rate

28
• Sulfuric acid tank volume and flow rate
4.2.5.2 Automatic Data Collection The UF pilot system was equipped with automatic data collection for the following parameters:
• Date and time
• Feed temperature
• Feed pH
• Flow readings - feed, permeate, and backwash
• Pressure readings - feed, lower module, upper module, permeate, and backwash
• Flux
• Permeability
These data were downloaded and stored on floppy disks. A telephone line was also installed to allow remote access to the unit.
The RO pilot system was equipped with automatic data collection for the following parameters:
• Pressure readings - system feed; Stage 1 permeate and concentrate; Stage 2 feed, permeate, and concentrate; Stage 3 feed, permeate, and concentrate
• Temperature
• System feed pH
• System feed and finished permeate conductivity
• Flow rates - Stages 1, 2, and 3 permeate and concentrate
4.2.5.3 Onsite Testing Table 4.9 outlines the Phase 1 water quality analyses that were performed daily. The following equipment was used for performing these analyses at the site:
• Temperature and pH - HACH sensION1 portable pH meter and HACH Model 51910 platinum series pH electrode
• Alkalinity - HACH Digital Titrator Model 16900
• Conductivity - HACH sensION5 conductivity meter and HACH Model 51975-00 conductivity probe
• Turbidity - HACH 2100P portable turbidimeter
29
• Silt Density Index (SDI) - Applied Membranes’ Direct SDITM with Millipore 0.45-micron nitrocellulose membranes
• Barium and silica - HACH DR2000 spectrophotometer
TDS was measured using dried weighing dishes, an analytical scale, and a commercial toaster oven.
Table 4.9 Onsite Water Quality Analyses (Phase 1- Surface Water)
Parameter Raw WaterUF
Permeate RO
Feed RO
Permeate RO
ByproductTemperature (°C) pH (SU) Alkalinity (mg/L) Conductivity Turbidity (NTU) SDI TDS (mg/L) Barium Silica
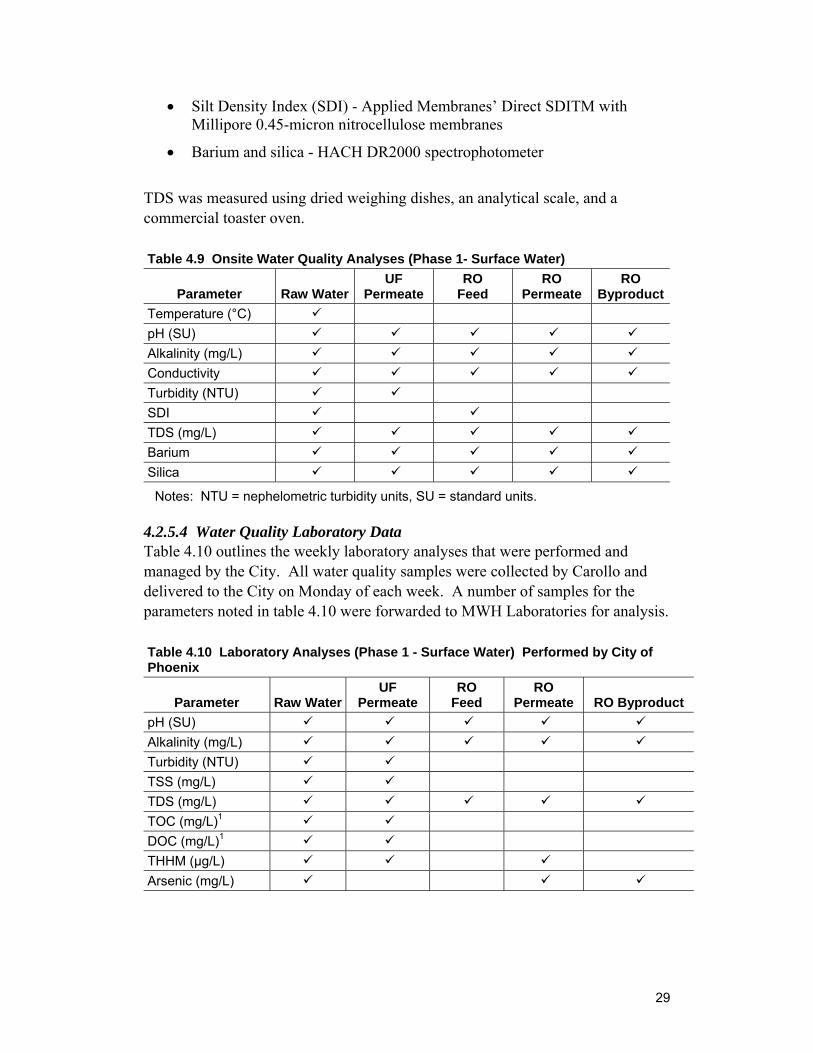
Notes: NTU = nephelometric turbidity units, SU = standard units. 4.2.5.4 Water Quality Laboratory Data Table 4.10 outlines the weekly laboratory analyses that were performed and managed by the City. All water quality samples were collected by Carollo and delivered to the City on Monday of each week. A number of samples for the parameters noted in table 4.10 were forwarded to MWH Laboratories for analysis.
Table 4.10 Laboratory Analyses (Phase 1 - Surface Water) Performed by City of Phoenix
Parameter Raw WaterUF
Permeate RO
Feed RO
Permeate RO Byproduct pH (SU) Alkalinity (mg/L) Turbidity (NTU) TSS (mg/L) TDS (mg/L) TOC (mg/L)1 DOC (mg/L)1 THHM (µg/L) Arsenic (mg/L)

30
Table 4.10 Laboratory Analyses (Phase 1 - Surface Water) Performed by City of Phoenix (continued)
Parameter Raw WaterUF
Permeate RO
Feed RO
Permeate RO Byproduct Barium (mg/L) Calcium (mg/L) Magnesium (mg/L) Sodium (mg/L) Potassium (mg/L) Ammonia (mg/L) Barium (mg/L) Strontium (mg/L) Sulfate (mg/L) Chloride (mg/L) Fluoride (mg/L) Nitrate (mg/L) Silica (mg/L) SOCs (mg/L)2 Note: TSS = total suspended solids, TOC = total organic carbon, DOC = dissolved organic carbon, TTHM = total trihalomethanes, SOC = synthetic organic compounds. 1 Samples for these parameters were forwarded to MWH Laboratories for analysis. 2 SOCs were performed monthly. All other parameters were monitored weekly.
4.3 Ground Water Testing (Phase 2)
Based on the RO recovery rates recommended by PWT, a series of RO projections were made using the ROSA modeling program (Dow Chemical Company, Version 6.0). The modeling results are presented in Appendix D, “RO Model Projections – Phase 2,” and summarized in table 4.11.
4.3.1 Scale Inhibitor Selection Similar to Phase 1, the antiscalant used for Phase 2 was a dendrimer-based antiscalant supplied by PWT. PWT also predetermined the antiscalant dosages.
4.3.2 Membrane Selection The FILMTEC™ low-pressure membranes used during Phase 1 were chemically cleaned and reused during Phase 2 (i.e., FILMTEC™ membranes BW30LE-4040 in RO Stages 1 and 2, and FILMTEC™ membranes LP2540 in Stage 3). Table 4.3, presented earlier, provides a summary of those membrane elements.

31
Table 4.11 RO Operating Conditions (Phase 2 – Brackish Ground Water) Parameter Value
RO array 7:7:5:5 Total number of elements 24 RO system recovery1 85% 90% 94% Scale inhibitor dose (mg/L)2 2.9 3.2 3.8 Raw water flow to RO system (gpm) 19.4 18.3 17.6 RO feed pressure (psi) 158 181 224 Permeate flow (gpm) 16.5 16.5 16.5 Concentrate recycle flow (gpm) 1.5 2.0 3.0 Average system flux (gfd) 14.0 14.0 14.0 Brine stream parameter 85% 90% 94% TDS (mg/L) 9,993 14,603 23,050 LSI 1.93 2.23 2.57 BaSO4 (% saturation) 1,855 2,816 4,835 CaF2 (% saturation) 1,651 5,278 21,640 SiO2 (% saturation) 151 229 385 HCO3 (mg/L) 1,611 2,333 3,614
1 RO system modeled using ROSA Version 6 (Dow Chemical Company). 2 SpectraGuard™ scale inhibitor dose and recommended RO recovery modeled using PROdose32 Version 2.13.74 (PWT, Inc.).
In order to improve the RO performance, a different RO array design was chosen for Phase 2. The Stage 3 feed water flow rate was increased by reducing the number of elements from six to five.
4.3.3 Equipment Setup The pilot site for Phase 2 remained at 1710 W. Dobbins Road in Phoenix (figure 4.1). The original proposal planned for testing ground water from an area west of downtown Phoenix, near the Gila River. However, extensive site development costs incurred during Phase 1 at the Western Canal made it advantageous to identify an alternative ground water source that could be pumped to the existing pilot site and eliminate the need to move the pilot equipment and develop a second site. An alternative well, owned by Salt River Project (SRP), was identified within a half mile (800 m) of the existing pilot site, which offered ground water of similar quality to that existing in the Gila River area.
SRP did not plan to use their well during the testing period; therefore, the project was responsible for the cost of pumping. To reduce electrical costs associated with continuous operation of SRP’s existing well and to prevent the wasting of excess water not used by the pilot, a small submersible pump was installed to replace the SRP pump.

32
As in Phase 1, the RO concentrate and permeate streams were combined and fed to a partially buried waste tank. A submersible pump then transferred the waste to the sewer.
4.3.4 Normal RO Operation Table 4.11 outlines the overall RO system operating conditions at each recovery rate for Phase 2 testing.
Appendix C includes detailed results of the RO model projections. Table 4.11 also presents a summary of the predicted concentrations of constituents in the brine stream when operating on the brackish ground water. Comparing these values with those predicted for Phase 1 (table 4.7), it can be seen that the Phase 2 brine TDS concentrations, as well as the LSI and CaF2 and SiO2 concentrations are higher. One difference is that the BaSO4 concentrations were predicted to be lower for Phase 2. Pump limitations on the RO pilot required the use of partial concentrate recycling to reach certain recovery rates. While sulfuric acid was used in Phase 1 to lower the feed water pH and increase the solubility of certain scaling salts, the use of acid did not seem to improve system recovery and was, therefore, not used during Phase 2.
4.3.5 Data Collection (Phase 2) Table 4.12 provides the water quality testing matrix showing the sampling frequency for parameters that were tested onsite. A list of the parameters and the frequency of laboratory testing is shown in table 4.13.
Table 4.12 Onsite Water Quality Testing (Phase 2 – Brackish Ground Water)
Raw Water RO Permeate RO
Concentrate Temperature ˚C 1 per day pH SU 1 per day 1 per day 1 per day SDI 3 per week1 Conductivity µS/cm 3 per week 3 per week 3 per week TDS mg/L 3 per week 3 per week 3 per week Turbidity NTU 3 per week Silica mg/L 3 per week1
Note: µS/cm = microsiemens per centimeter. 1 If raw water SDI and silica concentrations were stable, sampling frequency was reduced to once per week.

33
Table 4.13 Laboratory Analyses (Phase 2 - Brackish Ground Water) performed by City of Phoenix
Parameter Raw Water RO Permeate RO Byproduct Alkalinity (mg/L) 1 per week 1 per week 1 per week Ammonia (mg/L) 1 per week 1 per week Arsenic (mg/L) 1 per week 1 per week 1 per week Barium (mg/L) 1 per week 1 per week Boron (mg/L) 1 per week 1 per week Calcium (mg/L) 1 per week 1 per week Chloride (mg/L) 1 per week 1 per week DOC (mg/L) 1 per week 1 per week Fluoride (mg/L) 1 per week 1 per week Magnesium (mg/L) 1 per week 1 per week Nitrate (mg/L) 1 per month 1 per month 1 per month pH 1 per week 1 per week 1 per week Potassium (mg/L) 1 per week 1 per week Silica (mg/L) 1 per week 1 per week 1 per week SOCs 1 per week 1 per week 1 per week Sodium (mg/L) 1 per week 1 per week Strontium (mg/L) 1 per week 1 per week Sulfate (mg/L) 1 per week 1 per week TDS (mg/L) 1 per week 1 per week 1 per week TOC (mg/L) 1 per week 1 per week TSS (mg/L) 1 per week 1 per week TTHM (µg/L) 1 per week 1 per month 1 per month Turbidity (NTU) 1 per week 1 per week
Notes: µg/L = micrograms per liter. RO permeate metals sampling frequency reduced after results confirmed that removal was consistent with system recovery rate.
4.3.6 Membrane Autopsies At the end of the Phase 2, three elements were removed from the RO system and sent to the manufacturer for membrane testing. One element was a lead element in the third stage, and the other two elements were taken from the end of the third stage (tail elements). Standard performance tests were conducted on all the elements. A further test was carried out on one of the lead elements to determine whether the membrane could be cleaned by different cleaning solutions. A membrane autopsy was carried out on one of the tail-end elements, and an inductively coupled plasma emission spectroscopy (ICPES) was used to determine the nature of foulants/scalants on the membrane surface.

35
5. Test Results and Discussion 5.1 Surface Water Test Results (Phase 1)
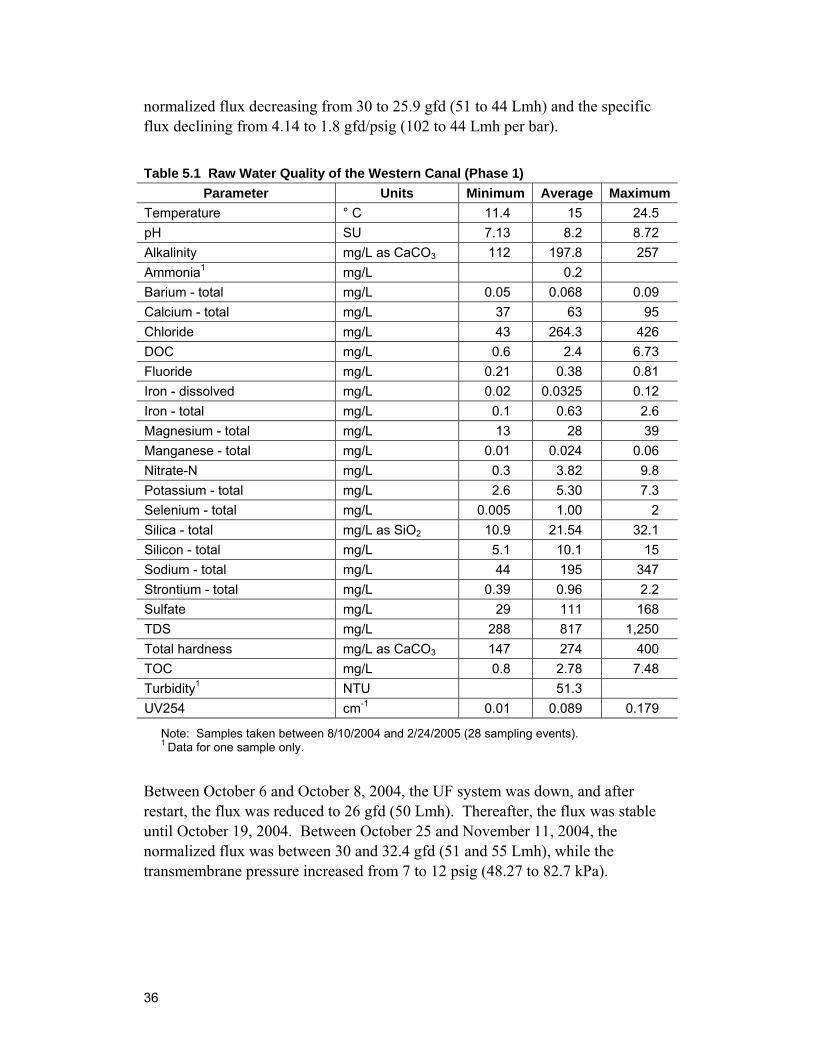
5.1.1 Feed Water Quality (Phase 1) The source water for Phase 1 testing was taken from the Western Canal. Selected constituents of that feed water with minimum, average, and maximum concentrations are presented in table 5.1. Appendix E presents a detailed table of all constituents that were analyzed. The raw water had relatively high concentrations of turbidity (around 50 NTU) and hardness (average around 270 mg/L as CaCO3). During the first 3 months of UF operation, the raw water turbidity was mostly between 3 and 10 NTU, with a median turbidity of 4 NTU. However, by the end of November 2004, the feed water turbidity had increased significantly, reaching a peak of 50 NTU, and then gradually decreased over the ensuing months, reaching a low of 4 NTU in the middle of February 2005. Figure 5.1 shows the turbidity and particle counts of the raw water for the duration of the testing.
5.1.2 Ultrafiltration System Performance The UF system performance was evaluated using data retrieved from the automatic data collection system and entries from the logbooks. The following performance indicators have been identified as the most critical ones to evaluate UF system performance:
• Transmembrane pressure (TMP) • Flux • Specific flux • Normalized flux • Feed and permeate water quality
Additionally, the backwash duration and frequency and the overall water recovery of the UF system were identified. Water quality is discussed later.
5.1.2.1 UF System Flux The purpose of the UF system was to provide an adequate flow of high-quality permeate to the RO unit by removal of turbidity and particulate matter. Figure 5.2 shows the hydraulic performance of the UF system throughout Phase 1 testing.
After startup, the UF system flux was set at 60 Lmh, and the system was operated at this condition for 30 days. After 30 days, the transmembrane pressure had increased from 6 to 16.5 psig (41.37 to 113.76 kilopascals [kPa]), resulting in the
36
normalized flux decreasing from 30 to 25.9 gfd (51 to 44 Lmh) and the specific flux declining from 4.14 to 1.8 gfd/psig (102 to 44 Lmh per bar).
Table 5.1 Raw Water Quality of the Western Canal (Phase 1) Parameter Units Minimum Average Maximum
Temperature ° C 11.4 15 24.5 pH SU 7.13 8.2 8.72 Alkalinity mg/L as CaCO3 112 197.8 257 Ammonia1 mg/L 0.2 Barium - total mg/L 0.05 0.068 0.09 Calcium - total mg/L 37 63 95 Chloride mg/L 43 264.3 426 DOC mg/L 0.6 2.4 6.73 Fluoride mg/L 0.21 0.38 0.81 Iron - dissolved mg/L 0.02 0.0325 0.12 Iron - total mg/L 0.1 0.63 2.6 Magnesium - total mg/L 13 28 39 Manganese - total mg/L 0.01 0.024 0.06 Nitrate-N mg/L 0.3 3.82 9.8 Potassium - total mg/L 2.6 5.30 7.3 Selenium - total mg/L 0.005 1.00 2 Silica - total mg/L as SiO2 10.9 21.54 32.1 Silicon - total mg/L 5.1 10.1 15 Sodium - total mg/L 44 195 347 Strontium - total mg/L 0.39 0.96 2.2 Sulfate mg/L 29 111 168 TDS mg/L 288 817 1,250 Total hardness mg/L as CaCO3 147 274 400 TOC mg/L 0.8 2.78 7.48 Turbidity1 NTU 51.3 UV254 cm-1 0.01 0.089 0.179
Note: Samples taken between 8/10/2004 and 2/24/2005 (28 sampling events). 1 Data for one sample only.
Between October 6 and October 8, 2004, the UF system was down, and after restart, the flux was reduced to 26 gfd (50 Lmh). Thereafter, the flux was stable until October 19, 2004. Between October 25 and November 11, 2004, the normalized flux was between 30 and 32.4 gfd (51 and 55 Lmh), while the transmembrane pressure increased from 7 to 12 psig (48.27 to 82.7 kPa).

37
Figu
re 5
.1 U
F Fe
ed W
ater
Qua
lity
Poly
mem
UF1
20S2
Pha
se 1
.

38
Figu
re 5
.2 U
F Fe
ed W
ater
Qua
lity
Poly
mem
UF1
20S2
Pha
se 1
.

39
During the next operating period between November 8 and December 3, 2004, the normalized flux rose between 30 and 37.7 gfd (50 and 64 Lmh), while the transmembrane pressure reached its first peak of 20 psig (137.9 kPa). The temperature was initially around 77 °F (25 °C) and, at this point, dropped to a minimum of 54 °F (12 °C).
From this point in time, the membrane system had to be cleaned more frequently to recover the flux. The membrane fibers had to be fixed every 4 days, which resulted in at least 1 or 2 days of downtime of the UF system. During every run, the normalized flux declined from 37.7 to 30 gfd (66 to 51 Lmh). The specific flux ranged between 1.4 and 3.7 gfd/psig (35 and 90 Lmh per bar). Finally, on January 11, 2005, the UF membrane module was replaced. With the new membrane, and after changing from NaOH CEBs to NaOCl CEBs, the flux was stable at 29.5 gfd (50 Lmh), and the specific flux ranged between 2.8 and 2.3 gfd/psig (70 and 57 Lmh per bar).
The recovery of membrane flux after chemical cleaning was measured based on permeability tests before and after the cleaning procedure. This procedure showed that a single cleaning, with both acid and caustic, was not as efficient as multiple clean in places (CIPs) with caustic alone. After February 9, 2005, the new NaOCl CEBs and the caustic cleaning enhanced and stabilized the flux of the UF system.
5.1.2.2 UF System Transmembrane Pressure Transmembrane pressure, the pressure across the membrane, is the driving force needed to produce the desired UF permeate flow rate. Therefore, the transmembrane pressure increases to maintain the desired permeate flow as the membrane loses permeability due to membrane fouling.
As an example, between October 25 and November 5, 2004, the normalized flux was between 30 and 32.4 gfd (51 and 55 Lmh), while the transmembrane pressure increased from 7 to 12 psig (48.3 to 82.74 kPa) as shown in figure 5.2. During the period November 8 to December 3, 2004, the transmembrane pressure reached its first peak of 20 psig (137.9 kPa). A transmembrane pressure of 20 psig (137.9 kPa) was determined as a set point when the UF membrane cleaning cycle was to be initiated. The earlier sections dealing with the UF cleaning requirements (sections 4.2.3.1 and 4.2.4.1.2) contain more detailed information about the cleaning cycles.
5.1.2.3 Permeate Water Quality and UF Membrane Integrity The turbidity of the UF permeate was consistently below 0.2 NTU; the median was 0.08 NTU, as shown in figure 5.3. Only during one episode on October 28, 2004, did the turbidity of the UF permeate increase to 3 NTU due to a membrane

40
failure. During this episode, the particle count (for particles greater than 2 μm) increased from 15 to 500 counts. The median particle count in the permeate water was 130 counts.
After the UF membrane replacement, particle counts of less than 5 were consistently measured in the UF permeate, and the median particle count was only 1.
The SDI for 15 minutes (SDI15) was measured up to three times per week. The variations of the SDI15 in the UF permeate were between 0.5 and 1.82, which could be attributed to UF fiber breakages rather than to seasonal variations in raw water quality. The average SDI15 over the period October 6, 2004, to February 15, 2005, was 1.03. Based on the SDI values of the RO feed water, RO membrane fouling was not expected to be a problem.
Table 5.2 shows a summary of selected water quality parameters in the UF permeate stream for the period September 23, 2004, to February 25, 2005. Appendix F includes a table showing all constituents that were measured during this period.
Table 5.2 UF Permeate Water Quality - Western Canal Water (Phase 1) Parameter Units Minimum Average Maximum
Temperature ˚C 9.4 15 27.5 Ph SU 7.13 8.2 8.72 Alkalinity mg/L as CaCO3 110 198.6 255 Total dissolved solids mg/L 882 1,095 1,260 TOC mg/L 0.7 2.4 6.23
Notes: Samples were taken between 8/10/2004 and 2/24/2005 (28 sampling events). Some of the parameters were analyzed only once.
5.1.2.4 UF Backwash Duration, Frequency, and Overall Recovery The initial water recovery was around 90 percent but decreased to around 85 percent when more frequent backwashing was necessary. After replacement of the membrane module, the recovery was 83 percent. The backwash duration was between 235 and 280 seconds. The total backwash volume produced was between 78 and 205 gal (295 and 776 L). Backwash time 1 was set for 30 seconds, with 150 seconds rest time; backwash time 2 for 5 seconds on and 5 seconds off; and backwash time 3 for 40 seconds on and air purge of 10 seconds. A CEB was performed with NaOH until February 9, 2005. Thereafter, a combination of NaOCl CEBs and caustic cleaning helped enhance and stabilize the flux of the UF system.

41
Figu
re 5
.3 U
F Pe
rmea
te W
ater
Qua
lity
Poly
mem
UF1
20S2
Pha
se 1
.

42
5.1.2.5 UF Membrane Cleaning Requirements As mentioned earlier, more frequent and extended cleaning cycles of the UF membranes were required to sustain the desired permeate production. When the cleaning routine was optimized, the cleaning frequency was 2 to 3 days. The longest period of time during which no chemical cleaning was performed was 1 month, which was mostly due to intermediate pilot plant shutdowns. Figure 5.4 shows the cleaning frequencies and the effects on UF hydraulic performance.
Table 5.3 shows the cleaning requirements for the UF membranes. The efficiency of the cleaning procedures was determined by the decrease in transmembrane pressure.
Table 5.3 UF Membrane Cleaning Requirements - Western Canal Water (Phase 1)
Parameter Unit Value NaOH dose mg/L 7,500 NaOH pump capacity gph 11.98 Loop volume gal 70 Dosing time minutes 10 NaOH strength (set point) lb/gal 2.2 Chlorine strength lb/gal 0.55 Chlorine dosing rate gph 1.23 Dosing time minutes 10 Target chlorine strength mg/L 200 NaOH cleaning backwash seconds 30 NaOH cleaning recirculation seconds 3,600 NaOCl cleaning backwash seconds 35 NaOCl cleaning recirculation seconds 300 Before Cleaning Measurements:
Flux Lmh at 20 ˚C 62.15 TMP psi 11.5
Permeability Lmh per bar 78.4
After Cleaning Measurements:
Flux Lmh at 20 ˚C 62.15
TMP Psi 9.5 Permeability Lmh per bar 94.9
The relatively high hardness of the water used for the UF CIP resulted in a gray inorganic substance, which accumulated on the permeate side of the membrane as shown in figure 5.5. Softening of the make-up water for the cleaning solutions is recommended in the future because of the high calcium hardness in the Western Canal.

43
Figu
re 5
.4 U
F Pe
rmea
te C
lean
ing
and
Hyd
raul
ic P
erfo
rman
ce P
hase
1.

44
The cleaning requirements have been modified based on experience gained during the testing period. As shown in figure 5.4, a single cleaning with both acid and caustic solutions was not as efficient as multiple CIPs with caustic solution alone. Therefore, it is recommended that multiple CIPs be done within a short period of time using both acid and caustic cleaners.
5.1.3 Reverse Osmosis System Performance 5.1.3.1 Feed Water Quality The feed water to the RO unit was the permeate from the UF system. The concentration of TDS is the parameter that determines the feed pressure and energy requirements of a RO system. The TDS concentration of the Western Canal water ranged between 300 and 1,290 mg/L; the average was 767 mg/L, as shown in table 5.4. The low calcium and magnesium concentrations and relatively low sulfate levels allowed for a relatively high water recovery in the RO system as indicated by the RO modeling results (Appendix B). Two other parameters that affect RO system performance are turbidity and SDI, which, after UF treatment, had readings below 0.2 NTU and 1.03 on average, respectively.
Figure 5.5 Close-Up of Silt and Mud Build-Up on UF Membrane Phase 1.

45
Table 5.4 RO Feed Water Quality – UF-Treated Surface Water (Phase 1) Parameter Units Minimum Maximum Average1
Alkalinity mg/L as CaCO3 61 196 130 Ammonia2 mg/L 0.2 Arsenic – total μg/L 3.1 7.2 4.8 Barium – total mg/L 0.04 0.08 0.06 Boron – total mg/L 0.1 0.7 0.4 Calcium – total mg/L 35 87 57 Chloride mg/L 43 419 227 Fluoride mg/L 0.29 0.79 0.43 Iron – total mg/L 0.1 0.3 0.2 Magnesium – total mg/L 13 36 26 Manganese – total mg/L 0.01 0.03 0.02 Nitrate-N mg/L 0.3 9.8 3.6 Nitrite-N2 mg/L 0.1 Potassium – total mg/L 2.1 6.1 4.6 Selenium – total2 mg/L 0.025 Selenium – total2 µg/L 5 Silica2 mg/L as SiO2 13.7 Silica – total mg/L as SiO2 6.8 24.6 16.9 Silicon – total mg/L 3.2 11.5 7.8 Sodium – total mg/L 43 342 180 Strontium – total mg/L 0.38 1.4 0.74 Sulfate mg/L 32 285 156 TDS mg/L 300 1290 767 Total hardness mg/L as CaCO3 142 368 248 Turbidity NTU 0.15 0.3 0.19 Note: Samples taken between 9/12/2004 and 2/24/2005 1 Average of 17 sampling events. 2 Data for one sample only.
5.1.3.2 RO Hydraulic Performance The performance of the RO system is influenced by feed water composition, temperature, and operating factors such as pressure and system recovery. In order to distinguish between variations over time in these feed and operating characteristics versus any performance changes due to fouling or scaling problems, the measured permeate flow and salt passage have to be normalized. Normalization allows a comparison of the actual performance to a given reference performance, while the influences of operating parameters are taken into account. The reference performance may be the designed performance or the measured initial performance. For this study, the first effective day of pilot operation was used as the reference point.

46
5.1.3.2.1 RO Performance Equations Two parameters used to evaluate RO system performance are normalized permeate flow (NPF) and normalized salt passage (NSP). NPF is the permeate flow normalized for feed concentration, temperature, and applied transmembrane pressure. NSP is the salt passage normalized for feed concentration, transmembrane pressure, and the feed-brine salt concentration. The salt passage can also be expressed as a percent rejection; thus, normalized salt rejection (NSR) would be equal to 100 percent minus NSP. The respective equations are as follows:
Normalized Permeate Flow:
where: NPFt = normalized permeate flow at time t (gpm)
NDPi = net driving pressure at initial conditions of operation (psi)
NDPt = net driving pressure calculated at time t (psi)
TCFi = temperature correction factor based on temperature at initial conditions of operation
TCFt = temperature correction factor based on temperature at time t
Qp = permeate flow (gpm)
Normalized Salt Passage:
where: NSPt = Normalized Salt Passage at time t (%)
NDPi = Net Driving Pressure at initial conditions of operation (psi)
NDPt = Net Driving Pressure calculated at time t (psi)
Cfbi = Feed-brine salt concentration at initial conditions of operation (mg/L) (defined below)
Cfbt = Feed-brine salt concentration at time t (mg/L) (defined below)
Cfi = Feed salt concentration at initial conditions of operation (mg/L)
Cft = Feed salt concentration at time t (mg/L)
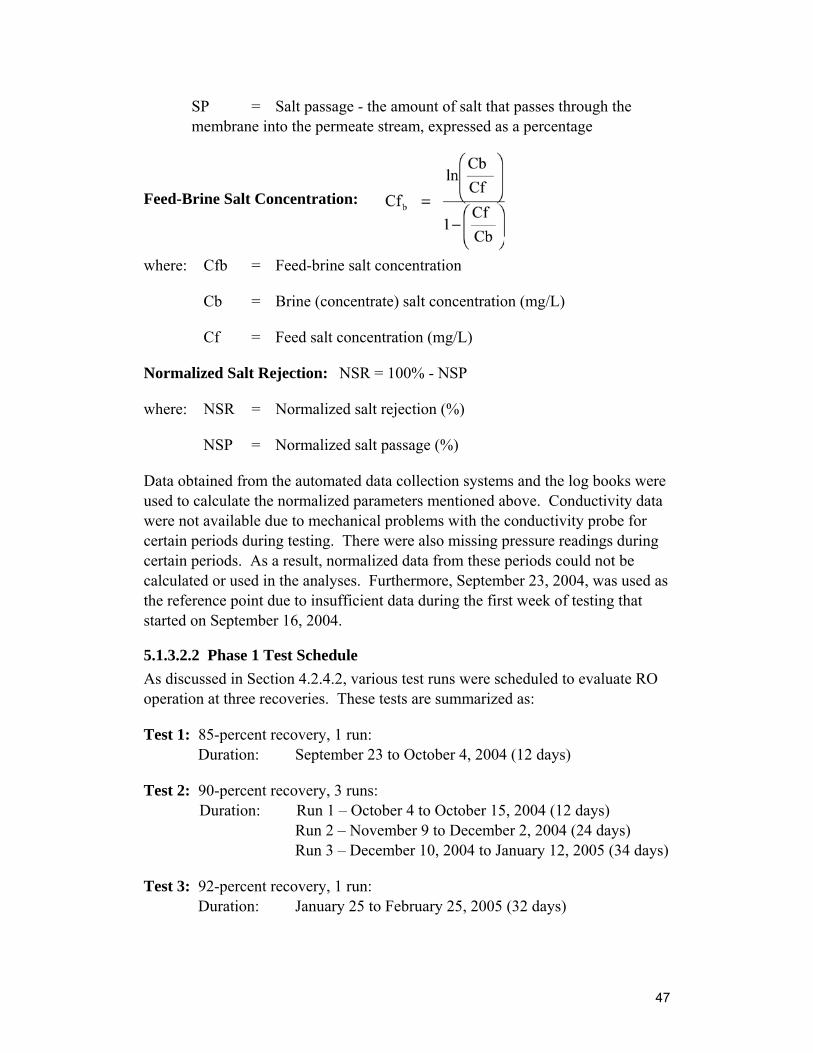
47
SP = Salt passage - the amount of salt that passes through the membrane into the permeate stream, expressed as a percentage
Feed-Brine Salt Concentration:
where: Cfb = Feed-brine salt concentration
Cb = Brine (concentrate) salt concentration (mg/L)
Cf = Feed salt concentration (mg/L)
Normalized Salt Rejection: NSR = 100% - NSP
where: NSR = Normalized salt rejection (%)
NSP = Normalized salt passage (%)
Data obtained from the automated data collection systems and the log books were used to calculate the normalized parameters mentioned above. Conductivity data were not available due to mechanical problems with the conductivity probe for certain periods during testing. There were also missing pressure readings during certain periods. As a result, normalized data from these periods could not be calculated or used in the analyses. Furthermore, September 23, 2004, was used as the reference point due to insufficient data during the first week of testing that started on September 16, 2004.
5.1.3.2.2 Phase 1 Test Schedule As discussed in Section 4.2.4.2, various test runs were scheduled to evaluate RO operation at three recoveries. These tests are summarized as:
Test 1: 85-percent recovery, 1 run: Duration: September 23 to October 4, 2004 (12 days)
Test 2: 90-percent recovery, 3 runs: Duration: Run 1 – October 4 to October 15, 2004 (12 days) Run 2 – November 9 to December 2, 2004 (24 days) Run 3 – December 10, 2004 to January 12, 2005 (34 days)
Test 3: 92-percent recovery, 1 run: Duration: January 25 to February 25, 2005 (32 days)

48
Heavy rain began in early January 2005, which reduced the TDS of the water in the Western Canal significantly. As a result, the TDS levels during the third run of test 2 (at 90-percent recovery) and all of test 3 were lower than they were for the earlier runs. The decrease was more than 50 percent, from an average TDS level of 1,200 mg/L to about 500 mg/L. Consequently, although the results from these test runs are shown in the plots presented below, they are not included in the evaluation of the RO performance.
5.1.3.2.3 Normalized Permeate Flow Figure 5.6 shows the NPF plots for the five tests. The 85-percent recovery test had the highest overall NPF, ranging from 14 to 16 gpm (0.88 to 1 liter per second (L/s). The NPF of the first run at 90-percent recovery ranged from 13 to 15 gpm (0.82 to 0.95 L/s), but there appeared to be a downward trend in the NPF. The rest of the runs ranged from 11 to 13 gpm (0.69 to 0.82 L/s), also with downward trends.
Overall, the system NPF for the 85-percent recovery test was relatively stable, with an average of 3-percent change in product flow over the duration of the test (12 days). The RO system was relatively stable at 85-percent recovery. The average system flux for this test run was 14 gfd (23.8 Lmh), similar to the target flux for the pilot test.
Higher degrees of NPF decline were observed for the rest of the test runs. As shown in figure 5.6, there was a gradual decline in the NPF in the RO system during the 3 months of testing at 90-percent recovery. The NPF decreased 13 percent during test 1 (12 days) and an additional 13 percent during test 3 (32 days). This gradual decline in NPF indicates that fouling or scaling of the membranes was occurring. More importantly, the system was chemically cleaned between each test run but was not able to return to the NPF at the beginning of the first run. This can be clearly seen in figure 5.6.
The first cleaning was carried out at the conclusion of the 85-percent recovery test run after 12 days of operation. The NPF at the start of the first run at 90-percent recovery was similar to that at the conclusion of the 85-percent recovery test run; it did not return to the NPF that existed at the beginning of the 85-percent test run. Furthermore, the NPF started to gradually decline soon after the operation at 90-percent recovery. The plant was operated for only 12 days before the second cleaning was carried out. The plant was restarted after the second cleaning at 90-percent recovery (Run No. 2), although the NPF at the start of the operation was a little bit higher than the NPF at the conclusion of the first 90-percent test run, it clearly was not restored to the NPF level at the beginning of the first test run at 90-percent recovery. After operation for 24 days, a third chemical cleaning was carried out, and again the system was operating at a lower NPF level than the

49
Figu
re 5
.6 W
este
rn C
anal
RO
Nor
mal
ized
Per
mea
te F
low
Pha
se 1
.
50
beginning of the previous test run. This phenomenon indicates long-term fouling/scaling in the system. It also indicates that 90-percent recovery does not appear to be a feasible operating condition for the RO system on this feed water with the antiscalant used. Further, the results show that the cleaning method was not effective for this feed water.
As discussed earlier, since the heavy rains resulted in a decreased feed TDS, the results after early January 2006 are not pertinent to the current analysis. It is, however, observed that as expected, the much lower feed TDS results in a reduced decline in NPF at 92-percent recovery (compared to the test runs at 90-percent recovery and “normal” feed TDS). Nevertheless, a gradual decline in NPF is still clearly present, indicating continued membrane fouling despite the lower TDS. This may indicate organic, rather than inorganic, membrane fouling during this run. Figure 5.7 shows the permeate fluxes across each stage, and it shows a similar trend to the NPF plots. The flux was relatively stable at 85-percent recovery but declines gradually for the 90-percent recovery tests.
5.1.3.2.4 Net Driving Pressure The net driving pressure (NDP) measures the transmembrane pressure (the pressure available to drive water through the membrane). Significant or nonreversible increases (following chemical cleaning) in this parameter would indicate fouling or scaling on the membrane surface. Figure 5.8 shows the NDP of the different stages during Phase 1 testing. Looking at the NDP for the 85-percent recovery, the NDP curves of all three stages were relatively stable, indicating stable performance.
However, there were apparent increases in the NDP for all of the 90-percent test runs. These increases further support the occurrence of fouling/scaling in the RO system. Furthermore, the increases seem to be more prominent in the second and third stages of the RO train. This would indicate that it is likely that scaling is causing the drop in system permeate flow, and not fouling, as fouling tends to affect the performance at the first stage. Figure 5.9 shows the NDP for all test runs plotted on the same graph as the NPF. As shown, the NPF decreases as the NDP increases.
Results of the 92-percent recovery test run are also shown in figure 5.8. At the start of the run, the greatest increase in NDP was occurring in the third stage of the RO train, as before. The decrease in TDS appeared to stabilize the NDP, but there was no significant reduction in NDP, indicating that the scaling remained in place.

51
Figu
re 5
.7 W
este
rn C
anal
RO
Flu
x B
alan
ce P
hase
1.
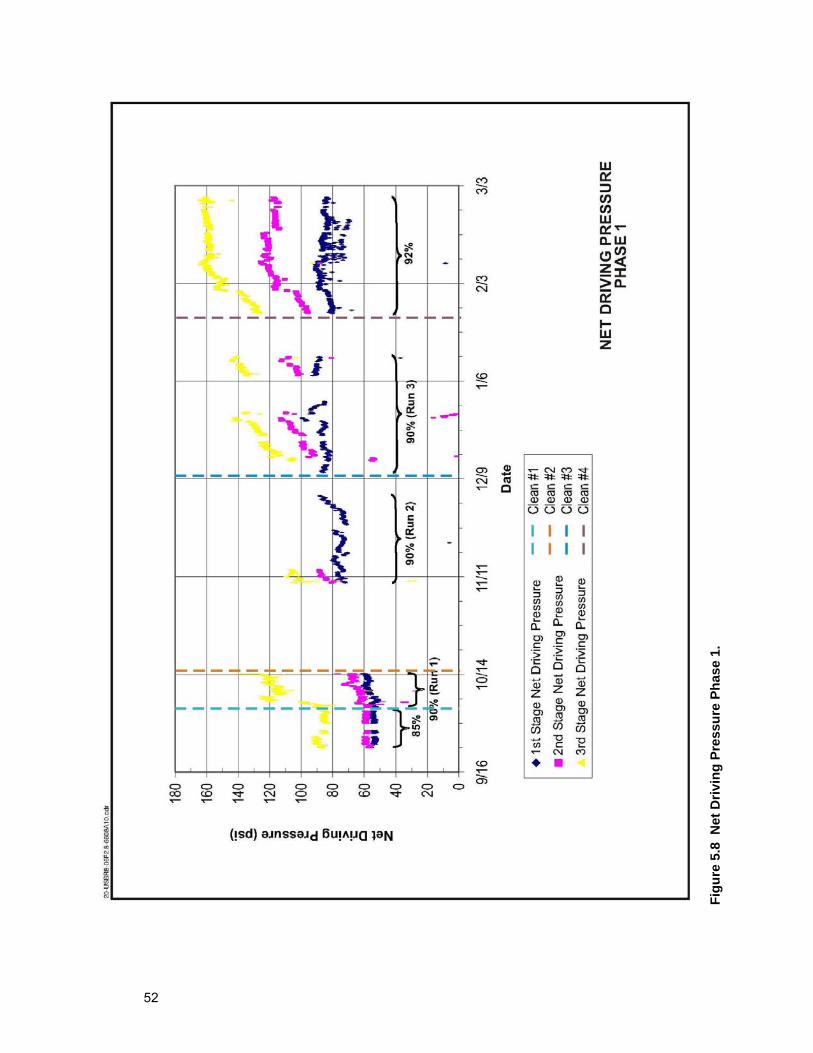
52
Figu
re 5
.8 N
et D
rivin
g Pr
essu
re P
hase
1.

53
Figu
re 5
.9 W
este
rn C
anal
RO
ND
P an
d N
PF P
hase
1.

54
5.1.3.3 Water Quality 5.1.3.3.1 Normalized Salt Rejection Normalized salt rejection helps to evaluate changes in the passage of salt through the membrane, caused by membrane fouling and scaling, or changes in the permeability of the membrane itself, from exposure to feed water constituents. As shown on the NSR plot in figure 5.10, the NSR ranges between 95 and 99 percent. The NSR was relatively stable for the 85-percent recovery test run, ranging from 96 to 97 percent for Stage 1, 97 to 98 percent for Stage 2, and at 99 percent for Stage 3 over the duration of the run.
A similar trend can be seen for the first test run at 90-percent recovery. No conclusion can be drawn from the second test run at 90-percent recovery because only 4 days of effluent data were available for the analysis. However, there was some apparent decline in the NSR over the duration of the third test run at 90-percent recovery. This is consistent with the decline in NPF for the same period because as the permeate flow declines, the permeate TDS increases due to the more constant salt leakage across the membrane, lowering the overall salt rejection. Figure 5.10 also shows the NSR of the 92-percent recovery test run.
5.1.3.3.2 Permeate Water Quality Table 5.5 shows the blended permeate water TDS (blended from the permeate of the three membrane stages). The average blended TDS level during the 85-percent recovery test was 65 mg/L, while the average TDS levels during the 90-percent test runs ranged from 49 to 68 mg/L. Lime addition to the permeate or filtration through CaCO3 filters will be needed in a full-scale application in order to stabilize the water before distribution.
Table 5.5 RO Permeate Water Quality - Surface Water (Phase 1) Parameter Units Minimum Maximum Average
Alkalinity mg/L as CaCO3 20 20 20 TDS mg/L 10 72 35.3 TOC mg/L 0.2 0.7 0.4 Turbidity NTU 0.1 0.1 0.1 Notes: Samples taken between 9/12/2004 and 2/24/2005 (17 sampling events).
5.1.3.3.3 Concentrate Water Quality The TDS of the RO concentrate, as shown in table 5.6, ranged between 6,500 and 9,800 mg/L. The average TDS level of the concentrate during the 85-percent recovery test was approximately 6,100 mg/L, while the average TDS during the 90-percent recovery test runs ranged from 7,300 to 8,200 mg/L. These values are somewhat lower than those predicted by the RO modeling software, presented earlier.

55
Figu
re 5
.10
Nor
mal
ized
Sal
t Rej
ectio
n Ph
ase
1.

56
Table 5.6 RO Concentrate Water Quality - Surface Water (Phase 1) Parameter Units Minimum Maximum Average Alkalinity mg/L as CaCO3 20 1,590 935 Arsenic - total μg/L 17 57 22.5 TDS mg/L 6,540 9,840 7,901 Turbidity NTU 1.2 1.3 1.25 Note: Samples taken between 9/12/2004 and 2/24/2005 (17 sampling events).
5.1.4 Cleaning Requirements In a typical RO operation, chemical cleaning of the membranes is performed on a monthly basis. The 85-percent recovery test was conducted over a duration of 12 days, and although the performance was relatively stable, the exact cleaning frequency cannot be determined due to the limited data and duration of the test.
The 90-percent test runs indicate that cleaning more frequently than once per month will be required. Furthermore, the cleaning in the 90-percent recovery runs did not restore the membranes to the initial performance. This would indicate that more frequent cleaning is required. Based on this result, a 90-percent recovery might not be operationally feasible for this water quality.
5.1.5 Summary of Phase 1 Testing Results In terms of the UF pretreatment performance, the results clearly show the advantage of a membrane separation step upstream of the RO when treating surface water. The raw feed water turbidity to the UF plant varied significantly over the course of Phase 1, but the UF membrane was able to produce a consistently low turbidity feed water for the RO system with a correspondingly low SDI value. In addition, the UF membrane was able to reduce the iron concentration in the feed water to the RO system.
The results show that the RO system was relatively stable operating at 85-percent recovery; however, the test period was relatively short (less than 2 weeks). The water quality data presented earlier, together with the modeling results, showed that even at 85-percent recovery, the system would have to deal with potential scale formation from CaCO3, BaSO4, CaF2 and silica. It is not possible to conclude if the system would maintain stable performance if it were operated for a longer period.
The results also suggest that operating the RO system at 90-percent recovery or higher is not feasible with this water under the operating conditions and with the antiscalant used in the tests. The NPF declined more than 10 percent after running for only 30 days or less. The decline in the NPF is attributed to possible scaling in the system.

57
5.2 Ground Water Test Results (Phase 2)
5.2.1 Feed Water Quality The feed water for Phase 2 RO testing came from ground water in an area west of downtown Phoenix, near the Gila River. Table 5.7 shows water quality data from two samples taken by the SRP in 2003 and 2004. Table 5.8 shows the water quality measured during this study. As shown, the calcium and magnesium concentrations are relatively low compared to the Phase 1 feed water, resulting in a significantly lower total hardness of the water; average of 115 mg/L as CaCO3 for Phase 2 compared with 248 mg/L as CaCO3 for Phase 1. The water is brackish in quality with a TDS level in the range of 1,300 to 2,300 mg/L. The water also contains iron (0.24 mg/L), and the silica concentration is greater than that found in the Western Canal (Phase 1): 25 mg/L for the well water compared with about 14 mg/L for the Western Canal. The sulfate concentration in the well water is approximately double the concentration in the Western Canal water.
Table 5.7 Raw Water Quality of Well Utilized for Study (Phase 2) Parameter Units 4/22/03 9/28/04
Alkalinity mg/L as CaCO3 215 212 Aluminum mg/L <0.050 <0.050 Ammonia mg/L ND ND Arsenic mg/L 0.012 0.012 Barium mg/L 0.066 0.059 Bicarbonate mg/L 262 259 Boron mg/L 0.625 0.561 Bromide mg/L 0.40 0.37 Calcium mg/L 47.8 46.3 Carbonate mg/L < 1 < 1 Chloride mg/L 525 434 Fluoride mg/L 0.99 0.95 Iron mg/L < 0.010 < 0.010 Magnesium mg/L 20.6 20.6 Manganese mg/L < 0.010 < 0.010 Nitrate mg/L as NO3 99.9 64.8 Noncarbonate hardness mg/L as CaCO3 0 0 Potassium mg/L 3.1 3.5 pH SU 7.7 7.6 Silica mg/L as SiO2 30.1 26.7 SDI mg/L ND ND Sodium mg/L 406 411 Strontium mg/L ND ND Sulfate mg/L 144 157

58
Table 5.7 Raw Water Quality of Well Utilized for Study (Phase 2) (continued) Parameter Units 4/22/03 9/28/04
TDS mg/L 1,380 1,270 Temperature ˚C 23.9 24.6 Total hardness mg/L as CaCO3 204 201 Turbidity NTU ND ND UV254 m-1 ND ND Zinc mg/L < 0.010 < 0.010
Table 5.8 Water Quality of Ground Water near Gila River (Phase 2)
Parameter Unit Minimum Maximum Average1 Alkalinity mg/L as CaCO3 20 371 238
Arsenic - total mg/L 0.0147 0.0177 0.016 Barium - total mg/L 0.06 0.08 0.06 Calcium - total mg/L 24 31 26 Chloride mg/L 466 882 557 Dissolved organic carbon mg/L 0.34 1.1 0.59 Fluoride mg/L 1.6 2.8 1.9 Hardness - total mg/L as CaCO3 102 136 115 Iron - total mg/L 0.1 0.6 0.2 Magnesium - total mg/L 10 14 12 Manganese - total mg/L 0.01 0.05 0.02 Nitrate-N mg/L 13.5 26.4 17.5 Potassium - total mg/L 3.1 8 4.8 Silica mg/L as SiO2 23.8 28.7 25.0 Silicon - total mg/L 11.1 13.4 11.7 Sodium - total mg/L 357 488 432 Strontium - total mg/L 0.38 0.98 0.6 Sulfate mg/L 165 313 198 TDS mg/L 1,310 2,310 1,527 TOC mg/L 0.35 1.47 0.66 Turbidity NTU 0.1 0.1 0.1 Note: Samples taken between 7/18/2005 and 1/4/2006. 1 Average of 17 sampling events.
5.2.2 Hydraulic Performance (Phase 2) Note that the RO membranes used in Phase 2 were the same membranes used in Phase 1. The membranes were chemically cleaned at the end of Phase 1, and the number of elements in the third stage was reduced to increase the flow rate. Also, there was no pretreatment of the ground water by UF; the ground water was fed directly to the RO unit.

59
5.2.2.1 Performance Equations The performance of the RO pilot system will again be compared by using normalized permeate flow and salt passage data. See Section 5.1.3.2.1 for the corresponding equations. Normalization allows a comparison of the actual performance to a given reference performance while the influences of operating parameters are taken into account. Data obtained from the automated data collector and from the daily manual data recording were used to calculate the normalized parameters mentioned before. For this study, the first effective day of pilot operation was used as the reference point.
5.2.2.2 Test Runs During Phase 2 testing, the RO pilot system was operated at three recoveries to evaluate its performance using the ground water described above. These tests are summarized as:
Test 1: 80-percent recovery, 1 run: Duration: July 18 to July 28, 2005 (11 days)
Test 2: 85-percent recovery, 1 run: Duration: July 29 to August 25, 2005 (27 days)
Test 3: 90-percent recovery, 3 runs: Duration: Run 1 – August 17 to October 6, 2005 (40 days) Run 2 – October 14 to November 5, 2005 (22 days) Run 3 – December 15, 2005 to January 6, 2006 (23 days)
No tests were conducted above 90-percent recovery during Phase 2 testing. The TDS of the feed water remained relatively constant at around 1,300 mg/L, except that it was higher towards the end of the third run at 90-percent recovery, when it averaged 2,200 mg/L.
These data also show that during the operation of the RO system at a recovery of 90 percent, the measured permeate pressures were 80 psig (3.83 kPa) in Stage 1 and 130 psig in Stage 2. The projected permeate back pressures used during the RO modeling were only 60 and 65 psig (414 and 448 kPa), respectively.
The discrepancy between projected and achieved maximum RO water recovery was evaluated by rerunning the RO model with the actual pressure data measured during the pilot testing and using the updated water quality data. Based on the new RO model results, the higher permeate back pressure would result in a flux of 13.5 gfd (22.9 Lmh) in Stage 1, 11.3 gfd (19.2 Lmh) in Stage 2, and 18.7 gfd (31.7 Lmh) in Stage 3.
60
The higher permeate back pressure in Stage 2 resulted in a lower permeate production in Stage 2 and, therefore, a lower overall system recovery. At the same time, the feed flow rate to the first element in Stage 3 and the permeate flow rates in Stage 3 were exceeded. The hydraulic imbalance could have resulted in excessive feed flow rates to Stage 3, higher flux in Stage 3, and, therefore, higher potential for fouling. By comparing the permeate quality of each stage, it could be determined if any membrane damage had occurred.
5.2.2.3 Normalized Permeate Flow Figure 5.11 presents the NPF over the entire operating period of approximately 170 days (although there was a period of about 40 days starting in November 2005 when the system was offline).
The test run at 80-percent recovery was operated for 11 days, and the NPF was stable. The 85-percent recovery test run had the highest average system NPF: 18.5 gpm (1.17 L/s). As shown in figure 5.11, NPF was relatively stable throughout the 27-day test period, with virtually no decline in flow when the system was operating at 80 and 85-percent recovery. As shown in figure 5.11, the Stage 1 NPF was stable between 12 and 14 gpm (0.76 and 0.88 L/s), Stage 2 was stable around 4 gpm (0.25 L/s), and Stage 3 was stable around 1 gpm (0.06 L/s). These numbers should be compared with the values at which the membranes were operating at the end of Phase 1, namely: Stage 1 around 7.5 gpm (0.47 L/s), Stage 2 around 3 gpm (0.19 L/s), and Stage 3 around 1 gpm (0.06 L/s). There was a significant improvement in performance of Stage 1. Stages 2 and 3 performed about the same as before, but they certainly did not show a decline in performance with time during this period. During the first run at 90-percent recovery (Run 2), the NPF continued to be stable with no evidence of a decline in NPF.
The average system NPF of the first test run at 90-percent recovery was 17.9 gpm (1.13 L/s). This declined to 16.5 gpm (1.04 L/s) during the second run at 90-percent recovery and appears to have been due to a decline in NPF in the third stage. The average system NPF of the third test run at 90-percent recovery was 16.2 gpm (1.02 L/s); in this case, there does appear to be a gradual decline in the NPF with time in Stage 1.
Figure 5.11 also indicates when chemical cleaning of the membranes was carried out. A total of five cleans were required. The first cleaning was carried out at the conclusion of the run at 80 and 85-percent recovery, after almost 40 days of operation. The system was restarted at a recovery of 90 percent and operated for just over 40 days before the second membrane cleaning was carried out. The system was restarted after the second cleaning at a recovery of 90 percent once again (Run 2), and a slight drop in NPF can be seen between the conclusion of

61
Figu
re 5
.11
Nor
mal
ized
Per
mea
te F
low
(NPF
) Pha
se 2
.

62
Run 1 and the start of Run 2. A similar drop in NPF also occurred between the conclusion of the 85-percent recovery run and the start of the first 90-percent recovery run. After about 20 days of Run 2 at 90-percent recovery, the membranes were cleaned a third time, and then twice more within the following 10 days, and a decline in the NPF in the third stage is evident. The third 90-percent recovery run was more sporadic than the first two (between 150 and 170 days of operating time).
5.2.2.4 Net Driving Pressure As stated earlier, the NDP measures the transmembrane pressure (the pressure available to drive water through the membrane). Any significant increase in this parameter would indicate fouling or scaling on the membrane surface. Figure 5.12 shows the NDP of the different stages during Phase 2 testing. As shown in the figure, the NDP curves of all three stages at the 85-percent recovery were relatively stable.
The NDP for all three stages of the first run at 90-percent recovery appeared to be relatively stable, except towards the end of the test. The NDP in the third stage increased from an average of 100 psi (689 kPa) to 130 psi (896 kPa) by the end of the test run. The third stage NDP for the two remaining test runs continued to increase and reached over 200 psi by the end of Run 3. This is consistent with the observations of the NPF in the third stage mentioned above. An increase in NDP in the third stage indicates scaling, particularly as the increases were first observed in the third stage of membranes. The cause(s) of the drastic increase in NDP may be due to excessive permeate back pressure, which was applied at the second stage, causing an imbalance in flux across the three stages. The recommended permeate pressure by the manufacturer is 90 psi (621 kPa), while 130 psi (896 kPa) was accidentally applied periodically during Run 3.
5.2.3 Water Quality 5.2.3.1 Normalized Salt Rejection As shown in figure 5.13, the NSR in Phase 2 testing ranges between 94 and 99 percent. The NSR was relatively stable for the 85-percent recovery test, ranging from 97 to 98 percent for Stage 1, 98 percent for Stage 2, and 97 to 99 percent for Stage 3, over the duration of the run.
The NSR plot seems to have similar trends to the NPF plot for the 90-percent test runs. Run 1 appeared to be relatively stable until September 15, 2005, when the system went down for about 4 days. Then, there was a drastic change in the third stage NSR. First, it increased for about 1 week, and then it decreased. Run 2 continued on October 14, and there was a decrease in the NSR in the first and third stages. There was no permeate TDS data available to determine the NSR for Run 3.
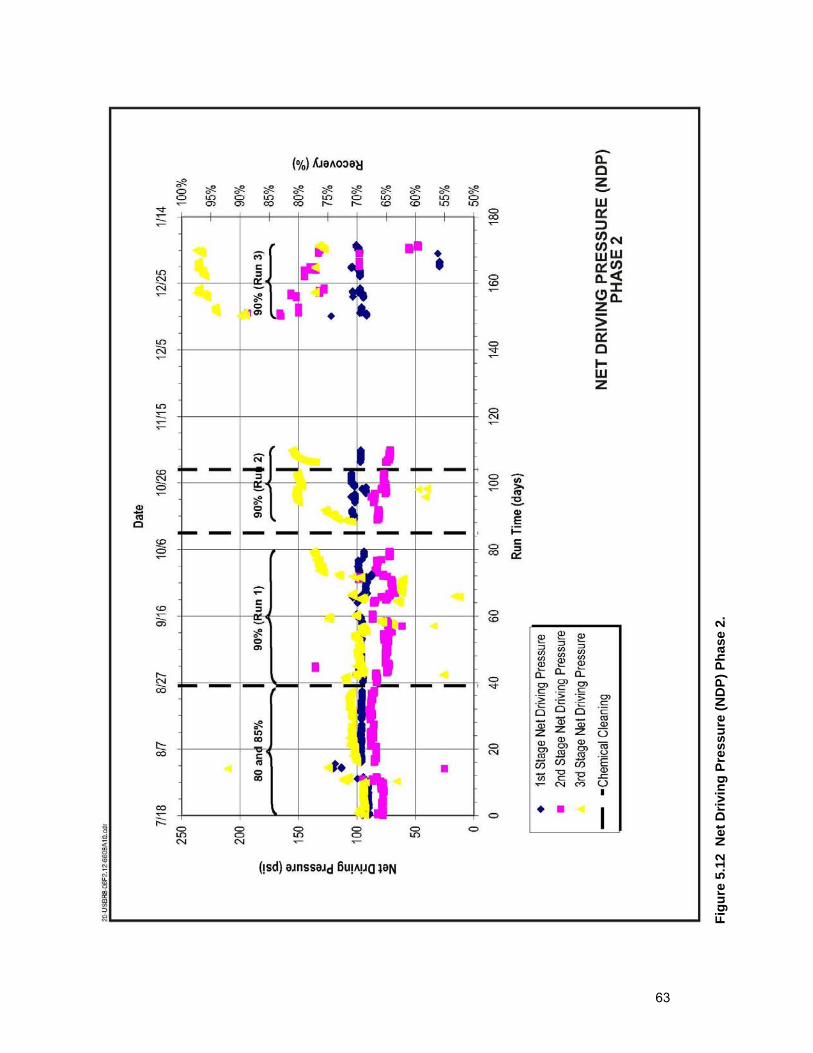
63
Figu
re 5
.12
Net
Driv
ing
Pres
sure
(ND
P) P
hase
2.

64
Figu
re 5
.13
Nor
mal
ized
Sal
t Rej
ectio
n (N
SR) P
hase
2.

65
The NSR plot seems to have similar trends to the NPF plot for the 90-percent test runs. Run 1 appeared to be relatively stable until September 15, 2005, when the system went down for about 4 days. Then, there was a drastic change in the third stage NSR. First, it increased for about a week, and then it decreased. Run 2 continued on October 14, and there was a decrease in the NSR in the first and third stages. There was no permeate TDS data available to determine the NSR for Run 3. The decline in NSR observed in Stage 3 is consistent with the decline in NPF observed over the same period. It would appear that some scale or foulant on the surface was blocking the permeate passage.
The NSR data indicates that membrane scaling/fouling (likely scaling) began in the third stage during Run 2 at 90-percent recovery. The data for the NPF and NDP indicate a change between the end of Run 2 and the start of Run 3. This may have been a result of the system being off-line for about 40 days.
5.2.3.2 Permeate Water Quality The average TDS of the blended permeate water ranged from 66 to 89 mg/L (figure 5.14). The blended TDS level during the 85-percent recovery test was the lowest, averaging 66 mg/L; while the average TDS levels during the 90-percent test runs averaged between 77 and 89 mg/L.
5.2.3.3 Concentrate Water Quality The TDS of the concentrate averaged between 6,800 and 9,000 mg/L. The average TDS level of the concentrate during the 85-percent recovery test was approximately 6,800 mg/L, while the average TDS levels during the 90-percent recovery test runs ranged from 7,900 to 8,600 mg/L.
5.2.3.4 Cleaning Requirement The performance was relatively stable during the 40 days of testing at 85 percent. Based on the performance and the typical RO operation, monthly chemical cleaning of the membranes may be adequate with this water.
The duration of the first run at 90-percent recovery was about 40 days. The NPF of this test was relatively stable as mentioned earlier; however, at around 20 days of operation, the NDP of the second and third stages started to destabilize. This would indicate more frequent cleaning is required. However, no conclusion can be made because the deterioration of performance might be caused, in part, by damage to the membrane resulting from excessive back pressure that was accidentally applied occasionally.

66
Figu
re 5
.14
Per
mea
te T
otal
Dis
solv
ed S
olid
s (T
DS)
Pha
se 2
.

67
5.2.3.5 Summary for Phase 2 The initial modeling of RO performance was carried out at 85, 90, and 94-percent recovery. Based on the test data, it was not possible to operate the system above 85-percent recovery. Three test runs were performed at 90 percent, but only the first two runs produced reasonable performance data.
The results indicated the following:
• Operation of the RO system at 85-percent recovery was stable.
• Chemical cleaning did not restore the RO system to original performance level.
• Operation of the RO system at 90-percent recovery does not seem feasible, although it is not clear whether the decline in system performance was due to the water quality alone or due to excessive back pressure applied at the second stage and hydraulic loading in the third stage.
5.2.3.6 Membrane Autopsy At the end of the Phase 2 testing, three membrane elements (one from the front of the system (lead element) and two from the third stage (tail elements)) were sent to Dow/Filmtec Corporation for testing.
Standardized flow tests were carried out on all elements. These tests showed that the lead element permeate flow had declined by 34 percent. The permeate flow in one of the tail elements had declined by 53 percent, and the other is estimated to have declined by about 40 percent. The serial number of the latter element was removed during transport, so its initial conditions after manufacturing were not known.
Cleaning of the lead element showed an increase of about 10 percent in permeate flow after a NaOH (0.1 percent at pH 12) wash at 95 °F (35 °C) for 1 hour. A further 8-percent improvement in permeate flow was obtained after a second wash using 0.1 percent NaOH and 1 percent Na4EDTA at 95 °F (35 °C) and pH 12 for 1 hour. Combined, the two standard washes were only able to recover the membrane to about 77 percent of its initial flow. The cleaning did not impact the salt rejection, which remained around 97.5 percent, down from its initial 98.1 percent when the element was new.
One of the tail elements was autopsied. The membrane surface was coated with a rust-colored foulant that felt “gritty” to the touch. The foulant was determined to contain iron. An inductively coupled plasma mass spectrometry (ICP-MS) analysis of the foulant material indicated very high concentrations of silica, calcium, iron, and aluminum. Details are provided in the autopsy report included in Appendix G.

68
It was mentioned earlier that the silica concentration in Phase 2 was higher than in Phase 1 (25 mg/L compared to 16.9 mg/L). The dose of antiscalant was 3.2 mg/L at 90-percent recovery. This was slightly lower than the dose recommended by the supplier for use during Phase 1 at the same recovery (3.5 mg/L).
The membrane autopsy confirms the presence of a silica scale in the tail-end membranes. Aluminum and iron are known to help facilitate the polymerization of reactive silica to form silica scale.
5.3 Comparison of LSI and CCPP Indices
The LSI is the standard measure of scaling potential. LSI is a qualitative assessment of the water’s potential to precipitate calcium carbonate; it does not account for the amount of calcium carbonate that can precipitate. A negative LSI indicates that the water is undersaturated, while a positive LSI may indicate that the water is oversaturated.
Calcium Carbonate Precipitation Potential (CCPP) is an index that quantifies the amount of calcium carbonate that may dissolve or precipitate; it is a true indication of the water’s potential to deposit calcium carbonate. A negative value denotes the amount of calcium carbonate that must dissolve to reach a saturated condition, while a positive value indicates the concentration of calcium carbonate that exceeds the saturated condition.
Table 5.9 summarizes the RO concentrate water quality data for both Phase 1 and Phase 2, including the respective LSI and CCPP indices for each. The Phase 1 feed water had a higher calcium concentration but an overall lower TDS. The alkalinity of the RO concentrate from the brackish ground water in Phase 2 was higher than that of the concentrate in Phase 1. With regard to the LSI index, the Phase 1 concentrate has a lower LSI than the Phase 2 concentrate, suggesting that the Phase 2 concentrate has a higher potential for calcium carbonate scale formation than the Phase 1 concentrate. However the CCPP indices suggest otherwise, in that the CCPP value for the Phase 1 concentrate is higher than that for Phase 2.
From this study, it was not possible to determine which index is more suitable, but the results do show that there is merit in evaluating both indices and using the values to assist in determining the antiscalant dosages. Certainly, one advantage the CCPP has over the LSI is that it gives an indication of the mass of precipitate that could form.

69
Table 5.9 Water Quality Data for RO Concentrate
Parameter Surface Water (Phase 1)
Brackish Ground Water (Phase 2)
K 28.8 mg/L 17.2 mg/L Na 2,466 mg/L 4,229 mg/L Mg 321 mg/L 201 mg/L Ca 734 mg/L 458 mg/L CO3 10 mg/L 76 mg/L HCO3 1,718 mg/L 2,314 mg/L SiO2 213 mg/L 290 mg/L Cl 3,374 mg/L 4,902 mg/L SO4 2,128 mg/L 1,621 mg/L TDS 11,180 mg/L 14,804 mg/L pH 7.25 7.88 LSI 1.73 2.3 CCPP 944 858
Note: Samples taken between 7/18/2005 and 1/4/2006.
71
6. Summary and Conclusions 6.1 Ultrafiltration Pretreatment System
Ultrafiltration was selected as the pretreatment process upstream of the RO pilot plant while treating surface water from the Western Canal during Phase 1 of the project. A Polymem™ UF membrane was selected for this application based on good experience on a previous pilot-scale project. These hollow fiber membranes also provided the large surface area needed to produce enough UF permeate to feed to the RO unit.
There was significant variability of the raw water turbidity withdrawn from the Western Canal, ranging from less than 1 NTU at times to greater than 50 NTU. The UF membrane was able to produce a product stream that had a turbidity consistently less than 1 NTU (apart from one isolated incident) and generally less than 0.1 NTU for the entire 160-day Phase 1 operating period. SDI measurements of the UF permeate showed values that were generally around 1.0. This is well below the generally accepted SDI values of 2 to 3 considered suitable for RO feed water.
Operation of the UF system indicated that the cleaning frequency of once every 30 days was not sufficient to sustain the permeate production at a fixed rate. This indicates that the water had fouling tendencies and that, in practice, a lower flux rate would likely be required for long-term operation. A CEB, using chlorine in the form of sodium hypochlorite, was shown to improve the membrane performance in terms of maintaining flux.
The hardness of the water used to prepare the high pH wash solution for the UF CIP operation is thought to have resulted in the formation of a gray inorganic substance, which accumulated on the permeate side of the membrane (probably calcium carbonate). Tests were not done to confirm the nature of this material, and it did not appear to impact the performance of the membrane, but softening of the make-up water for the cleaning solutions would be recommended for a full-scale application. The RO permeate can also be used as cleaning make-up water.
The UF system demonstrated its ability to adequately remove suspended solids from the Western Canal water to a level suitable for RO treatment. The membrane was also able to remove some insoluble iron from the water, which is an important advantage of the process when coupled with RO, due to the potential fouling issues associated with iron and silica on RO membranes. A key finding of the investigation is that CEBs proved to be an effective way to maintain the membrane flux between full chemical cleaning events.

72
6.2 Reverse Osmosis System
The RO pilot plant was operated in both phases of the project. During Phase 1, the RO system operated on UF-pretreated Western Canal surface water; during Phase 2, the RO system operated directly on brackish ground water.
The main objective of the RO portion of the study was to maximize the RO system recovery with the use of a newly developed dendrimer antiscalant. The goal was to achieve a recovery of 90 percent or more, which was based on the results of computer modeling and recommendations from the antiscalant manufacturer.
During Phase 1, the RO system was operated on UF-pretreated water from the Western Canal, with an average TDS of 767 mg/L. Test results showed that operating at 90-percent recovery was not feasible under the test conditions encountered. The results showed that there was a decrease in membrane performance as indicated by a loss of permeate production and salt rejection after less than 30 days of operation at 90-percent recovery. The cleaning methods that were used were not effective at restoring membrane performance for this water source, and permeate production continued to decline as the operation continued. A more frequent cleaning schedule or a different cleaning procedure needs to be evaluated. The pilot testing did indicate stable operation at a recovery level of 85 percent, although this testing period was short – only 12 days.
During Phase 2, testing on brackish ground water (average TDS of 1,526 mg/L – roughly twice that of the surface water) showed better RO system performance at 90-percent recovery. The membranes used in the approximately 130-day operating period were the same as those used during Phase 1, with one new element installed in the first membrane stage and a modification made to the second and third stages to improve the hydraulics. However, despite the improved performance relative to Phase 1, there was a decline in system performance during each of the test runs, and a gradual decline in performance occurred over the entire 3-month test period while operating at 90-percent recovery. It is unclear from the data whether the decline in performance was due to scale formation on the membranes due to Phase 2 operation alone, contributions from Phase 1 operation, and/or due to acceleration of scale formation attributable to excessive permeate back pressure applied accidentally in the second stage of the RO system to maintain adequate flow to the third stage. An operational challenge associated with the three-stage RO pilot plant was the requirement to meet the minimum/maximum feed flow rates to the third stage membranes.
A membrane autopsy (carried out on an element taken from the third stage of the pilot plant at the end of Phase 2 operation) confirmed a drop in membrane

73
permeate flow and salt rejection. Analysis of scale on the membrane surface showed the presence of high concentrations of silica, calcium, iron, and aluminum. This result confirmed that scale formation was occurring in the tail-end membranes, resulting in the declining performance observed during the testing. The presence of silica suggests that this resulted from the Phase 2 operation, since the silica concentration in the raw water was higher in Phase 2 than in Phase 1. The iron concentration in the raw water was also higher in Phase 2 than in Phase 1 (where some of the ambient iron concentration was removed by the UF process). Iron removal should be considered for future pretreatment of this water.
6.3 Overall Conclusions
The testing conducted in Phases 1 and 2 on Western Canal surface water and brackish ground water, respectively, has provided a good insight into the different issues associated with each of these water sources.
In the case of the Western Canal surface water, pretreatment using UF appeared to provide a good quality of water (in terms of turbidity and SDI value) for RO treatment. Nevertheless, scaling and/or fouling of the RO membranes was observed when a dose of 3.5 mg/L of scale inhibitor was used. In addition, there were challenges with cleaning the RO membranes.
During testing on the brackish ground water, which had a higher average TDS concentration than the surface water, pretreatment with UF was not used. The RO system performed a lot better initially, but then showed scaling/fouling in the RO membranes too when operating at 90-percent recovery and a scale inhibitor dose of 3.2 mg/L. Once again, periodic membrane cleaning was not able to sustain permeate production. A membrane autopsy showed the presence of scale containing silica, iron, calcium, and aluminum in the tail end membrane element.
The CCPP index proved to be a better tool than the LSI in predicting scaling potential, based on the actual mass of calcium carbonate that has potential to deposit on the membrane. However, for this study, neither index proved to be more valuable than the other. Both indices should be used to predict the potential for calcium carbonate scale formation and assist with setting scale inhibitor dosages.
This study has indicated that the predictions for the performance of a newly developed dendrimer scale inhibitor for operating RO at 90-percent recovery and above could not be achieved during this pilot test under the dosages and system conditions encountered. This was the case for both water sources tested.

74
The results from this study provide a good starting point for the additional testing that would be necessary before starting to design an RO treatment plant to demineralize one or both of these water sources. Such testing would need to include an extended period of operation to confirm stable performance at a recovery of 85 percent. Future testing should also include the evaluation of different scale inhibitors to determine which one works best for these source waters.

75
7. References Amjad, Z., and J.F. Zibride, “Membranes-Silica Control Technology for Reverse
Osmosis System.” Ultrapure Water February 1999 (35-41).
GE Water & Process Technologies, RCC Thermal Products, “Budget ZLD Pricing.” September 26, 2003, email.
Kenna, E.N., and A.K. Zander, “Current Management of Membrane Plant Concentrate.” American Water Works Association Research Foundation, Denver, Colorado, 2000.
Seacord, T.F., and A. Sander, “Determining the Scale Inhibitor Threshold Limit for Calcium Carbonate - LSI Versus CCPP.” Paper presented at the 2003 International Desalting Association World Congress on Desalination and Water Reuse, Paradise Island, Bahamas, September 28 - October 3, 2003.
Zacheis, G.A., and G.J.G. Juby, “Brine Disposal Options for Membrane Processes Located in the Southwestern United States.” Paper presented at the Nevada Water Environment Association 2002 Annual Conference, Reno, Nevada, March 20-22, 2002.

Appendix A Filmtec RO Membranes

Product Information
FILMTEC Membranes
FILMTEC Fiberglassed Elements for Light Industrial Systems Features
FILMTECTM brackish water reverse osmosis membrane elements provide consistent, outstanding system performance in light industrial applications. •
•
•
FILMTEC BW30LE-4040 delivers highest performance at lowest pressure resulting in less energy usage and lower costs. FILMTEC BW30-4040 is the industry standard for reliable operation and production of the highest quality water. FILMTEC BW30-2540 elements are designed for systems smaller than 1 gpm (0.2 m3/h) offering a hard shell exterior for extra strength.
Elements with a hard shell exterior are recommended for systems with multiple-element housings containing three or more membranes, as they are designed to withstand higher pressure drops.
Product Specifications Product
Part Number
Active Area ft2 (m2)
Applied Pressure psig (bar)
Permeate Flow Rate gpd (m3/d)
Stabilized Salt Rejection (%)
BW30LE-4040 80604 82 (7.6) 150 (10.3) 2,300 (8.7) 99.0 BW30-4040 80783 82 (7.6) 225 (15.5) 2,400 (9.1) 99.5 BW30-2540 80766 28 (2.6) 225 (15.5) 850 (3.2) 99.5 1. Permeate flow and salt rejection based on the following test conditions: 2,000 ppm NaCl, pressure specified above, 77°F (25°C) and 15% recovery. 2. Permeate flows for individual elements may vary +/-20%. 3. For the purpose of improvement, specifications may be updated periodically. 4. BW30LE-4040 was previously named BW30HP-4040.
A
Figure 1* Trademark of The Dow Chemical Company Form No. 609-00350-804
FilmTec sells coupler partnumber 89055 for use in multipleelement housings. Each couplerincludes two 2-210 EPR o-rings,FilmTec part number 89255.
B B
D DIAC DIA
Feed
Fiberglass Outer WrapEnd Cap ProductBrine
Dimensions – Inches (mm) Product A B C D BW30LE-4040 40.0 (1,016) 1.05 (26.7) 0.75 (19) 3.9 (99) BW30-4040 40.0 (1,016) 1.05 (26.7) 0.75 (19) 3.9 (99) BW30-2540 40.0 (1,016) 1.19 (30.2) 0.75 (19) 2.4 (61) 1. Refer to FilmTec Design Guidelines for multiple-element systems. 1 inch = 25.4 mm 2. BW30-2540 elements fit nominal 2.5-inch I.D. pressure vessel. BW30LE-4040 and BW30-4040 elements fit nominal 4-inch I.D. pressure vessel.
A-1

*Trademark of The Dow Chemical Company Form No. 609-00350-804
Operating Limits • • • •
• • • • •
• • •
• •
•
•
• •
Membrane Type Polyamide Thin-Film Composite Maximum Operating Temperaturea 113°F (45°C) Maximum Operating Pressure 600 psi (41 bar) Maximum Feed Flow Rate - 4040 elements 16 gpm (3.6 m3/h)
- 2540 elements 6 gpm (1.4 m3/h) Maximum Pressure Drop 15 psig (1.0 bar) pH Range, Continuous Operationa 2 – 11 pH Range, Short-Term Cleaningb 1 – 12 Maximum Feed Silt Density Index SDI 5 Free Chlorine Tolerancec <0.1 ppm
a Maximum temperature for continuous operation above pH 10 is 95°F (35°C). b Refer to Cleaning Guidelines in specification sheet 609-23010. c Under certain conditions, the presence of free chlorine and other oxidizing agents will cause premature membrane failure.
Since oxidation damage is not covered under warranty, FilmTec recommends removing residual free chlorine by pretreatment prior to membrane exposure. Please refer to technical bulletin 609-22010 for more information.
Important Information
Proper start-up of reverse osmosis water treatment systems is essential to prepare the membranes for operating service and to prevent membrane damage due to overfeeding or hydraulic shock. Following the proper start-up sequence also helps ensure that system operating parameters conform to design specifications so that system water quality and productivity goals can be achieved. Before initiating system start-up procedures, membrane pretreatment, loading of the membrane elements, instrument calibration and other system checks should be completed. Please refer to the application information literature entitled “Start-Up Sequence” (Form No. 609-00298) for more information.
Operation Guidelines
Avoid any abrupt pressure or cross-flow variations on the spiral elements during start-up, shutdown, cleaning or other sequences to prevent possible membrane damage. During start-up, a gradual change from a standstill to operating state is recommended as follows:
Feed pressure should be increased gradually over a 30-60 second time frame. Cross-flow velocity at set operating point should be achieved gradually over 15-20 seconds.Permeate obtained from first hour of operation should be discarded.
General Information
Keep elements moist at all times after initial wetting. If operating limits and guidelines given in this bulletin are not strictly followed, the limited warranty will be null and void. To prevent biological growth during prolonged system shutdowns, it is recommended that membrane elements be immersed in a preservative solution. The customer is fully responsible for the effects of incompatible chemicals and lubricants on elements. Maximum pressure drop across an entire pressure vessel (housing) is 50 psi (3.4 bar). Avoid static permeate-side backpressure at all times.
FILMTEC Membranes For more information about FILMTEC membranes, call the Dow Liquid Separations business: North America: 1-800-447-4369 Latin America: (+55) 11-5188-9222 Europe: (+32) 3-450-2240 Pacific (ex. China): +800-7776-7776 China: +10-800-600-0015 http://www.filmtec.com
Notice: The use of this product in and of itself does not necessarily guarantee the removal of cysts and pathogens from water. Effective cyst and pathogen reduction is dependent on the complete system design and on the operation and maintenance of the system. Notice: No freedom from any patent owned by Seller or others is to be inferred. Because use conditions and applicable laws may differ from one location to another and may change with time, Customer is responsible for determining whether products and the information in this document are appropriate for Customer’s use and for ensuring that Customer’s workplace and disposal practices are in compliance with applicable laws and other governmental enactments. Seller assumes no obligation or liability for the information in this document. NO WARRANTIES ARE GIVEN; ALL IMPLIED WARRANTIES OF MERCHANTABILITY OR FITNESS FOR A PARTICULAR PURPOSE ARE EXPRESSLY EXCLUDED.
A-2

Appendix B RO Model Projections - Phase 1

System Summary
Permeate Flux reported by ROSA is calculated based on ACTIVE membrane area, not nominal membrane area as reported in some competitive projection products. DISCLAIMER: NO WARRANTY, EXPRESSED OR IMPLIED, AND NO WARRANTY OF MERCHANTABILITY OR FITNESS, IS GIVEN. Neither FilmTec Corporation nor The Dow Chemical Company assume liability for results obtained or damages incurred from the application of this information. FilmTec Corporation and The DOW Chemical Company assume no liability if, as a result of customer's use of the ROSA membrane design software, the customer should be sued for alleged infringement of any patent not owned or controlled by the FilmTec Corporation nor The DOW Chemical Company. Any final design should be reviewed by the appropriate engineering personnel.
Reverse Osmosis System Analysis for FILMTEC(TM) Membranes ROSA v5.4Project: Phoenix Area Membrane Pilot Study Case: 1Jenna Worley, Carollo Engineers 5/25/2004
Feed Flow to Stage 1 18.80 gpm Permeate Flow 15.98 gpm Raw Water Flow to System 18.80 gpm Recovery 85.00 % Feed Pressure 152.62 psig Feed Temperature 20.50 C Fouling Factor 0.95 Feed TDS 1168.77 mg/l Chem. Dose (100% H2SO4) 79.99 mg/l Number of Elements 24 Total Active Area 1644.00 ft2 Average System Flux 14.00 gfd Water Classification Surface Supply SDI < 3
Stage Element #PV #EleFeed Flow
(gpm)
Feed Press (psig)
Recirc Flow
(gpm)
Conc Flow
(gpm)
Conc Press (psig)
Perm Flow
(gpm)
Avg Flux (gfd)
Perm Press (psig)
Boost Press (psig)
Perm TDS
(mg/l) 1 BW30LE-4040 2 6 18.80 147.62 0.00 9.56 127.69 9.24 13.52 50.00 0.00 23.24 2 BW30LE-4040 1 6 9.56 172.69 0.00 4.47 153.21 5.09 14.89 50.00 50.00 43.14 3 LP-2540 1 6 4.47 148.21 0.00 2.82 113.26 1.65 14.18 0.00 0.00 130.71
(mg/l, except pH) Raw Water Adj Feed Permeate ConcentrateNH4 0.20 0.20 0.10 0.74 K 4.20 4.20 0.87 23.06 Na 249.00 258.67 9.85 1668.67 Mg 32.70 32.70 0.52 215.07 Ca 74.80 74.80 1.16 492.11 Sr 0.00 0.00 0.00 0.00 Ba 0.06 0.06 0.00 0.39 CO3 3.21 0.05 0.00 4.01 HCO3 275.00 181.91 7.25 1166.11 NO3 23.60 23.60 3.65 136.64 Cl 351.00 351.09 11.61 2274.84 F 0.35 0.35 0.01 2.25 SO4 138.00 216.36 2.71 1427.04 Boron 0.52 0.52 0.43 1.05 SiO2 21.80 21.80 0.43 142.90 CO2 2.70 70.71 69.49 71.30 TDS 1176.90 1168.77 40.59 7559.84 pH 8.10 6.50 5.23 7.15
B-1

Design Warnings
Solubility Warnings
Scaling Calculations
To balance: 9.67 mg/l Na added to feed.
Permeate Flux reported by ROSA is calculated based on ACTIVE membrane area, not nominal membrane area as reported in some competitive projection products. DISCLAIMER: NO WARRANTY, EXPRESSED OR IMPLIED, AND NO WARRANTY OF MERCHANTABILITY OR FITNESS, IS GIVEN. Neither FilmTec Corporation nor The Dow Chemical Company assume liability for results obtained or damages incurred from the application of this information. FilmTec Corporation and The DOW Chemical Company assume no liability if, as a result of customer's use of the ROSA membrane design software, the customer should be sued for alleged infringement of any patent not owned or controlled by the FilmTec Corporation nor The DOW Chemical Company. Any final design should be reviewed by the appropriate engineering personnel.
Reverse Osmosis System Analysis for FILMTEC(TM) Membranes ROSA v5.4Project: Phoenix Area Membrane Pilot Study Case: 1Jenna Worley, Carollo Engineers 5/25/2004
-None-
Langelier Saturation Index > 0 Stiff & Davis Stability Index > 0 BaSO4 (% Saturation) > 100 % CaF2 (% Saturation) > 100 % SiO2 (% Saturation) > 100 % Antiscalants may be required. Consult your antiscalant manufacturer for dosing and maximum allowable system recovery.
Raw Water Adj Feed ConcentratepH 8.10 6.50 7.15 Langelier Saturation Index 0.70 -1.08 1.14 Stiff & Davis Stability Index 1.04 -0.76 0.77 Ionic Strength (Molal) 0.02 0.02 0.15 TDS (mg/l) 1176.90 1139.96 7559.84 HCO3 275.00 181.91 1166.11 CO2 2.74 71.86 72.46 CO3 3.21 0.05 4.01 CaSO4 (% Saturation) 0.49 0.76 22.08 BaSO4 (% Saturation) 268.49 420.94 2897.50 SrSO4 (% Saturation) 0.00 0.00 0.00 CaF2 (% Saturation) 1.22 1.22 332.59 SiO2 (% Saturation) 16.18 17.69 123.19
B-2

Array Details
Permeate Flux reported by ROSA is calculated based on ACTIVE membrane area, not nominal membrane area as reported in some competitive projection products. DISCLAIMER: NO WARRANTY, EXPRESSED OR IMPLIED, AND NO WARRANTY OF MERCHANTABILITY OR FITNESS, IS GIVEN. Neither FilmTec Corporation nor The Dow Chemical Company assume liability for results obtained or damages incurred from the application of this information. FilmTec Corporation and The DOW Chemical Company assume no liability if, as a result of customer's use of the ROSA membrane design software, the customer should be sued for alleged infringement of any patent not owned or controlled by the FilmTec Corporation nor The DOW Chemical Company. Any final design should be reviewed by the appropriate engineering personnel.
Reverse Osmosis System Analysis for FILMTEC(TM) Membranes ROSA v5.4Project: Phoenix Area Membrane Pilot Study Case: 1Jenna Worley, Carollo Engineers 5/25/2004
Stage 1 Element Recov. Perm Flow (gpm)
Perm TDS (mg/l)
Feed Flow (gpm)
Feed TDS (mg/l)
Feed Press (psig)
1 0.10 0.91 15.92 9.40 1168.77 147.62 2 0.10 0.85 18.22 8.50 1291.68 142.90 3 0.10 0.79 21.08 7.65 1432.78 138.83 4 0.11 0.74 24.66 6.86 1596.09 135.33 5 0.11 0.69 29.17 6.12 1786.55 132.35 6 0.12 0.64 34.97 5.42 2010.56 129.81
Stage 2 Element Recov. Perm Flow (gpm)
Perm TDS (mg/l)
Feed Flow (gpm)
Feed TDS (mg/l)
Feed Press (psig)
1 0.11 1.03 26.46 9.56 2275.95 172.69 2 0.11 0.96 31.60 8.54 2547.08 167.90 3 0.12 0.88 38.14 7.58 2864.30 163.83 4 0.12 0.81 46.55 6.69 3237.65 160.41 5 0.13 0.74 57.56 5.88 3678.92 157.55 6 0.13 0.67 72.18 5.14 4200.72 155.17
Stage 3 Element Recov. Perm Flow (gpm)
Perm TDS (mg/l)
Feed Flow (gpm)
Feed TDS (mg/l)
Feed Press (psig)
1 0.08 0.36 86.48 4.47 4814.77 148.21 2 0.08 0.32 102.38 4.11 5228.61 140.64 3 0.08 0.29 121.46 3.79 5666.28 133.90 4 0.07 0.26 144.45 3.50 6124.17 127.89 5 0.07 0.23 172.22 3.24 6597.12 122.50 6 0.07 0.20 205.91 3.02 7078.39 117.65
B-3
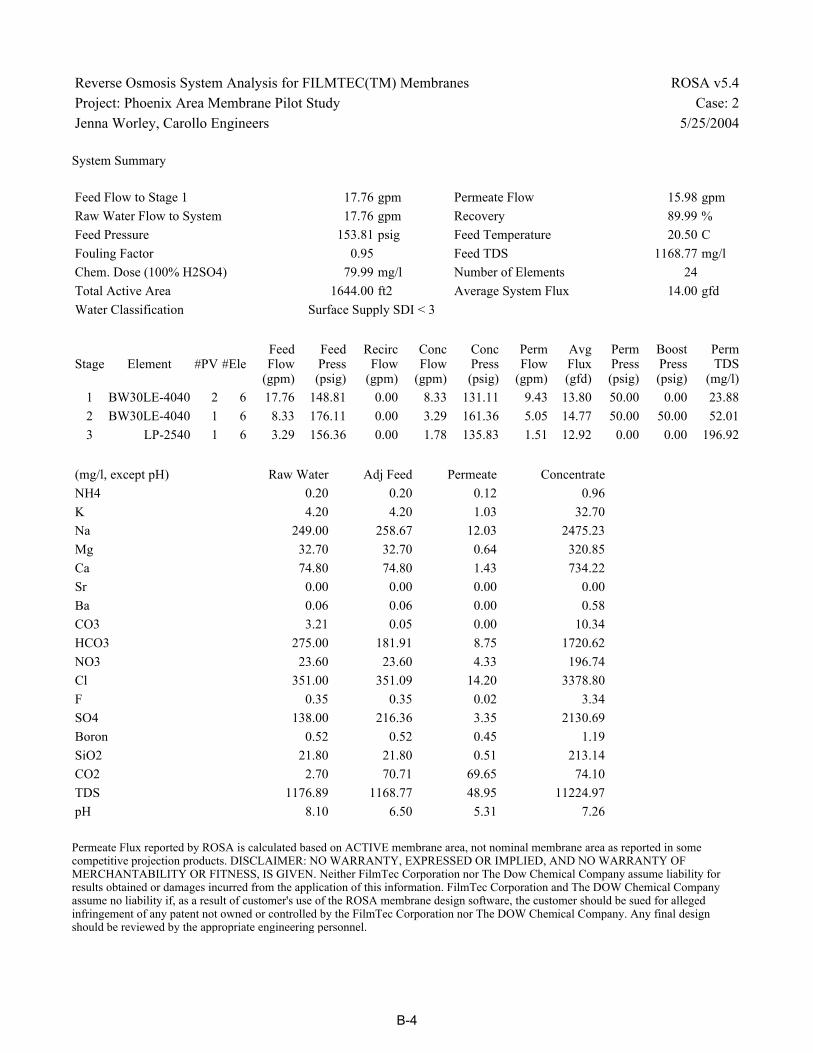
System Summary
Permeate Flux reported by ROSA is calculated based on ACTIVE membrane area, not nominal membrane area as reported in some competitive projection products. DISCLAIMER: NO WARRANTY, EXPRESSED OR IMPLIED, AND NO WARRANTY OF MERCHANTABILITY OR FITNESS, IS GIVEN. Neither FilmTec Corporation nor The Dow Chemical Company assume liability for results obtained or damages incurred from the application of this information. FilmTec Corporation and The DOW Chemical Company assume no liability if, as a result of customer's use of the ROSA membrane design software, the customer should be sued for alleged infringement of any patent not owned or controlled by the FilmTec Corporation nor The DOW Chemical Company. Any final design should be reviewed by the appropriate engineering personnel.
Reverse Osmosis System Analysis for FILMTEC(TM) Membranes ROSA v5.4Project: Phoenix Area Membrane Pilot Study Case: 2Jenna Worley, Carollo Engineers 5/25/2004
Feed Flow to Stage 1 17.76 gpm Permeate Flow 15.98 gpm Raw Water Flow to System 17.76 gpm Recovery 89.99 % Feed Pressure 153.81 psig Feed Temperature 20.50 C Fouling Factor 0.95 Feed TDS 1168.77 mg/l Chem. Dose (100% H2SO4) 79.99 mg/l Number of Elements 24 Total Active Area 1644.00 ft2 Average System Flux 14.00 gfd Water Classification Surface Supply SDI < 3
Stage Element #PV #EleFeed Flow
(gpm)
Feed Press (psig)
Recirc Flow
(gpm)
Conc Flow
(gpm)
Conc Press (psig)
Perm Flow
(gpm)
Avg Flux (gfd)
Perm Press (psig)
Boost Press (psig)
Perm TDS
(mg/l) 1 BW30LE-4040 2 6 17.76 148.81 0.00 8.33 131.11 9.43 13.80 50.00 0.00 23.88 2 BW30LE-4040 1 6 8.33 176.11 0.00 3.29 161.36 5.05 14.77 50.00 50.00 52.01 3 LP-2540 1 6 3.29 156.36 0.00 1.78 135.83 1.51 12.92 0.00 0.00 196.92
(mg/l, except pH) Raw Water Adj Feed Permeate ConcentrateNH4 0.20 0.20 0.12 0.96 K 4.20 4.20 1.03 32.70 Na 249.00 258.67 12.03 2475.23 Mg 32.70 32.70 0.64 320.85 Ca 74.80 74.80 1.43 734.22 Sr 0.00 0.00 0.00 0.00 Ba 0.06 0.06 0.00 0.58 CO3 3.21 0.05 0.00 10.34 HCO3 275.00 181.91 8.75 1720.62 NO3 23.60 23.60 4.33 196.74 Cl 351.00 351.09 14.20 3378.80 F 0.35 0.35 0.02 3.34 SO4 138.00 216.36 3.35 2130.69 Boron 0.52 0.52 0.45 1.19 SiO2 21.80 21.80 0.51 213.14 CO2 2.70 70.71 69.65 74.10 TDS 1176.89 1168.77 48.95 11224.97 pH 8.10 6.50 5.31 7.26
B-4

Design Warnings
Solubility Warnings
Scaling Calculations
To balance: 9.67 mg/l Na added to feed.
Permeate Flux reported by ROSA is calculated based on ACTIVE membrane area, not nominal membrane area as reported in some competitive projection products. DISCLAIMER: NO WARRANTY, EXPRESSED OR IMPLIED, AND NO WARRANTY OF MERCHANTABILITY OR FITNESS, IS GIVEN. Neither FilmTec Corporation nor The Dow Chemical Company assume liability for results obtained or damages incurred from the application of this information. FilmTec Corporation and The DOW Chemical Company assume no liability if, as a result of customer's use of the ROSA membrane design software, the customer should be sued for alleged infringement of any patent not owned or controlled by the FilmTec Corporation nor The DOW Chemical Company. Any final design should be reviewed by the appropriate engineering personnel.
Reverse Osmosis System Analysis for FILMTEC(TM) Membranes ROSA v5.4Project: Phoenix Area Membrane Pilot Study Case: 2Jenna Worley, Carollo Engineers 5/25/2004
CAUTION: The concentrate flow rate is less than the recommended minimum flow. Please change your system design to increase concentrate flow rates. (Product: BW30LE-4040, Limit: 4.00 gpm)
Langelier Saturation Index > 0 Stiff & Davis Stability Index > 0 BaSO4 (% Saturation) > 100 % CaF2 (% Saturation) > 100 % SiO2 (% Saturation) > 100 % Antiscalants may be required. Consult your antiscalant manufacturer for dosing and maximum allowable system recovery.
Raw Water Adj Feed ConcentratepH 8.10 6.50 7.26 Langelier Saturation Index 0.70 -1.08 1.59 Stiff & Davis Stability Index 1.04 -0.76 1.05 Ionic Strength (Molal) 0.02 0.02 0.23 TDS (mg/l) 1176.89 1139.96 11224.97 HCO3 275.00 181.91 1720.62 CO2 2.74 71.86 75.31 CO3 3.21 0.05 10.34 CaSO4 (% Saturation) 0.49 0.76 41.45 BaSO4 (% Saturation) 268.49 420.94 4361.23 SrSO4 (% Saturation) 0.00 0.00 0.00 CaF2 (% Saturation) 1.22 1.22 1090.71 SiO2 (% Saturation) 16.18 17.69 183.74
B-5
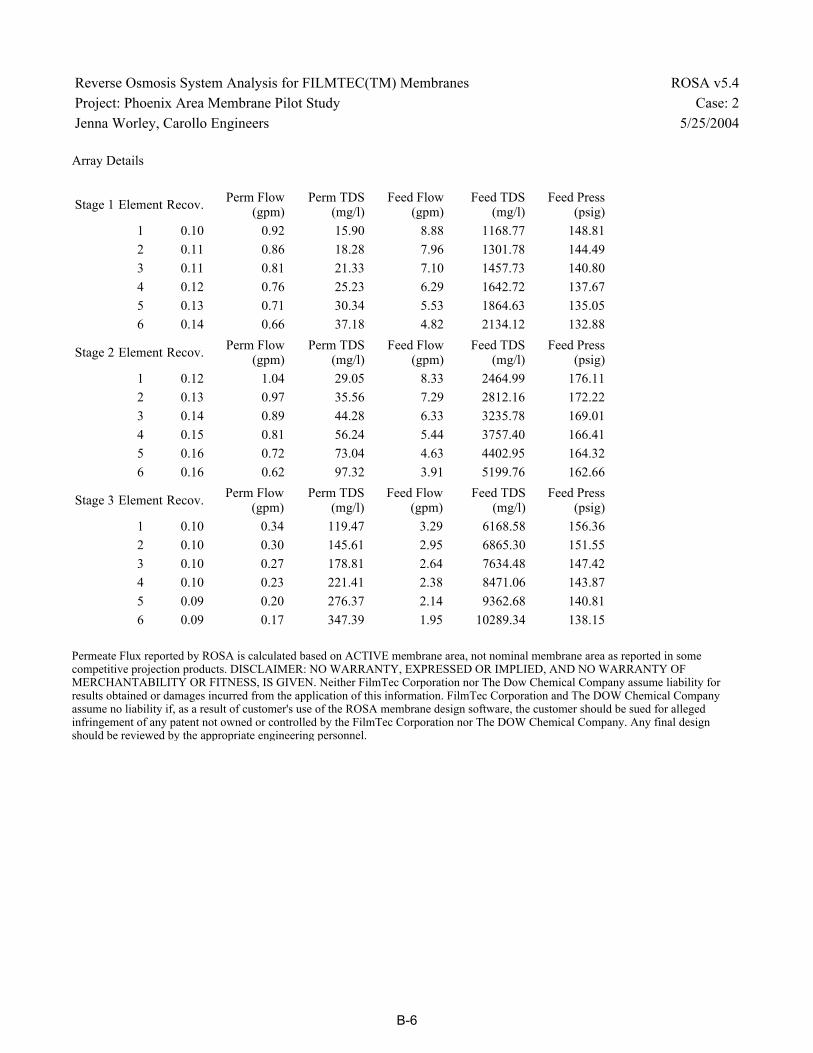
Array Details
Permeate Flux reported by ROSA is calculated based on ACTIVE membrane area, not nominal membrane area as reported in some competitive projection products. DISCLAIMER: NO WARRANTY, EXPRESSED OR IMPLIED, AND NO WARRANTY OF MERCHANTABILITY OR FITNESS, IS GIVEN. Neither FilmTec Corporation nor The Dow Chemical Company assume liability for results obtained or damages incurred from the application of this information. FilmTec Corporation and The DOW Chemical Company assume no liability if, as a result of customer's use of the ROSA membrane design software, the customer should be sued for alleged infringement of any patent not owned or controlled by the FilmTec Corporation nor The DOW Chemical Company. Any final design should be reviewed by the appropriate engineering personnel.
Reverse Osmosis System Analysis for FILMTEC(TM) Membranes ROSA v5.4Project: Phoenix Area Membrane Pilot Study Case: 2Jenna Worley, Carollo Engineers 5/25/2004
Stage 1 Element Recov. Perm Flow (gpm)
Perm TDS (mg/l)
Feed Flow (gpm)
Feed TDS (mg/l)
Feed Press (psig)
1 0.10 0.92 15.90 8.88 1168.77 148.81 2 0.11 0.86 18.28 7.96 1301.78 144.49 3 0.11 0.81 21.33 7.10 1457.73 140.80 4 0.12 0.76 25.23 6.29 1642.72 137.67 5 0.13 0.71 30.34 5.53 1864.63 135.05 6 0.14 0.66 37.18 4.82 2134.12 132.88
Stage 2 Element Recov. Perm Flow (gpm)
Perm TDS (mg/l)
Feed Flow (gpm)
Feed TDS (mg/l)
Feed Press (psig)
1 0.12 1.04 29.05 8.33 2464.99 176.11 2 0.13 0.97 35.56 7.29 2812.16 172.22 3 0.14 0.89 44.28 6.33 3235.78 169.01 4 0.15 0.81 56.24 5.44 3757.40 166.41 5 0.16 0.72 73.04 4.63 4402.95 164.32 6 0.16 0.62 97.32 3.91 5199.76 162.66
Stage 3 Element Recov. Perm Flow (gpm)
Perm TDS (mg/l)
Feed Flow (gpm)
Feed TDS (mg/l)
Feed Press (psig)
1 0.10 0.34 119.47 3.29 6168.58 156.36 2 0.10 0.30 145.61 2.95 6865.30 151.55 3 0.10 0.27 178.81 2.64 7634.48 147.42 4 0.10 0.23 221.41 2.38 8471.06 143.87 5 0.09 0.20 276.37 2.14 9362.68 140.81 6 0.09 0.17 347.39 1.95 10289.34 138.15
B-6

System Summary
Permeate Flux reported by ROSA is calculated based on ACTIVE membrane area, not nominal membrane area as reported in some competitive projection products. DISCLAIMER: NO WARRANTY, EXPRESSED OR IMPLIED, AND NO WARRANTY OF MERCHANTABILITY OR FITNESS, IS GIVEN. Neither FilmTec Corporation nor The Dow Chemical Company assume liability for results obtained or damages incurred from the application of this information. FilmTec Corporation and The DOW Chemical Company assume no liability if, as a result of customer's use of the ROSA membrane design software, the customer should be sued for alleged infringement of any patent not owned or controlled by the FilmTec Corporation nor The DOW Chemical Company. Any final design should be reviewed by the appropriate engineering personnel.
Reverse Osmosis System Analysis for FILMTEC(TM) Membranes ROSA v5.4Project: Phoenix Area Membrane Pilot Study Case: 3Jenna Worley, Carollo Engineers 5/25/2004
Feed Flow to Stage 1 17.37 gpm Permeate Flow 15.98 gpm Raw Water Flow to System 17.37 gpm Recovery 91.99 % Feed Pressure 149.64 psig Feed Temperature 20.50 C Fouling Factor 0.95 Feed TDS 1168.76 mg/l Chem. Dose (100% H2SO4) 79.98 mg/l Number of Elements 24 Total Active Area 1644.00 ft2 Average System Flux 14.00 gfd Water Classification Surface Supply SDI < 3
Stage Element #PV #EleFeed Flow
(gpm)
Feed Press (psig)
Recirc Flow
(gpm)
Conc Flow
(gpm)
Conc Press (psig)
Perm Flow
(gpm)
Avg Flux (gfd)
Perm Press (psig)
Boost Press (psig)
Perm TDS
(mg/l) 1 BW30LE-4040 2 6 17.37 144.64 0.00 8.95 126.73 8.42 12.33 55.00 0.00 24.85 2 BW30LE-4040 1 6 8.95 196.73 0.00 3.04 181.32 5.91 17.30 55.00 75.00 45.20 3 LP-2540 1 6 3.04 176.32 0.00 1.39 159.65 1.65 14.12 0.00 0.00 213.34
(mg/l, except pH) Raw Water Adj Feed Permeate ConcentrateNH4 0.20 0.20 0.12 1.13 K 4.20 4.20 1.08 40.09 Na 249.00 258.66 12.73 3084.50 Mg 32.70 32.70 0.68 400.61 Ca 74.80 74.80 1.52 916.81 Sr 0.00 0.00 0.00 0.00 Ba 0.06 0.06 0.00 0.72 CO3 3.21 0.05 0.00 17.45 HCO3 275.00 181.91 9.26 2134.42 NO3 23.60 23.60 4.55 242.48 Cl 351.00 351.09 15.01 4212.68 F 0.35 0.35 0.02 4.16 SO4 138.00 216.35 3.57 2661.19 Boron 0.52 0.52 0.45 1.31 SiO2 21.80 21.80 0.54 266.10 CO2 2.70 70.71 69.76 77.29 TDS 1176.89 1168.76 51.66 13989.81 pH 8.10 6.50 5.33 7.31
B-7

Design Warnings
Solubility Warnings
Scaling Calculations
To balance: 9.66 mg/l Na added to feed.
Permeate Flux reported by ROSA is calculated based on ACTIVE membrane area, not nominal membrane area as reported in some competitive projection products. DISCLAIMER: NO WARRANTY, EXPRESSED OR IMPLIED, AND NO WARRANTY OF MERCHANTABILITY OR FITNESS, IS GIVEN. Neither FilmTec Corporation nor The Dow Chemical Company assume liability for results obtained or damages incurred from the application of this information. FilmTec Corporation and The DOW Chemical Company assume no liability if, as a result of customer's use of the ROSA membrane design software, the customer should be sued for alleged infringement of any patent not owned or controlled by the FilmTec Corporation nor The DOW Chemical Company. Any final design should be reviewed by the appropriate engineering personnel.
Reverse Osmosis System Analysis for FILMTEC(TM) Membranes ROSA v5.4Project: Phoenix Area Membrane Pilot Study Case: 3Jenna Worley, Carollo Engineers 5/25/2004
WARNING: Maximum element recovery has been exceeded. Please change your system design to reduce the element recoveries. (Product: BW30LE-4040, Limit: 17.00) CAUTION: The concentrate flow rate is less than the recommended minimum flow. Please change your system design to increase concentrate flow rates. (Product: BW30LE-4040, Limit: 4.00 gpm)
Langelier Saturation Index > 0 Stiff & Davis Stability Index > 0 BaSO4 (% Saturation) > 100 % CaF2 (% Saturation) > 100 % SiO2 (% Saturation) > 100 % Antiscalants may be required. Consult your antiscalant manufacturer for dosing and maximum allowable system recovery.
Raw Water Adj Feed ConcentratepH 8.10 6.50 7.31 Langelier Saturation Index 0.70 -1.08 1.82 Stiff & Davis Stability Index 1.04 -0.76 1.20 Ionic Strength (Molal) 0.02 0.02 0.29 TDS (mg/l) 1176.89 1139.94 13989.81 HCO3 275.00 181.91 2134.42 CO2 2.74 71.86 78.56 CO3 3.21 0.05 17.45 CaSO4 (% Saturation) 0.49 0.76 57.90 BaSO4 (% Saturation) 268.49 420.93 5487.70 SrSO4 (% Saturation) 0.00 0.00 0.00 CaF2 (% Saturation) 1.22 1.22 2113.87 SiO2 (% Saturation) 16.18 17.69 229.40
B-8

Array Details
Permeate Flux reported by ROSA is calculated based on ACTIVE membrane area, not nominal membrane area as reported in some competitive projection products. DISCLAIMER: NO WARRANTY, EXPRESSED OR IMPLIED, AND NO WARRANTY OF MERCHANTABILITY OR FITNESS, IS GIVEN. Neither FilmTec Corporation nor The Dow Chemical Company assume liability for results obtained or damages incurred from the application of this information. FilmTec Corporation and The DOW Chemical Company assume no liability if, as a result of customer's use of the ROSA membrane design software, the customer should be sued for alleged infringement of any patent not owned or controlled by the FilmTec Corporation nor The DOW Chemical Company. Any final design should be reviewed by the appropriate engineering personnel.
Reverse Osmosis System Analysis for FILMTEC(TM) Membranes ROSA v5.4Project: Phoenix Area Membrane Pilot Study Case: 3Jenna Worley, Carollo Engineers 5/25/2004
Stage 1 Element Recov. Perm Flow (gpm)
Perm TDS (mg/l)
Feed Flow (gpm)
Feed TDS (mg/l)
Feed Press (psig)
1 0.10 0.83 17.04 8.69 1168.76 144.64 2 0.10 0.77 19.50 7.86 1290.10 140.43 3 0.10 0.72 22.57 7.09 1428.93 136.78 4 0.11 0.68 26.40 6.36 1588.94 133.63 5 0.11 0.63 31.21 5.69 1774.54 130.94 6 0.12 0.58 37.36 5.06 1991.36 128.66
Stage 2 Element Recov. Perm Flow (gpm)
Perm TDS (mg/l)
Feed Flow (gpm)
Feed TDS (mg/l)
Feed Press (psig)
1 0.13 1.20 23.86 8.95 2246.06 196.73 2 0.15 1.13 29.43 7.74 2591.76 192.45 3 0.16 1.04 37.14 6.62 3027.85 189.00 4 0.17 0.95 48.21 5.57 3588.07 186.26 5 0.18 0.85 64.63 4.62 4318.56 184.14 6 0.19 0.73 90.04 3.77 5277.92 182.52
Stage 3 Element Recov. Perm Flow (gpm)
Perm TDS (mg/l)
Feed Flow (gpm)
Feed TDS (mg/l)
Feed Press (psig)
1 0.13 0.38 117.72 3.04 6526.08 176.32 2 0.13 0.34 147.82 2.65 7450.70 172.08 3 0.13 0.30 188.43 2.31 8522.44 168.58 4 0.12 0.25 244.03 2.02 9742.12 165.70 5 0.12 0.21 321.10 1.77 11092.03 163.32 6 0.11 0.17 428.34 1.56 12529.54 161.33
B-9
Appendix C RO Cleaning Products and Procedures
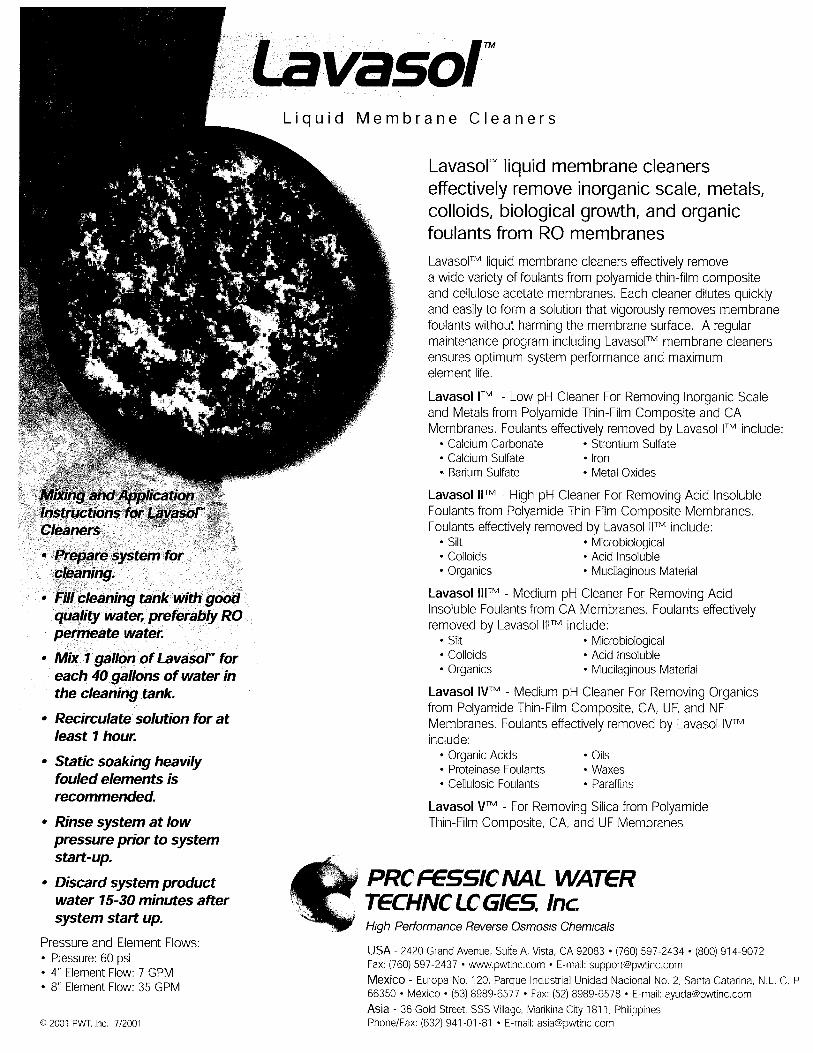


Appendix D RO Model Projections - Phase 2

D-1

D-2

D-3

D-4

D-5

D-6

D-7
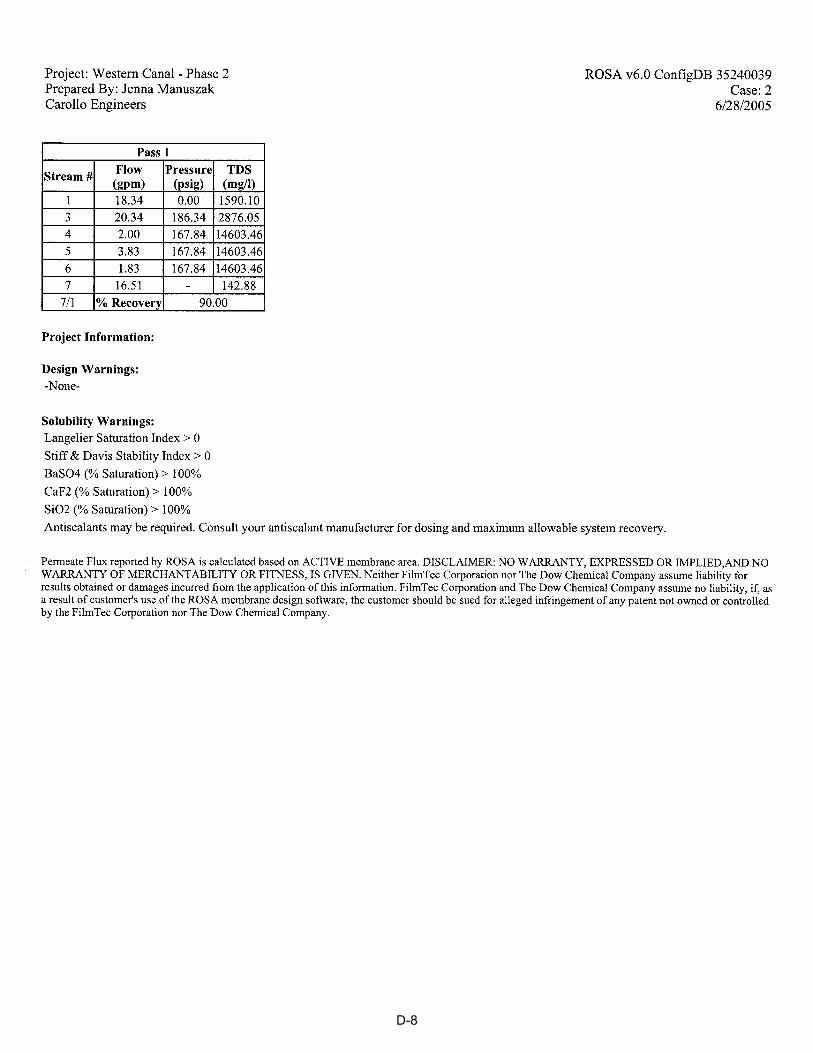
D-8

D-9

D-10
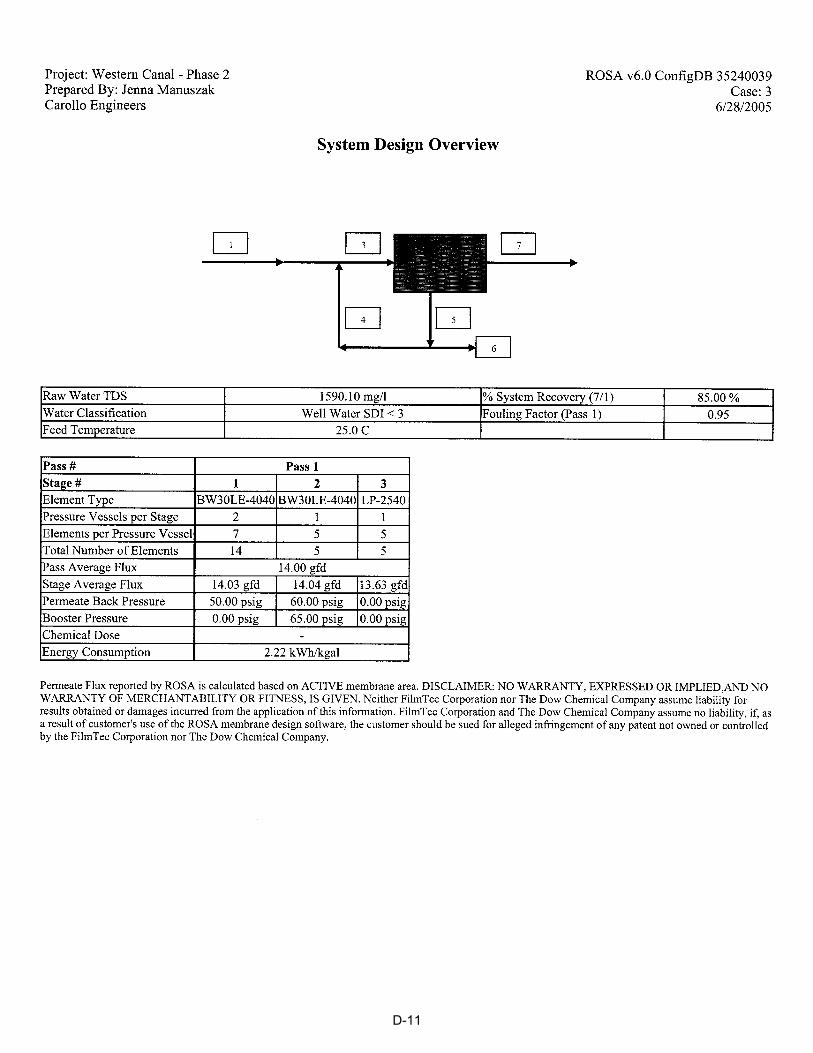
D-11

D-12

D-13

D-14

D-15

Appendix E
Raw Water Quality - Phase 1

Table E.1 Raw Water Quality of the Western Canal - Phoenix Area Membrane Pilot Study - Phase 1
Parameter Units Minimum Maximum Average MCL/NL
Temperature ºC 11.4 24.5 15 pH S.U. 7.13 8.72 8.2 Alkalinity mg/L as
CaCO3 112 257 197.8
Ammonia* mg/L 0.2 Arsenic - total μg/L 3.6 8.1 5.6 10 Atrazine* μg/L 0.05 1 Barium - total mg/L 0.05 0.09 0.068 1 Bentazon* μg/L 0.5 18 Benzene* μg/L 0.5 Benzo(a)pyrene* μg/L 0.02 0.2 Boron - total mg/L 0.1 0.7 0.4 1 Bromodichloromethane* μg/L 0.5 5 Bromoform* μg/L 0.5 Calcium - total mg/L 37 95 63 Carbofuran (Furadan)* μg/L 1 Carbon tetrachloride* μg/L 0.5 0.5 Chlordane* μg/L 0.1 Chloride mg/L 43 426 264.3 250 Chloroform μg/L 0.5 2 0.8 Dalapon* μg/L 1 200 Di-(2-Ethylhexyl)adipate* μg/L 0.6 400 Di(2-Ethylhexyl)phthalate* μg/L 0.6 4 Dibromochloromethane* μg/L 0.5 5 Dibromochloropropane (DBCP)* μg/L 0.01 0.2 Dicamba* μg/L 0.08 Dichlorprop* μg/L 0.5 Dieldrin* μg/L 0.01 0.002 Dinoseb* μg/L 0.2 7 Diquat* μg/L 0.4 20 Dissolved organic carbon mg/L 0.6 6.73 2.4 Endothall* μg/L 5 100 Endrin μg/L 0.01 0.1 0.055 2 Ethylene Dibromide (EDB)* μg/L 0.01 Fluoride mg/L 0.21 0.81 0.38 Glyphosate* μg/L 5 700 Heptachlor μg/L 0.01 0.04 0.025 0.01 Heptachlor epoxide μg/L 0.01 0.02 0.015 0.01 Heptachlor epoxide (isomer B)* μg/L 0.02 0.01 Hexachlorobenzene* μg/L 0.05 1 Hexachlorocyclopentadiene* μg/L 0.05 50 Iron - dissolved mg/L 0.02 0.12 0.0325 Iron – total mg/L 0.1 2.6 0.63 0.3 Lindane* μg/L 0.02 0.2 Lindane (gamma-BHC)* μg/L 0.01
E-1

Table E.1 Raw Water Quality of the Western Canal - Phoenix Area Membrane Pilot Study - Phase 1
Parameter Units Minimum Maximum Average MCL/NL
Magnesium - total mg/L 13 39 28 Manganese - total mg/L 0.01 0.06 0.024 0.05 Mercury - total* mg/L 0.0002 0.002 Methiocarb* μg/L 0.5 Methoxychlor μg/L 0.05 0.1 0.075 30 Nitrate-N mg/L 0.3 9.8 3.82 45 (as NO3)
Nitrite-N* mg/L 0.1 1 Oxamyl (Vydate) * μg/L 0.5 1 Paraquat* μg/L 2 PCB 1016 Arochlor* μg/L 0.07 PCB 1221 Arochlor* μg/L 0.1 PCB 1232 Arochlor* μg/L 0.1 PCB 1242 Arochlor* μg/L 0.1 PCB 1248 Arochlor* μg/L 0.1 PCB 1254 Arochlor* μg/L 0.1 PCB 1260 Arochlor* μg/L 0.1 Pentachlorophenol* μg/L 0.04 1 Picloram* μg/L 0.1 500 Potassium - total mg/L 2.6 7.3 5.30 Propoxur (Baygon)* µg/L 1 30 Selenium - total mg/L 0.005 2 1.00 50 Silica – total mg/L as
SiO2 10.9 32.1 21.54
Silicon - total mg/L 5.1 15 10.1 Simazine* μg/L 0.05 4 Sodium - total mg/L 44 347 195 Strontium - total mg/L 0.39 2.2 0.96 Sulfate mg/L 29 168 111 250 Total DCPA mono- and di-acid degradates*
μg/L 1
Total dissolved solids mg/L 288 1,250 817 500 Total organic carbon mg/L 0.8 7.48 2.78 Total PCBs* μg/L 0.07 0.5 Total TTHM μg/L 0.5 2 0.8 100 Toxaphene* μg/L 0.5 3 Trichloroethylene* μg/L 0.5 5 Turbidity* NTU 51.3 5 UV254 cm-1 0.01 0.179 0.089 * Sampled and analyzed one time only MCL = Maximum Contaminant Level (NL = Notification Level)
E-2

Appendix F UF Permeate Water Quality - Phase 1
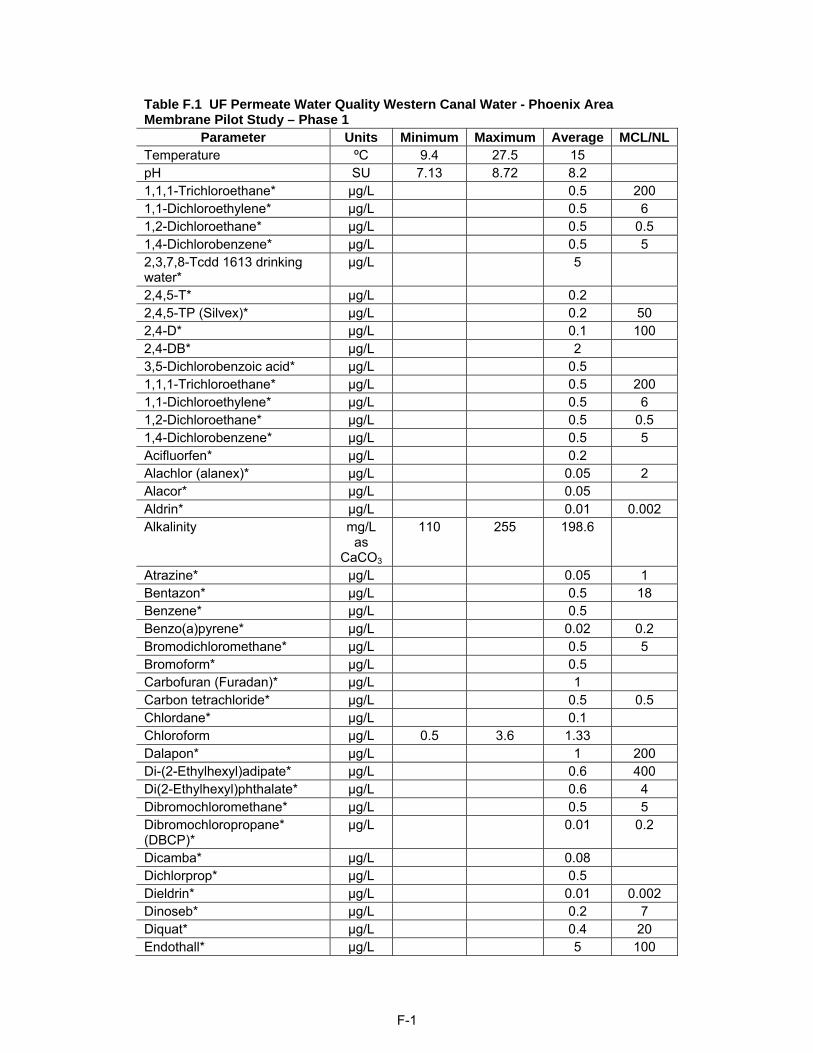
Table F.1 UF Permeate Water Quality Western Canal Water - Phoenix Area Membrane Pilot Study – Phase 1
Parameter Units Minimum Maximum Average MCL/NL
Temperature ºC 9.4 27.5 15 pH SU 7.13 8.72 8.2 1,1,1-Trichloroethane* μg/L 0.5 200 1,1-Dichloroethylene* μg/L 0.5 6 1,2-Dichloroethane* μg/L 0.5 0.5 1,4-Dichlorobenzene* μg/L 0.5 5 2,3,7,8-Tcdd 1613 drinking water*
μg/L 5
2,4,5-T* μg/L 0.2 2,4,5-TP (Silvex)* μg/L 0.2 50 2,4-D* μg/L 0.1 100 2,4-DB* μg/L 2 3,5-Dichlorobenzoic acid* μg/L 0.5 1,1,1-Trichloroethane* μg/L 0.5 200 1,1-Dichloroethylene* μg/L 0.5 6 1,2-Dichloroethane* μg/L 0.5 0.5 1,4-Dichlorobenzene* μg/L 0.5 5 Acifluorfen* μg/L 0.2 Alachlor (alanex)* μg/L 0.05 2 Alacor* μg/L 0.05 Aldrin* μg/L 0.01 0.002 Alkalinity mg/L
as CaCO3
110 255 198.6
Atrazine* μg/L 0.05 1 Bentazon* μg/L 0.5 18 Benzene* μg/L 0.5 Benzo(a)pyrene* μg/L 0.02 0.2 Bromodichloromethane* μg/L 0.5 5 Bromoform* μg/L 0.5 Carbofuran (Furadan)* μg/L 1 Carbon tetrachloride* μg/L 0.5 0.5 Chlordane* μg/L 0.1 Chloroform μg/L 0.5 3.6 1.33 Dalapon* μg/L 1 200 Di-(2-Ethylhexyl)adipate* μg/L 0.6 400 Di(2-Ethylhexyl)phthalate* μg/L 0.6 4 Dibromochloromethane* μg/L 0.5 5 Dibromochloropropane* (DBCP)*
μg/L 0.01 0.2
Dicamba* μg/L 0.08 Dichlorprop* μg/L 0.5 Dieldrin* μg/L 0.01 0.002 Dinoseb* μg/L 0.2 7 Diquat* μg/L 0.4 20 Endothall* μg/L 5 100
F-1
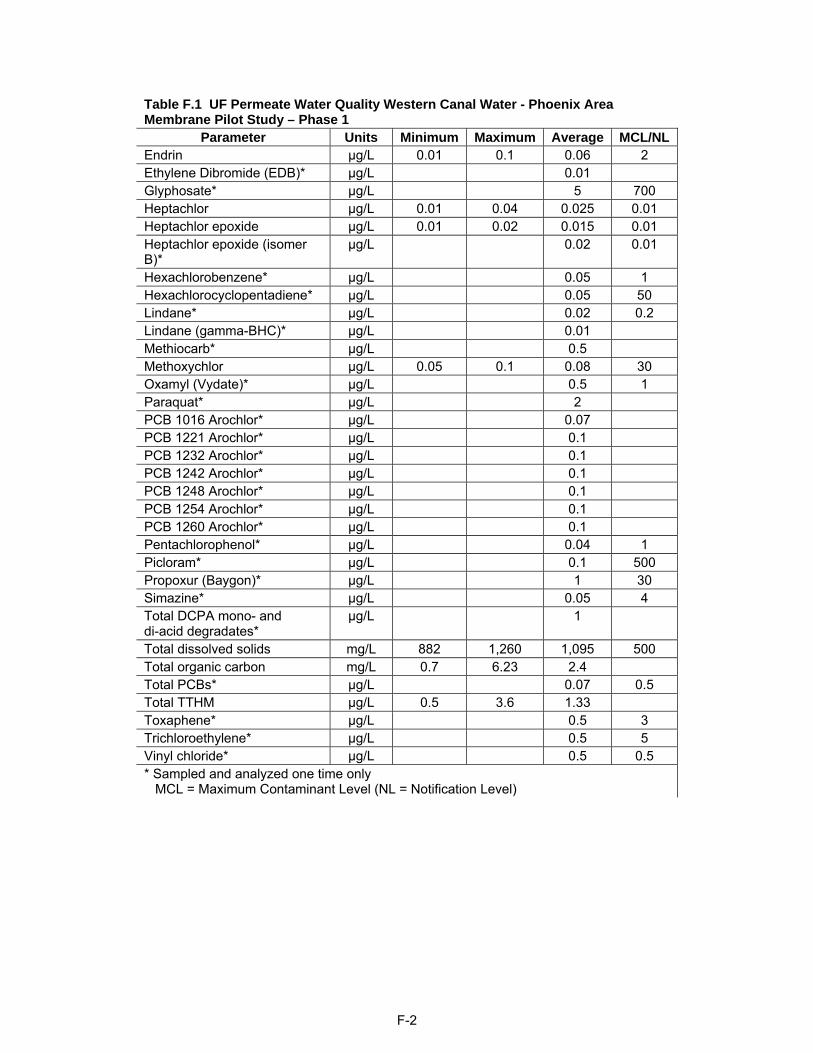
Table F.1 UF Permeate Water Quality Western Canal Water - Phoenix Area Membrane Pilot Study – Phase 1
Parameter Units Minimum Maximum Average MCL/NL
Endrin μg/L 0.01 0.1 0.06 2 Ethylene Dibromide (EDB)* μg/L 0.01 Glyphosate* μg/L 5 700 Heptachlor μg/L 0.01 0.04 0.025 0.01 Heptachlor epoxide μg/L 0.01 0.02 0.015 0.01 Heptachlor epoxide (isomer B)*
μg/L 0.02 0.01
Hexachlorobenzene* μg/L 0.05 1 Hexachlorocyclopentadiene* μg/L 0.05 50 Lindane* μg/L 0.02 0.2 Lindane (gamma-BHC)* μg/L 0.01 Methiocarb* μg/L 0.5 Methoxychlor μg/L 0.05 0.1 0.08 30 Oxamyl (Vydate)* μg/L 0.5 1 Paraquat* μg/L 2 PCB 1016 Arochlor* μg/L 0.07 PCB 1221 Arochlor* μg/L 0.1 PCB 1232 Arochlor* μg/L 0.1 PCB 1242 Arochlor* μg/L 0.1 PCB 1248 Arochlor* μg/L 0.1 PCB 1254 Arochlor* μg/L 0.1 PCB 1260 Arochlor* μg/L 0.1 Pentachlorophenol* μg/L 0.04 1 Picloram* μg/L 0.1 500 Propoxur (Baygon)* μg/L 1 30 Simazine* μg/L 0.05 4 Total DCPA mono- and di-acid degradates*
μg/L 1
Total dissolved solids mg/L 882 1,260 1,095 500 Total organic carbon mg/L 0.7 6.23 2.4 Total PCBs* μg/L 0.07 0.5 Total TTHM μg/L 0.5 3.6 1.33 Toxaphene* μg/L 0.5 3 Trichloroethylene* μg/L 0.5 5 Vinyl chloride* μg/L 0.5 0.5 * Sampled and analyzed one time only MCL = Maximum Contaminant Level (NL = Notification Level)
F-2

Appendix G Membrane Autopsy
May 3, 2006 FilmTec Corporation 5230 West 73rd Street
Edina MN55439 USA
DIRECTOR* Services
Membrane Test Report
Carollo Engineers Western Canal Pilot Study
RA # 106060DS Notice: No freedom from any patent owned by Seller or others is to be inferred. Because use conditions and applicable laws may differ from one location to another and may change with time, Customer is responsible for determining whether products and the information in this document are appropriate for Customer’s use and for ensuring that Customer’s workplace and disposal practices are in compliance with applicable laws and other governmental enactment’s. Seller assumes no obligation or liability for the information in this document. NO WARRANTIES ARE GIVEN; ALL IMPLIED WARRANTIES OF MERCHANTIBILTY OR FITNESS FOR A PARTICULAR PURPOSE ARE EXPRESSLY EXCLUDED. Published July 1997.
G-1

Membrane Sample Background Three FILMTECTM LP-2540 elements were received at our Minneapolis, MN site on April 7, 2006 under Return Authorization # 106060DS. The element’s serial numbers were A9908201, A9908247, and unknown serial number. The elements originally shipped from FilmTec on July 19, 2004. The purpose of the element return was to determine an effective cleaning protocol to remove the foulant from the membrane surface and to identify the cause of the performance decline. Summary Of Tests Performed: The following tests were performed on the returned element: • Physical Inspection of Element: A non-destructive test for an observation of physical integrity of the element and visual identification of potential foulants. All elements are visually inspected noting any differences from new product. (Examples would be: cracked endcaps, discolored scrolls, fiberglass discoloration, etc.) • Performance Testing: Determination of element operating performance, with a comparison to typical properties and original production test data (when available, not applicable to dry product). This is also a non-destructive test, used to determine how the element is performing at standard test conditions. • Cleaning Recommendations: Evaluation of the visual inspection as well as the performance test indicates to the technician what type of cleaning is likely to be most effective. If the first cleaning is unsuccessful, further cleanings can be instituted using different chemicals to improve performance. A performance test should be run after each cleaning to evaluate the degree of success. • Element Autopsy: A destructive test, the element is cut lengthwise to allow the membrane to be unrolled. Two cuts must be made, on opposite sides, just deep enough to penetrate the element casing. The element should be unrolled carefully so as to not damage the membrane surface. The surface is fully examined and sprayed with cleaning chemicals to check for reaction. • Analytical Testing: Inorganic, such as Inductively Coupled Plasma Emission Spectroscopy (ICP) to help in determining specific metals on the membrane surface, as well as silica.
G-2

Physical Inspection of Element: The elements were received in Minneapolis on April 7, 2006. They were inspected on arrival. Unknown S/N (tail element): - Tape wrinkled and came loose near feed end (photo 1) - The end cap and permeate tube on concentrate end are dirty (photo 2). S/N A9908247 (lead element): - Tape wrinkled and came loose near feed end (photo 3) - Damaged end cap on feed end (photo 4) S/N A9908201 (tail element): - Tape and label came loose (photo 5) - Tape wrinkled near feed end
Photo 1: tape wrinkled and came loose
G-3

Photo 2: end cap and permeate tube on concentrate end are dirty
Photo 3: tape wrinkled and came loose
G-4

Photo 4: damaged end cap on feed end
Photo 5: tape and label came loose
G-5

Performance Testing: The elements were subjected to the FilmTec brackish water baseline test. This test uses a 2,000-ppm NaCl solution at 77° F with an applied pressure of 150 psi. The test results are reported below:
Production / normal element Return element Serial # Date
shipped Flow (GPD) Rejection (%)
Delta P (psig)
Flow (GPD) Rejection (%) Delta P (psig)
Unknown NA NA NA NA 479 99.1 NA A9908201 7/19/2004 843 98.7 NA 393 98.4 NA A9908247 7/19/2004 805 98.1 NA 525 97.5 NA The test results indicate that rejection has declined and flow has decreased in comparison to the FilmTec production quality control test data. Cleaning Recommendations: S/N A9908247: In an attempt to improve performance, the element was put through a standard cleaning cycle. The detail cleaning and the effectiveness are shown on table below: Serial No. A9908247 Before After
Cleaning Flow (gpd)
Salt Rej. (%)
∆ P psi
Flow (gpd)
Salt Rej. (%)
∆ P psi
Delta Flow (%)
Cleaned Solution
1. 0.1% (w) NaOH, pH12, 35ºC for 1 hour
525 97.5 NA 577 97.7 NA 9.9% Clear
2. 0.1% (w) NaOH, pH12, 35ºC, SLS, 1% (w) NaEDTA for 1 hour
577 97.7 NA 622 97.4 NA 7.8% Clear
Autopsy Summary: S/N A9908201: The outer tape wrap was removed from the element and the brine channel spacer and membrane surfaces were inspected. - The membrane surface was coated with rusted color foulant and it feels gritty to the touch (photo 6). - Pressure ridges and cracks along the inside bottom glue line (top leaf) on every membrane leaf (photo
7). - Brine feed spacer imprinted on membrane surface (photo 7).
G-6

- Both acid and caustic were applied to the foulant in order to determine whether it could be removed. The acid turned yellow indicating the presence of iron. Both acid and caustic appeared to remove some foulant from a visual perspective.
- Glue adhesion of the membrane was in good order, indicating that no leaks had occurred between membrane edges.
Photo 6: rusted color foulant covers on membrane surface
Photo 7: pressure ridges and cracks along inside the bottom glue line
G-7

Analytical Testing: ICP: Testing was done on the surface of the membrane to detect what types of metals, as well as the amount of organics present. Element A9908201 (tail element) was analyzed for metals by ICP (Inductive Coupled Plasma Emission Spectroscopy). **All metals reported in mg/m2
Al Ba Ca Cu Fe Mg Mn Ni P K Na Sr Zn Si 30.7 0.48 158.9 0.17 78.12 11.76 2.26 0.05 1.46 2.90 73.30 1.30 2.93 1095 Conclusions: Based on the test results: S/N unknown: the permeate flow decreased 44% in comparison to a typical element. S/N A9908021: the permeate flow decreased 53% and the salt rejection decreased from 98.7% to 98.4% in
comparison to FilmTec quality control test data. S/N A9908247: the permeate flow decreased 35% and salt rejection decreased from 98.1% to 97.5% in
comparison to FilmTec quality control test data. The outer tape wrap wrinkles and the brine feed spacer imprints on the membrane surface are the indication for high pressure operation. High pressure operation will result in a mechanical damage of the membrane: low flow and subsequently salt passage will be worse if operating at high feed pressure continued. The ICP analysis of element S/N A9908201 (tail element) indicates very high concentration of silica followed by calcium, iron, and aluminum. Alkaline cleanings indicate some improvement in flow and salt rejection. The membrane is severely fouled and the performance decline may be irreversible. Recommendations: The pilot RO system information is not available from the customer and therefore, it is not possible to identify the source of silica and metals. However, the common source of the silica and metals are in the feed water. It is recommended to check and optimize the pre-treatment system and piping prior to membrane RO unit to prevent fouling the membrane. The majority of the fouling is thought to be related to high recovery operation. Careful control of sparingly soluble salts is necessary for successful high recovery operation of membrane systems.
G-8