reverse engineering with logical coupling
TRANSCRIPT
Reverse Engineering
with Logical Coupling
Marco D’Ambros, Michele Lanza
- Faculty of Informatics -!
University of Lugano!
Switzerland!
13th Working Conference on Reverse Engineering
October 23-27, 2006, Benevento, Italy

Marco D’Ambros - University of Lugano WCRE 2006: October 23-27 2006 1/14!
Evolutionary Information
•! Important resource for understanding legacy
software systems
–! Infer causes of problems
–!Detect candidates for reengineering activities
•! Complementary: Information not present when
considering only one version of the system
•! Challenging:
–!Facts have to be reconstructed
–!Techniques are needed for processing and
understanding large amount of data

Marco D’Ambros - University of Lugano WCRE 2006: October 23-27 2006 2/14!
Logical Coupling (LC)
•! Implicit dependencies between artifacts observed to
change together
•! Introduced by Gall et. al. in [1]
•! Benefits
–!Lightweight
–!Visible only in the evolution, not in the code or
documentation
–!Orthogonal to structural analysis
f1
f2
[1] Gall et. al. Detection of Logical Coupling Based on Product Release History. ICSM 1998
Time

Marco D’Ambros - University of Lugano WCRE 2006: October 23-27 2006 3/14!
Current Approaches to LC
File (or finer) level (e.g. [3])
•! Predict entities which are likely to be modified
•! Problem: No global view of the system
[2] Pinzger et. al. Visualizing Multiple Evolution Metrics. SoftVis 2005
[3] Zimmermann et. al. Mining version histories to guide software changes. ICSE 2004
Architecture level (e.g. [2])
•! Dependencies among
modules or subsystems
•! Problem: Loss of detailed
information
Marco D’Ambros - University of Lugano WCRE 2006: October 23-27 2006 4/14!
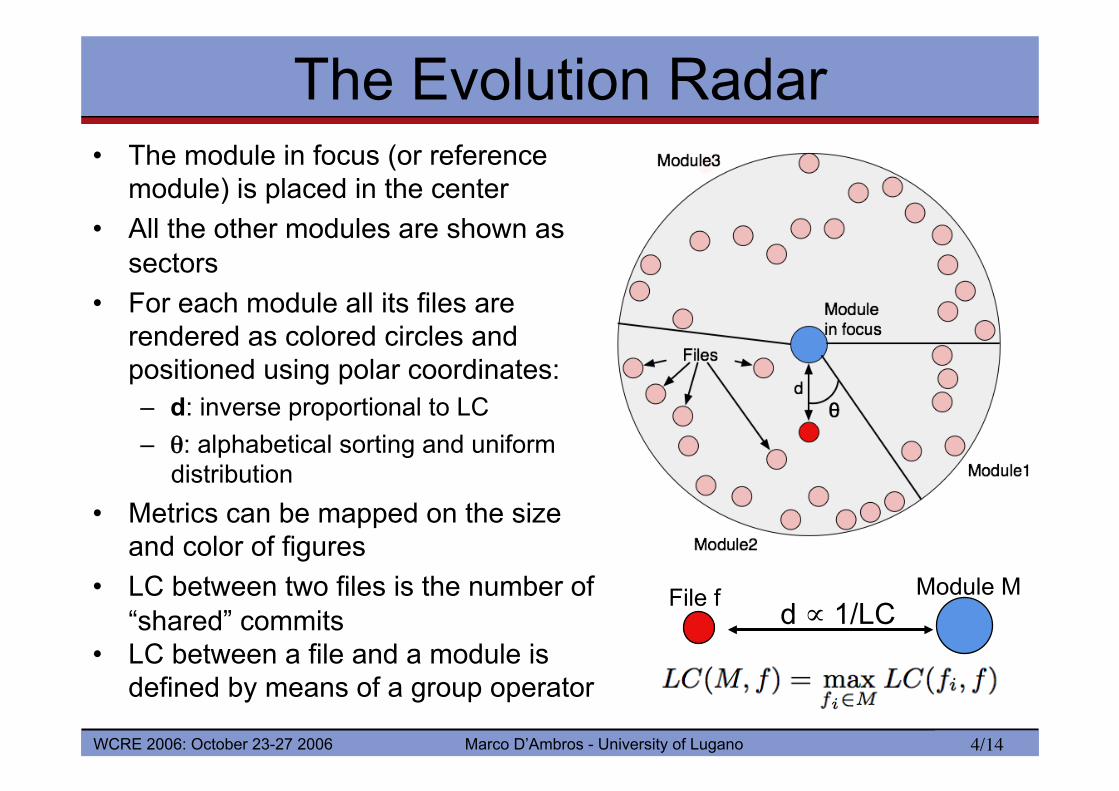
The Evolution Radar •! The module in focus (or reference
module) is placed in the center
•! All the other modules are shown as
sectors
•! For each module all its files are
rendered as colored circles and
positioned using polar coordinates:
–! d: inverse proportional to LC
–! !: alphabetical sorting and uniform
distribution
•! Metrics can be mapped on the size
and color of figures
•! LC between two files is the number of
“shared” commits
•! LC between a file and a module is
defined by means of a group operator
d " 1/LC File f Module M

Marco D’Ambros - University of Lugano WCRE 2006: October 23-27 2006 5/14!
Evolution Radar Exemplified
But a static visualization is not enough for analyzing a system…
•! LC between a
module and all the
other module
•! How the coupling
is structured in
terms of files
•! Files most coupled
with the module

Marco D’Ambros - University of Lugano WCRE 2006: October 23-27 2006 6/14!
Interacting with the Radar
•! Basic interaction
–! Any entity in the visualization (files and module
in focus) can be inspected
•! Source code
•! Commit-related information
•! Contents
•! Advanced interaction
1.! Spawning
2.! Moving trough time
3.! Tracking
Marco D’Ambros - University of Lugano WCRE 2006: October 23-27 2006 7/14!
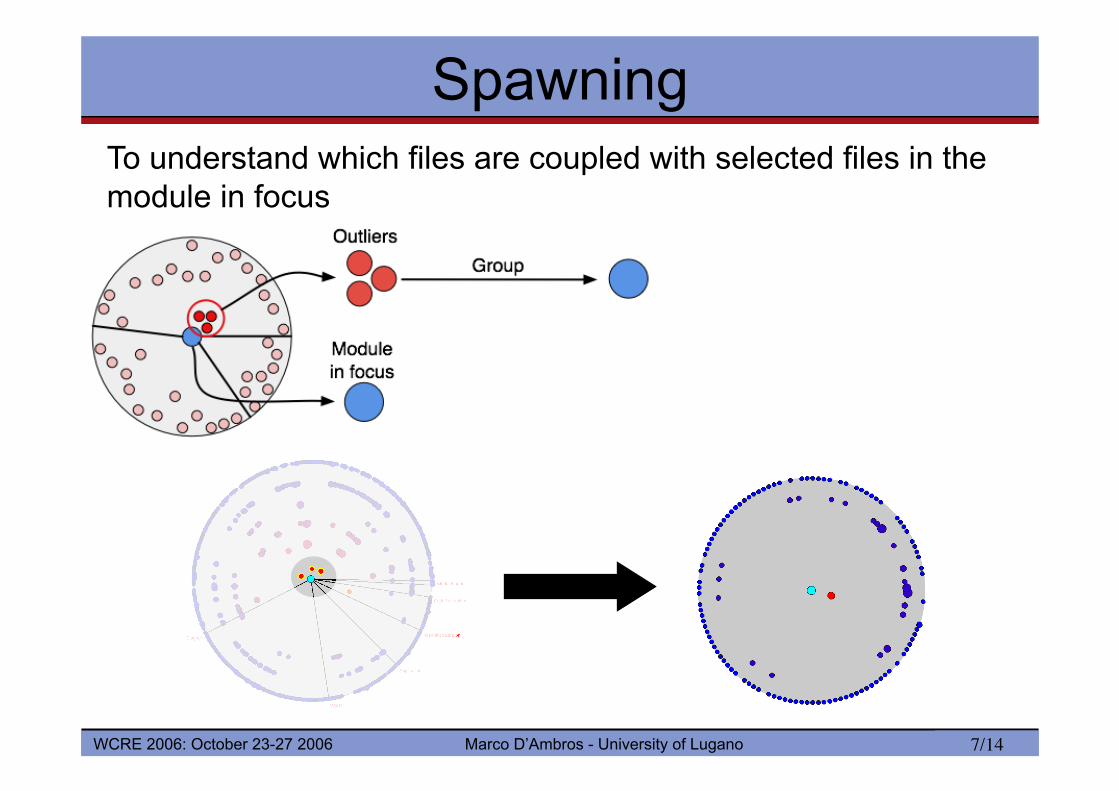
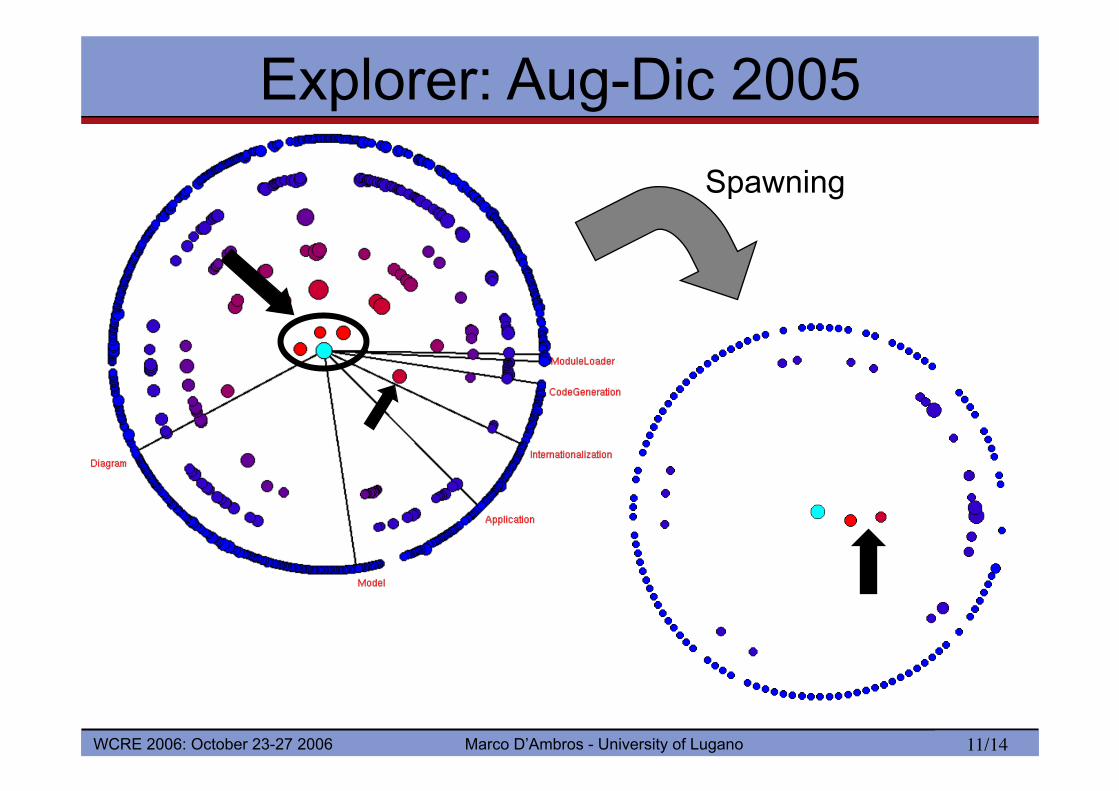
Spawning
To understand which files are coupled with selected files in the
module in focus

Marco D’Ambros - University of Lugano WCRE 2006: October 23-27 2006 8/14!
LC: 7/7
Very Strong LC LC: 2/6 LC: 0/4
No LC!
Moving Through Time •! Problem:
–! The LC value is time dependent
–! Summarizing the LC in a single value (i.e. consider the entire history) can give misleading results
•! Solution:
–! LC computed according to settable time interval
–! An Evolution Radar displayed for each time interval
–! A time slider is used to “move through time”
Year 1
Year 2
Year 3
Current version
LC (entire history): 9/17 Strong LC
file1
file2

Marco D’Ambros - University of Lugano WCRE 2006: October 23-27 2006 9/14!
Tracking
Year 1
Year 2
Year 3
figState.java figState.java figState.java
? ?
•! Solution: Files selected in one radar are highlighted (yellow border and name) in all the other radars
•! Problem: How do we keep track of the same entity
in different time intervals, i.e., in different radars
Marco D’Ambros - University of Lugano WCRE 2006: October 23-27 2006 10/14!
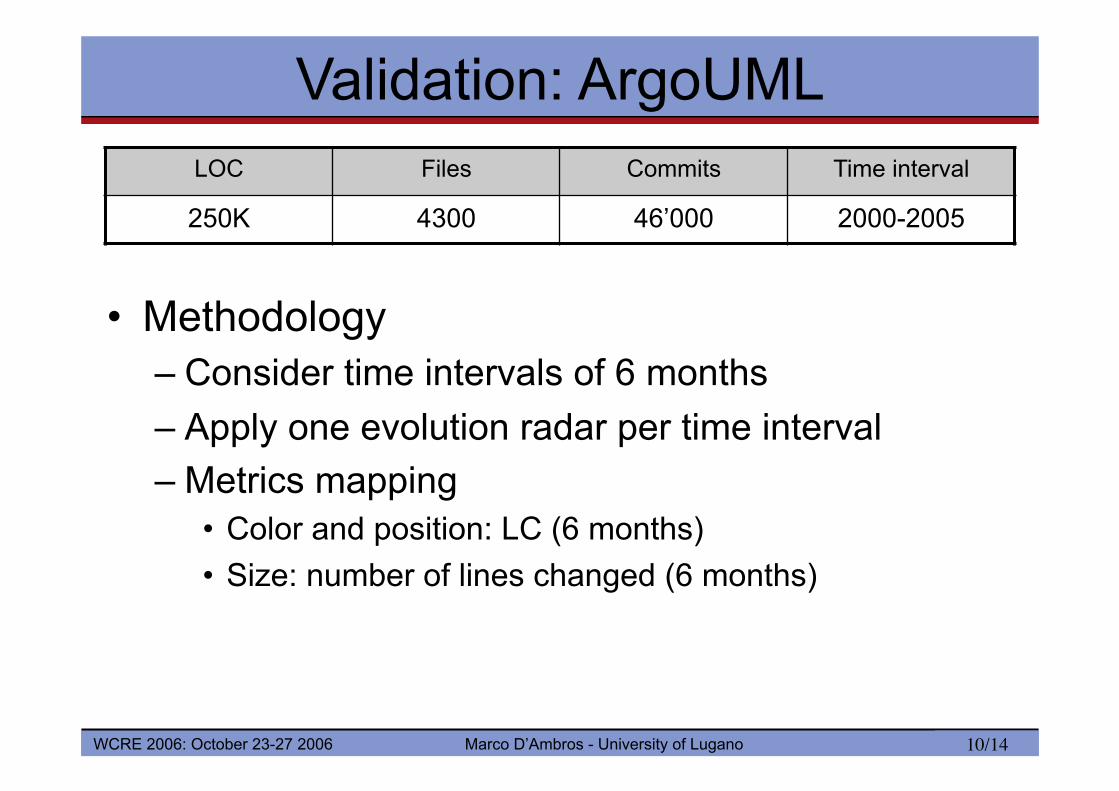
Validation: ArgoUML
•!Methodology
–!Consider time intervals of 6 months
–!Apply one evolution radar per time interval
–!Metrics mapping
•!Color and position: LC (6 months)
•!Size: number of lines changed (6 months)
LOC Files Commits Time interval
250K 4300 46’000 2000-2005
Marco D’Ambros - University of Lugano WCRE 2006: October 23-27 2006 11/14!
Explorer: Aug-Dic 2005
Spawning

Marco D’Ambros - University of Lugano WCRE 2006: October 23-27 2006 12/14!
Information crystallization
Explorer Diagram
CodeGeneration
Explorer Diagram
CodeGeneration
•! Dependencies between modules are simplified to
dependencies between small sets of files.
•! These files are candidates for reverse engineering

Marco D’Ambros - University of Lugano WCRE 2006: October 23-27 2006 13/14!
The Evolution of ModelFacade
Explorer in focus
Aug-Dic 2005
Explorer in focus
Aug-Dic 2004
Diagram in focus
Aug-Dic 2004

Marco D’Ambros - University of Lugano WCRE 2006: October 23-27 2006 14/14!
Conclusion
The Evolution Radar visualizes integrated logical
coupling information. It shows:
•! Dependencies at the module level
•! The structure of these dependencies
in terms of files, by rendering the files
themselves
Pro +! Interactivity and control of time
+! Scalability
+! Does not suffer from overplotting
+! General technique applicable to any
groups of entities given a distance
measure
Cons –! Need an authority system
decomposition
–! Finest granularity: files
–! May suffer from the outliers
problem

Marco D’Ambros - University of Lugano WCRE 2006: October 23-27 2006 15/14!

Marco D’Ambros - University of Lugano WCRE 2006: October 23-27 2006 16/14!
LC Measure Discussion
Outliers (files with LC >> average) can deform the
visualization by pushing all the other figures at the boundary
Possible solution Pro Cons
Log scale
Log(LC) Simple Can still suffer from outliers
Percentage
LC / noc1
No
outliers
Files with 2 and 100 commits
can have the same value
Percentage and log
(LC / noc) * log(noc)
No
outliers
It is an indirect measure of
the LC
Percentage with query engine to
detect files with noc < threshold
No
outliers Manual removal of files
1 noc = number of commits