revenue application - nersa · eskom holdings revenue application fy2018/19 page: 2 contents...
TRANSCRIPT

FY2018/19
August 2017
Revenue Application
CONTENTS
Eskom Holdings Revenue Application FY2018/19 Page: 2
CONTENTS
Preface ....................................................................................................................................................... 9
Executive Summary ................................................................................................................................ 10
1.1 Key elements of allowed revenue for the 2018/19 financial year ............................................ 11
1.2 Recovery of efficient costs ......................................................................................................... 11
1.3 Earning a reasonable return on assets ...................................................................................... 13
1.4 Revenue recovery ........................................................................................................................ 13
1.5 Electricity price impact in 2018/19 .............................................................................................. 14
2 Basis of Application ..................................................................................................................... 15
2.1 Legislative and regulatory framework ....................................................................................... 15 2.1.1 Electricity Regulation Act (Act No. 4 of 2006) ...................................................................... 15 2.1.2 Electricity Pricing Policy ....................................................................................................... 15 2.1.3 Municipal Finance Management Act (Act 56 OF 2003) ....................................................... 15 2.1.4 Multi-Year Price Determination (MYPD) Methodology ........................................................ 15 2.1.5 Eskom retail tariff and structural adjustment (ERTSA) methodology .................................. 16
3 Changes in landscape with regards to supply demand balance ............................................ 18
3.1 Medium term system adequacy outlook .................................................................................... 18
4 Generation landscape .................................................................................................................. 20
5 Energy Wheel ................................................................................................................................ 25
6 Allowable Revenue....................................................................................................................... 27
6.1 Allowed Revenue formula ........................................................................................................... 27
6.2 Revenue recovery ........................................................................................................................ 28
6.3 Electricity price impact in 2018/19 .............................................................................................. 29
6.4 Rebasing of sales volumes ......................................................................................................... 30
6.5 Inclusion of full international purchases ................................................................................... 31
6.6 Operating costs increase ............................................................................................................ 32
6.7 Depreciation and return on assets ............................................................................................. 32
7 Indicative Standard Tariff Increase ............................................................................................ 33
7.1 Tariffs ............................................................................................................................................ 33
7.2 Standard tariff increases ............................................................................................................. 33
7.3 Catering for the poor.................................................................................................................... 34
7.4 Illustrative Standard tariff category increases for 2018/19 ...................................................... 34
8 Sales Volumes .............................................................................................................................. 36
8.1 Introduction to sales volumes .................................................................................................... 36
8.2 Sales forecasting approach ........................................................................................................ 37
8.3 Sales volume forecasting assumptions..................................................................................... 38 8.3.1 Gross domestic product (GDP) ............................................................................................ 39 8.3.2 Commodity prices ................................................................................................................ 39 8.3.3 Price elasticity ...................................................................................................................... 41 8.3.4 Furnace load reduction in winter .......................................................................................... 41 8.3.5 Energy Efficiency Demand Side Management (EEDSM) savings....................................... 41 8.3.6 Weather conditions .............................................................................................................. 41

CONTENTS
Eskom Holdings Revenue Application FY2018/19 Page: 3
8.4 Forecasted sales for the application .......................................................................................... 42
8.5 Under-recovery of allowed revenue in MYPD3 ......................................................................... 45
8.6 Initiatives to grow sales volumes ............................................................................................... 47
8.7 Debt owing to Eskom ................................................................................................................... 48 8.7.1 Strategies to improve debt collections ................................................................................. 49 8.7.2 Arrear Debts ......................................................................................................................... 49
9 Production Plan ............................................................................................................................ 50
9.1 Background to the production plan ........................................................................................... 50
9.2 Production Plan Assumptions .................................................................................................... 51 9.2.1 The Energy Forecast ........................................................................................................... 51 9.2.2 Eskom Generation Capacity ................................................................................................ 51 9.2.3 Plant performance data ........................................................................................................ 52 9.2.4 Non-Eskom Generation ....................................................................................................... 52
9.3 Production Planning Process ..................................................................................................... 52 9.3.1 Base load ............................................................................................................................. 53 9.3.2 Gas Turbines ....................................................................................................................... 53 9.3.3 Pumped Storage .................................................................................................................. 54 9.3.4 Hydro .................................................................................................................................... 54
9.4 Production plan results ............................................................................................................... 55
9.5 Energy Losses .............................................................................................................................. 55
10 Cost of Capital .............................................................................................................................. 57
11 Regulated Asset Base.................................................................................................................. 59
12 Return of Assets ........................................................................................................................... 60
13 Depreciation .................................................................................................................................. 62
14 Capital Expenditure...................................................................................................................... 63
15 Primary Energy ............................................................................................................................. 65
15.1 Overall summary of primary energy ....................................................................................... 65
15.2 Independent Power Producers (IPPs) .................................................................................... 67 15.2.1 IPP summary ....................................................................................................................... 68
15.3 International purchases ........................................................................................................... 70
15.4 Eskom own primary energy market overview ....................................................................... 70 15.4.1 Overview of the Primary Energy Business Environment ..................................................... 70 15.4.2 Key elements of Eskom strategy in response to trends and market forces ........................ 72 15.4.3 Coal Supply to meet Coal Burn requirements ..................................................................... 73 15.4.4 Annual coal purchases costs ............................................................................................... 75 15.4.5 Detailed coal burn costs ....................................................................................................... 77 15.4.6 Transport Costs ................................................................................................................... 78 15.4.7 Coal Stock ............................................................................................................................ 80
15.5 Water costs ............................................................................................................................... 80 15.5.1 Key drivers for water costs................................................................................................... 80
15.6 Sorbent ...................................................................................................................................... 81
15.7 Nuclear fuel ............................................................................................................................... 82 15.7.1 Nuclear Fuel Price ............................................................................................................... 82 15.7.2 Fuel burnt ............................................................................................................................. 83 15.7.3 Nuclear Other ....................................................................................................................... 84
15.8 Open Cycle GasTurbines (OCGTs) ......................................................................................... 84 15.8.1 Decision Making Criteria ...................................................................................................... 84

CONTENTS
Eskom Holdings Revenue Application FY2018/19 Page: 4
15.9 Start-up fuel ............................................................................................................................... 85
15.10 Water treatment ........................................................................................................................ 85
15.11 Coal Handling ............................................................................................................................ 86
15.12 Environmental levy ................................................................................................................... 86 15.12.1 Environmental levy payment ................................................................................................ 86 15.12.2 Equivalent Revenue from Environmental Levy .................................................................... 87
16 Operating Cost ............................................................................................................................. 88
16.1 Overall summary of operating costs ...................................................................................... 88
16.2 Employee Benefits.................................................................................................................... 90 16.2.1 Staff complement ................................................................................................................. 90 16.2.2 Employee benefits increases ............................................................................................... 90 16.2.3 Level of remuneration .......................................................................................................... 92 16.2.4 Total Employee benefit costs ............................................................................................... 93
16.3 Operating and Maintenance costs .......................................................................................... 94 16.3.1 Generation maintenance...................................................................................................... 94 16.3.2 Transmission ........................................................................................................................ 95 16.3.3 Distribution ........................................................................................................................... 95
16.4 Other Operating Expenses ...................................................................................................... 96
16.5 Integrated Demand Management ............................................................................................ 97 16.5.1 IDM Programmes ................................................................................................................. 98 16.5.2 IDM COSTS ......................................................................................................................... 98 16.5.3 Summary of Savings ............................................................................................................ 99 16.5.4 Summary of Costs ............................................................................................................... 99
16.6 Research, Testing and Demonstration ................................................................................. 100
16.7 Insurance ................................................................................................................................. 101 16.7.1 Methods used to determine insurance premiums .............................................................. 101 16.7.2 Nuclear Insurance .............................................................................................................. 102 16.7.3 Engineering Risk Surveys .................................................................................................. 102 16.7.4 Value of ESCAP as a Primary Insurer ............................................................................... 102
17 Credit Ratings Overview ............................................................................................................ 104
17.1 Impact of credit rating on funding ........................................................................................ 104
18 Economic Landscape Changes ................................................................................................ 106
18.1 Economic Impact Study ......................................................................................................... 106
18.2 Economic Landscape Changes ............................................................................................ 106 18.2.1 Overview of historical trend in electricity consumption in South Africa ............................. 106 18.2.2 Trend in electricity prices ................................................................................................... 107 18.2.3 International competiveness of SA electricity tariffs .......................................................... 108 18.2.4 Requirements of an efficient electricity pricing regime ...................................................... 109
18.3 Macroeconomic impacts of alternative scenarios .............................................................. 110 18.3.1 Background and context .................................................................................................... 110 18.3.2 Aim of the study ................................................................................................................. 112 18.3.3 Key scenario assumptions, and scenarios modelled ......................................................... 112 18.3.4 Interpreting results of hypothetical scenarios – particularly post-downgrade .................... 115 18.3.5 Approach ............................................................................................................................ 116 18.3.6 Key findings and results ..................................................................................................... 116
18.4 Concluding remarks ............................................................................................................... 122
19 National Treasury and SALGA responses ............................................................................... 126
19.1 Summary of key responses provided by National Treasury as part of consultation process 126
CONTENTS
Eskom Holdings Revenue Application FY2018/19 Page: 5
19.1.1 Period of the MYPD submission ........................................................................................ 126 19.1.2 Economy-wide impacts of the proposed tariff .................................................................... 126 19.1.3 Sales volume assumptions ................................................................................................ 130 19.1.4 Regulatory Clearing Account ............................................................................................. 132 19.1.5 Primary energy ................................................................................................................... 132 19.1.6 Operating expenditure ....................................................................................................... 132 19.1.7 Corporate Social Investment ............................................................................................. 133 19.1.8 Regulatory asset base ....................................................................................................... 133 19.1.9 Independent Power Producers .......................................................................................... 133
19.2 Summary of SALGA responses related to the 2018/19 Revenue Application ................. 134 19.2.1 Impact on economy and affordability ................................................................................. 134 19.2.2 Impact of sales volume ...................................................................................................... 135 19.2.3 Operating costs .................................................................................................................. 136 19.2.4 Primary energy costs ......................................................................................................... 137 19.2.5 Transmission capital costs ................................................................................................. 138 19.2.6 Impact of credit rating ........................................................................................................ 138 19.2.7 Renewables ....................................................................................................................... 139 19.2.8 Economic Activity to be improved ...................................................................................... 141 19.2.9 Impact on Municipal Debt .................................................................................................. 142
20 Revenue requirements for licensees ....................................................................................... 144
20.1 Generation allowable revenue ............................................................................................... 144
20.2 Distribution allowable revenue ............................................................................................. 145
20.3 Transmission allowable revenue .......................................................................................... 146
21 Conclusion .................................................................................................................................. 147
22 Appendix 1 - Coal Burn Costs .................................................................................................. 149
22.1 Coal Burn Costs and Volume(Kt) per Power Station .......................................................... 149 22.1.1 Explanation of Coal Burn Costs ......................................................................................... 150 22.1.2 The treatment of opening stock in the first year................................................................. 151 22.1.3 Coal burn............................................................................................................................ 151 22.1.4 Closing stock ...................................................................................................................... 151 22.1.5 Adjustments to stock .......................................................................................................... 151
22.2 Coal Purchase Ratio used to calculate coal burn per contract type ................................. 151
22.3 Coal cost escalation assumption for FY 2019 ..................................................................... 151
22.4 Coal stockpile volumes .......................................................................................................... 152
22.5 Rail transport indices and escalations ................................................................................. 152
22.6 Road transport indices and escalations .............................................................................. 153
23 Appendix 2 – Coal handling Costs ........................................................................................... 154
23.1 Coal handling costs................................................................................................................ 154
23.2 The major cost drivers for coal handling ............................................................................. 154 23.2.1 Labour ................................................................................................................................ 154 23.2.2 Yellow and white plant description and functions: ............................................................. 154
23.3 Coal handling costs per power station ................................................................................ 155
23.4 Coal handling costs per cost driver ..................................................................................... 156
24 Appendix 3 – Water Costs ......................................................................................................... 157
24.1 Water Volumes (ML) ............................................................................................................... 158
24.2 Major Water Schemes and Contracts ................................................................................... 158
25 Appendix 4 – Water treatment costs ........................................................................................ 162
25.1 Water Treatment Cost per process ....................................................................................... 163
CONTENTS
Eskom Holdings Revenue Application FY2018/19 Page: 6
25.2 Cost of water treatment materials/chemicals ...................................................................... 163
LIST OF TABLES
Table 1 : Total Allowable Revenue for 2018/19 ................................................................................. 10
Table 2: Revenue Recovery................................................................................................................ 14
Table 3 : Standard tariff price increase ............................................................................................... 14
Table 4: Allowable Revenue ............................................................................................................... 28
Table 5: Revenue Recovery................................................................................................................ 28
Table 6 : Sales volume rebasing in 2018/19 ....................................................................................... 31
Table 7: Standard tariff category increases ........................................................................................ 35
Table 8: Sales volumes forecasts ....................................................................................................... 36
Table 9: Gross domestic product (GDP) forecasts ............................................................................. 39
Table 10: Commodity prices ............................................................................................................... 40
Table 11: EEDSM forecasts ................................................................................................................ 41
Table 12: Forecasted sales volumes .................................................................................................. 42
Table 13: Sales Categories ................................................................................................................. 43
Table 14: Generation Technical Performance Plan ............................................................................ 52
Table 15 : Details of production plan .................................................................................................. 55
Table 16 : Cost of Capital .................................................................................................................... 57
Table 17 : Regulatory Asset Base (RAB) ............................................................................................ 59
Table 18 : Licensee breakdown of RAB .............................................................................................. 59
Table 19 : Escalating debt despite receiving prices increases ........................................................... 60
Table 20 : Return on assets ................................................................................................................ 61
Table 21 : Depreciation ....................................................................................................................... 62
Table 22 : Capital Expenditure ............................................................................................................ 63
Table 23 : Detailed primary energy cost ............................................................................................. 67
Table 24 : Summary of IPPs ............................................................................................................... 68
Table 25: Co-generation expected energy and costs ......................................................................... 70
Table 26 : International purchase volumes ......................................................................................... 70
Table 27 : Koeberg nuclear fuel costs ................................................................................................ 83
Table 28 : OCGTs declining usage ..................................................................................................... 85
Table 29 : Environmental levy ............................................................................................................. 87
Table 30 : Detailed Operating costs .................................................................................................... 89
Table 31 : Employee costs .................................................................................................................. 91
Table 32 : Employee benefits increases compared to inflation .......................................................... 92
Table 33: IDM Programme Savings ................................................................................................... 99
Table 34: IDM Programme Costs ....................................................................................................... 99
Table 35: IDM Total Costs .................................................................................................................. 99

CONTENTS
Eskom Holdings Revenue Application FY2018/19 Page: 7
Table 36: KEY Planned Research Projects for Application year ...................................................... 100
Table 37 : Generation Allowable Revenue ....................................................................................... 144
Table 38 : Distribution allowable revenue ......................................................................................... 145
Table 39 : Transmission allowable revenue ...................................................................................... 146
Table 40: Assumed Coal Burn Costs per Power Station .................................................................. 149
Table 41: Coal Burn volume (Kt) per Power Station ......................................................................... 150
Table 44: Volume of coal on stockpile (tonnes) ................................................................................ 152
Table 45: Escalation Components for fy18 ....................................................................................... 153
Table 46: Road Transport Indices and escalations .......................................................................... 153
Table 49: Yellow and White Plant Description and Functions .......................................................... 155
Table 50: Coal Handling Costs per Power Station............................................................................ 155
Table 51: Coal handling costs per cost driver ................................................................................... 156
Table 52: Water Costs per Power Station ......................................................................................... 157
Table 53: Water Volumes per power station .................................................................................... 158
Table 54: Water Schemes and Power Stations Supplied ................................................................. 159
Table 56: Water Treatment Costs per Power Station ....................................................................... 162
Table 57: Water Treatment cost per process .................................................................................... 163
LIST OF FIGURES
Figure 1 : Operating costs breakdown ................................................................................................ 12
Figure 2: Illustrative Daily Load in 2020 .............................................................................................. 21
Figure 3: Actual Total Weekly Energy Sent-out .................................................................................. 22
Figure 4: Total Daily Energy Sent out ................................................................................................. 22
Figure 5: Actual Total Weekly Energy Sent-out .................................................................................. 23
Figure 6: Total Daily Energy Sent out ................................................................................................. 23
Figure 7: Actual Total Weekly Energy Sent-out .................................................................................. 23
Figure 8: Total Daily Energy Sent out ................................................................................................. 23
Figure 9: Actual Total Weekly Energy Sent-out .................................................................................. 23
Figure 10: Total Daily Energy Sent out ............................................................................................... 23
Figure 11 : Energy wheel 2017/18 ...................................................................................................... 25
Figure 12 : Energy wheel 2018/19 ...................................................................................................... 26
Figure 13 : Total revenue growth of r14.3 billion ................................................................................ 29
Figure 14 : Factors impacting on price increase ................................................................................. 30
Figure 15: Tariff calculation process ................................................................................................... 33
Figure 16: Inclining block tariff structure ............................................................................................. 34
Figure 17: 2015/16 Number of Customers and Contribution to Total Sales ....................................... 38
Figure 18 : Historic commodity price levels ........................................................................................ 40
Figure 19: Eskom sales volume gap over mypd3 ............................................................................... 44

CONTENTS
Eskom Holdings Revenue Application FY2018/19 Page: 8
Figure 20 : under-recovery of allowed revenue .................................................................................. 46
Figure 21: local demand stimulation- key elements ............................................................................ 48
Figure 22: Production planning methodology ..................................................................................... 53
Figure 23: Production Plan.................................................................................................................. 55
Figure 24 : Primary energy cost escalations ....................................................................................... 66
Figure 25 : Graphic analysis of primary energy costs ......................................................................... 66
Figure 26 : IPP mix over MYPD3 period ............................................................................................. 68
Figure 27: Primary energy value chain ............................................................................................... 71
Figure 28: Challenges facing Primary Energy Division ....................................................................... 71
Figure 29: Planned Coal Supply (Mt) .................................................................................................. 74
Figure 30: Annual coal expenditure per supply source ....................................................................... 76
Figure 31: Average delivered R/ton coal cost ..................................................................................... 77
Figure 32: Planned logistics modes and costs for long and medium term sources ............................ 79
Figure 33 : trends in operating costs ................................................................................................... 88
Figure 34 : Level of remuneration ....................................................................................................... 93
Figure 35 : Employee benefits and staff complement ......................................................................... 93
Figure 36: Summary of scenarios modelled ..................................................................................... 115
Figure 37: Foreign currency rating vs. interest payment burden ...................................................... 116
Figure 38: Impact on trend in real GDP and employment growth – 1A, 1B, 3A relative to BAU1 and BAU2 ................................................................................................................................................. 118
Figure 39 Impact on government debt-to-GDP ratio - 1A, 1B, 3A relative to BAU1 and BAU2 ....... 119
Figure 40: Average BW Price REIPPP ............................................................................................. 140
Figure 41: Integrated Vaal River System (IVRS) .............................................................................. 160

Preface
Eskom Holdings Revenue Application FY2018/19 Page: 9
Preface
The revenue application for the 2018/19 financial year is submitted to NERSA after
receiving comments from National Treasury and organised local Government (SALGA) in
terms of section 42 of the Municipal Finance Management Act (MFMA). It is understood
that the National Energy Regulator (NERSA), will use this submission as part of its public
consultation process affording opportunities to stakeholders to comment on the application.
This revenue application has been prepared in accordance with MYPD methodology as
published by NERSA during October 2016. Due to uncertainty in the environment
presently, NERSA has approved that Eskom can make a revenue application for the
2018/19 financial year only. The revenue application has been updated in accordance with
the NERSA decision on the request for condonation. Assumptions, as guided by NERSA,
have been made to provide details. Thus the NERSA revenue and tariff decisions will be
implemented for the period 1 April 2018 to 31 March 2019 for non-municipal customers and
from 1 July 2018 to 30 June 2019 for municipal customers. The five year MYPD 3 period
was applicable for the period 1 April 2013 to 31 March 2018 for the non-municipal
customers and 1 July 2013 to 30 June 2018 for municipal customers.
The MYPD methodology addresses two broad aspects, namely, the MYPD allowed
revenue application and the adjustment of the allowed revenue through the regulatory
clearing account (RCA) process. The focus of this application is the MYPD revenue
application for the 2018/19 financial year. It is clarified that this revenue application does
not include any RCA adjustments. Once NERSA has determined the allowed revenue in
terms of the MYPD methodology, the tariffs and price adjustments are calculated in terms
of the Eskom retail tariff and structural adjustment (ERTSA) methodology, as published by
NERSA during March 2016. The tariffs and price adjustments are then approved by
NERSA. This application does not include any RCA adjustments.

Executive Summary
Eskom Holdings Revenue Application FY2018/19 Page: 10
Executive Summary
This revenue application is being made for the year 2018/19, after the Energy Regulator
maintained its revenue decision made in 2013 for the 2017/18 year, where it approved the
total allowable revenue of R205 billion. The allowed revenue resulted in an average
increase of 2.2% due to the base adjustments made in the preceding years following the
approved Regulatory Clearing Account (RCA) balances for Eskom (12.69% for 2015/16 for
MYPD2 and 9.4% for 2016/17 for the first year of MYPD3).
The 2.2% average increase resulted in consumers receiving an effective decrease in
electricity prices, in a situation where costs to produce the electricity are increasing.
Inflation related increases were not catered for. It is thus demonstrated that there would be
a marked jump in electricity prices in the 2018/19 year partly due to the increases from an
artificially low base and would not allow for smoothing of price increases. It would have a
compounding effect over a number of years.
NERSA has approved that Eskom could submit a one year revenue application for the
2018/19 year. Eskom, in this revenue application for the 2018/19 year has applied the
NERSA MYPD methodology of 2016, with a phasing in of return on assets being applied,
resulting in a total allowable revenue of R219 514m. The building blocks for the revenue
application, in accordance with the MYPD methodology are reflected in the summary table
below.
TABLE 1 : TOTAL ALLOWABLE REVENUE FOR 2018/19
Note – there are no RCA adjustments in the 2018/19 revenue application
Allowable Revenue (R'millions) AR FormulaApplication
2018/19
Regulated Asset Base (RAB) RAB 763 589
WACC % ROA X 2.97%
Returns 22 690
Expenditure E + 62 221
Primary energy PE + 59 340
IPPs (local) PE + 34 209
International purchases PE + 3 216
Depreciation D + 29 140
IDM I + 511
Research & Development R&D + 193
Levies & Taxes L&T + 7 994
RCA RCA +
Total Allowable Revenue R'm 219 514
Executive Summary
Eskom Holdings Revenue Application FY2018/19 Page: 11
1.1 Key elements of allowed revenue for the 2018/19 financial year
Eskom’s allowed revenue requirement is based on the Electricity Regulation Act, 2006 (Act
No.4 of 2006), Section 15(1) which states:
• Must enable an efficient licensee to recover full cost of its licensed activities, including
a reasonable margin or return
This basis is reinforced in the Electricity Pricing Policy and the MYPD Methodology.
1.2 Recovery of efficient costs
a. Primary Energy costs:
Primary energy costs equate to the costing of the electricity supply required to meet
demand. The three sources of electricity supply are Eskom own generation, domestic
independent power producers (IPPs) and regional imports.
Due to the roll out of DOE renewable IPP progammes up to bid window 4.5, local IPPs
have grown over the last few years. International supply is represented substantially by the
supply from Cahorra Bassa reflecting declining trend recently attributable to the drought
conditions. Eskom’s own generation is used to meet the balance of supply as renewables
are non-dispatchable. The expected revenue requirement related to the renewable IPP
programme is R31 230m for the 2018/19 financial year. The DOE Peaker programme has
been fully operational from 20 July 2016 with a total capacity of 1005 MW. The expected
load factor of the two power stations (as dispatched by Eskom) is 1% in each year, leading
to an expected energy output of 88 GWh per year. The allowed revenue related to these
IPPs is R2 380m for the application year.
Eskom prefers to contract for coal on long term contracts. However, it is not possible to
contract for all of Eskom’s coal requirements on long term contracts. It is prudent to have a
portfolio of coal supply agreements that allows flexibility to meet changing electricity
demand patterns. The largest component of the projected annual coal costs is the costs
from existing and new long term coal sources. This is in line with the first principle of the
long term coal supply strategy, namely, securing long term contracts with mines close to
power stations.
The compound average annual increase in the delivered R/ton cost of coal between the
FY17-FY19 period is ~5%. The average increase in R/ton cost from the three main contract
types is:

Executive Summary
Eskom Holdings Revenue Application FY2018/19 Page: 12
Cost plus mines: 1%
Long term fixed price mines: 13%
Short/medium term fixed price contracts: 7%
Cross border purchases from substantially Cohorra Bassa will cost approximately R3.2bn.
An amount of R8bn is the allowed revenue related to environmental levy costs based on a
rate of 3.5c/kWh energy generated. It is assumed for the planning period that no further
rate increases will occur. This environmental energy revenue is paid to SARS.
b. Operating costs:
Operating expenses are expected to escalate on a year on year basis from 2016/17 at less
than inflation. Almost half of the operating cost is attributable to employee benefits (46%)
with the maintenance (29%) and other opex (25%) making up the remainder.
FIGURE 1 : OPERATING COSTS BREAKDOWN
It is expected that employee costs will increase by inflation when compared to projections
for 2017/18. Significant efficiencies would be achieved over the period by reducing the
number of employees without compromising the required skills in appropriate areas.
Eskom’s employee benefit escalations are compared to the overall generic labour market.
However the bargaining unit element is referred to as the average settlements. The
employee benefits comprised the direct remuneration (salary, pension, medical aid, bonus,
overtime) and indirect remuneration (training and development, temporary and contract

Executive Summary
Eskom Holdings Revenue Application FY2018/19 Page: 13
staff). Eskom’s total labour costs escalations over the last 5 years has tracked the market
escalations.
As the business strives to accelerate maintenance programmes, and with the aging plant it
is expected that maintenance costs should increase. Eskom will ensure that maintenance is
carried out prudently and efficiently.
The growth in other operating costs is less than inflation after 2016/17. Included in this
category are costs such as insurance, information technology, fleet costs, legal and audit
services, security, travel expenses, billing costs, connection/disconnection costs, meter
reading, vending commission costs and telecoms.
1.3 Earning a reasonable return on assets
Return on assets is computed on a revalued regulatory asset base (RAB) with the intention
to cover interest costs and earn an equity return. The regulatory mechanism is based a pre-
tax real return as interest and tax are not separate line items in the allowable revenue
formula. The opening RAB balance for FY2019 is based on the MYPD 3 decision which is
then adjusted for the latest capital expenditure forecasts for the period FY2014 to FY2018.
The average RAB value for FY2019 is R764bn.
Eskom has maintained the principle to phase-in the return on assets as the full return on
assets will place further upward pressure on the electricity price. Thus this revenue
application for 2018/19 assumes a return on assets at 2.97% (amounting to R22.7bn)
compared to a cost of capital of 8.4%.
Depreciation was computed by dividing the RAB over the remaining life of the respective
assets. A depreciation cost of R29bn has remained relatively similar to 2017/18 cost as the
RAB has not changed significantly and in accordance with the methodology.
1.4 Revenue recovery
Eskom’s Company revenue is recovered from international customers, negotiated pricing
agreement (NPA) customers, with the balance from standard tariff customers.

Executive Summary
Eskom Holdings Revenue Application FY2018/19 Page: 14
TABLE 2: REVENUE RECOVERY
The growth in total allowed revenue from FY2017/18 to FY2018/19 is 7% with the
contribution being almost 50:50 split between standard tariff revenue and non-standard
tariff revenue. Standard tariff consumers are required to contribute R7.2 billion (3.6%) more
when compared to the 2017/18 decision. Eskom’s strategy to maximise export sales and
revenue impacts positively on the balance required from standard tariff customers.
However, the price impact would be much higher due to the allowed revenue being
recovered from a lower sales volume. The impact on the electricity price due to the extent
of the drop in volumes when compared to the MYPD3 over 5 years of some 30 TWh is
9.4% in 2018/19.
1.5 Electricity price impact in 2018/19
Standard tariff revenue has increased by R7 251 million which equates to revenue increase
of 3.6% from NERSA’s decision for the 2017/18 year. As the revenue is recouped from a
lower sales volume, the overall price increase required is 19.9% for 2018/19. Two major
contributors to the price increase are the sales volume rebasing (9.4% price impact) and
growth in IPPs (5.5% price impact).
TABLE 3 : STANDARD TARIFF PRICE INCREASE
The 19.9% average increase translates to a 1 July 2018 local-authority tariff increase of
27.5% to municipalities. Municipalities continue to pay at the 2017/18 rates for the period
1 April 2018 to 30 June 2018. This is due to the Municipal Finance Management Act
(MFMA) requiring Municipal tariff changes to be made only from 1 July each year.
Revenue recovery (R'millions)MYPD 3
2017/18
Application
2018/19Change % growth
NPA and International customers 6 259 13 309 7 050 112.6%
Standard tariff customers 198 954 206 205 7 251 3.6%
Total Allowable Revenue 205 213 219 514 14 301 7.0%
Standard tariff price impact Unit
MYPD3
Decision
2017/18
Application
2018/19
Standard tariff revenue R'm 198 954 206 205
Standard tariff sales volumes GWh 223 217 192 953
Standard tariff price c/kWh 89.13 106.87
Standard tariff price adjustments % 2.2% 19.9%

Basis of Application
Eskom Holdings Revenue Application FY2018/19 Page: 15
2 Basis of Application
2.1 Legislative and regulatory framework
The adherence to many related legislative, regulatory and license requirements form the
basis of the MYPD application. The following are applicable to the determination of Eskom’s
allowed revenue and resulting tariff adjustments.
2.1.1 Electricity Regulation Act (Act No. 4 of 2006)
Prescribes tariff principles including:
• Revenues enabling an efficient licensee to recover the full cost of its licensed activities,
including a reasonable margin or return;
• Avoidance of undue discrimination between customer categories;
• Permitting the cross subsidy of tariffs to certain classes of customers by the Energy
Regulator;
• Approval of tariffs by the Energy Regulator
2.1.2 Electricity Pricing Policy
EPP gives broad guidelines to the Energy Regulator in approving prices and tariffs for the
electricity supply industry.
2.1.3 Municipal Finance Management Act (Act 56 OF 2003)
Eskom is required to take into account comments from the National Treasury and organised
local government on the draft revenue application. The revenue application should include a
motivation for adjustment of tariffs; consideration of impact on inflation targets and other
macroeconomic policy objectives; Eskom’s efficiency improvements and objectives. The
need to timeously table approved adjusted tariffs in Parliament for implementation for
Municipal customers. This process has been undertaken and responses have been
considered in the finalisation of this revenue application.
2.1.4 Multi-Year Price Determination (MYPD) Methodology
The revenue application is based on the requirements of the MYPD methodology as
published by NERSA during October 2016. The MYPD methodology addresses two broad

Basis of Application
Eskom Holdings Revenue Application FY2018/19 Page: 16
aspects, namely, the MYPD allowed revenue application and the adjustment of the allowed
revenue through the regulatory clearing account (RCA) process. The focus of this
application is the MYPD revenue application for the 2018/19 financial year. It is clarified
that this revenue application does not include any RCA adjustments. As decided by
NERSA, Eskom has made assumptions to meet the requirements of the MYPD
methodology.
2.1.4.1 Focus is the revenue application for the 2018/19 financial year
Eskom’s MYPD 3 cycle comes to an end on 31 March 2018. This necessitates NERSA to
make a further revenue determination in accordance with its mandate. On 31 October 2016,
Eskom requested NERSA that only a single year application is to be made (as opposed to a
multi-year application). On 23 February 2017, the Energy Regulator approved that Eskom
will submit a revenue application for a single year for the period 1 April 2018 to 31 March
2019.
2.1.4.2 Application does not include RCA adjustments
On 23 February 2017, the Energy Regulator decided that “NERSA is unable to process RCA
applications until its appeal on the Gauteng High Court decision has been heard and
decided upon”. Since then, the appeal was heard by the Supreme Court of Appeal on 4 May
2017 and an order where the appeal was upheld was made on 6 June 2017. An appeal of
this decision to the Constitutional Court was not granted. Eskom will await guidance from
NERSA with regards to the processing of already submitted and further RCA submissions.
It is clarified that Eskom has not applied for any RCA adjustments in this revenue
application. The RCA process is backward looking and allows for adjustment of future tariffs
to address past variances (in accordance with the MYPD methodology) between the
revenue decision and the actuals that panned out. When a new MYPD revenue application
is made, it is forward looking and based on projected assumptions.
2.1.5 Eskom retail tariff and structural adjustment (ERTSA) methodology
Once NERSA has approved the allowed revenue for a particular cycle in terms of the MYPD
methodology, the ERTSA methodology is applied annually. The ERTSA allows for rate
adjustments to tariffs applicable to the customer groups and schedule of standard prices
applicable to the different Eskom tariffs for each year of the MYPD period.

Basis of Application
Eskom Holdings Revenue Application FY2018/19 Page: 17
An indication of the impact on tariffs to the customer categories will be included in the
revenue application document. NERSA will first approve the allowed revenue for Eskom,
which will then be used to finalise the Eskom Schedule of Standard prices in accordance
with the ERTSA methodology.

Changes in landscape with regards to supply demand balance
Eskom Holdings Revenue Application FY2018/19 Page: 18
3 Changes in landscape with regards to supply demand balance
3.1 Medium term system adequacy outlook
Around the time that the MYPD 3 application was being prepared by Eskom, the prevailing
demand-supply balance was described in the 2010 Medium term risk mitigation project for
electricity in South Africa (included as part of the IRP 2010). The risk of load shedding was
significant unless extra-ordinary steps were taken to accelerate the realisation of a range of
supply and demand side measures as set out by this project. The base case outlook up to
2016, based on the IRP 2010 moderate demand scenario, suggested a high likelihood that
there will be an energy supply shortfall over the period until 2015. The supply/demand
balance will be tightest during 2011-2012 as additional supply options are relatively limited
until new build capacity starts to come on stream. The base case forecasted a supply
shortfall of 9 TWh of energy in 2012, which is comparable to the energy produced by ~1000
MW of base-load capacity in a year.”
Since 2010, medium term outlooks (MTO) have been determined by Eskom during the
period 2014 to 2016. The MTO provides an adequacy assessment of South Africa’s
electricity supply system in the medium term. The method to assess the system adequacy
uses an hourly optimisation tool that balances energy demand from existing and committed
generation capacity. The system’s adequacy to meet the demand is then measured against
the Generation Adequacy Metrics where any violations to the adequacy metric are identified
as supply shortfall and quantifies how much capacity (MW) is needed to restore the system
to acceptable reliability as defined by the adequacy metrics.
With particular assumptions made on demand, generation performance and new build
delivery dates, the following trends were identified:
2014: The system will be constrained and will continue to be challenged until the
commercial operation of new build units and improvements in plant performance are
achieved.
2015: The commissioning of new builds on schedule will not be enough to restore the
system to adequacy if plant performance deteriorates. It further shows that worsening
plant performance has the biggest impact on the gap sizes.

Changes in landscape with regards to supply demand balance
Eskom Holdings Revenue Application FY2018/19 Page: 19
2016: The system is adequate from 2018 and can then accommodate a medium to high
growth in demand. Based on a high demand growth and low plant performance scenario,
there would be a requirement for additional capacity in all years for an adequate system.
However, it is unlikely that a high growth in demand is sustainable.
As can be summarised from the above trends, based on particular assumptions, the 5 year
horison has shown a trend from a significant gap in 2010 to an adequate system in 2016.

Generation landscape
Eskom Holdings Revenue Application FY2018/19 Page: 20
4 Generation landscape
The improved performance of the power generating units coupled with additional capacity
from some of the new build projects has resulted in a stable power system, with excess
capacity being exported to neighbouring countries. Unit 6 of Medupi Power Station has been
in commercial operation since August 2015. Medupi Unit 5 became commercially operational
during April 2017. Good progress is also being made on Unit 4 of Medupi. The Kusile Power
Station project is making substantial strides. Unit 1 continues to achieve fixed milestones, on
the path to commercial operation by August 2017. Following the success of the maintenance
plan, Eskom has delivered on focused areas for the past year, with no load shedding and
load curtailment of key customers since August 2015.
Eskom is moving from a period of a severely constrained environment to one of adequate or
even excess capacity. The reasons for this include improved generating plant availability,
low demand growth and the introduction of new capacity, both Eskom and IPPs. The
significant drop in the sales assumed during the MYPD 3 application and what has
materialised is addressed in the sales forecast section. In essence the sales have remained
fairly static from the beginning of the MYPD 3 period. The Eskom generating plant
availability has improved over the last year. The details are provided in the operating costs
section. The availability of new generating capacity from Eskom plant and IPPs are
discussed as part of the capital expenditure and IPP sections respectively. This situation is
expected to allow for the plant to be operated at lower utilisation factors, thus reducing stress
on plant components and systems and will also provide adequate space for all required
maintenance without the risk of load shedding.
This will also allow for least-cost merit order production to be followed more often (within
various constraints, such as network stability), thus focussing the burn on the cheaper
stations and reducing burn at the more expensive stations and reducing overall primary
(coal) energy costs.
At the same time, other challenges are introduced or exacerbated. Lower loads often mean
that, particularly, at night, less generation is required. This means that some units either
have to be shut down during these low load periods or else a number of units are required to
operate stably at very low power levels. Shutting down units at night and restarting for the
morning when demand picks up is known as “two-shifting” and this places enormous
stresses in many of the plants’ systems leading to increasingly degraded performance.

Generation landscape
Eskom Holdings Revenue Application FY2018/19 Page: 21
Shutting down units for longer periods also requires various interventions to ensure that
damage does not occur during this off-period and that the unit is available when required
again. In the case of operating at low power levels, various interventions, ranging from
operating procedure changes to major plant modifications may be required in order to
ensure that the unit can operate stably at these power levels.
Another challenge that will become increasingly important as the amount of capacity from
renewable generation sources increases is related to the “duck curve”, an illustrative
example of which is shown below.
FIGURE 2: ILLUSTRATIVE DAILY LOAD IN 2020
Solar PV and wind, in particular, are considered to be non-dispatchable generation sources.
This means that the system operator cannot call on them as required, but has to run them
when available. However, their energy is only available when the sun shines or when the
wind blows. If we subtract the energy provided by wind and solar from the total load, we get
the net load – the green curve in the illustrative example above. Here it can be seen that the
slope of this net load is much steeper than that of the total load (blue curve) and the
difference between the peaks and minimum load is greater. This exacerbates the challenge,
as mentioned above, of having adequate capacity to meet the evening peak at the same
time as being able to reduce generation significantly during the low loads at night. In
addition, the steeper slope of the curve means that, stations need to be able to both increase
and decrease power levels faster than before. Certain stations can achieve this more easily

Generation landscape
Eskom Holdings Revenue Application FY2018/19 Page: 22
than others and many will again require interventions ranging from procedural updates to
plant modifications.
A depiction of South Africa’s experience since 2014 to the 2017 calendar years is reflected
in the figures below. Please note
Dispatchable generation includes all Eskom generation, international imports, as well as
generation from Dispatchable IPPs (i.e. Avon and Dedisa at this stage).
Non-dispatchable generation refers to all generation that is self-dispatched. At this stage
it includes all Renewable IPPs and conventional IPPs (WEPS, STPPP, MTPPP). Note
that WEPS, STPPP and MTPPP contracts were discontinued from 1 April 2017.
Only energy sent-out (GWh) is shown
All calculations are for calendar years (01 Jan to 31 Dec).
The figures on the left hand side reflect the actual total weekly energy sent-out – which is
dispatchable and non-dispatchable (top of orange line) and the dispatchable generation
(black line). The figures on the right hand side reflect the total daily energy sent out from
both dispatchable and non-dispatchable generators (red line) and energy sent out from only
dispatchable generators (blue line).
2014
FIGURE 3: ACTUAL TOTAL WEEKLY
ENERGY SENT-OUT
FIGURE 4: TOTAL DAILY ENERGY SENT OUT
2015

Generation landscape
Eskom Holdings Revenue Application FY2018/19 Page: 23
FIGURE 5: ACTUAL TOTAL WEEKLY
ENERGY SENT-OUT
FIGURE 6: TOTAL DAILY ENERGY SENT OUT
2016
FIGURE 7: ACTUAL TOTAL WEEKLY
ENERGY SENT-OUT
FIGURE 8: TOTAL DAILY ENERGY SENT OUT
2017
FIGURE 9: ACTUAL TOTAL WEEKLY
ENERGY SENT-OUT
FIGURE 10: TOTAL DAILY ENERGY SENT
OUT
As is evident, from 2014 to 2017 (year to date) the contribution from renewables has been
increasing over the years.
In addition, there is a widening gap during the day which closes during the peaks and night
when Eskom generation is required as a result of Solar not being available except for
Generation landscape
Eskom Holdings Revenue Application FY2018/19 Page: 24
Concentrated Solar Power (CSP) with storage (anything between 10MW and 150MW) and
wind (anything between 0MW and 950MW).
Thus the challenges related to the duck curve are being experienced already. This
phenomenon will be further addressed in subsequent revenue submissions.

Energy Wheel
Eskom Holdings Revenue Application FY2018/19 Page: 25
5 Energy Wheel
The energy forecast is the starting point of the production planning process. The source of
the forecast is the Eskom Energy Wheel diagram which provides total projected Eskom
sales. The Energy Wheel diagram forecast provides energy forecast which is made up of
Distribution and Transmission national sales, Export sales, Transmission and Distribution
losses. This energy forecast has been discounted of impact of demand side management
options.
The energy wheel shows the volume of electricity that flowed from local and international
power stations and independent power producers (IPPs) to Eskom’s distribution and export
points during, including the losses incurred in reaching those customers. Supply electricity
sources are captured in the top half the energy wheel figure, while sales and losses are
included in the bottom portion of the energy wheel figure.
The energy wheel for the projection year 2017/18 is presented below.
FIGURE 11 : ENERGY WHEEL 2017/18
ESKOM HOLDINGS SOC LTD
ENERGY WHEEL
2017/18 Projections
ALL FIGURES IN GWh
Generation of Electricity Available for Distribution Total Imports
2017/18 2017/18 2017/18
Generation 221 184 Generation (incl IPPs) 233 603 International Purchases 9 670
OCGT 211 International 9 670 Wheeling 2 562
Pumping (5 931) Wheeling 2 562 Total 12 232
IPP 12 208 Sub Total 245 835
Total 227 672 Pumping (5 931)
Total 239 905
Total Exports2017/18
International Sales 13 930
Wheeling 2 562
Total 16 492
Internal Use Demand External Sales
2017/18 2017/18 2017/18Generated ( 162) Sales 213 981 Local 200 051
Internal Use 488 Losses 23 035 International 13 930
Total 326 Internal 488 Total 213 981
Generated ( 162)
Wheeling 2 562
Technical & Other Losses
Total 239 905 2017/18
Distribution 16 270
Transmission 6 765
Total 23 035
Technical & Other Losses - %
2017/18
Distribution 7.5%
Transmission 2.8%
South African Power Pool

Energy Wheel
Eskom Holdings Revenue Application FY2018/19 Page: 26
The energy wheel for the application year 2018/19 is presented below.
FIGURE 12 : ENERGY WHEEL 2018/19
ESKOM HOLDINGS SOC LTD
ENERGY WHEEL
2018/19 Application Forecast
ALL FIGURES IN GWh
Generation of Electricity Available for Distribution Total Imports
2018/19 2018/19 2018/19
Generation 216 560 Generation (incl IPPs) 235 201 International Purchases 9 381
OCGT 211 International 9 381 Wheeling 2 453
Pumping (5 783) Wheeling 2 453 Total 11 834
IPP 18 429 Sub Total 247 035
Total 229 418 Pumping (5 783)
Total 241 252
Total Exports2018/19
International Sales 13 634
Wheeling 2 453
Total 16 087
Internal Use Demand External Sales
2018/19 2018/19 2018/19Generated ( 159) Sales 215 710 Local 202 076
Internal Use 499 Losses 22 750 International 13 634
Total 339 Internal 499 Total 215 710
Generated ( 159)
Wheeling 2 453
Technical & Other Losses
Total 241 252 2018/19
Distribution 15 952
Transmission 6 798
Total 22 750
Technical & Other Losses - %
2018/19
Distribution 7.3%
Transmission 2.8%
South African Power Pool

Allowable Revenue
Eskom Holdings Revenue Application FY2018/19 Page: 27
6 Allowable Revenue
6.1 Allowed Revenue formula
Eskom’s revenue requirement application for 2018/19 is based on the allowed revenue
formula as reflected in the MYPD methodology:
𝐴𝑅= (𝑅𝐴𝐵×𝑊𝐴𝐶𝐶)+𝐸+𝑃𝐸+𝐷+𝑅&𝐷+𝐼𝐷𝑀±𝑆𝑄𝐼+𝐿&𝑇±𝑅𝐶𝐴
Where:
𝐴𝑅 = Allowable Revenue
𝑅𝐴𝐵 = Regulatory Asset Base
𝑊𝐴𝐶𝐶 = Weighted Average Cost of Capital
𝐸 = Expenses (operating and maintenance costs)
𝑃𝐸 = Primary Energy costs (inclusive of non-Eskom generation)
𝐷 = Depreciation
𝑅&𝐷 = Costs related to research and development programmes/projects
𝐼𝐷𝑀 = Integrated Demand Management costs (EEDSM, PCP, DMP, etc.)
𝑆𝑄𝐼 = Service Quality Incentives related costs
𝐿&𝑇 = Government imposed levies or taxes (not direct income taxes)
𝑅𝐶𝐴 = The balance in the Regulatory Clearing Account (risk management devices of
the MYPD)

Allowable Revenue
Eskom Holdings Revenue Application FY2018/19 Page: 28
TABLE 4: ALLOWABLE REVENUE
Notes to allowed revenue
1. Other income has been included under the expenditure element.
6.2 Revenue recovery
Company revenue is recovered from international customers, negotiated pricing agreement
(NPA) customers, with the balance from standard tariff customers
TABLE 5: REVENUE RECOVERY
The growth in total allowed revenue from FY2017/18 to FY2018/19 is 7% with the
contribution being almost 50:50 split between standard tariff revenue and non-standard tariff
revenue. Standard tariff consumers are required to contribute R7.2 billion (3.6%) more when
compared to the 2017/18 decision. Eskom’s strategy to maximise export sales and revenue
impacts positively on the balance required from standard tariff customers.
Allowable Revenue (R'millions) AR FormulaApplication
2018/19
Regulated Asset Base (RAB) RAB 763 589
WACC % ROA X 2.97%
Returns 22 690
Expenditure E + 62 221
Primary energy PE + 59 340
IPPs (local) PE + 34 209
International purchases PE + 3 216
Depreciation D + 29 140
IDM I + 511
Research & Development R&D + 193
Levies & Taxes L&T + 7 994
RCA RCA +
Total Allowable Revenue R'm 219 514
Revenue recovery (R'millions)MYPD 3
2017/18
Application
2018/19Change % growth
NPA and International customers 6 259 13 309 7 050 112.6%
Standard tariff customers 198 954 206 205 7 251 3.6%
Total Allowable Revenue 205 213 219 514 14 301 7.0%

Allowable Revenue
Eskom Holdings Revenue Application FY2018/19 Page: 29
However, the price impact would be much higher due to the allowed revenue being
recovered from a lower sales volume. The impact on the electricity price is 9.4% in 2018/19
due to the extent of the drop in standard tariff volumes when compared to the MYPD3 over 5
years of some 30 TWh.
The growth in revenue from the 2017/18 MYPD3 decision is attributable to IPPs of R11.2bn,
operating costs of R13.2bn and international purchases of R2.8bn. Revenue requirement is
reduced by a drop in returns of R12bn and lower environmental levy of R1.8bn.
FIGURE 13 : TOTAL REVENUE GROWTH OF R14.3 BILLION
6.3 Electricity price impact in 2018/19
Standard tariff consumers are required to contribute R7 251 million (3.6%) more when
compared to the 2017/18 decision. The reasons for the proposed standard price increase of
19.9%, which is much higher than the revenue increase, is unpacked into 3 categories.
These categories are adjustments that need to be made prior to considering Eskom’s costs;
secondly allowing for operating costs impacts and accounting for the depreciation, returns,
SPAs and exports.

Allowable Revenue
Eskom Holdings Revenue Application FY2018/19 Page: 30
FIGURE 14 : FACTORS IMPACTING ON PRICE INCREASE
Step 1: Adjustments that need to be made prior to considering Eskom’s own cost.
These are:
Price adjustment of 9.4% due to sales volume rebasing
Price adjustment of 5.5% due to further increase in IPPs costs
Price adjustment of 1.4% due to NERSA correction for treatment of international
purchases
Thus, before considering any of Eskom’s own cost movements, NERSA will be required to
consider a price increase of 16.3% for the 2018/19 year.
Step 2: Allows for Eskom’s own primary energy costs increasing by 0.5% while operating
cost increase by 7%.
Step 3: Return on assets is reduced when compared to MYPD3 2017/18 resulting in a 6%
price reduction. The final factor relates SPAs and exports which increases the price by 2.1%.
6.4 Rebasing of sales volumes
Over the entire MYPD3 period Eskom’s sales volumes have been significantly lower than the
assumption made in the MYPD3 decision. The key reason for this is slower economic
recovery in the country than anticipated. NERSA did not adjust the sales volumes through
19.9%
30
26
5 G
Wh
R2
69
74
m R1
0 8
12
m
V
o
G
ro
Sales
volumes rebasing
IPPs International
Purchases
9.4%
5.5%
1.4%
16.3%
Price
before Operating
costs changes
Generation
OwnPE costs
7.0% 0.5%
23.8%
Opex Price
after Operating
-6.0%
Adjustments Operating costs Depr , Returns , SPAs & Exports,
Overall
Price Increase
Pri
ce I
mp
act
%
SPAs
&Exports
2.1%
Depre
&Returns

Allowable Revenue
Eskom Holdings Revenue Application FY2018/19 Page: 31
their regulatory processes to reflect current realities. This volume adjustment to reflect the
actual sales will occur during the revenue application for 2018/19. Even if the allowed
revenue was not increased for the 2018/19 year, the recovery through lower sales volume
will result in a price increase. The net impact of this sales volume rebasing is a 9.4% price
increase being required after accounting for primary energy savings on the lower volumes.
Standard tariff sales volumes has declined by 30TWh from 223TWh (2017/18 decision) to
193TWh (2018/19 application).
Assuming the same standard tariff revenue in 2017/18 of R198 954 million is maintained for
2018/19, and adjusting for lower sales, will result in a primary energy savings of R10 812m
based on an average variable primary energy production cost of 32c/kWh. This corresponds
to a drop in allowed revenue to R188 142 million recovered over the lower volumes of
192 953GWh which equates to standard tariff price increase of 9.4% from 89.13c/kWh to
97.5c/kWh.
It is important to correct the sales volumes, as embedded in the sales is the recovering of
Eskom’s fixed costs (operating costs are fixed in the short term). Eskom is not receiving the
full allowed operating costs, depreciation and returns when volumes are lower than the
assumption in the NERSA decision.
TABLE 6 : SALES VOLUME REBASING IN 2018/19
6.5 Inclusion of full international purchases
In the MYPD3 decision, NERSA had included a net cost for international purchases and not
the gross costs. Subsequently through the RCA 2013/14 decision and the revised MYPD
methodology, the gross purchases are included to set off the inclusion of international
revenue. Therefore, the primary energy cost base will reflect the change in 2018/19,
Rebasing of sales volumesMYPD 3
Decision Application
2017/18 2018/19
Standard tariff revenue (R'm) 198 954 198 954
Savings on primary energy due lower sales (R'm) - 10 812
Revised standard tariff revenue after lower sales (R'm) 188 142
Standard Tariff volumes (GWh) 223 217 192 953
Standard tariff average electricity price (c/kWh) 89.13 97.5
Price adjustments for rebasing sales volumes 9.4%

Allowable Revenue
Eskom Holdings Revenue Application FY2018/19 Page: 32
effectively resulting in international purchases increasing by R2.8 billion for regulatory
purposes from 2017/18.
6.6 Operating costs increase
Eskom continues to strive to extract efficiencies over the MYPD3 period through the
implementation of a business productivity programme initially and later updated to a ‘design
to cost’ approach. The compounded average growth rate reflects that year on year operating
and maintenance costs have grown by 7.3% between 2013/14 to 2018/19. Employee
benefits have a CAGR of 4.9% p.a. over the same period. The significant adjustment is
linked to the starting point of a low base which adds 7.0% to the price impact.
6.7 Depreciation and return on assets
The depreciation amount will be based on a revalued asset base in terms of the MYPD
methodology. Return on assets will be based on the weighted average cost of capital
(WACC). The WACC will not be implemented in its entirety in 2018/19 as a phased in
amount of 2.97% is utilised. The ROA % will be phased-in to cost reflectivity in order to
minimise the impact on the overall price increase in the application. The phasing in of ROA
will result in a reduction in the price of electricity by 6.0%.

Indicative Standard Tariff Increase
Eskom Holdings Revenue Application FY2018/19 Page: 33
7 Indicative Standard Tariff Increase
7.1 Tariffs
Eskom’s total sales revenue recovery is from three categories; Standard tariffs, local
negotiated pricing agreements (NPAs) and International sales. The applicable prices and
increases for the NPAs and the international utility agreements are specified in long-term
supply agreement contracts. As a result, the annual tariff adjustment only applies to the
Standard tariffs that make up the Eskom Schedule of Standard prices.
7.2 Standard tariff increases
Once NERSA has determined the allowed revenue, Eskom is required to submit its retail
tariff and structural adjustment application for Standard tariffs to NERSA in accordance with
the Eskom Retail Tariff and Structural Adjustment (ERTSA) methodology.
The ERTSA is the Eskom application for the rate of adjustment to tariffs applicable to the
respective customer groups, as well as the resultant Eskom Schedule of Standard prices
applicable to each of the customer groups. The figure below summarises the approach
required by ERTSA.
FIGURE 15: TARIFF CALCULATION PROCESS
It is applicable to Eskom’s local authority and non-local authority customers.
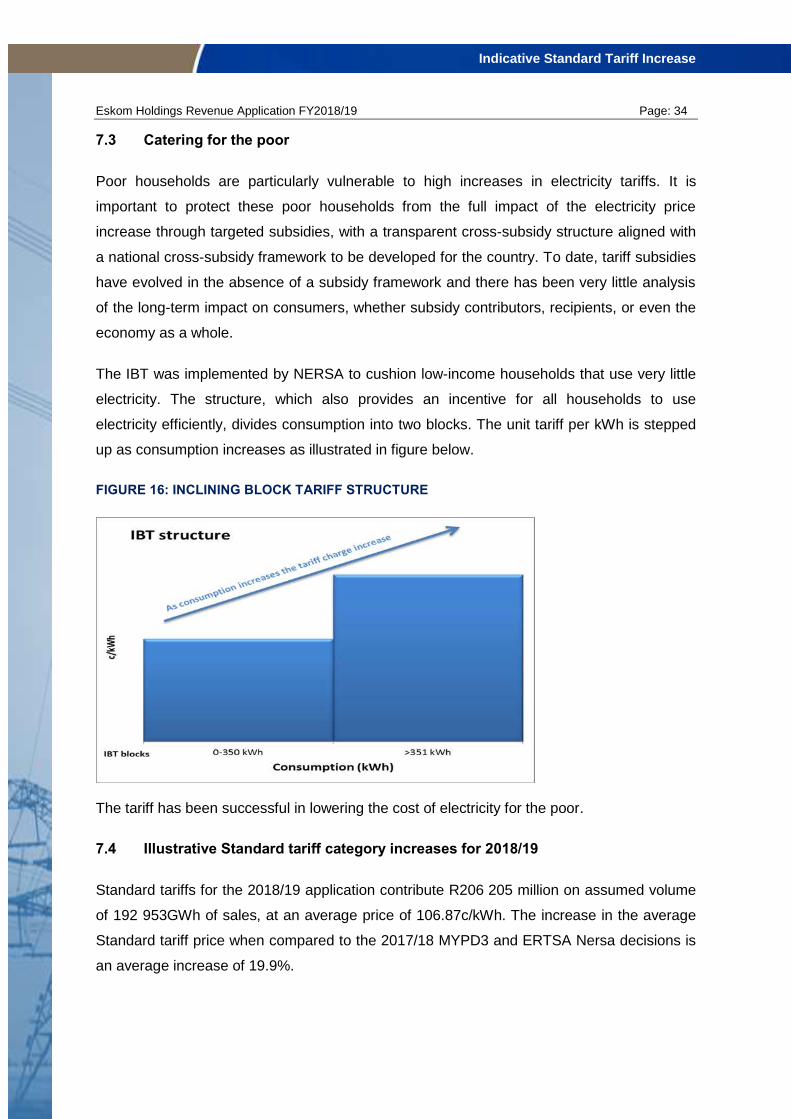
Indicative Standard Tariff Increase
Eskom Holdings Revenue Application FY2018/19 Page: 34
7.3 Catering for the poor
Poor households are particularly vulnerable to high increases in electricity tariffs. It is
important to protect these poor households from the full impact of the electricity price
increase through targeted subsidies, with a transparent cross-subsidy structure aligned with
a national cross-subsidy framework to be developed for the country. To date, tariff subsidies
have evolved in the absence of a subsidy framework and there has been very little analysis
of the long-term impact on consumers, whether subsidy contributors, recipients, or even the
economy as a whole.
The IBT was implemented by NERSA to cushion low-income households that use very little
electricity. The structure, which also provides an incentive for all households to use
electricity efficiently, divides consumption into two blocks. The unit tariff per kWh is stepped
up as consumption increases as illustrated in figure below.
FIGURE 16: INCLINING BLOCK TARIFF STRUCTURE
The tariff has been successful in lowering the cost of electricity for the poor.
7.4 Illustrative Standard tariff category increases for 2018/19
Standard tariffs for the 2018/19 application contribute R206 205 million on assumed volume
of 192 953GWh of sales, at an average price of 106.87c/kWh. The increase in the average
Standard tariff price when compared to the 2017/18 MYPD3 and ERTSA Nersa decisions is
an average increase of 19.9%.

Indicative Standard Tariff Increase
Eskom Holdings Revenue Application FY2018/19 Page: 35
TABLE 34: 2018/19 STANDARD TARIFF AVERAGE INCREASES
Standard Tariffs Total Decision
2017/18
Application
2018/19
Annual Average Increase - ERTSA(%) 2.20% 19.90%
Annual Average Price (c/kWh) 89.13c 106.87
Standard Tariff Forecasted Sales Volumes (GWh) 223 219 192 953
Standard Tariff Allowed Revenues (R'm) 198 954 206 205
NERSA may allow cross-subsidies between various customer groups to be implemented as
part of the annual average price to benefit affected groups. This may result in changes to the
non-municipal and/or municipal increases.
For example; if NERSA continues to protect the poor with lower tariff increases to the
Homelight 20A tariff similarly as it did for the MYPD3 decision, the applicable tariff category
increases after applying the ERTSA methodology would be as shown in Table 7. This
Homelight 20A tariff was 2.4% less than average for Block 1 (>0-350kWh) and 0.4% less
than average for Block 2 (>350kWh) in the MYPD 3 decision.
TABLE 7: STANDARD TARIFF CATEGORY INCREASES
Total Standard tariffs 19.90%
Municipal - 1 July 27.53%
Key industrial and urban
Other tariff charges 19.90%
Affordability subsidy 22.04%
Rural 19.90%
Homelight 20A
Block 1 (>0-350kWh) 17.50%
Block 2 (>350kWh) 19.50%
Homelight 60A 19.90%
Homepower 19.90%

Sales Volumes
Eskom Holdings Revenue Application FY2018/19 Page: 36
8 Sales Volumes
8.1 Introduction to sales volumes
The basis of the sales forecast is all customer categories of the standard tariff, negotiated
pricing agreements (NPA) and international (exports).
The forecasted sales are for a short-term period and it is for projecting consumption at the
customer meter so as to obtain the total energy usage, kilowatt-hours, for all customers. The
sales forecast is translated into revenues that needs to be as accurately as possible for tariff
calculation and cash flow purposes.
The sales forecast for the financial years 2016/17 to 2018/19 is reflected in the table below.
TABLE 8: SALES VOLUMES FORECASTS
All sales are from Eskom’s regulated business as all Eskom electricity sales are regulated in
terms of a NERSA decision. Sales refer to all end-customers directly supplied by Eskom.
This includes sales to Municipalities purchasing in bulk from Eskom as well as all sales to
any point of delivery that belongs to Eskom or any Eskom subsidiary. The associated costs
for the purchase of the electricity are included in the operational costs of that entity. Entities
such as Roshcon is regarded as fully fledged Eskom customer paying the Nersa approved
Eskom Standard tariffs.
The sales forecast differs from the network demand forecast and the generation production
plan forecast as follows:
Sales volumes (GWh) Actuals Projections Application
2016/17 2017/18 2018/19
Standard tariff sales 189 845 190 917 192 953
Negotiated pricing agreement 9 750 9 621 9 621
Export sales 14 995 13 930 13 634
Total Sales 214 590 214 468 216 208
Year-on-year growth (GWh) - 559 - 122 1 740
Year-on-year growth (%) -0.26% -0.06% 0.81%

Sales Volumes
Eskom Holdings Revenue Application FY2018/19 Page: 37
• The network demand forecast projects network capacity (MW) is to advise on the network
capacity (energy and demand) available for the connection of existing and future
customers to generators.
• The generation production informs on the generation capacity (peak and sent out)
available to meet the customer electricity requirements and cater for a sufficient reserve
margin. This forecast incorporates Independent Power Producers (IPPs) generation and
is aligned to Government determinations
This sales forecast section of the application for the NERSA approval first discusses the
sales forecasting approach for Standard tariffs and NPAs. Following this a discussion on the
assumptions that include but are not limited to considerations of integrated demand
management (IDM) programmes and the Gross domestic product (GDP) trend.
A myriad of factors differently impact future sales including the price elasticity of demand
captured through the application of customers’ future consumption projections during the
sales forecasting process. Thereafter, provided is an explanation of the sales forecasting
process, leading to the overview and analysis of the 2018/19 forecasted sales as well as the
Eskom initiative to grow sales.
8.2 Sales forecasting approach
There are various different influences on customers’ current and future electricity
consumption that are determined by individual customers’ need for electricity and substitutes
to taking supply from Eskom. To practically capture this complex dynamic, the Eskom
forecasting practice recognises differing sales assumptions by sector. For high-sales volume
customers, the sales forecasting assumptions include individual customer expected energy
requirements and consultation with respective customers and industry representatives. This
forecasting approach therefore combines the use of quantitative and qualitative techniques.
Municipalities purchase in bulk from Eskom and distribute to industry and commercial
sectors with a good measure of supply to residential end-customers. Eskom bulk sales to
municipalities differ from one municipality (or metro) to the next as each municipal electricity
customer-mix shapes each municipality’s Eskom purchase profile. Eskom therefore uses a
combination of forecasting methodologies, individual municipality consultation with reference
to the respective local government development plans. For the residential and commercial

Sales Volumes
Eskom Holdings Revenue Application FY2018/19 Page: 38
sectors, primarily historical trends, weather, and economic indicators inform the sales
forecast.
This individual forecasting approach applies to rail customers albeit that rail sales represent
1% of total sales on 509 active service agreements.
The forecasting of international sales adopts the individual approach given the country
specific drivers and that the sales are to 7 international utilities and 4 international end-users.
FIGURE 17: 2015/16 NUMBER OF CUSTOMERS AND CONTRIBUTION TO TOTAL SALES
Note: The residential total includes pre-payment and public lighting
Eskom sales are mainly to Municipalities, industrial and mining customers and this was at
78% sales volumes at the end of the 2016/17 from 4 547 customers (or active service
agreements). Consequently, electricity sales changes in any of these three segments
requires application of an individual bottom-up approach so as to consider specific sales
usage drivers that include customers’ business plans, commodity prices, and consideration
of customer plans.
8.3 Sales volume forecasting assumptions
The sales forecast is based on various assumptions reflecting the different types of
customers’ electricity needs and influences on diverse customers’ consumption profiles.
There are some similar assumptions used for all customers but with varying impacts.
Key assumptions include Gross domestic product (GDP) growth, commodity market
performance and prices, demand response savings, weather conditions, customer projects,
industrial action and impact of the leap year.

Sales Volumes
Eskom Holdings Revenue Application FY2018/19 Page: 39
8.3.1 Gross domestic product (GDP)
Anticipated changes in GDP growth while an important input into the sales volume forecast
are one of the many sales volume forecasting inputs. In sectors where there is a strong
correlation between electricity demand and GDP growth, such as bulk sales to
Municipalities, changes to the GDP have a greater weighting on the sales volume
projections.
The GDP percentage growth (%) used in this Application 2018/19 forecast was derived from
an average of 4 different sources that are the Eskom treasury forecast, International
Monetary Fund (IMF) forecast and Investec forecast.
TABLE 9: GROSS DOMESTIC PRODUCT (GDP) FORECASTS
National Treasury latest outlook was that GDP would increase from 0.5% (2016) to a
forecast of 1.3% (2017).
8.3.2 Commodity prices
The commodity price assumptions are primarily for aluminium, gold, platinum, steel and
Ferrochrome that influence mining and industrial customers’ electricity use. For the
commodity prices referred to in the sales volume forecast, most are at lower levels than in
the past. The sales forecast assumes that this trend will continue for the entire application
period with only moderate growth expected for some commodity prices; see below Table 10
for the main commodity prices.

Sales Volumes
Eskom Holdings Revenue Application FY2018/19 Page: 40
TABLE 10: COMMODITY PRICES
FIGURE 18 : HISTORIC COMMODITY PRICE LEVELS
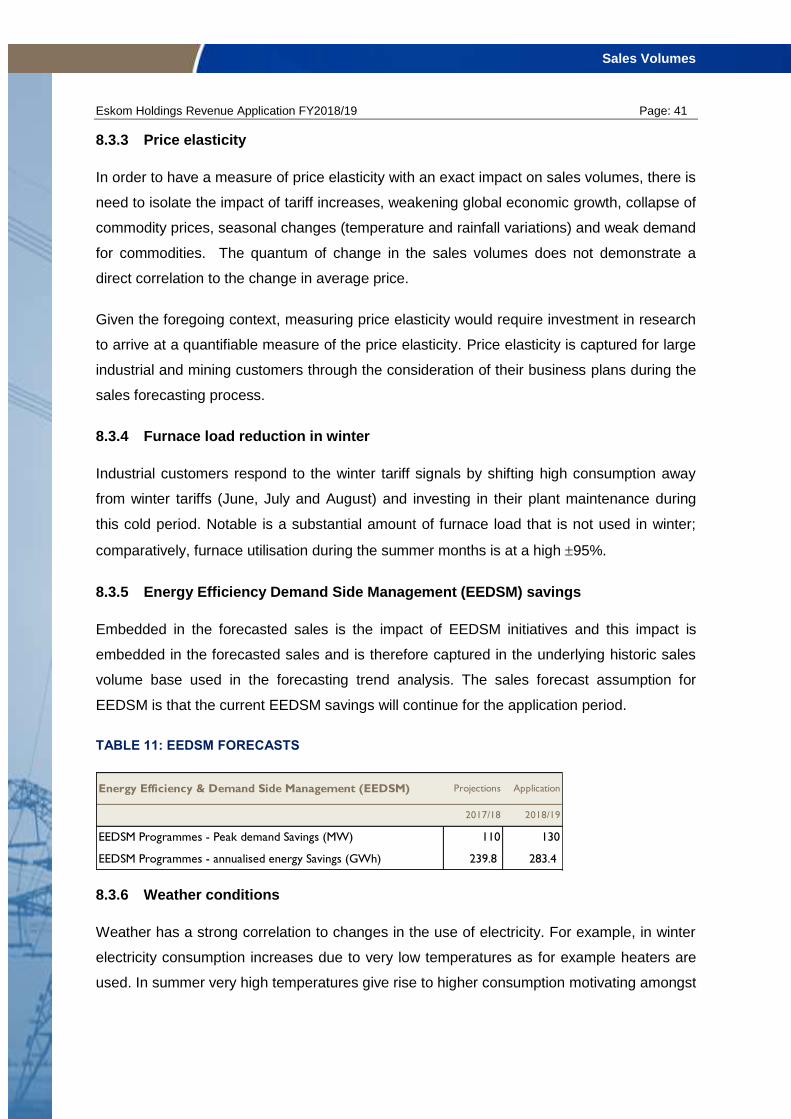
Sales Volumes
Eskom Holdings Revenue Application FY2018/19 Page: 41
8.3.3 Price elasticity
In order to have a measure of price elasticity with an exact impact on sales volumes, there is
need to isolate the impact of tariff increases, weakening global economic growth, collapse of
commodity prices, seasonal changes (temperature and rainfall variations) and weak demand
for commodities. The quantum of change in the sales volumes does not demonstrate a
direct correlation to the change in average price.
Given the foregoing context, measuring price elasticity would require investment in research
to arrive at a quantifiable measure of the price elasticity. Price elasticity is captured for large
industrial and mining customers through the consideration of their business plans during the
sales forecasting process.
8.3.4 Furnace load reduction in winter
Industrial customers respond to the winter tariff signals by shifting high consumption away
from winter tariffs (June, July and August) and investing in their plant maintenance during
this cold period. Notable is a substantial amount of furnace load that is not used in winter;
comparatively, furnace utilisation during the summer months is at a high 95%.
8.3.5 Energy Efficiency Demand Side Management (EEDSM) savings
Embedded in the forecasted sales is the impact of EEDSM initiatives and this impact is
embedded in the forecasted sales and is therefore captured in the underlying historic sales
volume base used in the forecasting trend analysis. The sales forecast assumption for
EEDSM is that the current EEDSM savings will continue for the application period.
TABLE 11: EEDSM FORECASTS
8.3.6 Weather conditions
Weather has a strong correlation to changes in the use of electricity. For example, in winter
electricity consumption increases due to very low temperatures as for example heaters are
used. In summer very high temperatures give rise to higher consumption motivating amongst
Energy Efficiency & Demand Side Management (EEDSM) Projections Application
2017/18 2018/19
EEDSM Programmes - Peak demand Savings (MW) 110 130
EEDSM Programmes - annualised energy Savings (GWh) 239.8 283.4

Sales Volumes
Eskom Holdings Revenue Application FY2018/19 Page: 42
others the use of air-conditioning. However, the sales volume forecasting does not attempt
to forecast weather; at best, a weather forecast is only accurate for a max of +/- 7 days
ahead.
Instead, the sales volume forecasting applies average temperatures (or average weather), to
determine the level of sales volumes under “normal” temperatures. Average weather
conditions are inputs used to forecast weather sensitive customers. By using “normal” (or
average) weather conditions, in the event of a very cold winter, the difference in the
forecasted and actual consumption sales volume is limited to “normal” level. Conversely, if
the sales forecast considers a warmer winter and instead a colder winter is experience, the
change in the sales volumes is also limited to the difference to the “normal” winter level.
The sales volume forecasting considers that each Eskom regional forecast has some
variation in weather patterns and regional customers react differently to weather changes.
Furthermore, it is also recognised that there is a “dead band” in temperature and/or weather
changes that do not affect electricity consumption. There is also a threshold temperature
level for low and high temperatures above / below which would advise electricity
consumption changes.
8.4 Forecasted sales for the application
The sales forecast is on the back of declining sales from the MYPD3 period. Going forward,
the expectation is slow-growth reflecting the low economic growth projections and in line with
the actual trend experienced since 2012.
TABLE 12: FORECASTED SALES VOLUMES
The forecasted growth between projections for 2017/18 and the Application 2018/19 is 0.8%
compared to an average decline in sales growth rate over the MYPD3 period of 1.8%. As
Sales volumes (GWh) Actuals Actuals Actuals Actuals Projections Application
2013/14 2014/15 2015/16 2016/17 2017/18 2018/19
Standard tariff sales 194 762 195 258 192 089 189 845 190 917 192 953
Negotiated pricing agreement 11 229 9 896 9 684 9 750 9 621 9 621
Export sales 12 378 11 911 13 376 14 995 13 930 13 634
Total Sales 218 369 217 065 215 149 214 590 214 468 216 208
Year-on-year growth (GWh) 1 808 - 1 304 - 1 916 - 559 - 122 1 740
Year-on-year growth (%) 0.83% -0.60% -0.88% -0.26% -0.06% 0.81%

Sales Volumes
Eskom Holdings Revenue Application FY2018/19 Page: 43
required by the methodology, Eskom will alert NERSA to any changes in the sales forecast
closer to the time of the NERSA decision.
For the 2017/18 financial year compared to year 2016/17, the sales trend remains the same
from additional negotiated pricing agreement and international sales. The total forecasted
sales growth is an additional 1 740 TWh for 2018/19. There are additional but minimal sales
attributable to the 100 000 new electrification customers supplemented with an assumed
increase in residential consumption.
TABLE 13: SALES CATEGORIES
The switching off of furnaces by large customers during winter and many industrial
customers scaling down or closing due to the current slump in commodity prices influence
the sales trend. With low commodity prices and electricity price increases expected to be
higher than inflation for the entire period, the expectation is that this low growth trend will
continue.
Compared to the MYPD3 decision’s forecasted sales, the actual sales were lower and this
trend is reflected in the 2018/19 forecasted sales. These lower sales volumes present the
need to rebase the sales volumes for 2018/19 so as to be in line with the sales trend and
provide a realistic reference point for 2018/19.
Sales volumes into categories (GWh) Actuals ApplicationChange FY2014
~FY2019
2013/14 2018/19
Industrial 54 567 48 700 - 5 867
Mining 30 667 31 302 635
Municipalities 91 262 90 298 - 964
Residential + Prepayment 10 818 12 311 1 493
Other 31 055 33 597 2 542
International Sales 12 378 13 634 1 256
Traction 3 125 2 786 - 339
Commercial 9 605 10 577 972
Agriculture 5 192 5 810 618
Public lights 199 204 5
Other 556 586 30
Total Sales 218 369 216 208 - 2 161

Sales Volumes
Eskom Holdings Revenue Application FY2018/19 Page: 44
FIGURE 19: ESKOM SALES VOLUME GAP OVER MYPD3
In discussions with key industrial customers various reasons other than the price of
electricity were highlighted as drivers for the current situation. The declining trend in the in
Eskom sales can be attributed to a number of driving forces:
Electricity price increases have played a part in constraining growth as the cost of
electricity for certain industries is a high percentage of production cost
South African industrial plants have overcapacity while commodity prices either remains
static or reduce together with the remote location from major markets
- China is taking our market share in a fiercely competitive market.
- Other input costs, particularly where electricity cost intensity is lower also play a role,
i.e. expensive transport and location of plants from the markets
Availability of electricity and energy efficiency drives during period of capacity constraint
created permanent loss in sales/revenue
- Eskom communicated to customers to reduce sales since load shedding
- Energy efficiency initiatives implemented: Eskom required a 10% reduction in load
from its Key Industrial Customers (KICs)
- Electricity Conservation Scheme (ECS) rules were also embedded in Electricity
Supply Agreements with customers

Sales Volumes
Eskom Holdings Revenue Application FY2018/19 Page: 45
Reluctance by global companies to invest in SA due to a lack in competitiveness and the
uncertain situation in SA from a political and sustainable financial perspective (i.e. credit
rating, labour and transport)
Internationally governments (not utilities) assist in dropping the price of electricity for
large energy intensive users in their countries
In line with the MYPD methodology, the mitigation of the sales variance can be addressed
through the consideration of a more recent sales forecast at the time of the NERSA decision.
To avert the declining trend Eskom has put in place a growth initiative to grow sales as
explained in this application. A sustainable solution requires a coordinated national (SA Inc)
effort and should consider all options. Eskom is completely supportive of any policy
interventions by the Government in ensuring further economic growth that is likely to attract
further industrial investment.
8.5 Under-recovery of allowed revenue in MYPD3
Lower sales volumes over the MYPD3 window has meant that Eskom did not recover the
allowed revenue which was awarded by the Regulator. As described earlier, although the
sales volumes in actual mode have decreased marginally on a Year-on-Year basis, the gap
to the sales volumes when compared to the MYPD3 decision has widened over time. The
revenue has been recovered in the respective years.
Below is a summary of the revenue under-recovery which has occurred during the last few
years and the cumulative shortfall for the 4 years of the MYPD3 period (FY2014 to FY2017)
is R48 billion. Based on projections for year 5 (FY2018) this gap will escalate by another
R20 billion, resulting in a combined under-recovery of allowed revenue over the MYPD3
period of in the region of R68 billion.

Sales Volumes
Eskom Holdings Revenue Application FY2018/19 Page: 46
FIGURE 20 : UNDER-RECOVERY OF ALLOWED REVENUE
In order to compute the difference to the actual revenue as reflected in Eskom’s annual
financial statements, Eskom makes the following adjustments:
Reversal of revenue impairments disclosed in the Annual financial Statements (AFS) –
this has the effect of increasing the revenue reported and thus lowering the amount of
the revenue gap.
Load shedding interruptions are accounted for by reducing the revenue gap further
Allowed revenue in 2015/16 and 2016/17 are increased from the original MYPD3
decision to cater for the regulatory clearing account decision which were granted by
NERSA.
In order to allow for the NERSA revenue decision to be recovered, it is essential for the sales
volumes to be adjusted in 2018/19 decision to reflect the current reality. If this is not done in
accordance with the latest information available (as required by the MYPD methodology) the
under-recovery of the allowed revenue will again be repeated. As discussed below, Eskom
is making every effort to maintain the current sales volumes and to grow sales volumes into
the future. This will allow for revenue to be recovered over a larger volume.

Sales Volumes
Eskom Holdings Revenue Application FY2018/19 Page: 47
8.6 Initiatives to grow sales volumes
Eskom is experiencing low electricity sales growth which is set to continue in line with the
sluggish international and local economic growth and low commodity price projections.
Specifically, electricity sales to Eskom’s industrial and mining customers are declining as
they are faced with increasing operational and market challenges, including the erosion of
competitive advantage from previous low-electricity prices in South Africa.
Additionally, the large industry and mining market context has changed recently and is
marked by diminished competitive advantage from previous low-electricity prices. This is
driving industrial customers to seek alternatives and move production to lower priced
electricity markets.
This trend, coupled with the commissioning of new power stations has moved Eskom into a
position of excess operational generation capacity. In order to remedy the situation, Eskom
has embarked on a Growth and Sustainability Strategy with the objective of stemming the
declining sales trend, thereby sustaining our current sales and pursuing sales growth
opportunities to increase electricity sales over time (i.e. in addition to what is in the sales
forecast). Eskom has developed a framework to stimulate local demand that has 4 key
elements geared to supporting existing customers to expediting projects in construction. All
projects will be pursued on their sound and mutual business merits.
Eskom has developed a framework to stimulate local demand with 4 key elements geared to
supporting existing customers to expediting projects in construction. The roll-out will be to all
customers including Municipalities and will be considerate of all stakeholders competitive
context. The merits for the consideration of any project will be the soundness and mutual
business benefits.

Sales Volumes
Eskom Holdings Revenue Application FY2018/19 Page: 48
FIGURE 21: LOCAL DEMAND STIMULATION- KEY ELEMENTS
As cost drivers are not only electricity prices, growth initiatives must be driven from a country
platform together with the key role players, including Department of Trade and Industry,
Department of Public Enterprises, Economic Development Department, Industrial
Development Corporation, National Treasury, Department of Energy, and the National
Energy Regulator of South Africa.
The success of the Growth and Sustainability Strategy is dependent on establishing a
country platform together with all key role players to ensure an integrated and focused SA
Incorporated approach to encourage existing and new customers to invest in the country and
maximize the growth potential of South Africa.
8.7 Debt owing to Eskom
Eskom is managing the payments from customers reasonably well. As at September 2016
the overall payment level was 97%. A relatively small portion of Eskom’s customer base is
battling to fully and timeously settle their accounts resulting in the increase of overdue debt
and decrease in customer payment levels. Since March 2014 to March 2016 the overdue
debt has increased significantly of which the main increase are with the Municipal and
Soweto customers.

Sales Volumes
Eskom Holdings Revenue Application FY2018/19 Page: 49
8.7.1 Strategies to improve debt collections
Eskom will continue with the deployment of appropriate technologies that may prove to be a
successful preventative measure to curb arrear debt and to assist with increased payment
levels due to increased effective credit control. For e.g.:
• Split metering (protective enclosures).
• Automated Metering Interface (Smart Metering).
• Transfer supplies from conventional metering to prepaid as an affordable means to
customers.
• The deployment of smart metering beyond the municipal structures.
• Evaluating municipal recovery plans and to agree on a payback plan to settle arrears as
well as ensuring that there will be sustainable income in the future that will not impact
Eskom materially.
8.7.2 Arrear Debts
Eskom’s arrear debts have been increasing over the last few months. This meant that
Eskom needed to implement interruptions in lieu of receiving payments. However the
percentage of arrear debt to revenue currently exceeds the MYPD3 allowance of 0.5%.
Several interventions have been introduced and will continue to be rolled out including
prepaid meters which will contribute to arresting the arrear debts going forward. Although
current arrear debt levels are high as 2% of allowed revenue, Eskom has maintained the
NERSA previously determined rate of 0.5% for arrear debt/impairments in this application.
Production Plan
Eskom Holdings Revenue Application FY2018/19 Page: 50
9 Production Plan
9.1 Background to the production plan
The purpose of production planning is to optimise Eskom production on a power station
basis to meet Eskom demand in the short to medium-term, while maintaining least cost
dispatch given the known constraints, legal and environmental policies. Constraints may
include emissions, water shortages, coal shortage or surplus, network constraints, plant
technical capabilities and any other constraints. The mandate for the production plan is to
strictly stick to merit order dispatch at all times.
The Production Plan is used to provide the following:
• Eskom with the expected production level at each station so as to establish cost and
revenue projections.
• Primary Energy Department (PED) with fuel requirements of the stations so as to
procure adequate fuel to meet projected levels of production and to maintain the
required strategic stockpile at each station.
Least cost dispatch is mainly derived from primary energy cost (coal and diesel cost). The
process to prioritise stations is undertaken as follows:
• OCGT production – OCGT load factor is restricted to 1%.
• Due to the operational requirements for nuclear, Koeberg is always dispatched first
when available.
• Hydro plants are dispatched based on water release agreements between Eskom and
Department of Water Affairs.
• The remaining available units are dispatched from the cheapest to the most expensive.
• With the system availability improvement experienced over the past few months, it is
critical that merit order dispatch is followed to support financial sustainability initiatives.
• Renewable IPPs are non dispatchable and run when available.
The Production Plan also takes the following into consideration:
• The energy forecast – This is based on the latest Energy Wheel Diagram which
forecasts Eskom energy sales monthly and annually and includes Distribution and

Production Plan
Eskom Holdings Revenue Application FY2018/19 Page: 51
Transmission national sales, export sales, Transmission and Distribution losses and
pumping energy requirements.
• Eskom Generation Capacity – The plan includes Eskom’s existing and new-build plants;
Medupi, Kusile and Ingula. Non-commercial units are included from the projected
Commercial Operation (CO) Dates.
• Plant performance – The Generation technical performance plan was used. This is
derived from Planned Capability Loss Factor (PCLF), Unplanned Capability Loss Factor
(UCLF) and Other Capability Loss factor (OCLF) assumptions.
• Non-Eskom Generation – the total energy supplied by non-Eskom suppliers (IPPs and
Imports) is discounted from the total energy demand to determine Eskom generation
requirements.
9.2 Production Plan Assumptions
9.2.1 The Energy Forecast
The energy forecast is the starting point of the production planning process. The source of
the forecast is the Eskom Energy Wheel diagram which provides total projected Eskom
sales. The Energy Wheel diagram forecast provides energy forecast which is made up of
Distribution national sales, Export sales, Transmission and Distribution losses. This energy
forecast has been discounted of impact of demand side management options.
The production planning model requires an hourly demand forecast for each of the years
being studied. The hourly forecast is developed from the wheel diagram monthly/annual
energies and the Medium-Term Outlook hourly profile as a reference of hourly demands.
The hourly demands of the reference profile are scaled until the given annual energy figures
are satisfied. The peak demands for each of the years of the study period are also the result
of this scaling process. In order to determine the Net Generation energy for a particular year,
the energy used for Generation pumping and the Distribution energy are subtracted from the
demand for that particular year.
9.2.2 Eskom Generation Capacity
Eskom Generation currently, as at 31 January 2017, operates 44 034 MW of commercially
operating fleet. The bulk of this, 36441 MW, is coal fired and also includes 1860 MW
nuclear, 2409 MW of gas turbines, 600 MW hydro and 2724 MW pumped storage. The
Production Plan is based on 60 year power station life for coal fired stations except Komati.

Production Plan
Eskom Holdings Revenue Application FY2018/19 Page: 52
Acacia and Port Rex also reach end of life during the planning horison. Komati units reach
end of life from FY2024 as per life of each unit, Acacia and Port Rex units reach end of life
from FY2027.
Eskom renewable plant (Sere) with 50 units of 2 MW (100 MW) each is also included in the
production plan. Ingula pump storage is projected to be fully operational by beginning of
FY2018. The new stations included in this planning horison are coal-fired base-load plant
Medupi and Kusile.
9.2.3 Plant performance data
Plant performance data determines the availability of the generating plant. This data includes
unplanned capability loss factor (UCLF) estimates, other capability loss factor (OCLF)
estimates and planned capability loss factor (PCLF). The Generation technical performance
plan was used for this study as shown below.
TABLE 14: GENERATION TECHNICAL PERFORMANCE PLAN
9.2.4 Non-Eskom Generation
The total energy supplied by non-Eskom generators is reduced from the total energy
demand to determine the Eskom generation requirement. Non-Eskom generation include the
international imports (purchases, imports and wheeling) as per the wheel diagram input and
Eskom IPPs and Renewables. The Eskom IPPs include MTPPP, DoE Peakers and Short
Term Purchases. Renewable IPPs from Wind, Concentrated Solar Plant (CSP), Solar PV,
Hydro and Other. IPPs considered in the production plan are up to Bid Window 4.5.
9.3 Production Planning Process
The Production planning methodology is shown in the figure below.
Generation Technical performance Actuals Projections Application
2016/17 2017/18 2018/19
Energy Availability Factor (EAF) 77.3 78.0 79.0
Planned Capacity Loss Factor (PCLF) 12.2 10.0 10.0
Unplanned Capacity Loss Factor (UCLF) 9.9 10.9 9.9
Other Capacity Loss Factor (OCLF) 0.7 1.1 1.1
Gross Load Factor (GLF) 56.2 53.3

Production Plan
Eskom Holdings Revenue Application FY2018/19 Page: 53
FIGURE 22: PRODUCTION PLANNING METHODOLOGY
The production plan is optimised using an Integrated Energy Model. This is a simulation tool
that uses data handling, mathematical programming and stochastic optimisation techniques
to provide analytical framework for power market analysis. It is able to optimally dispatch
schedule of generating units based on user defined constraints and respecting technical
limits. This modelling tool determines the least cost dispatch of generating resources within
given system constraints to meet the power demand from a single period to daily, weekly,
monthly or annual timeframes. The merit order costs are not actual running costs, but rather
approximate energy cost in R/MWh which is derived from fuel cost projections per station.
9.3.1 Base load
The coal-fired and nuclear stations are baseload stations and form the bulk of the capacity
and will be utilised first to meet the demand. The base-load stations are restricted in their
output through their available capacity, utilisation factors and their position in the merit order.
A base-load station first in the merit order (e.g. Koeberg) will generate at full available output
in all hours, whilst an expensive base-load station will follow the load pattern from hour-to-
hour taking into account their minimum generating levels.
9.3.2 Gas Turbines
Similar to the baseload units, the OCGTs are not fuel constrained but restricted by their
availability and position in the merit order. For this submission, Eskom and IPP (Avon and

Production Plan
Eskom Holdings Revenue Application FY2018/19 Page: 54
Dedisa) OCGTs are restricted to minimum 1% annual load factor for grid stability purposes
(Eskom OCGTs – 1% load factor and IPP OCGTs – 1% load factor).
9.3.3 Pumped Storage
The pumped storage units are constrained by their reservoir sizes and pumping
requirements. They are modelled such that their top reservoirs must be full at the beginning
of every week. The historically generating pattern have been taken into account hence they
were given minimum load factors.
9.3.4 Hydro
The approach restricts the generation capability of the hydro stations (Gariep and
Vanderkloof) to historical annual generation patterns due to water availability. The full
capacity of these stations is thus not available in all hours; they can only be dispatched for a
limited number of hours per day.
The Generation Production Planning serves as the guide in resource utilisation for Eskom
power stations based on the current assumptions. The production plan gives an indication of
surplus energy as early as FY19 going forward. Eskom has to develop an asset utilisation
strategy to deal with excess capacity as there are several factors which must be taken in
account. Production planning depends on many forecast parameters, including:
• Government policies with regards to REIPPPP (Renewable Energy Independent Power
Producers Procurement Programme)
• Environmental compliance
• The impact of the Integrated Resource Plan (IRP) to Eskom
• Changes in the plant performance
• Delivery and performance of IPP’s.
• Recovery of the economy which will have impact on demand forecast
• Changes in Import as supplied by Southern African Energy

Production Plan
Eskom Holdings Revenue Application FY2018/19 Page: 55
9.4 Production plan results
FIGURE 23: PRODUCTION PLAN
Figure above reflects escalating supply from IPPs, while Eskom’s own supply is trending
downwards.
TABLE 15 : DETAILS OF PRODUCTION PLAN
9.5 Energy Losses
The nature of transporting electricity from generator to the end-users involves losses in
energy volumes (electrical or technical losses) that reduce the amount of electricity volumes
available for sale to end-customers. In addition, other energy losses may occur due to non-
metered usage related to electricity theft (non-technical losses). The representation of the
Actuals Projections Application
Electricity output 2016/17 2017/18 2018/19
Power sent out by Eskom stations, GWh (net) 220 166 221 395 216 771
Coal-fired stations, GWh (net) 200 893 201 796 198 908
Hydroelectric stations, GWh (net) 579 695 693
Pumped storage stations, GWh (net) 3 294 4 394 4 282
Gas turbine stations, GWh (net) 29 211 211
Wind energy, GWh (net) 345 282 277
Nuclear power station, GWh (net) 15 026 14 017 12 400
IPP purchases, GWh 11 529 12 208 18 429
Wheeling, GWh 2 910 2 562 2 453
Energy imports from SADC countries, GWh 7 418 9 670 9 381
Total Gross Production , GWh 242 023 245 835 247 035
Less Pumping 4 809 5 931 5 783
Total Net Production , GWh 237 214 239 905 241 252

Production Plan
Eskom Holdings Revenue Application FY2018/19 Page: 56
measure for the levels of the combined total technical and non-technical losses is by way of
loss factors.
Energy loss is an inherent risk in the electricity business and utilities globally are addressing
this issue, which costs billions of rand annually with developing countries being the worst
affected. Energy losses are incurred when energy is transferred from the suppliers to the
loads through the network. This energy lost, is approximately equal to the difference
between the energy supplied and the energy consumed.
• Transmission losses are determined by the difference between energy injected onto the
transmission grid and energy off-take at main transmission substations (MTS) and
interconnection points.
• Distribution losses are determined by the difference between energy purchased
(measured at main transmission substations) and energy sold to all Distribution
customers.
Energy loss has a direct effect and increases generation requirements (both capacity and
energy volumes) and primary energy costs.
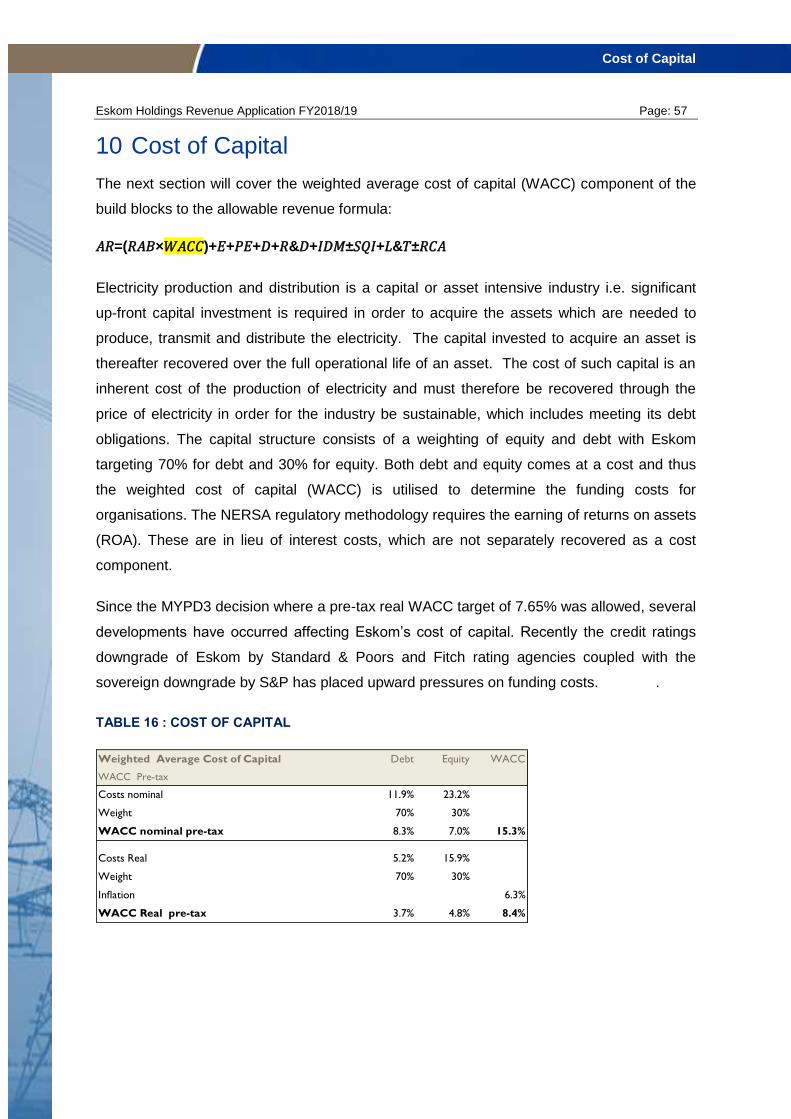
Cost of Capital
Eskom Holdings Revenue Application FY2018/19 Page: 57
10 Cost of Capital
The next section will cover the weighted average cost of capital (WACC) component of the
build blocks to the allowable revenue formula:
𝐴𝑅=(𝑅𝐴𝐵×𝑊𝐴𝐶𝐶)+𝐸+𝑃𝐸+𝐷+𝑅&𝐷+𝐼𝐷𝑀±𝑆𝑄𝐼+𝐿&𝑇±𝑅𝐶𝐴
Electricity production and distribution is a capital or asset intensive industry i.e. significant
up-front capital investment is required in order to acquire the assets which are needed to
produce, transmit and distribute the electricity. The capital invested to acquire an asset is
thereafter recovered over the full operational life of an asset. The cost of such capital is an
inherent cost of the production of electricity and must therefore be recovered through the
price of electricity in order for the industry be sustainable, which includes meeting its debt
obligations. The capital structure consists of a weighting of equity and debt with Eskom
targeting 70% for debt and 30% for equity. Both debt and equity comes at a cost and thus
the weighted cost of capital (WACC) is utilised to determine the funding costs for
organisations. The NERSA regulatory methodology requires the earning of returns on assets
(ROA). These are in lieu of interest costs, which are not separately recovered as a cost
component.
Since the MYPD3 decision where a pre-tax real WACC target of 7.65% was allowed, several
developments have occurred affecting Eskom’s cost of capital. Recently the credit ratings
downgrade of Eskom by Standard & Poors and Fitch rating agencies coupled with the
sovereign downgrade by S&P has placed upward pressures on funding costs. .
TABLE 16 : COST OF CAPITAL
Weighted Average Cost of Capital Debt Equity WACC
WACC Pre-tax
Costs nominal 11.9% 23.2%
Weight 70% 30%
WACC nominal pre-tax 8.3% 7.0% 15.3%
Costs Real 5.2% 15.9%
Weight 70% 30%
Inflation 6.3%
WACC Real pre-tax 3.7% 4.8% 8.4%

Cost of Capital
Eskom Holdings Revenue Application FY2018/19 Page: 58
Eskom’s updated WACC real pre-tax is 8.4% which is higher than the MYPD3 decision by
75 basis points. During the revenue application only a portion of the WACC is claimed
against the regulated asset base (RAB).

Regulated Asset Base
Eskom Holdings Revenue Application FY2018/19 Page: 59
11 Regulated Asset Base
The next section will cover the regulated asset base (RAB) component of the build blocks to
the allowable revenue formula:
𝐴𝑅=(𝑅𝐴𝐵×𝑊𝐴𝐶𝐶)+𝐸+𝑃𝐸+𝐷+𝑅&𝐷+𝐼𝐷𝑀±𝑆𝑄𝐼+𝐿&𝑇±𝑅𝐶𝐴
The ERA and the electricity pricing policy require the recovery of efficient costs and earning
a fair return on revalued asset valuations. The NERSA regulatory methodology allows for the
earning of returns for works under construction as interest costs are not separately
recovered as a cost component.
The opening RAB balance for FY2019 is based on the MYPD 3 decision which is then
adjusted for the latest capital expenditure forecasts for the period FY2014 to FY2018. The
average RAB value for FY2019 is R764bn.
TABLE 17 : REGULATORY ASSET BASE (RAB)
Power stations comprise a large proportion (72%) of the Eskom RAB at R550bn, with
Transmission contributing R109bn and Distribution R105bn.
TABLE 18 : LICENSEE BREAKDOWN OF RAB
Regulatory asset base
(Rand millions)
2018/19
Application
Assets 592104
Working capital & WUC 171485
Eskom RAB 763589
Regulatory asset base
(Rand millions)
2018/19
Application
Generation 549527
Transmission 109371
Distribution 104691
Eskom RAB 763589

Return of Assets
Eskom Holdings Revenue Application FY2018/19 Page: 60
12 Return of Assets
The next section will cover the return on assets which is a function (RAB X WACC)
component of the build blocks to the allowable revenue formula:
𝐴𝑅=(𝑅𝐴𝐵×𝑊𝐴𝐶𝐶)+𝐸+𝑃𝐸+𝐷+𝑅&𝐷+𝐼𝐷𝑀±𝑆𝑄𝐼+𝐿&𝑇±𝑅𝐶𝐴
Eskom has continued the approach of NERSA by phasing in the returns on the regulated
asset base resulting in a 2.97% ROA being requested; which equates to R22.7 billion. These
returns are lower than the 4.7% awarded in 2017/18 resulting in a drop of R12 billion in the
revenue requirement. These returns do not cover the full interest costs forecasted at R36
billion in 2018/19. Eskom has already paid R26 billion for interest in 2016/17. The escalation
in interest costs is directly correlated to the debt funding raised. Notwithstanding the price
increases awarded between 2008 and 2016, Eskom’s debt continued to grow even with the
increase in the price of electricity since 2008.
TABLE 19 : ESCALATING DEBT DESPITE RECEIVING PRICES INCREASES
This reduction in ROA is chosen to help keep the revenue and price impact as low as
possible. Eskom’s submission of 2.97% is a third of its cost of capital rate of 8.4%, resulting
in sacrificing on allowed revenue. The drop in debt in 2016/17 is attributable to the
conversion of the shareholder loan of R60 billion into equity.

Return of Assets
Eskom Holdings Revenue Application FY2018/19 Page: 61
TABLE 20 : RETURN ON ASSETS
The MYPD methodology allows for the returns on assets as a proxy for the recovery of
interest costs and an equity return to the shareholder. As a result of the phased in returns of
R22 690million which does not fully cover the forecasted interest costs of R36 billion there is
no residual available for equity returns. In terms of earning a full ROA of 8.4%, Eskom is
sacrificing R41 452 million. It is evident that the process for phasing-in of reasonable returns
is being further extended.
If Eskom were to apply for the full return on assets of 8.4% the allowed revenue would be
R261bn, which corresponds to an average price increase of 44% for the 2018/19 year.
Return on Assets 2018/19
(Rand millions) Application
Average RAB (R'm) 763 589
Full Return on Assets (ROA) % 8.4%
Returns (R'm) 64 142
Phased in ROA % 2.97%
Phased in Returns (R'm) 22 690
Returns sacrificed (R'm) -41 452

Depreciation
Eskom Holdings Revenue Application FY2018/19 Page: 62
13 Depreciation
The next section will cover the depreciation (D) component of the build blocks to the
allowable revenue formula:
𝐴𝑅=(𝑅𝐴𝐵×𝑊𝐴𝐶𝐶)+𝐸+𝑃𝐸+𝐷+𝑅&𝐷+𝐼𝐷𝑀±𝑆𝑄𝐼+𝐿&𝑇±𝑅𝐶𝐴
In accordance with the MYPD methodology, depreciation is computed by dividing the RAB
over the remaining life of the respective assets. Therefore the depreciation amounts have
remained relatively similar to 2017/18 as the RAB has not changed significantly. The
weighted average life for assets included in the RAB is 25 years. The depreciation disclosed
for regulatory purposes (in terms of the MYPD methodology) is based on a revalued modern
equivalent asset base and is thus different to the depreciation disclosed in the AFS which is
based on historic valuations.
TABLE 21 : DEPRECIATION
Depreciation 2018/19
(Rand millions) Application
Generation 19 062
Transmission 3 833
Distribution 6 245
Total Depreciation 29 140

Capital Expenditure
Eskom Holdings Revenue Application FY2018/19 Page: 63
14 Capital Expenditure
In this revenue application window, Eskom capital expenditure plans will focus on delivering
the following projects:
• New Build programme (Commercial operation of Medupi and Kusile) with some units on
accelerated construction plans
• Expanded and strengthened transmission grid which gets Eskom closer to N-1
compliance whilst executing the Power Delivery Plan
• Investments into other projects including Kusile Ash Dump, Majuba Silo recovery and
rail, Medupi FGD, Duvha Unit 3,
• Generation technical plan capital expenditure
• Primary Energy will invest into Cost-Plus mines which will provide Eskom with cheaper
coal.
• Eskom will also invest in projects to reduce particulate emissions and water
consumption, on the journey towards environmental compliance.
• Investments will be made in the refurbishment and strengthening of existing networks, in
building new networks for customers and in connecting IPPs.
• Eskom does not include DOE funded capex into the regulatory asset base.
TABLE 22 : CAPITAL EXPENDITURE
• The new build capital expenditure for Medupi and Kusile contributes R20 billion to
Generation capex spend of R46 494 million in 2018/19.
• Electrification capex funded by the Department of Energy assumed to be in the region of
R3.4 billion
Capital Expenditure (excluding IDC) 2016/17 2017/18 2018/19
(Rand millions) Actuals Projections Application
Generation 44 685 44 823 46 494
Transmission 5 971 6 814 11 492
Distribution 5 221 7 372 8 381
Total licensee capex excluding future fuel 55 877 59 009 66 367
Future fuel 114 2 864 3 911
Total licensee capex 55 991 61 873 70 278
Corporate capex 2 932 3 910 6 663
Eskom Capex portfolio (excl IDC) 58 923 65 783 76 941
Electrification (DOE Funded) 3 233 3 373 3 475

Capital Expenditure
Eskom Holdings Revenue Application FY2018/19 Page: 64
• Transmission growth is attributable substantially to capital expansion projects, together
with refurbishments, servitudes and environmental impact assessments (EIA)
• Distribution capital expenditure focusses on the strengthening of networks
• In addition to the above capital expenditure requirements, Eskom is pursuing alternate
funding options.

Primary Energy
Eskom Holdings Revenue Application FY2018/19 Page: 65
15 Primary Energy
15.1 Overall summary of primary energy
The next section will cover the primary energy (PE) and levies & taxes (L&T) components of
the building blocks to the allowable revenue formula:
𝐴𝑅=(𝑅𝐴𝐵×𝑊𝐴𝐶𝐶)+𝐸+𝑃𝐸+𝐷+𝑅&𝐷+𝐼𝐷𝑀±𝑆𝑄𝐼+𝐿&𝑇±𝑅𝐶𝐴
Primary energy costs equate to the costing of the production plan (electricity supply required
to meet demand). There are three sources of electricity supply comprising Eskom own
generation (majority), domestic independent power producers (IPPs) and regional import of
supply (international supply). Due to the roll out of renewable IPP domestic progammes
driven by DOE, there has been a growing trend in local IPPs over the last few years.
International supply represents substantially the supply from Cahora Bassa reflecting
declining trend recently attributable to the drought conditions. Therefore, Eskom’s own
generation is used to meet the balance of supply as renewables are non-dispatchable.
Eskom’s primary energy costs escalations are summarised as follows:
• Generation own costs have a compounded average growth rate (CAGR) of 1.5% per
annum from 2013/14 to 2018/19
• Own costs peaked in 2014/15 and 2015/16 when OCGTs were utilised during periods
of supply shortages to minimise/prevent load shedding
• In later years (2016/17~2018/19) the growth in local IPPs results in displacement of
Eskom power stations
• Local IPPs grew substantially from a low base and contributed positively especially
during supply challenges
• Total primary energy costs reflect a CAGR of 8.7% per annum between 2013/14 to
2018/19
• Coal burn costs reflect a CAGR over the period of 7% per annum

Primary Energy
Eskom Holdings Revenue Application FY2018/19 Page: 66
FIGURE 24 : PRIMARY ENERGY COST ESCALATIONS
The figure above highlights the drop in primary energy costs following the reduction in
OCGTs utilisation since September 2015. Eskom has assumed a maximum load factor of
1% of gas turbines in 2017/18 and 2018/19.
FIGURE 25 : GRAPHIC ANALYSIS OF PRIMARY ENERGY COSTS

Primary Energy
Eskom Holdings Revenue Application FY2018/19 Page: 67
TABLE 23 : DETAILED PRIMARY ENERGY COST
Note: The primary energy costs reflected in the Annual Financial Statements for 2016/17 is R82760 million. The
difference to the R84 722 million is because for regulatory purposes the IFRIC 4 adjustment relating to the DOE
Peaking station is reversed as the MYPD methodology allows for a full pass through of IPP costs.
Primary energy will be unpacked into more detailed for the three sources starting with IPPs
which is followed with international purchases and concludes with Eskom’s own generation
costs.
15.2 Independent Power Producers (IPPs)
IPP costs will increase from a 5% (FY2014) contribution to 26% (FY2018) of the primary
energy costs with the costs escalating from R3bn to R24bn over the MYPD3 period.
Actuals Projections Application
Primary energy costs R'million 2016/17 2017/18 2018/19
Coal usage 44 164 45 642 48 687
Coal obligations provisions 488 1 304
Water usage 1 751 2 185 2 310
Fuel & Water procurement service 163 211 223
Coal handling 1 758 1 874 1 974
Water treatment 423 465 490
Sorbent usage - 36 63
Gas and oil (coal fired start-up) 2 216 2 268 2 405
Total coal 50 963 52 681 57 456
Nuclear 727 808 865
Coal and gas (Gas-fired) 10 8 9
OCGT fuel cost 340 638 691
Demand Market Participation 194 301 319
Total Eskom generation 52 234 54 436 59 340
Environmental levy 8 087 8 152 7 994
IPPs 21 720 24 450 34 209
International Purchases 2 681 3 127 3 216
Total primary energy 84 722 90 165 104 759

Primary Energy
Eskom Holdings Revenue Application FY2018/19 Page: 68
15.2.1 IPP summary
TABLE 24 : SUMMARY OF IPPS
Production from IPPs over the MYPD3 period consisted of Eskom programmes
(STPPP/MTPPP) and those driven by the DOE (Renewables and Peaker). The figure below
reflects a movement away from STPPP/MTPPP to that of DOE progammes.
FIGURE 26 : IPP MIX OVER MYPD3 PERIOD
Supply from renewable IPPs have increased from R389 million (250GWh) in 2013/14
reaching R15 582 million (7 227GWh) by March 2017. During the same period, Eskom’s
own IPP initiatives (STPPP and MTPPP) incurred R 2877 million (3 421GWh) by March
IPPs (local) 2016/17 2017/18 2018/19 2016/17 2017/18 2018/19
Eskom short term programmes 4 235 424 424 3 952 274 302
MTPPP 29 0 - 37 -
STPPP (incl Munic) 4 101 0 - 3 845 -
WEPS 105 424 424 70 274 302
Section 34 programmes (-RE) 67 122 176 2 186 2 377 2 485
DoE Peaking 67 88 88 2 186 2 338 2 380
Co-generation - 34 88 - 39 105
Renewable IPP 7 227 11 661 17 828 15 582 21 631 31 230
Renewable IPPs Round 1 3 593 3 845 3 834 8 958 10 276 10 850
Renewable IPPs Round 2 2 671 3 072 3 074 5 430 5 917 6 191
Renewable IPPs Round 3 963 3 073 4 493 1 194 3 943 6 452
Renewable IPPs Round 3.5 - - 590 - - 2 308
Renewable IPPs Round 4 - 501 2 931 - 449 2 514
Renewable IPPs Round 4.5 - 1 091 2 721 - 939 2 629
Small-scale renewable 79 185 - 107 286
Total IPP 11 529 12 207 18 428 21 720 24 282 34 017
Network costs (UoS) 168 192
Total IPP 11 529 12 207 18 428 21 720 24 450 34 209
Cost (R million)Energy (GWh)

Primary Energy
Eskom Holdings Revenue Application FY2018/19 Page: 69
2014, growing to R3 952 million (4 235GWh) by March 2017. However, the need for these
programmes were removed and therefore forecasts to March 2019 reflect a mere R302
million (424GWh).
A. Department of Energy IPP Peaker Programme
The Peaker programme has been fully operational from 20 July 2016 with the Avon power
station joining the Dedisa power station in commercial operation, bringing the total capacity
to 1 005 MW. These power stations are compensated for available capacity on the system
separately to the energy produced as they are fully dispatched by Eskom’s System
Operator. The expected load factor of the two power stations (as dispatched by Eskom) is
1% in each year, leading to an expected energy output of 88 GWh per year.
B. Renewable IPP Programme
The Renewable IPP Programme (REIPPP) has concluded on seven bid windows (bid
window 1, 2, 3, 3.5, 4, 4.5 and the first bid window of the Smalls programme). This
application provides the expected energy purchased from these programmes only, assuming
that further programmes do not reach commercial operation during the application period.
The summary of the expected energy and total costs per bid window is indicated in Table 24
above. The costs for bid windows 4, 4.5 and the Small scale programme are based on
adjusted contract prices received from the IPP Office to account for foreign exchange
movements to July 2015. The final price for these contracts will be determined when the
contracts are signed as there is an adjustment for foreign exchange, amongst others,
relative to the bid prices.
C. Co-generation programme (only current window)
The IPP Office has concluded one contract under the Co-generation programme (with a
capacity of 11 MW). The expected energy and costs associated with this contract are
indicated in Table 25 table below.
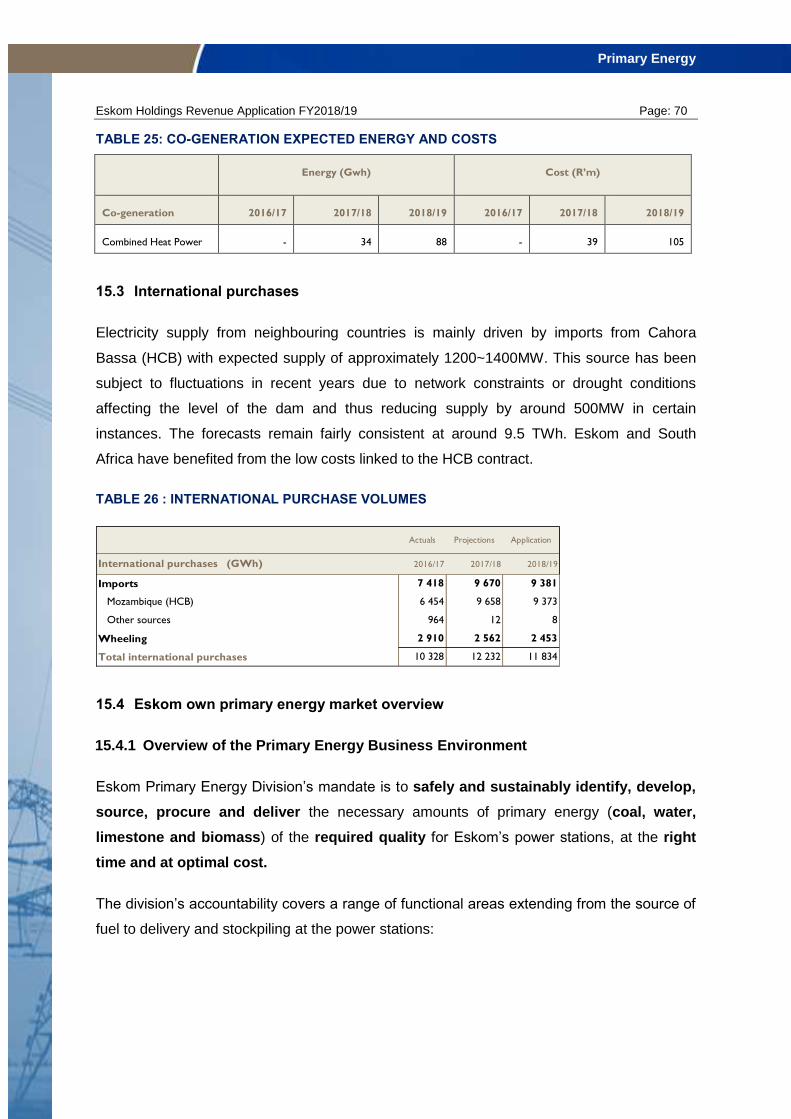
Primary Energy
Eskom Holdings Revenue Application FY2018/19 Page: 70
TABLE 25: CO-GENERATION EXPECTED ENERGY AND COSTS
Energy (Gwh) Cost (R’m)
Co-generation 2016/17 2017/18 2018/19 2016/17 2017/18 2018/19
Combined Heat Power - 34 88 - 39 105
15.3 International purchases
Electricity supply from neighbouring countries is mainly driven by imports from Cahora
Bassa (HCB) with expected supply of approximately 1200~1400MW. This source has been
subject to fluctuations in recent years due to network constraints or drought conditions
affecting the level of the dam and thus reducing supply by around 500MW in certain
instances. The forecasts remain fairly consistent at around 9.5 TWh. Eskom and South
Africa have benefited from the low costs linked to the HCB contract.
TABLE 26 : INTERNATIONAL PURCHASE VOLUMES
15.4 Eskom own primary energy market overview
15.4.1 Overview of the Primary Energy Business Environment
Eskom Primary Energy Division’s mandate is to safely and sustainably identify, develop,
source, procure and deliver the necessary amounts of primary energy (coal, water,
limestone and biomass) of the required quality for Eskom’s power stations, at the right
time and at optimal cost.
The division’s accountability covers a range of functional areas extending from the source of
fuel to delivery and stockpiling at the power stations:
Actuals Projections Application
International purchases (GWh) 2016/17 2017/18 2018/19
Imports 7 418 9 670 9 381
Mozambique (HCB) 6 454 9 658 9 373
Other sources 964 12 8
Wheeling 2 910 2 562 2 453
Total international purchases 10 328 12 232 11 834

Primary Energy
Eskom Holdings Revenue Application FY2018/19 Page: 71
FIGURE 27: PRIMARY ENERGY VALUE CHAIN
Within each of these functional areas lies an array of factors, over which Eskom has varying
degrees of influence.
FIGURE 28: CHALLENGES FACING PRIMARY ENERGY DIVISION
Eskom is exposed to various factors that have had, and will continue to have implications for
costs and security of primary energy supply to Eskom. Some of these factors above are
discussed below.
• Impact of economic uncertainty on the long term growth trend - Continued
uncertainty and economic instability increases the risk of over or under contracting of
coal supply, which necessitates the requirement for Eskom to increase the volume
flexibility in the portfolio of coal contracts. However, this flexibility will bear a cost.
• Changing the coal industry structure - The commodity boom has ended. This has
positive and negative implications for Eskom. On the positive side, one would expect
Eskom’s bargaining power during contract negotiations to be stronger. Eskom may now
not be competing with the export market for coal. On the negative side, where South

Primary Energy
Eskom Holdings Revenue Application FY2018/19 Page: 72
Africa previously seen the emergence of more junior and BEE miners in the coal sector,
the current cyclical downturn has resulted in a dearth of new mines.
• Mines are currently facing a multi-year price rout - Export coal prices are currently at
multi-year lows due to a structural oversupply of seaborne thermal coal. Many
investment decisions were made at the height of the last commodity boom, and now
these new mines are coming on line.
• Deteriorating resource/reserve base –
The mines in the Mpumalanga basin are entering a phase where the cost of coal is
driven upwards by factors such as deteriorating coal quality, increased occurrence of
geological disturbances, thinner coal seams, depleting reserves in the currently
accessible reserve blocks, high investments to access the remaining new small reserve
blocks and longer ‘on-mine’ transport distances.
• Increased transport distances between mines and power stations - The
procurement of coal from sources, which are great distances from the power stations,
will incur some kind of logistics cost to deliver that coal to the Power Station which will
result in an increase in the coal cost.
• Increasing environmental pressure - Water and coal are the most prevalently used
resources in coal fired generation. Eskom’s coal-focused generation mix also requires
significant volumes of water. The opening of new coal mines is expected to place
unsustainable pressure on the already strained environment and on water catchments,
while the increased burn at the power stations will have an adverse impact on air
qualities in Mpumalanga.
• A constraint on water supplies - Eskom is a strategic user of water, consuming
approximately 2% of the total annual use of the country, which is equivalent to the
consumption of the City of Cape Town.
• Supply constraints in key mining inputs - Most mine input costs have been increasing
at rates higher than general inflation over 2008-2014.
15.4.2 Key elements of Eskom strategy in response to trends and market forces
Eskom historically procured coal for its power stations on a dedicated-mine basis, where the
power station is built to the specification of the coal available and built as close as possible
to the mine. To cover full requirements, these long-term contracts were predominantly either

Primary Energy
Eskom Holdings Revenue Application FY2018/19 Page: 73
a cost plus or fixed price agreement. However, a long-term coal contracting model was not
always feasible, and in certain cases medium-term coal supplies were utilised, which
required coal to be transported over long distances, resulting in further cost increases.
In spite of these challenges, Eskom has managed to grow and diversify its supplier base and
continue to provide quality coal and water supply to ensure the powering of stations.
Furthermore, Eskom has identified coal sources for all of its power stations and has put in
place measures to establish contracts for the majority of its coal requirements.
15.4.3 Coal Supply to meet Coal Burn requirements
Eskom prefers to contract for coal on long term contracts. The presumption is that this
provides Eskom with assurance of supply at a lower cost because the supplier is able to
depreciate certain fixed costs over a longer revenue stream. Sometimes, for various
reasons, it is not possible to contract for all of Eskom’s coal requirements on long term
contracts. However, contracts of a shorter duration and a percentage of uncontracted coal
allow for flexibility should there be a change in overall demand or should there be a need to
change the mix of supply. It is prudent to have a portfolio of coal supply agreements that
allows flexibility to meet changing electricity demand patterns.
In FY17, approximately 63% of coal was procured on long term contracts. These are
historical contracts with original durations of 40 years, which were designed to match the life
of the associated power station(s). In FY19, this proportion increases to 70% because of the
increase in coal procured on the Medupi contract. There is also a planned small increase in
the proportion of coal from the cost plus contracts. This, combined with a decrease in the
total coal procured, results in less coal having to be planned for on medium term contracts,
as is evidenced in the figure below.

Primary Energy
Eskom Holdings Revenue Application FY2018/19 Page: 74
FIGURE 29: PLANNED COAL SUPPLY (MT)
i. Cost Plus Mines
The planned quantity from the cost-plus mines increases from 42 Mt in FY17 to 46 Mt in
FY19. There are a number of reasons for this:
• Production from these mines has declined over the past few years as the mines have
aged and reinvestment has stagnated. Earlier production from the cost plus mines
exceeded contractual obligations. In more recent years, the situation has reversed.
• Individual cost plus contracts are coming to the end of their terms.
• Operational issues can result in the mine being temporarily unable to mine or mining at
a lower rate.
• Investments in these mines will help increase volumes
ii. Fixed Price Mines
Eskom has four Fixed Price contracts. Three of these contracts are historical long term
contracts that supply coal to Matimba, Duvha and Hendrina Power Stations. A more recent
addition has been the contract with Exxaro to supply coal to Medupi Power Station.
• The coal contract for Hendrina Power Station expires at the end of 2018. It is assumed
that the coal will then be purchased on medium term contracts
• Matimba Power Station has a contract with Exxaro for 13 - 14 Mt p.a. Depending on the
electricity demand and how Matimba is scheduled to run, excess coal is stored on the

Primary Energy
Eskom Holdings Revenue Application FY2018/19 Page: 75
station’s stockpile. When stockyard capacity is reached, the take or pay payments need
to be made. Prior to that coal from the contract with Exxaro is stockpiled until the
stockyard reaches full capacity. Thereafter, provision has been made for the take or pay
payment.
• It is important to note that most of the coal supply agreements have a take or pay
arrangement. The geographical location of Grootegeluk mine supplying Medupi and
Matimba Power Station make it expensive logistically to deal with an oversupply
situation.
iii. Medium Term and uncontracted coal
Coal contracted on medium term contracts to fill the gap between long term contracts and
the coal requirement.
Procurement of coal from medium term (MT) contracts declines over the period as
production from coal fired stations declines. This plan also includes increased production
from the cost plus mines as investment in the mines are rolled out. Arnot Power Station
receives its coal from MT contracts since the cost plus contract expired at the end of 2015.
Majuba, Komati, Grootvlei and Kusile Power Stations do not have dedicated mines. These
stations still plan for all their coal from medium term contracts.
15.4.4 Annual coal purchases costs
The largest component of the projected annual coal expenditure is the costs from existing
and new long term coal sources. This is in line with the first principle of the long term coal
supply strategy, namely, securing long term contracts with mines close to power stations.
Over the FY17-FY19 period, compound average growth rate of the annual coal expenditure
is ~5%.
‘Other’ costs referred to below, includes coal sampling costs and amortisation of logistics
investments.

Primary Energy
Eskom Holdings Revenue Application FY2018/19 Page: 76
FIGURE 30: ANNUAL COAL EXPENDITURE PER SUPPLY SOURCE
The average delivered cost will be affected by the transport solutions that are introduced
over the period and by the volume of medium term coal, as this coal is typically transported
over longer distances than the long term cost plus and fixed price coal. The mode of
transport is by road and/or rail, which is more expensive than conveyor. The average annual
increase is 5%, as per the figure below.

Primary Energy
Eskom Holdings Revenue Application FY2018/19 Page: 77
FIGURE 31: AVERAGE DELIVERED R/TON COAL COST
The bulk of the average cost of a ton of coal delivered to a power station is the ex-mine cost
of the coal. This is around 84% of the cost. Transport as a percentage of total average
delivered coal cost is around 14%. Other costs, such as take or pay payments and
laboratory fees, comprise about 2%. The average increase in FY19 is 8%. The increase in
the unit cost of long term cost plus coal is 8%, long term fixed price coal is 14%, and
short/medium term coal is 8%.
15.4.5 Detailed coal burn costs
Further details on coal burn costs, in accordance with the MYPD methodology are reflected
in Appendix 1. NERSA requires burn to be submitted per station, per contract type and per
supplier. Eskom calculates coal burn on a weighted-average-cost basis. A single coal stock
pile is maintained for all coal delivered to the stock yard, irrespective of the contract type.
The coal is burnt as a single, mixed product and not as three different product types.
Accordingly, coal burn does not differentiate between contract types (i.e. cost-plus, fixed-
price or medium term). Eskom has submitted coal burn assumptions per power station.
Eskom has furthermore made assumptions to split coal burn by contract type, calculating
coal burn in the same ratio as coal purchases.

Primary Energy
Eskom Holdings Revenue Application FY2018/19 Page: 78
15.4.6 Transport Costs
Eskom transports coal by one of three modes or a combination of these modes:
• Conveyor – this is the mode used for coal from collieries located close to the power
station receiving the coal. It is the cheapest mode.
• Rail – Transnet Freight Rail provides the rolling stock. Coal is railed from the supplier to
the power station, if the supplier and the power station have the infrastructure.
Alternatively, coal may be transported by a combination of rail siding and truck. The
more complex the transport arrangement, the more expensive the transport cost is likely
to be.
• Road – Coal is trucked to its destination when conveyor and rail are not possible.
Rail is preferred over longer distances. However, only Majuba and Tutuka Power Stations
have the infrastructure for coal to be railed to the station. Grootvlei and Camden Power
Stations are located close to rail sidings. Rail has, historically, been cheaper than road.
Transnet is the only provider of freight rail and determines the tariff, which varies with the
type of service required, e.g. open top wagons are cheaper than closed containers. Tariffs
are escalated annually in accordance with a basket of published indices agreed to by Eskom
and Transnet. This increase has been higher than general inflation over the past five years.
The current contract with Transnet expires in March 2018. A new contract has not been
finalised as yet. This plan assumes that:
• There will be a step change in the rate in that year. Thereafter, the rate is forecast to
increase at 12%p.a.
• The new contract will not include any minimum volume clauses.
The volume on rail increases from 13.2 Mt in FY17 to 14.5 Mt in FY19. It is assumed that
new coal purchases will be delivered via rail. These sources at the time of this document
have not yet been established or been through the required commercial processes.
Transport on road is managed using two types of contracts:
• Delivered – the cost of coal includes the cost of transport. The coal supplier is
accountable for the transport. The transporter contracts with the mine.
• Free Carrier Agreement (FCA) – Eskom pays the coal supplier for the coal only. Eskom
then allocates the route to one of the transporters contracted to Eskom. The existing

Primary Energy
Eskom Holdings Revenue Application FY2018/19 Page: 79
FCA contracts expire at the end of March 2018. The assumption is that the same terms
and conditions will apply to any further contracts and that there will be additional costs
incurred.
The table below indicates the total annual cost of transport and the volumes per transport
mode.
FIGURE 32: PLANNED LOGISTICS MODES AND COSTS FOR LONG AND MEDIUM TERM
SOURCES
The average annual cost of getting a tonne of coal from the source to the power station
increases by 10% p.a. Coal transported by rail will often include a road component because
there may not be an available rail link. In some instances, the multi-mode trip may be more
expensive than a direct road trip, but rail is preferred because the reduced time on the road
translates into fewer opportunities for road accidents.
Further details on assumptions on escalation rates and transport costs are provided in
Appendix 1.

Primary Energy
Eskom Holdings Revenue Application FY2018/19 Page: 80
15.4.7 Coal Stock
Closing stock levels in FY15 were 51 days. From FY17, planned stock levels exceed the
system maximum. This is because of increasing levels of stock at Lethabo, Matla, Medupi,
Matimba and Kusile Power Stations. More details on coal stock have been included in
Appendix 1.
15.5 Water costs
Eskom pays for the water it consumes through a series of water tariffs. These are legislated,
so Eskom has no control over the tariffs. Historically, water costs have been very low as a
percentage of the Eskom operating costs. The main reason for this is that the water
infrastructure assets (Eskom’s and that of DWA) were constructed several years ago and
are almost completely depreciated. As new infrastructure and water charges have been
introduced, the demand for water and the cost have increased. Furthermore, the cost
increases as the distances over which water needs to be transferred increase and as new
tariffs are introduced into legislation.
New water infrastructure includes augmentation to the Vaal, Komati and Mokolo water
schemes. The DWA National Water Pricing Strategy allows DWA to implement these
projects “off budget” and to recover associated costs via a tariff. The Komati and Mokolo
costs are recovered on a take or pay pricing basis.
The water financial plan comprises the following cost elements:
• Water cost, including cost of new water infrastructure
• Electricity
• Operations and maintenance
• Amortisation and capital spend
15.5.1 Key drivers for water costs
i. The Department of Water Affairs under-spent on maintenance and refurbishment of
bulk water infrastructure over the years. This has resulted in a backlog of maintenance
and refurbishment that is required to be planned and implemented in the forthcoming
years to ensure plant reliability and availability.
Primary Energy
Eskom Holdings Revenue Application FY2018/19 Page: 81
ii. The development and implementation of new water infrastructure, such as Mokolo
Crocodile River (West) Water Augmentation Programme (MCWAP) 2 required for
water to the Waterberg, will increase the cost of water.
iii. Water costs are regulated in line with the prevailing National Water Pricing Strategy. A
new draft Water Pricing Strategy has been issued. Water tariffs could change during
the latter part of MYPD3 or during this application period. Water cost increases are
primarily driven by increasing water demands of the new build and Return to Service
power stations, which require new water infrastructure and therefore higher capital
tariffs to repay off the financing debt. The MCWAP2 pipeline to Medupi Power Station
has a take or pay contract.
iv. The water deficit in the Integrated Vaal River System has resulted in Eskom driving
water conservation and demand management initiatives to reduce its freshwater
footprint and diversify its water mix. As part of its planned projects, Eskom will increase
its use of treated mine water, thereby increasing the capital requirements for the
development and implementation of mine water treatment plants and the management
of waste.
v. The Department of Water Affairs is also rationalising and reforming its water
institutions at catchment and national levels which may result in increasing water
management fees being levied on all water users.
vi. Increased volumes of contaminated water at collieries will result in higher costs of
water management.
With ageing bulk water supply infrastructure, deteriorating water quality and competition for
water resources, especially during drought conditions, Eskom needs to ensure provision of
water to its power stations are secure.
More details on water costs, manner of determining water costs and key drivers of water
costs are included in Appendix 3.
15.6 Sorbent
Sorbent (limestone) is required for the flue gas desulphurisation (FGD) technology at Medupi
and Kusile Power Stations. The sources identified for this commodity are located in the
Northern Cape. The limestone is railed from the Northern Cape to Gauteng. Then, because

Primary Energy
Eskom Holdings Revenue Application FY2018/19 Page: 82
of a lack of rail infrastructure, it is trucked to the powers stations. These process increases
the delivered cost of sorbent significantly.
The use of sorbent also increases the water requirements at each of the above mentioned
power stations. The primary energy water volumes and cost include water for FGD at
Medupi and Kusile, based on a requirement of 0.45 litres per unit of energy sent out.
15.7 Nuclear fuel
The cost of the delivered nuclear fuel is expensed as part of Koeberg's primary energy costs
over the period that the assemblies remain in the reactor, which is normally 54 months. Thus
there is not a direct correlation between when the nuclear fuel procurement costs are
incurred and when it is expensed as primary energy costs.
The pricing formula for the fuel fabrication is 100% of the base escalated price. For the rest,
i.e. uranium, uranium conversion and uranium enrichment, a mix of price conditions have
been agreed to, e.g. a mix between base escalated and market related prices, a mix
between term and spot market prices and a contract with a reset of the base price to market
prices during the contract period.
Koeberg Power Station consists of two reactors requiring each a loading of the reactor core
of 157 fuel assemblies to achieve an even energy output as one third of the fuel assemblies
are replaced at each refuelling cycle. These fuel assemblies remain in the reactor core and
are “burnt” over a period between 45 and 54 months depending on the Production Plan and
the refuelling strategies. The costs of the fresh fuel assemblies are amortised over the
anticipated burn period and are reflected in Primary Energy costs. Factors influencing
Koeberg’s primary energy (nuclear fuel) costs include:
15.7.1 Nuclear Fuel Price
Nuclear fuel procurement comprises mainly of four distinct phases, being procurement of
uranium, conversion of the uranium into the gas UF6, enrichment of the U-235 isotopes to the
required level, and the fabrication and delivery of the fuel assemblies. All these activities are
undertaken internationally and are subject to market price and foreign exchange fluctuations.
Eskom has contracts that cover 100% of Koeberg’s demand until the end of 2017 with
procurement currently in progress to acquire uranium, conversion and enrichment services
for the period up until 2028. For the fuel assembly fabrication phase, Eskom recently

Primary Energy
Eskom Holdings Revenue Application FY2018/19 Page: 83
concluded contracts for the supply of fabricated assemblies up until 2022 with an option to
extend to 2026.
Production Plan is influenced by Koeberg’s need for refuelling every eighteen months as
well as it maintenance regime which requires it to replace and modify its plant components.
The fuel is burnt over a period of three reload cycles of approximately eighteen months
each, being a total of 54 months, however based on the energy requirements some fuel
assemblies may be changed and replaced with fresh fuel after only two cycles. These
partially burnt assemblies are then expensed fully and removed from the reactor.
Spent Fuel Management Costs - The costs associated with the management, including the
disposal of the Spent Fuel Assemblies generated by Koeberg is quantified from extensive
studies which is incorporated into the Reference Technical Plan and reflected into a Spent
Fuel Management Provision. The costs in raising the liability to safely and responsibly
manage the spent fuel is amortised over the burn period of the fuel in the reactor core. The
Spent Fuel Reference Technical Plan, which is based on extensive consulting studies, is
revised every three years or when deemed necessary. In 2014, Koeberg experienced a
significant increase in the costs anticipated in the management of used fuel, mainly due to
the weakening pf the Rand against other trading partners, and an adjustment of R 830m to
the Primary Energy costs was adjusted.
TABLE 27 : KOEBERG NUCLEAR FUEL COSTS
These costs represent the fuel burnt as per the Production Plan. The fuel assemblies
loaded are expected to be burnt over a period of three cycles which equates to 54 months.
15.7.2 Fuel burnt
All the costs required to manage the Spent Fuel must be allocated to period of production
from which the benefits of burning the fuel is derived. Hence the costs relating to the long-
term storage and disposal of the fuel is expensed over the period for which the fuel is
burnt. This represents the variable costs of burning the fuel as should the fuel not be
Nuclear fuel Actuals Projections Application
2016/17 2017/18 2018/19
Fuel burnt 638 712 713
Depreciation of Decomm Asset 39 65 77
Decomm provision adjustment
Total 727 808 865

Primary Energy
Eskom Holdings Revenue Application FY2018/19 Page: 84
irradiated the costs would be avoided. The above charge to the income statement is
credited to Spent Fuel Provision thereby ensuring that the obligation for managing the
Spent Fuel is correctly reflected on the balance sheet.
The Spent Fuel assemblies are stored in the Spent Fuel Pools at Koeberg Power Station;
however given that Koeberg is over 30 years in use, the pools are reaching their capacity.
The station has commenced acquiring Spent Fuel Casks which will allow the spent fuel to
be removed from the pools and stored in dual-purpose, storage and transport casks. With
each fresh reload of fuel into the reactor core the displaced spent fuel from the core will
require older and cooler spent fuel to be removed from the pool. Hence the cash flow
expenditure relating to the Spent Fuel Provision is now being incurred in the 2017 financial
year and will continue through to the end of life of the station. Unlike the Plant
Decommissioning expenditure which is mainly incurred at the end of life of the station, the
spent fuel decommissioning expenditure is a current and ongoing cost.
15.7.3 Nuclear Other
These costs represent the write-off of partially burnt fuel. Partially burnt fuel arises when
due to energy requirements not all fuel assemblies can be fully burnt over the 54 months.
The Reactor Fuel Engineering section calculates the energy requirements from the fuel so
as to ensure sufficient energy for the full duration of each cycle.
15.8 Open Cycle GasTurbines (OCGTs)
The OCGT’s (Ankerlig and Gourikwa) are heavy duty industrial gas turbines (Siemens) and
can be used over a wide variety of loading regimes from peaking to base load. The OCGT’s
(Acacia and Port Rex) are based on jet engine technology.
15.8.1 Decision Making Criteria
When making a decision to run the OCGTs, all available resources are considered, for the
current day as well as the next few days. Possible restrictions on Eskom generation include
the dam levels at the pump storage stations (Palmiet and Drakensberg) and the availability
of water at the other hydro stations (Gariep and Vanderkloof) which is managed by the Dept.
of Water Affairs. Once available base-, mid merit and hydro-generation has been utilised or
planned to be utilised over peak, load reduction demand response options is dispatched.
These have limited energy reduction opportunity and they are normally planned to be utilised

Primary Energy
Eskom Holdings Revenue Application FY2018/19 Page: 85
over peak. Emergency reserves are then considered. These include Emergency Level 1,
Interruptible Load Shedding (ILS) and the OCGT generation.
TABLE 28 : OCGTS DECLINING USAGE
Eskom’s utilisation of gas turbines has decreased from R10.6bn (2013/14), R9.5bn
(2014/15) and R8.7bn (2015/16) to R691 million in 2018/19.
The price used to forecast costs of gas fired stations was based on the ruling rate of 2
November 2016. The price was then escalated with the CPI inflation parameters of 6.3% for
2018. There is monthly storage fees included for the fuel tanks where diesel stocks are kept.
It must be noted that the costs of R340 million incurred in 2016/17 included an amount of
R281 million for storage costs. Therefore the balance of R59 million is linked to the actual
burn volumes of 24 GWh.
15.9 Start-up fuel
Heavy fuel oil starts and shuts down a coal fired power station and stabilises the boiler
flame on occasion e.g. when operated at low load. The increase in 2014 is a result of
increased generation by Medupi and Kusile Power Stations.
15.10 Water treatment
The quality of water from the various sources also impacts on the water treatment cost.
From 2009 to 2010, the increase in the consumption of water from the Usutu Vaal by
power stations on the Komati system meant that these stations needed to spend more on
treating water. Similarly, the cost of water treatment increases from 2011 as the transfers
from the Vaal system increase to augment the Komati and Usutu Vaal systems.
Further details on water treatment costs are included in Appendix 4.
Open Cycle Gas Turbines (OCGTs) Actuals Projections Application
Unit 2016/17 2017/18 2018/19
Volumes GWh 24 211 211
OCGTs costs R'm 340 638 691

Primary Energy
Eskom Holdings Revenue Application FY2018/19 Page: 86
15.11 Coal Handling
Coal handling refers to all the activities that are necessary to get the coal to the boiler
once it has been delivered to the power station. This includes stockpile maintenance, and
coal reclamation. It is an integral part of power production and the costs reflect a moderate
increase over the planning period.
Further information with regards to Eskom coal handling costs per power station is included
in Appendix 2. Assumptions are made with regards to the contribution of drivers for the coal
handling costs.
15.12 Environmental levy
The environmental levy on the generation of electricity from non-Renewable generators was
promulgated in July 2009. All Eskom generators, with the exclusion of Hydro and Pumped
Storage Power Stations, were registered and licenced as manufacturing warehouses as
required by the legislation.
15.12.1 Environmental levy payment
From 1 July 2012, the environmental rate is 3.5c/kWh. The actual payments to SARS are
determined by the true metered generated volumes. However, for this submission the
Production Plan which measures Energy Sent Out as measured after the high voltage
transformer is used to derive the assumed cost. To obtain the Generated volume an
expected auxiliary consumption, based on actual historical performance, which is unique to
each Power Station is added to the Energy Sent Out volume as published in the Production
Plan. This derived Generated volume is then charged at the applicable Environmental Levy
rate for that period to obtain the budgeted cost per Power Station. It is assumed for the
planning period that no further rate increases will occur.

Primary Energy
Eskom Holdings Revenue Application FY2018/19 Page: 87
TABLE 29 : ENVIRONMENTAL LEVY
15.12.2 Equivalent Revenue from Environmental Levy
The methodology, as approved by NERSA is based on the principle that the levy is raised at
electricity production and that the electricity sales volumes is lower than the production
volume. Thus the environmental levy cost is equivalent to the revenue related to the
environmental levy.
The environmental levy cost is raised on the production electricity volumes that are made up
of auxiliary consumption, electrical losses and electricity sales volumes. Electricity sales are
a combination of renewable and non-renewable electricity generated. Utilising the sum of the
renewable and non-renewable volumes in the cost allocation solves for the limitation of
separately identifying non-renewable electricity sales volumes. The approach of an equal flat
c/kWh approach to allocate the environmental levy costs facilitates an equal allocation of the
environmental costs across the total supply when the volume is categorised either as
auxiliary consumption, electrical losses or electricity sales. The retail charges to recover the
environmental levy costs are informed by the factors causing the levy’s costs and recovery
as well as the tariff regulations and the cost recovery principles.
Actuals Projections Application
Environmental levy 2016/17 2017/18 2018/19
Energy sent out (GWh) 220 166 221 395 216 771
Non Renewable ESO (GWh) 215 948 216 024 211 519
Renewable ESO (GWh) 4 218 5 371 5 252
Generated volume (GWh) 232 462 232 900 228 390
System average auxilliary % 7.65% 7.81% 7.98%
Environmental levy rate (c/kWh) 3.50 3.50 3.50
Environmental levy cost (R'm) 8 086 8 152 7 994

Operating Cost
Eskom Holdings Revenue Application FY2018/19 Page: 88
16 Operating Cost
16.1 Overall summary of operating costs
The next section will cover the operating expenditure (E) element of the build blocks to the
allowable revenue formula.
𝐴𝑅=(𝑅𝐴𝐵×𝑊𝐴𝐶𝐶)+𝐸+𝑃𝐸+𝐷+𝑅&𝐷+𝐼𝐷𝑀±𝑆𝑄𝐼+𝐿&𝑇±𝑅𝐶𝐴
Eskom’s operating costs, excluding impairments, over the period 2013/14 to 2018/19
(application year) have grown at rates that approximate inflation. Analysis reflects that
employee benefits have a CAGR of 4.9% in this horizon. Similarly, the operating and
maintenance costs have a CAGR of 7.3% over the period. There is a relative plateau in the
Eskom’s overall operating costs in the later years of this period. Operating costs remains flat
in 2017/18 followed by 4.6% increase in costs in 2018/19 before taking into account costs
not claimed in this application.
FIGURE 33 : TRENDS IN OPERATING COSTS
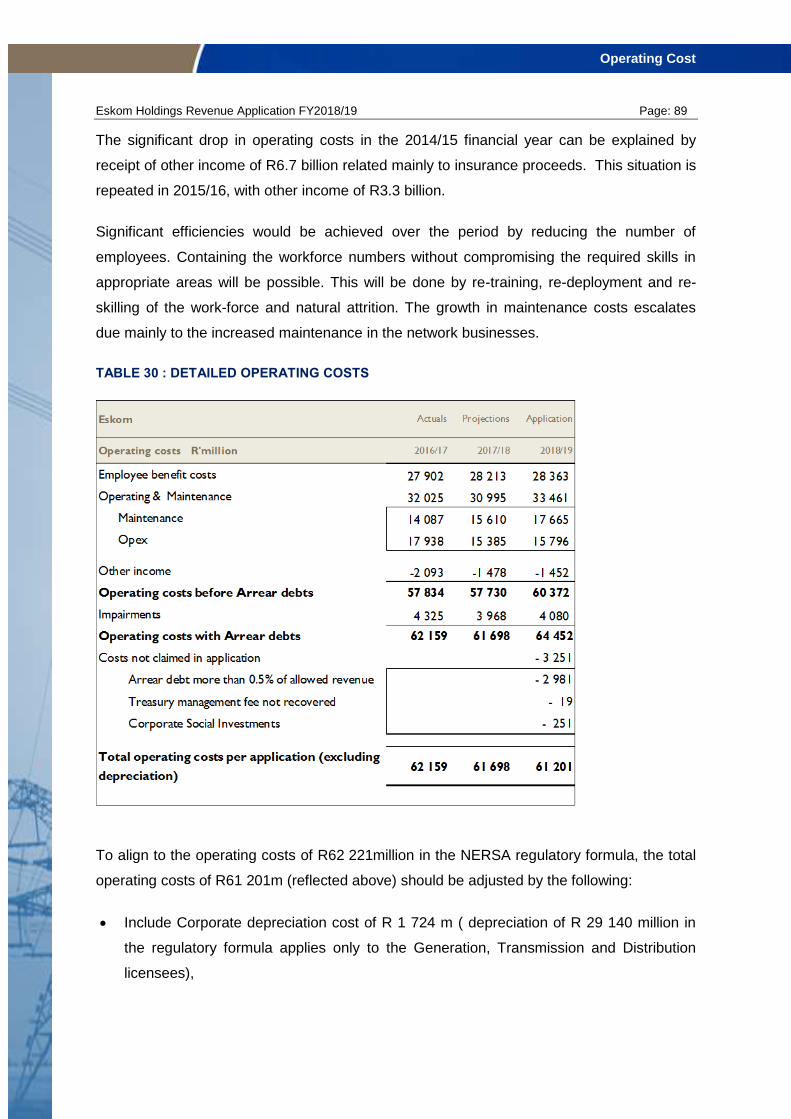
Operating Cost
Eskom Holdings Revenue Application FY2018/19 Page: 89
The significant drop in operating costs in the 2014/15 financial year can be explained by
receipt of other income of R6.7 billion related mainly to insurance proceeds. This situation is
repeated in 2015/16, with other income of R3.3 billion.
Significant efficiencies would be achieved over the period by reducing the number of
employees. Containing the workforce numbers without compromising the required skills in
appropriate areas will be possible. This will be done by re-training, re-deployment and re-
skilling of the work-force and natural attrition. The growth in maintenance costs escalates
due mainly to the increased maintenance in the network businesses.
TABLE 30 : DETAILED OPERATING COSTS
To align to the operating costs of R62 221million in the NERSA regulatory formula, the total
operating costs of R61 201m (reflected above) should be adjusted by the following:
Include Corporate depreciation cost of R 1 724 m ( depreciation of R 29 140 million in
the regulatory formula applies only to the Generation, Transmission and Distribution
licensees),

Operating Cost
Eskom Holdings Revenue Application FY2018/19 Page: 90
Exclude research costs of R 193 m (reflected separately in the regulatory formula) and
Exclude IDM costs of R 511 m (reflected separately in the regulatory formula).
Eskom has maintained the approach in the MYPD3 decision to allow for 0.5% arrear
debt/impairments allowance which means that the actual arrear debt of approximately 2% is
reduced in the application.
16.2 Employee Benefits
Approximately 80% of Eskom’s staff complement belongs to the bargaining unit and 20% are
positioned at managerial level.
Employee benefits costs are influenced by three main factors:
• Staff complements
• Employee benefits increases
• Level of remuneration
16.2.1 Staff complement
The planned number of employees are assume to decrease from 43 640 to 39 186 by
2018/19. This will occur through planned attrition or alternates that support savings initiatives
and efficiencies.
16.2.2 Employee benefits increases
When comparisons are made to Eskom’s employee benefit escalations, they are either to
the overall generic labour market (Market move) or to average settlements (for bargaining
unit). The employee benefit costs comprise of direct remuneration (salary, pension, medical
aid, bonus, overtime) and indirect remuneration (training and development, temporary and
contract staff).
In assessing Eskom’s market position the following is important:
i. Eskom has consistently benchmarked the salaries and related benefits of all levels of
employees to ensure meaningful market alignment. For this purpose Eskom
participates in market surveys conducted by both the Deloitte Salary Survey and
the PE Corporate Services salary survey. The two surveys cover 850 South African
employers, and more than 1.5 million employees. This process allows for the

Operating Cost
Eskom Holdings Revenue Application FY2018/19 Page: 91
meaningful comparison of Eskom remuneration levels within the broader labour
market.
ii. Eskom operates from more than 450 geographic worksites across the country placing
strain on the supply and retention of skills in general. The extend of and the duration of
technical training and safety authorisation of employees deployed on the Generation,
Transmission and Distribution side of the business, further requires that measures are
put into place to stabilise the work force and minimise turnover.
iii. As a responsible employer and with due regard to the social and economic challenges,
salaries at lower level of the business are positioned above the market median,
however managerial level remuneration are closely aligned with the market.
TABLE 31 : EMPLOYEE COSTS
Note: The above employee costs are based on annualised costs and not the actual amount
incurred in the respective year.
Total labour costs, including direct and indirect remuneration, increased by 50.2% over the
period analysed which is aligned to the market average move of 50%.
• The year on year increase in Total Labour cost has slowed from 17.8% in 2012 to -2.1%
in 2016. This demonstrates that increased focus and management was placed on
controlling the Labour costs during the latter years of the period of analysis.
• The increased focus and management is mainly evident in the indirect remuneration
component, which increased by 16.4% over the period.
• The low increase in indirect remuneration component in comparison to the Headcount
Adjusted Market Move Benchmark is primarily influenced by a reduction in cost seen in
2015 and 2016.
• In addition, the Direct Remuneration component also exhibits evidence that, from 2014
to 2016, control has been placed on the increase in this cost component.

Operating Cost
Eskom Holdings Revenue Application FY2018/19 Page: 92
• This control in Direct Remuneration cost component increase is noticed through the
reduced increase percentages observed (2012 equals a 19% increase while 2016 equals
a 6.1% increase) despite headcount movements remaining relatively stable (2012 a
4.5% headcount increase and in 2016 a 2.2% headcount increase).
The table below summarises various factors related to employee benefit settlements. These
are comparison of the NERSA assumed CPI to the actual CPI; Eskom bargaining unit
increases; average settlements in the market and reported market movements.
TABLE 32 : EMPLOYEE BENEFITS INCREASES COMPARED TO INFLATION
• NERSA assumed CPI for the MYPD 3 period fixed at an average of 5.6%
• With the exception of 2015, actual CPI over the period was consistently slightly above
NERSA assumptions
• The average settlement agreed in the unionised labour (bargaining unit) market was
consistently above the average movement in salaries in the general market environment.
Eskom salary movement over the period is thus well aligned with the average settlements in
the collective bargaining environment.
16.2.3 Level of remuneration
Eskom’s remuneration levels for (bargaining unit) staff reflects packages which are higher
than the combined market reference based on unions requests being premised on improving
the living standards of members. Alternatively at managerial level the Eskom is either
tracking the market or below as presented below.

Operating Cost
Eskom Holdings Revenue Application FY2018/19 Page: 93
FIGURE 34 : LEVEL OF REMUNERATION
16.2.4 Total Employee benefit costs
The total employee benefits costs in 2018/19 are R28.4 billion. Employee benefit costs are
forecasted to remain relatively flat between 2016/17 (R27.9 billion) and 2017/18 (R28.2
billion). There is an escalation of 1% to 2017/18 and a further 0.5% growth to 2018/19.
FIGURE 35 : EMPLOYEE BENEFITS AND STAFF COMPLEMENT
Employee benefit expenses consist of both payroll and non-payroll expenses (indirect costs
such as training and development). The average cost per head is calculated by dividing the
payroll costs for permanent employees by the number of permanent headcount. Dividing

Operating Cost
Eskom Holdings Revenue Application FY2018/19 Page: 94
gross employee benefit expenses by permanent headcount would therefore overstate the
average cost per head.
Eskom will embark on a drive to review the operating model to ensure the right balance of
skills and workforce numbers are embedded across the business. Workforce optimisation
was identified as a major component to drive internal efficiencies, increase productivity and
lower the operating cost.
Eskom’s headcount will be reduced over the next few years. The gross costs are inclusive of
cost to company remuneration and other staff related expenditures such as training,
professional fees, overtime and contingency travel costs.
The gross employee benefit costs directly incurred for capital projects are allocated to the
projects (capitalised) and recovered over the life of the capital asset through amortisation
when the asset is depreciated. The costs are therefore not recovered immediately through
the revenue application as a major portion is recovered over the life assets.
In conclusion it is impossible to assume that unionised labour will settle for CPI increases
which go against the drive to improve the living standards of their members. Furthermore
this sector of labour is exposed to different inflationary basket driven through transport, food
and clothing costs which creates “skewness” from a CPI perspective.
16.3 Operating and Maintenance costs
As the business strives to accelerate maintenance programmes, and with the aging of plant
it is expected that maintenance costs should increase.
16.3.1 Generation maintenance
Generation maintenance is driven by the ageing fleet which now on average about 30 years
old and high UCLF impact on maintenance costs. The outlook for the future reflects a real
increase in maintenance costs on this ageing fleet.
In the last 3 years a steep increase in maintenance costs was experienced. The fruit of this
expenditure is evidenced by the significant improved technical performance of the power
stations and projection to improve performance further in the next couple of years. It needs
to be highlighted that the operating costs for the new power stations generally reduce. Costs
are high initially, as only one unit of Medupi is initially operational, but as further units are

Operating Cost
Eskom Holdings Revenue Application FY2018/19 Page: 95
commissioned over the planning horison and capacity is added, the overall costs are
expected to reduce. Over time, the operating costs of the new stations will be about half of
that of the older fleet of stations. This can be expected as maintenance costs on the new
stations are a lot less than at the old stations and economies of scale contribute further with
the bigger new units with the latest, more efficient technologies.
16.3.2 Transmission
Transmission maintenance workload is driven by the size of the network and the age of
assets. The expansion of the transmission network will result in increased maintenance
workload going forward. Transmission’s maintenance strategy includes the compilation and
review of maintenance philosophies, standards and procedures.
The maintenance philosophy is mostly time-based, but also considers the following:
• Operational information (usage)
• On- and off-line condition monitoring
• Plant performance information
• Non-intrusive functional testing
• Statutory requirements
• Safety of assets and people
Maintenance is planned and executed in accordance with maintenance standards and
procedures. A maintenance management system is used for maintenance planning and
scheduling.
Live line maintenance is utilised to overcome planned outage constraints or during
emergencies. This requires specialised skills and equipment which has an impact on
maintenance costs.
16.3.3 Distribution
Distribution’s existing infrastructure has reached an advanced stage of its asset life; planned
electrification networks now means certain networks are at near the end of life. Future
connection and changes in the customer base requires a sustainable maintenance regime.

Operating Cost
Eskom Holdings Revenue Application FY2018/19 Page: 96
The following factors are important maintenance expenditure considerations
• Aging Network: Refurbishment requirements have been identified to address the aging
network. Inadequate refurbishment will contribute to increased maintenance
requirements. The inability to address these maintenance requirements will lead to
further declines in performance.
• Access to Skills: Maintenance requirements are based on Distribution having
sufficiently skilled resources. Reduction in these will compromise preventative and
corrective maintenance requirements
• Universal Access: Acceleration of the Universal Access Programme will result in
corresponding growth in the asset base which impacts the maintenance regimen.
Distribution maintenance strategy includes both preventative (planned) and corrective
maintenance (faults/unplanned).
An increased focus is placed on planned maintenance in shifting performance and will be
achieved through a number of key actions:
• Increase the ratio and time spent on planned maintenance and corresponding reduction
in unplanned maintenance towards the end of the application period
• Focus on Low Voltage (LV) networks due to its close proximity to the customer base,
specifically in the electrification areas
• A new proactive vegetation management which supports and aids the reduction of
conductor faults and leads to improved performance in reliability and quality of supply.
Distribution continues to embrace efficiency measures through its condition based
maintenance programs in its maintenance standards and regimes. These regimes are
further reflected within the maintenance strategies
16.4 Other Operating Expenses
Other operating costs are forecasted to grow from R15.4 billion in 2017/18 to R15.8 billion in
2018/19. Included in this category are costs such as insurance, IT (information technology),
fleet costs, legal and audit services, security, travel expenses, billing costs,
connection/disconnection costs, meter reading, vending commission costs and telecoms.
• Insurance cost increases reflect the increase in the asset base as well as global
premium increases. Factors that influence cover and pricing include insurance claim

Operating Cost
Eskom Holdings Revenue Application FY2018/19 Page: 97
trends, loss ratio performance, value of insurance excess, new-build programme, re-
insurance costs, increases in insured asset values and risk management efforts.
• The increase in Security expenditure is due to increased initiatives by Eskom to
safeguard assets, combat theft incidents and mitigate the related risks.
• Telecommunication services is required for supervisory control and data acquisition
(SCADA) and enabling remote access to fault recording systems as well as control
centre communications.
• Meter reading - reading of Small Power Users (SPU) and Large Power User (LPU)
billed customer meters are done mostly on a quarterly basis.
• Disconnection and Reconnection costs - costs incurred to manage outstanding debt by
disconnecting non payers and reconnecting once the payment is made.
• Shared services costs for billing customers – management of inflow and revenue
management compliance
16.5 Integrated Demand Management
The role of Integrated Demand Management (IDM) is to influence the electricity demand
profile of its customer base for the benefit of Eskom and the country. Over the past 8 years,
whilst Eskom experienced a supply shortfall, IDM focussed mainly on energy usage
reduction. With the improved generation plant performance and progress on the new build
programme, it is anticipated that Eskom will be entering a period of operational excess
capacity.
Irrespective, the system demand profile has a significant impact on the future supply
requirements and the sources and cost of generation. The system load profile is becoming
more “peaky”, resulting in high production cost during peak periods and low power station
utilisation during the night. This leads to inefficiencies and resulting high generation costs.
IDM remains a key tool to ensure an optimal system load profile, supporting an optimal
future generation mix in line with the requirements of the Integrated Resource Plan.
In particular, IDM will support the System Operator by providing demand response (DR) to
maintain adequate operating reserve levels through the supplemental and instantaneous DR
programmes, reducing evening peak demand. The focus of the IDM will transition to also
support sustainable economic growth brought about by using energy efficient technologies
for new growth. Past experience has proven the valuable contribution IDM can make to

Operating Cost
Eskom Holdings Revenue Application FY2018/19 Page: 98
stabilising the electricity system. The demand / supply situation is cyclical and maintaining
the IDM capacity is thus essential.
16.5.1 IDM Programmes
The following key IDM programmes are targeted during the 2018/19 financial year.
• Load Reduction Projects: Implement measurable and sustainable peak demand
reduction and load shifting interventions. This is crucial to ensuring security of supply
and optimises short and long term generation cost specifically during peak demand
periods. This is mainly done through the ESCO process and is focussed on large
projects. Such programmes are becoming more expensive with load shifting
opportunities reducing.
• Mass rollout programmes: These are specific mass rollout rebate programmes,
where products are procured and installed, either by Eskom directly or by an ESCO, and
implement in bulk. These large-scale rollouts are mainly in the residential market for
example the CFL roll-out programme. This includes the procurement of 1 million LEDs.
• Energy Advisory Services: Professional services to customers regarding their
electricity consumptions, advising customers on best practices of utilising energy in the
Industrial, Commercial and Agricultural sectors.
• Power Alert: Interactive media communication system aimed at the residential sector to
influence consumption patterns during weekday evening-peak-periods, yielding an
average of 300MW of short term load reduction. Prior to Winter 2017, Power Alert was
not operational. The national electricity network was stable and Power Alert switched
off in order to save cost. However, future system volatility remains a possibility
• Sales Growth / Greenfield Project: An opportunity exists to drive energy efficient
growth. IDM products will be developed to provide a set of products that sales advisors
can utilise to drive energy efficient growth, assisting customers in creating sustainable
business operations whilst growing energy consumption.
16.5.2 IDM COSTS
IDM costs constitute EEDSM programme costs, overhead costs and measurement and
verification costs. The estimated cost of IDM for financial years 2018/19 is R511 million, of
which the EEDSM programme cost amounts to R325 million at an average benchmark of

Operating Cost
Eskom Holdings Revenue Application FY2018/19 Page: 99
R2.5m/MW. The DR programme costs are excluded, and will form part of primary energy
costs.
16.5.3 Summary of Savings
The table below indicates the peak demand savings (in MW) of the past, current and future
IDM programmes.
TABLE 33: IDM PROGRAMME SAVINGS
16.5.4 Summary of Costs
The tables below indicate the IDM programme cost and the IDM total cost respectively.
TABLE 34: IDM PROGRAMME COSTS
TABLE 35: IDM TOTAL COSTS

Operating Cost
Eskom Holdings Revenue Application FY2018/19 Page: 100
16.6 Research, Testing and Demonstration
The electricity industry is going through significant challenges driven by technology
disruptors as well as market, policy and industry drivers. The power utility needs to respond
to these challenges with the need for greater flexibility, rapid technology advances across
the entire value chain and adapting to changing business models. Balancing social,
environmental and economic imperatives relies heavily on technology development and
breakthrough to provide a way forward when all other routes appear blocked. Eskom
Research, Testing and Development (RT&D) is therefore dedicated to finding technology
solutions that can be applied primarily within Eskom to ensure it fulfils its mandate to South
Africa. ‘We are predominantly a technology early follower’ - Except for a few carefully chosen
areas, Eskom does not wish to lead technology development. Rather it will focus on
technology identification, acceleration and application, not technology development.
Eskom is a needs driven organisation focussed on the systematic acquisition of knowledge
and the application, development, refinement or demonstration of new and innovative
technologies and solutions to satisfy Eskom’s operational and strategic requirements
through centres of expertise. Research costs of R193 million is required in 2018/19.
The table below provides a summary of the key areas where research projects are planned
to be undertaken for the application year.
TABLE 36: KEY PLANNED RESEARCH PROJECTS FOR APPLICATION YEAR
Project NERSA Criteria Environmental Criteria Grand Challenge
Coal Lower operating costs Not Applicable Coal
Clean Coal Environmental criteria Better usage of water, less pollution and less global warming Clean Coal
Water Environmental criteria Better usage of water, less pollution and less global warming Water
Gas Environmental criteria Better usage of water, less pollution and less global warming Gas
Renewables Environmental criteria Renewable energy sources Renewables
Nuclear
Build, plan or demo plant that might form part of a future build
plan Not Applicable Nuclear
Generation Plant Performance and Asset
Management Improved efficiency Not Applicable
Generation Plant Performance
and Asset Management

Operating Cost
Eskom Holdings Revenue Application FY2018/19 Page: 101
Project NERSA Criteria Environmental Criteria Grand Challenge
Transmission Plant Performance and Asset Management Improved efficiency Not Applicable
Transmission Plant Performance and Asset Management
Transmission Build
Solutions
Build, plan or demo plant that might form part of a future build
plan Not Applicable Transmission Build Solutions
Distribution Plant Performance and Asset
Management Improved efficiency Not Applicable
Distribution Plant Performance and Asset
Management
Future Customer Better understanding of load behaviour Not Applicable Future Customer
Flexibility Improved efficiency Not Applicable Flexibility
Eskom will undertake a stakeholder consultation process during the analysis of this revenue
application. The purpose of this consultation will be to provide Nersa with feedback on
stakeholder views on Eskom’s research project plans for the 2018/19 year.
16.7 Insurance
Escap SOC Ltd (“Escap”), a wholly-owned subsidiary of Eskom, is the primary insurer for
Eskom other than where Escap does not have the required capacity and/or expertise, mainly
nuclear risks. Eskom insurance costs are approximately R3.5 billion in 2018/19.
16.7.1 Methods used to determine insurance premiums
Actuarial pricing method which uses statistical analysis to determine insurance
premiums. An actuarial model is used to estimate future claims where key assumptions
used in developing the model are the frequency and severity of future losses. First, the
model is used determine the insurance premiums without taking into account the risk that
is retained by the business (i.e. total risk profile). Thereafter, it is used to determine
insurance premiums at different levels of risk retention by Eskom.
Burning cost method - is an experience-based method of determining insurance
premiums. It uses the average of past claims to estimate future claims. Escap’s
experience has shown that this method does not produce acceptable results.
Market - pricing method- The insurance premiums in respect of risks that are not
insured by Escap are determined by the external insurance market.

Operating Cost
Eskom Holdings Revenue Application FY2018/19 Page: 102
16.7.2 Nuclear Insurance
Nuclear insurance is not placed with Escap due to its complexity and significance of financial
impacts that may arise from a nuclear incident. It is for this reason that insurance risks are
generally underwritten by nuclear pools. The risk for property damage and business
interruption is insured by the South African Nuclear Pool and the European Mutual
Association for Nuclear Insurance (“EMANI”). The insurance for nuclear liability is provided
by the South African Nuclear Pool and European Liability Insurance for the Nuclear Industry
(“ELINI”). Eskom is a member of the EMANI and ELINI and Escap of the South African
Nuclear Pool.
16.7.3 Engineering Risk Surveys
Escap’s Lead insurers conduct independent engineering risk surveys of Eskom’s power
stations on annual basis. The purpose of the surveys is to identify risks that may result in
insurance claims and make recommendations on prevention of these risks. The
implementation of the recommendations is monitored by Eskom, Escap and Escap Lead
insurers.
16.7.4 Value of ESCAP as a Primary Insurer
The main benefits that Eskom derives from having Escap as a primary insurer are:
Generally, the components of an insurance premium include claims costs, commissions,
administration expenses, contingency allowances and profit. Escap’s pricing model does
not include commissions and profit. Therefore, the insurance premiums charged by
Escap are lower than the external market premium.
The premiums that are not utilised to pay claims and other expenses are retained and
invested by Escap. In the absence of Escap, this retained income would have benefited
the external markets.
Provides a protection from the volatility of the insurance market by mitigating against
insurance premium increases that are due to market conditions as opposed to increase in
risk.
Promotes risk management through engineering risk surveys
Provides direct access to the reinsurance market which in turns allows for negotiation of
favourable reinsurance premiums
Operating Cost
Eskom Holdings Revenue Application FY2018/19 Page: 103
Ability to provide insurance covers that are not available in the conventional insurance
markets.

Credit Ratings Overview
Eskom Holdings Revenue Application FY2018/19 Page: 104
17 Credit Ratings Overview
Credit ratings assigned to Eskom by the rating agencies (Moody’s and S&P) are critical
measurements of Eskom’s creditworthiness for investors and various other counterparties
from which Eskom secures funding.
Eskom’s credit rating is currently sub-investment grade, resulting in a number of facilities
covenants’ triggers and challenging investor sentiment for Eskom. By virtue of being a State
Owned Company (SOC), Eskom’s credit rating is intrinsically linked to that of the South
African Government (the Sovereign); for this reason, Eskom’s credit rating gets uplift for
Sovereign support.
17.1 Impact of credit rating on funding
The impact of further downgrades of Eskom’s credit rating, directly or as a result of a
downgrade of the Sovereign, will have a negative impact on the sourcing of the R330 billion
funding, averaging R60 billion per annum. The impact on the cost and available funding will
be amplified if Eskom or the Sovereign were to experience further credit rating downgrades.
The consequence of Eskom’s weaker credit rating will be evident in:
• Increased cost and a decreased volume of funding available for future borrowings
• Decrease in investor base due to investor/ trustee mandates excluding sub-investment
grade assets
• Reduced volume available for investment within the still available investor mandates
• Reduction in loan tenors
• Investors requesting stricter loan covenants
• Lack of demand and reduced investor appetite;
• Inability to rollover or refinance existing exposures;
• Increases in hedging costs; and
• Counterparty banks reducing credit limits for Eskom.
Ratings agencies have raised a number of key concerns which could result in a further
ratings downgrade: a Sovereign rating downgrade; a weakened liquidity position and/or a

Credit Ratings Overview
Eskom Holdings Revenue Application FY2018/19 Page: 105
prolonged state of poor liquidity; free funds from operations as a percentage of debt below
5%; and operational weakness.
Economic Landscape Changes
Eskom Holdings Revenue Application FY2018/19 Page: 106
18 Economic Landscape Changes
18.1 Economic Impact Study
Eskom has commissioned two studies with regards to economic impact. The first is an
overview and analysis of economic trends in relation to electricity. Certain trends are
discussed here to illustrate the changes in the economic landscape in South Africa. The
second study aims to provide an understanding of the macroeconomic impacts of alternative
scenarios to meet Eskom’s five-year revenue requirement. Each study is summarised here.
18.2 Economic Landscape Changes
Deloitte Consulting has undertaken to provide an overview and analysis of economic trends
in relation to electricity in South Africa. Certain trends are discussed here to illustrate the
noticeable changes in the economic landscape in South Africa.
18.2.1 Overview of historical trend in electricity consumption in South Africa
Below is a brief overview of the historical trend in electricity consumption in South Africa, the
changing composition of electricity sales by sector, key determinants of demand, methods of
decomposing demand, and a brief analysis of the medium-term energy demand outlook.
The relatively energy-intensive mining and manufacturing industries remain the dominant
consumers of electricity in South Africa – they account for circa 60% of national electricity
consumption and about 22% of GDP. The results of several local and international studies
on the key determinants of electricity consumption suggest that income or GDP is the
dominant driver of demand. The sensitivity of consumers to changes in electricity prices
appears to vary significantly over time and depends on the direction and magnitude of price
increases and the prevailing price level.
There is evidence of strong positive correlation between GDP growth and growth in
electricity sales in the country - the correlation coefficient between Eskom’s local sales of
electricity and GDP over the 20 years between 1997 and 2016 is 0.93. A previous study
found that the income elasticity of demand over the period 1990 to 2005 almost unit elastic
meaning that a 1% increase in GDP was associated with close to a 1% rise in electricity
demand (once the influence of other important determinants such as price, supply
constraints has been accounted for).
Economic Landscape Changes
Eskom Holdings Revenue Application FY2018/19 Page: 107
In recent years and particularly since FY2012, growth in Eskom’s local electricity sales has
been much lower than growth in GDP. While GDP expanded at an average rate of 1.9% y/y
between FY2012 and FY2016 Eskom’s local electricity sales were falling, averaging -0.9%
y/y. In FY2013 electricity sales fell by ~4.2% y/y as a sharp fall in the global demand for
commodities hit production in South Africa’s relatively electricity-intensive mining and
manufacturing industries.
Supply constraints also put a brake on demand as Eskom re-introduced rotational
loadshedding in early 2014, and there was regular loadshedding between November 2014
and September 2015.
Electricity sales fell at an average rate of -0.3% y/y over the first three years of the 5-year
MYPD3 period which runs for 2013/14 to 2017/18 - much lower than the annual growth in
electricity sales of 1.8% that it forecast for these years when submitted its MYPD3
application. Much of the sales forecast variance can be attributed to disappointing GDP
growth - Eskom assumed that real annual GDP growth would average 4.5% but GDP growth
averaged just 1.5% in the first three years of MYPD3. The slower-than-anticipated sales in
first three years of MYPD3 were however also a result of unforeseen falls in global demand
for commodities and the re-emergence of local supply constraints. With annual GDP growth
forecast to average 1.8% for the 5-year period to 2021 (IMF & EIU forecasts), growth in
electricity sales is unlikely to average more than 1% per annum particularly given evidence
of a persistent trend-decline in the electricity intensity of growth and assuming that real
electricity prices will continue to rise as Eskom transitions to a tariff that is more reflective of
its prudently and efficiently incurred costs.
18.2.2 Trend in electricity prices
For much of the four decades to 2008/9 real (inflation-adjusted) electricity prices in South
Africa were on the decline. By 2007 electricity tariffs in South Africa were among the lower in
the world, but the power supply crisis that had been threatening for several years had also
reached a critical point. Eskom introduced loadshedding and was given the green light to
embark on a massive build programme – the first major increase in power generation
capacity the utility had undertaken in almost 30 years.
Between 2008 and 2013 NERSA approved several sharp increases in annual tariffs
which, in line with the regulatory methodology, would enable Eskom to raise the
future revenue streams in needed to cover the new build - electricity prices more than

Economic Landscape Changes
Eskom Holdings Revenue Application FY2018/19 Page: 108
doubled in real terms (inflation-adjusted) rising by a cumulative 114%. The sharp
increases in real electricity prices over the 5-year period were met with increasing public
resistance. NERSA subsequently awarded Eskom increases of roughly CPI plus 2% for the
5-year MYPD3 period. The tariff increases awarded by NERSA over the MYPD3 period
(since 2013) have proved inadequate and Eskom’s revenue shortfall has begun to
mount. In November 2016, S&P Rating’s agency further deepened Eskom’s non-investment
grade status to reflect Eskom’s deteriorating financial position which continues to put South
Africa’s sovereign credit rating at risk.
By maintaining artificially low tariffs, the South African government has effectively continued
to implicitly subsidise the cost of electricity. While electricity subsidies have largely been
implicit or off-budget they are subsidies nonetheless, and fiscal consequences do eventually
become evident. The substantial support provided by government to Eskom over the past 10
years both in the form of equity and a R350bn guarantee facility has contributed
meaningfully to the deterioration in Government’s overall debt metrics (and subsequent
credit rating downgrades). In addition, the economic harm and distortions that are
caused by energy subsidies is wide-ranging and include:
Energy subsidies can crowd-out growth-enhancing or pro-poor public spending.
Energy subsidies discourage investment in the energy sector and can precipitate supply-
crises.
Energy subsidies often promote investment in capital and energy-intensive industries at
the expense of more labour-absorbing and employment generating sectors.
Energy subsidies stimulate demand and encourage the inefficient use of energy and
unnecessary pollution.
Energy subsidies have distributional impacts where larger consumers benefit
disproportionately from subsidies.
18.2.3 International competiveness of SA electricity tariffs
Despite the sharp 147% compounded increase in real inflation-adjusted electricity prices
since 2008, a survey of the delivered price of electricity (12-month 1000KW contract) by
NUS Consulting in June 2015, showed that South Africa’s tariff at 0.085 $US/kWh is still
Economic Landscape Changes
Eskom Holdings Revenue Application FY2018/19 Page: 109
below the mean for the group of 18 mostly high-income countries. Furthermore, while South
Africa has the 9th lowest tariff of the 18 countries, there was less than 0.5 US cents per
kilowatt hour separating 4th placed Czech Republic and South Africa in 9th place.
A comparison of industrial electricity tariffs by the IEA shows that in 2014, Eskom’s industrial
electricity tariffs were still the lowest (or at least among the lowest if a more conservative
benchmark tariff was chosen) among the 30 countries surveyed. The inclusion of South
Africa in the IEA’s ranking of countries’ residential tariffs in 2014, suggests that Eskom’s
residential tariffs were the 3rd most competitive of the 30 countries surveyed. A comparison
of the standard residential electricity tariffs charged by 7 of the 187 municipalities was
sufficient to show there are large discrepancies in the tariff charged by municipalities.
Ekurhuleni placed 17th in the IEA’s residential tariff ranking which puts the municipality
among the 50% of countries with the most expensive residential tariffs in the OECD
group.While City Power (Johannesburg) tariffs were similar to the Eskom tariff, Ekurhuleni
tariffs are 85% higher.
18.2.4 Requirements of an efficient electricity pricing regime
Electricity pricing regimes often try to satisfy a range of social, economic and political
objectives, but we argue that the primary objective must be to ensure that resources are
allocated efficiently. In terms of economic theory, a ‘cost-reflective’ tariff is defined as a tariff
equal to the long-run marginal cost (LRMC) of supply. While a theoretically robust, LRMC is
difficult to accurately estimate and operationalise. It is argued that the RoR methodology
usually gives rise to tariffs that are equivalent to LRMC. The extent to which tariffs under the
ROR methodology approximates LRMC appears to depend on the basis for asset valuation
and/or the rules for depreciating the asset base. While an efficient pricing regime is a
necessary requirement to ensure the efficient delivery of electricity services by the utility
(even if a monopoly) it is not sufficient – internationally accepted governance practices must
be adhered to to ensure that sound and least-cost investment decisions are made. Eskom
estimates that approved tariff of 67.7c/kWh in 2014/15 would need to have risen by
23% in order to reach the fully cost-reflective tariff of 83.9c/kWh. It is noted however
that the gap between actual and cost-reflective tariffs is not static, particularly during a period
of capacity expansion when new assets are being added to the regulatory asset base.
Specific strategies for the transition to cost-reflective electricity tariffs in South Africa include:

Economic Landscape Changes
Eskom Holdings Revenue Application FY2018/19 Page: 110
Encourage open conversations on the implicit electricity price subsidies which are
heavily reliant on the limited fiscal resources. Support the conversation with a coherent
communication strategy that provides the public with information on the magnitude of the
subsidy and their shortcomings. The regulator must review its approach on the regulation
of municipal tariffs to address large discrepancies in tariffs levied by municipal
distributors as this is an obstacle to the transition to cost-reflective tariffs.
Government should develop a clear plan for the transition to cost-reflective tariffs, with
appropriate phasing and provision of targeted subsidies and other mitigating measures
for vulnerable groups.
18.3 Macroeconomic impacts of alternative scenarios
18.3.1 Background and context
In the three decades between 1978 and 2004 government allowed real (inflation-adjusted)
electricity prices in South Africa to decline to artificially low levels. During this period, the real
average price of electricity1 fell by more than 40% to 30.1 c/kWh (in 2016 rands) in 2004/5 -
at which point South Africa’s tariffs were among the lowest in the world. (Deloitte, 2017).
In 2008, a power supply crisis that had been threatening to emerge for several years,
reached a critical point and Eskom introduced nationwide load-shedding. As a result, Eskom
was given the green light to embark on the massive build programme to increase power
generation capacity. To enable Eskom to raise the capital it required, the NERSA approved
several sharp tariff increases. In the five years between 2008 and 2013, electricity prices
more than doubled in real terms (inflation-adjusted) rising by a cumulative 114% while
nominal prices rose by 191% over the same period. (Deloitte, 2017).
The sharp increases in real electricity tariffs over this period prompted a public outcry, and
NERSA subsequently decided to award Eskom revenue that would limit the increase in real
electricity tariffs to ~2% per year for the 5-year period from 2013. This was much lower than
Eskom’s requested increase of CPI plus ~10% per annum. The tariff increases that NERSA
1 Average prices are calculated as the total electricity revenue realised by Eskom divided by the total kWh
produced in a given period, these are then adjusted for inflation to calculate real prices and expressed in 2016
Rands.

Economic Landscape Changes
Eskom Holdings Revenue Application FY2018/19 Page: 111
awarded Eskom over the MYPD3 period have proven to be inadequate, and Eskom’s
financial position has deteriorated as its annual revenue shortfall has mounted. According to
Eskom (2016) the revenue shortfall that the utility faced in 2014/15 alone, was R35 billion. At
the time of finalising the modelling for this report in January 2017, we noted that the ongoing
deterioration in Eskom’s financial position would have meaningful fiscal consequences (in
the form of rising government debt and/or contingent liabilities), and that there was a
significant risk that this would trigger a sub-investment downgrade (S-IG) of South Africa’s
sovereign credit rating. On the 3rd of April 2017, shortly after this first version of this report
was finalised, Standard & Poor’s downgraded South Africa's long-term foreign currency
sovereign credit rating to sub-investment grade or "junk” and on the 7th of April 2017, Fitch
ratings agency followed suit.
S&P noted that the downgrade reflected their view that “contingent liabilities to the state,
particularly in the energy sector [i.e. government guarantees on debt issued by Eskom] are
on the rise and that previous plans to improve the underlying financial position of Eskom
may not be implemented in a comprehensive and timely manner.” This indicates that the
steady rise in government debt and contingent liabilities (guarantees of Eskom-issued debt)
associated with Eskom’s lower-than-required electricity tariff increases contributed
meaningfully to S&P’s recent decision to downgrade South Africa’s credit rating on foreign
currency debt to ‘junk’.
We argue in a recent analysis of the historical trends and policies in the electricity sector,
Deloitte (2017), that previous assessments of the macroeconomic impacts of rising electricity
prices failed to acknowledge the economic impacts of the implicit electricity subsidy Eskom
requires from government when the revenue it raises via the tariff is insufficient to cover its
costs. This implicit subsidy usually takes the form of an increase in debt (implicitly or
explicitly guaranteed by government) or an additional equity injection from government.
Government in turn has three main ways to raise the funds required to support Eskom –
either by issuing more debt (borrowing) and/or by raising additional tax revenue or reducing /
re-prioritising expenditure away from other government services and functions.
In its ‘Reasons for decision on Eskom’s MYPD3 tariff application’, NERSA (2013) presented
an economic impact of rising electricity tariffs on GDP, inflation, and employment under low,
medium, and high tariff path scenarios. However, NERSA did not acknowledge or model the
consequences of rising government / Eskom debt associated with ‘low tariff path scenarios.
Rather, in assessing the potential economic impact of its tariff decisions NERSA, appears to

Economic Landscape Changes
Eskom Holdings Revenue Application FY2018/19 Page: 112
implicitly assume that if Eskom is not able to recover sufficient revenue to cover all its
prudently and efficiency incurred costs, that those costs would not be incurred.
18.3.2 Aim of the study
The aim of this study is to provide an understanding of the macroeconomic impacts of
alternative scenarios to meet Eskom’s five-year revenue requirement. While, like previous
studies, the study should show the impacts on GDP, employment, and inflation during the
five-year period, it should also demonstrate the impact on the fiscus (debt ratios and budget
balance). We have also attempted to demonstrate some of the broader or longer-term
economic consequences of government debt accumulation in scenarios where tariff
increases generate insufficient revenue to cover Eskom’s costs – this included a scenario
where government debt accumulation associated with low tariff increases, triggers a sub-
investment grade credit rating downgrade.
18.3.3 Key scenario assumptions, and scenarios modelled
For this modelling exercise, Eskom advised Deloitte to model the impacts associated with
three alternative tariff scenarios – average annual increases over a five-year period of 8%,
13% and 19% respectively. In November 2016, when this study commenced, Eskom had not
yet finalised its forthcoming tariff application nor had it decided whether it would submit a
tariff application for a single-year or for a multi-year period. As such official estimates of
Eskom’s required revenue and sales forecasts over the next five years were not available,
the scenarios are therefore hypothetical and we have made the following key assumptions:
We assume that the upper-bound annual average increase of 19% is what Eskom
requires to reach and maintain a cost-reflective electricity tariff over the 5-year period
from 2017 to 2021.
We assume that Eskom’s total revenue requirement is the same across all tariff
scenarios and that it is equivalent to the revenue that would be raised if tariffs increased
at an annual average rate of 19%. For example, under the 8% tariff scenarios, Eskom
experiences an annual revenue shortfall equivalent to the difference between the total
revenue raised under a compounded 19% tariff increase and the compounded 8%
increase. We then have further scenarios to model how the shortfall will ultimately be
recovered– e.g. by raising additional government debt (borrowing) or taxes.
Economic Landscape Changes
Eskom Holdings Revenue Application FY2018/19 Page: 113
Eskom has indicated that based on an analysis of their financial position as at May 2017, it
seems unlikely that the utility will require an annual nominal tariff increase as great as 19%
to close the gap between costs (prudently and efficiently incurred) and revenue over a five-
year period. There are however some upside risks to this forecast, these include:
Purchase of additional renewable energy capacity - current estimate of the required
tariff is based on the assumption that Eskom will not purchase any additional renewable
energy capacity from IPPs (beyond that which is has already committed to). If Eskom
signs additional power purchase agreements (PPAs) under the renewable energy
independent power producers programme (REIPPP) the utility’s average cost of
electricity provision will rise further. The average cost of energy purchased from new
renewable IPPs is currently more than double Eskom’s average cost of own generation
(largely from coal-fired power stations) on a levelised cost of energy basis and the cost
multiple is even greater when relative intermittency of renewable sources and higher
transmission costs are considered.
Lower-than-anticipated electricity demand or sales – Analysts have revised their
forecasts of South Africa’s real GDP and fixed investment growth lower following the
downgrade of South Africa’s long-term foreign currency rating to sub-investment grade
and are now generally expecting real GDP growth of between 0% and 1% y/y in 2017.
Given the strong positive relationship between electricity sales and real economic
activity, Eskom may face lower than expected demand.
New build programme – the current estimate of tariff required to close the revenue gap
is based on anticipated capital expenditure under the approved new build programme
including the completion of Medupi and Kusile. If, however Eskom initiates a further new
build programme within the next 5 years, such as the potential nuclear build, real tariffs
would need to rise faster to accommodate additional capital expenditure.
Three main categories of policy simulations were modelled, each with a different set of
assumptions and for three tariff path options – 8%, 13% and 19% (where applicable)2. This
2 In the interim modelling report produced by the University of Pretoria, another two groups of scenarios were
considered – 1) a tax credit reducing VAT and 2) a tax credit reducing production taxes. We have decided to
omit these two scenarios as the added unnecessary complexity and did not materially alter the findings. We
have also re-labelled/re-coded the scenarios for the readers of the final report.

Economic Landscape Changes
Eskom Holdings Revenue Application FY2018/19 Page: 114
resulted in a total of five simulations all of which represent an alternative potential solution to
meet Eskom’s total revenue requirement over a five-year period. The scenarios modelled
included a ‘tariff-only’ option where electricity tariffs increase at an annual rate of 19% over
five years and a baseline scenario (BAU) where tariffs increase at an average rate of 8%
and the revenue shortfall is funded by raising additional government debt. Further scenarios
included a 13% annual tariff increases with a debt-funded shortfall, an 8% increase with tax-
hike funded shortfall and a downgrade scenario, explained further below. At the time the
modelling was undertaken (January 2017) we judged that there was also a significant risk
that steadily rising government debt levels associated with the baseline tariff scenario of 8%
would trigger a sub-investment grade (S-IG) credit rating downgrade3.
To simulate the economic impacts of this downgrade risk materialising we ran an alternative
baseline simulation (BAU2) where a steadily rising debt-to-GDP ratio and deteriorating
budget balance that is associated with an 8% average tariff increase triggers a S-IG credit
rating downgrade. A visual summary of the five simulations modelled is provided in the figure
below.
3 At the time of writing and finalisation of this study, South Africa maintained an investment grade rating on both
its foreign- and domestic-currency denominated debt. On the 3rd of April 2017, Standard & Poor’s downgraded
South Africa's long-term foreign currency sovereign credit rating to sub-investment grade or "junk” and on the 7th
of April 2017, Fitch ratings agency followed suit. By 7th
April 2017 the yields on 10-year government bonds had
risen by nearly 1 percentage point or 100bps from their mid-March lows from around 8.4% to just over 9%.
Please see the Addendum to this report, dated 7 April 2017 for the likely implications of rising debt under the (1A
8%: debt) scenario post the S-IG downgrade event.
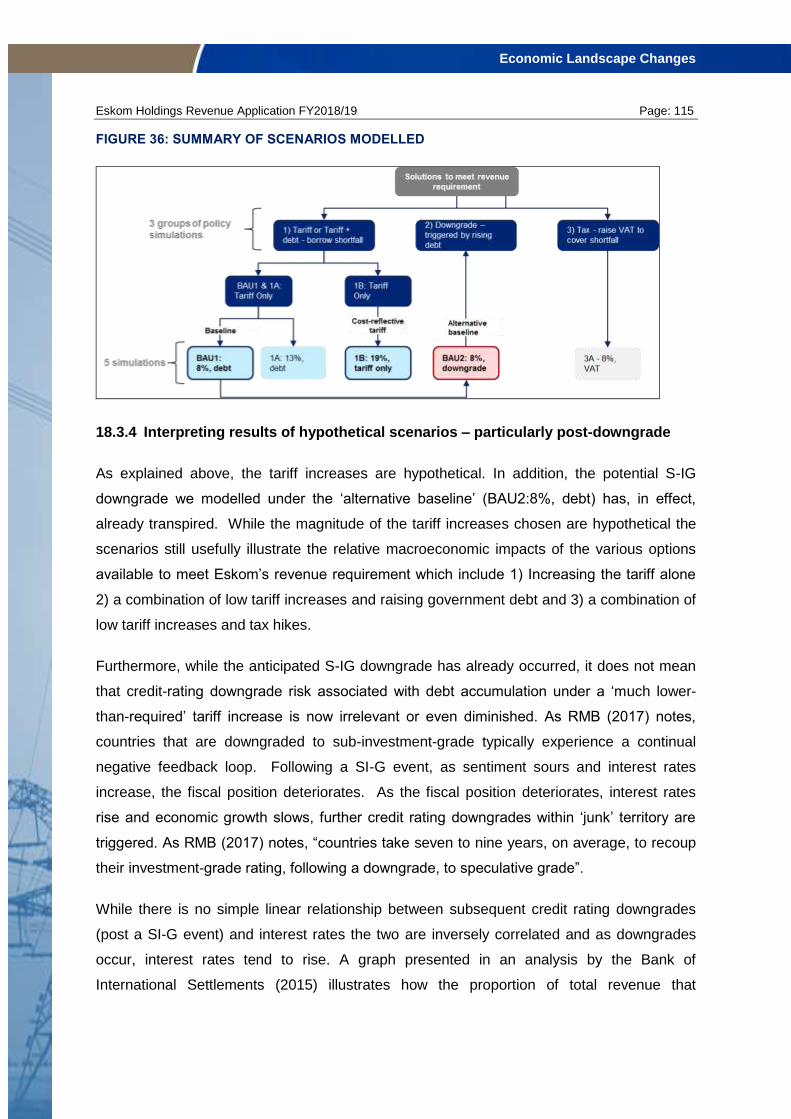
Economic Landscape Changes
Eskom Holdings Revenue Application FY2018/19 Page: 115
FIGURE 36: SUMMARY OF SCENARIOS MODELLED
18.3.4 Interpreting results of hypothetical scenarios – particularly post-downgrade
As explained above, the tariff increases are hypothetical. In addition, the potential S-IG
downgrade we modelled under the ‘alternative baseline’ (BAU2:8%, debt) has, in effect,
already transpired. While the magnitude of the tariff increases chosen are hypothetical the
scenarios still usefully illustrate the relative macroeconomic impacts of the various options
available to meet Eskom’s revenue requirement which include 1) Increasing the tariff alone
2) a combination of low tariff increases and raising government debt and 3) a combination of
low tariff increases and tax hikes.
Furthermore, while the anticipated S-IG downgrade has already occurred, it does not mean
that credit-rating downgrade risk associated with debt accumulation under a ‘much lower-
than-required’ tariff increase is now irrelevant or even diminished. As RMB (2017) notes,
countries that are downgraded to sub-investment-grade typically experience a continual
negative feedback loop. Following a SI-G event, as sentiment sours and interest rates
increase, the fiscal position deteriorates. As the fiscal position deteriorates, interest rates
rise and economic growth slows, further credit rating downgrades within ‘junk’ territory are
triggered. As RMB (2017) notes, “countries take seven to nine years, on average, to recoup
their investment-grade rating, following a downgrade, to speculative grade”.
While there is no simple linear relationship between subsequent credit rating downgrades
(post a SI-G event) and interest rates the two are inversely correlated and as downgrades
occur, interest rates tend to rise. A graph presented in an analysis by the Bank of
International Settlements (2015) illustrates how the proportion of total revenue that

Economic Landscape Changes
Eskom Holdings Revenue Application FY2018/19 Page: 116
Governments spend servicing interest on debt tends to rise sharply as the foreign currency
rating falls into sub-investment grade territory. As further credit rating downgrades take place
governments’ find they have less and less ‘fiscal space’ or flexibility in their spending choices
and are forced to focus on preserving and improving their financial position and trying to
meet obligations to deliver essential services (e.g. social grants, health and education).
FIGURE 37: FOREIGN CURRENCY RATING VS. INTEREST PAYMENT BURDEN
Source: Bank of International Settlements (2015).
18.3.5 Approach
The model selected for the simulation of the alternative scenarios to meet Eskom’s revenue
requirement is the University of Pretoria General Equilibrium Model (UPGEM) described in
Bohlmann et al. (2015). UPGEM is a flexible Computable general equilibrium (CGE) model
that for purposes of this study is used in standard recursive-dynamic mode.
18.3.6 Key findings and results
The results show that an annual tariff increase of 19% is expected to have a slightly negative
impact on GDP and employment growth relative to the baseline scenario (where tariffs rise
by 8% a year and government borrows the shortfall). For example, under the 19% tariff
scenario (1B), GDP is forecast to expand at an average rate of 2.0% y/y, which is 0.3
percentage points lower than the 2.3% y/y growth forecast in the baseline (BAU1). Total
employment is expected to grow at an average rate of 0.9% y/y under a 19% tariff increase
compared to 1.2% y/y in BAU1. This implies that under a 19% tariff increase scenario,
137000 fewer jobs will be created and sustained annually over the period 2017 to 2021,

Economic Landscape Changes
Eskom Holdings Revenue Application FY2018/19 Page: 117
relative to BAU1. These results are consistent with those NERSA (2013) obtained when it
presented the economic impact of similar tariff scenarios in its reason for decision on
Eskom’s MYPD3 tariff application4.
4 NERSA noted in its economic impact study that a 16% annual tariff increase over a five-year period was
expected to lower average annual GDP growth by 0.3 percentage points, reducing forecast GDP growth from
3.7% to 3.4%. NERSA also found that a series of five 16% tariff increases would compromise 652 654 jobs. We
assume that NERSA was referring to the cumulative number of jobs that would be foregone over 5 years in which
case our results are similar. Our results suggest that 137000 fewer jobs will be created and sustained annually
under the 19% tariff scenario (1A) relative to the BAU1 over the five years to 2021. If this is expressed
differently, the cumulative deviation in the total employment from baseline (BAU1) in 2021 is 685 000 jobs.

Economic Landscape Changes
Eskom Holdings Revenue Application FY2018/19 Page: 118
FIGURE 38: IMPACT ON TREND IN REAL GDP AND EMPLOYMENT GROWTH – 1A, 1B, 3A
RELATIVE TO BAU1 AND BAU2
Our results however suggest that the impact of higher tariff increases on CPI inflation over
the next five-year period would be more muted than what NERSA (2013) previously
indicated. The simulation results suggest that scenarios with higher annual electricity price
increases of 13% and 19% (1A and 1B respectively) have very little impact on CPI inflation -
inflation rises in both cases by less than 0.1 percentage point, averaging 5.8% y/y in the five-
year period from 2017 to 2021 and 5.5% y/y thereafter. While the low-CPI impact
associated with relatively high tariff increases may seem counterintuitive, it can be attributed
to the fact that higher tariff increases are expected to have a negative impact on GDP growth
and employment. Given that GDP growth was already expected to be relatively subdued
over this period (relatively to potential GDP growth of 3%), sluggish demand is likely to keep
inflation in check.
0.0
0.5
1.0
1.5
2.0
2.5
3.0
3.5
201
2
201
4
201
6
201
8
202
0
202
2
202
4
202
6
202
8
203
0
y/y
%
Real GDP growth
1A: 13%, debt 1B: 19%, tariff
BAU2: 8%, downgrade 3A: 8%, VAT
BAU1: 8%, debt
0.0%
0.2%
0.4%
0.6%
0.8%
1.0%
1.2%
1.4%
1.6%
1.8%
201
6
201
8
202
0
202
2
202
4
202
6
202
8
203
0
Gro
wth
in t
ota
l em
plo
yment
(y/y
%)
Employment growth

Economic Landscape Changes
Eskom Holdings Revenue Application FY2018/19 Page: 119
We noted previously that in the economic analysis that NERSA presented in 2013, the
regulator did not acknowledge the fiscal consequences of ‘lower-than-required’ tariff
increases. Our results show that under the 8% tariff baseline scenario (BAU1) there is a
steady and marked deterioration in government’s budget balance and that the government
debt-to-GDP ratio is expected to reach 75% by 2021 and 104% by 2030 (Figure 39). By
contrast under the 19% tariff scenario, the debt-to-GDP ratio stabilises at ~66% (Figure 39).
Given the sharp accumulation of government debt under a ‘much-lower-than-required tariff
increase’, we also noted that it was likely that BAU1: 8%, debt would trigger a sub-
investment grade credit rating downgrade and as such that it would be more accurate to
compare the economic impacts of a 19% tariff scenario with a scenario where an 8% tariff
increase triggers a SI-G downgrade (BAU2:8%, downgrade).
FIGURE 39 IMPACT ON GOVERNMENT DEBT-TO-GDP RATIO - 1A, 1B, 3A RELATIVE TO BAU1
AND BAU2
As noted earlier, the risk of a S-IG downgrade that we modelled under the ‘alternative
baseline’ (BAU2:8%, debt) has in effect, already materialised. On the 4th of April 2017,
Standard & Poor’s announced the downgrade of South Africa's long-term foreign currency
sovereign credit rating to sub-investment grade.
The results of our downgrade scenario show that when the rise in government debt that is
associated with a ‘much-lower-than required’ tariff increase is sufficient (together with other
economic and political risk factors) to trigger a sovereign credit-rating downgrade (BAU2:
8%, debt), South African’s end up worse-off than under a 19% annual tariff increase and the
88%
68%
100%
67% 55%
104%
0%
20%
40%
60%
80%
100%
120%
201
2
201
3
201
4
201
5
201
6
201
7
201
8
201
9
202
0
202
1
202
2
202
3
202
4
202
5
202
6
202
7
202
8
202
9
203
0
Govern
ment
debt
to G
DP
(%
)
1A: 13%, debt
1B: 19%, tariff
BAU2: 8%, downgrade
3A: 8%, VAT
BAU1: 8%, debt

Economic Landscape Changes
Eskom Holdings Revenue Application FY2018/19 Page: 120
negative economic impacts are likely in aggregate to be more severe5 for the following
reasons:
Firstly, our results show that under the ‘BAU2: 8%, downgrade’ scenario, growth in GDP and
employment will slow by almost as much as they would under a 19% annual tariff increase.
Simulation results show that under both the downgrade scenario (BAU2: 8% downgrade)
and 19% tariff scenario (1B:19%, debt) annual GDP growth will be 0.3 percentage points
lower than in BAU1. Similarly, under BAU2 and total employment growth is expected to
average 1.0% y/y which is an average of 0.2 percentage points lower than in BAU1, while
under scenario 1B: 19%, tariff employment will increase at an average rate of 0.9% y/y or
0.3 percentage points lower than BAU1.
Secondly, while our results suggest that the negative impact on GDP and employment that
follow a downgrade due to debt accumulation under a ‘much-lower-than-required’ tariff is
almost equivalent to a 19% tariff increase, South Africans are likely to end up worse-off in
aggregate under the downgrade scenario because of a simultaneous rise in debt and
interest rates that doesn’t occur under the tariff only scenario. Borrowing costs (or the
required return on investment) will rise by 1 percentage point (100bps) under BAU2 relative
to the 19% tariff scenario (1B) and the government debt-to-GDP ratio will rise steadily
reaching ~75% by 2021 and 100% by 2030 under BAU2, while under the 19% tariff
scenario, the debt-to-GDP ratio stabilises at ~66%.
Finally, under any scenario (including BAU1, BAU2 and 1B) where the revenue collected via
the tariff is insufficient to cover Eskom’s prudently and efficiently incurred costs, the price of
electricity is being implicitly subsidised. As the World Bank (2010:22) notes:
“Subsidising energy use involves providing it at a price below opportunity cost. This includes
non‐collection or non‐payment, selling electricity at a cost that does not reflect the long‐run
marginal cost of supply including capital maintenance.”
5 The way in which the effects of a potential downgrade were modelled was conservative -we assumed that the
key impact of an S-IG event would be that interest rates (or the return required on capital investment) would rise
by an average of 100 basis points over the five-year period.

Economic Landscape Changes
Eskom Holdings Revenue Application FY2018/19 Page: 121
The economic harm and distortions that are caused by energy subsidies, including artificially
low electricity prices, is well-documented in the international literature. Some of the potential
macroeconomic, environmental, and social consequences of energy subsidies, as
documented by the IMF (2013) were summarised in Deloitte (2017) as follows:
Energy subsidies crowd-out growth-enhancing or pro-poor public spending.
Energy subsidies, while often intended to protect consumers crowd-out other priority
spending (such as on social welfare, health, and education) and place an unnecessary
burden on public finances. Energy subsidies (unless specifically targeted) are a poor
instrument for distributing wealth relative to other types of public spending.
Energy subsidies discourage investment in the energy sector and can precipitate
supply-crises. Energy subsidies artificially depress the price of energy which results in
lower profits for producers or outright loses. This makes it difficult for state-owned
enterprises to sustainably expand production and removes the incentive for private
sector investment. The result is often an underinvestment in energy capacity by both the
public and private sector that results in an energy supply crisis which in turn hampers
economic growth. These effects have been felt in SA.
Energy subsidies create harmful market distortions. By keeping the cost of energy
artificially low, they promote investment in capital-intensive and energy-intensive
industries at the expense of more labour-intensive and employment generating sectors.
Energy subsidies stimulate demand, encourage the inefficient use of energy and
unnecessary pollution. Subsidies on the consumption of energy derived from fossil
fuels leads to the wasteful consumption of energy and generate unnecessary pollution.
Subsidies on fossil-fuel derived energy also reduces the incentive for firms and
households to invest in alternative more sustainable forms of energy.
Energy subsidies have distributional impacts. Energy subsidies tend to
disproportionately benefit higher-income households who consume far more energy than
lower income groups. Energy subsidies directed at large industrial consumers of energy
benefit the shareholders of these firms at the expense of the average citizen.
Deloitte (2017) goes on to give specific examples of the economic harm and distortions that
can be attributed to the historic under-pricing or implicit subsidisation of electricity. In South
Africa these are argued include:

Economic Landscape Changes
Eskom Holdings Revenue Application FY2018/19 Page: 122
Artificially low electricity tariffs discouraged investment in South Africa’s
electricity supply industry and helped to precipitate the 2008 power supply crisis.
The subsidised tariffs frustrated attempts by the government to attract private investment
in the early 2000s and helped to precipitate the supply crisis of 2008.
Subsidised electricity prices promoted investment in capital intensive industries
in South Africa at the expense of more labour-absorbing sectors. Kohler (2014)
traced the 40-year change in electricity intensity across a number of countries and
country groups and found that South Africa has amongst the highest electricity intensity
globally.
Subsidised electricity prices, encourage the inefficient use of energy and
contributed South Africa to becoming one of the single-largest contributors to
global GHG emissions. Subsidies on the consumption of electricity generated by
Eskom which was mostly coal-based have arguably contributed South Africa becoming
the 18th largest country-level contributor to global CO2 emissions6.
18.4 Concluding remarks
It may be tempting to conclude that by limiting electricity tariff increases to 8% per annum
and requiring that Eskom and/or government borrow the revenue shortfall (and effectively
implicitly subsidise the price), it is possible to minimise the negative impacts of rising
electricity prices on GDP and employment growth in the short-term.
However, the results of the economy-wide impact analysis show that the fiscal and economic
consequences of awarding Eskom a tariff that is much lower than what it requires (to recover
its prudently and efficiently incurred costs), do eventually (and arguably have now) become
evident. Our results show that when the gap between the required and actual tariff increases
is large (an 8% increase awarded over five years when we assumed 19% was required) and
the shortfall is covered by raising debt, there is a steady and marked deterioration in
government’s budget balance and debt-to-GDP ratio. For example, under the baseline 8%,
debt scenario government debt-to-GDP ratio is expected to reach 75% by 2021 and 104%
6 Based on data from the EDGAR – emissions databased for global atmospheric research. 2015. Available
online at: http://edgar.jrc.ec.europa.eu/overview.php?v=CO2ts1990-2015&sort=des9
Economic Landscape Changes
Eskom Holdings Revenue Application FY2018/19 Page: 123
by 2030. By contrast under the 19% tariff scenario, where all the required revenue is raised
via the tariff, the results show the debt-to-GDP ratio stabilising at ~66%.
Over the past 10-years there has been a marked deterioration in both the financial position
of Eskom and the fiscal health of the South African government and this is evident from the
change in debt and credit metrics that is summarised. Since 2008, South Africa’s long-term
foreign-currency rating has been downgrade by 3 notches from lower-medium grade to
speculative grade or ‘junk’ by two of the three major rating agencies. Eskom’s long-term
local-currency corporate bond rating has been downgraded by between 5 and 10 notches,
from upper-medium grade in 2008 is now rated ‘highly-speculative’ by Standard and Poor’s.
A summary of key debt metrics shows that since 2008 (when Eskom embarked on its
massive capital expansion programme) the South African government’s capacity to meet its
debt obligations (and to raise additional debt or issue guarantees on debt of state-owned
enterprises) has become far more constrained and as such vulnerability to eventual non-
payment has increased. In terms of the National Treasury broad risk management guidelines
(updated in 2008)7 – net loan debt, provisions and contingent liabilities should not exceed 50
per cent of GDP while the broader SADC macroeconomic convergence target was to limit
the metric to 60 per cent of GDP. While this metric stood comfortably within these prudential
limits at 34.4% GDP in 2008, in 2017 it stands at 67% of GDP – exceeding both the self-
imposed risk guideline and broader SADC convergence target. Net loan debt (excluding
provisions and contingent liabilities) is expected to reach 47% of GDP in 2017/18 (up from
22.6% in 2007/8). Government now spends 11.5% of its total revenue servicing the interest
on debt (up from 8.9% in 2007/8) illustrating how the fiscal space is becoming increasingly
constrained.
It is also clear that substantial support provided by government to Eskom over the past 10
years both in the form of equity and guarantees has contributed meaningfully to the
deterioration in Government’s overall debt metrics (and subsequent credit rating
downgrades). Eskom initially received support from government in the form of a R60bn
shareholder loan which was converted into equity in 2015 and in the form of a further R23bn
7 National Treasury (2008) National Budget Review, February 2008.

Economic Landscape Changes
Eskom Holdings Revenue Application FY2018/19 Page: 124
equity injection completed in March 20168. Government also approved R350bn worth of
guarantees on Eskom’s debt of which Eskom had drawn on R218bn worth by 2017/18 (the
agreement is to be extend to 31 March 2023). Government guarantees of SOE debt rose
from R65bn in 2008 to a total of R445bn in 2017 and 77% of this is for the electricity sector
which also covers Eskom’s power purchase agreements with IPPs.
Following the sub-investment grade downgrade of South Africa’s long-term foreign currency
in April 2017 and subsequent downgrade of Eskom’s corporate debt by S&P to ‘highly-
speculative grade’, neither Eskom nor the South African government will be in a position to
raise further debt to meet Eskom’s future revenue requirement without the risk of triggering
further sovereign credit rating downgrades.
In the present context, if Eskom is awarded much-lower-than-required tariff increases, it will
put South Africa at greater risk of remaining within the continual negative feedback loop that
countries typically experience following an SI-G event. Our analysis shows that under low
tariff scenarios, Eskom’s revenue shortfall grows, the fiscal position deteriorates, interest
rates rise, sentiment sours, economic growth slows, further credit rating downgrades within
‘junk’ territory are triggered and the toxic loop repeats. As RMB (2017) notes, “countries
take seven to nine years, on average, to recoup their investment-grade rating, following a
downgrade, to speculative grade”.
Our simulation results show that in terms of the overall economic impacts - even a sharp
19% annual tariff increase over five-years would be preferable to a scenario where rapid
debt accumulation associated with a much-lower-than-required ‘8% tariff increase triggers
further credit rating downgrades.
While our results suggest that the negative impact on GDP and employment that follows a
downgrade due to debt accumulation under a ‘much-lower-than-required’ tariff is almost
equivalent to a 19% tariff increase, South Africans are likely to end up worse-off in aggregate
under the ‘low-tariff downgrade scenario’ because of a simultaneous rise in debt and interest
rates triggered by a downgrade. In addition, in the low-tariff scenarios, the price of electricity
remains implicitly subsidised, and as outlined in detail in Deloitte (2017), energy price
subsidies are associated with a wide-range of market distortions and economic harm.
8 Moody’s Investor Service (2017) Moody's places Eskom's Ba1/A2.za ratings on review for downgrade

Economic Landscape Changes
Eskom Holdings Revenue Application FY2018/19 Page: 125
In conclusion, it would be ill-advised for NERSA to continue to limit Eskom’s tariff increases
below cost reflective levels. It would also be incorrect given the current context and results of
this analysis to assume that this will limit the negative impact on GDP and employment, even
in the short-term. Our recommendation is that tariff increases should at least be sufficient to
transition Eskom towards a more cost-reflective electricity tariff (prudently and efficiently
incurred) over the next 5 years. This will reduce of the risk of South Africa being trapped for
a prolonged period in the continual negative feedback loop that countries typically
experience following an SI-G rating downgrade.
Eskom has indicated that based on an analysis of their financial position as at May 2017, it
seems unlikely that the utility will require an annual nominal tariff increase as great as 19%
to close the gap between costs (prudently and efficiently incurred) and revenue over a five-
year period. Eskom and its key stakeholders should also take care to ensure that the upside
risks to forecasts of the tariff required to meet its revenue requirement over the next five
years are carefully managed – these include obligations to purchase additional renewable
energy capacity, risk of lower-than-anticipated electricity demand or sales and additional
capital expenditure and associated costs that will be incurred if Eskom and the Department
of Energy deems it prudent and necessary embark on a new build programme within the
next five years.

National Treasury and SALGA responses
Eskom Holdings Revenue Application FY2018/19 Page: 126
19 National Treasury and SALGA responses
19.1 Summary of key responses provided by National Treasury as part of
consultation process
19.1.1 Period of the MYPD submission
National Treasury raised concerns about Eskom making a one year application. A multi-
year application is preferred to provide investment certainty and allow for phasing in of
electricity price increases towards cost reflective levels over a longer period of time.
Eskom notes this concern and understands the concern. This National Treasury guidance
will be considered for subsequent applications.
19.1.2 Economy-wide impacts of the proposed tariff
National Treasury’s own analysis of the first round impacts on inflation shows that a 20 per
cent increase (before taking into account municipal tariff increases) in electricity prices would
increase headline CPI by 0.2 percentage points in 2018 and 2019 and have no further
effects in the outer years. A 27 per cent increase (i.e. municipal tariff increase), would
increase CPI by 0.4 percentage points in 2018 and 0.3 percentage points in 2019. It must be
stressed that this analysis does not take into account the second round effects that would
manifest themselves on the production side of the economy, which are likely to be more
significant.
Furthermore, National Treasury concurs that shortages of electricity have a more detrimental
impact on the economy than higher prices which are used to enable the financing of capacity
expansion. Various studies have shown that load shedding (especially unplanned load
shedding) has very large negative economic impacts, far more so than various other options
which may include running the gas fired power stations, buying back power from large
consumers, demand market participation and other alternatives.
Higher prices tend to have smaller economic impacts as they redistribute electricity and thus
production from least productive (less efficient) to be more productive (more efficient) firms.
This results in more optimally allocated resources. This is true to the extent that electricity
prices converge to cost reflective levels, which are not inflated by operational inefficiencies,

National Treasury and SALGA responses
Eskom Holdings Revenue Application FY2018/19 Page: 127
poor management and unjustified cost overruns. In the long run, cost reflective tariffs,
including the internalisation of the cost of negative externalities associated with electricity
supply, will ensure more efficient use of electricity and efficient allocation of resources in the
economy and will raise economic growth rates over time. It will provide the right signals for
investment in the electricity sector for both Eskom and Independent Power Producers (IPPs)
as well as in cogeneration opportunities. The correct pricing of electricity will help to
stimulate investment in more efficient and less environmentally damaging production
methods and incentivise residential consumers to consume electricity more efficiently. In the
short-run, electricity prices also have an important role to play in managing the supply and
demand balance. Nevertheless, it is critical to smooth the transition to cost-reflectivity in
order to allow consumers to adjust and avoid unnecessary employment and output losses.
Impact of electricity price increases
National Treasury also ran a shock in its Computable General Equilibrium (CGE) model
incorporating a higher price (both the 20 percent increase for Eskom, and the 27 per cent
increase for municipalities) in electricity generation and distribution. On a macro scale, both
price increases display very similar and marginal impacts. A 20 per cent increase in the price
of electricity reduces the Gross Domestic Products (GDP) at market prices by 0.1
percentage points from the base. The same is true for a 27 per cent increase in the price of
electricity. The macroeconomic effects are tabled below.
Macroeconomic effects of an increase in the price of electricity
Percentage point change from the base
20 per cent 27 per cent
Absorption -0.1 -0.1
Private consumption -0.3 -0.4
Fixed investment -0.1 -0.1
Change in inventories 0.0 0.0
Government consumption 0.6 0.7
Exports -0.3 -0.4
Imports -0.3 -0.4
Gross domestic product at market prices -0.1 -0.1
Source: National Treasury

National Treasury and SALGA responses
Eskom Holdings Revenue Application FY2018/19 Page: 128
Job losses can be seen across all levels of skills. When compared to the base, a decrease
of between 8.3 and 10.6 per cent is seen in employment when considering a 20 per cent and
27 per cent price increase, respectively.
On a sectoral basis, there are pronounced negative effects on the mining sectors, as these
are energy-intensive industries, as well as directly on the electricity industry. The electricity
industry is directly affected by weaker demand owing to the large increase in the price of
electricity. Weaker demand for electricity is seen across the household income groups, but is
relatively stronger for the higher income households who can switch to alternative forms of
energy.
Impact of industry’s GVA
Source: National Treasury
Impacts of the proposed tariff on Eskom customers
The following comments are based on the research conducted by National Treasury into the
impact of electricity tariff increases on households and select listed companies. The findings
of the research indicated that the impact on households will be as follows:
a. Using household data from the Income and Expenditure Survey, even under a
relatively low projected electricity tariff path,9 electricity expenditure by households will
9 10 per cent increase per annum in 2017, 2018, 2019, 2020 and 2021, and an inflation-related increase
thereafter until 2030.

National Treasury and SALGA responses
Eskom Holdings Revenue Application FY2018/19 Page: 129
almost double by 2030. Lower income households, particularly deciles 1 to 5, will be
the most affected as electricity represents a larger proportion of their expenditure
basket.
b. However, low income groups (LSMs 1 to 4) will be able to adjust more easily as they
can use basic non-electricity based appliances to reduce their electricity consumption
(e.g. gas/ paraffin cookers) and thus electricity expenditure.
c. A sharp increase in electricity tariffs will make electricity-alternative household
appliances (e.g. gas stoves, heaters, rooftop PV’s) relatively cheaper. This means that
households in the higher income groups (LSMs 8, 9 and 10) will be able to mitigate the
impacts of the tariff increases on their overall household expenditure.
d. Although low and high income households will be able to mitigate the effects of
electricity price increases somewhat, National Treasury’s findings suggest that middle
income households (LSM 5 and LSM 6 in particular) will be the most vulnerable to
rising tariffs. This is due to their higher electricity consumption, yet lower average
income that limits their ability to invest in appliances that will reduce their electricity
consumption more significantly. Thus electricity prices increases will likely have a large
negative effect on these households.
On the other hand, the findings of the research indicated that the impact on households will
be as follows:
e. By analysing the financials of 21 listed companies it was determined that under a high
tariff scenario, the net present values of the operating profits of firms could be reduced
by up to 17 per cent, dependent on energy intensity.
f. The viability of Own-generation of electricity is growing and some firms have already
reached the point where it makes sense from a financial perspective, even in a
moderate tariff trajectory.
g. If firms continue to undertake these investments or improve their energy efficiency they
will be able to mitigate the impact of the tariff increases somewhat.
Impacts of the proposed tariff on Eskom and municipalities
The mitigation strategies employed by households and firms described above will have an
adverse impact on electricity sales for Eskom and municipalities. Looking at households
specifically, under relatively conservative assumptions and a moderate tariff path (of a ten
per cent per annum increase over the next 5 years), about twenty six per cent of total

National Treasury and SALGA responses
Eskom Holdings Revenue Application FY2018/19 Page: 130
residential electricity sales could go off-grid by 2030.
From an analysis of listed companies, National Treasury estimates show that the equivalent
of up to thirty-four per cent of mining, eight per cent of industrial (from a sample size of 21
companies) and one per cent of commercial electricity generation sales currently supplied by
Eskom has the potential to go off-grid, by 2040. Furthermore, a sharp hike in electricity tariffs
will increase the prevalence of non-technical load losses, as certain households can no
longer afford the higher tariffs yet still continue to use electricity.
Eskom notes the analysis by National Treasury. Eskom has also commissioned two
economic impact studies that have been finalised subsequent to the submission of the draft
revenue application to SALGA and National Treasury. The analysis has yielded similar
results to that reflected in National Treasury’s study. The details of the studies will be
included in the final submission to be made to NERSA.
19.1.3 Sales volume assumptions
The sales forecast is perhaps one of the most crucial assumptions as it ultimately
determines not only what the price will be but also what expenses need to be covered.
National Treasury suggests that further clarity be provided on how sales volumes were
assumed.
It is evident that a significant sales volume adjustment has been implemented in this revenue
application. As reflected in the document a 9.4% price increase is needed for just adjusting
the change in volume between what NERSA had approved for the 2017/18 year to Eskom’s
assumption (for NERSA approval) for the 2018/19 year. This exerts tremendous pressure
on Eskom’s ability to request an increase in revenue. The revenue increase being requested
is approximately 7% for customers. However, due to the recovery over significantly lower
volumes – results in a much higher price increase. It is therefore understandable that
National Treasury is concerned that the same will happen if the application sales target is
over optimistic.
Eskom concurs with National Treasury with regards to the significance of the sensitivity of
the sales volume. The process that Eskom follows in arriving at a sales volume assumption
is a very rigorous one and a huge amount of effort is put into the process to ensure the
compilation of an accurate sales forecast over a period of 6 months. It can be confirmed that
National Treasury and SALGA responses
Eskom Holdings Revenue Application FY2018/19 Page: 131
Eskom definitely compares the bottom up with a top down approach to make sure that the
forecast makes sense from all angles and that the bottom up approach is realistic. To test
that the bottom up approach forecast is in line with historic trends the total sales growth with
many years of history is analysed and interrogated. A “linear and exponential trend line” to
the total sales trend is normally used to check the budget trend line.
Eskom further look at a wide variety of relationships, especially the relationship of electricity
demand to other macro variables, e.g. GDP, commodity prices, exchange rates. An
important part of the forecast is to focus on these relationships specifically for the Key
Industrial Customers (KIC) and mines who are reliant on exchange rate and commodity
prices. The submission document also shows the major commodity tables and economic
parameters that is utilised.
In determining price elasticity proper analyses is done with available information and the
findings tested with KICs. It is important to note that when you consider income elasticity,
one should be careful not to double count the impact of price elasticity. In the price elasticity
impact determination there is already a component of the income elasticity, as price elasticity
inherently sends a message as to what level customers will be able to tolerate higher
electricity bills when competing for spending on other more/equal important expenditures,
such as food, water and other. In addition Eskom also had a look at inflation rates, mostly for
the residential type of customers, but price elasticity and the savings drives overshadowed
that impact.
In representative customer engagements, time was spent to discuss the proposed price path
and the implication on energy intensive users, but Eskom takes note of National Treasury’s
suggestion that the price elasticity impact of such a high increase could be more what was
anticipated in the submission. In line with the MYPD methodology, the mitigation of the sales
variance can be addressed through the consideration of a more recent sales forecast at the
time of the NERSA decision.
When considering the 2018/19 submission with the projected 2017/18 consumption it must
be noted to avert the declining trend Eskom has put in place a growth initiative with stretched
targets to grow additional sales over and above what will transpire from the market. A
sustainable solution requires a coordinated national (SA Incorporated) effort and should
consider all options. Eskom is completely supportive of any policy interventions by the
Government in ensuring further economic growth that is likely to attract further industrial
investment.

National Treasury and SALGA responses
Eskom Holdings Revenue Application FY2018/19 Page: 132
19.1.4 Regulatory Clearing Account
National Treasury notes that the RCA has not been taken into account in preparing this
application and that this may result in amendments to the increases presented by Eskom in
the draft application.
National Treasury is correct. Eskom will not be including any RCA adjustments in the
2018/19 revenue application. NERSA has decided not to analyse any RCA submissions until
the outcome of the appeal process is finalised. The outcome of the appeal process has been
determined on 6 June 2017. The subsequent appeal to the Constitutional Court was not
successful. It needs to be clarified that if the RCA process is implemented, then any RCA
adjustments will likely to be in a subsequent year after the 2018/19 financial year.
19.1.5 Primary energy
National Treasury is of the view that the assumed coal increases of 7% between 2015 to
2019 financial years seem quite low (less than 10%).
Further analysis of primary energy costs have been undertaken since the draft submission.
Many of the areas highlighted by National Treasury have been addressed. These will be
provided to NERSA as part of the final submission.
19.1.6 Operating expenditure
National Treasury has requested further details on the key operating costs with regards to
employee benefit costs, maintenance costs and other operating costs. Including in this are
the details related to research costs and Energy Efficiency and Demand Side Management
(EEDSM)
It is accepted that further details on the operating costs would need to be provided to
NERSA to make a revenue decision based on the operating costs. These will be provided in
the final submission to be made to NERSA.
National Treasury and SALGA responses
Eskom Holdings Revenue Application FY2018/19 Page: 133
19.1.7 Corporate Social Investment
In respect of Eskom’s Corporate Social Investment (CSI), it appears that this it is not
included in their application.
National Treasury is correct. In accordance with the MYPD methodology, any CSI is
specifically excluded from the revenue application. This will be funded by Eskom’s bottom
line.
19.1.8 Regulatory asset base
National Treasury has raised concerns about Eskom not undertaking a revaluation of its
regulatory asset base (RAB). National Treasury has also noted Eskom’s proposed Return
on Assets (RoA) which is less than Eskom’s current cost of capital which is marginally higher
than 7.65%.
The National Treasury concern on the valuation of the RAB is noted and appreciated. Due
to the revised methodology being finalised in October 2016, insufficient time was available
for Eskom to finalise the revaluation of the RAB timeously. The revaluation process was
initiated soon after the revised methodology was published. The process was unfortunately
not finalised timeously for inclusion in Eskom’s 2018/19 revenue application. Eskom has
requested NERSA to condone this aspect of the methodology requirement for this revenue
application. Eskom will be in a position to meet this requirement for the next application. It
needs to be noted that for the purposes of migrating towards cost reflectivity, Eskom would
be required to allow for phasing-in of certain revenue requirements. Continuing with the
asset valuation of the RAB, as determined by NERSA for the MYPD 3 period, was one of
the opportunities exploited to address the phasing-in requirement.
As pointed out by National Treasury, it is crucial for the return on assets being requested, to
at least allow for the recovery of interest costs. It needs to be recognised that this lever has
to be one of the options to consider for migration towards cost-reflectivity.
19.1.9 Independent Power Producers
Clarification was sought on which bid windows for the IPP programmes have been included

National Treasury and SALGA responses
Eskom Holdings Revenue Application FY2018/19 Page: 134
in the revenue application. Clarity was sought on the comparison of IPP costs with primary
energy costs.
It is incumbent upon Eskom to include the responses received in terms of the Government
Support Framework Agreement (GSFA) for DOE related IPP projects. This reflects an
assumption, as for all other costs, for NERSA to make a decision on. The NERSA MYPD
methodology requires all IPP costs to be included as a primary energy costs.
19.2 Summary of SALGA responses related to the 2018/19 Revenue Application
19.2.1 Impact on economy and affordability
Concerns have been raised on Eskom applying for an average 19.9% average price
increase. This corresponds to 27.29% increase for Municipal customers to be implemented
from 1 July 2018. This percentage increase is based on below inflation increase for the
2017/18 year of an average of 2.2% increase for which corresponds to a 0.3% increase for
Municipal customers. SALGA proposes that CPI related increase needs to be awarded to
Eskom.
Eskom understands the concerns raised by SALGA in its responses related to impact on
customers. Eskom is required to make an application in terms of the relevant price
determination methodology as approved by NERSA. It is understood that NERSA will apply
its mandate in making a final decision on the revenue application. The percentage increase
in prices is also a factor of the very low increase in the 2017/18 year. It is important to note
that this low increase translated in an increase of only 0.3% to municipalities that will
continue until 30 June 2018. This has assisted municipalities to keep their increases for
2017/18 well below inflation.
Eskom needs to recover the NERSA allowed revenues within its financial year that is
determined by the PFMA and runs from 1 April to 30 June of the following year. In terms of
the MFMA the financial year of Municipalities runs from 1 July to 30 June of the following
year. To be fair and in accordance with the NERSA approved ERTSA methodology
Municipalities will experience exactly the same average annual increase over the period of
the Eskom financial year. As a result municipalities will not experience any increases during
April to June of the new financial year. In order to recover the fair share of the approved
allowed revenue from municipalities the balance of the allowed revenue needs to be

National Treasury and SALGA responses
Eskom Holdings Revenue Application FY2018/19 Page: 135
recovered over 9 months only - causing a higher than the annual average price increase
from 1 July.
As has been rightly pointed out by SALGA the actual increase in allowed revenue being
applied for by Eskom is approximately a 7% increase in total allowed revenue from NERSA’s
decision for 2017/18 (R205bn) to the application for 2018/19 (R219bn).
It is clearly shown in the submission that Eskom maintains its current business at increases
of around inflation – a significant adjustment is related to a decrease in sales volume. It is
critical for Eskom to re-base the sales volumes for 2018/19 to make sure that the average
price that is determined will indeed recover the allowed revenue if applied to a much lower
sales volume; otherwise one will again sit with the same situation of Eskom not recovering
the required revenue.
As reflected in Eskom’s submission to SALGA, a myriad of factors account for a downturn in
the economy. It is argued that the price elasticity of demand is not the only contributing
factor. A detailed economic impact study will be included in Eskom’s submission to explore
this aspect further. The holistic approach to the recovery of efficient and prudent costs for
the production of electricity is discussed in this study.
It is accepted that there is a world-wide phenomenon for migration to self-generating options.
The relevant roleplayers in the industry and Government will be required to give further
attention to this.
19.2.2 Impact of sales volume
SALGA is concerned about the increase in costs despite the continuing decline in sales
volume. Clarity is sought on why costs do not drop when sales volume decrease. Concerns
are raised on the NERSA MYPD and ERTSA methodology that allows Eskom to increase
the tariff to cover for lower sales to maintain the rand value of the income. .
Eskom’s allowed revenue in terms of the MYPD Methodology is to cover variable costs
(mainly primary energy) and fixed costs (operating costs + depreciation + returns).
Eskom agrees with SALGA’s response that as sales volumes drop, lower variable costs
should result - it is only variable costs that can respond to increases and decreases in sales
volumes in the short term. Eskom’s application has taken this into account and the variable
costs reduce in line with the decline in sales. However, Eskom continues to incur the fixed

National Treasury and SALGA responses
Eskom Holdings Revenue Application FY2018/19 Page: 136
costs as the power stations; the networks, staff etc. do not disappear immediately when the
sales volume increases or decreases.
As sales volumes increase or decrease, there would be a concomitant increase or decrease
in variable costs. The key variable costs for the electricity industry are related to primary
energy costs. An insignificant variance in certain operating and maintenance costs will also
be experienced.
Primary energy cost variances due to lower sales have been included in each of the primary
energy cost elements in the application. This is in accordance with the MYPD methodology
that considers coal burn and other primary energy costs including water, nuclear fuel,
environmental levy and coal handling costs. The key fixed costs elements include operating
costs, depreciation and returns.
In order for Eskom to recover the fixed cost element the full revenue must be recovered
even if the volume is lower, with the net effect being that Eskom only recovers the ‘gross
margin’.
The above mechanism also applies in the case of volumes being higher, where the allowed
revenue is recovered over a higher sales volume. It is intuitive that additional primary energy
costs would also be required. This mechanism is standard global regulatory practice for cost-
of-service type methodologies.
SALGA has raised concerns on the NERSA approved MYPD and ERTSA methodologies.
Eskom has implemented the methodologies, as required by NERSA.
19.2.3 Operating costs
SALGA has raised concerns about the employee benefit costs for this application
contributing to approximately 45% of operating costs. Proposals have been made for
austerity measures and NERSA audits.
The 2018/19 revenue application illustrates that operating expenses are expected to
escalate on a year on year at a rate of below inflation. Eskom has undertaken a detailed
design to cost process that has realised efficiencies which are reflected in the application.
NERSA conducts audits on Eskom processes regularly and Eskom welcomes the outcomes
and findings of these audits.
National Treasury and SALGA responses
Eskom Holdings Revenue Application FY2018/19 Page: 137
19.2.4 Primary energy costs
SALGA requested a clarification of how coal mix changes result in increased unit cost.
SALGA agrees with Eskom that lower sales volume should result in lower primary energy
volumes.
The mix variance refers to the combination of power stations that are used to generate
electricity. The delivered average cost of coal differs between power stations. The cost of
coal is impacted by:
The quality of the coal, which must comply with the station design requirements.
Generally, coal of a higher quality costs more.
The logistics costs associated with getting the coal to the station – conveyor, rail or
road.
The source of the coal – coal is generally cheaper from a mine next to the station with a
long term coal supply contract than coal from short and medium term contracts. Coal
contracts may be broadly grouped into three contract types:
- Cost plus – long term contracts where the mine is located close to the power
station. The coal is dedicated to the power station. There are no additional logistics
costs incurred.
- Long term fixed price contracts – historically the mine has also been located next
to the power station, but supplies both Eskom and other parties. This coal may be
relatively cheap because the mine recovers its costs from multiple buyers and
because conveyor is the mode of transport.
- Shorter term fixed price contracts – these contracts are generally used to breach
the gap between coal supplied from long term contracts and the coal required, if
there is a shortfall. They are of a shorter duration, usually relatively small quantities
and more expensive than long term coal. This coal is transported by rail, road or a
combination of both.
Ideally, all power stations should have a mine next door and a conveyor delivering the coal
from the mine to the station. In reality, stations receive coal from more than one source by
more than one transport mode for the following reasons:
Not all stations have mines next to them
The long term contract has expired
The long term contract does not meet all of the stations coal requirements.

National Treasury and SALGA responses
Eskom Holdings Revenue Application FY2018/19 Page: 138
All of the factors above determine the cost of coal at each of the power stations. So, a
reduction in electricity demand and generation will only result in a reduction in coal burn
costs if it is possible to reduce generation at stations where the cost of coal is higher.
19.2.5 Transmission capital costs
SALGA requests clarification on why Transmission infrastructure costs have increased
substantially.
The NERSA Grid Code rules govern investment in the transmission network. Eskom, as the
licensed Transmission Network Service Provider (TNSP), plans the network according to this
code and, subject to funding and other resource constraints, builds the network according to
these plans. Where insufficient funds are available to develop the network, a consistent set
of criteria is applied to prioritise projects and allocate funding in such a way that the
maximum benefit is gained for customers.
Eskom’s transmission network needs to be strengthened and expanded to connect new
loads and generation to the network to enable country growth. In addition, refurbishment
investments are required to sustain a reliable supply of electricity.
The capital plan includes generation integration projects required to ensure that the network
is able to evacuate and dispatch power from new generation sources to load centres. The
plan also includes projects for strengthening the transmission network to allow for future
demand growth, reliability projects to ensure compliance with the Grid Code requirements as
well as refurbishment projects essential for sustaining the network. The increased planned
expenditure for the application year resulted from the phasing of project expenditure peaking
over this period.
19.2.6 Impact of credit rating
Clarification is sought on the processes being undertaken by Eskom to minimise the
potential Eskom credit rating downgrade.
Rating agencies conduct management review meetings with Eskom bi-annually when they
visit South Africa for their due-diligence processes. Eskom also has quarterly engagements
scheduled with rating agencies either in South Africa or London where business updates are
provided to the rating agencies, particularly on their issues of concern. Besides the rating

National Treasury and SALGA responses
Eskom Holdings Revenue Application FY2018/19 Page: 139
agencies annual visits and quarterly engagements, Eskom and the rating agencies engage
on an ad-hoc basis whenever there is an immediate issue to be addressed. These
engagements also allow Eskom to timeously comply with all rating agency reporting
requirements.
Ratings agencies have raised a number of key concerns which could result in a further
ratings downgrade: a Sovereign rating downgrade; a weakened liquidity position and/or a
prolonged state of poor liquidity; free funds from operations as a percentage of debt below
5%; and operational weakness, with costs rising well above the budgeted targets. We are
confident that our financial plan adequately addresses these concerns.
Short-term liquidity will be managed closely by delivering operational and cost efficiencies,
and ensuring revenue uplift, as well as assessing options to rephase debt redemptions
between 2017/18 and 2020/21. Debt servicing is anticipated to increase over the next five
years, driven by increases in interest repayments, as well as debt repayments as loans
mature.
In addition, cost containment is another key component of our strategy. We have developed
programmes which will deliver long-term sustainable savings and/or avoid cost escalation.
These include delivering a total-cost-of-ownership (TCO) based procurement programme on
major commodities; limiting the escalation of coal costs by increasing volumes from cost-
plus mines, and improving the negotiation of other coal contracts; and reducing our company
headcount, while also supporting productivity through skills-based assessments and
targeted hiring programmes. Given this context, the financial health of Eskom is dependent
on a price of electricity that allows for recovery of efficient costs and earning returns which
can cater for debt service commitments.
19.2.7 Renewables
Concerns on the price of electricity from renewable sources are raised. A comparison is
made between the average cost of renewable IPPs and average cost of Eskom primary
energy. Request for Government to include Municipalities as buyers of renewable energy is
made. This is in response to Eskom not willing to sign further IPPs before further discussions
are held with Government. To address the higher average costs of renewable generation,
SALGA proposes the difference be funded through the fiscus (including the environmental
levy).

National Treasury and SALGA responses
Eskom Holdings Revenue Application FY2018/19 Page: 140
The policy issues raised by SALGA are best addressed by Government. These include
defining the buyer of electricity from IPPs in terms of the Electricity Regulation Act and the
provision funding of variance in cost of renewables from average cost through the fiscus.
It needs to be clarified that although IPP costs are considered primary energy costs in terms
of NERSAs MYPD methodology, they correspond to total generating costs. Thus a like-for-
like comparison has to be made. It is clarified that Eskom is in the process of discussing the
signing of further IPPs with Government. The outcome of this discussion will provide
guidance on the way forward.
The procurement of renewable energy through the REIPPP gives effect to the outcome of
the IRP 2010 which proposed a significant shift in generation capacity in the electricity
sector. The steady increase in renewable capacity before 2025 was deliberately intended to
stimulate localisation of RE technology capabilities in South Africa and encourage a gradual
decline in RE costs. The experience of the three completed rounds (bid windows) of the
REIPPP as well as the subsequent but incomplete rounds highlights the effectiveness in
reducing the costs of RE. The figure below indicates the declining prices related to bid
windows 1 through 4 (particular for Solar photovoltaic and wind generators).
FIGURE 40: AVERAGE BW PRICE REIPPP
Source: Single Buyer Office estimated payments in April 2019 (when all operating), adjusted to 2016 ZAR. Some
BW2 and BW 3 projects have partial indexation (leading to over-estimation of cost relative to others not using
partial indexation). CSP average prices reflect expected generation over peak which carries substantial price
premium. CSP in BW 3.5 reflected under BW 4; BW 4 costs reflect the bid prices(not yet adjusted for foreign
exchange which will occur at financial close).

National Treasury and SALGA responses
Eskom Holdings Revenue Application FY2018/19 Page: 141
However the average RE costs indicated in the submission still reflect the high costs of the
first and second bid windows and will continue to do so until additional rounds are completed
to reduce the average price and South Africa is able to capitalise on the increasing RE
capacity (and the “school fees” inherent in the earlier rounds). The legacy costs associated
with bid windows 1 and 2 will continue until the expiry of the contracts after 20 years but
these could decline in significance with additional RE energy procurement. Stopping the RE
procurement process now would result in the continued payment of the “school fees” and the
painful legacy of these rounds but no alleviation from cheaper RE that would follow.
19.2.8 Economic Activity to be improved
Concerns have been raised on South Africa’s economic decline – especially in the industrial
environment. It is reasoned that the economic decline will be reversed by Eskom charging
lower price increases.
The comment suggests that the economic decline will be reversed by only implementing
reasonable electricity prices. The current decline in economic activity is much more complex
than that and more stakeholders are required to take up their accountability and to
collaborate in finding a solution instead of only relying on Eskom to turn the tide on its own.
Eskom accept that the increase in electricity prices in the last few of years had partial impact
on the decrease in sales. However, in discussions with various industrial customers various
other reasons were highlighted as drivers for the current situation. The declining trend in the
in Eskom sales can be attributed to a number of driving forces including:
Electricity price increases have played a part in constraining growth as the cost of
electricity for certain industries is a high percentage of production cost
South African industrial plants have overcapacity while commodity prices either remains
static or reduce together with the remote location from major markets
- China is taking our market share in a fiercely competitive market
- Other input costs, particularly where electricity cost intensity is lower also play a
role, i.e. expensive transport and location of plants from the markets
Availability of electricity and energy efficiency drives during period of capacity constraint
created permanent loss in sales/revenue
- Eskom communicated to customers to reduce sales since load shedding
- Energy efficiency initiatives implemented: Eskom requested a 10% reduction in load

National Treasury and SALGA responses
Eskom Holdings Revenue Application FY2018/19 Page: 142
- Energy Conservation Scheme (ECS) rules were embedded in Electricity Supply
Agreements
Reluctance by global companies to invest in SA due to a lack in competitiveness and the
uncertain situation in SA from a political and sustainable financial perspective (i.e. credit
rating, labour)
Internationally governments (not utilities) provide mechanisms for incentivised electricity
prices for large energy intensive users in their countries
A sustainable solution requires a coordinated national (SA Inc) effort and should
consider all options. Eskom is completely supportive of any policy interventions by the
Government in ensuring further economic growth that is likely to attract further industrial
investment.
As reflected in Eskom’s application, Eskom is making every effort to increase local in
cross-border sales. However, as alluded to earlier a concerted effort by the country is
needed to improve economic conditions.
As cost drivers are not only electricity prices, growth initiatives are driven from a country
platform together with the key role players, i.e. Department of Trade and Industry, Economic
Development Department, Industrial Development Corporation, National Treasury,
Department of Energy, and the National Energy Regulator of South Africa to ensure an
integrated and focused SA Inc approach to maximise growth stimulation.
The Government has initiated the establishment of a work group facilitated by the
Department of Public Enterprises to find alternative options that can be implemented. This
include short term price incentives for electricity intensive users as well as more cost
reflective tariffs for energy intensive industrial customers.
19.2.9 Impact on Municipal Debt
SALGA is concerned that any price increase will result in further debt burden on
Municipalities. Approximately 50% of Municipal electricity customers are residential
customers. Approximately 40% of these are indigent. It is felt that this is a vicious cycle.
It is agreed that the Municipal debt challenge needs to be addressed. It is submitted that the
challenge needs to be looked at holistically from a Municipality financial sustainability point

National Treasury and SALGA responses
Eskom Holdings Revenue Application FY2018/19 Page: 143
of view. The economic impact study undertaken by Eskom illustrates the impact of price
increases on various economic factors.
Eskom has committed to look at some of the items which the Municipalities deem to be
contributing to the Municipal debt situation.
Eskom has agreed to implement the following (after following due governance processes)
1. Changing the interest rate charged on overdue amounts from Prime plus 5% to Prime
plus 2.5%
2. Changing the payment cycle from 15 days to 30 days
3. Changing the payment allocation to Capital debt first and then interest
4. Allowing municipalities to pay connection charges for new/upgrading of supply points
over a period of time instead of on a cash upfront basis.
It is proposed that these concessions would make it easier for the municipalities to deal with
the debt situation.

Revenue requirements for licensees
Eskom Holdings Revenue Application FY2018/19 Page: 144
20 Revenue requirements for licensees
Eskom’s allowable revenue requirement comprises that of Generation, Transmission and
Distribution businesses. Generation contributes about 75% of the allowable revenue with the
networks making up the balance.
20.1 Generation allowable revenue
Generation revenue requirement is R175 158 million with the production costs contributing
almost R96 billion which represents 55% of the allowable revenue. Generation own primary
energy is R59 340 million, IPPs adds R34 209 million and international purchases of
R3216 million. Core operating expenditure is R35 200 which includes their share of
corporate overheads adding R6 988 million. Debt commitments are covered through
depreciation and returns of R35 391 million.
TABLE 37 : GENERATION ALLOWABLE REVENUE
Generation
Allowable Revenue (R'millions)AR
Application
2018/19
Regulated Asset Base (RAB) RAB 549 527
WACC % ROA 2.97%
Returns 16 329
Expenditure E 35 200
Primary energy PE 59 340
IPPs (local) PE 34 209
International purchases PE 3 216
Depreciation D 19 062
IDM I
Research & Development R&D
Levies & Taxes L&T 7 994
RCA RCA
Total Allowable Revenue R'm 175 351
Not claimed in application
Corporate social investment (CSI) - 193
Allowable Revenue for Generation 175 158

Revenue requirements for licensees
Eskom Holdings Revenue Application FY2018/19 Page: 145
20.2 Distribution allowable revenue
Distribution revenue requirement is R33 257 million covering expenditure of R23 434 which
includes their share of corporate overheads adding R3 510 million. Debt commitments are
covered through depreciation and returns of R9 356 million.
TABLE 38 : DISTRIBUTION ALLOWABLE REVENUE
Distribution
Allowable Revenue (R'millions)AR
Application
2018/19
Regulated Asset Base (RAB) RAB 104 691
WACC % ROA 2.97%
Returns 3 111
Expenditure E 23 434
Primary energy - net import PE
IPPs (local) PE
International purchases PE
Depreciation D 6 245
IDM I 511
Research & Development R&D
Levies & Taxes L&T
RCA RCA
Total Allowable Revenue R'm 33 301
Not claimed in application
Corporate social investment (CSI) - 44
Allowable Revenue for Distribution 33 257

Revenue requirements for licensees
Eskom Holdings Revenue Application FY2018/19 Page: 146
20.3 Transmission allowable revenue
Transmission external revenue requirement is R11 112 million covering expenditure of R4
029 million which includes their share of corporate overheads adding R921 million. Debt
commitments are covered through depreciation and returns of R7 083 million.
TABLE 39 : TRANSMISSION ALLOWABLE REVENUE
Note that this represents external costs and excludes technical losses and ancillary costs.
Transmission
Allowable Revenue (R'millions)AR Formula
Application
2018/19
Regulated Asset Base (RAB) RAB 109 371
WACC % ROA X 2.97%
Returns 3 250
Expenditure E + 4 029
Primary energy PE +
IPPs (local) PE +
International purchases PE +
Depreciation D + 3 833
IDM I +
Research & Development R&D +
Levies & Taxes L&T +
RCA RCA +
Total Allowable Revenue R'm 11 112
Not claimed in application
Corporate social investment (CSI) - 15
Allowable Revenue for Transmission (external) 11 097

Conclusion
Eskom Holdings Revenue Application FY2018/19 Page: 147
21 Conclusion
Eskom has been striving to keep cost escalations close to inflationary levels which have
been highlighted as follows:
Eskom’s own primary energy costs excluding local IPPs growing at a CAGR of 1.5% per
annum
The total primary energy increasing by CAGR of 8.7% per annum after IPPs costs are
added into the supply mix
Employee benefits escalating by CAGR of 4.9% per annum and reduction of staff
complement
Operating and maintenance costs escalating with a CAGR 7.3%. This drops to less than
inflation from 2016/17 to 2018/19
Capital expenditure grows with focus on completing new build projects, maintaining
existing power stations, strengthening and expanding network businesses
Eskom’s allowable revenue applied for in 2018/19 grows by R14 billion from the R205 billion
allowed in 2017/18, equating to an absolute revenue growth of 7%. Half of the increase in
revenue will be recovered from exports and negotiated pricing customers and the remainder
being recouped from standard tariff customers.
As described in this application one of the major drivers to the price increase is that this
application requires a rebasing of sales volumes in the region of 30 TWh. In terms of
NERSA’s methodologies Eskom needs to recover the allowable revenue as this provides for
contribution to fixed costs. Over the MYPD3 period the organisation has been unable to
recover the allowed revenue which reflects a under recovery by March 2017 of
approximately R48 billion. Actual sales volumes have remained relatively flat over the last
few years and expected to continue in the next 2 years based on the current economic
environment. Eskom appreciates the importance of maintaining and growing sales volumes
as described in sales initiatives and recent emphasis to grow cross border sales.
In order to limit the revenue requirement and therefore the electricity price impact, Eskom
has reduced the returns when compared to the decision made by NERSA for the 2017/18
year. The revenue requirement results in the average electricity of price of 107c/kWh.

Conclusion
Eskom Holdings Revenue Application FY2018/19 Page: 148
Finally, NERSA has mechanisms to help protect targeted customer categories and
customers will require flexibility in these areas to maintain and grow sales volumes in trying
circumstances whilst balancing the needs of consumers and ensuring the financial
sustainability of Eskom.

Appendix 1 - Coal Burn Costs
Eskom Holdings Revenue Application FY2018/19 Page: 149
22 Appendix 1 - Coal Burn Costs
22.1 Coal Burn Costs and Volume(Kt) per Power Station
Table 40: Assumed Coal Burn Costs per Power Station
Coal Burn Costs (R 'M) Purchases cost ratio
FY19 Burn allocation FY19 (R ‘M)
Power Stations Actuals 2016/17
Projection 2017/18
Application 2018/19
Cost Plus
Fixed Price
MT Cost Plus Fixed Price
MT Total
Kusile
Medupi
Duvha
Kendal
Lethabo
Majuba
Matimba
Matla
Tutuka
Arnot
Camden
Grootvlei
Hendrina
Komati
Kriel
Total Coal Burn Costs (R'million)
44 164 45 642 48 687
17 140 11 442 20 105 48 687
The above Coal burn allocations per contract type were done at a high level basis using
purchases as a proxy.

Appendix 1 - Coal Burn Costs
Eskom Holdings Revenue Application FY2018/19 Page: 150
Table 41: Coal Burn volume (Kt) per Power Station
Coal Burn Kt Purchases volume ratio
FY19 Burn allocation FY19
Power
Stations
Actuals
2016/17
Projection
2017/18
Application
2018/19
Cost
Plus
Fixed
Price MT
Cost
Plus
Fixed
Price MT Total
Kusile
Medupi
Duvha
Kendal
Lethabo
Majuba
Matimba
Matla
Tutuka
Arnot
Camden
Grootvlei
Hendrina
Komati
(Comm)
Kriel
Total Coal
Burn (Kt) 113 737 116 099 112 397
45 944 30 898 35 555 112 397
The above Coal burn allocations per contract type were done at a high level basis using
purchases as a proxy.
22.1.1 Explanation of Coal Burn Costs
NERSA requires burn to be submitted per station, per contract type and per supplier. Eskom
calculates coal burn on a weighted-average-cost basis. A single coal stock pile is maintained
for all coal delivered to the stock yard, irrespective of the contract type. The coal is burnt as
a single, mixed product and not as three different product types. Accordingly, coal burn does
not differentiate between contract types (i.e. cost-plus, fixed-price or medium term).

Appendix 1 - Coal Burn Costs
Eskom Holdings Revenue Application FY2018/19 Page: 151
Eskom has submitted coal burn per station. Eskom furthermore, has made assumptions to
split coal burn by contract type, calculating coal burn in the same ratio as coal purchases.
When coal burn is calculated in the same ratio as coal purchases, the following factors
would need to be taken into account:-
22.1.2 The treatment of opening stock in the first year
Opening stock volumes in the first year are not segregated in accordance with the contract
type which covered the purchase. Opening stock will therefore be weighted in line with the
ratio of purchases of the previous year, for example, xx Cost-Plus, xx LT Fixed-Price and xx
MT Fixed-Price. A second assumption is made on the value of each category of coal in the
opening stock. The assumption could be that the unit cost is the same as the previous year’s
average purchases unit cost for that contract type, for example, if the average MT Fixed
Price purchases R/t was Rxx/t, this would be the unit cost of xx% of the coal in the opening
stock. Another further assumption is made to allocate common costs to each contract type.
22.1.3 Coal burn
The assumption is that opening stock per contract type and purchases per contract type are
added to obtain an average unit cost per contract type for the year. Coal burn is calculated in
the ratio of the sum of the opening stock plus purchases per contract type.
22.1.4 Closing stock
When the opening stock and burn are calculated as explained in the preceding paragraphs,
closing stock would be opening stock plus purchases less burn per contract type.
22.1.5 Adjustments to stock
An assumption would need to be made for adjustments to the stock, for example,
adjustments after the quarterly stock surveys.
22.2 Coal Purchase Ratio used to calculate coal burn per contract type
It is assumed that coal burn will be occurring in the ratio that coal purchases have occurred.
Thus assumptions in accordance with this are made for coal burn.
22.3 Coal cost escalation assumption for FY 2019
Eskom used a R/ton percentage increase of x% on the cost of coal.

Appendix 1 - Coal Burn Costs
Eskom Holdings Revenue Application FY2018/19 Page: 152
22.4 Coal stockpile volumes
Emergency stockpiles at Arnot, Henrina, Duvha, Camden and Grootvlei hold coarse coal to
alleviate coal handling problems during the rainy season. The table below reflects the tonnes
of coal on stockpiles during FY17 and the first quarter of FY18. The results are from the coal
stock survey conducted at in February 2017 and in May 2017. They will therefore differ from
the final stock volumes at the end of March 2017.
TABLE 42: VOLUME OF COAL ON STOCKPILE (TONNES)
Actuals FY17 FY18
Emergency Strategic Seasonal Live Emergency Strategic Seasonal Live
Arnot
Kriel
Lethabo
Tutuka
Hendrina
Matla
Duvha
Kendal
Majuba
Matimba
Camden
Grootvlei
Komati
Medupi
Kusile
TOTAL
455 351 23 788 816 2 396 452 1 603 351 458 992 22 965 642 2 163 985 1 226 401
22.5 Rail transport indices and escalations
The following table is indicative of the escalation components for FY18. However, the
contract with TFR ends at the end of FY18. For FY19, an 8% escalation rate was assumed.

Appendix 1 - Coal Burn Costs
Eskom Holdings Revenue Application FY2018/19 Page: 153
TABLE 43: ESCALATION COMPONENTS FOR FY18
22.6 Road transport indices and escalations
The following table provides indications of values related to road transport indices and
escalations.
TABLE 44: ROAD TRANSPORT INDICES AND ESCALATIONS
Component Portion Source Document IndexWeighted
Index
PPI Component 42.60% Stas SA P0142.1 Table C1 7.08% 3.02%
Labour 39.10% TFR 7.50% 2.93%
Fuel 8.70%
Department of Energy - Levies,
Taxes & Margins (Diesel 0.05%
Suplhur) -0.95% -0.08%
Electricity 9.60% Transflex 1 2.20% 0.21%
Total 100.00%
Component Proportion Index Linked To Cycle
Labour 20%
NBCRFI (National Bargaining Council for the Road
Freight Industry) Annually
Cost of Capital (Applicable to
vehicles not fully depreciated) 3%
Prime interest rate-SARB (South African Reserve
Bank) Annually
Fuel (Diesel) 35%
DoE (Department of Energy) 0.5% sulphur, Zone
Adjusted Monthly
Maintenance 10% RFA (Road Freight Association) Annually
Lubricant and tyres 10% RFA (Road Freight Association) Annually
Depreciation 10% RFA (Road Freight Association) Annually
CPI 12% Stats SA, Table A, CPI Headline Annually
Total 100%
Appendix 2 – Coal handling Costs
Eskom Holdings Revenue Application FY2018/19 Page: 154
23 Appendix 2 – Coal handling Costs
23.1 Coal handling costs
The major activities include the Provision of Coal handling, Operating, Maintenance,
Cleaning and Maintenance from the Coal Mine (some Mines are still responsible for the
operation and maintenance of the conveyor belts) to the Coal Conveyor Plant and Coal
Stockyard. This requires the management of operations 24 hours a day 7 days a week on
the Coal plant, conveyor system and cleaning so as to ensure the efficient operations of the
various plants.
Coal handling costs in 2018/19 accounted for 2.9% of the Total Eskom Generation Primary
Energy costs of R67 015m. The Coal handling costs increased by approximately CPI year-
on-year, despite the new units of Medupi and Kusile being commissioned within this time
frame. The new units added additional coal handling costs to the Generation cost base.
23.2 The major cost drivers for coal handling
The major drivers for coal handling costs can be allocated to the following roles:
Labour
Yellow plant (machinery)
White plant (machinery/vehicles)
Fuel for yellow and white plant
Contingencies
23.2.1 Labour
The number of staff, their responsibilities and labour inflation assumptions are covered in the
SLA of each power station and are negotiated centrally for the whole Generation fleet of
stations to obtain better rates.
23.2.2 Yellow and white plant description and functions:

Appendix 2 – Coal handling Costs
Eskom Holdings Revenue Application FY2018/19 Page: 155
TABLE 45: YELLOW AND WHITE PLANT DESCRIPTION AND FUNCTIONS
Item Plant Description (Yellow) Job Description
1. Bull Dozer Pushing of import coal for reclaim the coal
2. Front end loader Pushing up coal and load coal into the mobile feeders
3. Dump Trucks To move coal to various and difficult areas
4. Motor Grader To grade the roads on coal stockpiles and associated
gravel roads
5. Tipper Trucks Transport coal to various where it’s required
6. Smooth Drum Roller Compact seasonal and strategic stockpiles and gravel
roads
7. Water Tanker Dust suppression on coal stockpiles and gravel roads
8. Tractor loader bucket/TLB Clean sumps and dig trenches
9. Excavator To lead tipper and dump trucks. To break strategic
piles loose.
Item Plant Description (White) Job Description
1. LDVs To transport spares and tools
2. 7, 12 & 23 seater bus To transport people onsite and home work home
23.3 Coal handling costs per power station
Further information with regards to Eskom coal handling costs per power station is
presented below. Assumptions are made with regards to the contribution of drivers for the
coal handling costs.
TABLE 46: COAL HANDLING COSTS PER POWER STATION
Coal handling
R'million
Actuals
2016/17
Projection
2017/18
Application
2018/19
Kusile 0 10 39
Medupi 20 25 60
Duvha 194 204 216
Kendal 95 73 106
Lethabo 162 174 188
Majuba 240 281 303
Matimba 46 49 52
Matla 134 148 157
Tutuka 201 203 215

Appendix 2 – Coal handling Costs
Eskom Holdings Revenue Application FY2018/19 Page: 156
Coal handling
R'million
Actuals
2016/17
Projection
2017/18
Application
2018/19
Arnot 163 170 180
Camden 92 108 115
Grootvlei 106 111 118
Hendrina 107 105 0
Komati 73 76 80
Kriel 127 136 144
Total Coal Handling costs 1 758 1 874 1 974
Coal handling costs differ from power station to power station. At one extreme coal handling
costs amounted to R52m for Matimba in 2018/19 and at the other extreme, amounted to
R253m at Majuba in 2018/19. Valid reasons are provided for this variance between power
stations.
23.4 Coal handling costs per cost driver
TABLE 47: COAL HANDLING COSTS PER COST DRIVER
Coal handling per cost driver
R'million
Actuals
2016/17
Projection
2017/18
Application
2018/19
Labour(60%) 1 055 1 124 1 184
Yellow plant(15%) 264 281 296
White plant(5%) 88 94 99
Fuel for plant(15%) 264 281 296
Contingencies(5%) 88 94 99
Total Coal Handling costs 1 758 1 874 1 974
Assumptions are made on derived allocations for the split in coal handling costs per cost
driver based on historical trends.

Appendix 3 – Water Costs
Eskom Holdings Revenue Application FY2018/19 Page: 157
24 Appendix 3 – Water Costs
Further information with regards to Eskom water costs per power station is presented below.
TABLE 48: WATER COSTS PER POWER STATION
Water costs
R'million Actuals
2016/17
Projection
2017/18
Application
2018/19
Arnot 134
164 201
Camden 116
137 126
Duvha 79
227 281
Gariep 2
2 2
Grootvlei 29
25 35
Hendrina 122
143
Kendal 72
64 73
Koeberg 3
3 3
Komati 101
93 148
Kriel 305
261 295
Kusile 0
40 57
Lethabo 30
50 52
Majuba 72
137 140
Matimba 54
72 77
Matla 253
273 328
Medupi 125
219 232
Renewables 1
1 1
Tutuka 202
280 267
Vanderkloof 52
55 59
Efficiency target - -61 -65
Total Water Costs 1 751 2 185 2 310
Eskom pays for the water it consumes through a series of water tariffs which are legislated,
and beyond the control of Eskom. Historically, water costs have been very low as a
percentage of the Eskom operating costs. The main reason for this is that the water
infrastructure assets (Eskom’s and that of the Department of Water & Sanitation (DWS))

Appendix 3 – Water Costs
Eskom Holdings Revenue Application FY2018/19 Page: 158
were constructed several years ago and are almost completely depreciated. As new
infrastructure and water charges have been introduced, the demand for water and the cost
have increased. Furthermore, the cost increases as the distances over which water needs to
be transferred increase and as new tariffs are introduced into legislation.
New water infrastructure includes the augmentation to the Vaal (VRESS - Vaal River
Eastern Subsystem), Komati (KWASAP – Komati Water Augmentation Scheme) and Mokolo
(MCWAP – Mokolo Crocodile West Augmentation Project) water schemes. The DWA
National Water Pricing Strategy allows DWA to implement these projects “off budget” and to
recover associated costs via a tariff. The Komati and Mokolo costs are recovered on a take
or pay pricing basis.
24.1 Water Volumes (ML)
TABLE 49: WATER VOLUMES PER POWER STATION
Power Stations Actuals 2016/17
Projection 2017/18
Application 2018/19
Kusile - 2 055 2 770
Medupi 477 4 447 5 727
Duvha 21 958 30 805 31 651
Kendal 5 694 3 188 3 421
Lethabo 36 997 40 075 39 830
Majuba 22 103 23 050 21 926
Matimba 4 273 3 382 3 412
Matla 37 486 39 219 41 916
Tutuka 34 169 32 545 28 979
Arnot 25 494 26 035 25 416
Camden 17 873 18 277 15 821
Grootvlei 8 965 11 189 13 695
Hendrina 19 533 18 981 -
Komati 15 082 18 956 18 526
Kriel 34 249 30 042 30 779
Total Water Volumes (ML) 284 352 302 245 283 869
24.2 Major Water Schemes and Contracts
The following table illustrates the scheme(s) which supply water to each power station and
the cost components that apply to each power station.

Appendix 3 – Water Costs
Eskom Holdings Revenue Application FY2018/19 Page: 159
TABLE 50: WATER SCHEMES AND POWER STATIONS SUPPLIED
Scheme Power Stations Supplied Water Tariff Components
Vaal River Eastern Sub System (VRESS)
Komati Water Scheme
Duvha (approx. 50%), Komati, Hendrina,
Arnot & Kusile
Catchment Management Fee (CMF);
Water Research Commission (WRC);
VRESSAP & KWSAP
Usutu Water Scheme Kriel (approx.40%) & Camden Return on Assets (ROA); CMF; WRC;
VRESSAP; Operations & Maintenance
(O&M)
Usutu-Vaal Water Scheme Tutuka, Matla, Kendal ROA; CMF; WRC; VRESSAP; VRT;
O&M
Slang Majuba ROA; CMF; WRC; VRT; VRESSAP
Vaal Lethabo, Grootvlei, Duvha (approx. 50%),
Kriel (approx. 60%), Matla, Kendal, Tutuka
& Kusile
ROA; CMF; WRC; VRT
Mokol Matimba & Medupi Power Stations Contract with Exxaro

Appendix 3 – Water Costs
Eskom Holdings Revenue Application FY2018/19 Page: 160
FIGURE 41: INTEGRATED VAAL RIVER SYSTEM (IVRS)

Appendix 3 – Water Costs
Eskom Holdings Revenue Application FY2018/19 Page: 161
The water financial plan comprises the following cost elements, which are also the primary
cost drivers:
Water cost - levies, including cost of new water infrastructure
Electricity (pumping costs)
Operations and maintenance – incurred by Eskom on the Komati Water Scheme and
by DWS on the Usutu, Usutu-Vaal, Vaal and Slang
Amortization and capital spend
The coal fired power stations in the Highveld are supplied from the Integrated Vaal River
System which is supported with water transfers from Lesotho and the Thukela River in
KZN. In Mpumalanga there are 3 subsystems, viz. Komati Water Scheme, Usutu Water
Scheme and the Usutu Vaal Water scheme that are interconnected and supply the
Mpumalanga power stations. Water can be transferred between each subsystem to
manage any water supply risk. DWS runs a computer model yearly to determine what
volumes of water need to be transferred between subsystems and into the greater Vaal
River system to manage future water supply risks. Water tariffs are legislated by the
National Water Pricing Strategy. The water tariffs in each subsystem differ as determined
by the statutory tariffs applicable to that subsystem and by the operating and infrastructure
costs incurred by the DWS.
Lethabo and Grootvlei Power Stations obtain water directly out of the Vaal dam. Majuba
Power Station is supplied from a subsystem called the Slang. All of these are still within the
IVRS.
The water supply to Matimba and Medupi Power Stations is from this system, which is
being developed in phases. Phase 1 supplies water from Mokolo Dam located in the
region. The future water supply will be from the Crocodile River (West) and will be
transferring excess return flows (treated water from Gauteng’s sewage works) to the
Lephalale Area. The water tariffs include statutory tariffs levied, operating and infrastructure
costs as determined by the DWS’s National Water Pricing Strategy. These future phases
will have a significant impact on the pumping costs and the capital unit charges.
The costs are incurred before the water enters the power station. The meter for payment of
the water is located before the power stations raw water storage reservoir. Eskom is billed
by DWS on the reading as per these meters. When the water is consumed at the power
stations, the costs that are incurred (primarily water treatment costs) are relatively small
compared to the costs incurred before the power station.

Appendix 4 – Water treatment costs
Eskom Holdings Revenue Application FY2018/19 Page: 162
25 Appendix 4 – Water treatment costs
Further information with regard to Eskom water treatment costs per power station is presented below.
TABLE 51: WATER TREATMENT COSTS PER POWER STATION
Water treatment R'million
Actuals 2016/17
Projection 2017/18
Application 2018/19
Kusile 0 2 6
Medupi 0 3 7
Duvha 13 20 23
Kendal 38 42 45
Lethabo 40 46 50
Majuba 35 35 38
Matimba 31 33 35
Matla 35 39 42
Tutuka 86 90 96
Arnot 40 41 44
Camden 7 6 7
Grootvlei 24 23 24
Hendrina 17 19 0
Komati 19 21 23
Kriel 39 44 51
Total Water Treatment cost 423 465 490
Water treatment costs in 2018/19 amount to 0.7% of the Total Eskom Generation Primary
Energy costs of R67 015m. Water treatment costs for Total Generation costs increase by
approximately CPI year-on-year. This is despite new units from Medupi and Kusile being
commissioned in the period and thus adding costs to the Generation cost base.

Appendix 4 – Water treatment costs
Eskom Holdings Revenue Application FY2018/19 Page: 163
25.1 Water Treatment Cost per process
TABLE 52: WATER TREATMENT COST PER PROCESS
Water treatment per process
R'million
Actuals
2016/17
Projection
2017/18
Application
2018/19
Cooling water(85%) 360 395 417
Potable water(10%) 42 46 49
Demineralised water(5%) 21 23 25
Total Water Treatment cost 423 465 490
The split of water treatment costs per process was done in the same ratio as that of the
water usage at a power station.
25.2 Cost of water treatment materials/chemicals
The other main drivers of water treatment cost are the cost of the chemicals used to treat
the raw water. It is assumed that the costs of the chemicals will increase by CPI each year.