revealed by an exploratory factor analysis of equip …
TRANSCRIPT

THE UNDERLYING RELATIONSHIPS BETWEEN THE OBSERVED PRACTICES AS
REVEALED BY AN EXPLORATORY FACTOR ANALYSIS OF EQUIP RATINGS
by
JENESTA RAE NETTLES
Bachelor of Science, 1998 Texas A&M University College Station, Texas
Master of Curriculum and Instruction, 2006 University of Idaho
Moscow, Idaho
Submitted to the Graduate Faculty of the College of Education
Texas Christian University in partial fulfillment of the requirements
for the degree of
Doctor of Philosophy Science Education
December 2015


ii
ACKNOWLEDGEMENTS
I would like to express my gratitude to my committee Dr. Molly Weinburgh, Dr.
Cecilia Silva, Dr. Robin Griffith, and Dr. Kristina Higgins. Without their guidance, expertise,
and invaluable time, I would not have succeeded. In particular, many times throughout this
journey, Dr. Weinburgh’s belief in me was my only motivation.
This would not have been possible without the support of my fellow researchers. Dr.
Katherine Fogelberg and Dr. Freyca Berumen Calderon established a professional writing
group, modeling graciousness and professional excellence. Dr. Kelly Feille, my professional
life partner, shares her abundant supply of ambition, momentum, and joy. Dr. Angela
Buffington, my academic sibling, exemplifies perseverance and grace.
The TCU College of Education and Teacher Quality Grant Evaluation leadership
team provided an atmosphere of collaboration. This work is an amalgamation of personal,
professional, and academic curiosity. Elizabeth Powers, Dr. Pete Smith, and Dean Mary
Patton had the insight and vision to provide a setting conducive to this kind of inquiry.
My family has been patient and loving. My parents (Micki Gray, Marge Gray, Jamie
Nettles, and Sandra Nettles) have been endlessly supportive. Watching Sandra Nettles earn
her Masters degree a few decades ago planted the seed of higher education. My brother Kip
Nettles inspired me towards my proudest achievement, that of teacher. Zane Salavon served
as a sounding board throughout this work. Ian Salavon, my personal life partner, has
provided love, encouragement, and consistent reassurance.

iii
TABLE OF CONTENTS
ACKNOWLEDGEMENTS ...................................................................................................... ii
TABLE OF CONTENTS ......................................................................................................... iii
LIST OF TABLES ................................................................................................................... vi
LIST OF FIGURES ................................................................................................................ vii
Chapter 1 Introduction .............................................................................................................. 1
Statement of Problem ......................................................................................................................... 3
Research Questions ............................................................................................................................ 4
Significance of the Study ................................................................................................................... 5
Terms .................................................................................................................................................. 5
Chapter 2 Literature Review ..................................................................................................... 8
Learning Cycles ................................................................................................................................. 8
Three-Phase Cycle ......................................................................................................................... 9
Five-phase model ......................................................................................................................... 12
History of Inquiry Instruction .......................................................................................................... 13
Benchmarks for Science Literacy ................................................................................................ 14
National Science Education Standards ........................................................................................ 14
A Framework and the Next Generation Science Standards ......................................................... 15
Reform-Based Inquiry Science Observation Instruments ................................................................ 16
Reformed Teaching Observation Protocol .................................................................................. 16
Inside the Classroom Observation Protocol ................................................................................. 17
Electronic Quality of Inquiry Protocol ........................................................................................ 17
Conclusion ........................................................................................................................................ 20

iv
Chapter 3 Methodology .......................................................................................................... 21
Methods ............................................................................................................................................ 21
Sample .............................................................................................................................................. 21
Data Collection ................................................................................................................................. 22
Instrument ........................................................................................................................................ 23
Chapter 4 Results .................................................................................................................... 26
Discriminant Factor Analysis ........................................................................................................... 26
Exploratory Factor Analysis ............................................................................................................ 28
Primary Science Classroom (1st -5th Grade) ................................................................................. 29
Secondary Science Classroom (5th Grade –Graduation) .............................................................. 37
Inter-matrix Relationships ................................................................................................................ 42
Chapter 5 Discussion .............................................................................................................. 43
Grade Level Differences and Underlying Relationships ................................................................. 43
Unexpected factor results ............................................................................................................. 44
Order of Instruction and Prior Knowledge .................................................................................. 44
Discourse Construct ..................................................................................................................... 46
Inter-matrix Relationships ........................................................................................................... 47
Limitations ....................................................................................................................................... 47
Future Research ................................................................................................................................ 48
REFERENCES ....................................................................................................................... 50
APPENDIX A EQUIP (Marshall, et al., 2009) ..................................................................... 56
APPENDIX B Tables of the Discriminant Factor Analysis .................................................. 58
APPENDIX C Tables of the Exploratory Factor Analysis ..................................................... 59

v
VITA ....................................................................................................................................... 63
ABSTRACT ............................................................................................................................ 64

vi
LIST OF TABLES
TABLE 1 CORRELATION AND STANDARDIZED COEFFICIENTS OF EQUIP INDICATOR RATINGS ............................27
TABLE 2 FACTOR LOADINGS FOR EFA WITH OBLIMIN ROTATION OF EQUIP FOR PRIMARY DATASET ...............30
TABLE 3 DESCRIPTORS OF PROFICIENT EQUIP RATINGS FOR PARTICIPATION RIGOR (MARSHALL ET AL, 2009) ..34
TABLE 4 FACTOR LOADINGS FOR EFA WITH OBLIMIN ROTATION OF EQUIP FOR SECONDARY DATASET ..........38
TABLE 5 DESCRIPTIONS OF EQUIP RATINGS OF PROFICIENT FOR READINESS FOCUS (MARSHAL ET AL, 2009) ....39
TABLE 6 DESCRIPTIONS OF EQUIP RATINGS OF PROFICIENT FOR EXPERIENCE FOCUS (MARSHAL ET AL, 2009) ..40

vii
LIST OF FIGURES
FIGURE 1. RELATIONSHIP OF PRIMARY DATASET FACTORS TO THE EQUIP CONSTRUCTS AND INDICATORS. .........36
FIGURE 2. RELATIONSHIP OF SECONDARY DATASET FACTORS TO EQUIP CONSTRUCTS AND INDICATORS. ...........41
FIGURE 3. INTER-MATRIX COMPARISON OF SOCIALLY AND CONCEPTUALLY RIGOROUS INSTRUCTION. ..................42

1
Chapter 1
Introduction
…if you think that teaching is always and only a process of giving people
direct instructions and giving them information they have to memorize -
but teaching is much more than that. It's about enabling. It's about
facilitating. It's about mentoring. It's about creating curiosity. It's true in
the work of every creative person I've ever met that what drives them is a
passionate appetite for the work. But what facilitates it is an increasing
control over materials and ideas. So there's a pedagogy, and you can do it.
And my argument is it's essential that we do do it.
Sir Ken Robinson, 2014
While there is a time and a place for memorization and direct instruction, the
changing needs of today’s learners cannot be met by these instructional practices alone. The
last few decades have brought increased access to vast amounts of un-vetted information,
mechanization of repetitive and/or computational tasks, and unprecedented classroom
heterogeneity. These changes, while predominantly advantageous, come with a unique set of
challenges.
Students must learn how to determine what information is credible, offer services
beyond those reproducible by a machine, and reap the benefits of unique perspectives. The
abilities required to accomplish this cannot be transmitted through direct instruction, but
must be cultivated through more individualized instructional strategies. Fortunately,
educational researchers are advocating for learner-centered instruction, which relies on active

2
participation from the learner (Bransford, Darling-Hammond, & LePage, 2005; Cochran-
Smith & Lytle, 2009; DeBoer, 1991; Lawson, 2010; Luft, Bell, & Gess-Newsome, 2008;
National Research Council [NRC], 2012).
In particular, the science education community advocates learner-centered instruction
and extends the concept to include engaging the learner in scientific practices using the
umbrella term inquiry instruction (Lawson, 2010; Luft, Bell, & Gess-Newsome, 2008; NRC,
2000a). Thus, in addition to a classroom practice of relating “to the interests and life
experiences of students…” (NRC, 2012, p. 31), science educators are encouraged to enlist
learner participation in asking questions, designing and conducting investigations, using data
to formulate explanations, communicating results, justifying findings, and evaluating each
others’ arguments (Avraamidou, 2014; Marshall & Alston, 2014; NRC, 2012). Over the past
few decades, these recommendations for inquiry instruction in science have been refined,
specified, and increasingly supported by educational and cognitive research (DeBoer, 1991;
Lawson, 2010; Lawson, Abraham, & Renner, 1989; Luft, Bell, & Gess-Newsome, 2008;
NRC, 2000b, 2012).
Science teacher educators and science education researchers are making multiple
efforts (e.g., professional development, methods courses) to facilitate the implementation of
science inquiry instructional practices (Wilson, Taylor, Kowalski, & Carlson 2010).
However, helping teachers adjust their practices to include inquiry-based science instruction
is not easy (Crowther, Shahidullah, & Pozarski-Connolly, 2015; NRC, 2000a). To add to the
problem, assessing the use of inquiry-based instruction has also been a challenge. Several
instruments have been developed over the last 20 years in an effort to provide teachers and
teacher educators with ways to capture what is happening in classrooms. Some of the

3
observational instruments include Reform Teaching Observation Protocol (RTOP; Sawada et
al, 2002), Inside the Classroom Observational Protocol (Weiss, Pasley, Smith, Banilower, &
Heck, 2003), Science Teacher Inquiry Rubric (STIR; Bodzin & Beerer, 2003), Science
Management Observation Protocol (Sampson, 2004), the Practices of Science Observation
Protocol (P-SOP; Forbes, Biggers, & Zangori, 2013), and Electronic Quality of Inquiry
Protocol (EQUIP; Marshall, Horton, Smart, & Llewellyn, 2009). Of these, the EQUIP has the
potential to be the one most helpful for fine-grained assessment of current practices.
The EQUIP offers detailed descriptions of the various levels of inquiry instruction for
19 indicators, grouped according to four constructs: instruction, discourse, assessment, and
curriculum. The instrument is designed to offer teachers, professional development
providers, and educational researchers three levels of formative and/or summative
assessment: indicator, construct and overall (Marshall, Smart, Lotter, & Sirbu, 2011).
Statement of Problem
Despite the growing body of research regarding the benefits of and necessity for K-12
science inquiry instruction over the last several decades (Bybee, 2011; Marshall & Alston,
2014; NRC, 2012), K-12 science instruction in the U.S. continues to be presented as
traditional, teacher-centered lessons (Avraamidou, 2014; Marshall & Alston, 2014).
Marshall, Smart, Lotter, and Sirbu (2011) explain “in order to achieve transformation in
practice, clear, valid rubrics and/or measures are needed to track formative and summative
progress” (p. 306). Such a rubric would help science teachers and science teacher educators
operationalize what can seem to be a nebulous and abstract concept.
The EQUIP rubric has the potential to facilitate science teachers, science teacher
educators, and science education researchers in understanding current practices, diagnosing

4
areas of potential growth and acknowledging progress toward science inquiry instruction.
However, the instrument’s internal consistency and content validity has thus far been
determined using small, mostly homogenous samples of middle school teachers (Marshall,
Smart, & Horton, 2010; Marshall, Smart, Lotter, & Sirbu, 2011). As the EQUIP is used to
rate larger, more heterogeneous samples of teachers from varied grade levels, researchers
have a responsibility to investigate the validity of the instrument when applied on a larger
scale.
Research Questions
The purpose of this research is to continue the rigorous construct validation initiated
by the instrument developers. While a review of the literature did not reveal studies
providing empirical evidence as to a difference of practices between primary and secondary
teachers, the concern is supported by the 2012 National Survey of Science and Mathematics
Education (Banilower et.al, 2013), which found that the 3,701 science teachers surveyed
varied greatly in degree type and pedagogical beliefs when divided by grade level. Therefore,
the researcher seeks to extend the work of Marshall and colleagues through this continued
examination of subgroups and relationships between the observed practices.
The specific research questions are:
1. How do science teachers at different grade levels vary in their observed
teaching practices as indicated by the EQUIP ratings?
2. What underlying relationships between the observed practices will be revealed
by an exploratory factor analysis of the EQUIP ratings resulting from
observations of a large and diverse sample of Texas science teachers?

5
Based on prior research, the following hypotheses are put forward:
Hypothesis 1: Science teachers at different grade levels vary in their observed
teaching practices as indicated by the EQUIP ratings.
Hypothesis 2: An exploratory factor analysis of the EQUIP ratings resulting from
observations of a large and diverse sample of Texas science teachers will reveal underlying
relationships between the observed practices.
Significance of the Study
The results of this study provide valuable insight regarding differences between the
instructional practices of teachers when sampled by grade level. Identification of differences
in practices among the grade levels can inform researchers, professional developers, and
science teacher educators as they look into strategies to facilitate the transition to inquiry
science instruction. In regard to use of the EQUIP, the above professionals can use these
findings as they seek to interpret EQUIP ratings and thus respond appropriately.
The exploratory factor analysis provides further information regarding the underlying
or latent constructs of learner-centered instruction. Understanding latent constructs of inquiry
practices can provide inquiry or reform-based activists valuable insights regarding
epistemological or pedagogical pitfalls inhibiting a transformation in practice. The results of
this study provide another perspective regarding findings (existing or future) based on data
collected using the EQUIP.
Terms
It is important that educational terms be understood by the reader as intended by the
researcher. The definitions of important words appear below:

6
EQUIP Construct - One of the four constructs of the EQUIP: Instruction, Discourse,
Assessment, and Curriculum
Cognitive Development - An innate and spontaneous process initiating with embryogenesis
and ending in adulthood, situated within biological and psychological contexts,
involving maturity, experience, social transmission and equilibrium (self-regulation)
EQUIP-Electronic Quality of Inquiry Protocol - An instrument designed to measure the
quantity and quality of inquiry instruction being facilitated in K-12 mathematics and
science classrooms
Factor - Results of the discriminant factor analysis and exploratory factor analysis conducted
for this research
Inquiry instruction - Inductive educational practices that weave content objectives into
cognitively engaging activities which require that learners ask questions, develop and
communicate evidence-based interpretations, evaluate alternative interpretations, and
reevaluate initial interpretations in light of new evidence.
Learner-centered - Instruction that is adaptive to learners as individuals, taking into account
the learners’ “knowledge, skills attitudes and beliefs” (NRC, 2000b p.133), individual
learning trajectories as well as formative and summative learning outcomes.
Learning cycle – an instructional model based on the constructivist theory that learners build
an understanding of the natural world through prior knowledge, experiences, and
facilitated conceptual understanding.
Teacher Quality Grant Program (TQGP) - A “federally funded effort providing grants to
higher education institutions to promote improved instruction in mathematics and

7
science for Texas school children by providing professional development for their
teachers” (THECB, 2015, para. 1).

8
Chapter 2
Literature Review
The instructional practices measured by the EQUIP rubric are consistent with the arc
of science education research and literature of the last half-century. While the ideas
themselves were not new, a convergence of focus within the science education community
became notable during the 1960’s, 1970’s, and 1980’s: the skills associated with doing
science, authentic understanding of the nature of science, a working knowledge of science
content and inquiry/discovery instruction (DeBoer, 1991). These four areas of interest are
foundational to reform-based science inquiry instructional strategies and practices. The
following sections describe Learning Cycles, the history of inquiry instruction, and reform-
based inquiry science observation instruments.
Learning Cycles
Advances in psychology and cognition provided a basis for the reforms of the 1970’s.
Specifically, Piaget postulated that progress in intellectual development requires that
students’ interaction with the environment challenge the students’ current understanding. The
challenge causes a disequilibrium that sets the stage for self-regulation as the students work
to reestablish equilibrium (Piaget, 1964). This occurs through four major steps. The first step,
physiological development, is not directly influenced by instructional intervention and is less
relevant to instructional practices. The remaining three steps would become foundational to
the three-phase learning cycle.
Several curriculum projects were undertaken to translate the theories of cognitive
psychology into practice for science teachers. One of the best known is the Science
Curriculum Improvement Study (SCIS), which was published in the late 1970’s. Robert

9
Karplus introduced a three-phase learning cycle model of science instruction as a way to
allow students to engage in scientific activities and develop conceptual knowledge through a
cycle of guided discovery (DeBoer, 1991; Karplus, 1977; Lawson, Abraham, & Renner,
1989). Nearly two decades later (1987), the BSCS (Biological Sciences Curriculum Study)
developed an expanded learning cycle, the 5E instructional model (Bybee, Taylor, Gardner,
Van Scotter, Powell, Westbrook, & Landes; 2006).
Three-Phase Cycle
Development. The learning cycle model suggested by Karplus (1977) begins with the
exploration phase, which introduces students to new materials by using a question or a
discrepant event. This phase is consistent with Piaget’s second step toward intellectual
development, interaction with the environment and disequilibrium. During the exploration
phase, the “students often explore a new phenomenon with minimal guidance” (Lawson,
Abraham, & Renner, 1989, p. 46) or expectation of specific accomplishments (Karplus,
1977). With respect to Piaget’s second step, the experience should challenge the students’
current understanding of the content/concept (cause disequilibrium). In a science lesson,
instructors may use activities involving science process skills (i.e. experimenting, observing,
predicting, measuring, and model building) to introduce the unexpected or discrepant event
(Heard & Marek, 1985). The exploration phase must provide the experiences to build a
conceptual understanding of the content (Marek, 2008).
Karplus (1977) named the second phase of the learning cycle as concept introduction.
This terminology has met with variations of interpretation. Lawson, Abraham, and Renner
(1989) refer to a series of 1977 publications in which Karplus wishes to specify to teachers
that they (through direct instruction, textbook, video or other authority) should introduce the

10
concepts because the students will not be able to provide the concepts. The authors explain
that they chose to use the name ‘term introduction’ instead of ‘concept introduction’ because
they believe the students must invent the concepts themselves.
The second phase of the learning cycle is consistent with Piaget’s third step toward
intellectual development, social or linguistic transmission (Piaget, 1964). Piaget emphasizes
that this third step is insufficient in itself. He provides two factors that make this step reliant
on the preceding steps: first not all content lends itself to instruction and second the student
may not understand the nuances of the language used. To overcome these factors the student
must have both the physiological development as well as adequate experience with the
concept. The order of instruction, explore then explain, is a major component of reform
based science instruction.
The final phase, concept application (sometimes called elaboration), allows the
learners to apply the new concept to additional and novel situations. This phase provides the
learner with additional time and experiences for the student to complete the steps of
intellectual development and reestablish equilibrium. Piaget calls the completed process self-
regulation, emphasizing the importance of the student as the active agent (center) of the
process, and explaining the use of the phrase learner centered to describe reform based
science instruction.
Research studies. When researchers began to explore the effectiveness of the
learning cycle over traditional methods, they found possible confounding variables. While
some studies found no difference in student achievement when using the learning cycle,
many found gains in reasoning, science process skills, and experimental design/nature of

11
science (Lawson, Abraham, & Renner, 1989). A variety of variables were thought to be the
source of the mixed results.
In the early 1980’s, the National Science Foundation funded two large-scale studies
that shed some light on potentially confounding variables. The researchers modified high
school physics and chemistry lessons to conduct multiple experiments to investigate a
possible relationship between three aspects of the learning cycle (necessity, sequence, and
format of the phases) and subsequent student content achievement and attitudes about the
lessons. The design of the studies included a variety of data including observations, content
and attitude assessments, and measures of intellectual development (Abraham & Renner,
1983).
The intellectual development data collected showed a larger portion of the physics
students to be formal operational learners, while the chemistry students were more evenly
distributed between the concrete operational stage (able to solve problems using logic) and
the formal operational stage (able to solve problems using hypothetical, abstract and
deductive reasoning). The data led the researchers to conclude that for the physics students,
the sequence was unimportant as long as all of the phases of the learning cycle were present;
the students considered the learning cycle to be more effective and preferred the learning
cycle. For the chemistry students, concrete operational learners had more success on review
concepts when the explain phase came last, whereas the formal operational students learned
review concepts better when the explain phase came first. However, students in either stage
experienced higher achievement on new concepts when the explain phase was presented
second and preferred to have the explain phase either second or third (Lawson, Abraham, &
Renner, 1989).

12
From observational, interview, and case study data, the researchers of the two studies
suggest other confounding factors. First, either the explore phase or extend phase may
include full learning cycles within them. Second, students asked questions to fill in missing
information in lessons that did not meet their needs (Abraham & Renner, 1983).
Five-phase model
The expanded 5E instructional model was developed by the BSCS in response to
instructional research published after the original 3-phase model and is ubiquitous in science
education today (Bybee et al, 2006). The 5E instructional model introduced an initial phase
(engagement), a final phase (evaluation), and minor modifications to the original three
phases. The engagement phase uses short activities to draw the interest of the students, bridge
the students’ prior knowledge to the new content, and provide the teacher with information
regarding misconceptions. The engagement phase introduces the disequilibrium
recommended in Piaget’s stages of intellectual development.
Then, the explore phase begins the process of restoring equilibrium. This phase is
designed to be concrete, common among the students, and conceptually stimulating. The
activity should “assist the initial process of formulating adequate and scientifically accurate
concepts” (Bybee et al, 2006, p. 9). The primary function of the exploration phase is to
provide the class with experiences on which to build conceptual understanding. The teacher’s
role is to facilitate the students as they build their own understanding of the phenomena.
In the next phase, the 5E model solved some of the term problems of the term
introduction/ concept invention phase by renaming it the explain phase. During this stage, the
teacher first, asks the students to explain their interpretations of the phenomena. The teacher
then uses the explanations and the exploration experiences to build a foundation for the

13
desired conceptual understanding. This phase continues the process of reestablishing
equilibrium and introduces the academic terminology of the phenomena.
The 5E model renames the concept application phase, the elaboration phase. In this
phase, the explanations are applied to new, but related situations. The process helps the
students with persistent misconceptions and provides additional time and experiences to
become familiar with the phenomena. During this phase, the students should be encouraged
to communicate their understandings, provide feedback, and receive feedback between each
other.
The fifth and final phase is the evaluation phase. This phase is not found in the
Karplus model but is important because it provides the students with an opportunity to self
evaluate as well as provide the teacher with an opportunity to formally assess each student’s
level of understanding. The teacher should informally assess the students throughout the 5E
instructional processes.
As reformed-based science instruction continues to be refined through research,
practice, and epistemology, the phases of the learning cycle (3 phase and 5 phase) are evident
within the new recommendations. Studies of the effectiveness of the 5E instructional model
are consistent with those of the 3 phase learning cycle. Bybee et al (2006) report a smaller
number of studies due to the relative youth of the model.
History of Inquiry Instruction
Three documents are repeatedly referenced with regard to reform-based science
instructional practices: the Benchmarks for Science Literacy: a tool for curriculum reform
(Benchmarks) by Project 2061 of the American Association for the Advancement of Science
(AAAS), the National Science Education Standards (NSES), and the Next Generation

14
Science Standards (NGSS). Published in 1993, 1996, and 2013 respectively, the documents
share the following recommendations: reducing the amount of knowledge level material in
favor of a conceptual understanding of fundamental/core concepts, including extra-
disciplinary applications and engaging students in scientific inquiry practices.
Benchmarks for Science Literacy
The Benchmarks were the first reform document to be developed. The document was
developed in answer to questions regarding adult science literacy and outlines specific
expectations for students when the read various grade levels. The benchmark developers
specify that the benchmarks do not refer to what advanced or even average students should
be able to do, but what all students should understand and be able to do (AAAS, 1993). The
document serves as a foundation to the current reform trajectory including being explicitly
referenced multiple times in both of the following documents (NRC, 1996, 2012).
National Science Education Standards
The NSES offers essential features of classroom inquiry, which focused on the
learner rather than the teacher. To be considered inquiry the learner is required to ask
scientifically oriented questions, design and conduct investigations, formulate explanations
based on evidence, communicate and justify explanations, and finally compare alternative
explanations. The NSES explains that these essential features are necessary to science
literacy, which is fundamental to a contemporary society (NRC, 1996).
A follow-up document, Inquiry and the national science education standards: A
guide for teaching and learning describes some efforts to make inquiry instruction more
accessible resulted in prescriptive recommendations that lacked the foundational constructs
of inquiry instruction (NRC, 2000a). First, the learner should be an agent of the investigation:

15
presenting the inquiry questions, designing the investigations, and interpreting the results.
The NSES explicitly states, “Learning science is something students do, not something that is
done to them” (NRC, 1996, p 20). Second, content is not front-loaded as isolated nuggets but
rather learners are engaged in experiences/investigations designed to elucidate larger
conceptual frameworks in which content is contextualized. Third, the lessons provide the
learner with authentic applications of science process skills as they engage in their (ideally)
personalized inquiries.
A Framework and the Next Generation Science Standards
Sixteen years after the publication of the NSES, the NRC published A Framework for
K-12 Science Education (NRC, 2012). The Framework served as the basis for the Next
Generation Science Standards (NGSS) published in 2013. In the Framework, the NRC opted
against using the term inquiry instruction to describe the updated version of the essential
features, electing instead to present a list of science and engineering practices that are
consistent with the features of reform-based science instruction. In addition, the Framework
describes crosscutting themes as transferable from one discipline to the next (crosscutting
concepts) and core ideas of the various disciplines (disciplinary core ideas).
The NGSS (NGSS Lead State, 2013) provides science educators performance
expectations of what students should be able to do after instruction of the disciplinary core
ideas from the frameworks. Supplementing each performance expectation are listings of
related science and engineering practices, disciplinary core ideas, and crosscutting concepts
from the frameworks. The performance expectations are followed by suggested connections
to the standards in mathematics and English language arts.

16
These documents exemplify reform-based science instruction in that they center on
the learner as an active agent. The learner must be engaged in science investigations or
inquiries authentically weaving science process skills with the intellectual practices of using
evidence to propose answers to questions about the natural world. The documents further
situate the learning experiences within in larger academic and non-academic contexts. To
provide this instruction the teacher acts as a facilitator of the learning experience rather than
the authoritative source of content facts and is responsive to individual learners.
Reform-Based Inquiry Science Observation Instruments
The widespread agreement within the science education community in favor of
reform-based instruction led researchers to ask questions about how to measure the practices
occurring in the classroom. The resulting instruments included practices adapted from reform
documents. The following sections provide examples of the most ubiquitous, fecund, direct,
and relevant observation protocols used to measure inquiry instruction in science classrooms.
Reformed Teaching Observation Protocol
The most often used and cited science and mathematics observation instrument is the
Reformed Teaching Observation Protocol (RTOP; Sawada et al, 2002). The developers of the
RTOP sought to measure the degree to which a mathematics or science classroom is
reformed. In a series of studies to determine the relationship between achievement and RTOP
scores at the community college level, 6 mathematics instructors, 6 physical science
instructors and 4 phyics instructors were observed a minimum of 2 times during the fall
semester of 1999. After normalizing for initial differences on the pretest, the RTOP scores
were found to correlate with content test scores (Sawada et al, 2002).

17
Similarly, a study of involving 15 high school biology teachers servicing 1,116
students provided evidence that participation in professional development was predictive of
RTOP scores. Participation in the professional development was predictive of student
achievement but the RTOP scores were not as predictive of student achievement as the
participation in professional development. This led the researchers to ask if there was
something happening in the PD that was not captured by the RTOP. The researchers of the
study suggested that questioning level according to Blooms taxonomy might be the factor as
it is address in the development but not in the RTOP (Adamson et al, 2003).
Inside the Classroom Observation Protocol
The Inside the Classroom Observation Protocol (ICOP) was adapted to provide a
piece of a larger study designed to capture a snapshot of a variety of mathematics and science
classrooms in the United States (Weiss et al, 2003). The protocol is lengthy, subjective,
thorough, and appropriate to collect the data needed to create the intended case studies for the
National Science Foundation. The observations showed 59% of the mathematics and science
lessons to be low quality, 27% of medium quality and 15% to be high quality. The high-
quality lessons included lessons categorized as traditional and others categorized as reformed
(Weiss et al, 2003).
Electronic Quality of Inquiry Protocol
The Electronic Quality of Inquiry Protocol (EQUIP) is specifically designed to
measure inquiry instructional practices and is the instrument being investigated in the
proposed research (Marshall, Horton, Smart, & Llewellyn, 2009). The EQUIP was
specifically designed to measure the effectiveness of a professional development project
using a specific instructional model, but was deliberately left broad enough to be compatible

18
with other models of inquiry instruction. In addition to the theoretical foundation of inquiry
instruction, the EQUIP includes the granular detail of the rating rubric (specific practices for
each level of each indicator) make it a solid choice to research specific practices as well as
inform practitioners. The following section describes the evolution of the EQUIP through the
various stages of its development.
The developers provide background information on many of the features that make
the instrument such a valuable tool for inquiry assessment. Through the development
process, the first major structural change was to switch from a Likert rating system to a
descriptive rubric, see Appendix A. The descriptions operationalize the indicators, thus
making the instrument less subjective and more widely useful as a product. From a statistical
standpoint, the change adds a layer of dichotomy to the continuous nature of the levels of
inquiry proficiency (i.e. for some indicators, the instruction either does or does not include
the behavior listed in the rubric for others the behavior falls along a continuous spectrum).
After the developers decided on a descriptive rubric, they added some important
features to the instruments structure and organization. First, they established four levels of
inquiry instruction: pre-inquiry coded as “1”; developing inquiry coded as “2”; proficient
inquiry coded as “3”; and exemplary inquiry coded as “4”. Second, they divided the
instrument into components of observable instructional practices as determined by a review
of the relevant literature: instruction, curriculum, and ecology (later called discourse). Next,
honoring research regarding the importance of assessment, the developers made an effort to
incorporate assessment into each component. Later, the assessment was pulled out to become
its own component.

19
This version of the EQUIP was then piloted in middle school science and
mathematics classrooms. The pilot included 102 observations, which included 16 paired
observations of 22 mathematics and science teachers from two schools. The team recruited
the following additions to determine the face validity: four science education researchers,
three mathematics education researchers and two measurement experts. The larger research
team achieved consensus through negotiation and refinement. The 102 observations were
used to examine the indicators for internal consistency through Cronbach’s alpha. The
sixteen, paired observations were used to analyze inter-rater reliability.
Content and construct validity were determined using a confirmatory factor analysis
(CFA) on the three constructs. The structural equation modeling trimmed the indicators from
26 to 14, leaving five indicators in the instruction component (Instructional Strategies, Order
of Instruction, Teacher Role, Student Role, and Knowledge Acquisition), four in the
curriculum component (Content Depth, Learner Centrality, Integration of Content and
Investigation, and Organizing and Recording Information), and five in the ecology/discourse
component (Questioning Level, Complexity of Questions, Questioning Ecology,
Communication Pattern, and Classroom Interaction). Of the remaining eight indicators, a
fourth construct (assessment) emerged with 5 indicators (Prior Knowledge, Conceptual
Development, Student Reflection, and Assessment Type). The final three were removed from
the model for validation reasons. The resulting instrument includes 19 indicators grouped
into four constructs, four construct summaries and one overall lesson summary, see
Appendix A.
The four constructs are instruction, discourse, assessment, and curriculum. Instruction
is divided into five separate indicators: Instructional Strategies, Order of Instruction, Teacher

20
Role, Student Role, and Knowledge Acquisition. Discourse is divided into Questioning
Level, Complexity of Questions, Questioning Ecology, Communication Pattern, and
Classroom Interaction. Assessment is divided into Prior Knowledge, Conceptual
Developement, Student Reflection, Assessment Type, and Role of Assessing. Curriculum is
only divided into four indicators: Content Depth, Learner Centrality, Integration of Content
and Investigation, and Organizing and Recording Information.
Conclusion
Inquiry instructional practices are supported by decades of investigation from
multiple disciplines. The science education community continues to investigate these
practices as well their implementation. This led researchers to design instruments to measure
inquiry instructional practices. The detailed rubric of the EQUIP, makes it particularly useful
in identifying the practices and degree of those practices being enacted in science classroom.
Therefore, continuous, rigorous investigation of the nuances of the EQUIP can help science
educators use the instrument more effectively.

21
Chapter 3
Methodology
This study is quantitative, correlational research involving observational data
collected as part of 2012-2014 Teacher Quality Grant Program (TQGP) evaluation. Federal
funding for TQGPs provides grants for higher education institutions to present professional
development for in-service teachers with the objective to improve mathematics and science
instruction for Texas school children (THECB, 2015). The 2012-2014 cycle of TQGP funded
39 mathematics, science and mathematics, and science professional development grants.
Methods
Sample
All teachers participating in the 2012-2014 TQGP cycle met the grant requirements of
currently holding teaching positions at a Texas public school, charter school or private
school; teaching either mathematics or science; and demonstrating areas of need content
knowledge and pedagogy. The researcher requested and was granted limited access to
observational data collected as part of the grant’s external evaluation. Specifically, this
research analyzed the portion of evaluation observational data coded as science instruction of
teachers, who consented to have their data used for research. Five hundred fifteen
observations, include 351 teachers, from 217 schools in 84 school districts, located in rural
and urban areas were provided. Grades 1st through 8th are coded by grade level and then
content area, whereas, 9th through 12th are coded as “Secondary” and then by their content
area.

22
Data Collection
The supplied data were collected by an external evaluation team, which included 12
observers with professional K- 12 instruction experience. Each observer participated in and
met the requirements of a comprehensive two-day instrument instruction and qualifying
meeting including written, discussion and calibration components. Observers were calibrated
by watching videos of science classrooms and rating them using the EQUIP. The observer’s
ratings were compared to ratings by an expert panel. The calibration criteria took into
account ratings that were consistent with expert panel as well as any that deviate by more
than one level from the expert panel. After initial qualification, observers re-calibrated every
semester against pre-recorded video science lessons prior to each semester’s observations.
Upon calibration/re-calibration, the observers worked with the participant teachers to
schedule observations at a mutually agreed upon time and date within the academic school
year. Each observer was issued an iPad with grant-designed application to collect, store, and
transmit the data. The teachers’ anonymity was preserved through the use of a six-digit
participant code, and the teachers’ names, schools, and districts were never linked (physically
or digitally) to the observation data by the observer.
The researcher received an EXCEL (Microsoft, 2011) spreadsheet of the observation
data from the external evaluation institution. The first four columns included identification
variables: Participant Code, Grade Level, School Code, and District Code. The remaining
columns included ratings for each of the nineteen indicators of the EQUIP: five Instruction
indicators, five Discourse indicators, five Assessment indicators, and four Curriculum
indicators. The number of observations per teacher varied from one to four, across four
semesters: Fall 2012, Spring 2013, Fall 2013, and Spring 2014.
23
Instrument
The observations were conducted using the EQUIP (Marshall, Horton, Smart &
Llewellyn, 2009). Although the EQUIP is divided into eight sections (see appendix A), this
research was concerned with only five sections: Section I- Descriptive Information
(specifically the grade level), Section IV- Instruction (5 indicators), Section V- Discourse (5
indicators), Section VI- Assessment (5 indicators), and Section VII- Curriculum (4
indicators). Sections IV-VII of the EQUIP are construct components as determined by an
initial confirmatory factor analysis (Marshall, Smart & Horton, 2010). Section VIII-
Summative Overviews was not included because those ratings are not associated with
specific practices but an overall impression of each of the constructs and the lesson as a
whole.
Three of the four constructs of the EQUIP were initially introduced as “major
components of instructional practice that could be observed” (Marshall, Smart & Horton,
2010, p. 305). Instruction, curriculum, and ecology (later renamed discourse) emerged as the
developers consulted literature on effective instructional practices. The developers focused
on aspects of these components associated with inquiry instruction. The fourth component,
assessment, initially was integrated into the initial three, but was separated as a result of the
confirmatory factor analysis.
Each of the included 19 indicators (Section IV-VII) has a detailed rubric for four
levels of inquiry quality: Pre-Inquiry, Developing Inquiry, Proficient Inquiry, and Exemplary
Inquiry. The observer selects the level of inquiry quality that best represents the observed
practices during the observation. For each indicator, the target level for a practicing K-12

24
science teacher is Proficient Inquiry, which represents more of a guided inquiry rather than
open inquiry.
Data Analysis
Prior to import into Statistical Package for the Social Sciences (SPSS; IBM Corp,
2013), the spreadsheet data were prepared for analysis, further anonymized, and organized to
be consistent with the parameters of the import mechanism. First, grade levels were assigned
to either primary (1st-5th grade) or secondary (6th-graduation). Then, school and district data
was removed. The resulting document was saved for import. After the data was imported into
SPSS, it was analyzed for descriptive qualities that informed decisions regarding the nuances
of later analysis.
Research question 1: How do science teachers at different grade levels vary in their
observed teaching practices as indicated by the EQUIP ratings?
After consulting the descriptive characteristics of the full data set (including both the
primary and secondary classroom observations) a discriminant analysis was run to determine
the degree of differences between primary (1st-5th Grade) and secondary (6th-graduation). The
discriminate analysis suggested that the primary and secondary science classroom
observations were different enough to confound the exploratory factor analysis if not done
independently.
Research Question 2: What underlying relationships between the observed practices
will be revealed by an exploratory factor analysis of the EQUIP ratings resulting from
observations of a large and diverse sample of Texas science teachers?
Based on the results of Question 1, the researcher split the observation data
according to primary or secondary science classroom observations, reran the descriptive

25
analysis for the new data sets, and then ran an exploratory factor analysis on each. She used a
Principal Axis Factoring extraction method. The researcher selected an oblique rotation
(specifically Oblimin with Kaiser Normalization) due to the probable relationships between
factors. The data from the EFA provided information regarding patterns among multiple
indicators. The groups of indicators that, loaded together, provided the researcher with
valuable data regarding latent constructs of the EQUIP with a larger and more diverse
sample.

26
Chapter 4
Results
Prior to addressing the research questions, descriptive statistics were computed on the
complete data set, see Table B1 of Appendix B. The results showed the set to be normal
within the parameters required to address the research questions. The following sections
describe the results of the subsequent statistical analysis: a discriminant factor analysis of the
complete dataset and then, an exploratory factor analysis (EFA) of both the primary science
classroom observation dataset (primary dataset) and the secondary science classroom
observation dataset (secondary dataset).
Discriminant Factor Analysis
Research question 1: How do science teachers at different grade levels vary in their observed
teaching practices as indicated by the EQUIP ratings?
A discriminant factor analysis was conducted to determine how science teachers of
primary and secondary grade levels vary in their observed teaching practices as indicated by
the EQUIP ratings. The Wilks’s lambda was significant, Λ = .86, χ2 (19, N = 515) =74.62, p
< .01, indicating that overall the ratings on the nineteen indicators differed (more than is
expected due to chance) between the primary and secondary classrooms. Table 1 presents the
within-groups correlation and standardized coefficients between the indicators and the
discriminant functions. The indicators are listed in numeric order according to their
correlation coefficients.
While all of the loadings were considered in interpreting this discriminant factor,
Order of Instruction, Complexity of Questions, Student Reflection, and Questioning Ecology
were chosen to represent the function as they show particularly strong loadings (> .6). In

27
addition, the .6 cutoff was determined as a natural break due to the relatively homogeneous
loadings of the next eight indicators, when sorted by loading. Based on the descriptors for
these indicators, the discriminant factor was called conceptual understanding.
Table 1 Correlation and Standardized Coefficients of EQUIP Indicator Ratings
EQUIP Indicators Correlation coefficients with discriminant function
Standardized coefficients for discriminant function
Order of Instruction .71 .43 Complexity of Questions .68 .51 Student Reflection .63 .31 Questioning Ecology .6 .37 Classroom Interaction .53 .01 Student Role .53 .21 Teacher Role .52 .14 Knowledge Acquisition .52 .22 Conceptual Development .51 .00 Role of Assessing .50 .02 Instructional Strategies .49 -.03 Prior Knowledge .48 .21 Assessment Type .45 .02 Questioning Level .42 -.42 Learner Centrality .38 .23 Communication Pattern .32 -.41 Content Depth .29 -.16 Integration of Content and
Investigation .27 -.42
Organizing and Recording Information .24 -.39
Note. Factor loadings≥ .6 are in boldface.
The means of the discriminant factor were higher (M = .46) for the primary dataset
and much lower (M = -.34) for the secondary dataset. Thus, the observations of the primary

28
science classrooms were more likely to load on the discriminant funtion than observations of
the secondary science classroom. When the discriminant function was used to predict
classroom level (primary vs. secondary), 69% of the observations were correctly classified,
see Table B2 of Appendix B. To take chance agreement into account, a kappa coefficient was
computed and and a value of .33 was obtained, better than chance 0. Appropriately, the rest
of the analysis treats the primary and secondary science classroom observations as distinct
data sets.
Conceptual understanding. A lesson consistent with the conceptual understanding
factor would follow an enriched learning cycle in which the students explore a phenomenon
before participating in the explaining, are posed open-ended questions and discussions, and
apply the concept to new situations (Marshall et al, 2009). During the discussions, the
students are expected critique each others’ assertions. Throughout the lesson, the teacher
explicitly encourages the students to reflect on their understanding of the content.
Relation to the original EQUIP constructs. Built into the EQUIP are the four
constructs developed from the literature and confirmatory factor analysis: instruction,
discourse, assessment, and curriculum. Three of the four factors presented in the EQUIP
instrument are distributed throughout the loadings: instruction loading strongest, discourse
less strong, and assessment indicators loading slightly weaker. The fourth, curriculum, is the
weakest loading, with no loadings over .4.
Exploratory Factor Analysis
Research Question 2: What underlying relationships between observed practices will
be revealed by an exploratory factor analysis of the EQUIP ratings resulting from
observations of a large and diverse sample of Texas science teachers?

29
When data were separated as either observations of a primary or secondary classroom
(n = 220 and n = 295 respectively), the descriptive statistics were run again on the resulting
data sets and found to be appropriate for factor analysis, see Tables C1 and C2 of Appendix
C. Then, the EFA was conducted to address the second research question and identify the
underlying relationships between observed practices. Two criteria were used to determine the
number of factors to rotate for each data set: a scree test and the interpretability of the factor
solutions (Green & Salkind, 2005).
Based on the second criteria, multiple iterations of the extraction and rotation
sequence were performed with varying numbers of factors as recommended by Costello and
Osborne (2005). For the primary dataset, the reported factors below were also present in
other iterations of the extraction and rotation sequence. For the secondary dataset, this
provided only one interpretable factor solution.
Primary Science Classroom (1st -5th Grade)
The principal axis factoring (PAF) extraction of the primary dataset resulted in
commonalities above 0.5 for all nineteen of the EQUIP indicators, see table C3 of appendix
C (Costello and Osborne, 2005). Four factors with initial eigenvalues above 0.7 accounted
for 72% of the variance. The pattern matrix, Table 2, was used to interpret the rotated
solution because it presents the factor loadings while taking into account possible
correlations between the factors. This solution yielded the following interpretable factors:
lesson authenticity, formative assessment, learning subjectivity, and participation rigor.
While factor loadings greater than .4 are recommended (Gaskin, 2012), it also served
as a useful breakpoint. First, in the lesson authenticity factor, the three highest loading
indicators were much more heterogeneous when compared to the next six lower loading

30
indicators. Second, the .4 cut off, for the most part, included a variable’s strongest loading to
be considered in the interpretation of the related factor. Lowering the cutoff resulted in cross
loadings among less influential indicators. This cutoff resulted in three moderately loading
factors (lesson authenticity formative assessment, and learning subjectivity) and one strongly
loading factor (participation rigor).
Table 2 Factor Loadings for EFA With Oblimin Rotation of EQUIP for Primary Dataset
Indicators Lesson Authenticity
Formative Assessment
Learning Subjectivity
Participation Rigor
Integration of Content and Investigation .66 .03 .10 -.14
Student Reflection .55 -.37 .10 .03 Assessment Type .43 -.12 .19 -.19 Prior Knowledge .06 -.69 -.02 -.04 Role of Assessing .32 -.47 .10 -.15 Questioning Ecology .02 -.43 .29 -.30 Learner Centrality .04 .19 .70 -.10 Organizing and Recording
Information .02 -.16 .69 .08
Conceptual Development .31 -.01 .40 -.24 Teacher Role .03 -.04 .02 -.79 Instructional Strategies .11 .09 .07 -.74 Student Role .31 .00 .00 -.60 Communication Pattern -.12 -.23 .19 -.53 Questioning Level .19 -.33 -.04 -.46 Complexity of Questions .07 -.37 .12 -.42 Classroom Interaction .00 -.39 .16 -.42 Knowledge Acquisition .33 .05 .21 -.38 Order of Instruction .34 -.14 .07 -.35 Content Depth .29 -.35 .17 -.11 Note. Factor loadings≥ .4 are in boldface.

31
The four factors of the primary dataset can be grouped according to positive or
inverse correlations to each other. Lesson authenticity and learning subjectivity were
positively correlated with each other (r = .58) and formative assessment and participation
rigor were positively correlated with each other (r = .53). Lesson authenticity and learning
subjectivity shared an inverse relationship with formative assessment and participation rigor.
Therefore, lesson authenticity is presented first, followed by learning subjectivity, and then,
the inversely related factors, formative assessment and participation rigor.
Lesson authenticity. The lesson authenticity factor accounted for 57.9% of the
variance in this data set. It is supported by factor loadings from Integration of Content and
Investigation, Student Reflection, and Assessment Type. This factor refers to a lesson in
which the relationship between the instruction and the content are well integrated, the
students are prompted to check in with their own learning metacognitively, and the
assessments include authentic measures.
For example, a lesson about plant development during which the class plants,
observes, and discusses the growth of a variety of seeds and seedlings is better integrated
than a lesson during which the students take notes over the state tested botanical content.
This could be done in using journals that include the students’ observations about what
happened as the plants developed, but also about their experiences learning about the plants.
A series of well-developed journal entry prompts could result in entries that also served to
provide the teacher with authentic information about the students’ understanding of the
content.
Learning subjectivity. The learning subjectivity factor accounted for 4.3% of the
variance in this data set. This factor is supported by loadings from Learner Centrality,

32
Organizing and Recording Information, and Conceptual Development. Observed practices
associated with this factor include providing opportunity for student developed explorations,
allowing students options for organizing and recording information, and process-focused
assessments requiring critical thinking. The learning subjectivity factor honors the
individuality of each learner and acknowledges the learner as an active agent in the lesson.
Keeping with plant development example, the lesson would allow the students to ask
their own questions about plant development and use critical thinking to design a way answer
it. The students would be encouraged to present their investigation design and their findings,
in a way that made sense to them. Therefore, a lesson scoring well on learning subjectivity
would look different from one class period to the next.
Learning subjectivity positively correlated with lesson authenticity. Thus, the
behaviors associated with learning subjectivity are likely to be observed in a lesson that also
shows the lesson authenticity behaviors. However, these behaviors were observed
independent of lesson authenticity often enough to distinguish learning subjectivity as an
independent factor. The difference between the factors is that a lesson rating well for the
indicators associated with learning subjectivity is concerned the students interactions with the
content. The strategies may or may not vary depending on the content. In contrast, lesson
authenticity is concerned with the content, and may or may not vary based on the learners as
individuals. Thus, a lesson scoring well on lesson authenticity, but poorly on learner
subjectivity would likely look much the same for each class.
Formative assessment. The formative assessment factor accounted for 6.1% of the
variance in the primary science classrooms ratings. It is supported by loadings from Prior
Knowledge, Role of Assessing, and Questioning Ecology. Formative assessment is

33
concerned with collecting information about the students’ prior and ongoing content
understanding through open-ended questioning and adjusting accordingly.
In the plant development example, a Know, Want to Know, and Learned (KWL)
could serve to provide the teacher with periodic information about the students’
understandings as they move through the lesson (Ogle, 1986). A KWL is a document in
which the students record what they know about the topic, what they would like to know, and
what they have learned. The teacher could use this document with the students individually,
in groups, and/or as a class. When used as a class, the KWL could initiate an open-ended, but
guided, discussion about plant development, thus providing the teacher with valuable
information about misconceptions and conceptual understanding of the content.
Formative assessment has an inverse relationship to lesson authenticity (r = -.46) and
learning subjectivity (r = -.40). The inverse relationships suggest that practices associated
with learning subjectivity are unlikely to be observed during a lesson scoring well in either
lesson authenticity or learner centrality. The point of diversion from these factors has to do
with the specificity of the outcomes.
A lesson scoring well in learning subjectivity would welcome diverse interests
regarding the content. Such a lesson would change based on the learners. For instance, one
student, group, or class might be curious about how seeds know which way is up, while
another is interested in how the temperature effects development. The questions they would
ask and the strategies for investigating the answers might lead them in different directions.
Both lessons might vary from class period to class period but for different reasons.
The point of diversion between formative assessment and lesson authenticity is the
focus on the students’ understanding of the content. A lesson rating well in lesson

34
authenticity might meander based on a phenomenon of the content, but not based on an
observable assessment of student understanding. In such a lesson, the focus of may vary if all
of the plants failed to grow, or if the teacher deemed a discussion strand relevant to the
content, if not the stated objective. In contrast, the formative assessment factor has a learning
target, verses a content target, in mind and checks in repeatedly to assess the progress.
Participation rigor. The participation rigor factor was the most diversely (seven
indicators) and strongly loading (four indicators above .5) factor in the primary dataset. This
factor accounted for 3.7% of the variance. The diverse indicators and the descriptors for a
proficient rating are presented in Table 3. The participation rigor factor requires that most of
the students in the class take a cognitively active role when interacting with the content.
Table 3 Descriptors of proficient EQUIP ratings for Participation Rigor (Marshall et al, 2009)
In the plant lesson example, the students would explore a feature of the development
of the plants, i.e. test seeds to see if they sprout in the dark as well as the light. Then, the
Indicator Descriptors from EQUIP Teacher Role Teacher frequently acted as facilitator. Instructional
Strategies Teacher occasionally lectured, but students were engaged in activities that helped develop conceptual understanding.
Student Role Students were active as learners (involved in discussions, investigations, or activities, but not consistently & clearly focused).
Communication Pattern
Communication was often conversational with some student questions guiding the discussion.
Questioning Level Questioning challenged students up to application or analysis levels. Complexity of
Questions Questions challenged students to explain, reason, and/or justify.
Classroom Interaction
Teacher or another student often followed-up response with engaging probe that required student to justify reasoning or evidence.

35
students, and sometimes the teacher, would explain the observations. The teachers might
encourage the students to use a think aloud to explain their observations. During a think
aloud, a student or a teacher, orally follows the path of what they know about the content to
arrive at a conclusion or solve a problem. The students would be encouraged to refer to their
observations, present their understandings, and critique each other’s assertions.
Participation rigor positively correlated with formative assessment. In many cases, the
two factors were observed in the same classroom, however they factors occurred
independently often enough to result in separate factors. The point of divergence is the level
of rigor. One teacher may be consistently assessing the students and adjusting appropriately
but based on a minimal expectation. Another teacher may present activities that would
require the class engage at a high level but not check in with the students to be sure they
understand what is expected.
Participation rigor negatively correlated with lesson authenticity and learning
subjectivity to the same (r = .7) magnitude. At first, the strong negative correlation to lesson
authenticity and learner subjectivity may seem counter-intuitive, but the difference is the
rigor of the participation and its application to the class as a whole. The results suggest that
lessons rating consistent with lesson authenticity or learning subjectivity, would be activity
and/or manipulative heavy, but not require that the students rise to a specific intellectual
challenge. Whereas, the lessons that rated well for participation rigor required the students
conceptually engage with the content at a consistently rigorous level. The classroom
intellectual authority would not center on the teacher but be so evenly dispersed as to make
the teacher distinguishable more by age than perceived authority.
36
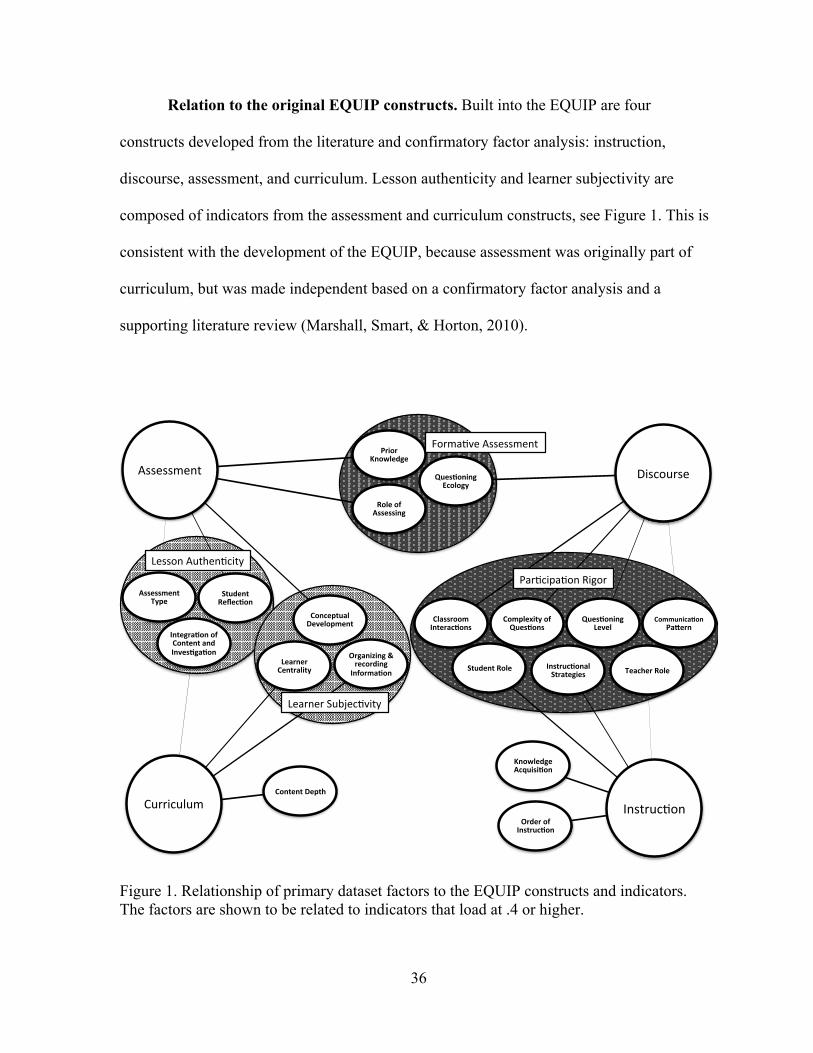
Relation to the original EQUIP constructs. Built into the EQUIP are four
constructs developed from the literature and confirmatory factor analysis: instruction,
discourse, assessment, and curriculum. Lesson authenticity and learner subjectivity are
composed of indicators from the assessment and curriculum constructs, see Figure 1. This is
consistent with the development of the EQUIP, because assessment was originally part of
curriculum, but was made independent based on a confirmatory factor analysis and a
supporting literature review (Marshall, Smart, & Horton, 2010).
Figure 1. Relationship of primary dataset factors to the EQUIP constructs and indicators. The factors are shown to be related to indicators that load at .4 or higher.
Instruc(on
Instruc(onalStrategies
OrderofInstruc(on
TeacherRoleStudentRole
KnowledgeAcquisi(on
Curriculum
Integra(onofContentandInves(ga(on
ContentDepth
LearnerCentrality
Organizing&recording
Informa(on
Assessment
PriorKnowledge
ConceptualDevelopment
StudentReflec(on
AssessmentType
RoleofAssessing
Discourse
Ques(oningLevel
ComplexityofQues(ons
Ques(oningEcology
Communica(onPaIern
ClassroomInterac(ons
Forma(veAssessment
LessonAuthen(city
LearnerSubjec(vity
Par(cipa(onRigor

37
Discourse indicators heavily influenced the formative assessment and participation
rigor factors. These factors made up 8.0% of the variance in the primary dataset. Both factors
included discourse indicator loadings above the .4 cutoff. With the exception of
communication pattern in formative assessment (.23), all of the discourse indicators loaded at
.3 or above for these the formative assessment and the participation rigor factors.
Secondary Science Classroom (5th Grade –Graduation)
EFA of the secondary dataset was not as straight forward as that of the primary
dataset. First, five factors showed commonalities less than .5, see table C4 of Appendix C.
Order of Instruction, Student Reflection, Content Depth, and Organizing and Recording
Information had commonalities above .4, the lower limit for the indicator to be considered
related to the other items. Prior Knowledge, however, had a commonality of .18, suggesting
that the indicator was not correlated to the other indicators. This low commonality justified
its removal from the dataset. The commonalities of the second iteration, see table C5 of
Appendix C, were similar to those of the first iteration: most of the indicators greater than .5
and four indicators between .4 and .5.
Second, after removing the Prior Knowledge indicator, extracting more or less than
two factors resulted either in the factors failing to converge or one of the factors not loading
greater than .3 for any of the indicators. The two-factor solution resulted in most of the
commonalities being above .5 and only one cross-loading variable, Questioning Ecology.
The interpretable factors, readiness focus and experience focus, accounted for 63% of the
variance, were highly correlated at r = .78, and had eigenvalues above 1. The pattern matrix,
Table 4, was used interpret the rotated solution because it takes into account correlations
between the factors.

38
Table 4 Factor Loadings for EFA With Oblimin Rotation of EQUIP for Secondary Dataset Indicators Readiness focus Experience focus Questioning Level .94 -.15 Complexity of Questions .88 -.02 Role of Assessing .82 -.00 Classroom Interaction .73 .06 Student Reflection .65 -.01 Assessment Type .56 .27 Conceptual Development .53 .31 Content Depth .49 .19 Knowledge Acquisition .48 .35 Instructional Strategies -.05 .89 Teacher Role .04 .79 Learner Centrality -.06 .78 Student Role .05 .77 Integration of Content and
Investigation .00 .72
Communication Pattern .21 .61 Questioning Ecology .40 .42 Order of Instruction .32 .40 Organizing and Recording
Information .35 .35
Note. Factor loadings> .4 are in boldface.
Readiness focus. The readiness focus factor accounted for 57% of the variance in the
secondary dataset. The term readiness was adapted from the Texas Education Agency (2015),
which uses the term to describe students having the knowledge and skills important for
success in the subsequent grade level or course, in college and in a career. A lesson rating
well on readiness focus would include strategies designed to prioritize specific learning
outcomes. Table 5 presents the indicators and their related proficiency descriptors for the
readiness focus factor.

39
Table 5 Descriptions of EQUIP ratings of proficient for Readiness Focus (Marshal et al, 2009) Indicator Descriptors from EQUIP Questioning Level Questioning challenged students up to application or analysis levels. Complexity of
Questions Questions challenged students to explain, reason, and/or justify.
Role of Assessing Teacher solicited explanations from students to assess understanding and then adjusted instruction accordingly.
Classroom Interaction
Teacher or another student often followed-up response with engaging probe that required student to justify reasoning or evidence.
Student Reflection Teacher explicitly encouraged students to reflect on their learning at an understanding level.
Assessment Type Formal and informal assessments used both factual, discrete knowledge and authentic measures.
Conceptual Development
Teacher encouraged process-focused learning activities that required critical thinking.
Content Depth Lesson provided depth of content with some significant connection to the big picture.
Knowledge Acquisition
Student learning required application of concepts and process skills in new situations.
Returning to the plant development lesson, a teacher wishing to evaluate and facilitate
the students’ readiness might ask open-ended questions regarding the use of chemical
fertilizers in agriculture, then, steer the discussion toward connections to concepts they will
encounter later in chemistry. When the teacher discovered student misconceptions about the
chemistry of plant development, the teacher would adjust the instruction/discussion to
readdress the topic. The teacher would want to ensure the students readiness in that the
students understood and could apply connections between plant development and other
contexts, but also take responsibility for their learning through reflective self-evaluation.
Experience focus. The experience focus factor accounts for 6% of the variance in the
secondary dataset. In contrast to the readiness focus factor, the experience focus factor

40
describes instructional practices consistent with comprehensive and varied activities that may
or may not be conceptually rigorous. A teacher, lesson, or lesson part with an experience
focus is concerned with providing an authentic experience with which the students can
construct a personal and conceptual understanding. Table 6 describes the behaviors required
to be rated Proficient on the EQUIP for the experience focus factor.
Table 6 Descriptions of EQUIP ratings of proficient for Experience Focus (Marshal et al, 2009) Indicator Description from EQUIP Instructional
Strategies Teacher occasionally lectured, but students were engaged in activities that helped develop conceptual understanding.
Teacher Role Teacher frequently acted as facilitator.
Learner Centrality Lesson allowed for some flexibility during investigation for student-designed exploration.
Student Role Students were active as learners (involved in discussions, investigations, or activities, but not consistently & clearly focused).
Integration of Content and Investigation
Lesson incorporated student investigation that linked well with content.
Communication Pattern
Communication was often conversational with some student questions guiding the discussion.
Questioning Ecology Teacher successfully engaged students in open-ended questions, discussions, and/or investigations.
Order of Instruction Teacher asked students to explore before explanation. Teacher and students explained.
In the plant lesson, the teacher would allow the students time to explore, observe, and
discuss various phenomena regarding plants. The teacher might then ask the students to
discuss their observations and any patterns they might have noticed. The teacher could ask
the students to propose some possible explanations and ways to test them. During the
explanations, the teacher may notice some misconceptions and guide the activity to address
them. The discourse in this lesson would be conversational, open-ended, and fluid.

41
Relation to the original EQUIP constructs. With the exception of the assessment
indicators, the readiness focus and experience focus factors divide the indicators of the
original EQUIP constructs, see Figure 2. The highest loading indicators of the readiness
factors are from the assessment and discourse constructs. All four of the remaining
assessment indicators and three of the five discourse indicators load only on the readiness
focus factor. Where as, the experience focus factor is primarily composed of instruction
indicators. All of the instruction indicators, except Knowledge Acquisition loading at .35,
load on the experience focus factor.
Figure 2. Relationship of secondary dataset factors to EQUIP constructs and indicators. The indicators are only associated with factors on which they load at .4 or higher.
Assessment'
Discourse'
Instruc/on'
Curriculum'
Organizing(and(Recording(Informa1on(
Readiness'Focus'
Ques1oning(Level(
Complexity(of(Ques1ons(
Classroom(Interac1ons(
Role(of(Assessing( Student(
Reflec1on(Assessment(
Type(Conceptual(Development(
Content(Depth(
Knowledge(Acquisi1on(
Experience'Focus'
Instruc1on(Strategies(
Teacher(Role(
Student(Role(
Order(of(Instruc1on(
Learner(Centrality(
Integra1on(of(Content(and(Inves1ga1on(
Communica1on(PaGern(
Ques1oning(Ecology(

42
Inter-matrix Relationships
While the sign or direction of the factors is meaningless from one matrix to the next
due to rotation on the Cartesian plane, the magnitudes of the factor loadings provide insight
regarding the relationships between the factors. When conceptual understanding is contrasted
with participation rigor of the primary dataset and readiness focus of the secondary dataset,
see Figure 3, a pattern of socially and conceptually rigorous instruction emerges. First,
Student Reflection, Questioning Ecology, Knowledge Acquisition, Conceptual Development,
and Assessment Type load for both conceptual understanding and readiness focus and
Student Role, Teacher Role, and Instructional Strategies load on conceptual understanding
and participation rigor. Then, the three factors overlap for indicators Complexity of
Questions, Classroom Interactions, Role of Assessing, and Questioning Level. Curiously,
these four indicators are also the highest loading (greater than .7) for the readiness factor.
Figure 3. Inter-matrix comparison of socially and conceptually rigorous instruction.
..2.4.6.81.
FactorLoa
dings
ConceptualUnderstandingIndicators
ConceptualUnderstanding
Par9cipa9onRigor
ReadinessFocus

43
Chapter 5
Discussion
The over-arching finding of this research indicates that when science teachers used
inquiry practices primary science teachers did so differently than secondary science teachers.
This information was immediately useful in determining that the exploratory factor analysis
of the primary and secondary datasets should be run independently. However, many teacher
preparation programs divide their methods and content courses according to primary and
secondary teachers. The same is true of many professional development programs. So,
beyond informing this analysis, the finding that primary and secondary science education
classrooms rated differently is not as important as the differences themselves.
The following sections describe some of the ways the grade levels differed in the
results. First, both the discriminant factor analysis and the exploratory factor analysis (EFA)
produced unexpected results. Second, the results of the discriminant factor analysis and the
exploratory factor analysis (EFA) showed the datasets to differ with regard to the Order of
Instruction and Prior Knowledge indicators. Fourth, a comparison of the resulting factors
with the original EQUIP constructs, indicated that discourse played an influential role for
both datasets. Finally, an inter-matrix comparison highlighted an interesting sub-set of
indicators from multiple factors.
Grade Level Differences and Underlying Relationships
The grade level differences may be due to differences or perceived differences in the
efficacy of different strategies for learners of different developmental stages. As early as the
1920’s, Piaget began to argue that development occurs through stages involving different
kinds of cognitive structures (NRC, 2000b; Piaget, 2003). Based on such cognitive research,

44
combined with neuroscience research, the document, How People Learn (2000b), describes
differences in, and recommends further research of, the thinking of children regarding subject
areas at different developmental stages.
Unexpected factor results
First, the discriminant factor analysis showed that the primary dataset teachers were
more likely to be observed using inquiry instruction practices than the secondary dataset
teachers.Then,theEFA of the primary dataset resulted in four discrete (reemerging) factors
with clearly defined relationships, but the secondary dataset’s results were not as conclusive.
This may be explained by the results of the discriminant factor analysis. A dataset that is less
likely to rate as inquiry instruction would require a larger sample size to increase the
confidence of any revealed underlying factors or relationships. These differences suggest that
professional development may need to be differentiated according to the grade levels that
they are serving, be it primary science teachers only, secondary science teachers only, or a
combination of both levels.
Order of Instruction and Prior Knowledge
The primary dataset was more likely to be rated highly on the indicator Order of
Instruction. Therefore, the behaviors associated with the Order of Instruction indicator,
explore before both teacher and students explain, were more likely to be observed in the
primary science classroom than the secondary science classroom. However, when both
datasets were analyzed using EFA, the indicator loaded only moderately on any of the
resulting factors.
These seemingly discrepant results may be explained by Order of Instruction’s
relationship to the learning cycle. Order of Instruction includes two phases (explore and

45
explain) of either the three or five phase learning cycle. Lawson (2010) describes the learning
cycle as compatible with all of the practices of inquiry instruction, suggesting that the
learning cycle provides a support structure to many of the other indicators.
In contrast, Prior Knowledge loaded only moderately in the discriminant analysis, but
resulted in a distinctly different role in the EFA. In the EFA of the primary dataset, Prior
Knowledge was the strongest loading indicator of the formative assessment factor. But in the
secondary dataset, the Prior Knowledge indicator showed to be unrelated to the other
indicators. At the primary level, the behaviors associated with this indicator were part of a
general assess and adjust cycle, but at the secondary level the same behaviors were not
associated with other inquiry practices.
A possible explanation for the lack of correlation between the Prior Knowledge
indicator and the other indicators as the secondary level may be mandated policies of bell
ringers or warm ups at the campus or district level. Teachers enacting these policies may not
be aware of the connection to inquiry practices. To learn more about the secondary teacher’s
Prior Knowledge rating, the researcher will request the qualitative classroom observation
data.
The inverse loading pattern of Order of Instruction and Prior Knowledge suggest
some implications for professional development. Science educators providing professional
development might use this information in the design and differentiation of primary and
secondary professional development. Professional development for primary science teachers
could use the flexibility of this indicator as a bridge to other inquiry practices, whereas,
secondary professional development might focus on strategies to introduce exploration
before the explanation.

46
Discourse Construct
For both datasets, the discourse construct plays a different but integral role in a
teacher’s EQUIP rating. The discriminant factor showed science teachers from the primary
dataset as more likely to rate well on instruction and discourse constructs. Indicators from the
instruction and discourse constructs are the only constructs that load on the participation
rigor factor. With the exception of Questioning Ecology, these are the same indicators that
loaded on the discriminant factor. In contrast, analysis of the secondary dataset paired
discourse with assessment in the readiness focus factor.
Smart and Marshall (2013) explain that discourse in the science inquiry classroom, as
rated in the EQUIP, is intended to facilitate student learning to a higher level and not to
evaluate the correctness of student responses. This explanation is consistent with discourse
indicators loading within the same factor as instruction indicators, as in the primary dataset.
It is not consistent with discourse indicators loading within the same factor as assessment
indicators, as in the secondary dataset.
Two possibilities might explain this inconsistency. First, a teacher wishing to be
confident that his or her students attained a high standard of readiness (career or academic)
would want to assess the students’ progress toward that goal. The types of questions
motivated by a desire to assess the students’ readiness would likely rate highly on the
discourse factor indicators that measure the quality and cognitive level of the teacher’s
questioning. Second, a teacher with both readiness and experience motivations might present
a unit that included some lessons with an experience focus, some lessons with a readiness
focus, and some lessons that include both. The second explanation is supported by the strong
correlation between the readiness and experience focus factors of the secondary dataset.

47
Given the influential role of discourse for both the primary and secondary datasets,
providers of professional development could use the discourse construct as a strategic
starting point for professional development programs with the goal of increasing inquiry
instruction practices at either level. At the primary level, the discourse practices could be
used as a starting point to enrich the practices associated with the lesson authenticity and
learner subjectivity factors. At the secondary level, the professional development providers
might use classroom discourse practices to increase the inquiry happening at that level, but
also as an instructional tool.
Inter-matrix Relationships
Relationships between the indicators of the conceptual understanding, participation
rigor, and readiness focus factors showed a four-indicator overlap. The conceptual
understanding indicators are those that differentiate the primary and secondary datasets,
participation rigor is the most diverse and highest loading factor of the primary dataset, and
readiness focus accounted for the greatest variance of the secondary dataset. These three
factors overlapped on the four highest loading indicators of the readiness focus factor:
Questioning Level, Complexity of Questions, Role of Assessing, and Classroom Interaction.
Common among these indicators is higher-level discourse, including the assessment
indicator, Role of Assessment. The descriptors of these indicators describe students
defending their assertions and critiquing other student’s responses.
Limitations
The first limitation is the access that observers have to classroom interactions. For the
most part, the observers can only observe practices that other students would observe. The
observations do not collect data on individual conferences regarding progress or

48
individualized assistance. Second, the literature presents some controversy regarding the
number of factors that can be created from an instrument with only four options for each
variable. Third, a proficient rating is the preferred rating. The loadings do not distinguish
between a consistent proficient rating and a less consistent exemplary rating.
Finally, it is important to note the investigative nature of EFA. Costello and Osborne
(2005) “strongly caution researchers against drawing substantive conclusions based on
exploratory analyses” (p. 8). The resulting factors should be supported using a confirmatory
factor analysis with additional datasets. This acknowledged, these findings provide the
necessary factors to confirm with other datasets in future research.
Future Research
While the information these results provide can be used to facilitate professional
development, they also provide a strong foundation for future research. Most directly, the
factors should be confirmed with a confirmatory factor analysis of a larger and/or different
dataset. In addition to the quantitative data of this new dataset, the qualitative notes and
comments will be included in the request for data. The notes and comments can provide
valuable information to better understand the factors of this research and the results of the
confirmatory factor analysis. The researcher might also be able to use the qualitative data to
investigate the anomalous relationship of Order of Instruction and Prior Knowledge to the
differences between the practices of primary and secondary science teachers.
The results of this data support two tangential lines investigation. First, a study of
discourse focused professional development could enrich the implications of these findings.
Second, the researcher plans to continue in this vein toward addressing the overarching
question about the factors that influence a teacher’s choice of instructional practices using

49
additional types of teacher data from the Teacher Quality Grant Program Evaluation:
discourse survey results, teacher reflections and interview transcripts.

50
REFERENCES
Abraham, M. R., & Renner, J. W. (1983). Sequencing Language and Activities in Teaching
High School Chemistry-A report to the National Science Foundation. Norman, OK:
University of Oklahoma Press. (ERIC Document Reproduction Service No. ED 241 267).
Adamson, S. L., Banks, D., Burtch, M., Cox, F., III, Judson, E., Turley, J. B., Benford, R., &
Lawson, A. (2003). Reformed undergraduate instruction and its subsequent impact on
secondary school teaching practice and student achievement. Journal of Research in
Science Teaching, 40(10), 939-957
American Association for the Advancement of Science. (1993). Benchmarks for science
literacy. Oxford University Press.
Avraamidou, L. (2014). Developing a reform-minded science teaching identity: The role of
informal science environments. Journal of Science Teacher Education, 25(7), 823-
843.
Banilower, E. R., Smith, P. S., Weiss, I. R., Malzahn, K. A., Campbell, K. M., & Weis, A.
M. (2013). Report of the 2012 National Survey of Science and Mathematics
Education. Chapel Hill, NC: Horizon Research, Inc.
Bodzin, A. M., & Beerer, K. M. (2003). Promoting inquiry-based science instruction: The
validation of the science teacher inquiry rubric (STIR). Journal of Elementary Science
Education, 15(2), 39-49.
Bransford, J., Darling-Hammond, L., & LePage, P. (2005). Introduction. In L. Darling-
Hammond & J. Bransford (Eds.) Preparing teachers for a changing world: What
teachers should learn and be able to do (pp. 1-39). San Francisco, CA: Jossey-Bass.

51
Bybee, R.W. (2011). Scientific and engineering practices in K–12 classrooms. Science
Teacher, 78(9), 34–40.
Bybee, R. W., Taylor, J. A., Gardner, A., Van Scotter, P., Powell, J. C., Westbrook, A., &
Landes, N. (2006). The BSCS 5E instructional model: Origins and effectiveness.
Colorado Springs, CO: BSCS.
Cochran-Smith, M., & Lytle, S. L. (2009). Inquiry as stance: Practitioner research for the
next generation. New York, NY: Teachers College Press.
Costello, A. B., & Osborne, J.W. (2005). Best practices in exploratory factor analysis: Four
recommendations for getting the most from your analysis. Practical Assessment,
Research & Evaluation. 10(7):1– 9.
Crowther, D., Shahidullah, K., & Pozarski-Connolly, C. (2015, January). STEM Inquiry
institute for administrators: An overview and evaluation of the program. Paper presented
at Association for Science Teacher Education (ASTE). Portland, Oregon.
DeBoer, G. E. (1991). A History of Ideas in Science Education: Implications for Practice.
New York, NY: Teachers College Press.
Forbes, C. T., Biggers, M., & Zangori, L. (2013). Investigating essential characteristics of
scientific practices in elementary science learning environments: The practices of science
observation protocol (P‐SOP). School Science and Mathematics, 113(4), 180-190.
Gaskin, J., (2012), "Exploratory Factor Analysis", Gaskination's
StatWiki. http://statwiki.kolobkreations.com Accessed November 19, 2015.
Green, S. B., & Salkind, N. J. (2005). Using SPSS for Windows and Macintosh: Analyzing
and understanding data (4th ed.). Upper Saddle River, NJ: Pearson Education, Inc.

52
Heard, S. B., & Marek, E. A. (1985, April). Research of the Learning Cycle with the
Anthropological Model. Paper presented at the Annual Meeting of the National
Association for Research in Science Teaching, French Lick Springs, IN
IBM Corp. Released 2013. IBM SPSS Statistics for Windows, Version 22.0. Armonk, NY:
IBM Corp.
Karplus, R. (1977). Science teaching and the development of reasoning. Journal of Research
in Science Teaching, 14(2), 169–175.
Lawson, A. E. (2010). Teaching inquiry science in middle and secondary schools. Thousand
Oaks, CA: Sage.
Lawson, A. E., Abraham, M. R. & Renner, J. W. (1989) A theory of instruction: Using the
learning cycle to teach science concepts and thinking skills. NARST Monograph,
Number One, 1989. University of Cincinnati: National Association for Research in
Science Teaching.
Luft, J., Bell, R. L., & Gess-Newsome, J. (2008). Science as inquiry in the secondary setting.
Arlington, VA: NSTA press.
Marek, E. A. (2008). Why the learning cycle?. Journal of Elementary Science Education,
20(3), 63-69.
Marshall, J. C., & Alston, D. M. (2014). Effective, sustained inquiry-based instruction
promotes higher science proficiency among all groups: A 5-year analysis. Journal of
Science Teacher Education, 25(7), 807-821.
Marshall, J. C., Horton, B., Smart, J., & Llewellyn, D. (2009). EQUIP: Electronic Quality of
Inquiry Protocol: Retrieved from Clemson University’s Inquiry in Motion Institute,
www.clemson.edu/iim.

53
Marshall, J. C., Smart, J., & Horton, R. M. (2010). The design and validation of EQUIP: An
instrument to assess inquiry-based instruction. International Journal of Science and
Mathematics Education, 8(2), 299-321.
Marshall, J. C., Smart, J., Lotter, C., & Sirbu, C. (2011). Comparative analysis of two inquiry
observational protocols: Striving to better understand the quality of teacher facilitated
inquiry-based instruction. School Science and Mathematics, 111(6), 306-315.
Microsoft. (2011). Microsoft Excel for Mac. Version 14.4.8. Redmond, Washington:
Microsoft.
National Research Council. (1996). National science education standards. Washington, DC:
National Academy Press.
National Research Council. (2000a). Inquiry and the national science education standards :
A guide for teaching and learning. Washington, DC: National Academy Press.
National Research Council. (2000b). How people learn: Brain, mind, experience, and school:
expanded edition. Washington, DC: The National Academies Press.
National Research Council. (2012). A Framework for K-12 science education: Practices,
crosscutting concepts, and core ideas. Washington, DC: The National Academies Press
NGSS Lead States. (2013). Next Generation Science Standards: For States, By States.
Washington, DC: The National Academies Press.
Ogle, D.M. (1986). "K-W-L: A teaching model that develops active reading of expository
text." Reading Teacher, 39, 564-570.
Piaget, J. (2003). The psychology of intelligence. In Taylor & Francis e-Library (M. Piercy &
D.E. Berlyne, Trans.) Retrieved from Amazon.com (First English edition published 1950;
Original work published 1947)

54
Piaget, J. (1964). Part I: Cognitive development in children: Piaget development and
learning. Journal of Research in Science Teaching, 2(3), 176-186.
Robinson, K. (2014, October 3). How do schools kill creativity? Technology Entertainment
Design Radio Hour. Copyright ©2014 NPR. Podcast transcript retrieved from
http://www.npr.org/templates/transcript/transcript.php?storyId=351552772
Sampson, V. (2004). The science management observation protocol: Using structured
observations to improve teachers' management of inquiry-based classrooms. Science
Teacher, 71(10), 30-33.
Sawada, D., Piburn, M. D., Judson, E., Turley, J., Falconer, K., Benford, R. & Bloom, I.
(2002). Measuring reform practices in science and mathematics classrooms: The
reformed teaching observation protocol. School Science and Mathematics, 102(6), 245–
253. doi:10.1111/j.1949-8594.2002.tb17883.x
Smart, J. B., & Marshall, J. C. (2013). Interactions between classroom discourse, teacher
questioning, and student cognitive engagement in middle school science. Journal of
Science Teacher Education, 24(2), 249-267.
Texas Education Agency (TEA). STAAR media toolkit. Retrieved October 24, 2015 from
http://tea.texas.gov/index2.aspx?id=2147504081.
Texas Higher Education Coordinating Board (2015). Research and Project Grants: Teacher
Quality retrieved from http://www.thecb.state.tx.us/index.cfm?objectid=B535F1E5-
DF2C-77BF-B87830C92234EE3F
Weiss, I. R., Pasley, J. D., Smith, P. S., Banilower, E. R., & Heck, D. J. (2003). Looking
inside the classroom. Chapel Hill, NC: Horizon Research Inc.

55
Wilson, C. D., Taylor, J. A., Kowalski, S. M., & Carlson, J. (2010). The relative effects and
equity of inquiry-based and commonplace science teaching on students’ knowledge,
reasoning, and argumentation. Journal of Research in Science Teaching, 47(3), 276–301.
doi:10.1002/tea.20329

56
APPENDIX A
EQUIP (Marshall, et al., 2009)
www.clemson.edu/iim
EQUIP--2009
IV. Instructional Factors Construct Measured Pre-Inquiry (Level 1) Developing Inquiry (2) Proficient Inquiry (3) Exemplary Inquiry (4)
I1.
Instructional
Strategies
Teacher predominantly
lectured to cover content.
Teacher frequently lectured
and/or used demonstrations to
explain content. Activities
were verification only.
Teacher occasionally
lectured, but students were
engaged in activities that
helped develop conceptual
understanding.
Teacher occasionally lectured, but
students were engaged in investigations
that promoted strong conceptual
understanding.
I2. Order of
Instruction
Teacher explained concepts.
Students either did not
explore concepts or did so
only after explanation.
Teacher asked students to
explore concept before
receiving explanation.
Teacher explained.
Teacher asked students to
explore before explanation.
Teacher and students
explained.
Teacher asked students to explore concept
before explanation occurred. Though
perhaps prompted by the teacher,
students provided the explanation.
I3. Teacher Role
Teacher was center of
lesson; rarely acted as
facilitator.
Teacher was center of
lesson; occasionally acted as
facilitator.
Teacher frequently acted as
facilitator.
Teacher consistently and effectively
acted as a facilitator.
I4.
Student Role
Students were consistently
passive as learners (taking
notes, practicing on their
own).
Students were active to a
small extent as learners
(highly engaged for very brief
moments or to a small extent
throughout lesson).
Students were active as
learners (involved in
discussions, investigations, or
activities, but not consistently
and clearly focused).
Students were consistently and
effectively active as learners (highly
engaged at multiple points during lesson
and clearly focused on the task).
I5. Knowledge
Acquisition
Student learning focused
solely on mastery of facts,
information, and/or rote
processes.
Student learning focused on
mastery of facts and process
skills without much focus on
understanding of content.
Student learning required
application of concepts and
process skills in new
situations.
Student learning required depth of
understanding to be demonstrated
relating to content and process skills.
www.clemson.edu/iim
EQUIP--2009
V. Discourse Factors Construct Measured Pre-Inquiry (Level 1) Developing Inquiry (2) Proficient Inquiry (3) Exemplary Inquiry (4)
D1. Questioning
Level
Questioning rarely
challenged students above
the remembering level.
Questioning rarely challenged
students above the
understanding level.
Questioning challenged
students up to application or
analysis levels.
Questioning challenged students at
various levels, including at the analysis
level or higher; level was varied to
scaffold learning.
D2. Complexity of
Questions
Questions focused on one
correct answer; typically
short answer responses.
Questions focused mostly on
one correct answer; some
open response opportunities.
Questions challenged
students to explain, reason,
and/or justify.
Questions required students to explain,
reason, and/or justify. Students were
expected to critique others’ responses.
D3.
Questioning
Ecology
Teacher lectured or engaged
students in oral questioning
that did not lead to
discussion.
Teacher occasionally
attempted to engage
students in discussions or
investigations but was not
successful.
Teacher successfully engaged
students in open-ended
questions, discussions, and/or
investigations.
Teacher consistently and effectively
engaged students in open-ended
questions, discussions, investigations,
and/or reflections.
D4.
Communication
Pattern
Communication was
controlled and directed by
teacher and followed a
didactic pattern.
Communication was typically
controlled and directed by
teacher with occasional input
from other students; mostly
didactic pattern.
Communication was often
conversational with some
student questions guiding the
discussion.
Communication was consistently
conversational with student questions
often guiding the discussion.
D5.
Classroom
Interactions
Teacher accepted answers,
correcting when necessary,
but rarely followed-up with
further probing.
Teacher or another student
occasionally followed-up
student response with further
low-level probe.
Teacher or another student
often followed-up response
with engaging probe that
required student to justify
reasoning or evidence.
Teacher consistently and effectively
facilitated rich classroom dialogue
where evidence, assumptions, and
reasoning were challenged by teacher or
other students.

57
www.clemson.edu/iim
EQUIP--2009
VI. Assessment Factors Construct Measured Pre-Inquiry (Level 1) Developing Inquiry (2) Proficient Inquiry (3) Exemplary Inquiry (4)
A1. Prior
Knowledge
Teacher did not assess
student prior knowledge.
Teacher assessed student
prior knowledge but did not
modify instruction based on
this knowledge.
Teacher assessed student prior
knowledge and then partially
modified instruction based
on this knowledge.
Teacher assessed student prior knowledge
and then modified instruction based on
this knowledge.
A2. Conceptual
Development
Teacher encouraged learning
by memorization and
repetition.
Teacher encouraged product-
or answer-focused learning
activities that lacked critical
thinking.
Teacher encouraged process-
focused learning activities
that required critical
thinking.
Teacher encouraged process-focused
learning activities that involved critical
thinking that connected learning with
other concepts.
A3. Student
Reflection
Teacher did not explicitly
encourage students to reflect
on their own learning.
Teacher explicitly encouraged
students to reflect on their
learning but only at a minimal
knowledge level.
Teacher explicitly encouraged
students to reflect on their
learning at an understanding
level.
Teacher consistently encouraged students
to reflect on their learning at multiple
times throughout the lesson; encouraged
students to think at higher levels.
A4. Assessment
Type
Formal and informal
assessments measured only
factual, discrete knowledge.
Formal and informal
assessments measured
mostly factual, discrete
knowledge.
Formal and informal
assessments used both
factual, discrete knowledge
and authentic measures.
Formal and informal assessment methods
consistently and effectively used
authentic measures.
A5.
Role of
Assessing
Teacher solicited
predetermined answers from
students requiring little
explanation or justification.
Teacher solicited
information from students
to assess understanding.
Teacher solicited explanations
from students to assess
understanding and then
adjusted instruction
accordingly.
Teacher frequently and effectively
assessed student understanding and
adjusted instruction accordingly;
challenged evidence and claims made;
encouraged curiosity and openness.
www.clemson.edu/iim
EQUIP--2009
VII. Curriculum Factors Construct Measured Pre-Inquiry (Level 1) Developing Inquiry (2) Proficient Inquiry (3) Exemplary Inquiry (4)
C1.
Content Depth
Lesson provided only
superficial coverage of
content.
Lesson provided some depth
of content but with no
connections made to the big
picture.
Lesson provided depth of
content with some significant
connection to the big picture.
Lesson provided depth of content with
significant, clear, and explicit
connections made to the big picture.
C2. Learner
Centrality
Lesson did not engage
learner in activities or
investigations.
Lesson provided prescribed
activities with anticipated
results.
Lesson allowed for some
flexibility during
investigation for student-
designed exploration.
Lesson provided flexibility for students
to design and carry out their own
investigations.
C3. Integration of
Content and
Investigation
Lesson either content-
focused or activity-focused
but not both.
Lesson provided poor
integration of content with
activity or investigation.
Lesson incorporated student
investigation that linked well
with content.
Lesson seamlessly integrated the
content and the student investigation.
C4. Organizing &
Recording
Information
Students organized and
recorded information in
prescriptive ways.
Students had only minor
input as to how to organize
and record information.
Students regularly organized
and recorded information in
non-prescriptive ways.
Students organized and recorded
information in non-prescriptive ways that
allowed them to effectively communicate
their learning.

58
APPENDIX B
Tables of the Discriminant Factor Analysis
Table B 1 Descriptive Statistics of the Complete Dataset
N Mean Std. Deviation Skewness Kurtosis
Statistic Statistic Statistic Statistic Std. Error Statistic Std. Error I1 515 2.41 .731 -.043 .108 -.321 .215 I2 515 2.07 .886 .176 .108 -1.091 .215 I3 515 2.42 .805 .097 .108 -.455 .215 I4 515 2.58 .890 .029 .108 -.768 .215 I5 515 2.36 .744 -.257 .108 -.564 .215 D1 515 2.17 .736 .135 .108 -.370 .215 D2 515 2.16 .782 .098 .108 -.628 .215 D3 515 2.14 .910 .046 .108 -1.218 .215 D4 515 2.16 .810 .320 .108 -.365 .215 D5 515 1.93 .743 .456 .108 -.116 .215 A1 515 2.30 .817 -.136 .108 -.774 .215 A2 515 2.36 .693 .161 .108 -.125 .215 A3 515 2.11 .843 .246 .108 -.717 .215 A4 515 2.15 .774 .135 .108 -.555 .215 A5 515 2.07 .791 .438 .108 -.150 .215 C1 515 2.34 .797 -.054 .108 -.585 .215 C2 515 2.19 .632 .706 .108 1.142 .215 C3 515 2.30 .876 -.259 .108 -1.072 .215 C4 515 1.95 .753 .498 .108 -.014 .215
Table B 2 Classification Results of Discriminant Factor Analysis
Predicted Group Membership
Total Primary Secondary
Original
Count Primary 145 75 220 Secondary 94 201 295
% Primary 65.9 34.1 100 Secondary 31.9 68.1 100
a. 67.2% of original grouped cases correctly classified

59
APPENDIX C
Tables of the Exploratory Factor Analysis
Table C 1 Descriptive Statistics of Primary Dataset
N Mean Std. Deviation Skewness Kurtosis
Statistic Statistic Statistic Statistic Std. Error Statistic Std. Error I1 220 2.58 .654 .205 .164 -.309 .327 I2 220 2.35 .877 -.225 .164 -.912 .327 I3 220 2.60 .760 -.013 .164 -.360 .327 I4 220 2.80 .843 -.012 .164 -.888 .327 I5 220 2.53 .685 -.460 .164 -.118 .327 D1 220 2.31 .712 -.069 .164 -.391 .327 D2 220 2.40 .761 -.191 .164 -.468 .327 D3 220 2.39 .902 -.353 .164 -.990 .327 D4 220 2.28 .728 .307 .164 -.008 .327 D5 220 2.11 .726 .265 .164 -.131 .327 A1 220 2.48 .825 -.163 .164 -.535 .327 A2 220 2.52 .665 -.208 .164 -.178 .327 A3 220 2.35 .870 .022 .164 -.732 .327 A4 220 2.31 .743 .037 .164 -.357 .327 A5 220 2.25 .827 .277 .164 -.409 .327 C1 220 2.44 .817 -.264 .164 -.586 .327 C2 220 2.30 .582 .684 .164 .598 .327 C3 220 2.41 .831 -.455 .164 -.770 .327 C4 220 2.03 .692 .292 .164 .028 .327 Valid N 220

60
Table C 2 Descriptive Statistics of Secondary Dataset
N Mean Std. Deviation Skewness Kurtosis
Statistic Statistic Statistic Statistic Std. Error Statistic Std. Error
I1 295 2.29 .762 -.037 .142 -.522 .283
I2 295 1.86 .834 .472 .142 -.861 .283
I3 295 2.27 .810 .233 .142 -.394 .283
I4 295 2.42 .892 .112 .142 -.716 .283
I5 295 2.23 .760 -.079 .142 -.690 .283
D1 295 2.06 .737 .308 .142 -.166 .283
D2 295 1.99 .751 .313 .142 -.417 .283
D3 295 1.96 .874 .332 .142 -1.066 .283
D4 295 2.07 .856 .419 .142 -.495 .283
D5 295 1.80 .728 .653 .142 .191 .283
A1 295 2.17 .786 -.182 .142 -1.101 .283
A2 295 2.24 .690 .458 .142 .359 .283
A3 295 1.93 .777 .343 .142 -.679 .283
A4 295 2.03 .777 .247 .142 -.595 .283
A5 295 1.94 .735 .510 .142 .141 .283
C1 295 2.26 .775 .093 .142 -.452 .283
C2 295 2.11 .656 .830 .142 1.605 .283
C3 295 2.22 .901 -.112 .142 -1.199 .283
C4 295 1.88 .791 .664 .142 .065 .283
Valid N 295

61
Table C 3 Commonalities of Primary Dataset
Initial Extraction I1 .656 .683 I2 .616 .590 I3 .664 .704 I4 .678 .702 I5 .624 .621 D1 .663 .659 D2 .682 .681 D3 .713 .738 D4 .559 .545 D5 .633 .662 A1 .485 .545 A2 .680 .705 A3 .650 .684 A4 .617 .625 A5 .697 .727 C1 .558 .550 C2 .425 .541 C3 .606 .674 C4 .445 .512
Extraction Method: Principal Axis Factoring.

62
Table C 4 Commonalities of the Secondary Dataset: All Indicators
Initial Extraction I1 .694 .721 I2 .506 .462 I3 .679 .687 I4 .633 .645 I5 .65 .615 D1 .662 .676 D2 .712 .737 D3 .639 .598 D4 .661 .62 D5 .615 .599 A1 .206 .177 A2 .635 .628 A3 .431 .425 A4 .609 .617 A5 .646 .674 C1 .476 .427 C2 .568 .543 C3 .552 .524 C4 .529 .442
Table C 5 Commonalities of the Secondary Dataset: Without A1
Initial Extraction I1 .694 .723 I2 .506 .462 I3 .677 .682 I4 .631 .652 I5 .648 .613 D1 .661 .686 D2 .712 .756 D3 .629 .594 D4 .661 .620 D5 .615 .597 A2 .634 .632 A3 .420 .410 A4 .609 .616 A5 .643 .673 C1 .476 .425 C2 .566 .534 C3 .550 .525 C4 .529 .442

VITA
NETTLES, JENESTA 3023 S. University #119, Fort Worth TX 76109 | 817-876-2441 | [email protected]
RESEARCH INTERESTS Scholarship focuses on reform-based, science instruction. Dissertation used exploratory factor analysis to investigate the inquiry practices of science teachers participating in professional development.
EDUCATION Texas Christian University, Fort Worth, TX Exp. December 2015 ABD Ph.D. Science Education: Advisor- Dr. Molly H. Weinburgh University of Idaho, Moscow, ID 2006 M.A. Curriculum and Instruction; Major in Chemistry; Minor in Biology Texas A&M University, College Station, TX 1998 B.S. Biomedical Science
EXPERIENCE Texas Christian University, Fort Worth, TX 2012-Present Senior Research Associate – Teacher Quality Grant Evaluation Facilitate and conduct observations as part of an external evaluation. Intern-Secondary Science Methods 2011 Co-Developed syllabus and course structure, and consulted in administering grades. Teaching Assistant- Early Childhood through 6th Grade Science Methods 2009 and 2010 Assisted in attendance, classroom preparation and general administrative tasks. Dunbar High School, Fort Worth Independent School District, Fort Worth, TX 2010 and 2011 Texas Assessment of Knowledge and Skills Tutor Assessed learning and prepared students for state assessment. Timberview High School, Mansfield Independent School District, Arlington, TX 2004-2009 Biology, Pre-AP Biology and AP Biology Teacher Summit High School, Mansfield Independent School District, Arlington, TX 2004 Biology Teacher
GRANTS Outdoor Learning Center- First Author- $16,000 2007 Biology in the F.I.E.L.D.s- $4,999 2006 Wolves’ Summer Science Academy - $10,000 2005
PUBLICATIONS Silva, Cecilia, Weinburgh, Molly, Malloy, Robert, Smith, Kathy Horak, & 2012 Marshall, Jenesta Nettles. Toward Integration: An instructional model of science and academic language. Childhood Education. Weinburgh, Molly, Silva, Cecilia, Marshall, Jenesta Nettles, & Malloy, Robert. 2012 A Science Lesson or Language Lesson? Using the 5R Instructional Model. Science and Children.

ABSTRACT
THE UNDERLYING RELATIONSHIPS BETWEEN THE OBSERVED PRACTICES AS REVEALED BY AN EXPLORATORY FACTOR ANALYSIS OF EQUIP RATINGS
By Jenesta Rae Nettles, Ph.D., 2015 College of Education
Texas Christian University
Dissertation Advisor: Molly Weinburgh, Professor of Education Cecilia Silva, Professor of Education Robin Griffith, Associate Professor of Education Kristina Higgins, Child and Family Support Advisor
The Electronic Quality of Inquiry Protocol (EQUIP) is an instrument to measure the
amount and quality of inquiry instruction of science and mathematics classrooms. The
EQUIP rubric includes detailed descriptions for the inquiry practices that it measures. This
study analyzed a large dataset of Texas science teacher observations using a discriminant
factor analysis and exploratory factor analysis. The discriminant factor analysis found the
inquiry instruction practices of primary (1st-5th grade) science teachers and secondary (6th-
12th grade) science teachers to differ greatly, with primary science teachers using inquiry
practices more often than secondary science teachers. Based on this information the primary
and secondary datasets were analyzed separately with the exploratory factor analysis. The
resulting factors indicate a variety of differences in the observed practices. The results also,
suggest that discourse practices play a divergent but influential role for both datasets.
Potential implications for professional development and future research are discussed.