rev group, inc.investors.revgroup.com/.../revg-ms-laguna-presentation.pdf · september investor...
TRANSCRIPT
September 2018
REV GROUP, INC.
September Investor Presentat ion
N Y S E : R E V G

Cautionary Statements & Non GAAP Measures
Disclaimers
Note Regarding Non-GAAP Measures
REV Group reports its financial results in accordance with U.S. generally accepted accounting principles (“GAAP”). However, management believes that the evaluation of REV Group’s ongoing operating results may be enhanced by a presentation of Adjusted EBITDA and Adjusted Net Income, which are non-GAAP financial measures. Adjusted EBITDA represents net income before interest expense, income taxes, depreciation and amortization as adjusted for certain non-recurring, one-time and other adjustments which REV Group believes are not indicative of its underlying operating performance. Adjusted Net Income represents net income, as adjusted for certain items described below that we believe are not indicative of our ongoing operating performance. REV Group believes that the use of Adjusted EBITDA and Adjusted Net Income provides additional meaningful methods of evaluating certain aspects of its operating performance from period to period on a basis that may not be otherwise apparent under GAAP when used in addition to, and not in lieu of, GAAP measures. See the Appendix to this presentation (and our other filings with the SEC) for reconciliations of Adjusted EBITDA and Adjusted Net Income to the most closely comparable financial measures calculated in accordance with GAAP.
Cautionary Statement About Forward-Looking Statements
This presentation contains statements that REV Group believes to be “forward-looking statements” within the meaning of the Private Securities Litigation Reform Act of 1995. These forward-looking statements can generally be identified by the use of forward-looking terminology, including the terms “believes,” “estimates,” “anticipates,” “expects,” “strives,” “goal,” “seeks,” “projects,” “intends,” “forecasts,” “plans,” “may,” “will” or “should” or, in each case, their negative or other variations or comparable terminology. They appear in a number of places throughout this presentation and include statements regarding REV Group’s intentions, beliefs, goals or current expectations concerning, among other things, its results of operations, financial condition, liquidity, prospects, growth, strategies and the industries in which we operate, including REV Group’s outlook for the full-year fiscal 2018. REV Group’s forward-looking statements are subject to risks and uncertainties, including those highlighted under “Risk Factors” and “Cautionary Note Regarding on Forward-Looking Statements” in REV Group’s public filings with the SEC and the other risk factors described from time to time in subsequent quarterly or annual reports on Forms 10-Q or 10-K, which may cause actual results to differ materially from those projected or implied by the forward-looking statement. Forward-looking statements are based on current expectations and assumptions and currently available data and are neither predictions nor guarantees of future events or performance. You should not place undue reliance on forward-looking statements, which only speak as of the date of this presentation. REV Group does not undertake to update or revise any forward-looking statements after they are made, whether as a result of new information, future events, or otherwise, expect as required by applicable law.
2
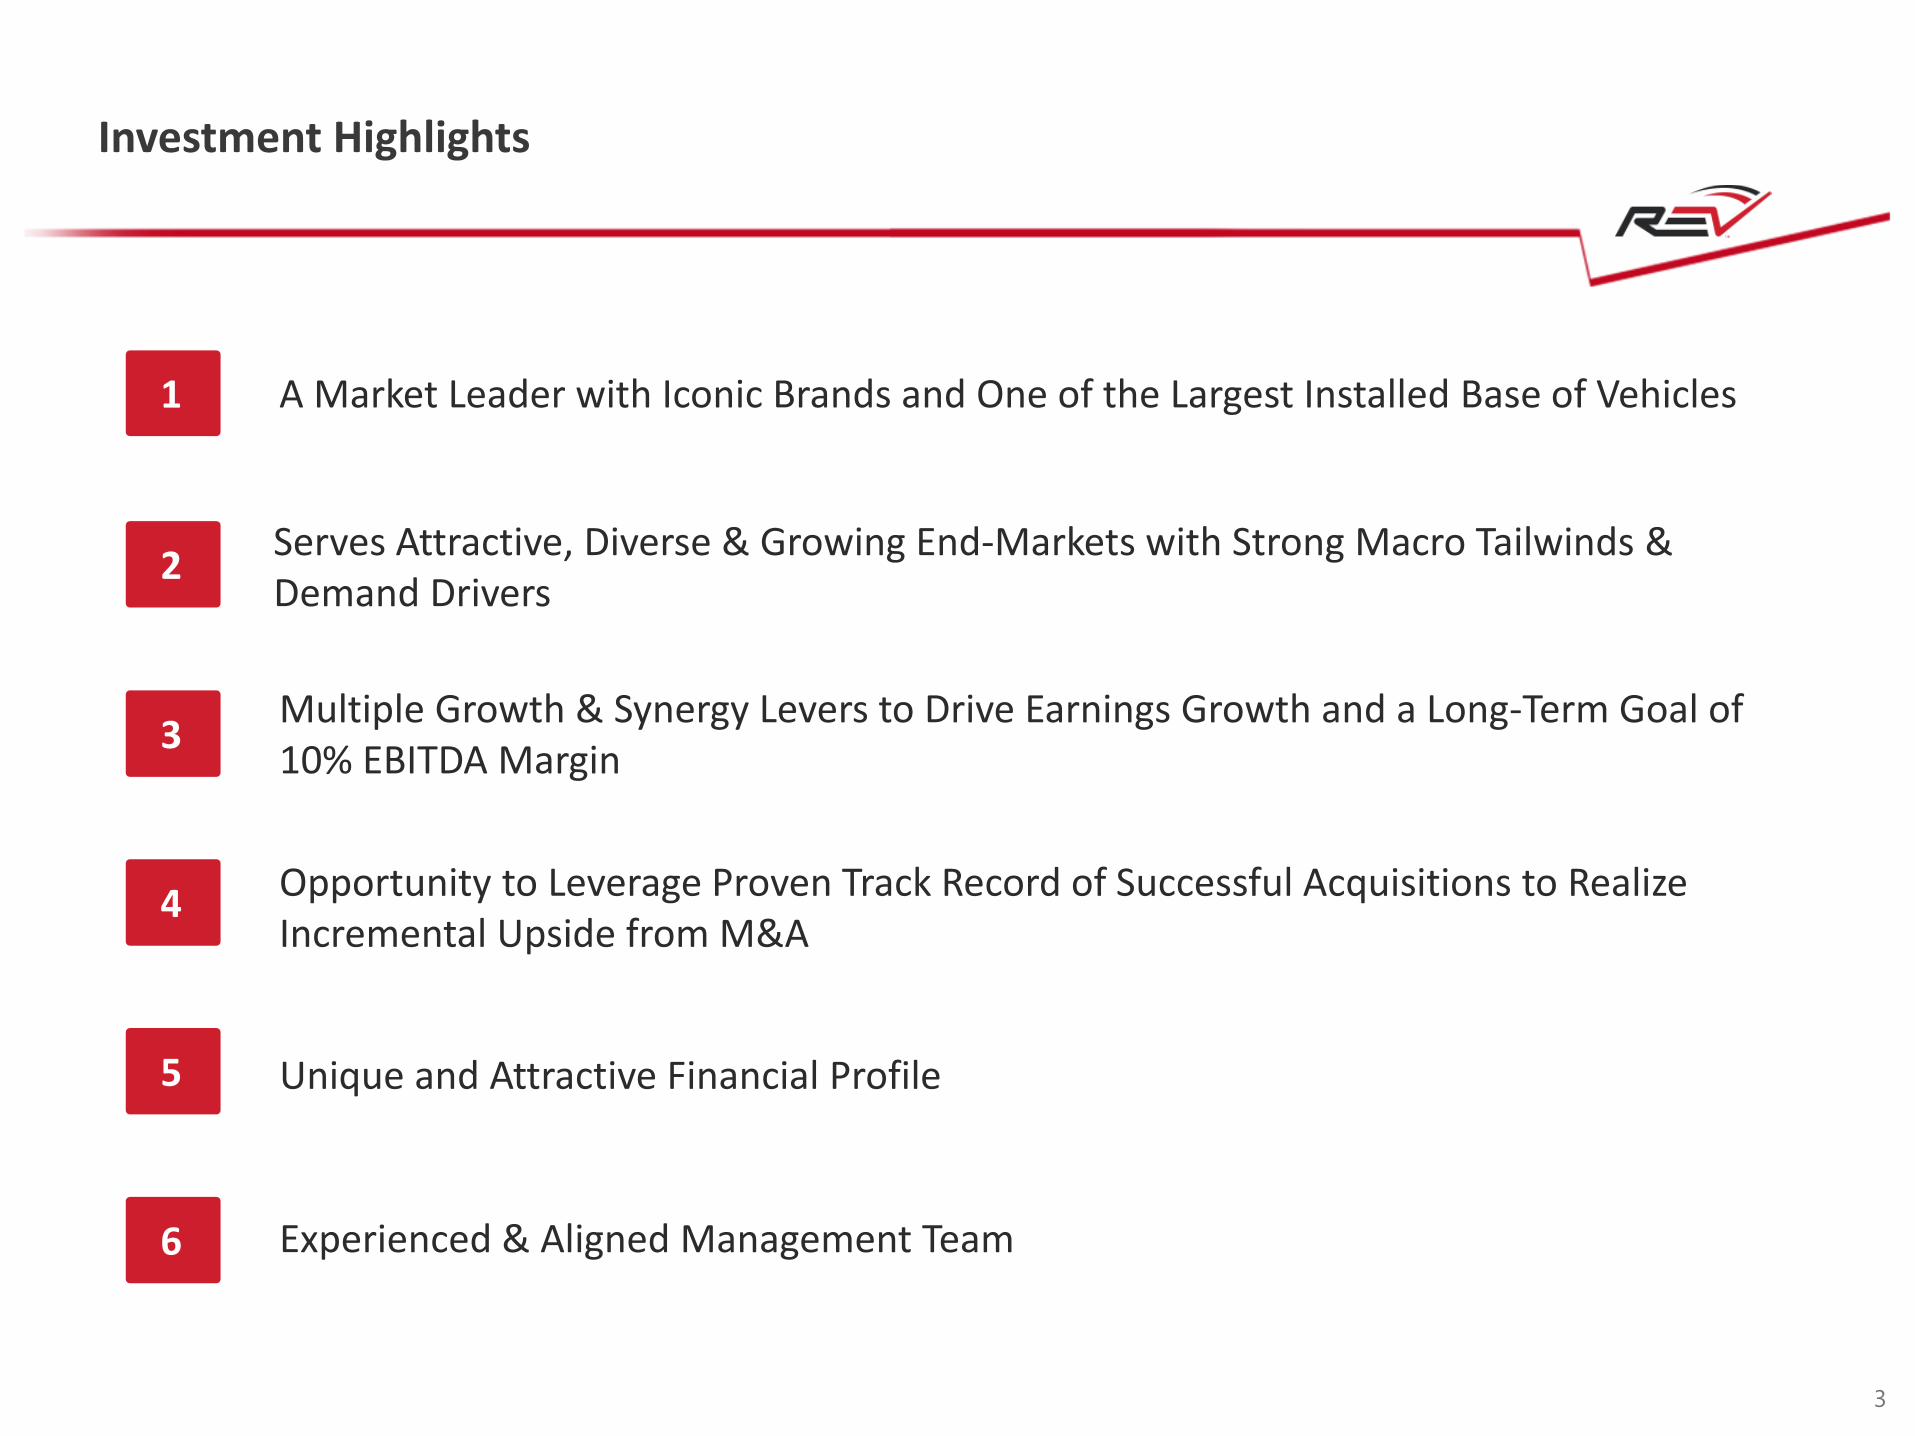
A Market Leader with Iconic Brands and One of the Largest Installed Base of Vehicles
Serves Attractive, Diverse & Growing End-Markets with Strong Macro Tailwinds & Demand Drivers
Multiple Growth & Synergy Levers to Drive Earnings Growth and a Long-Term Goal of 10% EBITDA Margin
Opportunity to Leverage Proven Track Record of Successful Acquisitions to Realize Incremental Upside from M&A
Unique and Attractive Financial Profile
Experienced & Aligned Management Team
1
2
3
4
5
6
Investment Highlights
3

COMPANY OVERVIEW

R E V H A S A D I V E R S E P O R T F O L I O O F V E H I C L E S , E A C H D I S T I N C T LY P O S I T I O N E D TO TA R G E T S P E C I F I C C U S TO M E R R E Q U I R E M E N T S & P R I C E P O I N T S
One of the Industry’s Broadest Product Portfolios of Specialty Vehicles
FIRE + EMERGENCY
COMMERCIAL
RECRE ATION
P U M P E R / TA N K E R A E R I E L F I R E T R U C KW I T H L A D D E R
A I R C R A F T R E S C U L E F I R E F I G H T E R
A M B U L A N C E T Y P E I A M B U L A N C E T Y P E I I A M B U L A N C E T Y P E I I I
T Y P E A S C H O O L B U S E S
T R A N S I T B U S T E R M I N A L T R U C K SS H U T T L E B U S S W E E P E R S M O B I L I T Y V A N
C L A S S A D I E S E LC L A S S A G A S O L I N E
C L A S S B C L A S S C S U P E R C
5
TRUCK CAMPERS TRAVEL TRAILERS
M O T O R C O A C H
¹ Represents FY 20132 Represents FY 2016
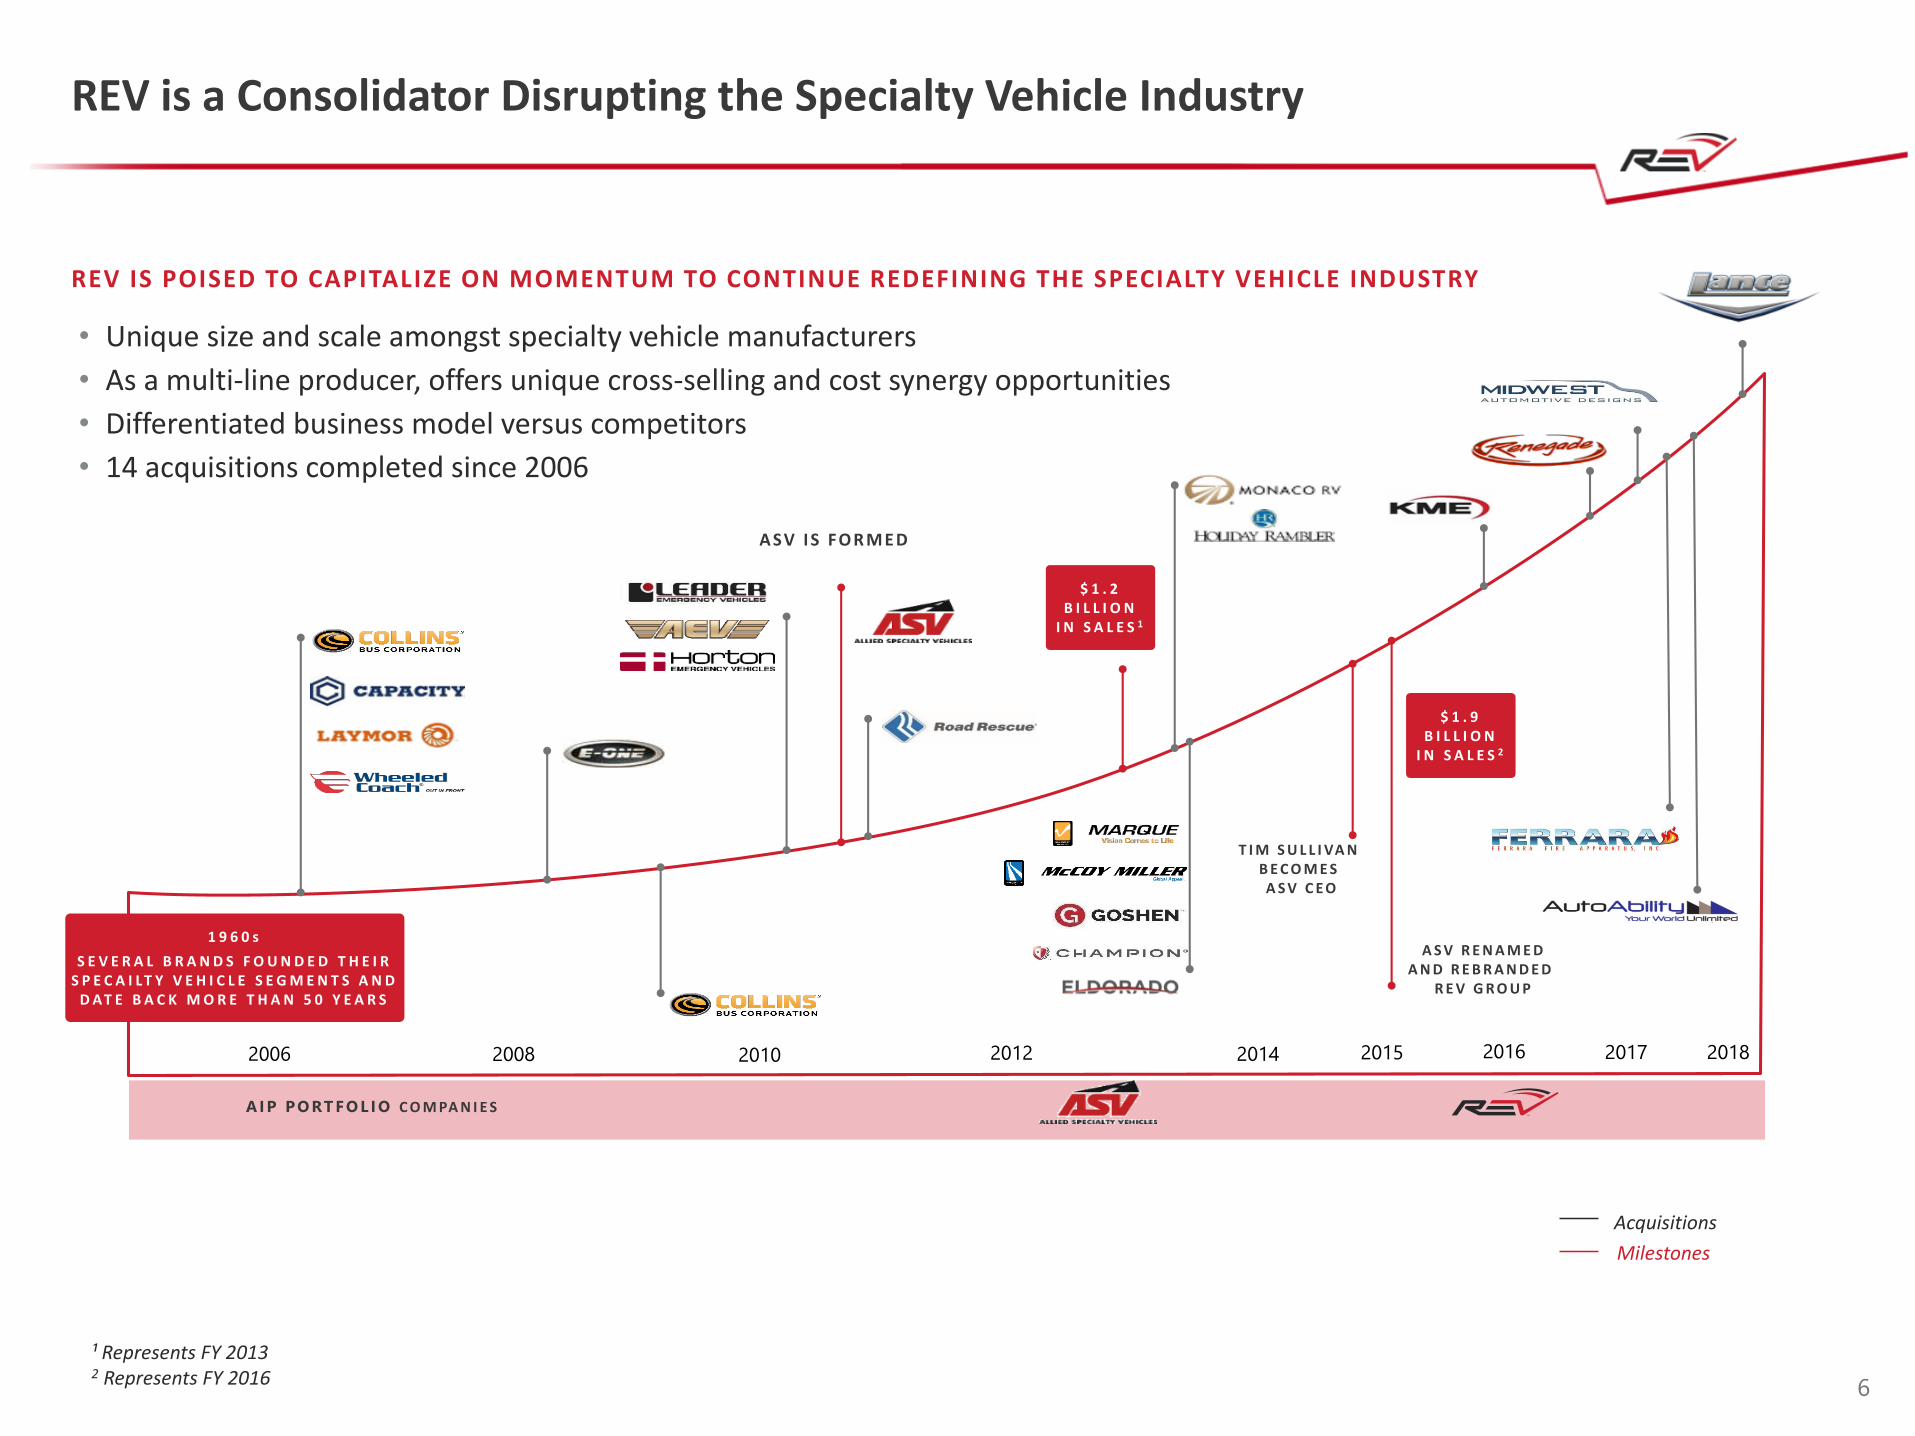
REV is a Consolidator Disrupting the Specialty Vehicle Industry
6
2006 2008 2010 2012 2014 20162015 2017
AI P PO RT F O L I O C O M PA N I E S
A SV I S FO R M E D
T I M S U L L I VA N B E C O M E S A S V C E O
A S V R E N A M E DA N D R E B R A N D E D
R E V G R O U P
$ 1 . 2 B I L L I O N
I N S A L E S 1
$ 1 . 9 B I L L I O N
I N S A L E S 2
2018
REV IS POISED TO CAPITALIZE ON MOMENTUM TO CONTINUE REDEFINING THE SPECIALTY VEHICLE INDUSTRY
• Unique size and scale amongst specialty vehicle manufacturers
• As a multi-line producer, offers unique cross-selling and cost synergy opportunities
• Differentiated business model versus competitors
• 14 acquisitions completed since 2006
Acquisitions
Milestones
1 9 6 0 s
S E V E R A L B R A N D S F O U N D E D T H E I R S P E C A I L T Y V E H I C L E S E G M E N T S A N D
D AT E B A C K M O R E T H A N 5 0 Y E A R S
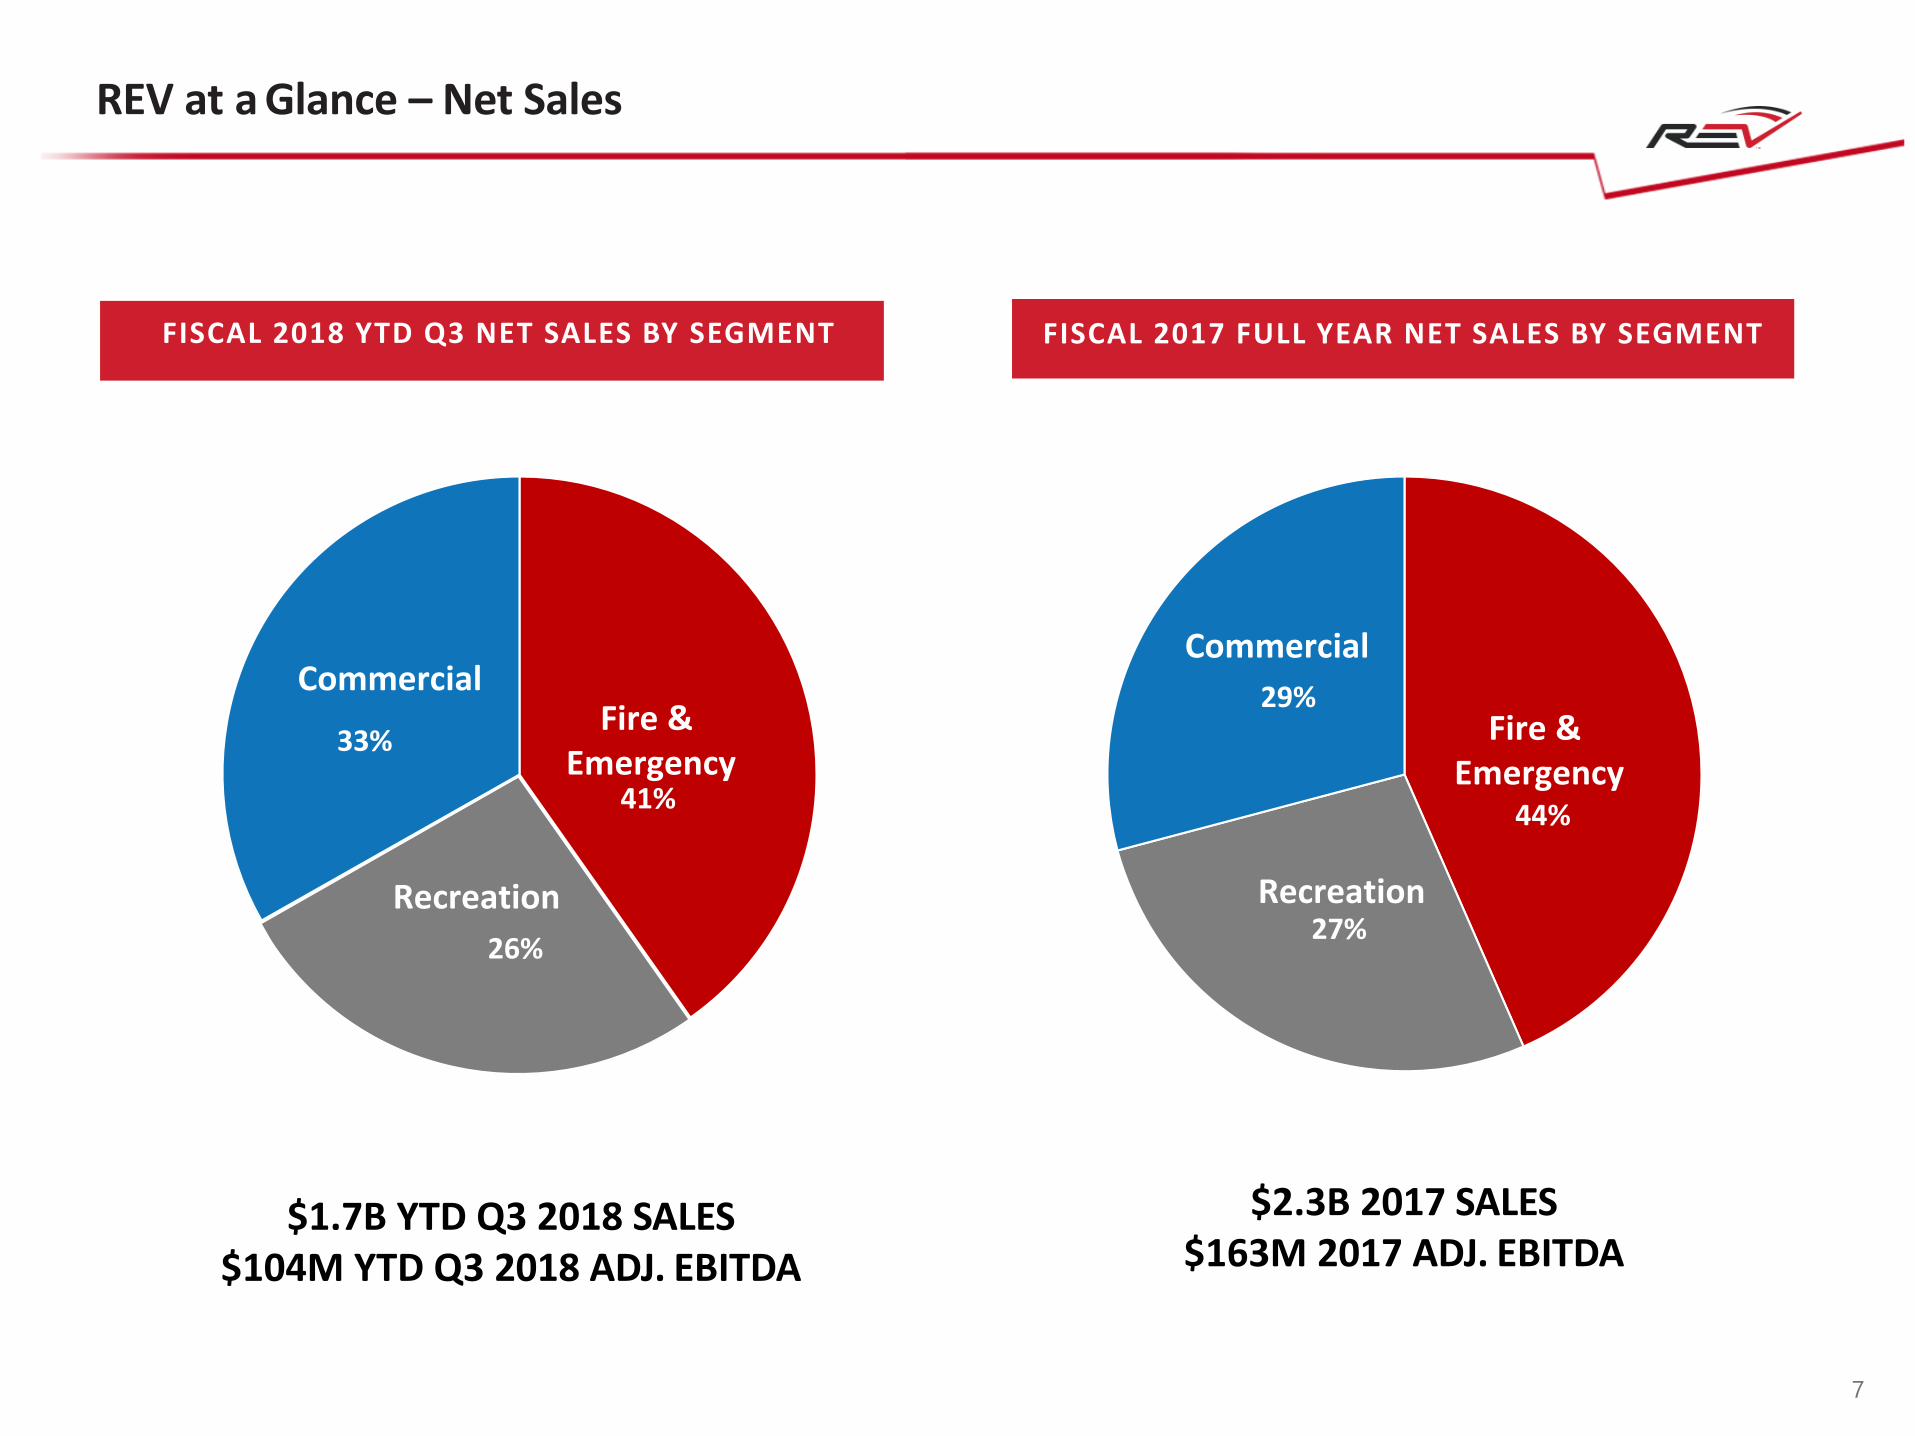
$2.3B 2017 SALES$163M 2017 ADJ. EBITDA
REV at a Glance – Net Sales
44%
27%
29%Fire &
Emergency
Commercial
Recreation
FISCAL 2018 YTD Q3 NET SALES BY SEGMENT
7
41%
26%
33%Fire &
Emergency
Commercial
Recreation
$1.7B YTD Q3 2018 SALES$104M YTD Q3 2018 ADJ. EBITDA
FISCAL 2017 FULL YEAR NET SALES BY SEGMENT

REV Sales at a Glance – Sales Mix
Ambulance23%
Fire Apparatus
21%
Type A School Bus
6%
Commercial Bus8%
Transit Bus7%
Specialty6%
RV29%
Government, 50%
Consumer, 28%
Private Contractor,
10%
Industrial / Commercial,
12%
Dealer73%
Direct27%
SALES BY VEHICLE TYPE SALES BY CUSTOMER TYPE SALS BY CHANNEL
Represents full year Fiscal 2017 ended October 31, 2017 1
1
8
9
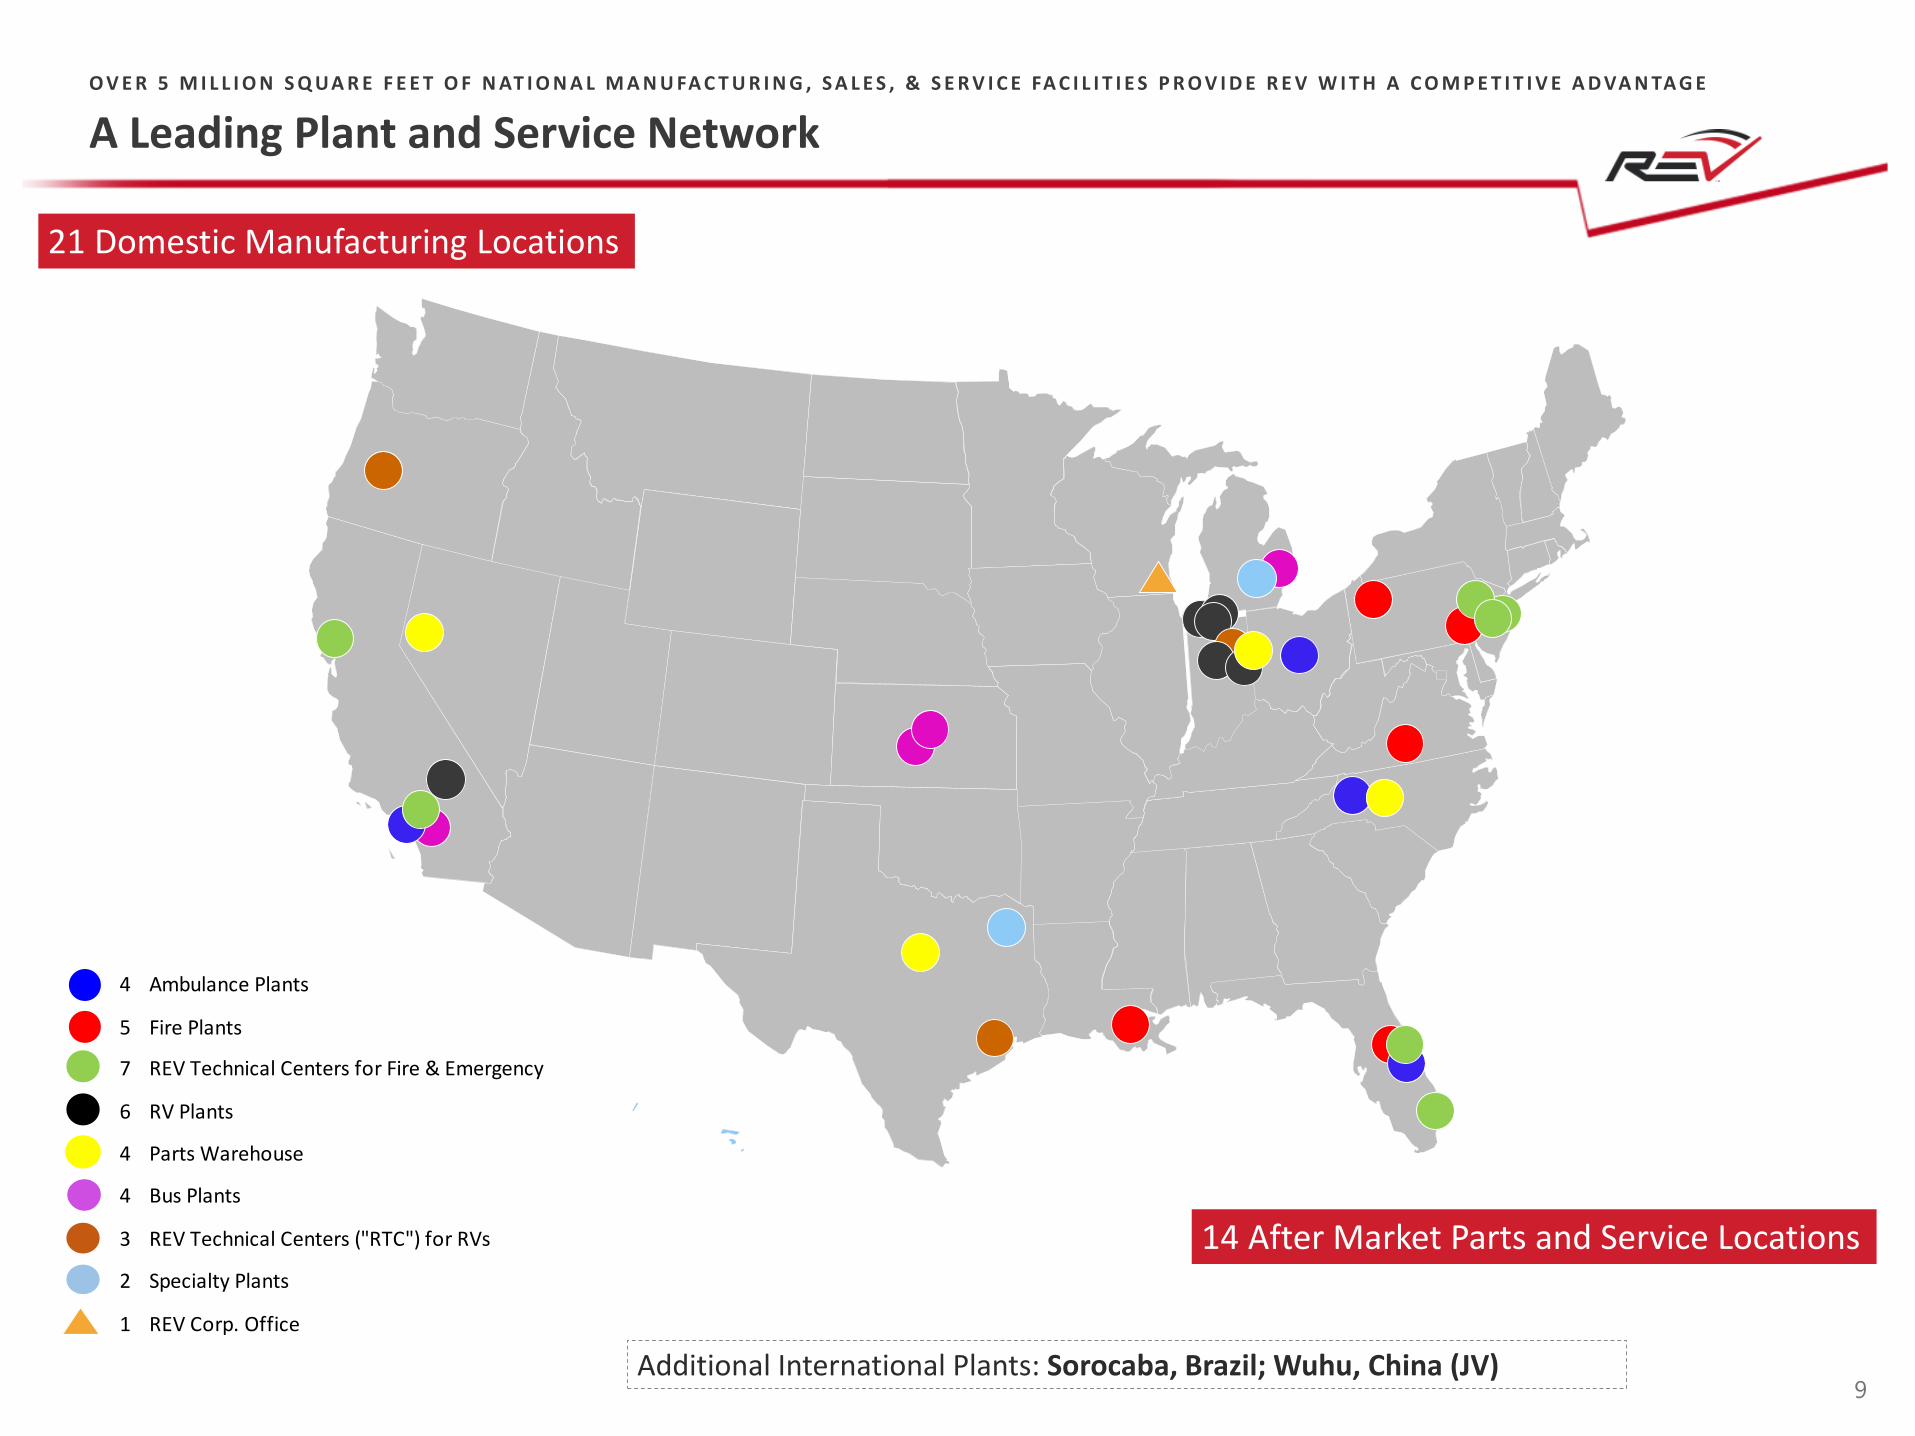
A Leading Plant and Service Network
Additional International Plants: Sorocaba, Brazil; Wuhu, China (JV)
O V E R 5 M I L L I O N S Q UA R E F E E T O F N AT I O N A L M A N U FA C T U R I N G , S A L E S , & S E R V I C E FA C I L I T I E S P R O V I D E R E V W I T H A C O M P E T I T I V E A D VA N TA G E
21 Domestic Manufacturing Locations
14 After Market Parts and Service Locations
4 Ambulance Plants
5 Fire Plants
7 REV Technical Centers for Fire & Emergency
6 RV Plants
4 Parts Warehouse
4 Bus Plants
3 REV Technical Centers ("RTC") for RVs
2 Specialty Plants
1 REV Corp. Office

Source: Management estimateNote: Replacement sales opportunity is calculated as the average number of annual units sold multiplied by the average useful life multiplied by the average selling price.¹ Does not include the replacement value of the fleets from the 2017 and 2018 acquisitions.
10
R E P L A C E M E N T VA L U E O FR E V ’ S I N S TA L L E D B A S E
AV E R A G E L I F E C YC L E& S E L L I N G P R I C E
I N C R E M E N TA L I M PA C TO F A C Q U I S I T I O N S S I N C E I P O
W H Y C U S TO M E R S C H O O S ER E V F O R R E P L A C E M E N T
• Repeat purchase to match in-service fleets
• Brand loyalty and reputation for value, quality, and reliability
• Long-standing customer relationships
• Broad, customizable vehicle platform
• Superior product quality and safety
• Network of aftermarket parts and service centers
L U X U R Y B U S E S
C L A S S B R V S
P U M P E R T R U C K S : 1 0 - 1 2 Y E A R S( $ 1 6 0 K - $ 6 5 0 K )
A E R I A L F I R E T R U C K S : 2 0 - 3 0 Y E A R S( $ 4 7 5 K - $ 1 . 2 M M )
A M B U L A N C E : 5 - 7 Y E A R S( $ 6 5 K - $ 3 5 0 K )
S H U T T L E B U S : 5 - 1 0 Y E A R S( $ 4 0 K - $ 1 9 0 K )
T R A N S I T B U S : 1 2 Y E A R S( $ 1 0 0 K - $ 5 0 0 K )
S C H O O L B U S : 8 - 1 0 Y E A R S( $ 3 5 K - $ 5 5 K )
S P E C I A LT Y V E H I C L E S : 5 - 7 Y E A R S( $ 2 5 K - $ 1 6 5 K )
R E C R E AT I O N V E H I C L E S : 8 - 1 5 Y E A R S( $ 6 5 K - $ 6 0 0 K )
FIRE
AMBULANCE
BUS
SPECIALTY
RV
~$36BILLION
R E P L A C E M E N TV A L U E O F R E V ’ S
I N - S E R V I C E F L E E T 1
R E P L A C E M E N T D E M A N D F O R T H E A G I N G F L E E T O F R E V ’ S P R O D U C T S R E P R E S E N T S A R E V E N U E G R O W T H O P P O R T U N I T Y
Large Installed Base Drives Recurring Replacement Sales
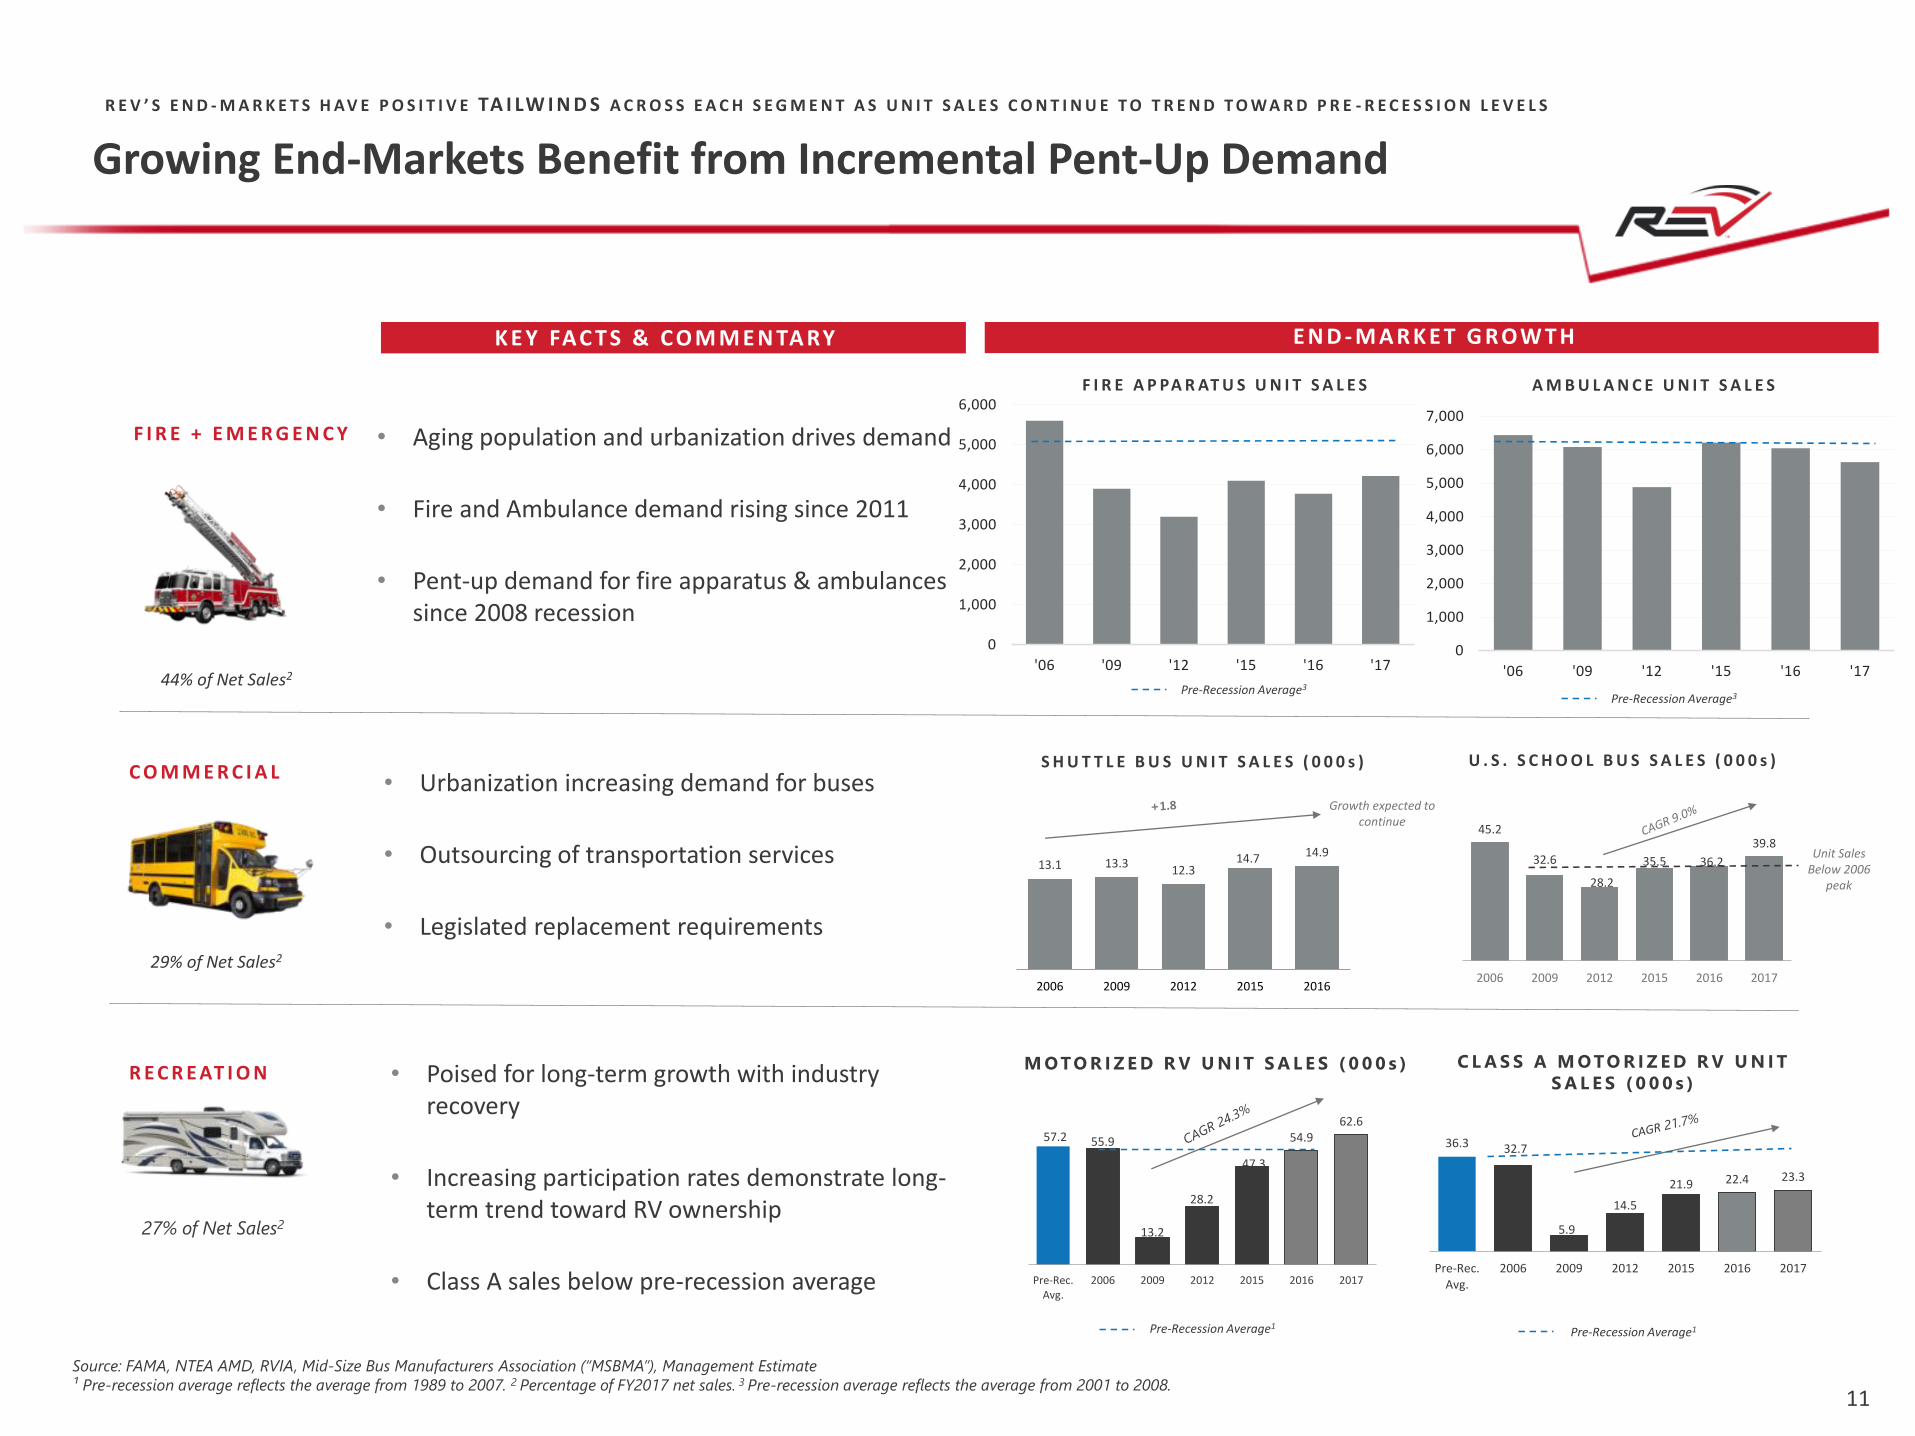
Source: FAMA, NTEA AMD, RVIA, Mid-Size Bus Manufacturers Association (“MSBMA”), Management Estimate
¹ Pre-recession average reflects the average from 1989 to 2007. 2 Percentage of FY2017 net sales. 3 Pre-recession average reflects the average from 2001 to 2008.
K E Y FAC T S & C O M M E N TA RY E N D - M A R K E T G R OW T H
F I R E + E M E R G E N C Y
C O M M E R C I A L
R E C R E AT I O N
44% of Net Sales2
29% of Net Sales2
27% of Net Sales2
• Aging population and urbanization drives demand
• Fire and Ambulance demand rising since 2011
• Pent-up demand for fire apparatus & ambulances since 2008 recession
• Urbanization increasing demand for buses
• Outsourcing of transportation services
• Legislated replacement requirements
• Poised for long-term growth with industry recovery
• Increasing participation rates demonstrate long-term trend toward RV ownership
• Class A sales below pre-recession average
F I R E A P PA R AT U S U N I T S A L E S A M B U L A N C E U N I T S A L E S
13.1 13.312.3
14.7 14.9
2006 2009 2012 2015 2016
Growth expected to continue
S H U T T L E B U S U N I T S A L E S ( 0 0 0 s ) U . S . S C H O O L B U S S A L E S ( 0 0 0 s )
M OTO R I Z E D R V U N I T S A L E S ( 0 0 0 s ) C L A S S A M OTO R I Z E D R V U N I T
S A L E S ( 0 0 0 s )
45.2
32.6
28.2
35.5 36.2
39.8
2006 2009 2012 2015 2016 2017
Unit SalesBelow 2006
peak
57.2 55.9
13.2
28.2
47.3
54.962.6
Pre-Rec.Avg.
2006 2009 2012 2015 2016 2017
Pre-Recession Average1
36.3 32.7
5.9
14.5
21.9 22.4 23.3
Pre-Rec.Avg.
2006 2009 2012 2015 2016 2017
R E V ’ S E N D - M A R K E T S H AV E P O S I T I V E TA I LW I N D S A C R O S S E A C H S E G M E N T A S U N I T S A L E S C O N T I N U E T O T R E N D T O W A R D P R E - R E C E S S I O N L E V E L S
Growing End-Markets Benefit from Incremental Pent-Up Demand
Pre-Recession Average1
11
Pre-Recession Average3
Pre-Recession Average3
0
1,000
2,000
3,000
4,000
5,000
6,000
'06 '09 '12 '15 '16 '170
1,000
2,000
3,000
4,000
5,000
6,000
7,000
'06 '09 '12 '15 '16 '17
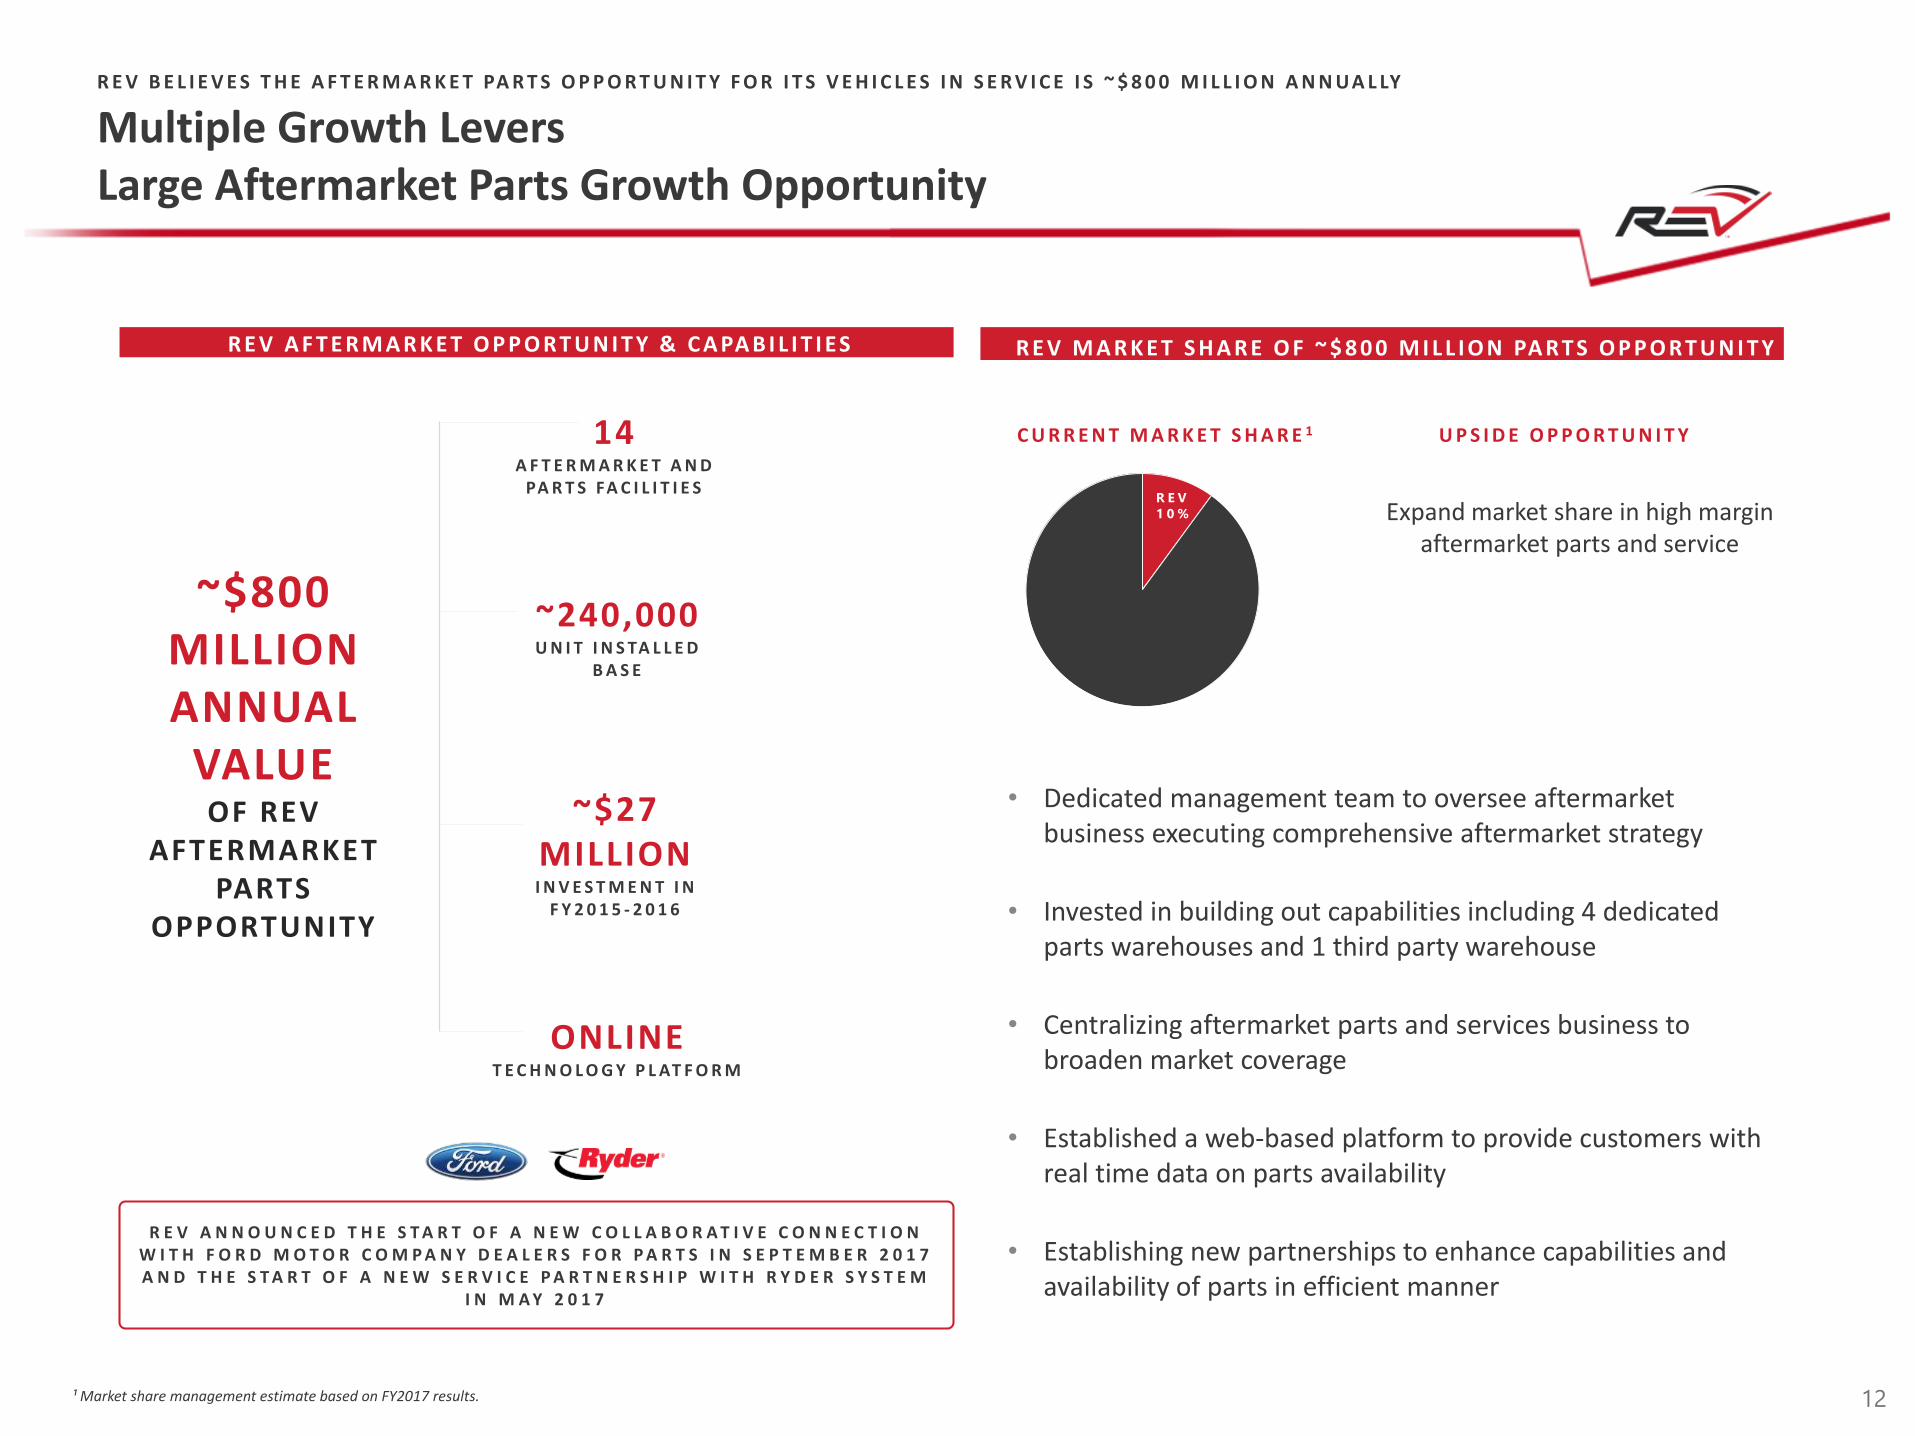
¹ Market share management estimate based on FY2017 results.
R E V A F T E R M A R K E T O P P O R T U N I T Y & C A PA B I L I T I ES R E V M A R K E T S H A R E O F ~ $ 8 0 0 M I L L I O N PA R T S O P P O R T U N I T Y
C U R R E N T M A R K E T S H A R E 1 U P S I D E O P P O R T U N I T Y
Expand market share in high margin aftermarket parts and service
• Dedicated management team to oversee aftermarket business executing comprehensive aftermarket strategy
• Invested in building out capabilities including 4 dedicated parts warehouses and 1 third party warehouse
• Centralizing aftermarket parts and services business to broaden market coverage
• Established a web-based platform to provide customers with real time data on parts availability
• Establishing new partnerships to enhance capabilities and availability of parts in efficient manner
R E V
1 0 %
~$800 MILLIONANNUAL
VALUE OF REV
AFTERMARKET PARTS
OPPORTUNITY
14A F T E R M A R K E T A N D
PA R T S FA C I L I T I E S
~240,000U N I T I N S TA L L E D
B A S E
~$27 MILLIONI N V E S T M E N T I N
F Y 2 0 1 5 - 2 0 1 6
ONLINET E C H N O L O G Y P L AT F O R M
R E V A N N O U N C E D T H E S T A R T O F A N E W C O L L A B O R A T I V E C O N N E C T I O N W I T H F O R D M O T O R C O M P A N Y D E A L E R S F O R P A R T S I N S E P T E M B E R 2 0 1 7 A N D T H E S T A R T O F A N E W S E R V I C E P A R T N E R S H I P W I T H R Y D E R S Y S T E M
I N M A Y 2 0 1 7
12
R E V B E L I E V E S T H E A F T E R M A R K E T PA R T S O P P O R T U N I T Y F O R I T S V E H I C L E S I N S E R V I C E I S ~ $ 8 0 0 M I L L I O N A N N UA L LY
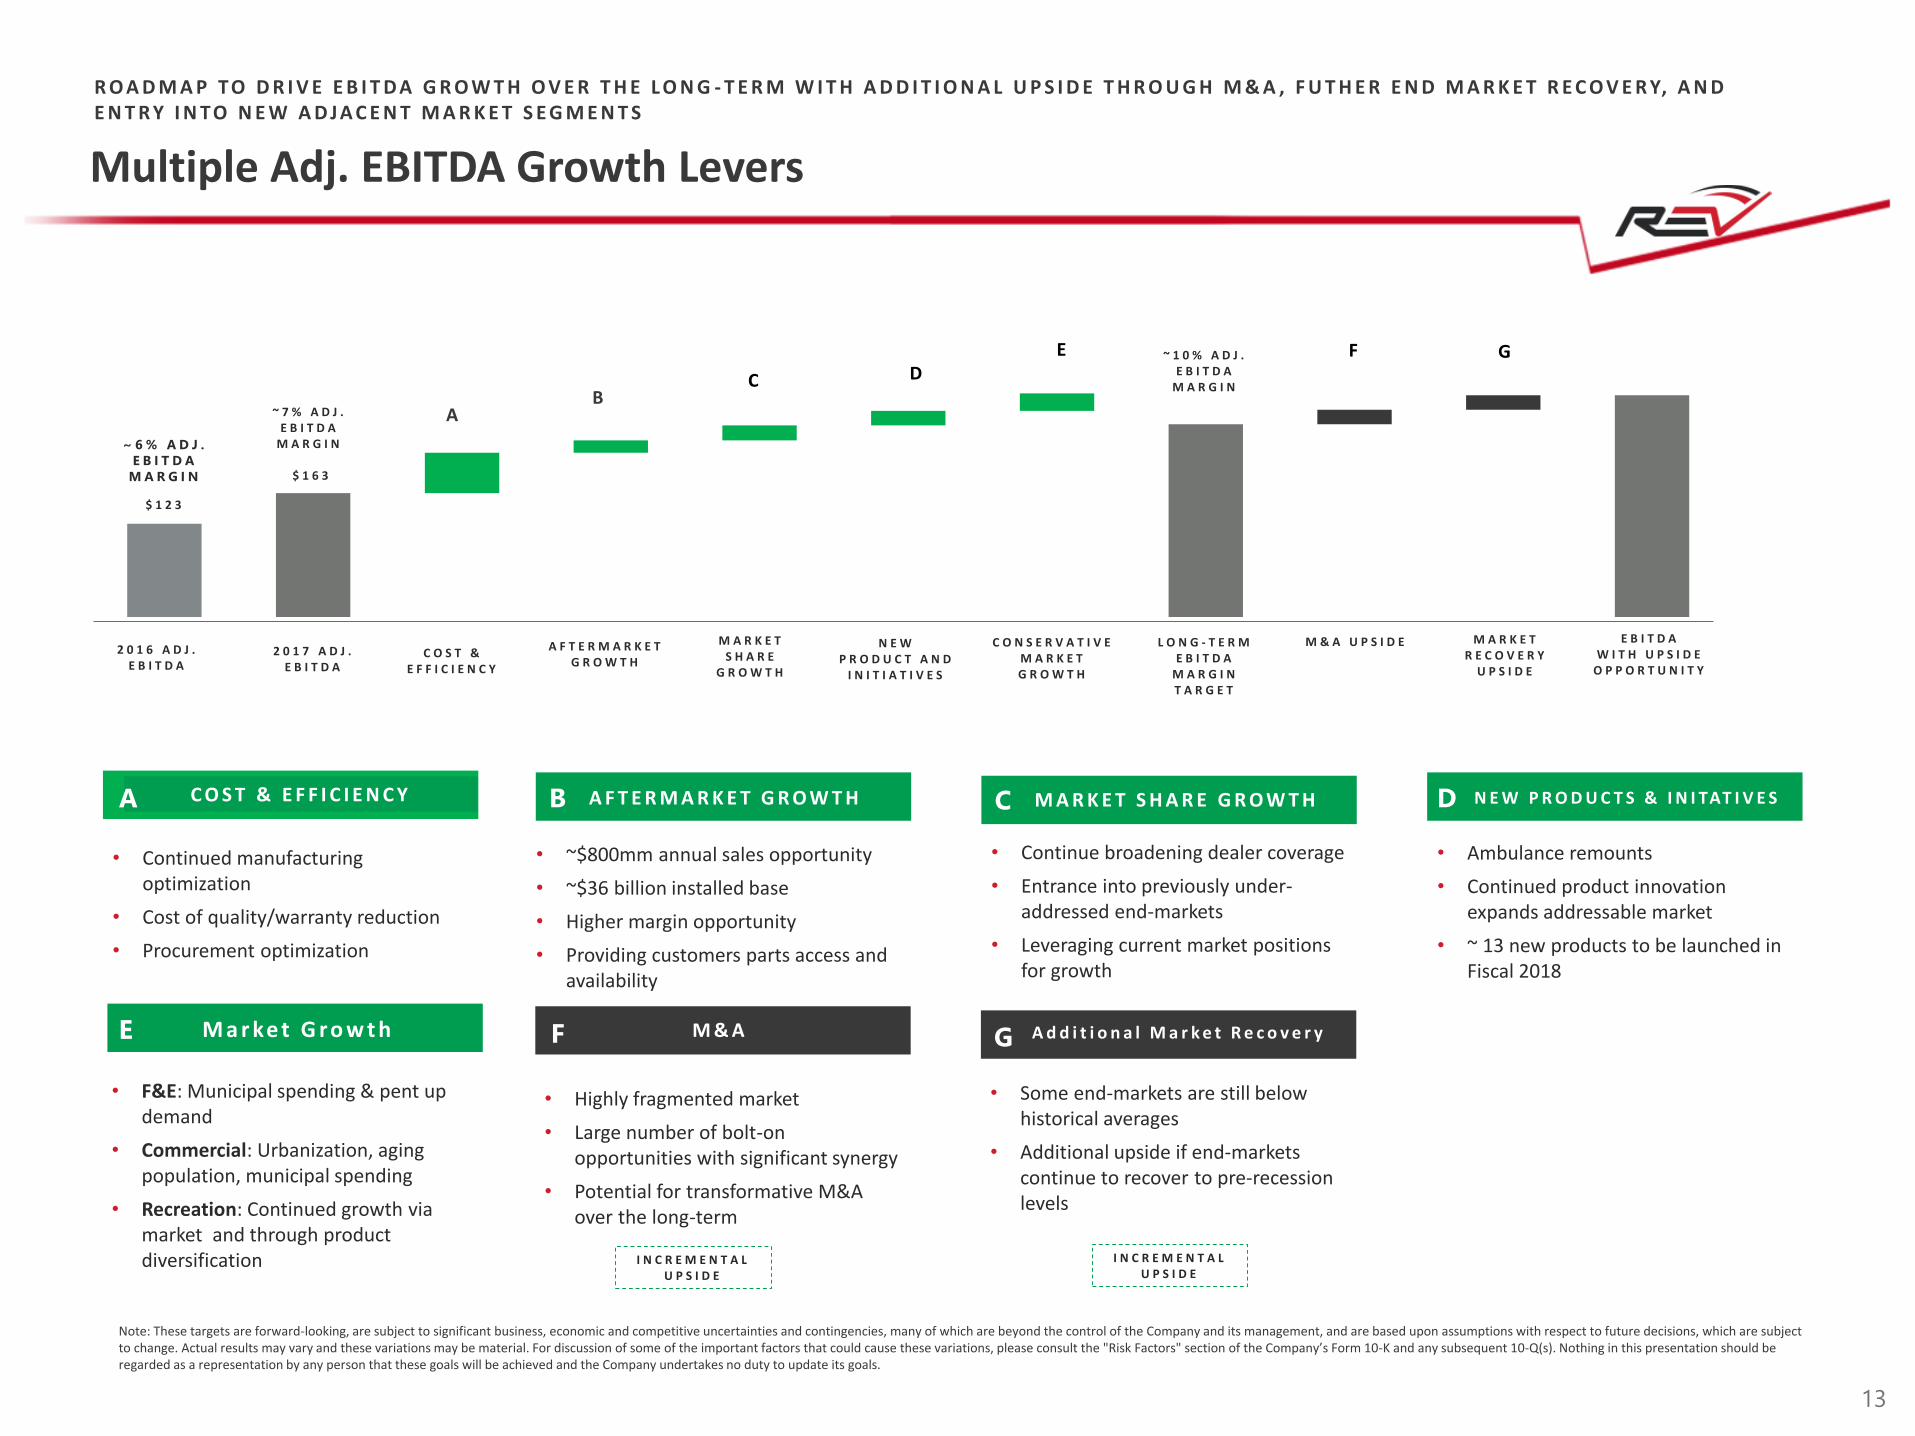
Multiple Growth LeversLarge Aftermarket Parts Growth Opportunity
AB
C DE F G
2 0 1 6 A D J .E B I T D A
2 0 1 7 A D J . E B I T D A
A F T E R M A R K E TG R O W T H
M A R K E TS H A R E
G R O W T H
N E W P R O D U C T A N D
I N I T I A T I V E S
C O N S E R V A T I V EM A R K E TG R O W T H
L O N G - T E R ME B I T D A
M A R G I NT A R G E T
M & A U P S I D E M A R K E TR E C O V E R Y
U P S I D E
E B I T D AW I T H U P S I D E
O P P O R T U N I T Y
$ 1 2 3
$ 1 6 3
~ 7 % A D J .E B I T D A
M A R G I N
~ 1 0 % A D J .E B I T D A
M A R G I N
13
Note: These targets are forward-looking, are subject to significant business, economic and competitive uncertainties and contingencies, many of which are beyond the control of the Company and its management, and are based upon assumptions with respect to future decisions, which are subject to change. Actual results may vary and these variations may be material. For discussion of some of the important factors that could cause these variations, please consult the "Risk Factors" section of the Company’s Form 10-K and any subsequent 10-Q(s). Nothing in this presentation should be regarded as a representation by any person that these goals will be achieved and the Company undertakes no duty to update its goals.
~ 6 % A D J .
E B I T D A
M A R G I N
C O S T & E F F I C I E N C Y A F T E R M A R K E T G R O W T H
• Continued manufacturing optimization
• Cost of quality/warranty reduction
• Procurement optimization
• ~$800mm annual sales opportunity
• ~$36 billion installed base
• Higher margin opportunity
• Providing customers parts access and availability
A B M A R K E T S H A R E G R O W T H
• Continue broadening dealer coverage
• Entrance into previously under-addressed end-markets
• Leveraging current market positions for growth
C N E W P R O D U C T S & I N I TAT I V E S
• Ambulance remounts
• Continued product innovation expands addressable market
• ~ 13 new products to be launched in Fiscal 2018
D
M a r ke t G ro w t h
• F&E: Municipal spending & pent up demand
• Commercial: Urbanization, aging population, municipal spending
• Recreation: Continued growth via market and through product diversification
E M & A
• Highly fragmented market
• Large number of bolt-on opportunities with significant synergy
• Potential for transformative M&A over the long-term
F A d d i t i o n a l M a r k e t R e c o v e r y
• Some end-markets are still below historical averages
• Additional upside if end-markets continue to recover to pre-recession levels
G
I N C R E M E N T A L U P S I D E
I N C R E M E N T A L U P S I D E
R O A D M A P TO D R I V E E B I T D A G R O W T H O V E R T H E L O N G - T E R M W I T H A D D I T I O N A L U P S I D E T H R O U G H M & A , F U T H E R E N D M A R K E T R E C O V E R Y, A N D E N T R Y I N TO N E W A D J A C E N T M A R K E T S E G M E N T S
Multiple Adj. EBITDA Growth Levers
C O S T &E F F I C I E N C Y

FINANCIAL OVERVIEW
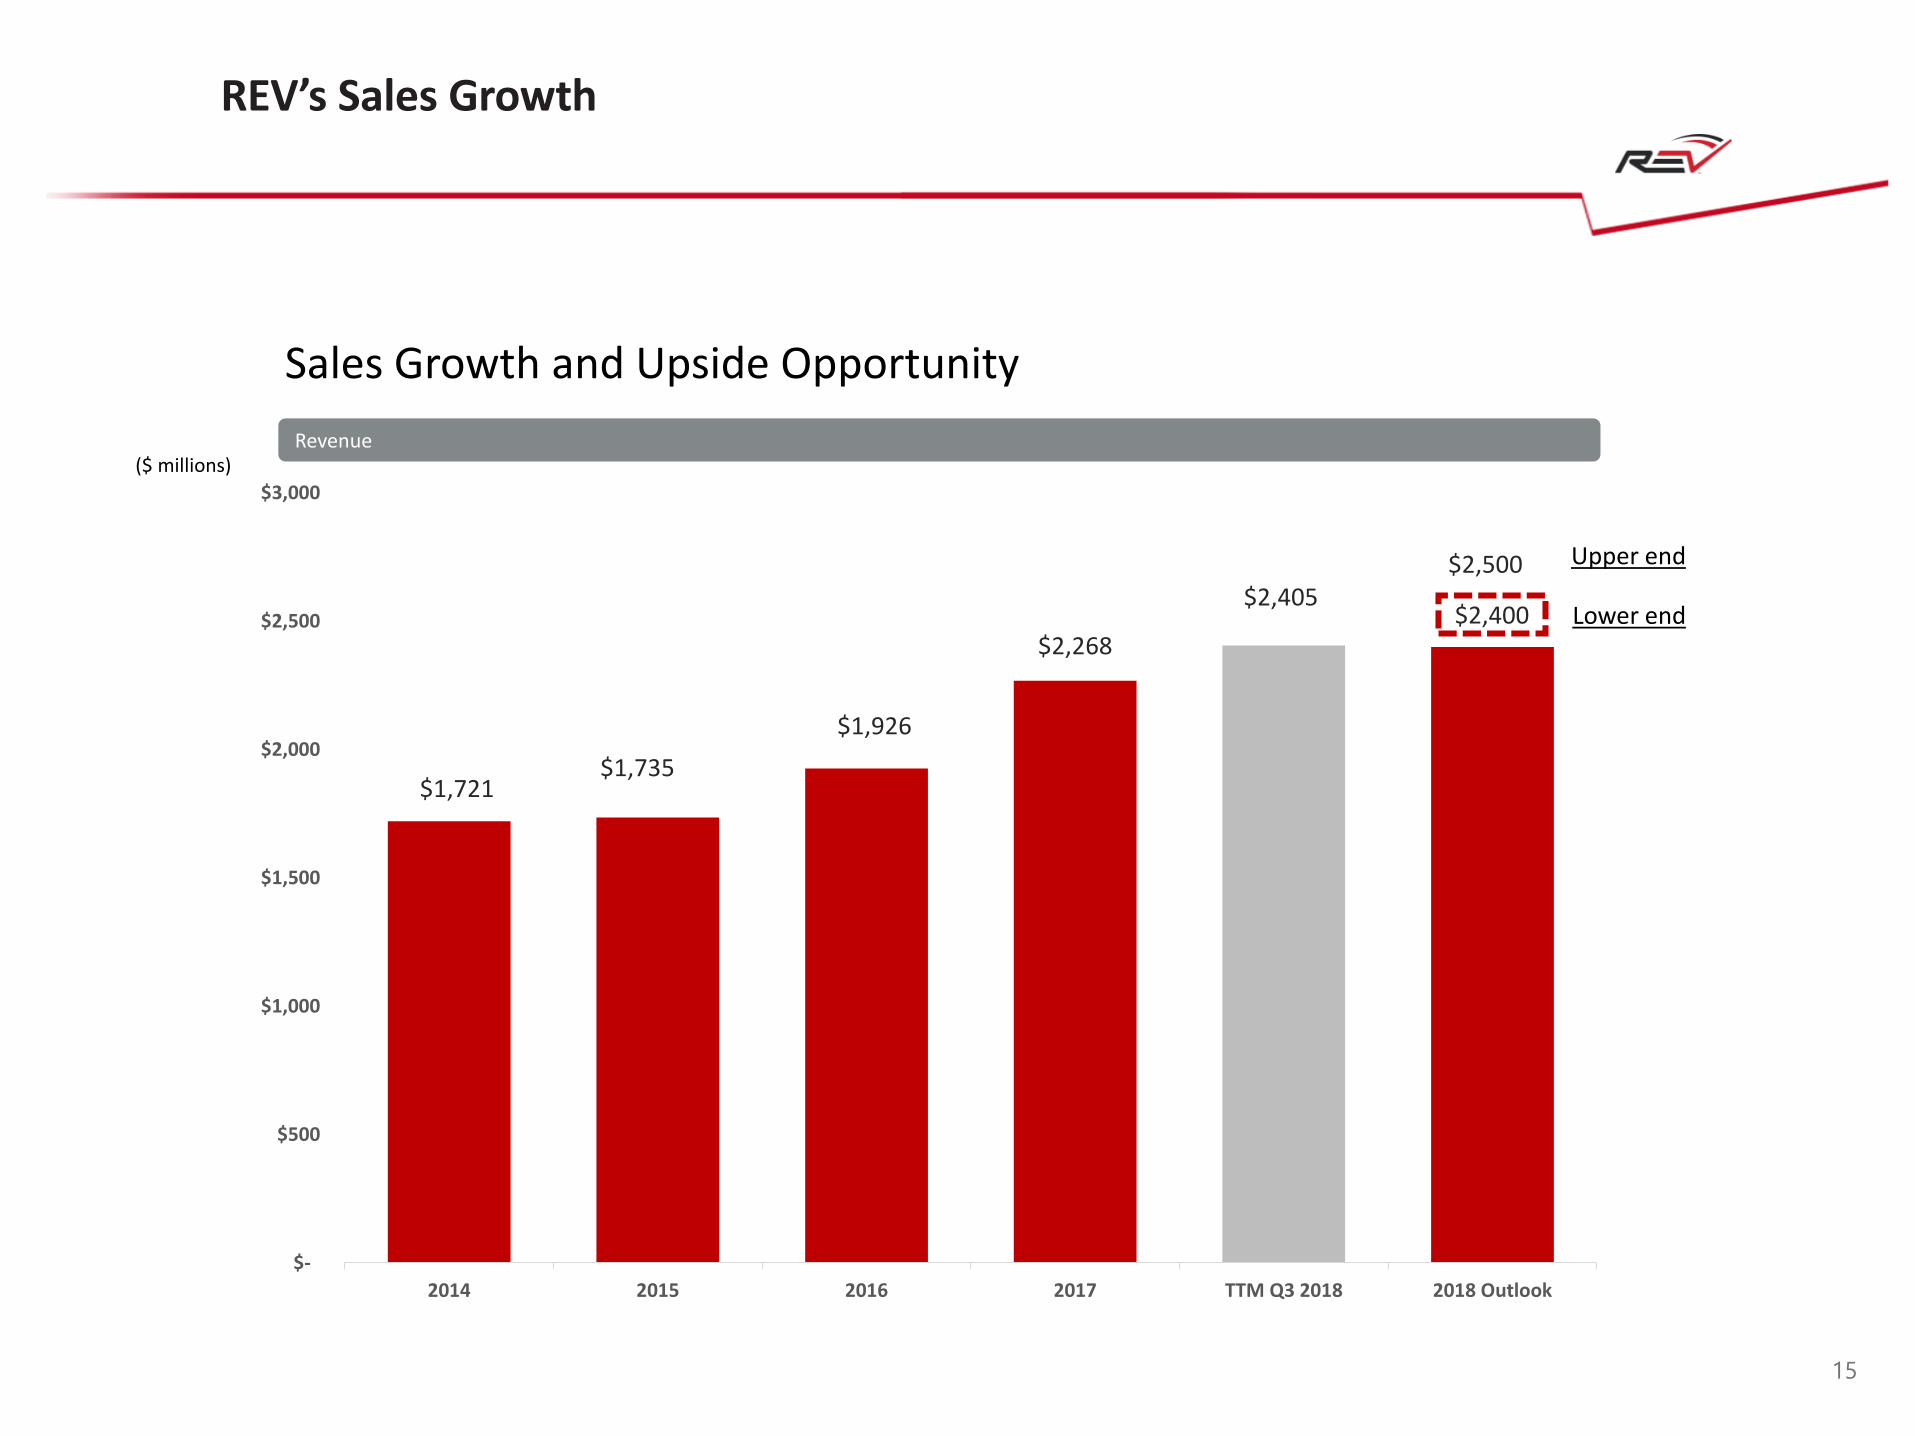
Sales Growth and Upside Opportunity
REV’s Sales Growth
Revenue($ millions)
15
$-
$500
$1,000
$1,500
$2,000
$2,500
$3,000
2014 2015 2016 2017 TTM Q3 2018 2018 Outlook
Upper end
Lower end
$2,500
$2,400
$1,721$1,735
$1,926
$2,268
$2,405
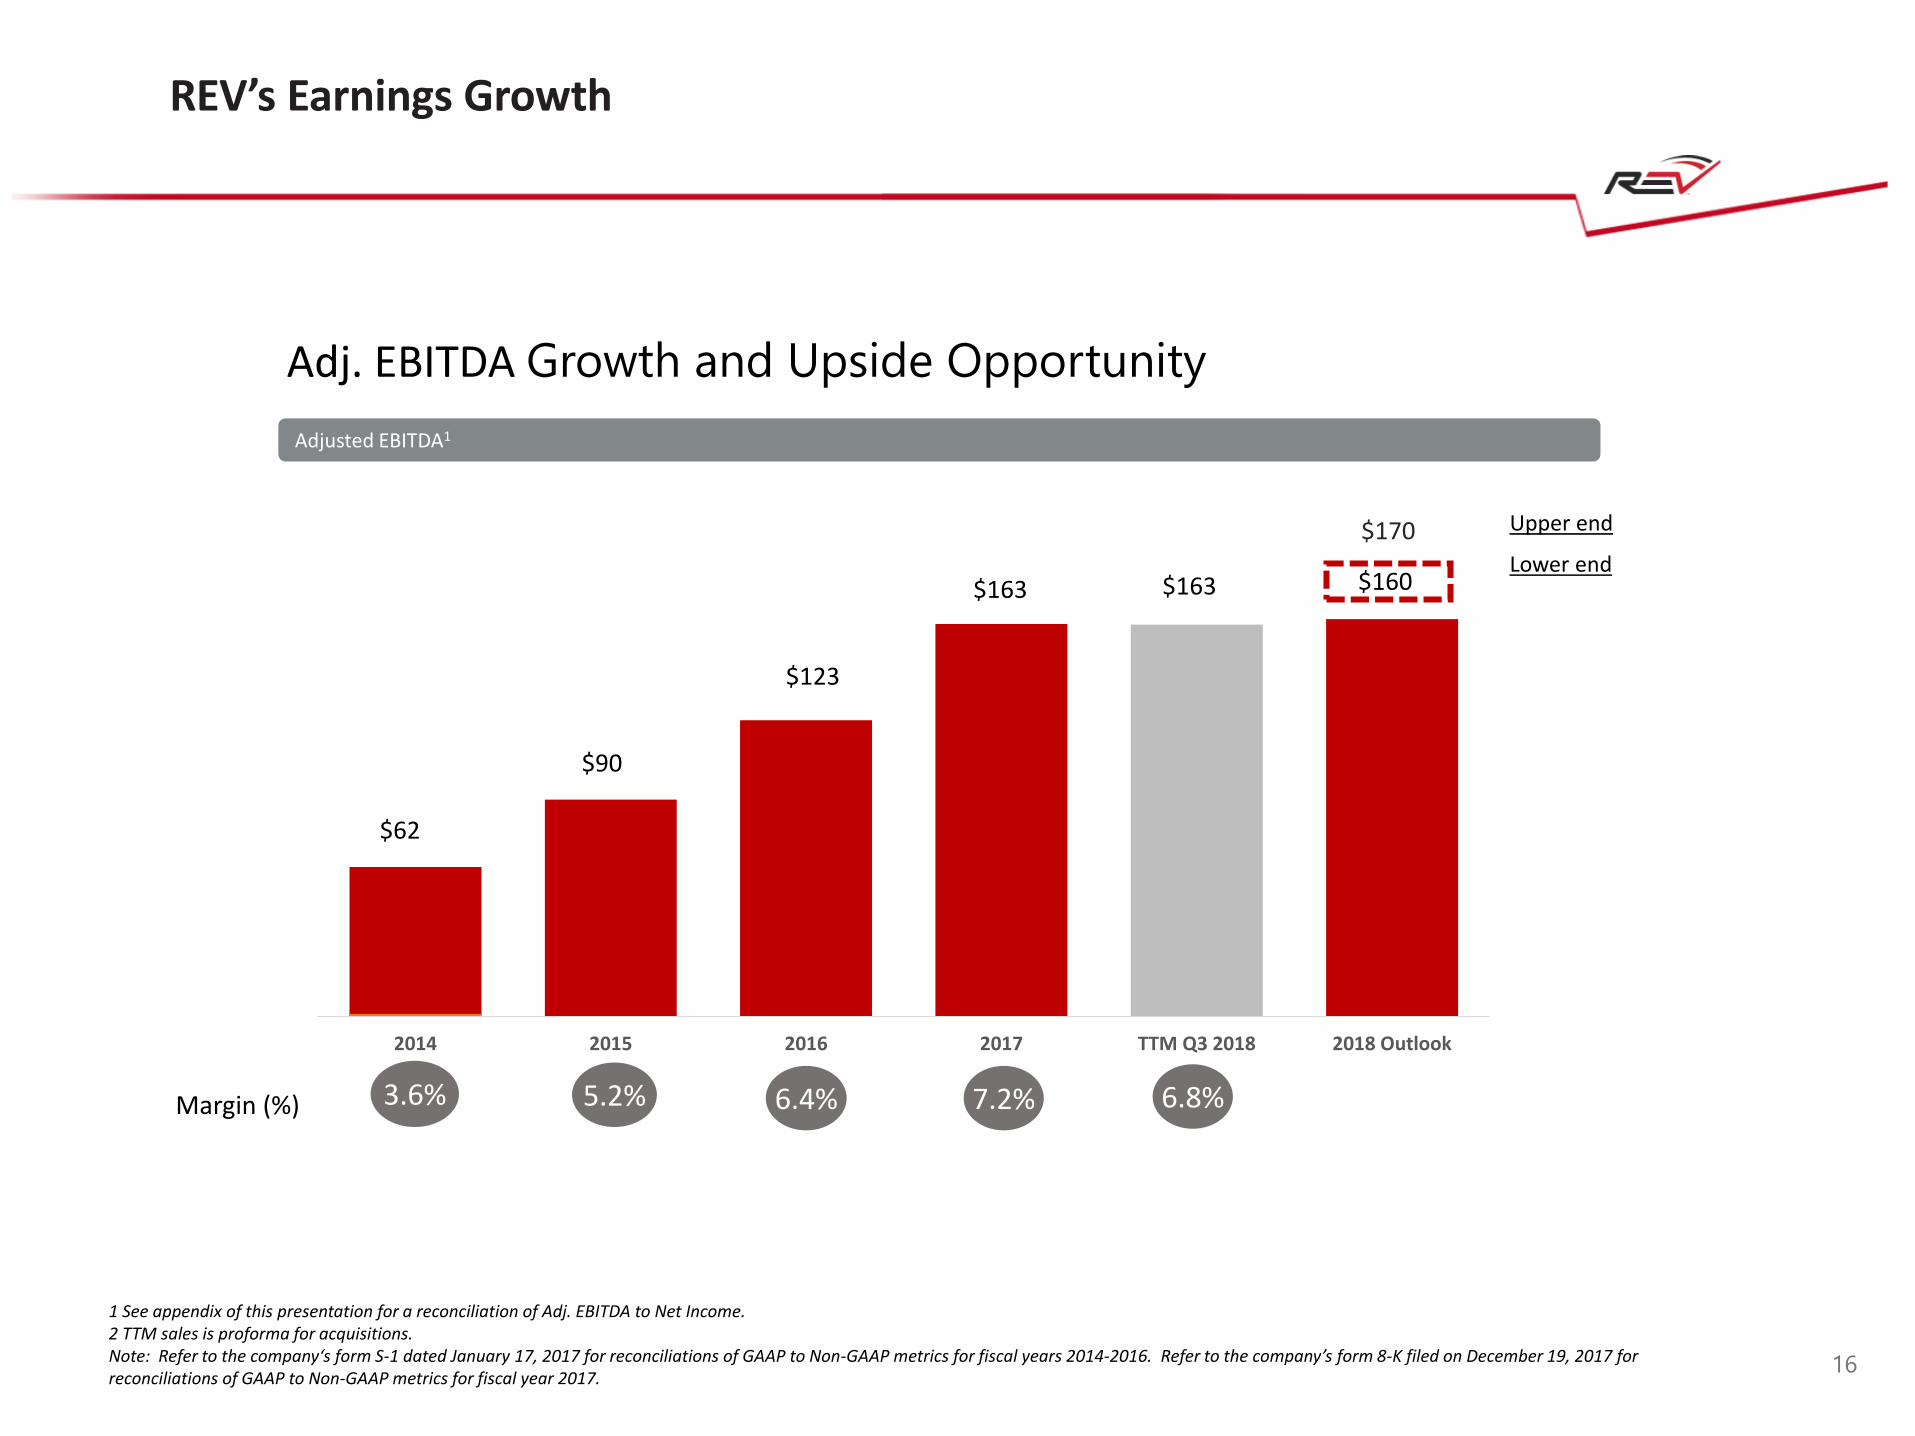
Adj. EBITDA Growth and Upside Opportunity
1 See appendix of this presentation for a reconciliation of Adj. EBITDA to Net Income. 2 TTM sales is proforma for acquisitions.Note: Refer to the company‘s form S-1 dated January 17, 2017 for reconciliations of GAAP to Non-GAAP metrics for fiscal years 2014-2016. Refer to the company’s form 8-K filed on December 19, 2017 for reconciliations of GAAP to Non-GAAP metrics for fiscal year 2017.
REV’s Earnings Growth
Adjusted EBITDA1
6.4%3.6% 5.2% 7.2%Margin (%)
16
6.8%
2014 2015 2016 2017 TTM Q3 2018 2018 Outlook
Upper end
Lower end
$170
$160
$62
$90
$123
$163 $163

Balance Sheet Strength & Liquidity
• Focus to improve conversion of working capital to cash
• Existing debt reduced with excess cash
• Earnings growth drives increased liquidity
• Capacity to pursue opportunistic acquisitions
Net Debt Net Working Capital % Sales Total Net Leverage
$212 $208
$245 $268
$212
$427
2014 2015 2016 Q32017
2017 Q32018
1 Pro forma for acquisitionsNote: Net Debt equals total debt less cash and cash equivalents; Net working capital equals A/R + Inventory – A/P; Total leverage is calculated as Net Debt divided by Adjusted EBITDA and TTM Adjust EBITDA for quarter purposes.
$ in millions
17
1 1
16.2% 16.7%18.8%
24.9%
20.0%
24.4%
2014 2015 2016 Q32017
2017 Q32018
2014 2015 2016 Q32017
2017 Q32018
3.4x
2.3x1.9x
1.6x1.2x
2.7x
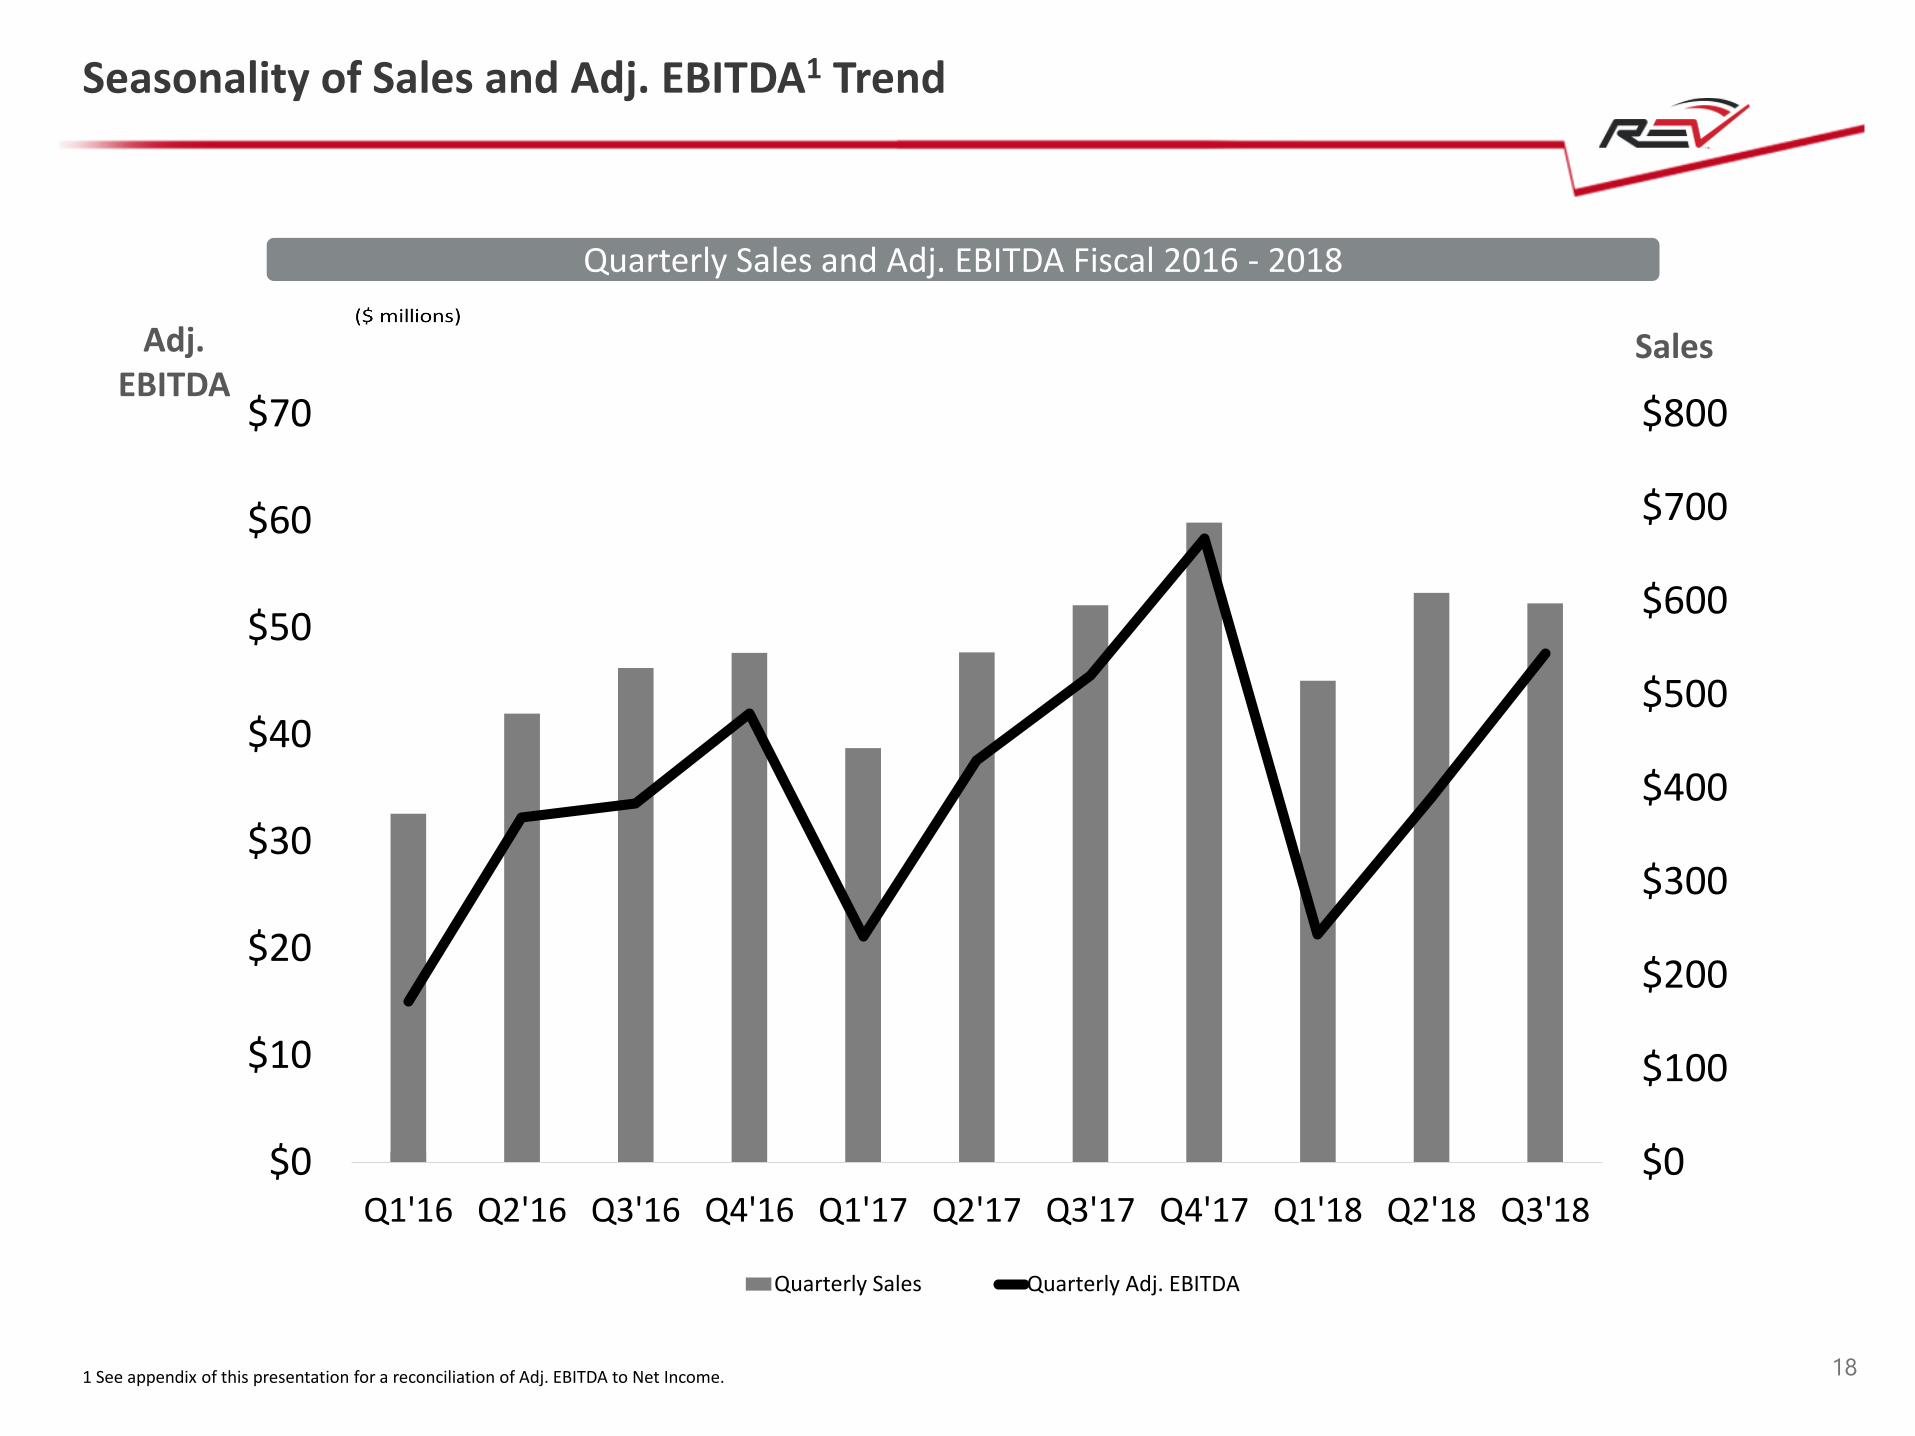
Seasonality of Sales and Adj. EBITDA1 Trend
Quarterly Sales and Adj. EBITDA Fiscal 2016 - 2018
18
SalesAdj. EBITDA
1 See appendix of this presentation for a reconciliation of Adj. EBITDA to Net Income.
$0
$100
$200
$300
$400
$500
$600
$700
$800
$0
$10
$20
$30
$40
$50
$60
$70
Q1'16 Q2'16 Q3'16 Q4'16 Q1'17 Q2'17 Q3'17 Q4'17 Q1'18 Q2'18 Q3'18
Quarterly Sales Quarterly Adj. EBITDA
R E C R E AT I O N
L O N G - T E R M TA R G E T SA D J U S T E D E B I T D A 1
Source: Company management.Note: Some targets are forward-looking, are subject to significant business, economic and competitive uncertainties and contingencies, many of which are beyond the control of the Company and its management, and are based upon assumptions with respect to future decisions, which are subject to change. Actual results may vary and these variations may be material. For discussion of some of the important factors that could cause these variations, please consult the "Risk Factors" section of the Company’s Form 10-K and any subsequent 10-Q(s). Nothing in this presentation should be regarded as a representation by any person that these goals will be achieved and the Company undertakes no duty to update its goals.
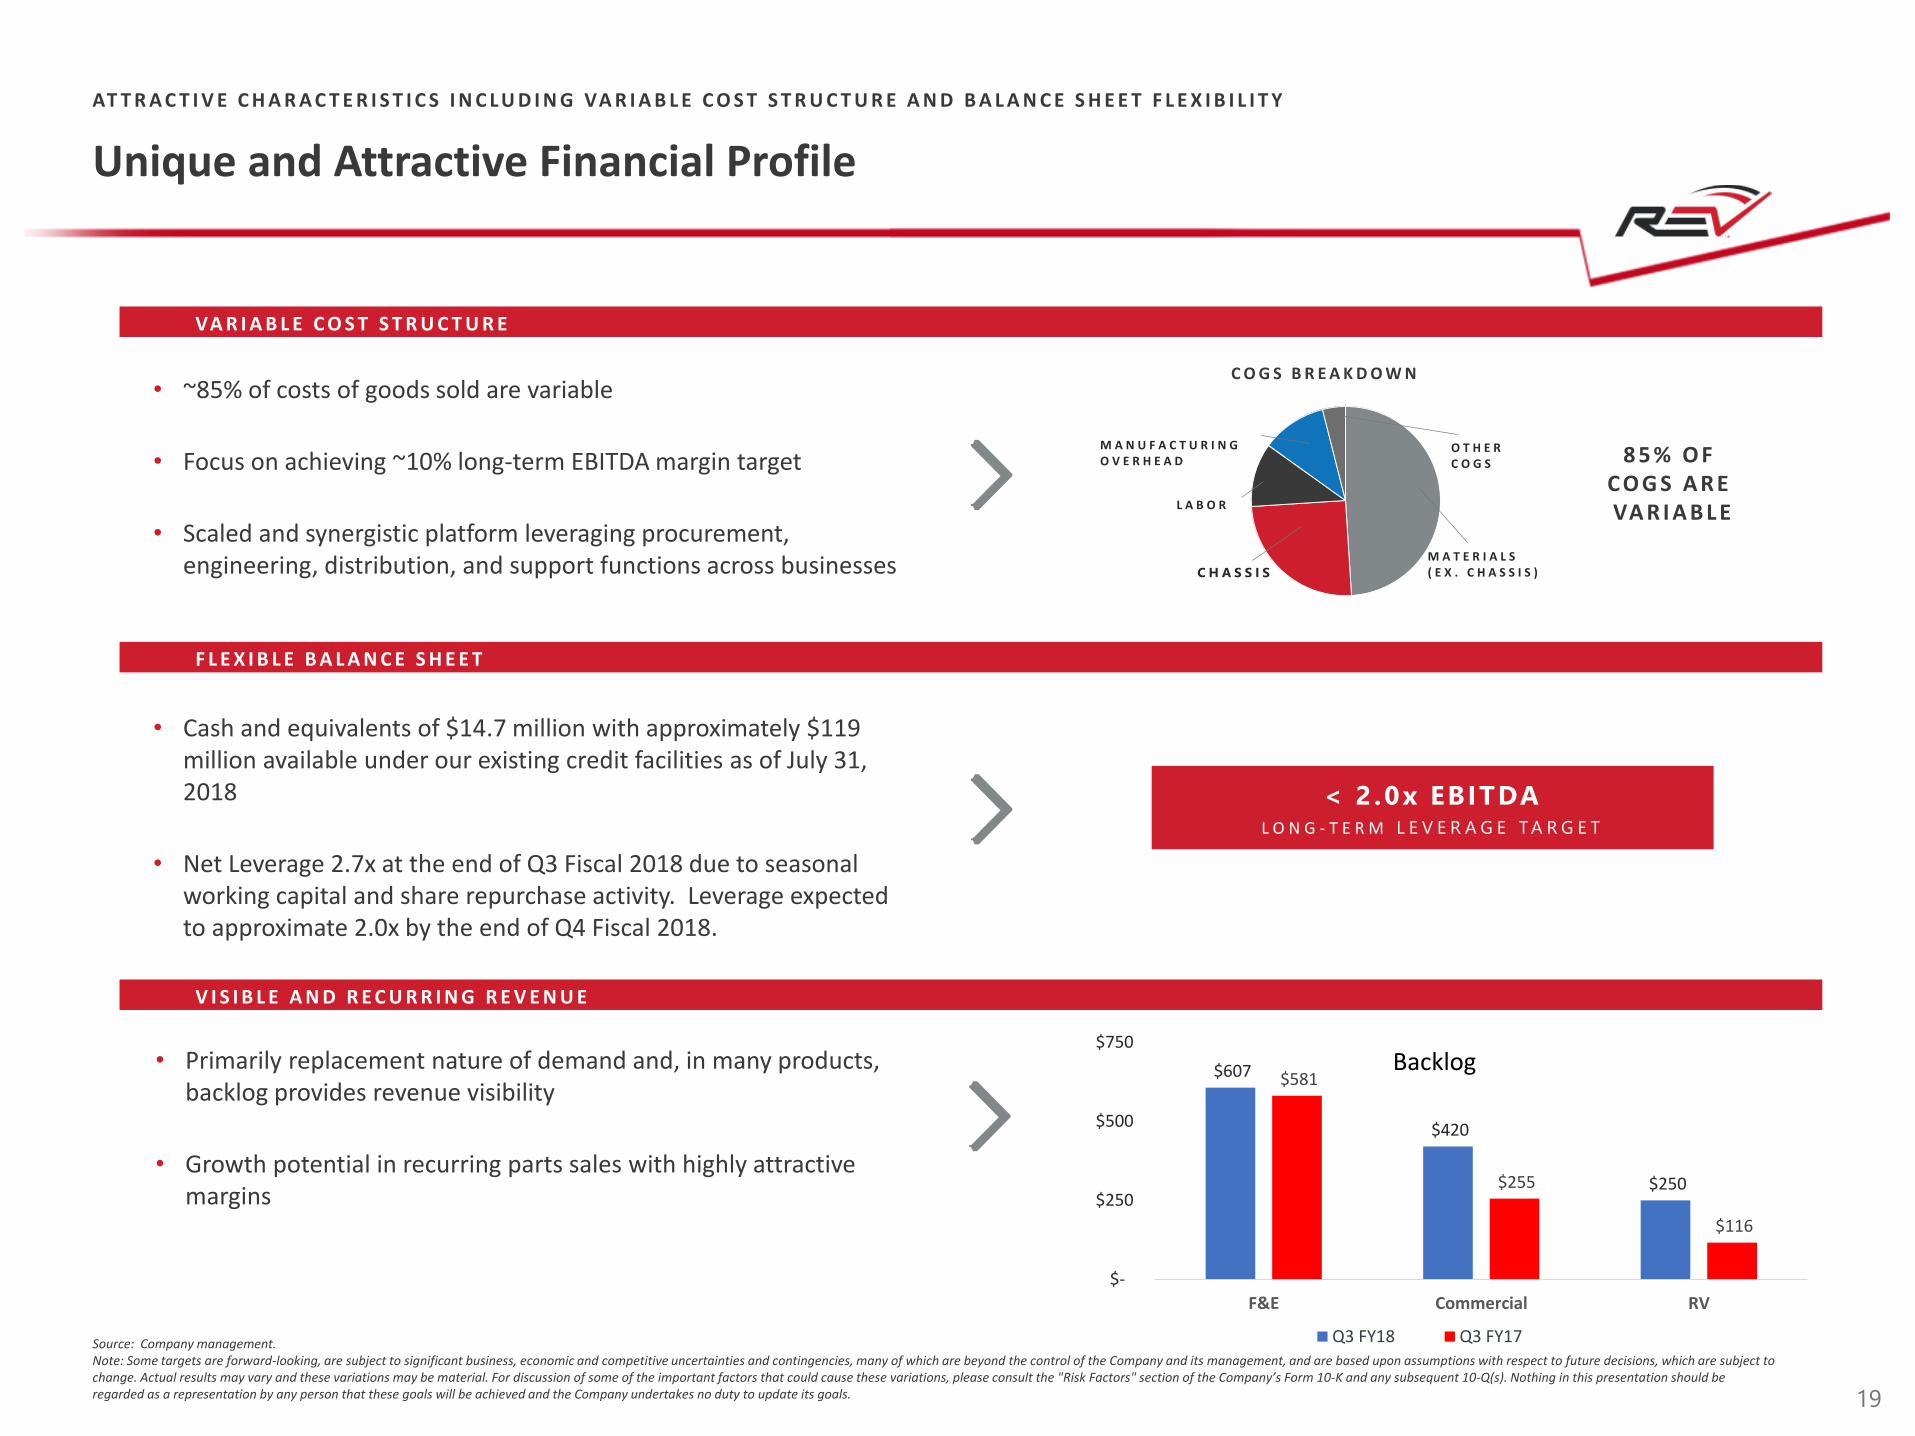
VA R I A B L E C O S T S T R U C T U R E
F L E X I B L E B A L A N C E S H E E T
V I S I B L E A N D R E C U R R I N G R E V E N U E
• ~85% of costs of goods sold are variable
• Focus on achieving ~10% long-term EBITDA margin target
• Scaled and synergistic platform leveraging procurement, engineering, distribution, and support functions across businesses
• Cash and equivalents of $14.7 million with approximately $119 million available under our existing credit facilities as of July 31, 2018
• Net Leverage 2.7x at the end of Q3 Fiscal 2018 due to seasonal working capital and share repurchase activity. Leverage expected to approximate 2.0x by the end of Q4 Fiscal 2018.
• Primarily replacement nature of demand and, in many products, backlog provides revenue visibility
• Growth potential in recurring parts sales with highly attractive margins
C O G S B R E A K D O W N
M A T E R I A L S( E X . C H A S S I S )C H A S S I S
L A B O R
M A N U F A C T U R I N GO V E R H E A D
O T H E RC O G S 8 5 % O F
C O G S A R E VA R I A B L E
< 2.0x EBITDAL O N G - T E R M L E V E R A G E T A R G E T
19
AT T R A C T I V E C H A R A C T E R I S T I C S I N C L U D I N G VA R I A B L E C O S T S T R U C T U R E A N D B A L A N C E S H E E T F L E X I B I L I T Y
Unique and Attractive Financial Profile
$607
$420
$250
$581
$255
$116
$-
$250
$500
$750
F&E Commercial RV
Q3 FY18 Q3 FY17
Backlog
Third Quarter Fiscal 2018 Summary
• Third quarter results positively impacted by the following items:
- Increased School Bus sales activity
- Strength of Class B, high-end Class C and Towables end markets along with improving profitability
- Impact of price increases and cost reductions implemented at the end of second quarter
• Third quarter results negatively impacted by the following items:
- Chassis availability challenges continued
- Other materials shortages due to timing of chassis deliveries and extended supplier lead times
- Delayed timing of Class A RV new product introductions
- Underperformance of certain product lines, including specialty and parts
• Adjusted EBITDA margin of 8.0% increased compared to prior year period, due to previously implemented price increases and cost reduction efforts yielding positive results
• Net Income increased 20.4% year-over-year to $18.3 million, driven by benefit of tax reform
• Backlog of $1.3 billion vs. $1.1 billion at the start of the year, and $952 million in the prior year period
• Revised fiscal year 2018 guidance range to reflect year-to-date performance, as well as expectations for continued chassis and material availability challenges in the fourth quarter
• Repurchased approximately $41 million of REVG stock during the third quarter; board subsequently increased the share repurchase authorization $50 million, bringing total available authorization to approximately $55 million
20
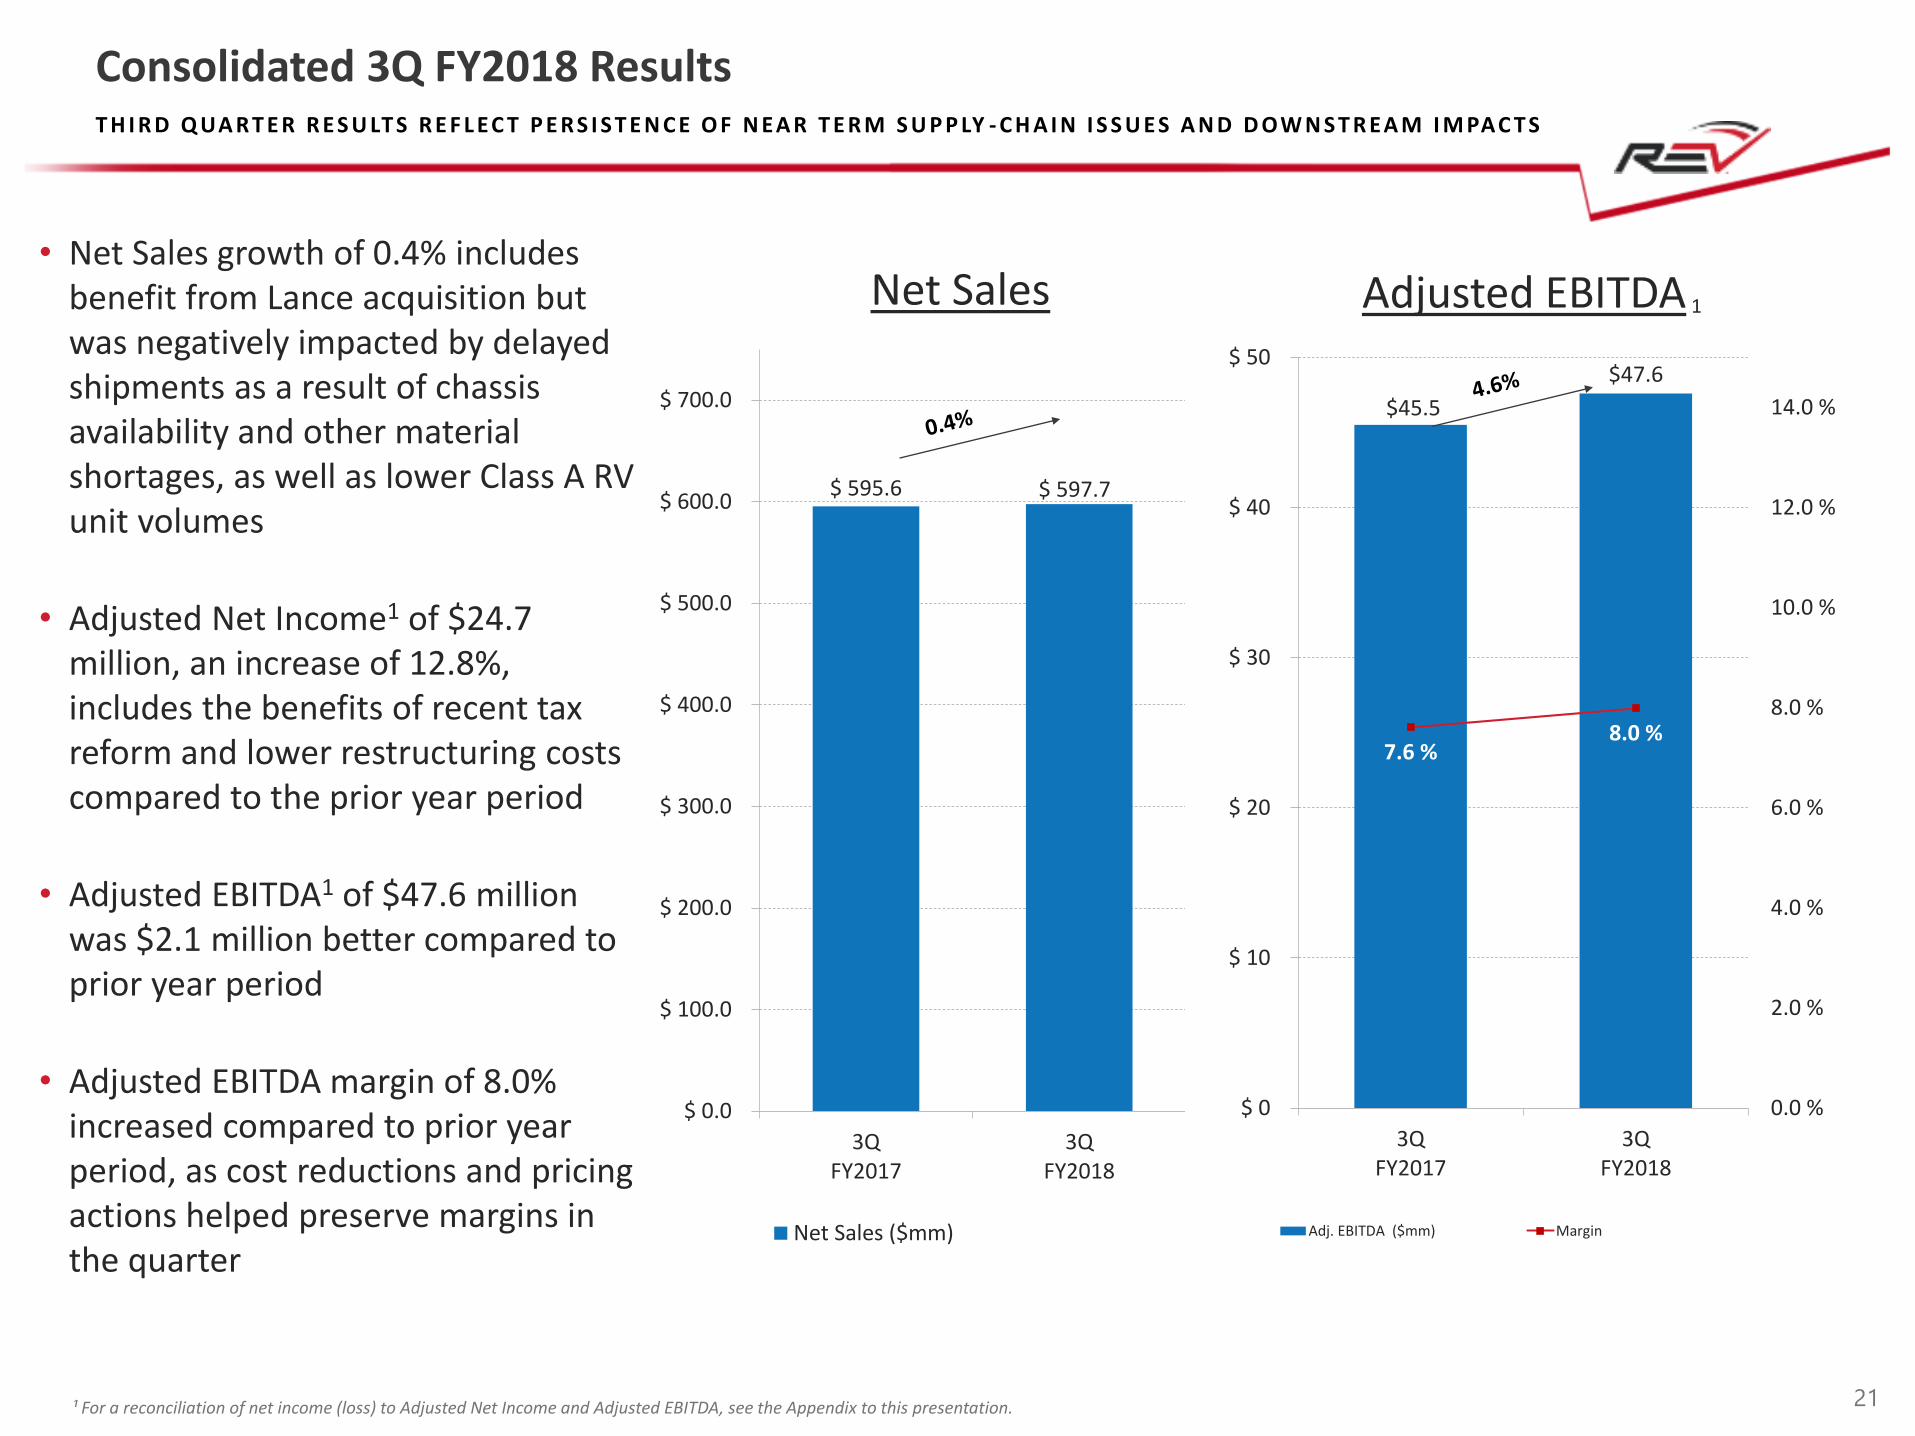
$ 595.6 $ 597.7
$ 0.0
$ 100.0
$ 200.0
$ 300.0
$ 400.0
$ 500.0
$ 600.0
$ 700.0
3QFY2017
3QFY2018
Net Sales ($mm)
$45.5
$47.6
7.6 %8.0 %
0.0 %
2.0 %
4.0 %
6.0 %
8.0 %
10.0 %
12.0 %
14.0 %
$ 0
$ 10
$ 20
$ 30
$ 40
$ 50
3QFY2017
3QFY2018
Adj. EBITDA ($mm) Margin
21
Net Sales Adjusted EBITDA 1
T H I R D Q UA R T E R R E S U LT S R E F L EC T P E R S I S T E N C E O F N EA R T E R M S U P P LY - C H A I N I S S U E S A N D D OW N S T R EA M I M PAC T S
• Net Sales growth of 0.4% includes benefit from Lance acquisition but was negatively impacted by delayed shipments as a result of chassis availability and other material shortages, as well as lower Class A RV unit volumes
• Adjusted Net Income1 of $24.7 million, an increase of 12.8%, includes the benefits of recent tax reform and lower restructuring costs compared to the prior year period
• Adjusted EBITDA1 of $47.6 million was $2.1 million better compared to prior year period
• Adjusted EBITDA margin of 8.0% increased compared to prior year period, as cost reductions and pricing actions helped preserve margins in the quarter
¹ For a reconciliation of net income (loss) to Adjusted Net Income and Adjusted EBITDA, see the Appendix to this presentation.
Consolidated 3Q FY2018 Results
¹ For a reconciliation of net income (loss) to Adjusted Net Income and Adjusted EBITDA, see the Appendix to this presentation.
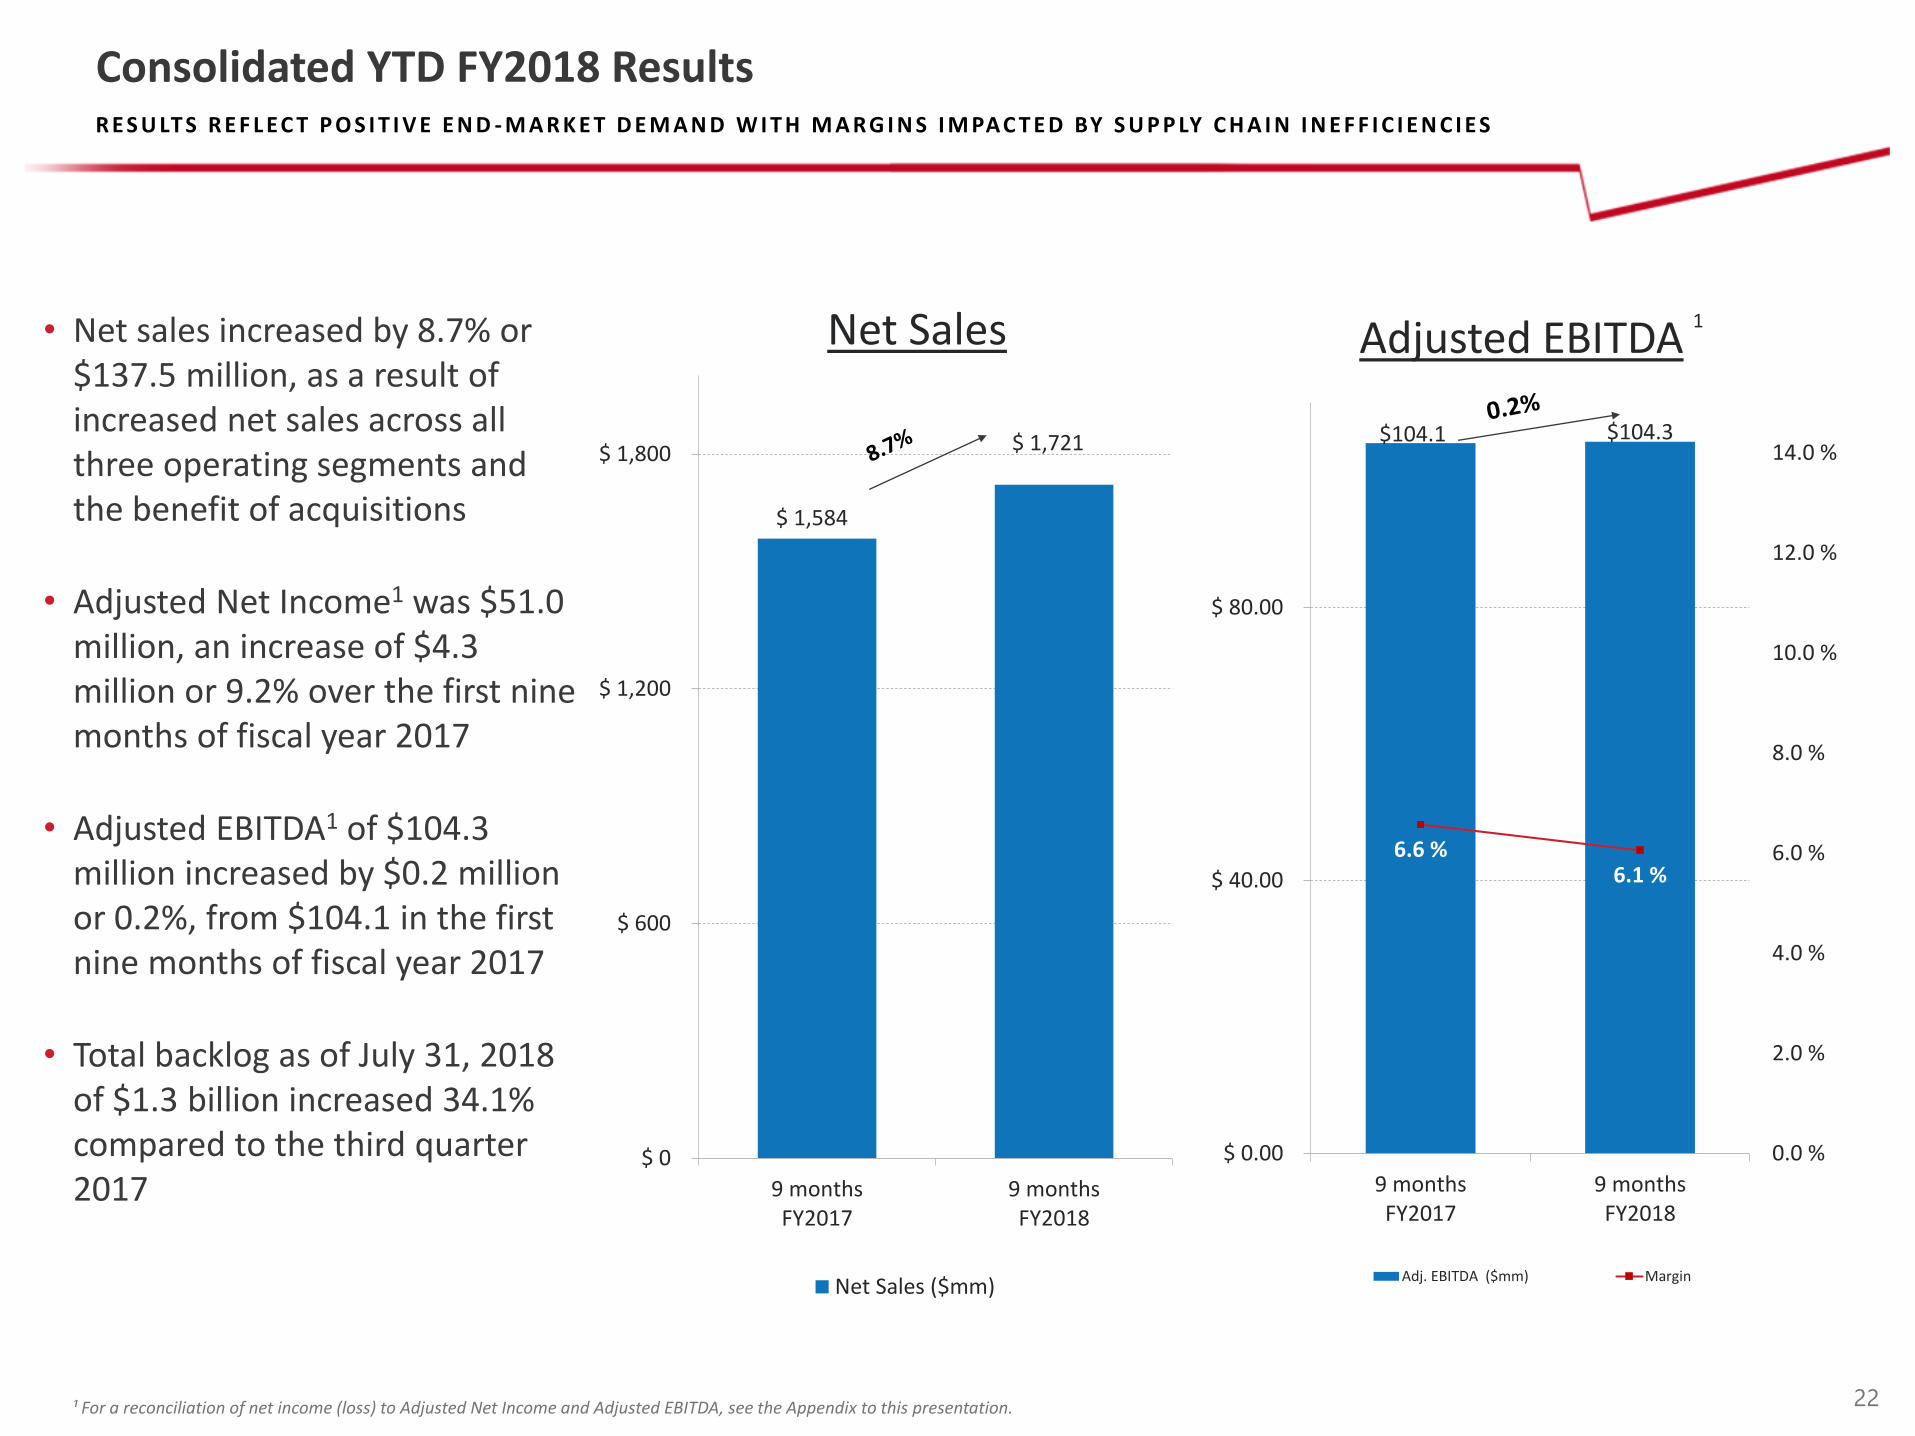
$ 1,584
$ 1,721
$ 0
$ 600
$ 1,200
$ 1,800
9 monthsFY2017
9 monthsFY2018
Net Sales ($mm)
Consolidated YTD FY2018 Results
$104.1 $104.3
6.6 %6.1 %
0.0 %
2.0 %
4.0 %
6.0 %
8.0 %
10.0 %
12.0 %
14.0 %
$ 0.00
$ 40.00
$ 80.00
9 monthsFY2017
9 monthsFY2018
Adj. EBITDA ($mm) Margin
22
Net Sales Adjusted EBITDA1• Net sales increased by 8.7% or
$137.5 million, as a result of increased net sales across all three operating segments and the benefit of acquisitions
• Adjusted Net Income1 was $51.0 million, an increase of $4.3 million or 9.2% over the first nine months of fiscal year 2017
• Adjusted EBITDA1 of $104.3 million increased by $0.2 million or 0.2%, from $104.1 in the first nine months of fiscal year 2017
• Total backlog as of July 31, 2018 of $1.3 billion increased 34.1% compared to the third quarter 2017
R E S U LT S R E F L EC T P O S I T I V E E N D - M A R K E T D E M A N D W I T H M A R G I N S I M PAC T E D BY S U P P LY C H A I N I N E F F I C I E N C I E S

Third Quarter Adjusted EBITDA Bridge
23
100% -8%
-8%
+3% 88%
• Chassis supply issues - impact of lower sales of ambulance, shuttle bus and Class B RV units due to chassis availability
• Material shortages - impact of lengthening material lead times & impact of material shortages
• Other improvements – increased volumes and profitability of RV businesses and lower corporate expenses
Total of approximately 570 vehicle shipments deferred out of the third quarter due to chassis and other material shortages
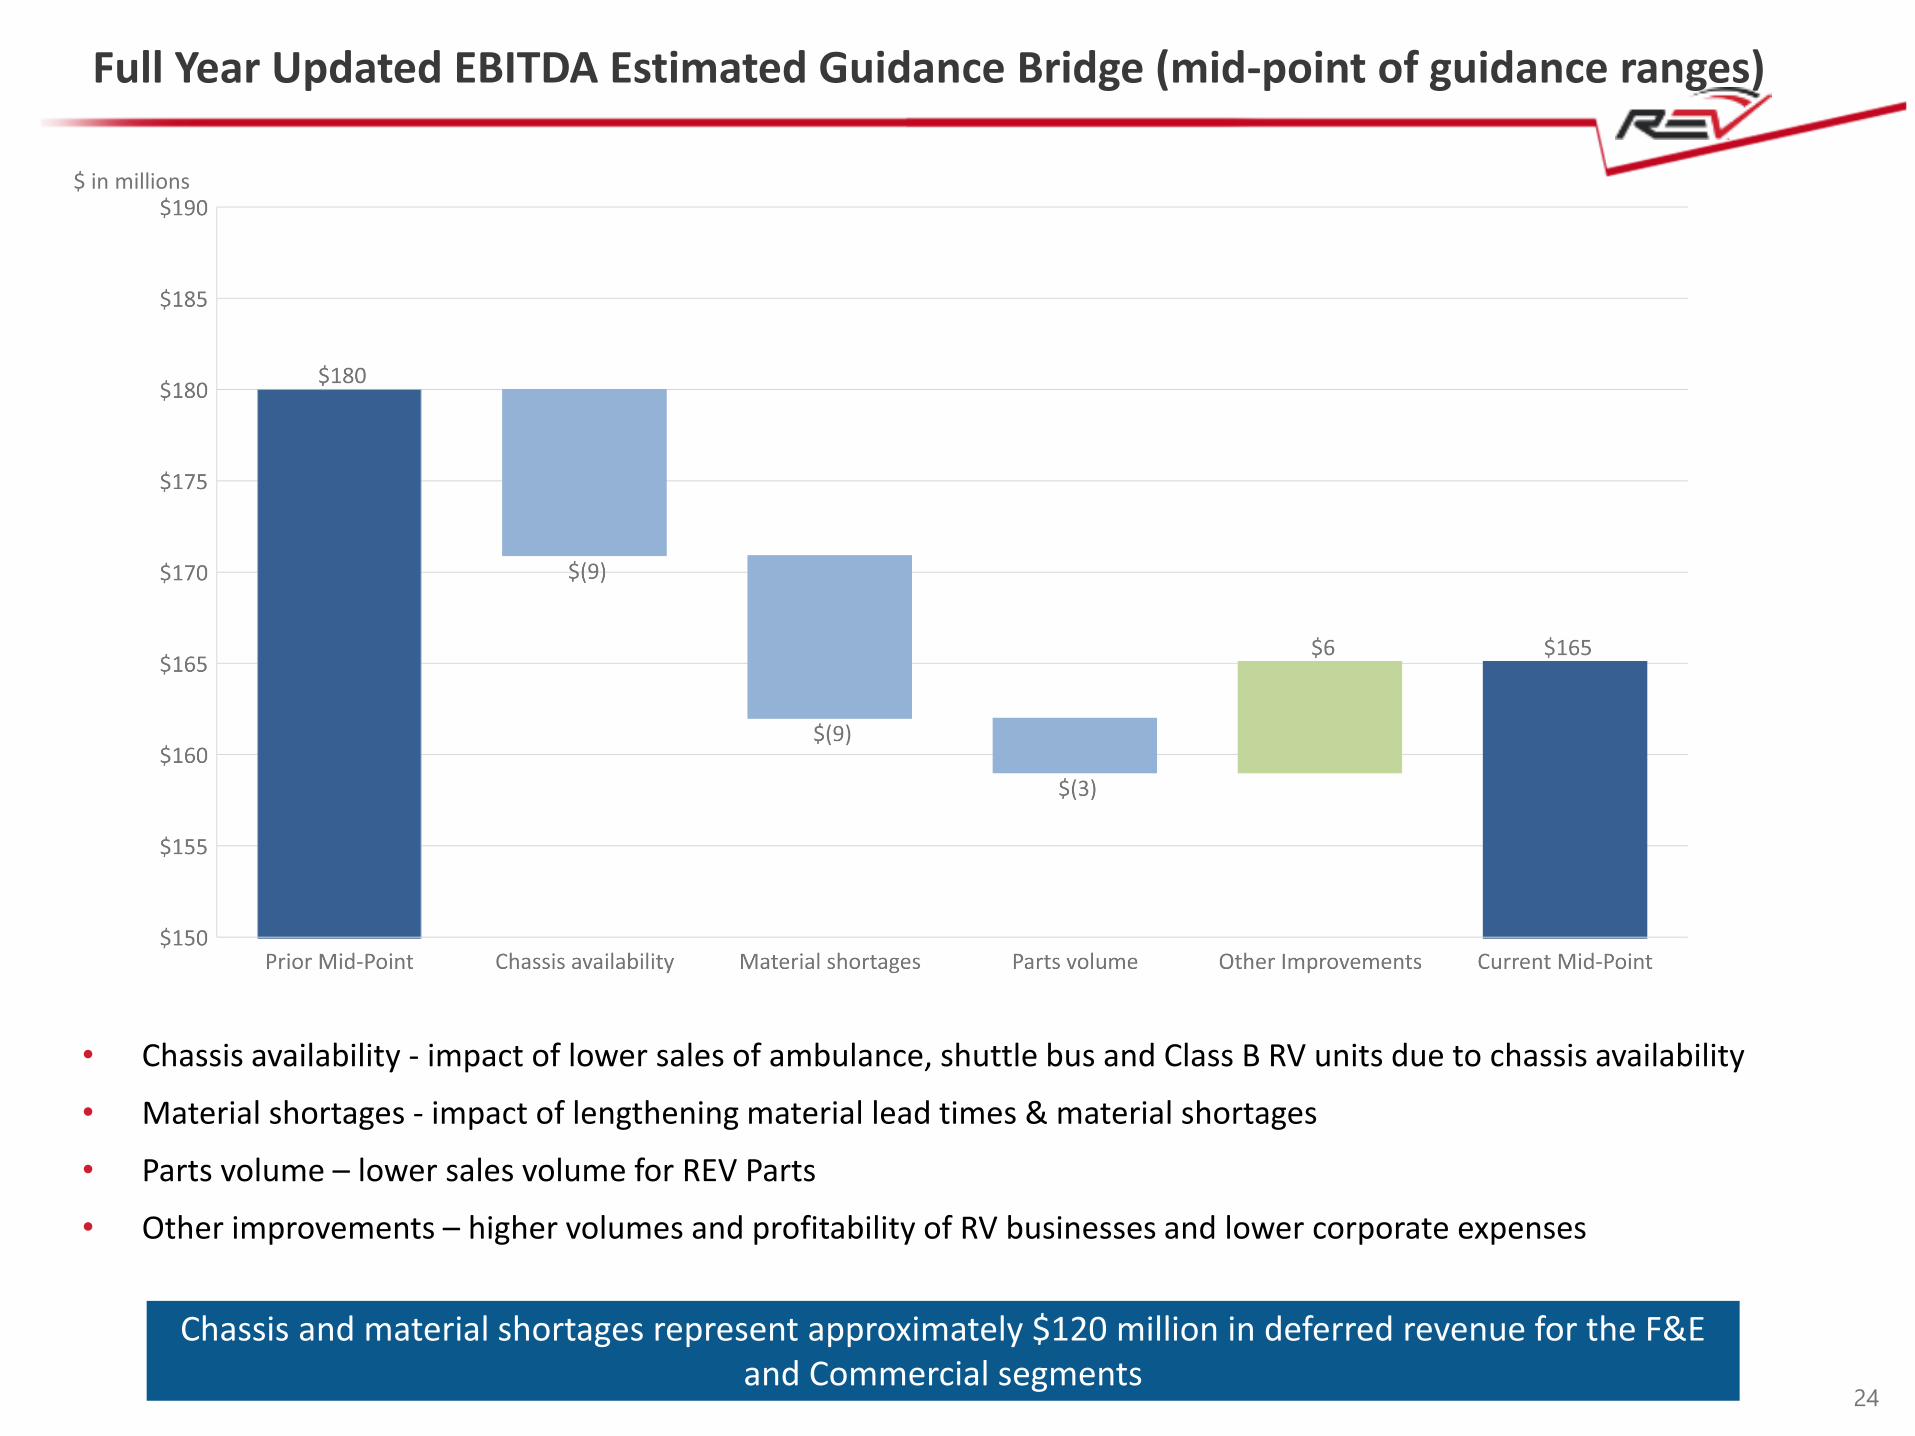
Full Year Updated EBITDA Estimated Guidance Bridge (mid-point of guidance ranges)
24
$ in millions
• Chassis availability - impact of lower sales of ambulance, shuttle bus and Class B RV units due to chassis availability
• Material shortages - impact of lengthening material lead times & material shortages
• Parts volume – lower sales volume for REV Parts
• Other improvements – higher volumes and profitability of RV businesses and lower corporate expenses
Chassis and material shortages represent approximately $120 million in deferred revenue for the F&E and Commercial segments
25
$0.0
$10.0
$20.0
$30.0
$40.0
$50.0
$60.0
$70.0
$80.0
Q3 17 Q4 17 Q1 18 Q2 18 Q3 18
CAPEX *M&A Dividend Share Repurchase
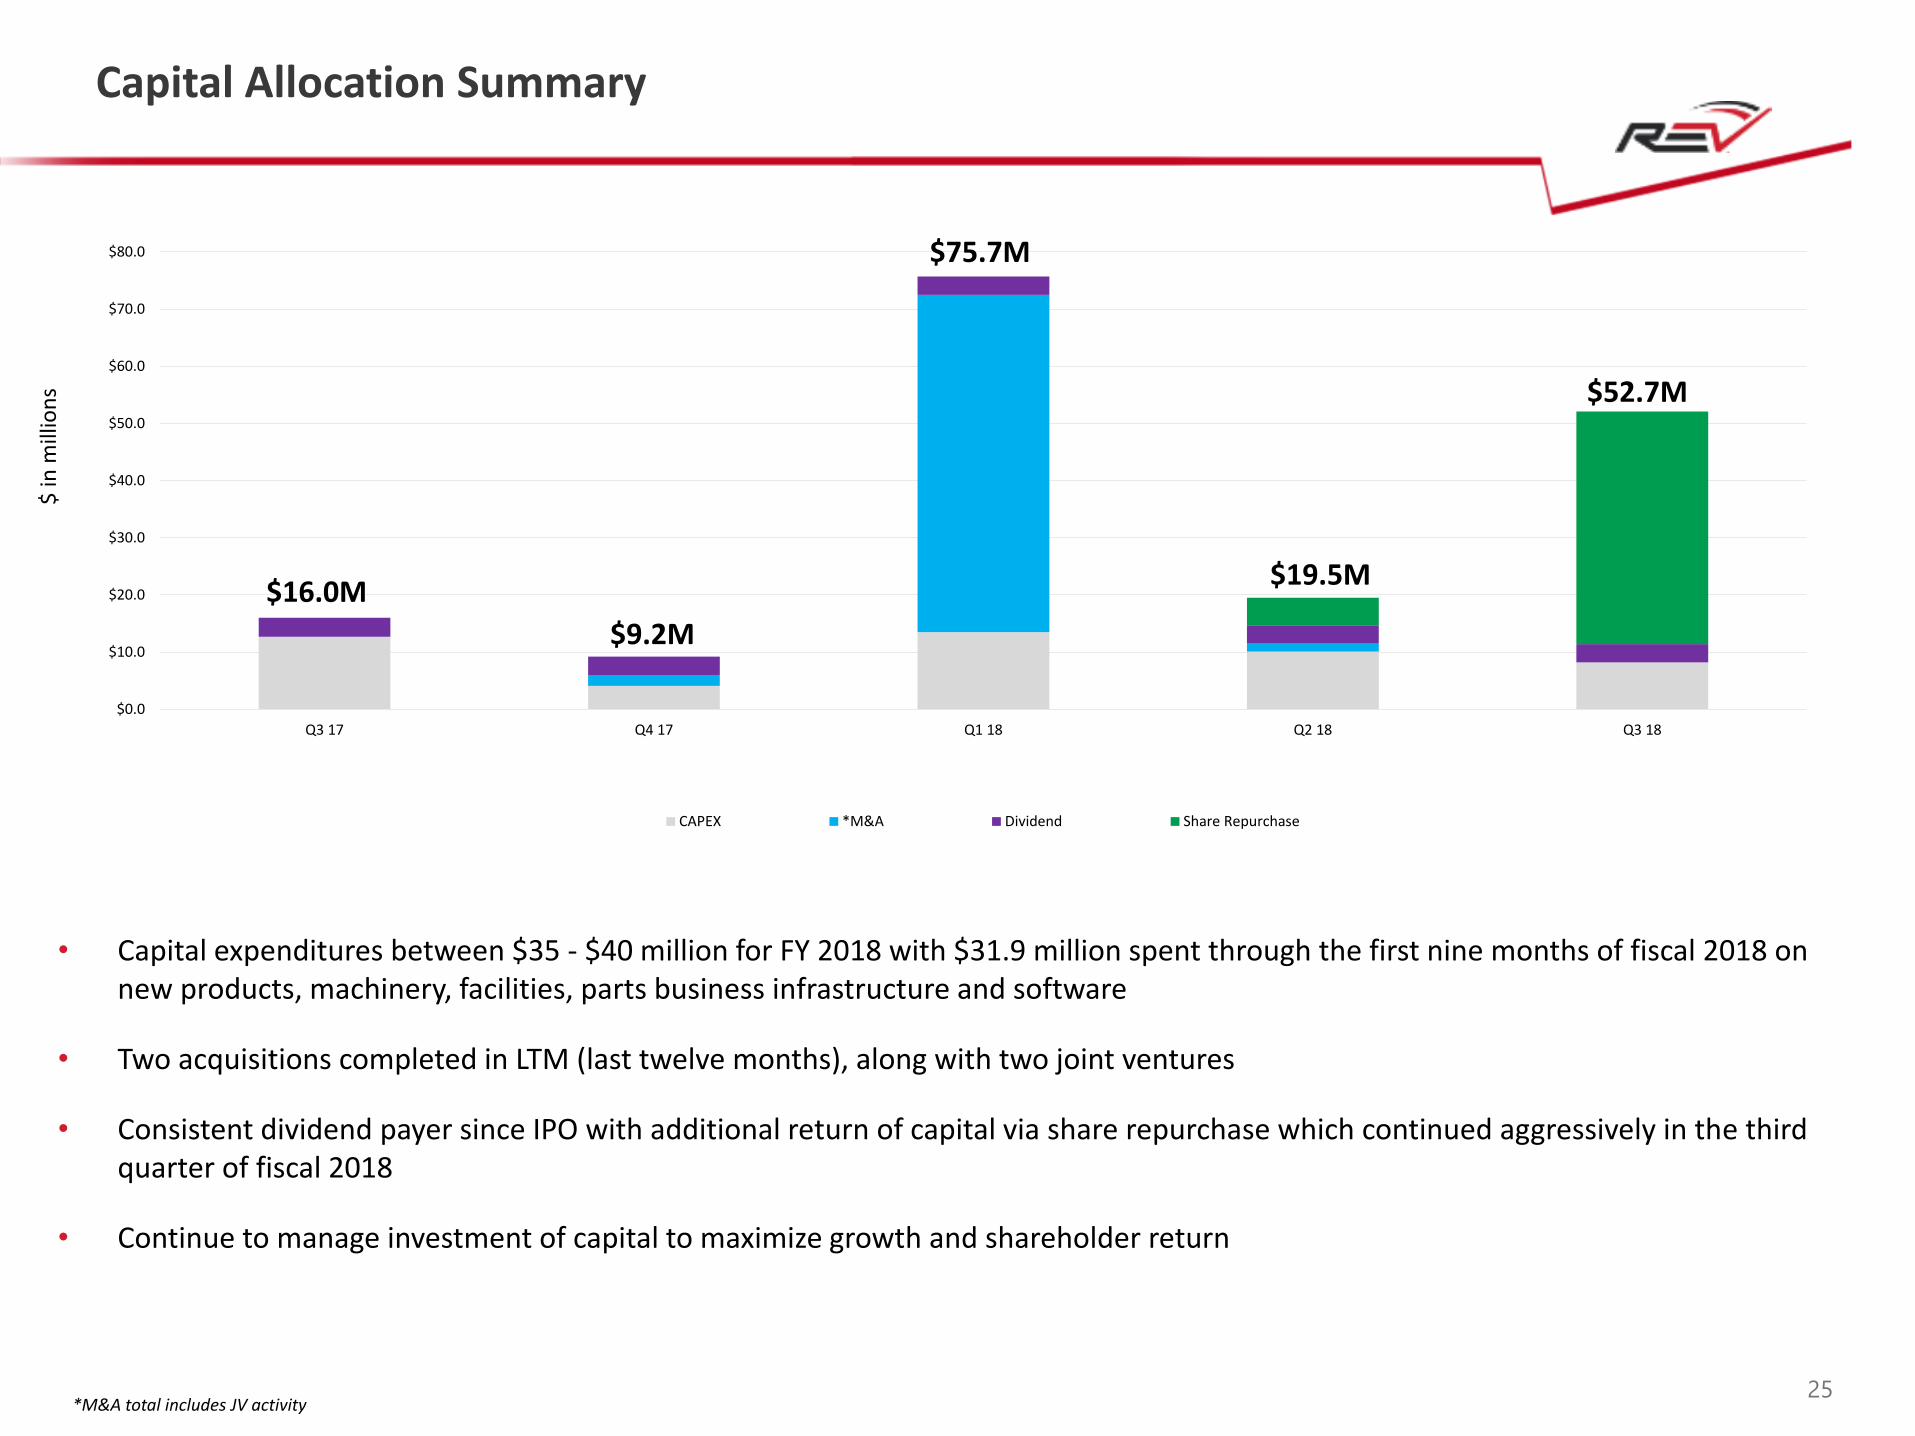
Capital Allocation Summary
$16.0M
$9.2M
$75.7M
$19.5M
$52.7M
$ in
mill
ion
s
*M&A total includes JV activity
• Capital expenditures between $35 - $40 million for FY 2018 with $31.9 million spent through the first nine months of fiscal 2018 on new products, machinery, facilities, parts business infrastructure and software
• Two acquisitions completed in LTM (last twelve months), along with two joint ventures
• Consistent dividend payer since IPO with additional return of capital via share repurchase which continued aggressively in the third quarter of fiscal 2018
• Continue to manage investment of capital to maximize growth and shareholder return

Top-line growth of ~10%
Long-term target continues to be >10% EBITDA margins
Full Year Fiscal 2018 Guidance Update
26
Current GuidancePrior Year
(Actual)
Net Sales: $2.4 billion to $2.5 billion Net Sales: $2.3 billion
Net Income: $57.9 million to $69.0
million Net Income: $31.4 million
Adjusted EBITDA: $160 million to
$170 millionAdjusted EBITDA: $162.5 million
Adjusted Net Income: $80.7 million
to $88.8 million
Adjusted Net Income: $75.9
million
1 REV Group’s forward-looking statements are subject to risks and uncertainties, including those highlighted under “Risk Factors” and “Cautionary Note Regarding on Forward-Looking Statements” in REV Group’s public filings with the SEC and the other risk factors described from time to time in subsequent quarterly or annual reports on Forms 10-Q or 10-K, which may cause actual results to differ materially from those projected or implied by the forward-looking statement. Forward-looking statements are based on current expectations and assumptions and currently available data and are neither predictions nor guarantees of future events or performance.
1
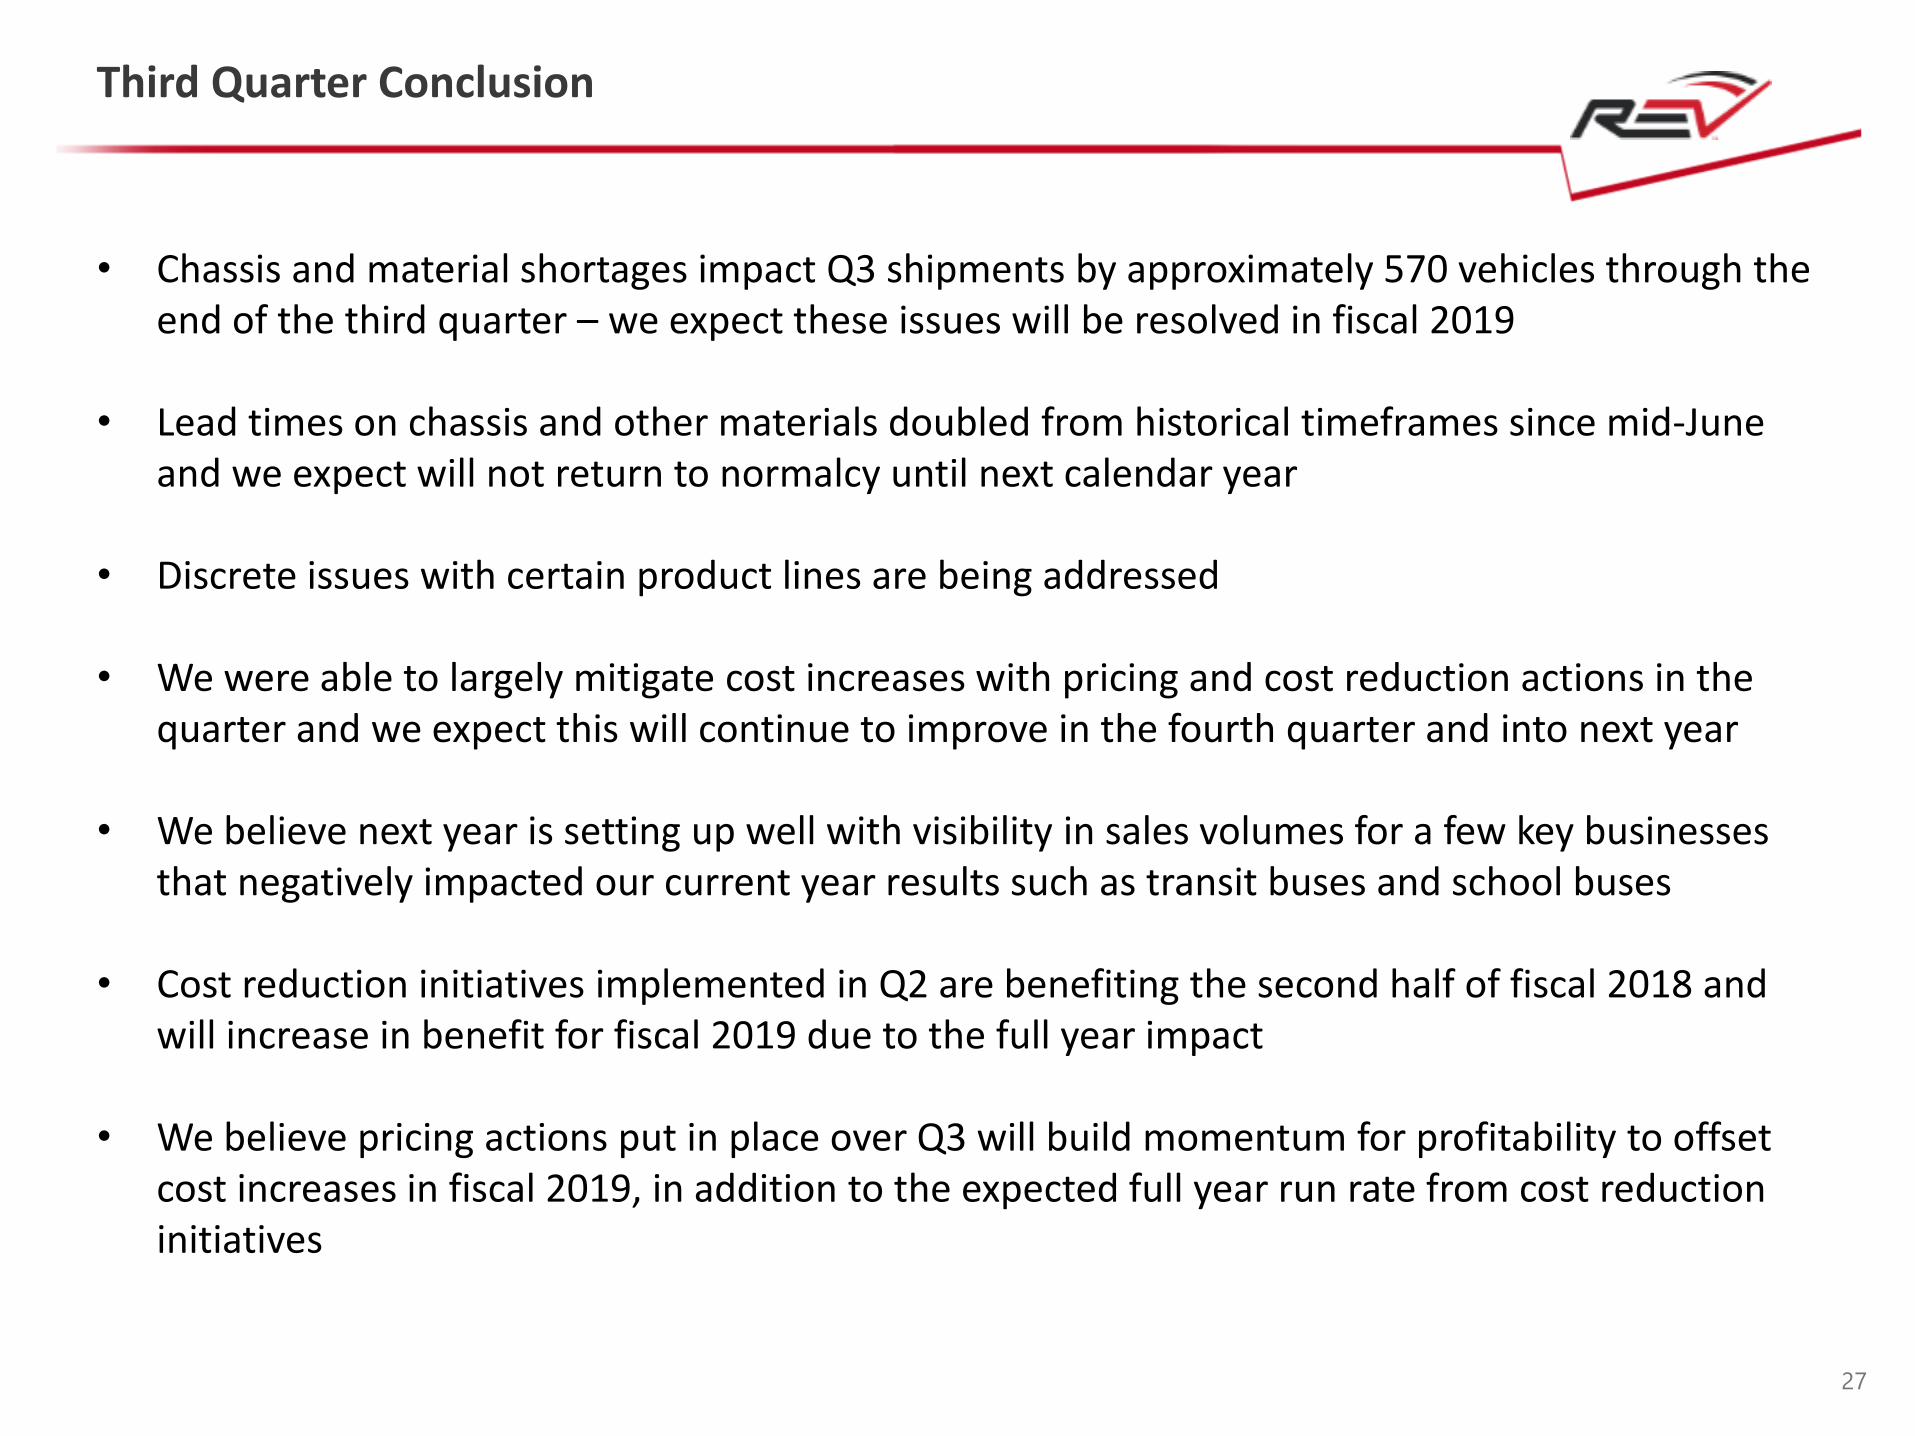
Third Quarter Conclusion
• Chassis and material shortages impact Q3 shipments by approximately 570 vehicles through the end of the third quarter – we expect these issues will be resolved in fiscal 2019
• Lead times on chassis and other materials doubled from historical timeframes since mid-June and we expect will not return to normalcy until next calendar year
• Discrete issues with certain product lines are being addressed
• We were able to largely mitigate cost increases with pricing and cost reduction actions in the quarter and we expect this will continue to improve in the fourth quarter and into next year
• We believe next year is setting up well with visibility in sales volumes for a few key businesses that negatively impacted our current year results such as transit buses and school buses
• Cost reduction initiatives implemented in Q2 are benefiting the second half of fiscal 2018 and will increase in benefit for fiscal 2019 due to the full year impact
• We believe pricing actions put in place over Q3 will build momentum for profitability to offset cost increases in fiscal 2019, in addition to the expected full year run rate from cost reduction initiatives
27
APPENDIX
29
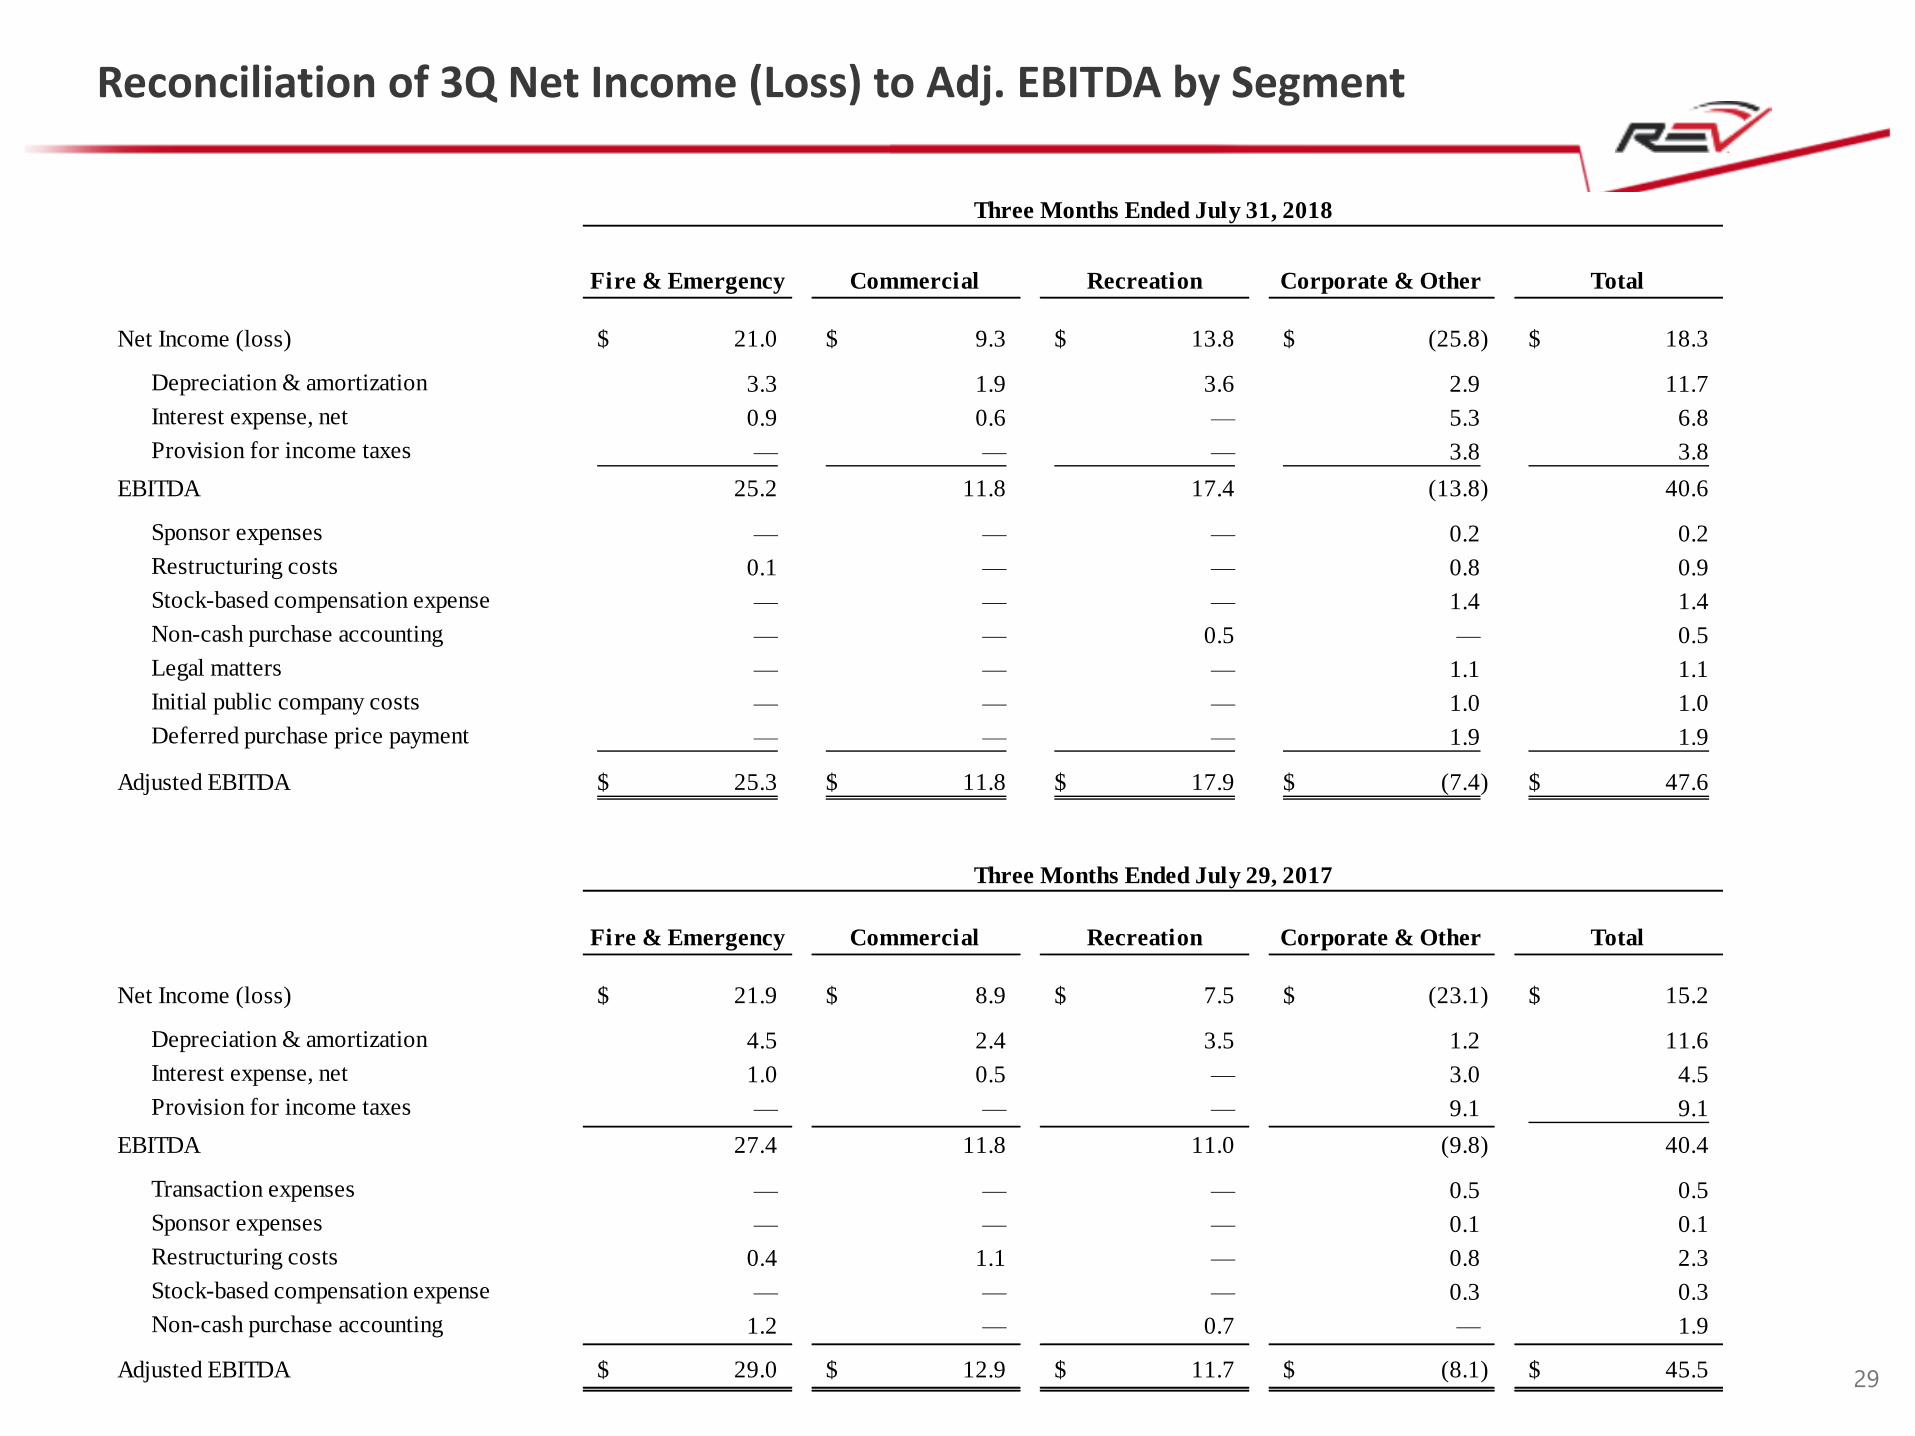
Reconciliation of 3Q Net Income (Loss) to Adj. EBITDA by Segment
Fire & Emergency Commercial Recreation Corporate & Other Total
Net Income (loss) 21.0$ 9.3$ 13.8$ (25.8)$ 18.3$
Depreciation & amortization 3.3 1.9 3.6 2.9 11.7
Interest expense, net 0.9 0.6 — 5.3 6.8
Provision for income taxes — — — 3.8 3.8
EBITDA 25.2 11.8 17.4 (13.8) 40.6
Sponsor expenses — — — 0.2 0.2
Restructuring costs 0.1 — — 0.8 0.9
Stock-based compensation expense — — — 1.4 1.4
Non-cash purchase accounting — — 0.5 — 0.5
Legal matters — — — 1.1 1.1
Initial public company costs — — — 1.0 1.0
Deferred purchase price payment — — — 1.9 1.9
Adjusted EBITDA 25.3$ 11.8$ 17.9$ (7.4)$ 47.6$
Fire & Emergency Commercial Recreation Corporate & Other Total
Net Income (loss) 21.9$ 8.9$ 7.5$ (23.1)$ 15.2$
Depreciation & amortization 4.5 2.4 3.5 1.2 11.6
Interest expense, net 1.0 0.5 — 3.0 4.5
Provision for income taxes — — — 9.1 9.1
EBITDA 27.4 11.8 11.0 (9.8) 40.4
Transaction expenses — — — 0.5 0.5
Sponsor expenses — — — 0.1 0.1
Restructuring costs 0.4 1.1 — 0.8 2.3
Stock-based compensation expense — — — 0.3 0.3
Non-cash purchase accounting 1.2 — 0.7 — 1.9
Adjusted EBITDA 29.0$ 12.9$ 11.7$ (8.1)$ 45.5$
Three Months Ended July 31, 2018
Three Months Ended July 29, 2017
30
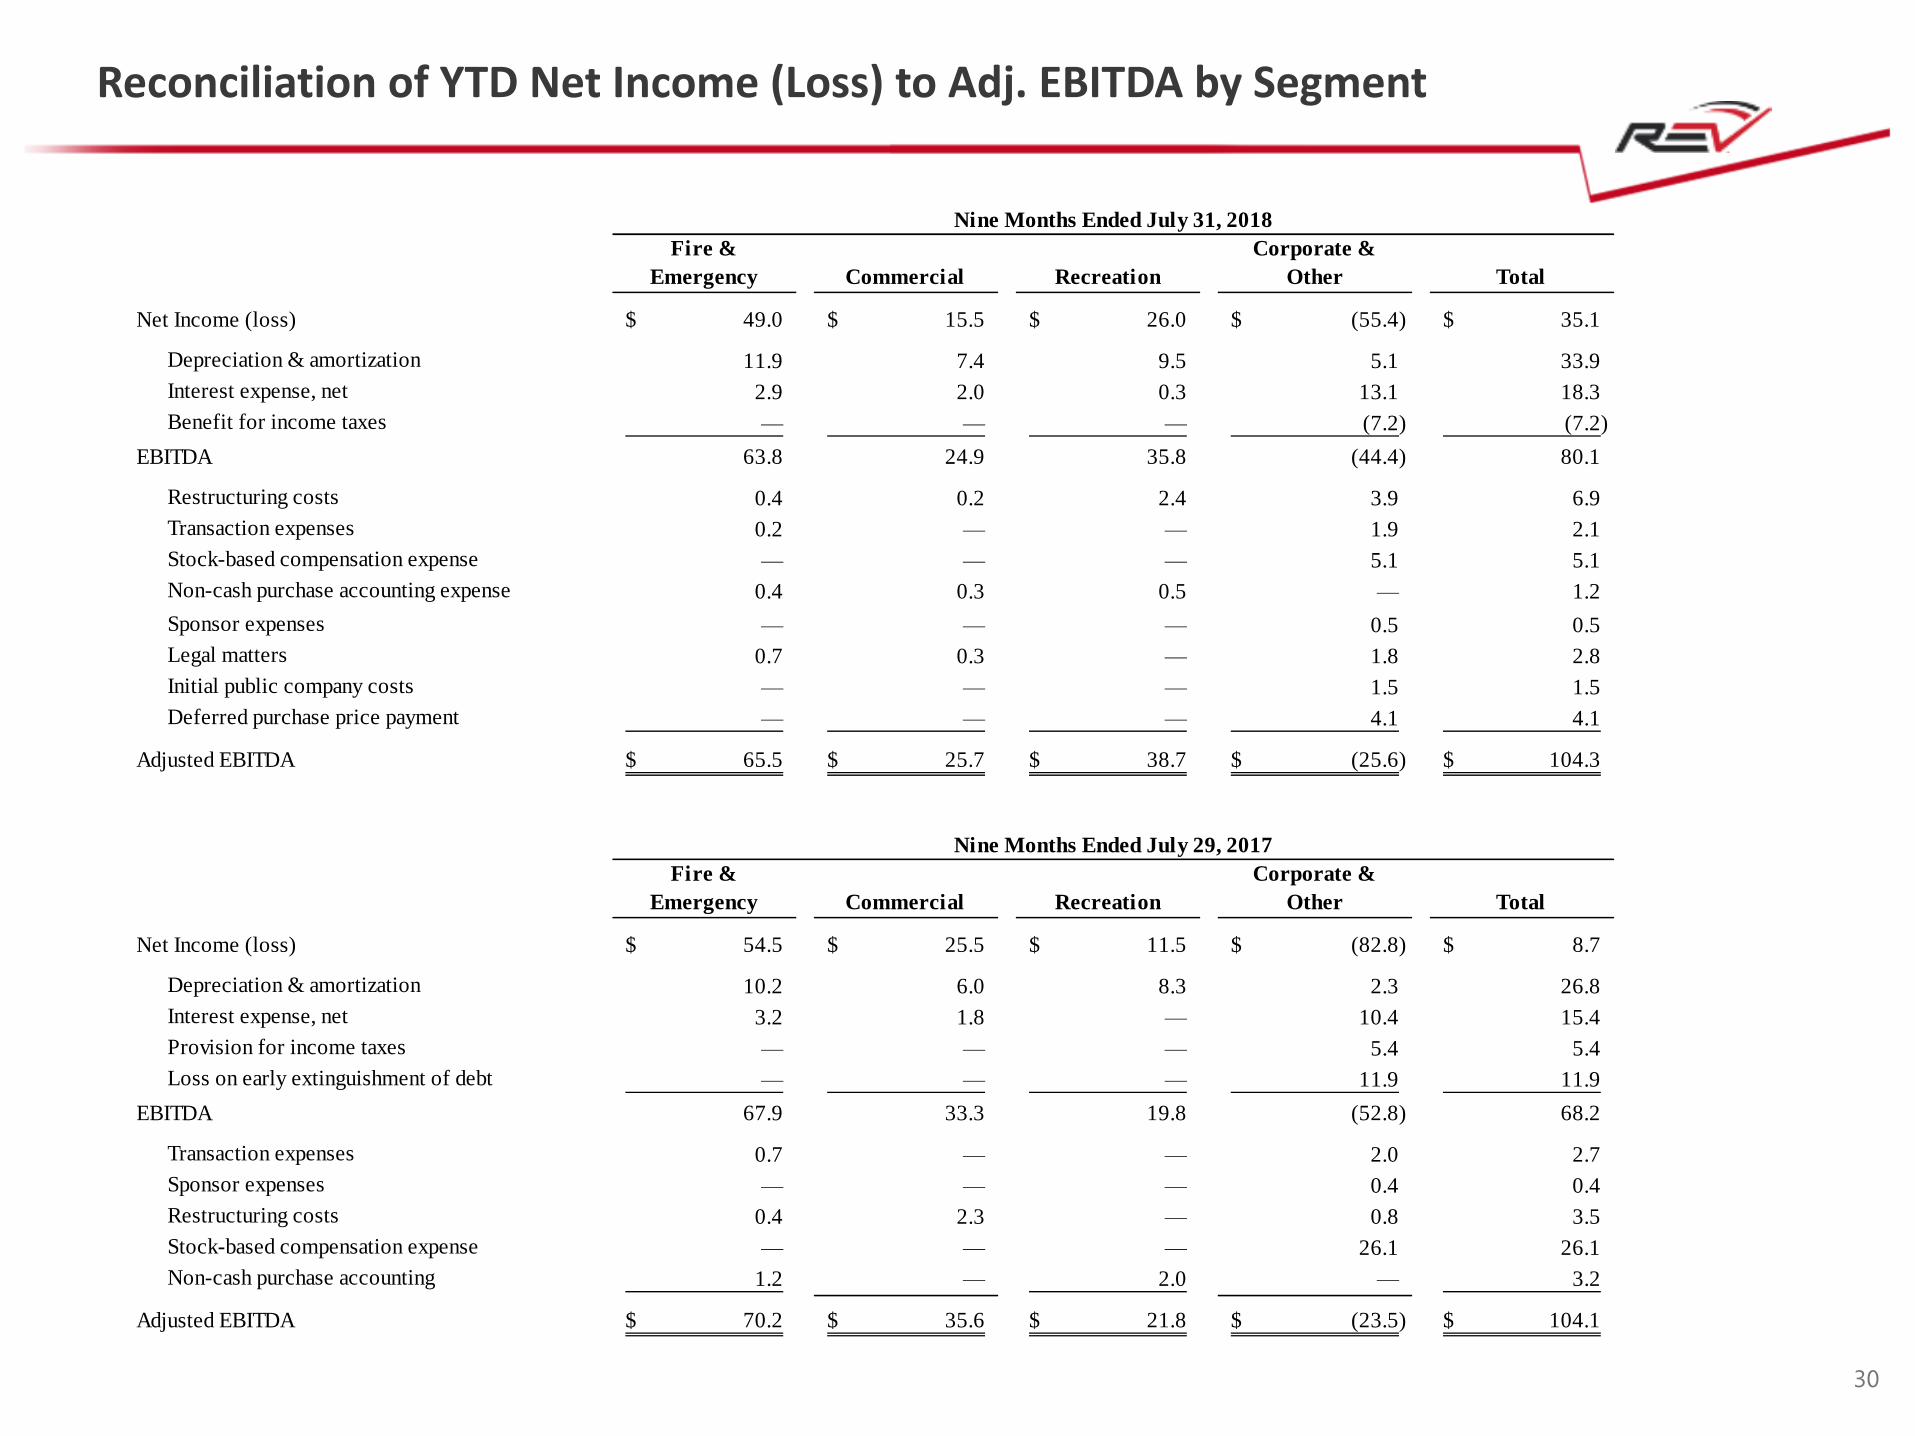
Reconciliation of YTD Net Income (Loss) to Adj. EBITDA by Segment
Fire &
Emergency Commercial Recreation
Corporate &
Other Total
Net Income (loss) 49.0$ 15.5$ 26.0$ (55.4)$ 35.1$
Depreciation & amortization 11.9 7.4 9.5 5.1 33.9
Interest expense, net 2.9 2.0 0.3 13.1 18.3
Benefit for income taxes — — — (7.2) (7.2)
EBITDA 63.8 24.9 35.8 (44.4) 80.1
Restructuring costs 0.4 0.2 2.4 3.9 6.9
Transaction expenses 0.2 — — 1.9 2.1
Stock-based compensation expense — — — 5.1 5.1
Non-cash purchase accounting expense 0.4 0.3 0.5 — 1.2
Sponsor expenses — — — 0.5 0.5
Legal matters 0.7 0.3 — 1.8 2.8
Initial public company costs — — — 1.5 1.5
Deferred purchase price payment — — — 4.1 4.1
Adjusted EBITDA 65.5$ 25.7$ 38.7$ (25.6)$ 104.3$
Fire &
Emergency Commercial Recreation
Corporate &
Other Total
Net Income (loss) 54.5$ 25.5$ 11.5$ (82.8)$ 8.7$
Depreciation & amortization 10.2 6.0 8.3 2.3 26.8
Interest expense, net 3.2 1.8 — 10.4 15.4
Provision for income taxes — — — 5.4 5.4
Loss on early extinguishment of debt — — — 11.9 11.9
EBITDA 67.9 33.3 19.8 (52.8) 68.2
Transaction expenses 0.7 — — 2.0 2.7
Sponsor expenses — — — 0.4 0.4
Restructuring costs 0.4 2.3 — 0.8 3.5
Stock-based compensation expense — — — 26.1 26.1
Non-cash purchase accounting 1.2 — 2.0 — 3.2
Adjusted EBITDA 70.2$ 35.6$ 21.8$ (23.5)$ 104.1$
Nine Months Ended July 31, 2018
Nine Months Ended July 29, 2017

31
Reconciliation of YTD FY18 Net Income to Adj. Net Income
July 31, 2018 July 29, 2017 July 31, 2018 July 29, 2017
Net income 18.3$ 15.2$ 35.1$ 8.7$
Amortization of Intangible Assets 4.6 5.1 13.7 10.4
Restructuring Costs 0.9 2.3 6.9 3.5
Transaction Expenses - 0.5 2.1 2.7
Stock-based Compensation Expense 1.4 0.3 5.1 26.1
Non-cash Purchase Accounting Expense 0.5 1.9 1.2 3.2
Loss on Early Extinguishment of Debt - - - 11.9
Sponsor Expenses 0.2 0.1 0.5 0.4
Legal Matters 1.1 - 2.8 -
Initial Public Company Costs 1.0 - 1.5 -
Deferred Purchase Price Payment 1.9 - 4.1 -
Impact of Tax Rate Change (2.1) - (12.5) -
Income Tax Effect of Adjustments (3.1) (3.5) (9.5) (20.2)
Adjusted net income 24.7$ 21.9$ 51.0$ 46.7$
Three Months Ended Nine Months Ended
REV GROUP, INC.
ADJUSTED NET INCOME
(Unaudited; dollars in millions)
32
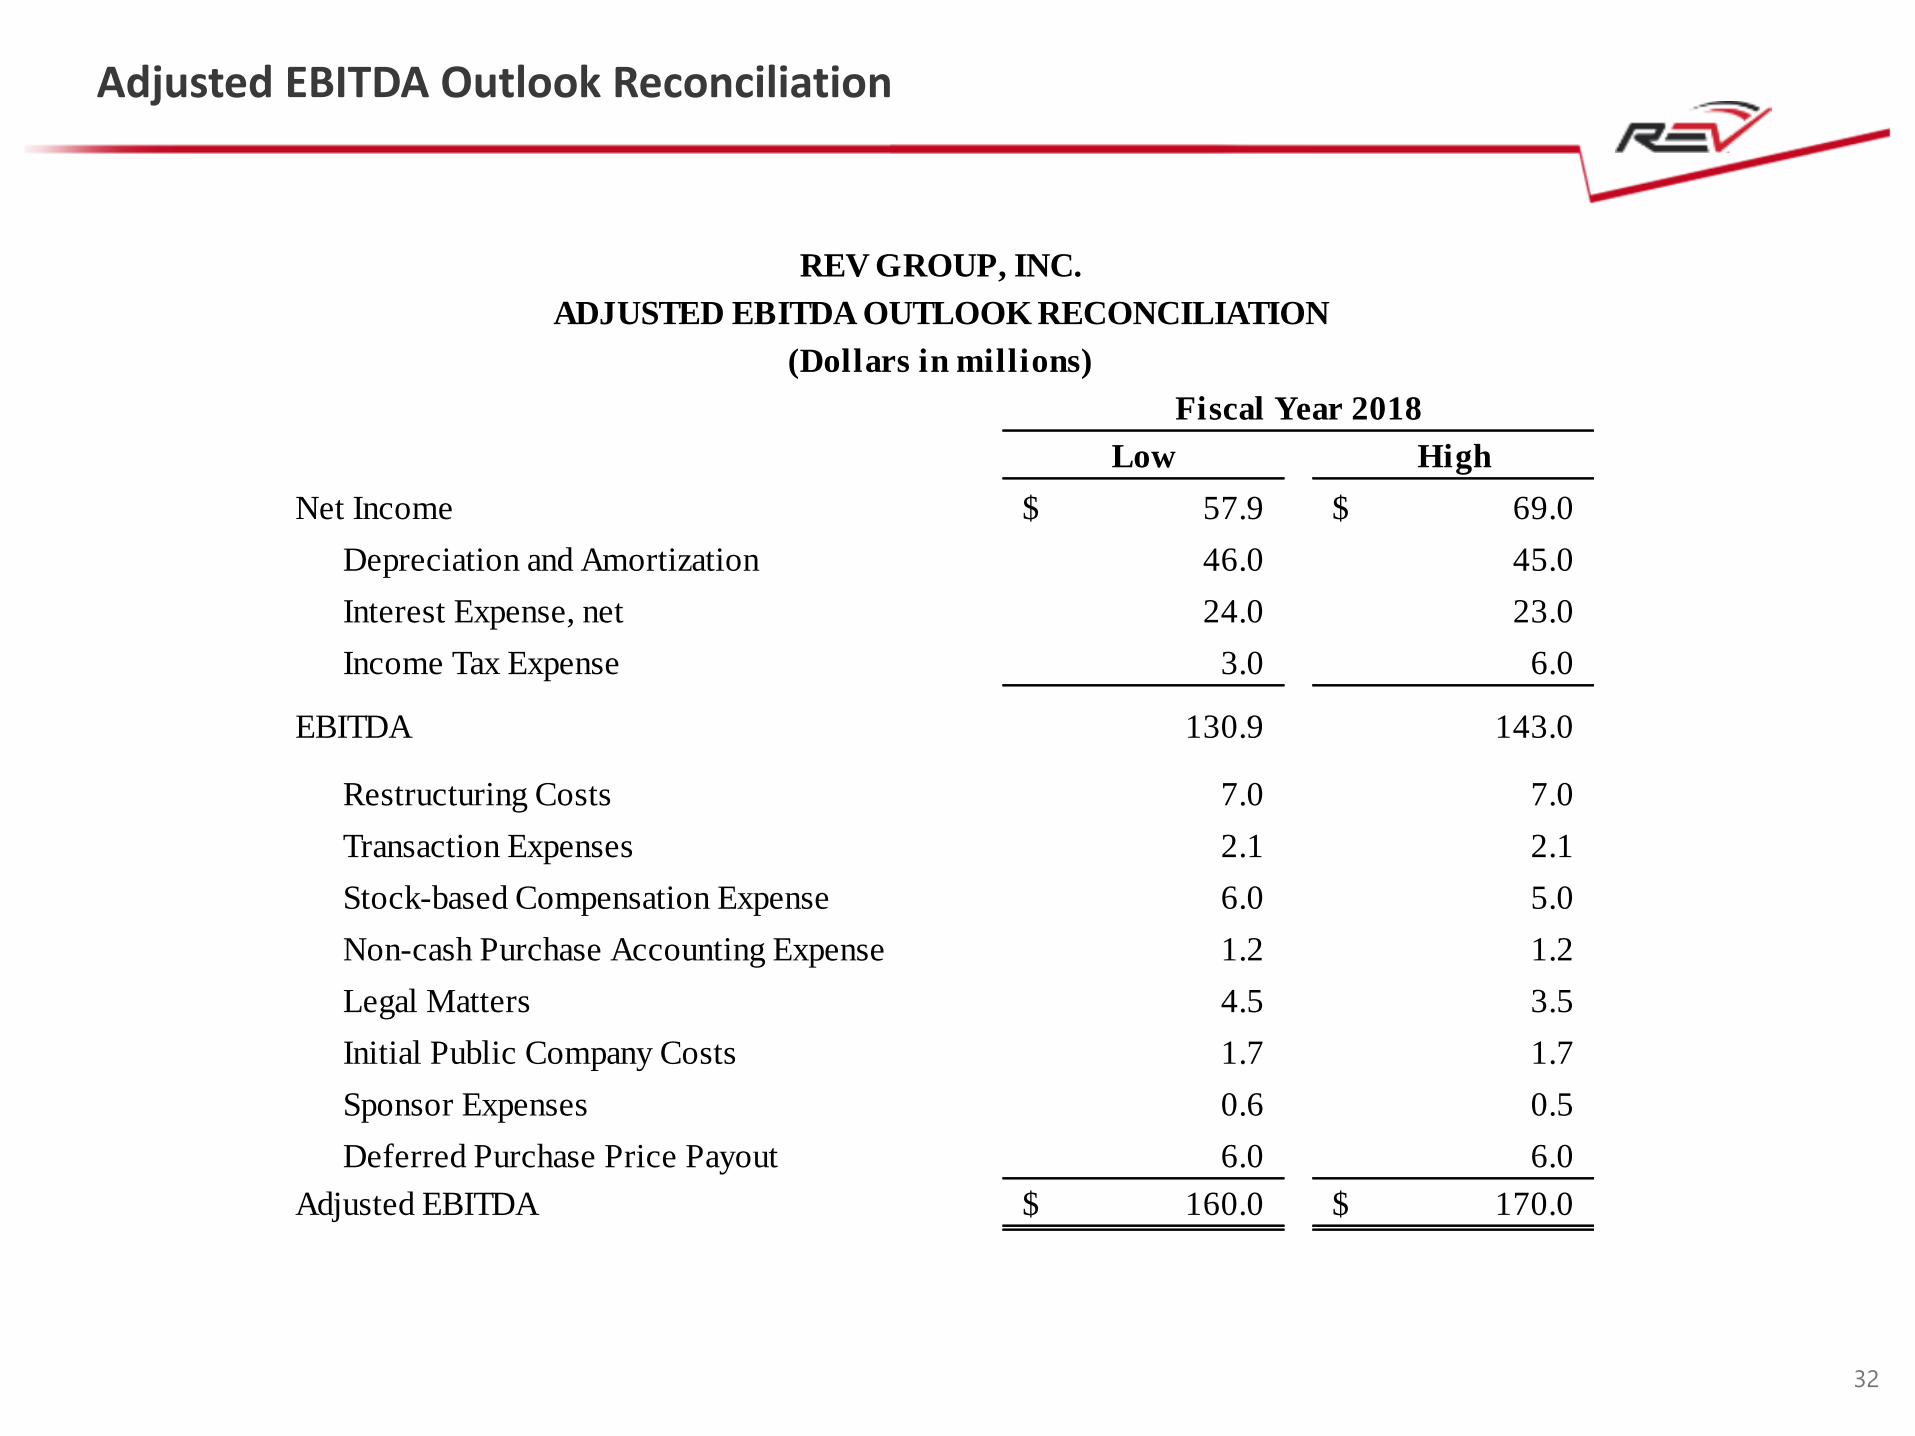
Adjusted EBITDA Outlook Reconciliation
Fiscal Year 2018
Low High
Net Income 57.9$ 69.0$
Depreciation and Amortization 46.0 45.0
Interest Expense, net 24.0 23.0
Income Tax Expense 3.0 6.0
EBITDA 130.9 143.0
Restructuring Costs 7.0 7.0
Transaction Expenses 2.1 2.1
Stock-based Compensation Expense 6.0 5.0
Non-cash Purchase Accounting Expense 1.2 1.2
Legal Matters 4.5 3.5
Initial Public Company Costs 1.7 1.7
Sponsor Expenses 0.6 0.5
Deferred Purchase Price Payout 6.0 6.0
Adjusted EBITDA 160.0$ 170.0$
REV GROUP, INC.
ADJUSTED EBITDA OUTLOOK RECONCILIATION
(Dollars in millions)
33
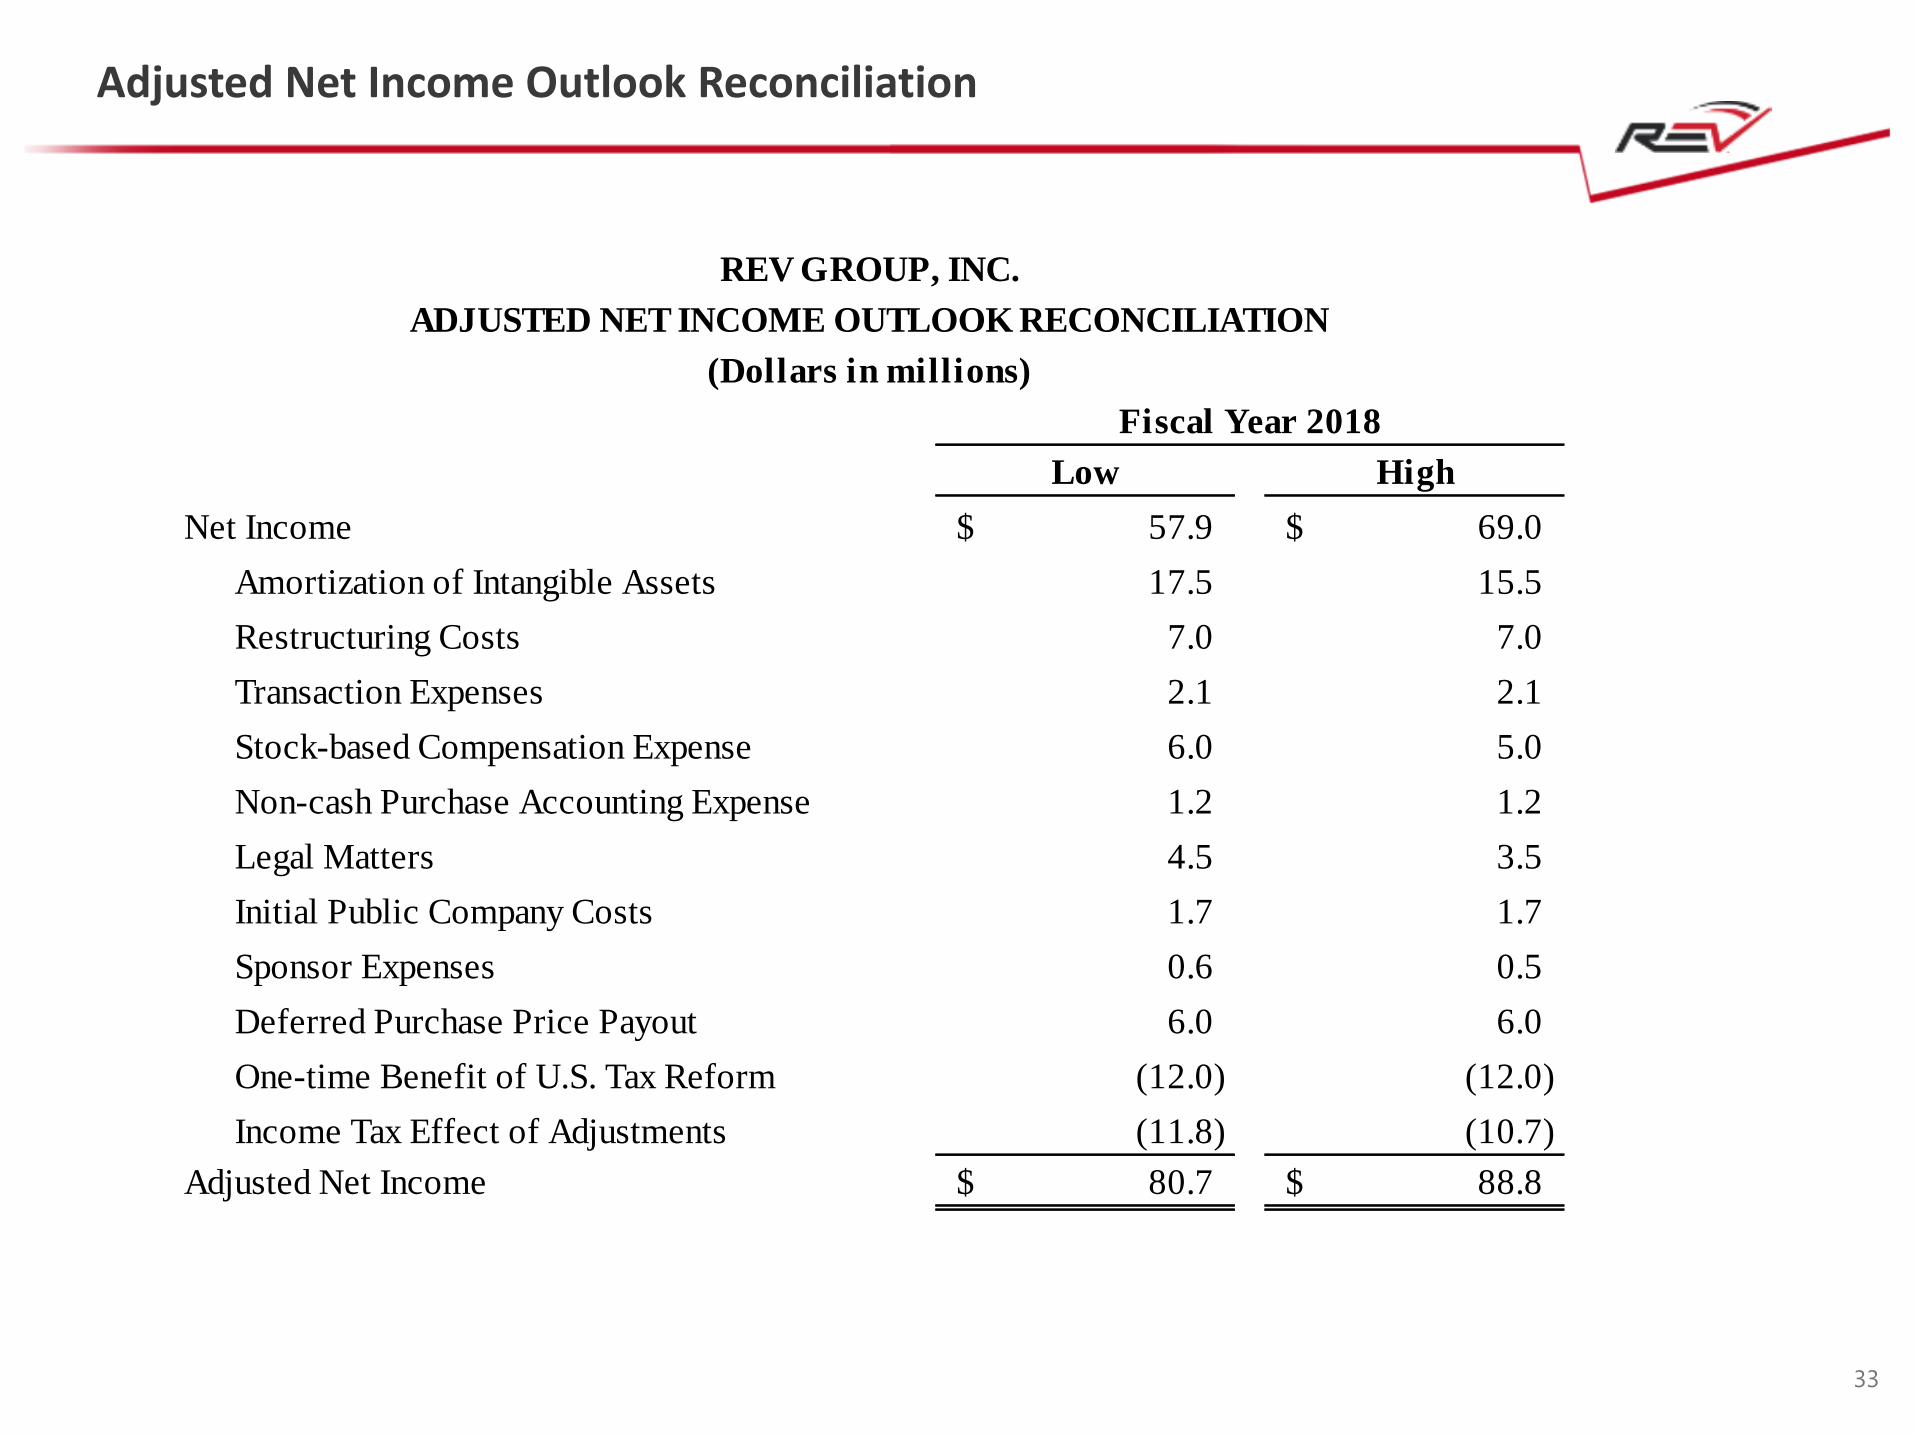
Adjusted Net Income Outlook Reconciliation
Fiscal Year 2018
Low High
Net Income 57.9$ 69.0$
Amortization of Intangible Assets 17.5 15.5
Restructuring Costs 7.0 7.0
Transaction Expenses 2.1 2.1
Stock-based Compensation Expense 6.0 5.0
Non-cash Purchase Accounting Expense 1.2 1.2
Legal Matters 4.5 3.5
Initial Public Company Costs 1.7 1.7
Sponsor Expenses 0.6 0.5
Deferred Purchase Price Payout 6.0 6.0
One-time Benefit of U.S. Tax Reform (12.0) (12.0)
Income Tax Effect of Adjustments (11.8) (10.7)
Adjusted Net Income 80.7$ 88.8$
REV GROUP, INC.
ADJUSTED NET INCOME OUTLOOK RECONCILIATION
(Dollars in millions)
¹ For a reconciliation of net income (loss) to Adjusted Net Income and Adjusted EBITDA, see the Appendix to this presentation.
$262.1
$ 238.9
$ 0.0
$ 100.0
$ 200.0
$ 300.0
3QFY2017
3QFY2018
Net Sales ($mm)
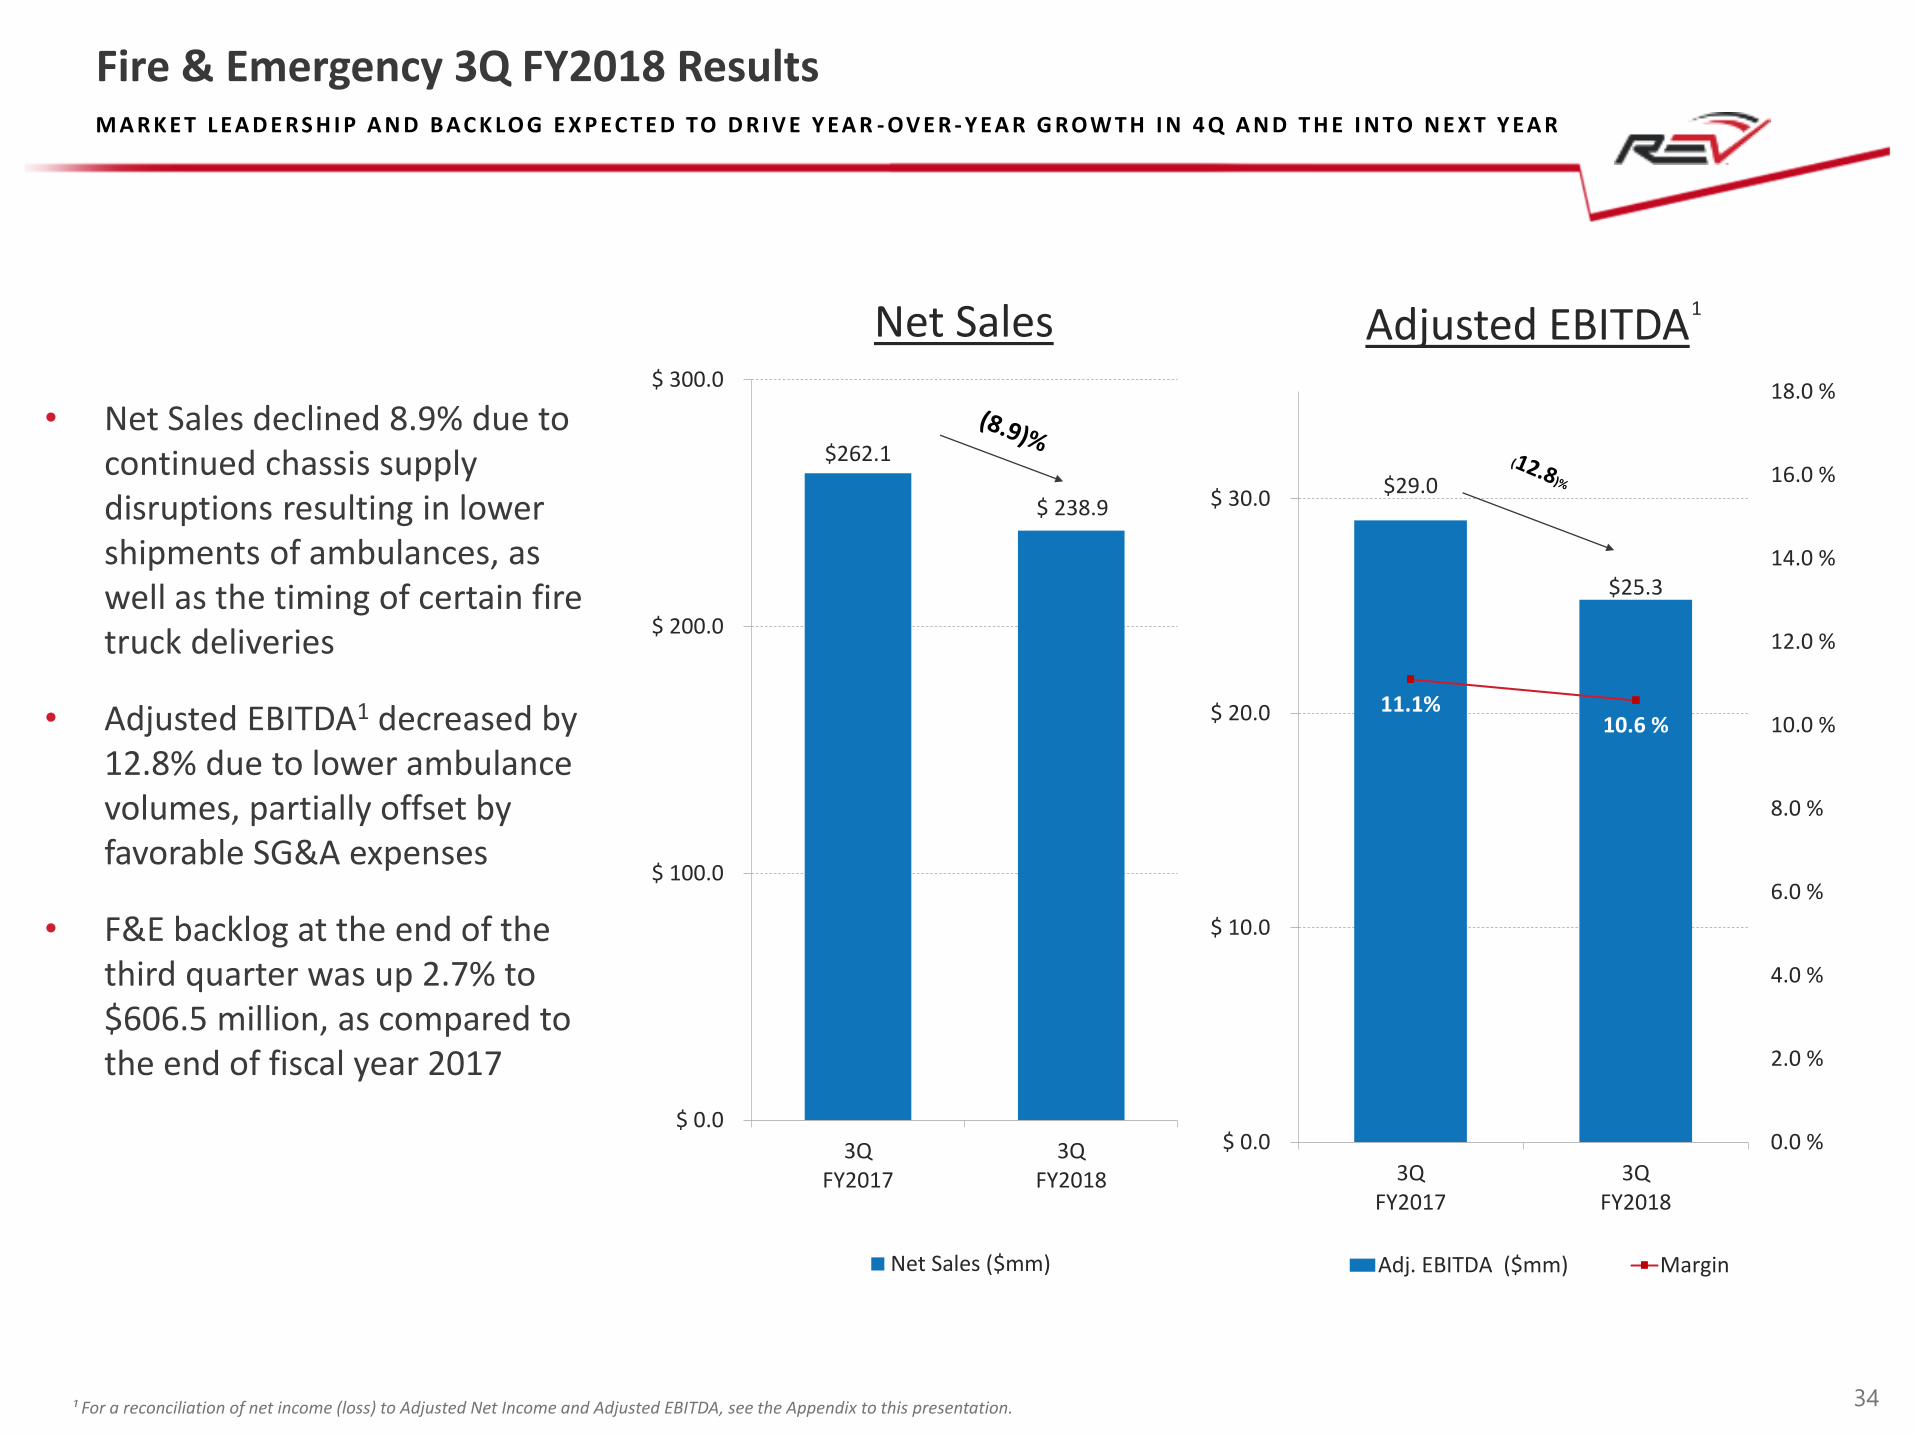
Fire & Emergency 3Q FY2018 Results
$29.0
$25.3
11.1%10.6 %
0.0 %
2.0 %
4.0 %
6.0 %
8.0 %
10.0 %
12.0 %
14.0 %
16.0 %
18.0 %
$ 0.0
$ 10.0
$ 20.0
$ 30.0
3QFY2017
3QFY2018
Adj. EBITDA ($mm) Margin
34
Net Sales Adjusted EBITDA1
• Net Sales declined 8.9% due to continued chassis supply disruptions resulting in lower shipments of ambulances, as well as the timing of certain fire truck deliveries
• Adjusted EBITDA1 decreased by 12.8% due to lower ambulance volumes, partially offset by favorable SG&A expenses
• F&E backlog at the end of the third quarter was up 2.7% to $606.5 million, as compared to the end of fiscal year 2017
M A R K E T L EA D E R S H I P A N D B AC K LO G E X P EC T E D TO D R I V E Y EA R - OV E R - Y EA R G R OW T H I N 4 Q A N D T H E I N TO N E X T Y EA R
¹ For a reconciliation of net income (loss) to Adjusted Net Income and Adjusted EBITDA, see the Appendix to this presentation.
$154.4 $157.6
$ 0
$ 100
$ 200
3QFY2017
3QFY2018
Net Sales ($mm)
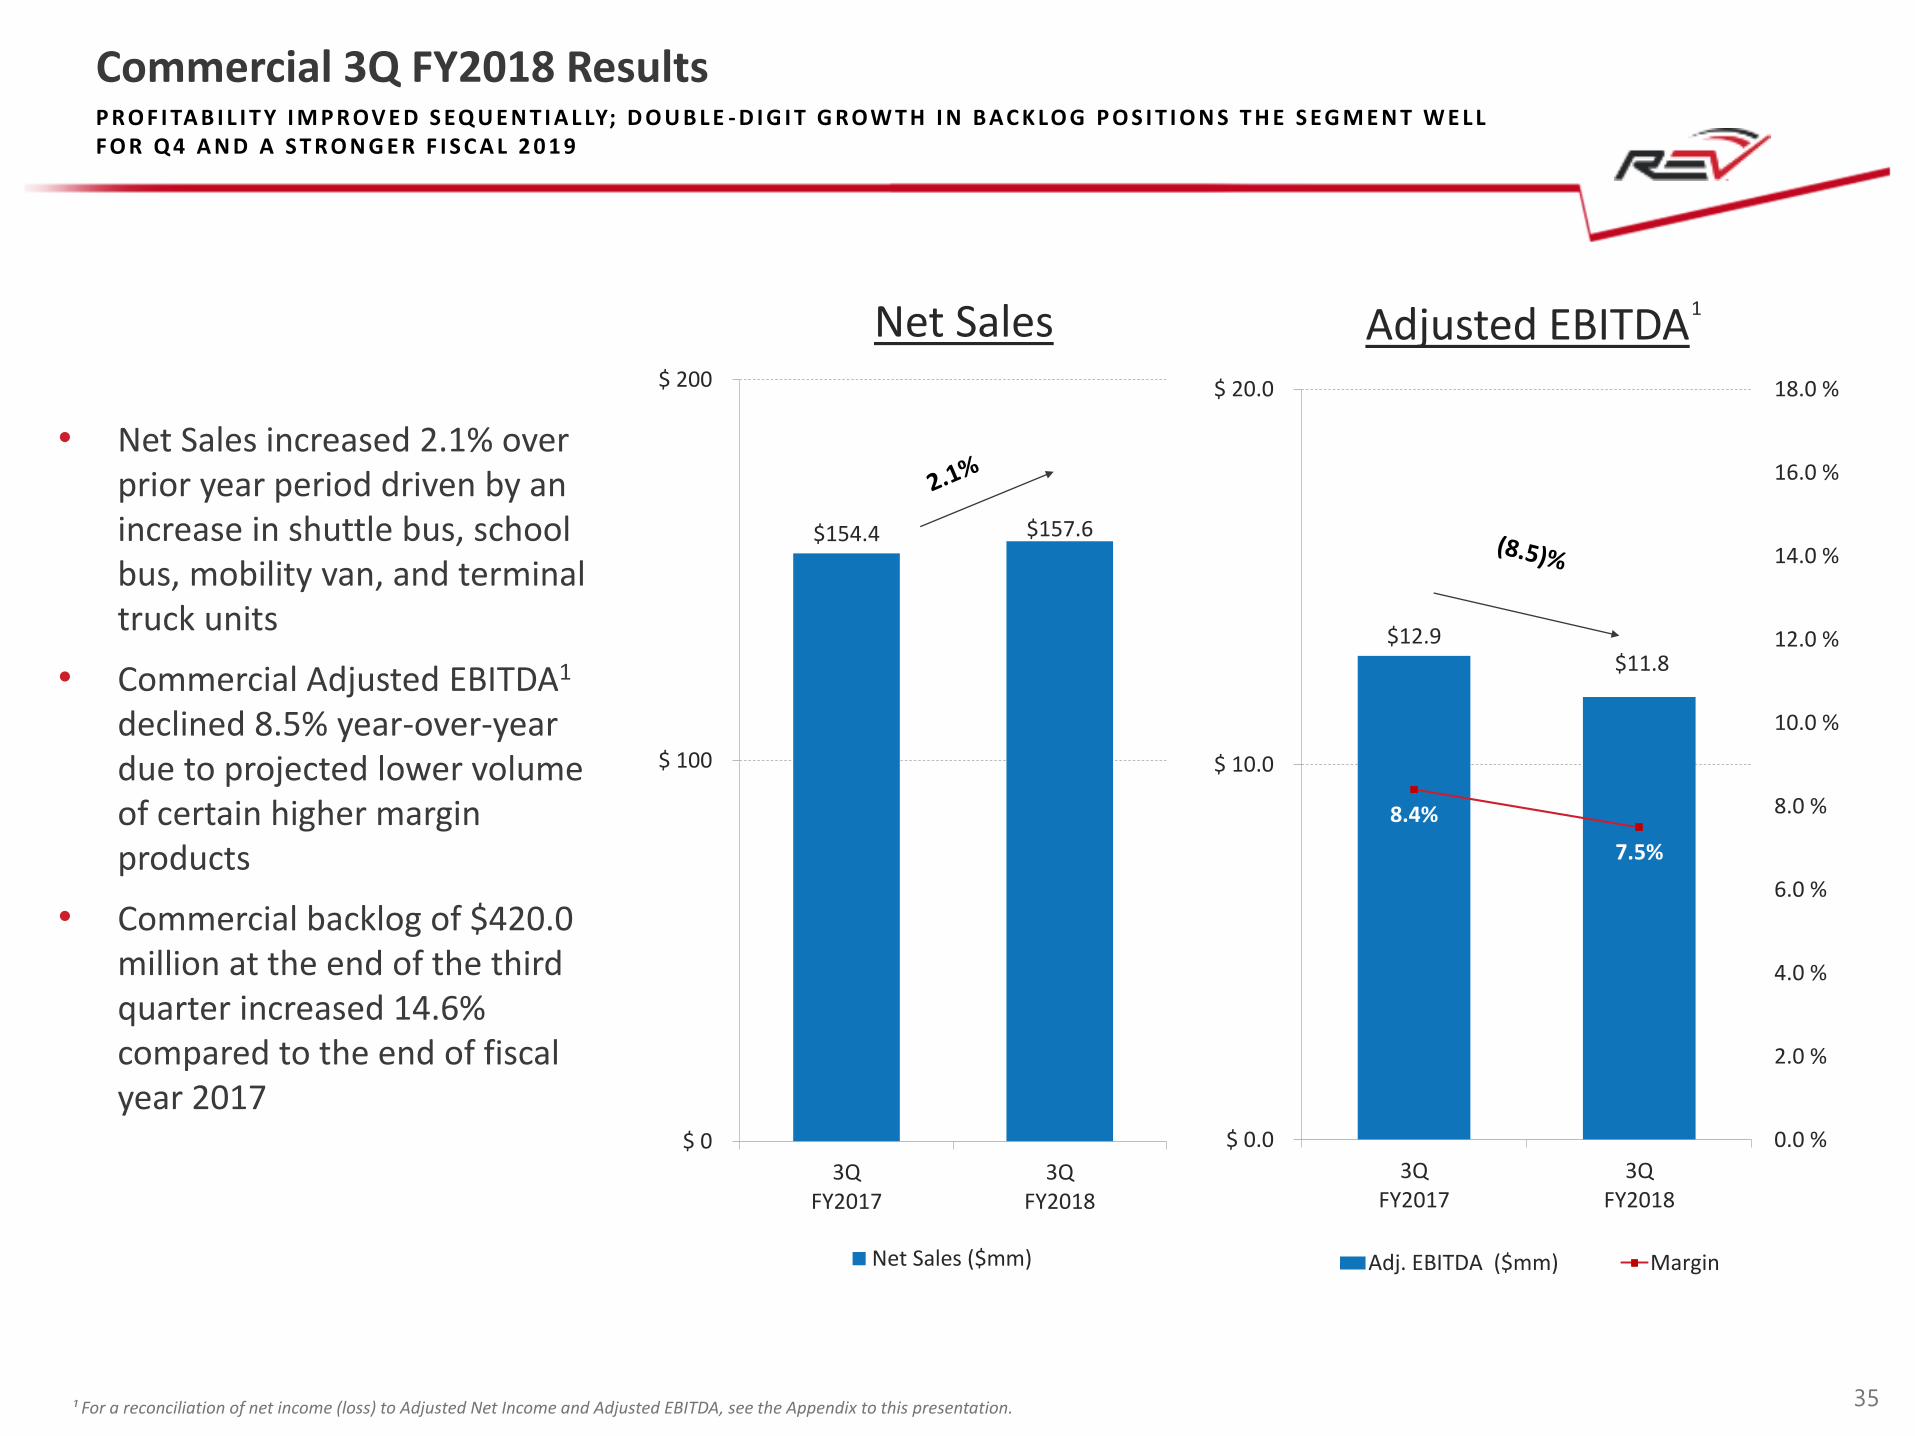
P R O F I TA B I L I T Y I M P R OV E D S EQ U E N T I A L LY; D O U B L E - D I G I T G R OW T H I N B AC K LO G P O S I T I O N S T H E S EG M E N T W E L L F O R Q 4 A N D A S T R O N G E R F I S C A L 2 0 1 9
Commercial 3Q FY2018 Results
$12.9$11.8
8.4%
7.5%
0.0 %
2.0 %
4.0 %
6.0 %
8.0 %
10.0 %
12.0 %
14.0 %
16.0 %
18.0 %
$ 0.0
$ 10.0
$ 20.0
3QFY2017
3QFY2018
Adj. EBITDA ($mm) Margin
35
Net Sales Adjusted EBITDA1
• Net Sales increased 2.1% over prior year period driven by an increase in shuttle bus, school bus, mobility van, and terminal truck units
• Commercial Adjusted EBITDA1
declined 8.5% year-over-year due to projected lower volume of certain higher margin products
• Commercial backlog of $420.0 million at the end of the third quarter increased 14.6% compared to the end of fiscal year 2017
¹ For a reconciliation of net income (loss) to Adjusted Net Income and Adjusted EBITDA, see the Appendix to this presentation.
$177.9
$197.3
$ 0
$ 100
$ 200
3QFY2017
3QFY2018
Net Sales ($mm)
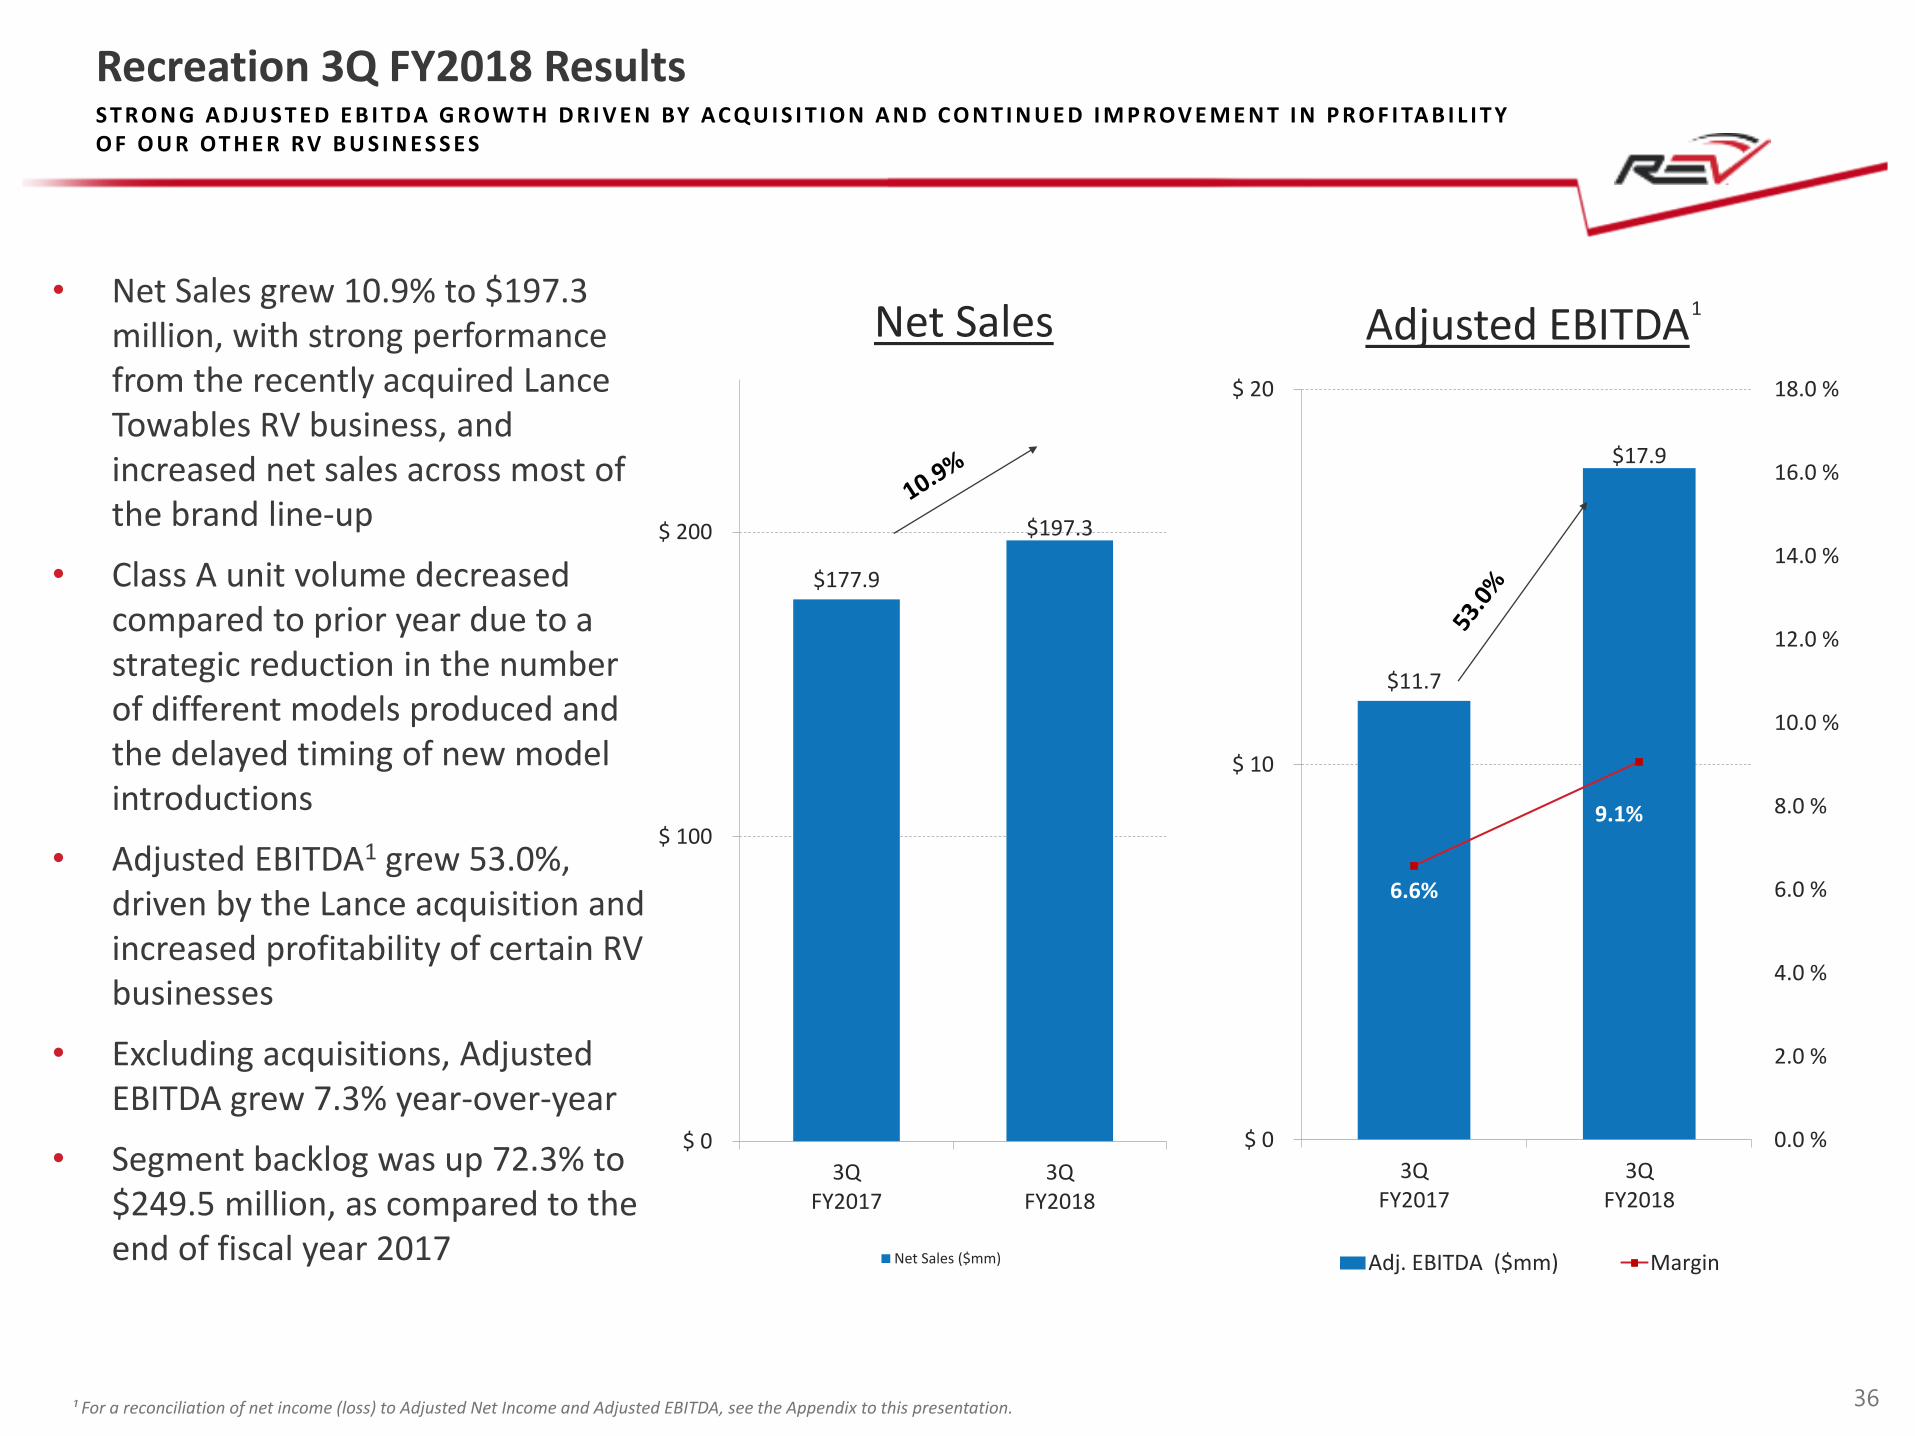
S T R O N G A D J U S T E D E B I T DA G R OW T H D R I V E N BY AC Q U I S I T I O N A N D C O N T I N U E D I M P R OV E M E N T I N P R O F I TA B I L I T Y O F O U R OT H E R RV B U S I N E S S E S
Recreation 3Q FY2018 Results
$11.7
$17.9
6.6%
9.1%
0.0 %
2.0 %
4.0 %
6.0 %
8.0 %
10.0 %
12.0 %
14.0 %
16.0 %
18.0 %
$ 0
$ 10
$ 20
3QFY2017
3QFY2018
Adj. EBITDA ($mm) Margin
36
Net Sales Adjusted EBITDA1
• Net Sales grew 10.9% to $197.3 million, with strong performance from the recently acquired Lance Towables RV business, and increased net sales across most of the brand line-up
• Class A unit volume decreased compared to prior year due to a strategic reduction in the number of different models produced and the delayed timing of new model introductions
• Adjusted EBITDA1 grew 53.0%, driven by the Lance acquisition and increased profitability of certain RV businesses
• Excluding acquisitions, Adjusted EBITDA grew 7.3% year-over-year
• Segment backlog was up 72.3% to $249.5 million, as compared to the end of fiscal year 2017
REV GROUP, INC