returns on investment - office of economic & demographic...
TRANSCRIPT

The Florida Legislature
Office of Economic and
Demographic Research
850.487.1402
http://edr.state.fl.us
Presented by:
Returns on Investment:Key Results, Findings & Recommendations
from FY 2016-2017 Reports
February 9, 2017
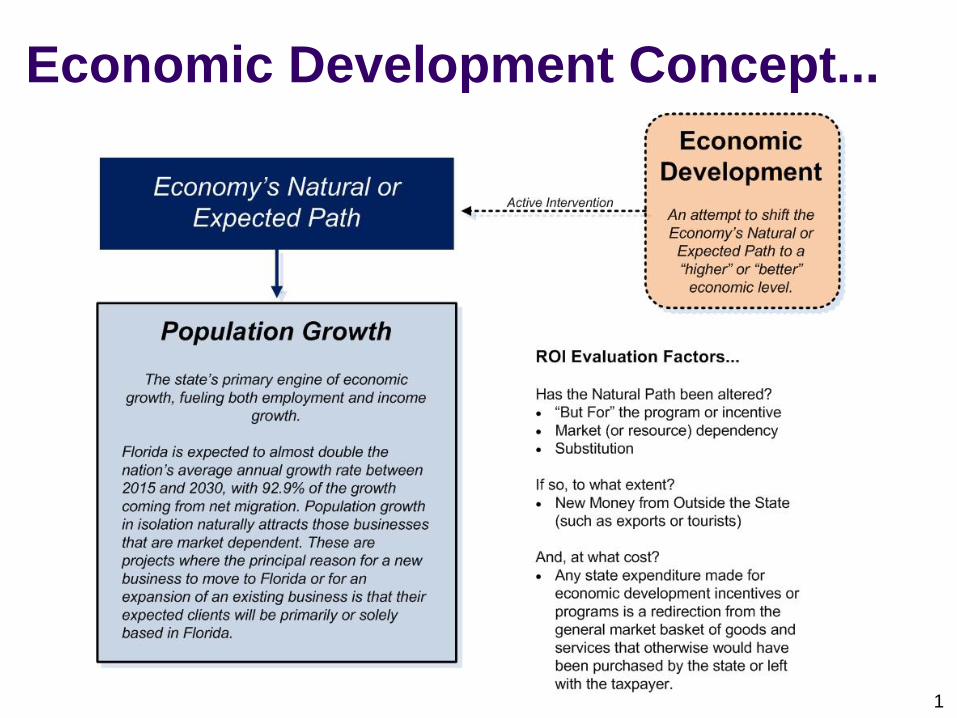
Economic Development Concept...
1

Return on Investment (ROI)...
In EDR’s work, the term “Return on Investment” is synonymous with the statutory
term “economic benefits” which is defined in s. 288.005, Florida Statutes.
2
“The direct, indirect, and
induced gains in state
revenues as a percentage
of the state’s investment.
The state’s investment
includes state grants, tax
exemptions, tax refunds,
tax credits, and other
state incentives.”ROI = 1.0
Cost of the
Investment from
State Revenues or
Appropriation:
$1 million
Taxable Sales Generated
from New Activity(Direct, Indirect and Induced)
This has to be 16.67 times
bigger than the original cost
to the state.
$16.67 million
Multiplied by Sales
Tax Rate
(.06 x 16.67 million)
$1 million
Sales Tax Example...

ROI In Practice...
The measure is ultimately conditioned by the state’s tax policy
which determines what is taxable.
EDR’s evaluation also requires identification of jobs created, the
increase or decrease in personal income, and the impact on
state Gross Domestic Product (GDP) to round out the analysis.
The ROI does not address issues of overall effectiveness or
societal benefit; instead, it focuses on tangible financial gains or
losses to state revenues.
It is entirely possible for a project or program to have a negative
return on investment but still be desired (for example, to
subsidize an essential activity that wouldn’t otherwise have
occurred).
3

Meaning of Returns...
Returns can be categorized as follows:
Greater Than One (>1.0)…the program more than breaks even; the return to the
state produces more revenues than the total cost of the incentives.
Equal To One (=1.0)…the program breaks even; the return to the state in
additional revenues equals the total cost of the incentives.
Less Than One, But Positive (+, <1)…the program does not break even;
however, the state generates enough revenues to recover a portion of its cost for
the incentives.
Less Than Zero (-, <0)…the program does not recover any portion of the
incentive cost, and state revenues are less than they would have been in the
absence of the program because taxable activity is shifted to non-taxable activity
or the costs are greater than the expected benefit.
The numerical ROI can be interpreted as return in tax revenues for each dollar
spent by the state. For example, a ROI of 2.5 would mean that $2.50 in tax
revenues is received back from each dollar spent by the state.
4

5
Ranked Incentives and Investments STATUSFlorida Sports Foundation Grant Program 5.6
Economic Evaluation of Florida’s Investment in Beaches 5.4
Qualified Target Industry (QTI) 4.4 6.4
International Offices Program 4.0
VISIT FLORIDA Advertising 3.2
Transportation: Seaports Program Area 2.7
Export Assistance Program 1.9
Transportation: Aviation Program Area 1.7
Quick Action Closing Fund (QACF) 0.60 1.1
Entertainment Industry Sales Tax Exemption (STE) 0.54
Capital Investment Tax Credit (CITC) 0.43 2.3
Entertainment Industry Financial Incentives Program (Tax Credit or FTC) 0.43
Brownfield 0.30 1.1
Professional Sports Franchise Incentive 0.30
Transportation: Roads & Highways 0.19
New Markets Development Program 0.18
Spring Training Baseball Franchise Incentive 0.11
Innovation Incentive Program (IIP) 0.10 0.20
Quick Response Training Program 0.09
Urban High-Crime Area Job Tax Credit 0.07
Transportation: Public Transit 0.05
High-Impact Sector Performance Grant (HIPI) 0.05 0.70
Transportation: Rails 0.02
Enterprise Zones -0.05
Professional Golf Hall of Fame Facility Incentive -0.08
International Game Fish Association World Center Facility Incentive -0.09
State Loses All of Its Investment
(plus incurs additional costs)
Return On Investment Analyses
Conducted by the Office of Economic and Demographic Research
CURRENT
ROI
PRIOR
ROI
More than Breaks Even
(State makes money from the investment)
Does Not Break Even
(however, the State recovers a portion of the
cost)

Tourism
Florida Sports
Foundation
Grant
Program
Florida’s
Investment in
BeachesExports
International
Offices
Program
VISIT
FLORIDA
Advertising
Transportation:
Seaports
Program Area
Export
Assistance
Program
Transportation:
Aviation
Program Area
Tourism and Exports both bring new dollars into the state and grow the economy.
Seven of the “Top 8” share the same reason for being there.
6

Some Programs Have ROIs That Are Dampened by the
State’s Tax Structure, But Are Important to the Economy...
7
3-Year Average Real
Gross Domestic Product
(Millions of $)
3-Year Average Real
Disposable Income
(Millions of $)
Roads & Highways Program $18,962.8 $20,546.7
Aviation Program $9,093.5 $9,867.7
Seaports Program $6,396.4 $6,920.3
Qualified Target Industry Tax Refund $773.3 $544.3
Quick Action Closing Fund $666.3 $446.0
Capital Investment Tax Credit $426.3 $299.0
Public Transit Program $411.7 $446.3
New Markets Development Program $154.2 $105.8
Rails Program $88.6 $96.0
Innovation Incentive Program $56.0 $52.0
Brownfield Redevelopment Bonus Tax Refund $1.6 $1.4
High-Impact Sector Performance Grant $0.7 $0.7
RETURN-ON-INVESTMENT REAL GDP & REAL DISPOSABLE PERSONAL INCOME
Progam (Highest to Lowest By Real GDP)
Transportation Programs 3-Year Average: FY2013-14 to FY2015-16
Economic Development Programs 3-Year Average: FY2012-13 to FY2014-15
Florida’s Real GDP in 2015 was $795.0 billion. This means the Roads & Highways program area represented
about 2.4% of the economy. It averaged a return in net state revenues of nearly $825 million per year during
this period, but its ROI was only 0.19 (meaning the state of Florida received only 19 cents back in tax revenue
for every dollar spent). This dichotomy has to do with the state’s tax structure and the cost of the program.

Additional Measure to Supplement ROI:
Net GDP per State Dollar...
8
Program Return on
Investment Net GDP per State Dollar
Aviation Program* 1.718 (3) 44.136 (3) Brownfield Redevelopment Bonus Tax Refund 0.302 (6) 7.281 (6) Capital Investment Tax Credit 0.434 (5) 19.170 (5) High-Impact Sector Performance Grant 0.051 (11) 0.840 (11) Innovation Incentive Program 0.095 (9) 2.798 (9) New Markets Development Program 0.184 (8) 7.189 (7) Public Transit Program* 0.053 (10) 1.795 (10) Qualified Target Industry Tax Refund 4.372 (1) 158.725 (1) Quick Action Closing Fund 0.577 (4) 25.392 (4) Rails Program* 0.025 (12) 0.625 (12) Roads & Highways Program* 0.194 (7) 3.963 (8) Seaports Program* 2.705 (2) 69.822 (2) *Transportation numbers are calculated from analyses of 5 future years, all other values are of 3 historic years Note: Values in parenthesis indicate rankings in the specified measure.
The additional measure considers the change in state GDP resulting from the state’s tax dollars
contributed. This measure allows policy makers to identify programs that have a significant
impact on the state’s economy, as measured by GDP, even if they have a minimal impact on state
tax revenues.
When interpreting Net GDP per State Dollar, values greater than zero indicate that the state
economy has expanded as a result of the program. Values below zero indicate that the state
economy has contracted as a result of the program.

Other Programs Have Design Flaws That Are
Revealed by the ROIs...
The now common use of escrow was the major factor negatively affecting the return on
investment for the QACF program. Relative to the prior analysis, the Department of
Economic Opportunity (DEO) has fully implemented its authority to reserve future grant
funds for a project by placing the awarded funds into an escrow account managed by
Enterprise Florida, Inc. The funds remain in the account until such time that it meets
specific contractual milestones such as job creation and/or capital investment. This
prevents the funds from reaching the economy.
While not specific to QACF, EDR has previously studied the two types of funding models:
Reserve Scenario...ROI of 0.6 over a five-year-period.
Pay-As-You-Go Scenario...ROI of 2.6 over a five-year-period.
With respect to state revenues, the Reserve Scenario does not break even, meaning the
state only recovers a portion of its cost. In contrast, the Pay-As-You-Go Scenario more
than recovers its cost.
Florida’s economy is overall better off under Pay-As-You-Go Scenario.
The state’s Gross Domestic Product (GDP), Output, Personal Income, and Job Creation
are all higher under Pay-As-You-Go.
QACF’s drop from an ROI of 1.1 to 0.6 is consistent with the expected results from EDR’s
more general study.
9

Economic Results...
While the state’s obligation is the same over the entire lifetime of the
commitments, the difference in the ROIs between the two scenarios is
due to the timing and amount of the release of the initial investment. In
one case, the entire investment is pulled from alternative expenditures,
whereas in the other case, those expenditures continue until the funds
are released into the economy.
The reserve feature of QACF effectively makes the initial expenditure
nonproductive. In the Reserve Scenario, the state is investing entire
future expenditure for the exact same increase in business activity and
capital investment that a staged investment would have achieved on a
pay-as-you-go basis.
The Reserve Scenario does this by removing those dollars from
circulation within the economy, thus negating the multiplier effect of the
spending. This can also be thought of as the opportunity cost for this
approach.
10

Repercussions of a Reserve...
The money is idle from the moment it hits the reserve until it is released back into
the economy.
Idle money has an opportunity cost.
From an economic perspective, lost economic activity.
From the state’s perspective, forgone state expenditures on alternative
investments—either through appropriation to other programs or through tax relief.
From an individual taxpayer’s perspective, forgone savings or consumption that
could have occurred otherwise; essentially, taxes are being paid before they are
needed.
For these reasons, the creation of a reserve is ultimately the result of a policy
decision where the desired benefits are deemed to outweigh the costs described
above.
For example, the state’s Budget Stabilization Fund fulfills an overarching purpose
of self-insuring the state against emergencies and economic downturns.
11

Recommendations Based On
FY 2016-2017 Reports...
Continue to focus on cost-efficient programs, practices and
infrastructure that benefit the flow of new money into the state. These
programs, practices and infrastructure should not substitute for
activity that would have otherwise occurred or that are market
dependent, especially on Florida’s population growth. Examples
include activities that induce or facilitate tourism and exports.
Modify the law to include an additional measure for Net GDP per
State Dollar. While ROIs are an important metric for discretionary
programs, policy makers have greater considerations than simply
aligning to the state’s tax code for certain public programs and
investments in infrastructure.
Change DEO’s current practice of using Escrow for the Quick Action
Closing Fund (QACF) to Pay-As-You-Go. As of December 31, 2016,
the Escrow account had a balance of $117.5 million.
12