return to the city of water: quantifying change in the venetina canals
DESCRIPTION
This project addressed the rumors spreading through the city of Venice, Italy regarding an alteration in the canal system. Residents have reported a change of flow and a movement of the watershed that influences the Venetian canals. Development and projects such as MOSE have exacerbated these concerns. This project addressed these rumors by analyzing the change of the canal system through hydrodynamics and tide delay studies.TRANSCRIPT

An Interactive Qualifying Project Report Submitted to the faculty
Of
In partial fulfillment of the requirements for the
Degree of Bachelor of Science
By
Alison Corriveau Jessica DiToro
Carlos Martinez Luna Brian Scully
Advisors
Fabio Carrera James Cocola

2
Authorship Page Each member of ‘Team Rii’ contributed equally to the research, data collection, analysis and write-
up of this report.
Jessica DiToro, Alison Corriveau, Carlos Martinez Luna & Brian Scully

3
Abstract This project addressed the rumors spreading through the city of Venice, Italy regarding an alteration in the
canal system. Residents have reported a change of flow and a movement of the watershed that influences the
Venetian canals. Development and projects such as MOSE have exacerbated these concerns. This project
addressed these rumors by analyzing the change of the canal system through hydrodynamics and tide delay
studies.

4
Acknowledgements Team Rii would like to thank… …The Istituzione Centro Previsioni e Segnalazioni Maree for taking the time out of their busy schedules to give us a tour of their facility, to provide us with daily tide forecasts through personal email and to provide us with the details that we needed to complete this project. ...UNESCO and Insula for providing us with data and information from their past studies that were crucial to our project ...And lastly to our advisors Professor Fabio Carrera and Professor James CoCola for without their guidance we would not have been able to complete this project in such a sucessful manner. Grazie Mille!

5
Contents Authorship Page ......................................................................................................................................... 2
Abstract ........................................................................................................................................................ 3
Acknowledgements .................................................................................................................................... 4
List of Figures ............................................................................................................................................. 7
List of Tables ............................................................................................................................................... 9
List of Appendices ...................................................................................................................................... 9
Executive Summary ................................................................................................................................. 10
Studying Changes in Hydrodynamics over Time ..................................................................................... 10
Identify Tide Delay .................................................................................................................................. 13
Setting a Standard for Sustainable Canal Data ....................................................................................... 14
Recommendations .................................................................................................................................. 14
1. Introduction ........................................................................................................................................ 15
2. Background ....................................................................................................................................... 17
2.1 Venetian Lagoon ............................................................................................................................... 17
2.2 The Inner Canals of Venice ................................................................................................................ 17
2.2.2 Dredging the Canals ................................................................................................................... 18
2.2.3 The Canals and Transport .......................................................................................................... 19
2.3 Tides and the Venetian Canals ................................................................................................... 19
2.3.1 The Tides and Astronomical Factors .......................................................................................... 19
2.3.2 Meteorological Factors Affecting Tides ..................................................................................... 20
2.3.3 Tide Forecasting for the Venetian Canals .................................................................................. 21
2.3.4 Tide Measurement ..................................................................................................................... 23
2.3.5 Tide Delay ................................................................................................................................... 24
2.3.6 Tidal Wave Propagation ............................................................................................................. 24
2.4 Hydrodynamics of the Venetian Canals ..................................................................................... 24
2.4.1 The Canals and Subsidence ........................................................................................................ 25
2.4.2 The Canals and Climate Change ................................................................................................. 25
2.4.3 Mean Sea Level Trends .............................................................................................................. 25
2.4.4 Friction’s Effect on the Flow ...................................................................................................... 26
2.4.5 Canal Intersections and Segments ............................................................................................. 26
2.4.6 The Hydrodynamic Influence of Rii Tera .................................................................................... 26

6
2.5 The Lagoon Watersheds ................................................................................................................... 27
2.6 Past WPI Hydrodynamic Studies ....................................................................................................... 28
3. Methodology ....................................................................................................................................... 30
3.1 Area of Study Selection ..................................................................................................................... 31
3.2 Hydrodynamics: Measuring Flow Velocities ..................................................................................... 32
3.2.1 Scheduling of Measurements .................................................................................................... 33
3.2.2 Measurement Tool ..................................................................................................................... 33
3.2.3 General Procedure ..................................................................................................................... 34
3.2.3 Data Collection ........................................................................................................................... 38
3.3 Measuring Tide Delays ...................................................................................................................... 38
3.3.1 Scheduling of Measurements .................................................................................................... 38
3.3.2 Measurement Tool ..................................................................................................................... 39
3.3.3 General Procedure ..................................................................................................................... 40
3.3.4 Data Collection ........................................................................................................................... 40
3.4 Venipedia: Maintaining Canal Data .................................................................................................. 41
4. Results ............................................................................................................................................... 42
4.1 Hydrodynamic Data .......................................................................................................................... 42
4.1.1 Canal Segments Measured ........................................................................................................ 42
4.1.2 Directional Changes with Respect to Tides ................................................................................ 42
4.1.3. Maximum Velocities.................................................................................................................. 43
4.2 Tide Delay Data ................................................................................................................................. 46
4.2.1 Canal Segments Measured ........................................................................................................ 46
4.2.1 Canal Segment Tide Delays vs. Tide Forecasting .......................... Error! Bookmark not defined.
4.2.2 Canal Segment Tide Delays vs. Punta della Salute Real-time Data ............................................ 47
4.2.3 Canal Segment Tide Delays vs. Misericordia Real-time Data ..................................................... 48
4.3 Maintainable Data Results ................................................................................................................ 49
5. Analysis .............................................................................................................................................. 50
5.1 Hydrodynamics ................................................................................................................................. 50
5.1.1 Effect of Dredging on Canals ...................................................................................................... 50
5.1.3. Flow Direction Comparisons ........................................................................................... 57
5.2 Tide Delay ....................................................................................................................................... 62
5.2.2 Delays at High Tide ..................................................................................................................... 62

7
5.2.3 Delays at Low Tide ..................................................................................................................... 63
5.2.4 Watershed Patterns in Data ....................................................................................................... 64
6. Recommendations ........................................................................................................................... 66
6.1 Lessons Learned in the Field ............................................................................................................. 66
6.2 The Future of Hydrodynamics Studies .............................................................................................. 67
6.3 The Future of Tide Delay Studies ...................................................................................................... 69
6.4 The Future of Canal Data .................................................................................................................. 70
6.5 Expanding the Area of Study ............................................................................................................. 70
6.4.1 Sedimentation Accumulation .................................................................................................... 70
6.4.2 Boat Traffic ................................................................................................................................. 70
6.4.3 Infrastructure Damage ............................................................................................................... 71
WORKS CITED ........................................................................................................................................ 72
List of Figures Figure 0.1: Maps depicting past area of study (left) and 2010 area of study (right) .................................. 11
Figure 0.2: Map depicting canal velocity change between the 90’s and 2010 at the incoming tide ......... 11
Figure 0.3: Map depicting canal velocity change between the 90’s and 2010 at the incoming tide ......... 12
0.4 Area of study for Tide Delay .................................................................................................................. 13
Figure 0.5: Four tide delay maps in respect to high tide (top) and low tide (bottom) and Salute (left) and
Misericordia (right) ..................................................................................................................................... 14
Figure 2.1 Venetian Lagoon and its inlets to the Adriatic Sea .................................................................... 17
Figure 2.2: Map of Sestieri .......................................................................................................................... 18
Figure 2.3: A boat being used for deep-water dredging ................................................................................ 18
Figure 2.4: The effect of lunar forces on the surface waters of earth ........................................................ 20
Figure 2.5: The winds that affect the Venetian Lagoon and tides .............................................................. 21
Figure 2.6: A chart showing the difference ................................................................................................... 22
Figure 2.7: The statistical model of all meteorological and astronomical data in Centro Maree ..................... 22
Figure 2.8: The warning station at Centro Maree .......................................................................................... 23
Figure 3.1: Area of hydrodynamics study .................................................................................................. 30
Figure 3.2: Area of tide delay study ............................................................................................................ 31
Figure 3.3: An ideally accessible canal for hydrodynamics testing ............................................................. 32
Figure 3.4: Tide chart depicting the forecast for the day before, day of and day after the new moon and
ideal hydrodynamics testing times ............................................................................................................. 33
Figure 3.5: Hydrodynamic Device ............................................................................................................... 34
Figure 3.6: Example of start and end points for hydrodynamics testing .................................................... 35
Figure 3.7 Hydrodynamics testing – Device moving with the current of the canal .................................... 36

8
Figure 3.8: Hydrodynamics testing – Throwing the device into the canal ................................................. 37
Figure 3.9: Tide chart depicting the forecast for the day before, day of and day after the new moon and
ideal tide delay testing times ...................................................................................................................... 38
Figure 3.10: The tide delay testing device – “plumb-bob” ......................................................................... 39
Figure 3.11: Measuring the tide delay above the sidewalk (left) and below the sidewalk (right) ............. 40
4.1: Map showing 2010 area of hydrodynamics study split up by influence of dredging .......................... 42
Figure 4.2: Directional behavior of canal segments during changes in tides ............................................. 43
Figure 4.3: Map depicting 2010 velocities and directions for both incoming and outgoing tides ............. 44
Figure 4.4: Speeds Distribution for Canal Segments during Incoming Tide................................................ 45
Figure 4.5: Speed Distribution of Canal Segments Unaffected by Dredging during Outgoing Tide ........... 45
4.6 Area of Tide Delay Study ....................................................................................................................... 46
Figure 4.7: Map of low tide delay times with respect to the Punta della Salute low tide time ................. 47
4.8 Map of low tide delay times with respect to the Punta della Salute low tide tim ................................ 47
Figure 4.9: Map of high tide delay times with respect to the Misericordia high tide time ........................ 48
4.10 Map of low tide delay times with respect to the Misericordia low tide time ..................................... 48
4.11 Basic Canal Infobox on Venipedia ....................................................................................................... 49
Figure 5.1: 1999 Incoming Tide Flow Directions of Canal Segments Possibly Affected by Dredging in 1999
.................................................................................................................................................................... 50
Figure 5.2: 2010 Incoming Tide Flow Directions of Canal Segments Possibly Affected by Dredging in 1999
.................................................................................................................................................................... 51
Figure 5.3: 1999 Outgoing Tide Flow Directions of Canal Segments Possibly Affected by Dredging in 1999
.................................................................................................................................................................... 52
Figure 5.4: 2010 Outgoing Tide Flow Directions of Canal Segments Possibly Affected by Dredging in 1999
.................................................................................................................................................................... 53
Figure 5.5: Graph depicting the maximum velocities for incoming tides ................................................... 54
Figure 5.6: Map depicting the direction of flow and change in flow velocity for incoming tides between
1999 and 2010 ............................................................................................................................................ 55
Figure 5.7: Image depicting the rumors of the watershed change between 1968 and 2009 .................... 56
Figure 5.8: Graph depicting the maximum velocities for outgoing tides ................................................... 56
Figure 5.9: Map depicting the direction of flow and change in flow velocity for outgoing tides between
1999 and 2010 ............................................................................................................................................ 57
Figure 5.10: Map depicting the direction of flow of 1999 incoming tides ................................................. 58
Figure 5.11: Map depicting the direction of the flow of 2010 incoming tides ........................................... 58
Figure 5.12: Map depicting the direction of flow of 1999 outgoing tides .................................................. 60
Figure 5.13: Map depicting the direction of flow of 2010 outgoing tides .................................................. 60
5.14 High tide delays with respect to Punta della Salute ........................................................................... 62
5.15 High tide delays with respect to Misericordia .................................................................................... 62
5.16 Low tide delay with respect to Punta della Salute .............................................................................. 63
5.17 Low tide delays with respect to Misericordia ..................................................................................... 64
6.1 Suggested canals for future studies for hydrodynamics ....................................................................... 68

9
List of Tables
Table 1: Hydrodynamics Field Data ............................................................................................................ 38
Table 2: Tide delay field form ..................................................................................................................... 41
Table 3: Velocities of canal segments possibly affected by dredging in 1999 during incoming tides ........ 52
Table 4: Velocities of canal segments possibly affected by dredging in 1999 during outgoing tide .......... 53
List of Appendices APPENDIX A – Literature Review APPENDIX B – Hydrodynamics Device APPENDIX C – Schedule for Hydrodynamics Testing APPENDEX D – Hydrodynamics Field Forms APPENDIX E – Past Hydrodynamics Data and Results APPENDIX F – Hydrodynamics Comparisons Between Summer 1999 and Fall 2010 APPENDIX G – Hydrodynamics Database APPENDIX H – Tide Delay Device APPENDIX I – Schedule for Tide Delay Testing APPENDIX J – Tide Delay Field Forms APPENDIX K – Tide Delay Table of Results APPENDIX L – Deliverables: Other Maps APPENDIX M – Calendar APPENDIX N – Budget

10
Executive Summary The canals of Venice are an integral part of daily life in the “City of Water.” The canals serve a dual purpose
as aquatic transportation routes and sewage disposal outlets. People that live so close to the water have a
greater need for knowledge about how the water acts day to day. This project, through the analysis of
hydrodynamics and tide delay, aimed to aid in the understandings of the workings of the Venetian canals and
any how the y change over time.
Multiple institutions, such as UNESCO, Insulaa S.pA. and the Instituzione Centro Previsionmi e Segnalazioni Maree
(Centro Maree), have been founded in Venice to observe the canals and collect data about their behavior. The
Centro Maree has been forecasting tidal levels in Venice for over 30 years, using a series of statistical and
astronomical models. UNESCO and Insula have also been conducted more specific studies of the canals and
the areas of hydrodynamics, sedimentation, boat traffic and infrastructure damage and how they all factor
into one another since the 1990s. This information, which is gathered through studies, is useful for planning
maintenance and preservation.
Worcester Polytechnic Institute students have been working through the Venice Project Center since the
1980s to study various aspects of Venice. In 1990 the first study on tides and hydrodynamics of the canals
was completed, setting a standard that was expanded over a course of nine years (1990-1999). Many of these
standards have been adopted by collaborative institutions like UNESCO and Insula, S.p.A .
The hydrodynamics database assembled by WPI and its Venetian collaborators was last revisited in 1999.
Since then, there has been great speculation, both in colloquial and scientific circles, about change in the
hydrodynamics of the canals. The objectives of this project were to revisit the hydrodynamics research from
the 90‟s and analyze the results for potential changes, to measure tidal delay in the inner canals, and to set a
standard for making canal research accessible for future studies through the wiki based website Venipedia.
Studying Changes in Hydrodynamics over Time The hydrodynamic portion of this project consisted of measuring 52 canal segments that were previously
measured in between 1990 and 1999. The methodology established by the hydrodynamics projects in the 90‟s
was used for consistency.

11
Figure 0.1: Maps depicting past area of study (left) and 2010 area of study (right)
Velocities (speed and direction) of the flow of canal segments were measured and compared to the speeds
recorded in 1999. This comparison was conducted for both in-coming and out-going tides.
Figure 0.2: Map depicting canal velocity change between the 90’s and 2010 at the incoming tide

12
Figure 0.3: Map depicting canal velocity change between the 90’s and 2010 at the incoming tide
The recorded changes in speeds, from 1999 to 2010, for in-tide and out-tide were normally distributed. The
majority of the canal segments have not changed direction of flow between 1999 and 2010 (66.7%). However,
the primary location for drastic change in speed was in Dorsoduro (in-tide became incredibly faster while out-
tide slowed down drastically). The primary location for drastic changes in flow direction was in Santa Croce
(in-tide changed from north following and stagnant to south flowing; and out-tide south flowing to north
flowing); and Dorsoduro (in-tide changed from stagnant to south flowing, out-tide south flowing to
stagnant). These changes provide evidence towards the idea that the watershed has changed in a way that
more water is entering the south end of the Canale Grande during in-tide, but cannot leave through the north
end due to another flow that surrounds the island. If this is the case the speeds and directions have changed
due to the fact that at in-tide the water that is built up at the north end of the canal has nowhere to go except
into the tributaries of Santa Croce and Dorsoduro. Then in the out-tide the water can leave the south end of
the Canale Grande freely, resulting in less need for water to travel through the same Santa Croce and
Dorsoduro tributaries

13
Identify Tide Delay Tide delay measurements were spread out across Venice and a total of 59 canal segments were measured. 37
of these measurements occurred at high tide and 22 occurred at low tide. The data collected consisted of
observing when the water level reached its most extreme points in the tide cycles (low tide and high tide).
Then to determine when the time difference of the tide arrival at the measured canals, the recorded time of
extreme was compared to the time of the extreme at the tide gauge stations surround Venice, Punta della
Salute and Misericordia.
0.4 Area of study for Tide Delay
As water enters and exits Venice, there are patterns of water distribution that seem to directly correlate to the
tide delay, these patterns are illustrated below. During the low tide, the water seems to exit mostly through
the southern end of the Canale Grande. As the outer canals empty out, water gets dragged from the center of
the island. During the high tide, water possibly originating from the Malamocco Inlet enters through the
northern Grand Canal. Then, water enters from the southern end of the Grand Canal originating from the
Lido Inlet. When the waters meet near the Santa Croce/San Polo border, the water builds up, creating a
watershed.

14
Figure 0.5: Four tide delay maps in respect to high tide (top) and low tide (bottom) and Salute (left) and Misericordia (right)
Setting a Standard for Sustainable Canal Data The third objective was to share the data in an accessible way. This was done by creating a series of maps and
articles that are hosted on Venipedia, an online wiki about Venice developed by WPI students. Each canal has
an article that details its morphology, location, history, and previous study results. This method of data
storage may be used as the VPC standard for cataloging canal data for future projects.
Recommendations Although much was achieved in the time span of this project, there is opportunity to expand the study. For
hydrodynamics, future IQP groups should plan to study the following canal segments: those in the Giudecca;
those which connect to the lagoon directly in northern Cannaregio; and those which connect to the Canale
Grande in southern Cannaregio, and northern San Polo. Seeing how these canals have changed can provide
more support for the change in the watershed. In terms of tide delay, the watershed can be further studied in
Western Venice. Finding where the source of the in-coming water into the Canale Grande is recommended to
help make sense of any emerging patterns. As far as the sharing of all this information is concerned, future
groups should follow a standard for making the data easily maintainable, so that the canals database can
continue to evolve.

15
1. Introduction Life on earth is made possible due to the abundance of water. For this reason, civilizations have been
established around oceans, seas, lakes, and lagoons. An aquatic-side city requires knowledge about the
behavior of its neighboring water system in order to for many facets of urban planning. When water behaves
in expected or extreme manners, it can result in the loss of human life, homes, and resources. Recently the
horrors of the 2004 tsunami in Indonesia left 11 countries devastated. With a death told of 150,000 it has
been referred to as the deadliest tsunami in history.1 Then in 2005, the tragedy of Hurricane Katrina struck
the Gulf Coast of the United States where 1836 died, 275,000 homes were destroyed, and over $110 billion in
damage have been estimated2. Lastly, in June of 2010, China‟s south-east Jiangxi providence was hit by a
massive flood due to an unusually extreme storm-season, where over 800,000 were left homeless, and
approximately 150 people lost their lives3. Even though it has been up to five years since these natural
disasters occurred, the recovery process is still in the beginning stages4. Understanding water bodies and the
elements that influence them is the best way to prevent disasters from occurring. This will ultimately save
lives and the money of those involved. Gathering hydrodynamic information for accurate forecasting and for
reactive and proactive urban maintenance is incredibly useful for the longevity of any civilization by the sea.
Venice is the City of Water, where the “roads” are a complex system of canals. Venetians use these canals to
travel from one place to another when they do not travel by foot. They are also used to dispose of sewage
and other domestic wastes. These canals are a way of Venetian life and no one could imagine living without
them. However, living so close to the water poses a number of problems for the locals as unique as the
lifestyle is itself. High water levels due to tides from the Adriatic and meteorological factors result in flooding
of the city. This flooding can be minor, like acque alte where boots must be worn for a few hours, to severe,
such as the Great Flood of 1966 that destroyed irreplaceable artwork around the city and left 5,000
homeless.5 This flooding from the canals can result in damages to everything from personal and domestic
goods to commercial goods to infrastructure. It also leaves people „stranded‟ in parts of the island for hours
when they cannot access other parts due to flooding, while others simply return home with soaking wet shoes
and pants. It can also, in rare cases, pose a risk to human health. The solutions to these problems require an
accurate tide forecasting system to be in effect with a thorough understanding of the workings of the
hydrodynamics of the canals.6.
1 National Geographic – The Deadliest Tsunami in History? 2 HurricaneKatrinaRelief.com 3 The Guardian United Kingdom News – China Devastated by Floods 4 Fox News – Katrina Five Years Later: Slow Recovery in 9th Ward 5 The Telegraph – Venice‟s Great Flood in 1966 Destroyed Art and Homes 6 Theory and Application of Wave Propagation and Scattering in Random Media

16
The Instituzione Centro Previsioni e Segnalazioni Maree has been forecasting the tide levels for the city of Venice
for over 30 years. Their goal is „to guarantee maximum information on tides and an efficient and immediate
alerting service in case of exceptionally high tides‟.7 This is achieved through statistical modeling of all
meteorological and astronomical data from both the Adriatic Sea and the Venetian Lagoon. The tide center
focuses almost all of its efforts and energy on the waters surrounding the island, not the waters of the inner
canals. This inner canal data could be useful for even more accurate predictions of tide levels and
corresponding times in specific parts of this city.
In the 1990s WPI began studying the inner canals of Venice. Over the course of 10 years students have
analyzed over 130 of the 180 canals. In 1999 a WPI project group conducted a final study on some of the
Northern canals of the island, and compiled all the data collected over that decade into one database8. This
database dates back to before the turn of the century, and since then no new hydrodynamics data has been
collected. Since then, there has been speculation in Venice that the canals have begun to flow differently. This
inquisition as to the change of the canals provides a validation for revisiting hydrodynamic measurements.
The aim of this project was to quantify changes in the flow of the canals. This was done in part by first
measuring the hydrodynamics of canal segments that have been previously studied. This projects data was
then analyzed against the existing database in order to visualize any patterns of change. Secondly, this project
explored the timing of the tides. This was accomplished through measurements of the tide delay across a
wide range of canal segments. The behavior of the tidal delay was then correlated with the hydrodynamic
information. Thirdly, this project‟s data was complied with the existing database and stored in an online
catalog, so that the database can be updated over time.
7 Citta‟ di Venezia - Instituzione Centro Previsioni e Segnalazioni Maree 8 Hydrodynamics of the Inner Canals of Venice. (E‟99)

17
Figure 2.1 Venetian Lagoon and its inlets to the Adriatic Sea
2. Background Venice is a cityscape woven together by waterways. Over 170 canals create the framework for the city‟s
landmasses and transportation routes. This array of waterworks act as the arteries of Venice. They serve to
connect, transport, cleanse and supply the city with the essentials of urban life.
2.1 Venetian Lagoon The Venetian Lagoon is estimated to be about 6,000 years
old. This lagoon, the largest of the Adriatic Sea, was created
by the silting of three rivers: the Piasve and Sile to the north
of the Lagoon and the Brenta to the south. The three rivers
carried eroded soil into the Adriatic Sea where it slowly
accumulated and created two types of islands. One, barene, are
low-lying islands capable of supporting some types of grassy
vegetation. The other type, velme, are sandbars which are only
exposed to the air by low tides. Velme are incapable of having
any sort of vegetation. These islands eventually became lidi,
or long thin islands that lie just above sea level. The islands kept growing which resulted in closing off the
waters surrounding the river mouths from the Adriatic.9
The Lagoon is connected to the Adriatic by three inlets. The Northern Lagoon is fed by the Lido Inlet,
which is the widest with a width of 900 meters. The Central Lagoon is fed by the Malamocco Inlet, which is
the deepest with a depth of 20 meters. The Southern Lagoon is fed by the Chioggia inlet which is the
smallest with a maximum depth of 8 meters and a width of 400 meters. The flows in these inlets are tidally
driven, which means water passes through them due to the tide coming into the lagoon from the Adriatic.10
2.2 The Inner Canals of Venice There are 182 canals in Venice which separate the city into six regions known as sestieri. The six sestieri, along
with the area of Dorsoduro, known as the Giudecca, can be seen in fig 2-2. Natural canals can be found at the
boundaries of the sestieri. The canals separate the city into 120 islands that make up Venice proper.
9 Long-term variations on sea level and tidal regime in the lagoon of Venice 10 Temporal variations of water flow between the Venetian Lagoon and the open sea

18
Figure 2.2: Map of Sestieri
In the days before modern septic systems, Venice‟s canals acted as an urban sewage marvel. The waterways
carry salt water from the surrounding Venetian Lagoon, which is fed by the Adriatic Sea. The movement of
the tides flushes away the waste that is deposited into the canals. This sewage system has endured over the
years and is still the main method of sewage removal from Venetian homes. However, over time, there is a
build-up of sediment from sewage and sea debris at the bottom of the canals11.
2.2.2 Dredging the Canals
Sedimentation is the accumulation of solids at the bottom of the canals. These solids are composed of sewage
waste, masonry debris, and sea deposits12. When sediment builds up on the canal floors, the flow through
them is directly affected.
Over time sediment builds up in the canals. As a result, the canals need to be dredged periodically in order to
maintain safe water conditions and insure the ability of boats to navigate the waterways. There are two main
types of dredging: deep-water dredging and dry-bottom dredging. Depending on the situation either one or
both of these types of dredging can be used to dredge a particular canal.13
11 Quantification of sediment sources in the city of Venice, Italy (E‟99) 12 Ibid 13 Insula Website: “Canal Excavation”
Figure 2.3: A boat being used for deep-water dredging

19
2.2.3 The Canals and Transport
The canals are used as waterways for daily boat traffic. Even though gondolas and other row boats are still in
use, most of the traffic is from motorized boats. The use of motor vehicles in the canals adds a layer of
anthropogenic phenomena to the state of the canals.
2.3 Tides and the Venetian Canals
The island of Venice is completely surrounded by a body of water known as the Venetian Lagoon. This
lagoon is fed by the Adriatic Sea. The tides of the Adriatic Sea directly control the water level and tides of the
Lagoon as well as the canals. There are two factors that influence these tides, these are astronomical and
metrological.
2.3.1 The Tides and Astronomical Factors
The word tide is a generic term used to describe the visible influence of the moon and the sun on the world‟s
waters. Along the surface of the earth there is an inward gravitational force and this pulls the water in the
direction of the planet. The moon and the sun have an inverse influence on the waters. Their gravitational
pull is „superimposed‟ to that of the earth‟s resulting in the drawing out of the water directly beneath the
body.14
The lunar cycle is approximately 29 days with four phases. There is the full and new moon, known as sizigia
in Italy. And there is the waning and half waxing, qadrantura. Sizigia is when the moon is directly above or
directly opposite the fixed point of reference on earth. Quadrantura is directly in the middle of the two sizigia
occurrences. Sizigia result in the most extreme tides due to the waters of the oceans „heaping‟ (two horizontal
flows of water coming together at one destination). Likewise quadrantura results in the least extreme tides due
to the compensating maximum withdrawal of water from the regions around the earth that are between the
areas of water being pulled.15
14 Our Restless Tides (‟98) 15 Our Restless Tide (‟98)

20
Figure 2.4: The effect of lunar forces on the surface waters of earth
The sun also plays a role in the tidal fluctuations of earth, but to a much lesser degree than the moon. This is
because the moon is much closer to the earth than the sun, thus the sun has a much smaller gravitational
effect. The most extreme influence of the sun is at noon and midnight, just like the moon. The least extreme
influence of the sun is at 6 and 18 hours, for the same compensating reason as with the moon.16
2.3.2 Meteorological Factors Affecting Tides
Major winds can also influence the tide. There are two winds in particular that manipulate the Venetian
Lagoon the most. The first is known as the Bora which comes from the Swiss Alps to the Appenines of Italy
to the Balkans. It is a cold, winter wind that blows northeast to southwest at speeds up to 100 knots. The
second major wind is the Sirocco which is opposite of the Bora. It is formed in Libya and Egypt. It is hot and
can occur year round. It blows southeast to northeast over the Mediterranean Sea carrying excess moisture
resulting in rain and fog.17
16 Ibid 17 MEDEX Winds (‟99)

21
Figure 2.5: The winds that affect the Venetian Lagoon and tides
When a wind of great force and magnitude blows in the same direction as the tide, the tide will accelerate as it
flows in that direction. This results in a higher and more pronounced tide When the winds blow in the
opposite direction than that of the flow, the tide is much lower and less extreme.18
The barometric pressure also has a small role in the workings and alterations of the tides. When there is a
high barometric pressure the height of the tide decreases. When there is a low barometric pressure the height
of the tide increases.19
2.3.3 Tide Forecasting for the Venetian Canals
Tide forecasting is crucial to the daily lives of Venetians. It is important to have an idea of how high the tides
will be in the coming months, and more importantly in the coming days so Venetians (and tourists) can
prepare for high waters. The island of Venice has had a warning siren for unusually high tides since the 1970s;
at the time there was only one siren which was located on the bell tower of San Marco. In
1979 Venice experienced highly damaging floods and from
this the city decided that a better forecasting and warning
program had to be implemented. From this the Instituzione Centro Previsioni e Segnalazioni Maree was created with
the following goal: “to guarantee maximum information on tide and an efficient and immediate alerting
service in case of exceptionally high tide”.20
18 MEDEX Winds (‟99) 19 Ibid
20 Citta‟ di Venezia - Instituzione Centro Previsioni e Segnalazioni Maree

22
The Instituzione carries ou two forms of tide forecasting:
long-term and short-term. Long-term tide forecasting
focuses on the study of lunar and solar cycles, as well as
permanent morphological factors.21
Short-term tide forecasting is much more accurate than
long-term tide forecasting. Current weather and
conditions of the Mediterranean and Adriatic Seas factor
in with the lunar and solar cycles to make tide forecasting
into an almost exact science.5 The Instituzione has a number of
data collecting platforms (several in the Venetian Lagoon,
and one 7 miles into the Adriatic) that collect wind
velocity, wave height and barometric pressure which then
are factored together with the lunar cycle and 20
models(about half statistical and half deterministic) are
drawn up by computer programs to predict the tides for
up to 6 days ahead of time. Scientists at the Instituzione
then overlay the models and statistically average out the
errors to develop a forecast and inform the public of the predicted tides to come. The models that prove to
be the most accurate are analyzed in an attempt to imporve future modeling forecasts.22
The Instituzione will warn the city if the tide is predicted to rise about 110 centimeters (this is known as Acque
Alte or high waters), the warning will occur 3 hours before the predicted high tide is forecasted to arrive. The
warning is a series of sirens, the old air raid sirens along the coast and islands in the lagoon, and more
21 Ibid 22 Ibid
Figure 2.7: The statistical model of all meteorological and astronomical data in Centro Maree
Figure 2.6: A chart showing the difference between high tide and low tide

23
specialized newer sirens within the central portions of the main island. These newer sirens within the
Figure 2.8: The warning station at Centro Maree
city replaced the older air raid sirens; the new alert sirens have the ability to ring at various different tones:
one for each level of Acque Alte (110cm, 120cm, 130cm, 140cm, or higher ). The new sirens also have
speakers, so that forecasters at the center can relay voice messages directly to the city if necessary.23
2.3.4 Tide Measurement
Tides are measured by 52 meteorological and tide gauge stations scattered within the Lagoon. They are
located in waterholes, in harbor inlets, and along the coastline from the Po River dealta to Trieste. Stations
may have a floating tool that gauges and records the tide level electronically every ten minutes. Some have
the ability to read the atmospheric pressure, rain, wind direction and wind speed.24
The tide level measurements refer to the Zero Tide Level at Punta della Salute. This level is identified by a
boundary stone placed on the bank along the Canal della Giudecca, which has been used to record tide
heights in Venice since 1872. This point of reference is close to the tidal gauge station, and this level matched
the Mean Seal Level in 1897.15
23 Citta‟ di Venezia - Instituzione Centro Previsioni e Segnalazioni Maree 24 Long-term variations on sea level and tidal regime in the lagoon of Venice

24
2.3.5 Tide Delay
Over the past 100 years, the tide delay in the Venetian Lagoon has become less significant. The following
graphic compares the tide delay from 1900-1950 to today‟s tide delay.
Figure2.9: An illustration of the change of tide delay times from the early 1900's to today
The current tide propagation delay is not as significant as the one from the first half of the 1900‟s. The 220
minute and 200 minute isopleths have disappeared completely. Also, there is no longer a delay in the outlets,
unlike in the early 1900s. The tidal wave damping power in the lagoon is stronger than the harbor inlets.
Due to the change in the tide delay times, it‟s concluded that this damping capacity has dropped significantly.
2.3.6 Tidal Wave Propagation
Tidal wave propagation is the phenomenon of the tidal waves being spread throughout the lagoon from the
inlets to the Adriatic Sea. In Venice, this process is slowed down by the shape of the canals and low depths.
Also, different atmospheric conditions can change the tide such as air pressure, wind, and the free oscillations
of the Adriatic Sea. Under poor weather conditions, the Lagoon will behave as if it were a single basin by
exchanging volumes of water between the three basins.25
2.4 Hydrodynamics of the Venetian Canals
The ebb and flow of the Venetian canals are influenced by several variables including: the tides, the long term
change in water levels, the physical form of the canal system, and the friction. The canals were formed
25 Theory and Application of Wave Propagation and Scattering tin Random Media

25
naturally before the city did then were later urbanized. Natural and anthropogenic factors can be quantified to
understand their impact on the state of the canals. Knowing the velocity, volume, depth, and quality of the
water in the canals is crucial in order to understand how to maintain them.
2.4.1 The Canals and Subsidence
Subsidence is the gradual sinking of landforms to a lower level as a result of earth movements, or in this case
human interference. The change of the land masses around a body of water can alter the hydrodynamic flow.
The natural rate of subsidence in Venice is 1.27 centimeters per year. In the 1920‟s, this rate accelerated to
5.08 centimeters per year. The main cause for this drastic change was Venice entering its industrial period,
and more specifically when water began being pumped from the subsoil. Soon after, laws were passed
forbidding water removal from below Venice‟s surface, which brought Venice closer to its original rate of
subsidence.26
2.4.2 The Canals and Climate Change
Eustatism, or the worldwide changes in sea level, is mostly caused by climate change, plate tectonics, and
human interference. Climate change is leading to the melting of glaciers, which adds a lot of water to the
oceans.27 The movement of ocean floors constantly adds to the already thick oceanic plates, which causes the
sea level to rise even more.28 Venice‟s sinking naturally caused the sea level to rise in relation to the shore.
The global sea level is expected to increase another 15 centimeters by 2050, and 34 centimeters by 2100.29
2.4.3 Mean Sea Level Trends
This figure covers over 130 years of data collection. In 1872, the global MSL was 150 centimeters below
Punta Della Salute, so that was used as the starting reference point. A chart of this type was also made for
other Adriatic towns where tide gauge systems are located, and they saw very similar oscillations.
The blue line in the graph refers to the mean of the 11 year period that precedes that point. The graph shows
a sharp increase in this moving average between 1930 and 1960. This change was due to high subsidence
processes such as taking water from the subsoil.
26 Lane, Fredrick. Venice: A Maritime Republic 27 Church, J.A., Gregory, J.M., Huybrechts, P., Kuhn, M., Lambeck, K., Nhuan, M.T., Qin, D., Woodworth, P.L. Changes in Sea Level 28 K C Macdonald. Mid-Ocean Ridges: Fine Scale Tectonic, Volcanic and Hydrothermal Processes Within the Plate Boundary Zone 29 U.S. Environmental Protection Agency

26
Figure 2.10: Chart of the Mean Sea Level annual mean values in Venice
2.4.4 Friction’s Effect on the Flow
It is important to understand how the canals themselves influence the flow of adjacent canals. Friction
between the canal wall and the water results in the water along the wall to move slightly slower than the water
in the direct center of the canal30.
2.4.5 Canal Intersections and Segments
Each intersection of two canals results in the alteration of the flow in both canals. When obtaining data, the
canals must be broken into segments that take into account these intersections. This portrays an accurate
representation of the hydrodynamics. A segment ends, and a new one begins at every intersection of canals.
2.4.6 The Hydrodynamic Influence of Rii Tera
Rii tera are canals that have been filled in with rock, gravel and dirt. Rii tera tombati are canals that have been
completely filled in, and rii tera con volti are canals that have been covered over. The rii tera tombati have no
flowing water within them, so they have no affect on the adjacent canal‟s flows. When a rii tera tombati
intersects another canal that is flowing with water, the two segments are treated as one. The rii tera con volti
is treated like any other canal, as it still has a flow of water through it.31
30 Hydrodynamics of the Inner Canals of Venice. (E‟99) 31 Ibid

27
Figure 2.11: Rii tera tomabti (orange) and rii tera con volti (blue) locations
2.5 The Lagoon Watersheds There have been many rumors circulating amongst the Venetians for some time regarding changes in the
flows of the canals, primarily in the northern sestiere of Cannaregio. These rumors come down to one main
idea about a change in the watershed of the Venetian lagoon. Supporters of the idea, such as Umberto Sartori,
believe that the original flow of the water entering the lagoon has changed in the course of 50 years due to
various governmental interventions towards the „sinking‟ of Venice, the most recent example being the
MOSE project. They say that the flows that once used to buffer the island and its canals from those damaging
flows from the South (See in Figure <<__>> 1968 green arrows) have not been redirected. They no longer
buffer the island from those damaging flows, but instead flow directly through the island themselves. This
they claim results in faster currents and more aggressive tides that are rapidly damaging infrastructure that
comes into contact with the canals.32
32 Umberto Sartori - Report on flood-tide in the Lagoon of Venice, 2009

28
Figure 2.12: Artist depiction of watershed change rumors
2.6 Past WPI Hydrodynamic Studies In the year 1990 the first WPI project was completed focusing on the study of the hydrodynamics of the
inner Venetian canals. The last one, until this study, was completed in the summer of 1999.
The first project team from WPI to study the flow characteristics of the canals completed their project, A
Hygienic, Dynamic, and Static Study of the Canals of Venice, in January and February of 1990. Their project focused
on four canals in the Venetian sestiere of Dorsoduro (the southernmost region of the island. They were the
first WPI group to devise a method for collecting measurements. This projects group‟s results were later ruled
inaccurate, as they used a cork as the flotation portion of their device. This resulted in the device flowing with
the surface water instead of the central flow of the canal and made their results highly susceptible to the
effects of wind and boat traffic.33
The Study of Tide Flows, Mud Buildup, Boat Traffic, and Structural Damage on the Cannaregio Canal Subsystem was the
second project team from WPI to address the topic of hydrodynamics in the canals. This project was
completed in the March and April of 1991 and focused on the sestiere of Cannaregio (the northernmost
region of the island). They covered a much larger area of canals than the 1990 group did, and created the first
reliable flow measuring device. They were the first project team to map hydrodynamics results using
MapInfo, and they helped rework the canal segment naming system devised in the 1980s.34
33 Hydrodynamics of the Inner Venetian Canals (E‟99) 34 Ibid

29
This WPI project, A Static and Dynamics Study of the Canals of Venice, Italy, completed in the months of January
and February of 1992 focused their area of study in the sestiere of Santa Croce (east-central region) and San
Polo (centermost region). They used the same methods developed by the 1991 group, and also mapped their
info onto MapInfo.35
The project team, A Topological and Hydro-Dynamics Study of the Canals in the San Marco, of WPI studied the
velocity flows of the canal segments in the sestiere of San Marco (west-central region). They completed this
study in March and April of 1992 and were the first group to take into account the effect of meteorological
factors on the tides and how that would impact their results.36
A Topological/Hydro-Dynamics Study and Geographical Information System of the Canals in the Castello Area was
completed in May and June of 1992 and focused on the sestiere of Castello (east most region). They used the
same methods as in the previous projects.37
The WPI, Hydrodynamics of the Inner Venetian Canals, project was completed in the months of May and June in
1999. This project compiled all past hydrodynamics data collected by WPI, UNESCO and Insula into one
database. They also collected their own hydrodynamics data in the sestiere of Cannaregio (northernmost
region) to add to this database. This was the final WPI project of its kind for over a decade.38
35 Ibid 36 Ibid 37 Ibid 38 Ibid

30
3. Methodology The aim of this project is to assist the city of Venice in understanding how the workings of the canals have
changed over time, and how they influence the tides entering and leaving the city. The following objectives
were identified:
1) To quantify changes over time in the hydrodynamics of the canals
2) To analyze the timing of the tides
3) To set a standard for presenting canal data accessibility
This study focused on measuring hydrodynamics and tide delays. Approximately five to fifteen canals from
each section of Venice were picked to be studied. This study was conducted between October 24, 2010 and
December 17, 2010. Since the maximum flow velocities in the canals occur during the new and full moons,
hydrodynamic testing occurred during those times (Appendix C). Tide delays also were studied during the
new and full moon (Appendix I). This allowed for the most noticeable change of rising and falling tides so
that accurate times for tide peak could be recorded.
Figure 3.1: Area of hydrodynamics study

31
Figure 3.2: Area of tide delay study
3.1 Area of Study Selection In order to compare the present hydrodynamics of the Venetian canals to the past hydrodynamics of the
canals, measurements taken by previous WPI students were repeated as best as possible. A representative set
of canals spread out over the entire city were chosen that had been previously measured for hydrodynamics.
Visual surveys of potential canals were performed to insure that the canal segments had adequate access
points, such as sidewalks for wide bridges, for measurements to be performed.

32
Figure 3.3: An ideally accessible canal for hydrodynamics testing
A preliminary assessment of the state of the canals was also recorded during the surveying process. By using
these criteria to select canals, measurements taken were compared to past studies (Appendix F) and any
potential trends over time were analyzed.
3.2 Hydrodynamics: Measuring Flow Velocities In 1999, a group of WPI students studied the hydrodynamics of the inner canals by measuring the maximum
flow velocity of various canals and compiled previous hydrodynamic data (Appendix E). The procedures
used to obtain their data were followed as closely as possible to produce data that could be most effectively
compared to past measurements.

33
3.2.1 Scheduling of Measurements
In order to determine the maximum possible velocity of the canals, measurements were taken while the tidal
flows were at their maximum. This occurs in between high and low tide during the full and new moon
phases (Appendix C). The 1999 group determined that taking measurements approximately one hour before
the predicted maximum velocity would insure that the fastest flow would not be missed. Depending on the
amount of time required to test all of the canals and the window of opportunity allowed by the lunar
calendar, the period for taking measurements could be extended from twenty-four hours to forty-eight hours
as necessary.
3.2.2 Measurement Tool
The device that was used is a replication of a device used by the 1999 project team. It consisted of a plastic
soda bottle, two aluminum blades, and a lead weight. The bottle was used to provide buoyancy and was
painted fluorescent to make it easily visible at night. It was small enough to be minimally affected by the
wind along the surface of the canal. The bottle was attached by fishing line to two interlocking perpendicular
aluminum blades. A small weight was attached to the blades to keep the device perpendicular to the surface
of the water.
Figure 3.4: Tide chart depicting the forecast for the day before, day of and day after the new moon and ideal hydrodynamics testing times

34
Figure 3.5: Hydrodynamic Device
The previous project team assumed that the average canal depth was 1.5 meters. In order to have the device
move in the canal at one third of the assumed canal depth, twine was used to attach the bottle to the blade so
that there was a distance of 0.5 meters between the two objects. This allowed the blades to sink to one-third
of the canal depth (Appendix B).
3.2.3 General Procedure
The flow velocity was measured by determining the amount of time required for a flotation device (see
section 4.2.2) to move between two predetermined points. The direction of tidal flow was determined by
throwing the device into the section of canal to be measured. After the direction of the flow was established,
a start point was selected. This could be a landmark along the canal, such as a pole. Then the end point was
chosen approximately 10 meters from the start point. Whenever possible, start and end points used from
previous hydrodynamic testing were selected (Appendix G).

35
Figure 3.6: Example of start and end points for hydrodynamics testing
After establishing the direction of flow and selecting the start and end points, the flotation device was thrown
into the canal before the starting point to allow the device to reach the velocity of the water.

36
In order to record the time it took for the flotation device to travel the predetermined distance, a stopwatch
was started when the device passes the start point and was stopped after the device passes the end point. The
test was performed three times to ensure that the results were precise and consistent.
Figure 3.7 Hydrodynamics testing – Device moving with the current of the canal

37
Figure 3.8: Hydrodynamics testing – Throwing the device into the canal
The maximum flow in open channels occurs in the center and at one-third the depth from the surface.
Measurements were taken by throwing the flotation device as close to the center as possible to obtain the
maximum flow of the water.

38
3.2.3 Data Collection
The following table was used to record the data in the field (Appendix D):
3.3 Measuring Tide Delays In partnership with Centro Maree, this part of the project is aimed to further the understanding of the tide
delays in different parts of the city. A tide delay is defined as the time it takes a high or low tide to reach a
canal, after the Punta della Salute tide gauge station records its high or low tide.
3.3.1 Scheduling of Measurements
The difference in water level between high and low tide is the most drastic during the new and full moon. By
taking measurements during this time period, it was the easiest to indentify the point where the water level
changes direction. During each moon phase, either new or full, canals from each of the six sestieri were
measured for tide delay (Appendix I).
Measurements were taken on the day of the new or full moon as well as the day before and the day after. On
each day of testing measurements were taken at high tide, low tide, and the subsequent high tide. At each tide
four canal segments were examined. Two different sestieri were measured on each tide so that canal
segments from each of the six sestieri could be measured on each day of testing.
Table 1: Hydrodynamics Field Data
Date Time of Day
Canal Segment
Hydrodynamics Distance (m)
Time (s) Velocity (m/s) Average
Trial 1
Trial 2
Trial 3
Trial 1
Trial 2
Trial 3
Time
Velocity
Figure 3.9: Tide chart depicting the forecast for the day before, day of and day after the new moon and ideal tide delay testing times

39
3.3.2 Measurement Tool
Tide delay measurements were performed using a device to determine the height of the water. The device
consisted of a plumb-bob and a piece of wood. The plumb-b was built by attaching a small weight to the end
of a thin piece of rope. The piece of wood had a hole near one of the ends. The plumb-bob was strung
through the hole. The piece of wood provided a level surface for measurements to be taken. The plumb-bob
insured that the rope was completely vertical so that the distance measured would not be skewed.
Figure 3.10: The tide delay testing device – “plumb-bob”
By lowering the plumb-bob to the surface of the water and pulling the line back up through the hole in the
wood, the distance from the sidewalk to the water could be calculated. In total, four devices were
constructed so that measurements could be taken simultaneously at four different canal segments (Appendix
H).

40
3.3.3 General Procedure
The tide delay was measured by recording the time a particular canal segment reached either high or low tide
and calculating the difference between that measured time and the predicted time. Predicted times for high
and low tide were provided by the Instituzione Centro Previsioni e Segnalazioni Maree, which is Venice‟s tide
forecasting station.
To measure the time of a high or low tide the canal segment was observed prior to the predicted tide. A
device was used (see section 4.3.2) to measure the distance from a known point of elevation, such as a
sidewalk, to the water. If the distance from the sidewalk to the water changed then the tide had not been
reached. When the measured distance stops changes the tide has been reached. When the tide has been
reached the time and measured distance are recorded. After the tide has been reached the change in the
measured distance should reverse. For example, if the distance was decreasing, after the tide it would start
decreasing. The measured distance was then used to calculate the water level by subtracting the value from
the known elevation the distance was measured from.
3.3.4 Data Collection
When measuring a canal segment, the date and tide (high or low) was recorded. The time of the tide and the
distance to the water was also recorded. The exact location that the measurement was taken was observed
and located on a map in order to find the known elevation (Appendix J).
Figure 3.11: Measuring the tide delay above the sidewalk (left) and below the sidewalk (right)

41
Table 2: Tide delay field form
3.4 Venipedia: Maintaining Canal Data As part of this project, existing canal data and the collected data, were uploaded online is such a way as to set
an example of an accessible data standard. The key criteria for creating accessible data were: to present the
data in an easily viewable way, to allow the data to be edited and expanded, and to organize the information
semantically.
The data was presented in the body of Venipedia articles in the forms: text, table, kml maps, and images. All
the files, as well as the raw data are accessible through direct links. Moreover the files can be updated with
newer file versions directly on Venipedia. The data becomes accessible through internal and external links.
Whenever a canal was named in an online map, the hyperlink to the canal Venipedia article was provided.
Likewise, the Venipedia article links to other canal pages and canal data as well as to project maps internally in
the site and externally on the web. This creates a series of linked data spaces on the internet that increase the
accessibility of the canal data.

42
4. Results This chapter contains the results of data collected for hydrodynamics and tide delay (Appendix F and K).
4.1 Hydrodynamic Data This section contains data collected from hydrodynamic testing (Appendix F).
4.1.1 Canal Segments Measured
A total of 52 canal segments were measured for maximum velocities during both the incoming and outgoing
tides. During the course of testing a canal in Cannaregio, Rio de San Andrea, was undergoing dredging. As a
result, 7 of the measured canal segments had flows that were possibly affected by the nearby dredging and
could not be used in velocity comparisons. The remaining 45 canal segments were unaffected (see figure 4.1).
All canal segments were tested during both incoming and outgoing tides.
4.1: Map showing 2010 area of hydrodynamics study split up by influence of dredging
4.1.2 Directional Changes with Respect to Tides
For each canal segment tested, the directions of flow for both incoming and outgoing tides were recorded.
Canal segments could behave in one of four ways: flow in different directions during incoming versus
outgoing tides, flow in the same directions, be stagnant for both tides, or be stagnant for one tide and flow
during the other.
Of the 45 canal segments studied, 30 flowed in opposite directions during incoming and outgoing tides
(66.7%), 8 flowed in the same directions (17.8%), 7 were stagnant during one half of the tide cycle and

43
moving for the other (15.5%), and 0 canal segments were stagnant for both incoming and outgoing tides. As
the tides change from incoming to outgoing water tends to change directions. This case is seen for the
majority of the canals.
Figure 4.2: Directional behavior of canal segments during changes in tides
4.1.3. Maximum Velocities
For each of the canal segments measured, the maximum flow velocity was determined for both incoming and
outgoing tides. Prior WPI studies separated canal speeds into four general categories: stagnant, lazy, mid-
ranged, and fast. Stagnant segments had speeds ranging from 0 centimeters per second (cm/s) to 1 cm/s.
Lazy segments had speeds ranging from above 1 cm/s to 10 cm/s. Mid-ranged segments had speeds ranging
from above 10 cm/s to 20 cm/s. Fast segments had a speed greater than 20 cm/s. The speeds for each
canal segment during incoming and outgoing tides, broken down by categories, can be seen in figure 4.3
below.
Opposite Direction
67%
Same Direction18%
Stagnant0% 1/2 Stagnant
15%
Tide Behavior of Canal Segments

44
Figure 4.3: Map depicting 2010 velocities and directions for both incoming and outgoing tides
4.1.3.1. Incoming Tide
During the incoming tide, 3 of the segments were stagnant (6.7%). 15 of the segments were lazy (33.3%), 15
of the segments were mid-ranged (33.3%), and 12 of the segments were fast (26.3%). Figure 4.4 shows the
distributions of speeds for canal segments during the incoming tide. The gray represents stagnant canal
segments, the blue represents lazy canal segments, the green represents mid-ranged canal segments, and the
red represents fast canal segments. The canal segments are evenly distributed around 14 cm/s with a few
canal segments with much faster speeds. The canal segment with the fastest speed was FORN1 in
Dorsoduro, which was also flowing in a southern direction when most of the other canal segments (73.3%)
were flowing north.

45
Figure 4.4: Speeds Distribution for Canal Segments during Incoming Tide
4.1.3.2. Outgoing Tide
During the outgoing tide, 4 of the segments were stagnant (8.9%). 14 of the segments were lazy (31.1%), 18
of the segments were mid-ranged (40%), and 9 of the segments were fast (20%). Figure 4.5 shows the
distribution of canal segments speeds during the outgoing tide.
Figure 4.5: Speed Distribution of Canal Segments Unaffected by Dredging during Outgoing Tide
0
2
4
6
8
10
12
0 5 10 15 20 25 30 35 40 45 50 55 60Nu
mb
er
of
Can
al S
egm
en
ts
Canal Segment Speed (cm/s)
Maximum Speeds for 2010 Segments During Incoming Tide
0
2
4
6
8
10
12
0 5 10 15 20 25 30 35 40 45 50 55 60Nu
mb
er
of
Can
al S
egm
en
ts
Canal Segment Speed (cm/s)
Maximum Speeds for 2010 Segments During Outgoing

46
4.2 Tide Delay Data This section contains data collected during tide delay measurements (Appendix K).
4.2.1 Canal Segments Measured
59 of segments were measured for tide delay. Of the segments measured, 37 were measured for high tides
and 22 segments were measured for low tide.
4.6 Area of Tide Delay Study

47
4.2.2 Canal Segment Tide Delays vs. Punta della Salute Real-time Data
Of the canal segments measured for their high tides, 3 segments had times that matched the high tide at
Punta della Salute (8.1%). 16 segments had high tide occur at a time later than Punta della Salute (43.2%). 18
segments had high tide occur at a time earlier than Punta della Salute (27.2%). The average delay for these
segments was -16.54 minutes with a standard deviation of 35.67 minutes. There was a wide range of data,
from -150 minutes to 17 minutes. When the times with delays between -60 minutes and -150 minutes are
excluded, the standard deviation is 17.75 minutes.
Figure 4.7: Map of low tide delay times with respect to the Punta della Salute low tide time
For canal segments measured for their low tides, no segments occurred at the same time as Punta della Salute.
4 segments occurred at a time later than the predicted time (18.2%). The remaining 18 segments had low tide
occur at a time earlier than Punta della Salute (81.8%). The average delay for these segments was -17.36
minutes with a standard deviation of 22.27 minutes. This set of data did not have any outliers.
4.8 Map of low tide delay times with respect to the Punta della Salute low tide tim

48
4.2.3 Canal Segment Tide Delays vs. Misericordia Real-time Data
Of the canal segments measured for their high tides, 3 segments had times that matched the high tide at
Misericordia (8.1%). 29 segments had high tide occur at a time later than Misericordia (78.4%). 5 segments
had high tide occur at a time earlier than Misericordia (13.5%). The average delay for these segments was -
26.35 minutes with a standard deviation of 35.67 minutes. There was a wide range of data, from -135
minutes to 10 minutes. When the times with delays between -60 minutes and -135 minutes are excluded, the
standard deviation is 15.15 minutes.
Figure 4.9: Map of high tide delay times with respect to the Misericordia high tide time
For canal segments measured for their low tides, no segments occurred at the same time as Misericordia. 3
segments (13.6%) occurred at a time later than the predicted time. The remaining 19 segments (86.4%) had
low tide occur at a time earlier than Misericordia. The average delay for these segments was -30.55 minutes
with a standard deviation of 25.33 minutes. When the 5 outliers, between -64 and -74 minutes, are excluded,
the standard deviation is 21.34 minutes.
4.10 Map of low tide delay times with respect to the Misericordia low tide time

49
4.3 Sustainable Data Results The result of this project‟s set standard on accessible canal data included various formats and edit to the
Venipedia site. The infobox template for canals was set; it includes the basic information of each canal: name,
map location, image, canal segments, canal intersections, length, depth, area, and orientation of flow.
The formatting for canal articles was set so that each article will contain the
following: a history and description of the canal, stats about the canal
segments, a table of studied data (velocity, dredging schedule, damage, sewer
outlets, tide delay), a photo gallery, and an interactive map. These articles will
detail the information collected for this project as well as provide a
depository for future collected data about each Venetian canal.
4.11 Basic Canal Infobox on Venipedia

50
5. Analysis This chapter contains the analysis of the results obtained from hydrodynamic and tide delay data.
5.1 Hydrodynamics Hydrodynamic measurements taken by prior WPI students were repeated for 52 of the canals segments using
the same methodology. Canals that were possibly affected by dredging in 1999 and 2010 could not be used to
make an adequate comparison of any potential changes in the canal hydrodynamics. A total of 33 canal
segments that were measured in this study were not currently affected by dredging and were not affected in
prior WPI studies. These canal segments were used to compare past and present hydrodynamic
measurements.
5.1.1 Effect of Dredging on Canals
Some of the canal segments tested by past WPI projects were near canals that were undergoing dry-bottom
dredging. These canals segments could have been possibly affected by the dredging. 12 of the canal
segments possibly affected by dredging in 1999 were repeated in this study and were not currently near canals
being dredged.
Figure 5.1 shows the canals that were dredged in 1999 and the direction the canal segments possibly affected
by dredging flowed during the incoming tide. Most canal segments flowed north during the incoming tide,
which is typical canal behavior. Three canal segments (PEST1, TETT1, and FORM) flowed south during the
incoming tide.
Figure 5.1: 1999 Incoming Tide Flow Directions of Canal Segments Possibly Affected by Dredging in 1999
Two of the three canal segments flowing south during the incoming tide in 1999, PEST1 and TETT1,
changed directions in 2010 and flowed north while FORM continued to flow south in 2010 (Figure 5.2). The
MUNE
ORIO1
STIN
FRAR1
TOMA
DOMI
POLO4
2TOR2
FORM
TETT1
PEST1 LIO

51
dredging of a nearby canal could have caused PEST1 and TETT1 to change the direction they would
normally flow during the incoming tide and flow in the opposite direction then it normally should. One canal
segment, ORIO1, flowed north in 1999 and changed direction to flow south in 2010. This segment could
have also been affected by dredging. However, it changed to flow in the direction that is uncommon among
canals during the incoming tide and could be the result of some other hydrodynamic phenomenon.
Figure 5.2: 2010 Incoming Tide Flow Directions of Canal Segments Possibly Affected by Dredging in 1999
The velocities of these canal segments could have also been influenced by being near to a canal undergoing
dredging. Table 3 shows the velocities of the canal segments that were possibly affected by dredging in 1999.
Both the 1999 velocities and the 2010 velocities are shown. A positive number represents a canal flowing
north and a negative number represents a canal flowing south. Some of the canal segments that do not
change direction between years also do not have a significantly different speed (FRAR1, STIN, MUNE, and
FORM). Other canal segments, such as TOMA, experienced increases of over 10 cm/s. Many canal
segments, such as LIO, had decreases in speed greater than 10 cm/s. The dredging of a canal could have
drastically changed the behavior of several of the canals nearby both in terms of direction of flow and speed.
MUNE
STIN
ORIO1
FRAR1
TOMA
POLO4
2TOR2
DOMI
FORM
TETT1
PEST1 LIO

52
Table 3: Velocities of canal segments possibly affected by dredging in 1999 during incoming tides
Figure 5.3 shows the direction of flow for canal segments that were possibly affected by dredging in 1999
during the outgoing tide. The majority of the segments flowed south with only two segments (ORIO1 and
FORM) flowing north. Another two segments (PEST1 and TETT1) had no measurable flow during the
outgoing tide.
Figure 5.3: 1999 Outgoing Tide Flow Directions of Canal Segments Possibly Affected by Dredging in 1999
In 2010, FORM continued to flow north during the outgoing tide (Figure 5.4). The other segment that
flowed north during the outgoing tide in 1999, ORIO1, flowed south in 2010. In 1999 ORIO1 flowed north
for the both incoming and outgoing tides and in 2010 it flowed south for both the incoming and outgoing
tides. This could be a result of being near a canal in the process of dredging or some other influence that
changed its direction. Both of the canals that did not flow during the outgoing tide in 1999 (PEST1 and
MUNE
STIN
FRAR1
TOMA
POLO4
ORIO1
2TOR2
DOMI
LIO
FORM
TETT1
PEST1

53
TETT1) flowed south in 2010. This change from stagnant to dynamic is most likely the result of the nearby
dredging prevent water from moving through those segments during the outgoing tide.
Figure 5.4: 2010 Outgoing Tide Flow Directions of Canal Segments Possibly Affected by Dredging in 1999
The table below shows the outgoing velocities for 1999 and 2010 for canal segments possibly affected by
dredging in 1999. Several of the canal segments (FRAR1, STIN, MUNE, and FORM) do not experience
great increases or decreases in their velocities. This is also true for their velocities during the incoming tide
and were most likely unaffected by the dredging of the nearby canal. The two canals that were not moving
during the outgoing tide in 1999 not only moved in 2010 but also had fast velocities. Some canals, such as
LIO, had substantial decrease in velocity of over 10 cm/s. This decrease matched the decrease during the
incoming tide.
Table 4: Velocities of canal segments possibly affected by dredging in 1999 during outgoing tide
MUNE
ORIO1
STIN
FRAR1
TOMA POLO4
2TOR2
DOMI
LIO PEST1
TETT1
FORM

54
The dredging of canals can have widespread and dramatic changes in the hydrodynamics of the surrounding
canals. Canals can change which direction they are flowing for incoming and outgoing tides. Dredging can
also make canals not flow for at least half of the tide cycle. Their speeds can also greatly increase or decrease.
However, many canal segments that appear close enough to a canal being dredged to be affected experience
no effects and retain their hydrodynamic behavior during the dredging process.
5.1.2.1 Comparisons of Flow Velocities of Outgoing Tides
Figure 5.5: Graph depicting the maximum velocities for incoming tides
The changes in speeds, from 1999 to 2010, for in-tide, appear to be normally distributed. Segment BURC,
displayed in the map below in the second darkest blue, had the highest decrease in speed, -21.25 cm/sec. Two
segments decreased in speed by an average of 6.015 cm/sec, five segments by an average 2.398 cm/sec.
Seven segments had an absolute speed change of less than 1 cm/sec. Five segments increased by an average
of 2.998 cm/sec, one segment by 7.53 cm/s, four segments by an average of 11.765 cm/sec, four segments
by an average of 17.659 cm/sec. Segment BATE1, below in the darkest red, saw the highest speed increase,
29.5 cm/sec. The majority of the canal segments (66.7%) have not changed direction of flow between 1999
and 2010.
0
2
4
6
8
10
12
0 5 10 15 20 25 30 35 40 45 50 55
Nu
mb
er
of
Can
al S
egm
en
t
Canal Segment Speed (cm/s)
Maximum Speed Comparison for Incoming Tide
1999
2010

55
Figure 5.6: Map depicting the direction of flow and change in flow velocity for incoming tides between 1999 and 2010
The most amounts of changed canals seem to be in the Dorsoduro area. This could possibly be because of
the change in the watershed that has been rumored to have occurred. The rumor suggest that the flows that
entered the lagoon from the northern Adriatic used to surround the island and buffer it from the more
aggressive flows entering from the southern Adriatic are now no longer surrounding the island but actually
flowing directly through it, while allowing the southern flows to interact with it Figure 5.7. In other words,
the flows depicted in green in Figure 5.7 now flow around to the north-western part of the island, where
during the incoming tide they „cork up‟ the north end of the Canale Grande. This results in the Canale Grande
filling up completely at the beginning of the incoming tide. As water keeps coming into the Canale Grande, the
tributaries in Dorsoduro start to flow as the water in the Canale Grande has nowhere else to go since the
northern end is „corked‟. This is possibly why the velocities have increased in speed in this area in the past
decade.

56
Figure 5.7: Image depicting the rumors of the watershed change between 1968 and 2009
5.1.2.2 Comparisons of Flow Velocities of Outgoing Tides
Figure 5.8: Graph depicting the maximum velocities for outgoing tides
The changes in speeds, from 1999 to 2010, for outgoing-tide, appear to be normally distributed. Segment
FORN2, displayed in the map below in the second darkest blue, had the highest decrease in speed, 21.51
cm/sec. Four segments decreased by an average of 16.588 cm/sec, six segments by an average of 2.53. One
segment had an absolute change in speed of 0.93 cm/sec. Six segments increased by an average2.161 cm/sec,
six by an average 7.225 cm/sec, two segments by an average 12.995 cm/sec. The segment BATE1 had the
highest increase of 15.3cm/sec and can be seen below in the third darkest red. Most of the canal segments
(66.7%) have not changed direction of flow between 1999 and 2010.
0
2
4
6
8
10
12
0 5 10 15 20 25 30 35 40 45 50 55Nu
mb
er
of
Can
al S
egm
en
ts
Canal Segment Speed (cm/s)
Maximum Speed Comparison for Outgoing Tide
1999
2010

57
Figure 5.9: Map depicting the direction of flow and change in flow velocity for outgoing tides between 1999 and 2010
Like with the incoming tide, Dorsoduro experienced the most changes in speed during the outgoing tide as
well. This is once again correlated back to the rumor regarding the watershed as an explanation for this
observation. When the tide begins to move outwards, the Canale Grande moves in a southward direction again,
and all the water in it empties through the south end. This would mean the water does not need to leave
through the tributaries of Dorsoduro. It is also possible that by the time the tide moves outwards the Canale
della Giudecca has reached the same „height‟ as the southern end of the Canale Grande (as a result of the water
leaving through the tributaries during the incoming tide) and this would result in there being no flow in
Dorsoduro between the Canale Grande and the Canale della Giudecca.
This would explain why the flows in this area dramatically decreased in speed over the past ten year.
5.1.3. Flow Direction Comparisons
The following sections discuss the changes in flow direction between 1999 and 2010 and the possible reasons
for these changes to have occurred.
5.1.3.1 Comparison of Flow Direction of Incoming Tides

58
Figure 5.10: Map depicting the direction of flow of 1999 incoming tides
Figure 5.11: Map depicting the direction of the flow of 2010 incoming tides
Figures 5.10 and 5.11 show the comparison of 1999 and 2010 directions for the incoming tide. From these
figures it is easy to see that the changes over the decade have occurred primarily in the eastern-southern
sestiere of Santa Croce and Dorsoduro. The segments that experienced changes in Dorsoduro were entirely
stagnant in 1999 and in present day all were moving in a southern direction. The segments in Santa Croce in
1999 were primarily north flowing and stagnant, but upon returning to them in 2010 they were primarily
south flowing and different segments stagnant. This, like the change in flow velocities, provides support for

59
the rumors suggested by Umberto Sartori.39 When the green flows from the south of the lagoon (depicted
Figure 5.7) „cork‟ up the north end of the Canale Grande during the incoming tide, the Canale Grande continues
to fill with incoming water that has no escape through that north end. So this water flows through the
tributaries in the Santa Croce and Dorsoduro region and out into the Canale della Giudecca. This could explain
why these canal segments have changed flow direction in the past decade.
39
Umberto Sartori - Report on flood-tide in the Lagoon of Venice, 2009

60
5.1.3.2 Comparison of Flow Direction of Outgoing Tides
Figure 5.12: Map depicting the direction of flow of 1999 outgoing tides
Figure 5.13: Map depicting the direction of flow of 2010 outgoing tides
Figures 5.12 and 5.13 show the comparison of 1999 and 2010 directions for the outgoing tide. These figures
illustrate that the changes over the decade have occurred primarily in the eastern-southern sestiere of Santa
Croce and Dorsoduro. The segments in Santa Croce in 1999 were primarily south flowing and stagnant, but
upon returning to them in 2010 they were almost entirely north flowing and different segments stagnant. The

61
segments that experienced changes in Dorsoduro were south flowing in 1999 and in present day almost all
were stagnant. In both cases this could be the similar trend witnessed with the incoming tides. When the tide
begins to move outwards again, the Canale Grande moves in a southward direction. This would mean the
water does not need to leave through the tributaries of Santa Croce or Dorsoduro. It is also possible that by
the time the tide moves outwards the Canale della Giudecca has reached the same height as the southern end of
the Canale Grande (as a result of the water leaving through the tributaries during the incoming tide) and this
would result in there being no flow in Dorsoduro between the Canale Grande and the Canale della Giudecca.

62
5.2 Tide Delay
This section analyzes the results for tide delay studies, which compliment the results from hydrodynamic
studies as proof of the new watershed location.
5.2.2 Delays at High Tide
5.14 High tide delays with respect to Punta della Salute
5.15 High tide delays with respect to Misericordia

63
As depicted in the above maps, water enters Venice though the two ends of the Canale Grande. First, water
comes from the northern end of the Canale Grande. This water enters Venice about 45 minutes before the
southern end of the canal, providing evidence that Venice is now getting water from two different sources.
When the water makes it way into Venice through the Lido Inlet and the southern end of the Canale Grande,
the water meets somewhere in the middle, ideally in the middle of the watershed. Then, the water level of the
Canale Grande rises to a level higher than the surrounding canal networks. This water is then distributed to
nearby canals which make up the watershed line, since it‟s where the water builds up. The border between
the 0 minute delay and the canals that reached high tide 15 minutes earlier than Misericordia shows where the
water starts to be rejected from the island. Basically, there is too much water in central Venice approaching
high tide that water naturally starts flowing toward the lower water level, which is the lagoon in this case.
5.2.3 Delays at Low Tide
5.16 Low tide delay with respect to Punta della Salute

64
5.17 Low tide delays with respect to Misericordia
During the outgoing tide, as the waters are approaching low tide, the pressure is released from the northern
end of the Canale Grande which causes an immediate rush of water out of the southern end of the Canale
Grande. This is depicted by the dark blue in the map of Punta della Salute, and by the pink in the map of
Misericordia. Further studies will be needed to see if water is also exiting through the northern end of the
Canale Grande, just like how the water enters Venice.
5.2.4 Watershed Patterns in Data
When Venice is filling up with water, during the incoming tide, it is receiving this water from two locations:
the northern end of the Canale Grande and the southern end of the Canale Grande in the Canale della Giudecca.
The water from the northern end of the Canale Grande is reaching Venice quicker than the other source. This
leads to a possibility of having two different water sources for the island of Venice: the Lido and the
Malamocco Inlets from the Adriatic Sea. Venice has always been known to get its water solely from the Lido
Inlet, since it is much closer than the Malamocco Inlet. There are numerous reasons why this might be
happening.
One reason the Malamocco Inlet is reaching Venice before the Lido Inlet is because the waters from the
Malamocco Inlet are transporting water faster than in the past, and the Lido Inlet is transporting waters
slower than in the past. The Canale Pitroli is bringing up water very quickly to the west of Venice through the
increase in cargo boats traveling that route, from the Malamocco to the western Venice Lagoon. The MOSE
tidal gate project might be effecting the Lido Inlet with the island that is now directly in the middle of the
opening, possibly restricting the water flow.

65
There is a commonality in all four of the tide delay maps. There is a clear pattern as a diagonal from eastern
Dorsoduro to eastern Cannaregio which might be the current home to the watershed. When the water builds
up in the Canale Grande, after high tide it is possible, though not proven through this study, that the water
might be forced through the northern end of the Canale Grande as well as the southern end. Since the “cork”
is water coming from the Malamocco Inlet, in order for the cork to be removed, this water must leave
Venice. It seems that the water will want to leave the island in the same way it enters it, but more data and
studies are necessary to confirm or deny this.

66
6. Recommendations
Much of the collected information from this project is in the form of recommendations for future studies
that may follow.
6.1 Lessons Learned in the Field One of the most helpful preparations for hydrodynamics testing was what was referred to as „surveying‟ or
„observing‟ the canals before the time of testing. Much was accomplished during these outings that saved
valuable time and energy for the actual days of testing. By going out ahead of time the group was able to
identify which canals were still accessible for hydrodynamics testing and which were not. Identifying any
difficulties in those canals that were accessible (such as constant boat traffic or docked boats) allowed for the
group to prepare for difficulties at time of testing. The points of reference for start and end points from the
1999 study were identified at these times, and if they no longer existed new points were identified, distances
measured and pictures taken. By being familiar with the location of the canal, and how to get to it also
allowed for valuable time to be saved at time of testing especially for those tests done after dark.
For the executing of hydrodynamics testing, it is important to be prepared for every worst possible
circumstance imaginable when it comes to the device (Section 3.2.2, Appendix B). For every device being
used in the field, there should be that many back-up devices for the extreme case that the entire device is
dropped into a canal and cannot be retrieved. Along the same lines, for every device that is being used in the
field, there should be an extra blade carried along with that device in the extreme case that an emergency
replacement of the blade is necessary. Extra duct tape should be also brought along to attach this new blade,
or to fix the original along with extra fishing weights if those are to fall off with the original blade. Lastly, it is
a good idea to have a long stick, such a broomstick, on hand in case the fishing line gets caught on the anchor
or motor of a docked boat. Using the stick to unhook the fishing line is a much better idea than climbing
onto someone‟s boat, which can get you in trouble.
For tide delay testing it is important that the fishing line that makes up the plum-bob (Section 3.3.2,
Appendix H) is attached to something (such as the clip-board) so that if the line slips from the tester‟s hand it
will not disappear into the canal. Securing the fishing line down to a larger object will ensure that testing will
not have to end early due to the plum-bob disappearing into the canal being tested.
On a more social note, be sure to be able to communicate to the locals who do not speak English what you
are doing. To many people who are unfamiliar with the methodology it appears that the hydro testers are just
teenage kids throwing plastic bottles into the canals, and tide delay testing can appear as loitering. These do
not go over well with many. Simply being able to explain that you are students studying the flow of the canal,

67
or measuring the tide will save a lot of time and inconveniences (Gondolier‟s destroying your device with
their ores) and make the entire experience much more enjoyable for all parties involved.
The final recommendation from experiences in the field should go without saying, but will be mentioned. If
testing is to occur in the fall/winter months such as this project did be prepared for the cold and wet weather
that you will be testing in. Rain boots, long underwear, rain coats, hats and waterproof gloves are an absolute
must. Being prepared for the elements will make testing all the more pleasant which results in more accurate
results.
6.2 The Future of Hydrodynamics Studies Because hydrodynamics testing could only be done approximately three days every two weeks, only nine days
were dedicated to hydrodynamics testing in a seven week period of study (Section 3.2.4, Appendix C). Within
these nine days of testing, only a short two to three hour period within each outgoing and incoming tide can
be hydro tested, ensuring that the most accurate maximum flows are obtained. Assuming that each canal
segment takes approximately 15 minutes to test at a time, and then taking into account hindrances from
boats, poor weather and getting lost allows for a very small number of canal segments to actually be hydro
tested in a given day. Even when a group of four students split into two pairs for hydro testing, the area
covered was not as big as hoped. On the best day nine segments per pair were analyzed. 52 total canal
segments were tested for hydrodynamics by the end of the third testing cycle (Appendix D).
This leave opportunities for future study of the canal segments in the area of hydrodynamics for comparisons
to the joint WPI, UNESCO and Insula studies compiled in 199940. The 1999 IQP that this project was
modeled after accounted for the hydrodynamics for 170 canal segments (Appendix E). In this study, 52 of
these 170 segments were revisited in order to compare in the area of hydrodynamics. This leaves 118 of the
segments compiled in the 1999 report untested over a decade later. It is highly recommended that IQPs about
hydrodynamics of the inner Venetian canals continue over the next few years. These groups are encouraged
to test and analyze the hydrodynamics of those remaining segments. If this happens, all 170 segments could
be revisited within 3 years of each other, which would result in a fair comparison of the hydrodynamics of the
canals. These tests should be done in the near future, due to the implications the MOSE project might create.
The groups testing after MOSE is fully operating will not be able to test with extreme high tides, as was done
in previous studies.
40
Hydrodynamics of the Inner Venetian Canals (E’99)

68
6.1 Suggested canals for future studies for hydrodynamics
Figure 6.1 depicts the canal segments (in pink) that this project group feels would be the best area of study
for the next group of students who study the hydrodynamics of the canals. These canal segments were
chosen for a number of reasons, but the main reason being that the future results obtained from the study of
these segments will hopefully be able to shed more light on the workings of the Venetian watershed and
provide any more hints, or possible solid evidence toward the rumors previously addressed in this report. The
study of these canal segments will be able to identify some of the hydrodynamic trends of the Canale Grande,
and were picked for this purpose. Those selected in northern Cannaregio are to determine any possible trends
with the watershed and to address rumors specific for Cannaregio and its flows. The canal segments in the
Giudecca were chosen to identify any possible changes that have occurred in the Canale della Giudecca, which
could explain some of the phenomenon witnessed in Dorsoduro during this study. With this the hope is that
next year‟s study on the canals can provide more concrete support or negate the rumors about the watershed.

69
These 170 canal segments that were analyzed throughout the 1990s and are now being revisited today only
make up approximately half of the totally canal segments in the entirety of the canal system. There are 367
total canal segments throughout all of Venice, and because only 170 have been tested for hydrodynamics this
leaves 197 canal segments that have never been tested for hydrodynamics. Many of these canal segments have
not been tested because they are not ideal for the methods used in this project. In this case a new
methodology can be created to resolve this issue. It is suggested to expand the knowledge of the canals and
how they are changing by analyzing as many of these unaccounted canal segments as possible. This is an ideal
project for an ambitious IQP group, or perhaps for a Civil Engineering or Fluid Mechanics MQP. If more of
these canal segments that have never been tested for hydrodynamics before can be tested in the near future, a
benchmark can be set for future comparisons, like with this project and the 1990 data. This would allow for a
more thorough and broad observation and analysis on how the canal hydrodynamics have changed over the
course of the past ten years, and for years to come.
6.3 The Future of Tide Delay Studies Tide delay testing could only be done approximately three days every two weeks, so in a seven week period of
study only nine days were able to be dedicated to collecting data on the tide delay (Section 3.3.4, Appendix I).
In the case of this project, the study of tide delay was not added to the methodology until the 4th week in,
after the first new moon had already passed. This resulted in only having two testing cycles left to work with,
thus only six days to collect tide delay data. With four students in the group, and tide delay being tested at the
morning high tide, afternoon low tide, and the night high tide this allowed for 12 canals segments to be tested
and data recorded on a completely successful day, 36 in a weekend and 72 in the total time allotted for testing.
In the case of this project a total of 60 canal segments were analyzed in the end for tide delay (Appendix K).
With 362 total canal segments within the boundaries of Venice, it is impossible for 60 to give a fair
representation of the canal system as a whole. For this reason, future groups should continue the analysis of
the tide delay throughout the remaining 362 canal segments that were not analyzed in this project. An
ambitious IQP group of four students could get a maximum of 108 canal segments tested for tide delay in a
seven week term following the methodology laid out in this project. In a few years, all canal segments could
be accounted for, and a much more accurate and complete graphic could be made to represent the tide delay
that the island is undergoing. If future IQP groups, or perhaps MQP groups, could study how various
meteorological factors influence the tide delay and obtain concrete data to support it.
Further-more, if a more complete collection of data can be obtained the opportunity for a model to be made
will present itself. This model could represent the data and how the tide changes depending on the moon,
the winds, and other factors. This could possibly be part of an MQP in the field of Computer Science and
Programming.

70
6.4 The Future of Canal Data This project‟s recommendations for the future are that students and Venipedia users will follow and improve
the standards for sharing information accessibly. For canals specifically future groups or individuals should
populate all the articles for every canal in Venice. These articles should be expanded with colloquial
information as well as with useful data. This way the information gathered about the canals can be expanded,
shared, and easily accessed.
6.5 Expanding the Area of Study This project was initially set to cover the topics of hydrodynamics, sedimentation accumulation, boat traffic,
and infrastructure damage. When the issue of time presented itself, all four areas of studies did not seem
feasible to complete in a seven week period.
6.4.1 Sedimentation Accumulation
Sedimentation testing has proven to be extremely time consuming. The methodology is a tedious and multi-
step process which includes testing the depth of a canal at every square meter. An ideal canal to test for
sedimentation accumulation would be a short and narrow one, which are hard to come by. A boat is needed
to do all these tests, unless there is a canal that has sidewalks on both sides and is narrow enough to reach the
middle of the canal from the sidewalk.
The device that was made for testing consisted of two PVC pipes connected with epoxy. On the bottom, a
plastic potting base was attached perpendicular to the pipe to create a flat surface. A bare pipe end would
have pierced the sediment on the bottom of the canal, and thus the wrong readings would have been
obtained. A few layers of duct tape were put on creating a smooth, cone-like surface. That would create the
least amount of resistance when pulling the device out of the water. Also, a small anchor was put in the
cavity inside the duct tape to assist in weighing the device down. Otherwise, it popped up when pushed
down to test the canal. A map layer of sedimentation volumes taken from the 1999 sedimentation IQP41 was
made for this project on Google Maps (Appendix L).
6.4.2 Boat Traffic
Boat traffic testing is very time consuming as well. When UNESCO conducted boat counts, they hired about
100 people to conduct counts at various intersections for 12 hour shifts. With a project group of four
students also trying to complete other aspects of a project, it was determined boat traffic counts were not
feasible. However, the data UNESCO collected through boat counts was able to be compiled into several
layers on Google Map (Appendix L). If a group were to look into this area of study in the future, it is
recommended that they look into different intersections that UNESCO may have not been able to get to. If
41
Quantifying Sedimentation in the Venetian Canals (E’99)

71
a future group does the same areas as UNESCO, they should map the data they collect and compare it to the
data UNESCO collected.
6.4.3 Infrastructure Damage
A lot of problems were encountered in this area of study. First, repeating the past project was difficult. They
obtained a boat from UNESCO to use for their data collection, which was not the case for this project. Since
the group did not have access to a boat, the idea to do a strictly visual rating system to differentiate between
different degrees of damage was suggested. However, since the exact areas of damage could not be measured
without a boat, a rubric needed to be made explaining the criteria for each degree of damage. This was much
more subjective than stating the exact size of the area of damage. If someone were to repeat this project, they
should plan to get a boat, possibly sponsored by UNESCO, so they are able to measure the exact area of the
damage.
For this project, every canal that was tested for hydrodynamics was previously observed. During the surveys
group members took note of the damage along the walls and other canal infrastructure. It was noticed that
the visible damage was not nearly as substantial as the past project group dealt with. However, this could be
due to the fact that Insula has been maintaining the canal walls and fixing the areas of damage that were
previously studied. It was decided in the 4th week that due to the „lack‟ of infrastructure damage this portion
of the project should be dropped.

72
WORKS CITED
Christine L. Biscotti, Andrea M. Emery, Maxwell Pistilli and Joseph A. Zsofka. 1999. Hydrodynamics of the Inner Canals of Venice. WPI Interactive Qualifying Project.
Città Di Venezia Centro Previsioni e Segnalacioni – Tide Center - City of Venice - Città Di Venezia - Il Portale Ufficiale Della Città. Web. 15 Sept. 2010. http://www.comune.venezia.it/flex/cm/pages/ServeBLOB.php/L/EN/IDPagina/1644.
Church, JA, JM Gregory, P. Huybrechts, M. Kuhn, K. Lambeck, MT Nhuan, D. Qin, and PL Woodworth.
2001. Changes in sea level. Climate Change 200 : 639-94.
Davis, Robert, and Garry Marvin. 2004. Venice, the tourist maze: A cultural critique of the world's most touristed city. Berkeley and Los Angeles, California: University of California Press.
Ferla, M, M Cordella, L Michielli, and A Rusconi. "Long-term variations on sea level and tidal regime in the lagoon of Venice." Estuarine, Coastal and Shelf Science 75.1-2 (2007): 214-222. Web. 18 Nov 2010. <http://au4sb9ax7m.scholar.serialssolutions.com/?sid=google&auinit=M&aulast=Ferla&atitle=Long-term+variations+on+sea+level+and+tidal+regime+in+the+lagoon+of+Venice&title=Estuarine,+coastal+and+shelf+science&volume=75&issue=1-2&date=2007&spage=214&issn=0272-7714>.
Gačić, Miroslav, Isaac Mancero Mosquera, Vedrana Kovačević, Andrea Mazzoldi, and Vanessa Cardin.
"Temporal variations of water flow between the Venetian lagoon and the open sea ." Journal of Marine Systems 51.1-4 (2004): 33-47. Web. 18 Nov 2010. <http://www.sciencedirect.com/science?_ob=ArticleURL&_udi=B6VF5-4D9D9J1-1&_user=74021&_coverDate=11%2F01%2F2004&_rdoc=1&_fmt=high&_orig=search&_origin=search&_sort=d&_docanchor=&view=c&_searchStrId=1546050924&_rerunOrigin=google&_acct=C000005878&_version=1&_urlVersion=0&_userid=74021&md5=c6af8045a1270d073ce7c65156a0f25c&searchtype=a>.
Gallagher, Tracy. "Katrina Five Years Later: Slow Recovery in 9th Ward." Fox News 26 Aug 2010: n. pag.
Web. 1 Dec 2010. <http://liveshots.blogs.foxnews.com/2010/08/26/katrina-five-years-later-recovery-slow-in-9th-ward/>.
Insula - canal excavation. in Insula - A Future for Venice [database online]. 2008 [cited September 25 2010].
Available from http://www.insula.it/scavorii_en.asp?show=2&subsection=10.
Insula - the ancient venetian sewer system. 2008 [cited September 20 2010]. Available from http://www.insula.it/resource/pdf/gatoli_eng.pdf.
Ishimaru, A. "Theory and application of wave propagation and scattering in random media." Proceedings of the IEEE 65.7 (2005): 1030-1061. Web. 18 Nov 2010. <http://au4sb9ax7m.scholar.serialssolutions.com/?sid=google&auinit=A&aulast=Ishimaru&atitle=Theory+and+application+of+wave+propagation+and+scattering+in+random+media&title=Proceedings+of+the+IEEE&volume=65&issue=7&date=2005&spage=1030&issn=0018-9219>.
Jocelyn Bessey, Enrico Cafaro, Victoria Klun, James McElroy, Jr., Jennifer Shaw. 1993. Venice Canal Studies. WPI Interactive Qualifying Project.

73
Kurpis, Brian. "Frequently Asked Questions." HurricaneKatrinaRelief.com. HurricanKatrinaRelief.com, 2005-
2009. Web. 1 Dec 2010. <http://www.hurricanekatrinarelief.com/about_us.html>
Lane, Frederic Chapin. 1973. Venice, a maritime republic. Baltimore: Johns Hopkins University Press.
Macdonald, K. C. 1982. Mid-ocean ridges: Fine scale tectonic, volcanic and hydrothermal processes within the plate boundary zone. Annual Review of Earth and Planetary Sciences 10 : 155.
MEDEX winds. in Naval Research Laboratory [database online]. 1999 [cited September 8 2010]. Available from http://www.nrlmry.navy.mil/~medex/tutorial/medex/winds/wind_all.html.
Our restless tides. Center for Operational Oceanographic Product and Services [database online]. 1998 [cited September 8 2010]. Available from http://www.co-ops.nos.noaa.gov/restles1.html.
Ozbas, Halil I., James William Horstick, Matthew John Crawford, Alexander Peter Borrelli, Fabio Carrera, and Stephen J. Weininger. 1999. Quantification of sediment sources in the city of venice, italy. WPI Interactive Qualifying Project.
Re, I., and P. Endangerment. 2006. United states environmental protection agency. Sartori, Umberto. "Report on flood-tide in the Lagoon of Venice, 2009." Venice Observer. 2009. Web. 11 Dec
2010. <http://venicexplorer.net/observer/images/maree-venezia-2009/index.php?hlangs=en>. "The Deadliest Tsunami in History?." National Geographic 07 Jan 2005: n. pag. Web. 1 Dec 2010.
<http://news.nationalgeographic.com/news/2004/12/1227_041226_tsunami.html> "Venice's Great Flood in 1966 destroyed art and homes ." Telegraph 01 Dec 2008: n. pag. Web. 1 Dec 2010.
<http://www.telegraph.co.uk/news/worldnews/europe/italy/3540719/Venices-Great-Flood-in-1966-destroyed-art-and-homes.html>.
Ward, Alan. "Weighing Earth's Water from Space." Earth Observatory. NASA, 23 Dec 2003. Web. 1 Dec
2010. <http://earthobservatory.nasa.gov/Features/WeighingWater/> Watts, Jonathan. "China devastated by floods." Guardian (2010): n. pag. Web. 7 Dec 2010.
<http://www.guardian.co.uk/world/2010/jun/20/china-devastated-floods>.

74
APPENDIX A – LITERATURE REVIEW

75
3.1 Sources Reviewed Primarily for Background Topics Regarding Tides
Centro Previsioni e Segnalacioni Maree - Città Di Venezia - Home - City of Venice - Città Di Venezia - Il Portale Ufficiale Della Città. Web. 15 Sept. 2010. <http://www.comune.venezia.it/flex/cm/pages/ServeBLOB.php/L/EN/IDPagina/1644.>.
This website contains information on long-term and short-term tide forecasting, along with what the
tides are expected to be like while we are in Venice. Many graphs and explanations are included, which
provided a clearer understanding of the subject. This source also contains regulations and rules that the City
of Venice follows. The source also provided information about what Venetians do in preparation for Acque
Alte.
Climate Change 2001: The Scientific Basis - Church, J. A., J. M. Gregory, P. Huybrechts, M. Kuhn, K. Lambeck, M. T. Nhuan, D. Qin, and P. L. Woodworth. UNEP/GRID-Arendal - Home. Web. 15 Sept. 2010. <http://www.grida.no/climate/ipcc_tar/wg1/408.htm> This chapter assesses the current knowledge regarding the global and regional rates of change of sea
level in relation to climate change. However, because of the slow response to past conditions of the oceans
and ice sheets and the consequent land movements, changes in sea level prior to the historical record are
considered.
Fine Scale Tectonic, Volcanic and Hydrothermal Processes Within the Plate Boundary Zone – Macdonald, Ken C. Annual Reviews, Inc. Web. 15 Sept. 2010. <http://www.annualreviews.org/doi/pdf/10.1146/annurev.ea.10.050182.001103> This article focuses primarily on plate tectonics and how they function. It also contains information
about mid-ocean ridges and the movement of plates.
Long-term variations on sea level and tidal regime in the lagoon of Venice – F e r l a , M , M C o r d e l l a , L M i c h i e l l i , a n d A R u s co n i . E s t u a r i n e , C o a s t a l a n d S h e l f S c i e n c e 7 5 . 1 - 2 ( 2 0 0 7 ) : 2 1 4 - 2 2 2 . W eb . 1 8 N o v 2 0 1 0 . < h t t p : / / a u 4 s b 9 a x 7 m . s ch o l a r . s e r i a l s s o l u t i o n s . c o m / ? s i d =g o o g l e& a u i n i t =M & a u l a s t= F e r l a & a t i t l e=L o n g -t e r m +v a r i a t i o n s +o n + s e a + l ev e l + a n d +t i d a l + r eg i m e+ i n +t h e + l a g o o n + o f + V en i c e& t it l e = E s t u a r i n e , +c o a s t a l + a n d +s h e l f +s c i en ce & v o l u m e = 7 5 & i s s u e= 1 -2 & d a t e= 2 0 0 7 & s p a g e= 2 1 4 & i s s n =0 2 7 2 - 7 7 1 4 > . This article is an analysis of data collected from the real-time tidal gauge system in the Venice lagoon
and specifically the Northern Lagoon. It investigates the possibility of subsidence and eustatism affecting the
tide delay, as well as the change in Mean Sea Level.

76
MEDEX Winds - Naval Research laboratory, Internet, World Wide Web, http://www.nrlmry.navy.mil/~medex/tutorial/medex/winds/wind_all.html, 1999.
This online tutorial provided information regarding the two influential winds in the Mediterranean
which have major impacts on the Venetian canals – The Bora and Sirocco. It explains the sources of the
winds and how they alter the Adriatic Sea, the Venetian lagoon and the canals.
Our Restless Tides - Center for Operational Oceanographic Product and Services, Internet. World Wide Web, <http://www.co-ops.nos.noaa.gov/restles1.html> February, 1998.
This online written lesson provided information on lunar cycles, solar cycles and the gravitational
impact on tides. It was also helpful in identifying tidal inequalities and explained how tides are predicted
based on the position of the celestial bodies.
Temporal Variations of Water Flow Between the Venetian Lagoon and the Open Sea – Gačić, Miroslav, Isaac Mancero Mosquera, Vedrana Kovačević, Andrea Mazzoldi, and Vanessa Cardin. Journal of Marine Systems 51.1-4 (2004): 33-47. Web. 18 Nov 2010. <http://www.sciencedirect.com/science?_ob=ArticleURL&_udi=B6VF5-4D9D9J1-1&_user=74021&_coverDate=11%2F01%2F2004&_rdoc=1&_fmt=high&_orig=search&_origin=search&_sort=d&_docanchor=&view=c&_searchStrId=1546050924&_rerunOrigin=google&_acct=C000005878&_version=1&_urlVersion=0&_userid=74021&md5=c6af8045a1270d073ce7c65156a0f25c&searchtype=a>.
This article discusses the tide variance and the effect is has on the islands in the lagoon. It also
analyzes the different flows through the three Venice Lagoon inlets: the Malmocco, Lido, and Chioggia inlets.
The trends of the difference in tidal flows throughout the past century are also analyzed.
Theory and Application of Wave Propagation and Scattering in Random Media - Ishimaru, A.
Proceedings of the IEEE 65.7 (2005): 1030-1061. Web. 18 Nov 2010.
<http://au4sb9ax7m.scholar.serialssolutions.com/?sid=google&auinit=A&aulast=Ishimaru&atitle=Theory+
and+application+of+wave+propagation+and+scattering+in+random+media&title=Proceedings+of+the+I
EEE&volume=65&issue=7&date=2005&spage=1030&issn=0018-9219>.
This report discusses the change in the study of wave propagation due to changes in the atmosphere,
the ocean, and biological media who‟s characteristics are randomly varying in time and space. It introduces
the idea of waves being distributed randomly and continuous waves. Also, they give reasons as to why some
tides are more intense than others and how they fluctuated throughout the lunar cycle.
U.S. Environmental Protection Agency: Web. 15 Sept. 2010. <http://www.epa.gov/>.

77
This source contains predications made by EPA regarding the future changes in the natural sea level.
It also shows how the rate of the rising sea level is changing.
Venice: A Maritime Republic - Lane, Frederic. Baltimore: Johns Hopkins UP, 1973.
This article contains an in depth exploration of Venice's problem with subsidence. It discussed
various theories for the sinking of the land as well as the historical context of the issue.
Sources Reviewed Primarily for Background Topics Regarding Canal and Lagoon History and Information
Canal Excavation - Insula: A Future for Venice. 2008. Insula spa. Web. 25 Sep 2010. <http://www.insula.it/scavorii_en.asp?show=2&subsection=10> This part of the Insula Webpage provided information on canal excavation and the reason why it is a
necessary part of maintenance in Venice. It also describes two types of dredging that Insula performs: deep-
water dredging and dry-bottom dredging.
Quantification of Sediment Sources in the Canals of the City of Venice, Italy - Borrelli, A., Crawford, M., Horstick, J., Ozbas, H.. 1999. WPI Interactive Qualifying Project. This IQP provided information about the Venetian sewer system and the composition of the canal
walls and how sedimentation buildup in the canals influences other canal aspects such as sedimentation.
The Ancient Venetian Sewer System. - Insula: A Future for Venice. Insula spa. 2008. Web.
25 Sep 2010. <http://www.insula.it/resource/pdf/gatoli_eng.pdf>
This part of the Insula Webpage provided information about the history and construction of the
Venetian sewage system.
Venice Canal Studies – Jocelyn Bessey, Enrico Cafaro, Victoria Klun, James McElroy, Jr., Jennifer Shaw. 1993. WPI Interactive Qualifying Project.
This Interactive Qualifying Project written by students that previously studied at the Venice Project Center was a useful resource for background on the Venice Lagoon. Venice the Tourist Maze: A Cultural Critique of the World’s Most Touristed City - Davis, Robert and Marvin, Garry, 2004.

78
This book provided information about the history of Venice and addresses many of the issues that
Venice faces. It also provided information on the current state of the canals and what is being done to protect
them. In describing the history of the Venice, the book also discusses the Venetian sewer system from past
to present.
Sources Reviewed Primarily for Methodology
Hydrodynamics of the Inner Canals of Venice – Biscotti, Christine, Emery, Adrea, Pistilli, Maxwell and Zsofka, Joseph. 1999. WPI Interactive Qualifying Project. This past WPI IQP served as a guideline to help determine what should be included in the
background, literature review and methodology. The report described the basic hydrodynamic behavior of
the canals in 1999 and provided a benchmark to compare to the present day hydrodynamics of the canals. It
outlined our hydrodynamics methodology entirely and a basis for results comparison.

79
APPENDIX B – HYDRODYNAMICS DEVICE

80
HYDRODYNAMICS DEVICE

81
APPENDIX C – SCHEDULE FOR HYDRODYNAMICS TESTING

82
November 4th – 6th 2010 – NEW MOON

83
November 4th – Thursday (Day before new moon)
Cannaregio
High Tide (8:50) – Low Tide (15:30) – Tide going OUT
PANA2 OUT – Tested at 12:35, tide level ~23 cm, flowing in the direction of North to South
Average Velocity = 0.31 m/s = 31 cm/s
MIRA OUT – Tested at 12:45, tide level ~17 cm, flowing in the direction of East to West
Average Velocity = 0.25 m/s = 25 cm/s
WIDM1 OUT – Tested at 12:55, tide level ~15 cm, flowing in the direction of North to South
Average Velocity = 0.24 m/s = 24 cm/s
PANA1 OUT – Tested at 13:05, tide level ~12 cm, flowing in the direction of North to South
Average Velocity = 0.096 m/s = 9.6 cm/s
Low Tide (15:30) – High Tide (21:45) – Tide going IN
PANA2 IN – Tested at 18:15, tide level ~23 cm, flowing in the direction of South to North
Average Velocity = 0.31m/s = 31 cm/s
MIRA IN – Tested at 18:05, tide level ~17 cm, flowing in the direction of West to East
Average Velocity = 0.24 m/s = 24 cm/s
WIDM1 IN – Tested at 17:55, tide level ~15 cm, flowing in the direction of South to North
Average Velocity = 0.15 m/s = 15 cm/s
PANA1 IN – Tested at 17:43, tide level ~12 cm, flowing in the direction of South to North
Average Velocity = 0.076 m/s = 7.6 cm/s

84

85
November 5th – Friday (New Moon)
Cannaregio
High Tide (9:25) – Low Tide (16:05) – Tide going OUT
APOS3 OUT – Tested at 12:30, tide level ~47 cm, flowing in the direction of North to South
Average Velocity = 0.16 m/s = 16 cm/s
APOS1 OUT – Tested at 12:45, tide level ~44 cm, flowing in the direction of North to South
Average Velocity = 0.29 m/s = 29 cm/s
GOZZ OUT – Tested at 13:00, tide level ~40 cm, flowing in the direction of West to East
Average Velocity = 0.18 m/s = 18 cm/s
GESU2 OUT – Tested at 13:16, tide level ~37 cm, flowing in the direction of North to South
Average Velocity = 0.17 m/s = 17 cm/s
CATE3 OUT – Tested at 13:30, tide level ~34 cm, flowing in the direction of West to East
Average Velocity = 0.083 m/s = 8.3 cm/s
Low Tide (16:05PM) – Low Tide (22:25) – Tide going IN
APOS3 IN – Tested at 19:50, tide level ~47 cm, flowing in the direction of South to North
Average Velocity = 0.29 m/s = 29 cm/s
APOS1 IN – Tested at 19:35, tide level ~44 cm, flowing in the direction of South to North
Average Velocity = 0.47 m/s = 47 cm/s
GOZZ IN – Tested at 19:25, tide level ~40 cm, flowing in the direction of South to North
Average Velocity = 0.08 m/s = 8 cm/s
GESU2 IN – Tested at 19:15, tide level ~37 cm, flowing in the direction of South to North
Average Velocity = 0.2 m/s = 20 cm/s
CATE3 IN – Tested at 19:00, tide level ~34 cm, flowing in the direction of East to West
Average Velocity = 0.086 m/s = 8.6 cm/s

86

87
November 6th – Saturday (Day after new moon)
San Marco
High Tide (9:55) – Low Tide (16:40) – Tide going OUT
VEST2 OUT – Tested at 12:18, tide level ~48 cm, flowing in the direction of West to East
Average Velocity = 0.08 m/s = 8 cm/s
ANZO2 OUT – Tested at 12:43, tide level ~43 cm, flowing in the direction of West to East
Average Velocity = 0.15 m/s = 15 cm/s
SANT OUT – Tested at 13:15, tide level ~38 cm, flowing in the direction of North to South
Average Velocity = 0.18 m/s = 18 cm/s
PROC OUT – Tested at 13:45, tide level ~34 cm, flowing in the direction of East to West
Average Velocity = 0.11 m/s = 11 cm/s
FERA2 OUT – Tested at 14:13, tide level ~30 cm, flowing in the direction of West to East
Average Velocity = 0.11 m/s = 11 cm/s
BARE1 OUT – Tested at 14:30, tide level ~27 cm, flowing in the direction of North to South
Average Velocity = 0.13 m/s = 13 cm/s
Low Tide (16:40) – Low Tide (23:05) – Tide going IN
VEST2 IN – Tested at 20:22, tide level ~48 cm, flowing in the direction of East to West
Average Velocity = 0.08 m/s = 8 cm/s
ANZO2 IN – Tested at 20:10, tide level ~43 cm, flowing in the direction of East to West
Average Velocity = 0.13 m/s = 13 cm/s
SANT IN – Tested at 19:53, tide level ~38 cm, flowing in the direction of North to South
Average Velocity = 0.16 m/s = 16 cm/s
PROC IN – Tested at 19:36, tide level ~34 cm, flowing in the direction of West to East
Average Velocity = 0.07 m/s = 7 cm/s

88
FERA2 IN – Tested at 19:22, tide level ~30 cm, flowing in the direction of East to West
Average Velocity = 0.08 m/s = 8 cm/s
BARE1 IN – Tested at 19:00, tide level ~27 cm, flowing in the direction of South to North
Average Velocity = 0.07 m/s = 7 cm/s

89

90
November 20th-22nd 2010 – FULL MOON

91
November 20th – Saturday (Day before full moon)
San Polo
High Tide (9:30AM) – Low Tide (16:00) – Tide going OUT
DOMI OUT – Tested at 11:44, tide level ~70 cm, flowing in the direction of North to South
Average Velocity = 0.13 m/s = 13 cm/s
2TOR2 OUT – Tested at 12:00, tide level ~65 cm, flowing in the direction of East to West
Average Velocity = 0.26 m/s = 26 cm/s
ORIO1 OUT– Tested at 12:09, tide level ~62 cm, flowing in the direction of North/East to South/West
Average Velocity = 0.09 m/s = 9 cm/s
STIN OUT – Tested at 12:35, tide level ~52 cm, flowing in the direction of East to West
Average Velocity = 0.11 m/s = 11 cm/s
FRAR1 OUT – Tested at 12:46, tide level ~49 cm, flowing in the direction of North to South
Average Velocity = 0.118 m/s = 11.8 cm/s
Low Tide (16:00) – High Tide (22:30) – Tide going IN
FRAR1 IN – Tested at 19:47, tide level ~49 cm, flowing in the direction of South to North
Average Velocity = 0.083 m/s = 8.3 cm/s
STIN IN – Tested at 20:30, tide level ~52 cm, flowing in the direction of West to East
Average Velocity = 0.053 m/s = 5.3 cm/s
ORIO1 IN – Tested at 20:53, tide level ~62 cm, flowing in the direction of North/East to South/West
Average Velocity = 0.11 m/s = 11 cm/s
2TOR2 IN – Tested at 21:15, tide level ~65 cm, flowing in the direction of West to East
Average Velocity = 0.2 m/s = 20 cm/s
DOMI IN – Tested at 21:40, tide level ~70 cm, flowing in the direction of South to North
Average Velocity = 0.14 m/s = 14 cm/s

92

93
November 21st – Sunday (Day of full moon)
Castello
High Tide (9:30AM) – Low Tide (16:30) – Tide going OUT
LIO OUT – Tested at 12:32, tide level ~70 cm, flowing in the direction of North to South
Average Velocity = 0.028 m/s = 2.8 cm/s
TETT1 OUT – Tested at 13:15, tide level ~67 cm, flowing in the direction of West to East
Average Velocity = 0.226 m/s = 22.6 cm/s
PEST1 OUT – Tested at 13:28, tide level ~63 cm, flowing in the direction of West to East
Average Velocity = 0.58 m/s = 58 cm/s
FORM OUT – Tested at 13:35, tide level ~60 cm, flowing in the direction of South/West to North/East
Average Velocity = 0.066 m/s = 6.6 cm/s
Low Tide (16:30AM) – High Tide (23:45) – Tide going IN
FORM IN – Tested at 19:30, tide level ~60 cm, flowing in the direction of North/East-South/West
Average Velocity = 0.106 m/s = 10.6 cm/s
PEST1 IN – Tested at 19:45, tide level ~63 cm, flowing in the direction of East to West
Average Velocity = 0.286 m/s = 28.6 cm/s
TETT1 IN – Tested at 20:00, tide level ~67 cm, flowing in the direction of East to West
Average Velocity = 0.13 m/s = 13 cm/s
LIO IN – Tested at 2-:15, tide level ~70 cm, flowing in the direction of South to North
Average Velocity = 0.07 m/s = 7.0 cm/s

94

95
November 22nd – Monday (Day after full moon)
San Polo
High Tide (10:05) – Low Tide (17:05) – Tide going OUT
TOMA OUT – Tested at 13:00, tide level ~70 cm, flowing in the direction of West to East
Average Velocity = 0.216 m/s = 21.6 cm/s
POLO4 OUT – Tested at 13:20, tide level ~67 cm, flowing in the direction of South to North
Average Velocity = 0.12 m/s = 12.0 cm/s
Device Broke
Low Tide (17:05) – Low Tide (23:45) – Tide going IN
POLO4 IN – Tested at 21:55, tide level ~67 cm, flowing in the direction of South to North
Average Velocity = 0.197 m/s = 19.7 cm/s
TOMA IN – Tested at 22:22, tide level ~70 cm, flowing in the direction of East to West
Average Velocity = 0.20 m/s = 20.0 cm/s

96

97
December 4th-6th 2010 – NEW MOON

98
December 4th – Saturday (Day before new moon)
Cannaregio Group 1
High Tide (8:55) – Low Tide (15:55) – Tide going OUT
CATE2 OUT – Tested at 11:35, tide level ~65 cm, flowing in the direction of West to East
Average Velocity = 0.16 m/s = 16 cm/s
CAT1 OUT – Tested at 11:45, tide level ~63 cm, flowing in the direction of West to East
Average Velocity = 0.24 m/s = 24 cm/s
PRIU3 OUT – Tested at 11:55, tide level ~60 cm, not flowing
Average Velocity = 0 m/s = 0 cm/s
PRIU2 OUT – Tested at 12:00, tide level ~60 cm, not flowing
Average Velocity = 0 m/s = 0 cm/s
PRIU1 OUT – Tested at 12:05, tide level ~60 cm, not flowing
Average Velocity = 0 m/s = 0 cm/s
Low Tide (15:55) – High Tide (22:30) – Tide going IN
PRIU1 IN – Tested at 19:12, tide level ~60 cm, flowing in the direction of West to East
Average Velocity = 0.035 m/s = 3.5 cm/s
PRIU2 IN – Tested at 19:20, tide level ~60 cm, not flowing
Average Velocity = 0 m/s = 0 cm/s
PRIU3 IN – Tested at 19:30, tide level ~60 cm, not flowing
Average Velocity = 0 m/s = 0 cm/s
CATE1 IN – Tested at 19:37, tide level ~63 cm, flowing in the direction of East to West
Average Velocity = 0.115 m/s = 11.5 cm/s
CATE2 IN – Tested at 19:45, tide level ~65 cm, flowing in the direction of East to West
Average Velocity = 0.086 m/s = 8.6 cm/s

99

100
December 4th – Saturday (Day before new moon)
Cannaregio Group 2
High Tide (8:55) – Low Tide (15:55) – Tide going OUT
CREA3 OUT – Tested at 12:05, tide level ~50 cm, flowing in the direction of NorthWest to SouthEast
Average Velocity = 0.113 m/s = 11.3 cm/s
GIOB OUT – Tested at 12:30, tide level ~48 cm, flowing in the direction of South to North
Average Velocity = 0.063 m/s = 6.3 cm/s
BATE1 OUT – Tested at 14:22, tide level ~35 cm, flowing in the direction of NorthWest to SouthEast
Average Velocity = 0.33 m/s = 33 cm/s
GHET OUT – Tested at 14:37, tide level ~33 cm, flowing in the direction of South to North
Average Velocity = 0.086 m/s = 8.6 cm/s
Low Tide (15:55) – High Tide (22:30) – Tide going IN
GHET IN – Tested at 19:04, tide level ~33 cm, flowing in the direction of North to South
Average Velocity = 0.048 m/s = 4.8 cm/s
BATE1 IN – Tested at 19:28, tide level ~35 cm, flowing in the direction of SouthEast to NorthWest
Average Velocity = 0.243 m/s = 24.3 cm/s
GIOB IN – Tested at 19:39, tide level ~48 cm, flowing in the direction of South to North
Average Velocity = 0.069 m/s = 6.9 cm/s
CREA3 IN – Tested at 20:13, tide level ~50 cm, flowing in the direction of SouthEast to NorthWest
Average Velocity = 0.039 m/s = 3.9 cm/s

101

102
December 5th – Sunday (Day of new moon)
Dorsoduro
High Tide (9:30) – Low Tide (16:30) – Tide going OUT
SALU1 OUT – Tested at 11:41, tide level ~67 cm, flowing in the direction of North to South
Average Velocity = 0.055 m/s = 5.5 cm/s
FORN1 OUT – Tested at 11:50, tide level ~65 cm, flowing in the direction of North to South
Average Velocity = 0.15 m/s = 15.0 cm/s
FORN2 OUT – Tested at 12:00, tide level ~63 cm, flowing in the direction of North to South
Average Velocity = 0.088 m/s = 8.8 cm/s
VIO OUT – Tested at 12:15, tide level ~60 cm, not flowing
Average Velocity = 0 m/s = 0 cm/s
TROV3 OUT – Tested at 12:25, tide level ~57 cm, not flowing
Average Velocity = 0 m/s = 0 cm/s
TROV2 OUT – Tested at 12:26, tide level ~55 cm, not flowing
Average Velocity = 0 m/s = 0 cm/s
OGNI1 OUT – Tested at 12:40, tide level ~54 cm, not flowing
Average Velocity = 0 m/s = 0 cm/s
OGNI2 OUT – Tested at 12:45, tide level ~52 cm, flowing in the direction of West to East
Average Velocity = 0.053 m/s = 5.3 cm/s
ROMI1 OUT – Tested at 13:00, tide level ~50 cm, flowing in the direction of North to South
Average Velocity = 0.059 m/s = 5.9 cm/s
Low Tide (16:30) – High Tide (23:15) – Tide going IN
ROMI1 IN – Tested at 19:35, tide level ~50 cm, flowing in the direction of North to South
Average Velocity = 0.115 m/s = 11.5 cm/s
OGNI2 IN – Tested at 19:38, tide level ~52 cm, flowing in the direction of West to East

103
Average Velocity = 0.113 m/s = 11.3 cm/s
OGNI1 IN – Tested at 19:44, tide level ~54 cm, flowing in the direction of West to East
Average Velocity = 0.155 m/s = 15.5 cm/s
TROV2 IN – Tested at 20:01, tide level ~55 cm, flowing in the direction of North to South
Average Velocity = 0.19 m/s = 19.0 cm/s
TROV3 IN – Tested at 20:07, tide level ~57 cm, flowing in the direction of North to South
Average Velocity = 0.17 m/s = 17.0 cm/s
VIO IN – Tested at 20:21, tide level ~60 cm, flowing in the direction of North to South
Average Velocity = 0.13 m/s = 13.0 cm/s
FORN2 IN – Tested at 20:33, tide level ~63 cm, flowing in the direction of North to South
Average Velocity = 0.16m/s = 16.0 cm/s
FORN1 IN – Tested at 20:39, tide level ~65 cm, flowing in the direction of North to South
Average Velocity = 0.51 m/s = 51.0 cm/s
SALU1 IN – Tested at 20:53, tide level ~67 cm, flowing in the direction of North to South
Average Velocity = 0.27 m/s = 27.0 cm/s
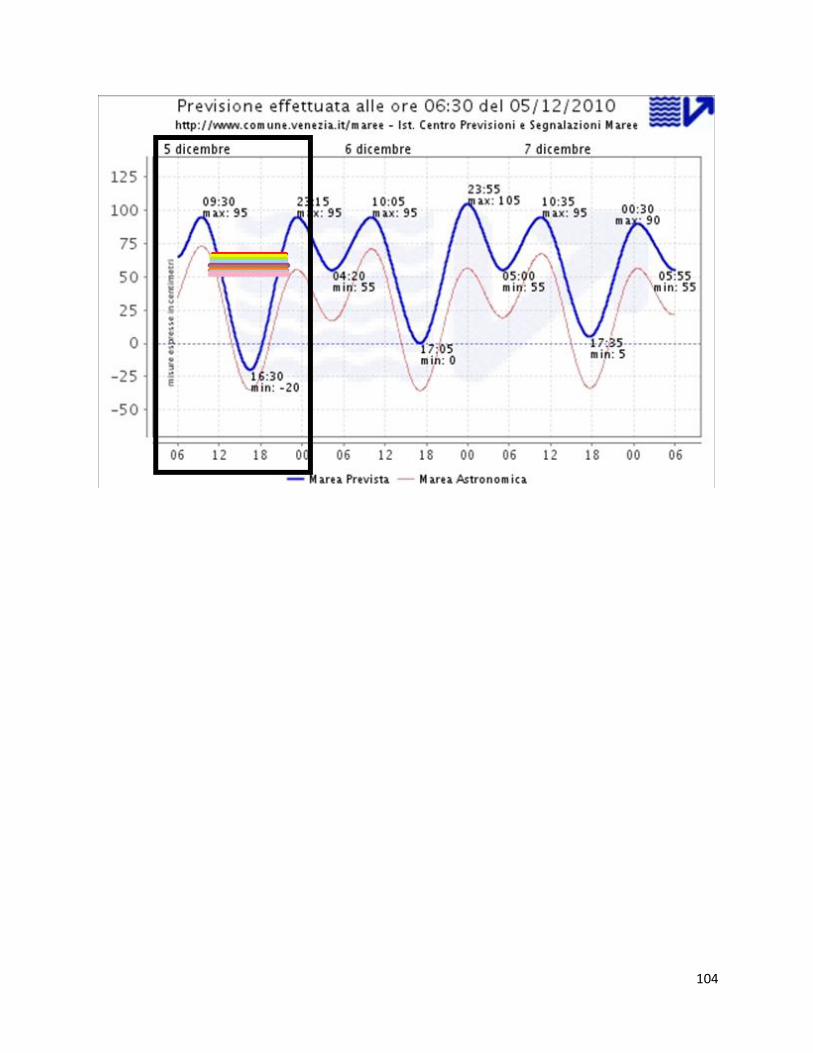
104

105
December 5th – Sunday (Day of new moon)
Santa Croce
High Tide (9:30) – Low Tide (16:30) – Tide going OUT
MUNE OUT – Tested at 11:38, tide level ~67 cm, flowing in the direction of North to South
Average Velocity = 0.156 m/s = 15.6 cm/s
MAGA OUT – Tested at 11:53, tide level ~65 cm, flowing in the direction of East to West
Average Velocity = 0.038 m/s = 3.8 cm/s
BURC OUT – Tested at 12:12, tide level ~62 cm, flowing in the direction of North to South
Average Velocity = 0.14 m/s = 14.0 cm/s
MAGG3 OUT – Tested at 12:35, tide level ~58 cm, flowing in the direction of North to South
Average Velocity = 0.115 m/s = 11.5 cm/s
TERE1 OUT – Tested at 12:48, tide level ~55 cm, flowing in the direction of North to South
Average Velocity = 0.062 m/s = 6.2 cm/s
MAGG2 OUT – Tested at 12:53, tide level ~53 cm, flowing in the direction of North to South
Average Velocity = 0.094 m/s = 9.4 cm/s
MAGG1 OUT – Tested at 13:10, tide level ~49 cm, flowing in the direction of North to South
Average Velocity = 0.067 m/s = 6.7 cm/s
TREP3 OUT – Tested at 13:34, tide level ~47 cm, flowing in the direction of North to South
Average Velocity = 0.15 m/s = 15.0 cm/s
Low Tide (16:30) – High Tide (23:15) – Tide going IN
TREP3 IN – Tested at 19:06, tide level ~47 cm, flowing in the direction of South to North
Average Velocity = 0.029 m/s = 2.9 cm/s
MAGG1 IN – Tested at 19:27, tide level ~49 cm, not flowing
Average Velocity = 0 m/s = 0 cm/s
MAGG2 IN – Tested at 19:34, tide level ~53 cm, flowing in the direction of South to North

106
Average Velocity = 0.017 m/s = 1.7 cm/s
TERE1 IN – Tested at 19:41, tide level ~55 cm, flowing in the direction of South to North
Average Velocity = 0.025 m/s = 2.5 cm/s
MAGG3 IN – Tested at 19:57, tide level ~58 cm, not flowing
Average Velocity = 0 m/s = 0 cm/s
BURC IN – Tested at 20:11, tide level ~62 cm, flowing in the direction of South to North
Average Velocity = 0.092 m/s = 9.2 cm/s
MAGA IN – Tested at 20:21, tide level ~65 cm, not flowing
Average Velocity = 0 m/s = 0 cm/s
MUNE IN – Tested at 20:34, tide level ~67 cm, flowing in the direction of South to North
Average Velocity = 0.146 m/s = 14.6 cm/s

107

108
APPENDIX D – HYDRODYNAMICS FIELD FORMS
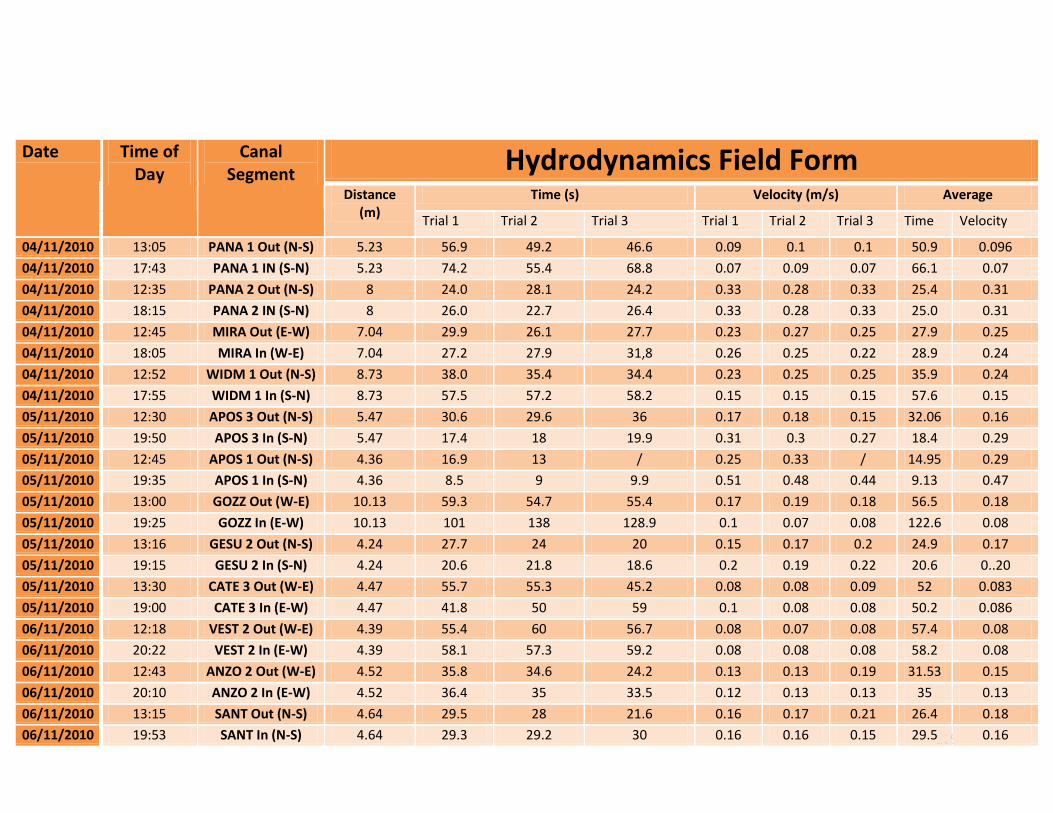
109
Date Time of Day
Canal Segment
Hydrodynamics Field Form Distance
(m) Time (s) Velocity (m/s) Average
Trial 1 Trial 2 Trial 3 Trial 1 Trial 2 Trial 3 Time Velocity
04/11/2010 13:05 PANA 1 Out (N-S) 5.23 56.9 49.2 46.6 0.09 0.1 0.1 50.9 0.096
04/11/2010 17:43 PANA 1 IN (S-N) 5.23 74.2 55.4 68.8 0.07 0.09 0.07 66.1 0.07
04/11/2010 12:35 PANA 2 Out (N-S) 8 24.0 28.1 24.2 0.33 0.28 0.33 25.4 0.31
04/11/2010 18:15 PANA 2 IN (S-N) 8 26.0 22.7 26.4 0.33 0.28 0.33 25.0 0.31
04/11/2010 12:45 MIRA Out (E-W) 7.04 29.9 26.1 27.7 0.23 0.27 0.25 27.9 0.25
04/11/2010 18:05 MIRA In (W-E) 7.04 27.2 27.9 31,8 0.26 0.25 0.22 28.9 0.24
04/11/2010 12:52 WIDM 1 Out (N-S) 8.73 38.0 35.4 34.4 0.23 0.25 0.25 35.9 0.24
04/11/2010 17:55 WIDM 1 In (S-N) 8.73 57.5 57.2 58.2 0.15 0.15 0.15 57.6 0.15
05/11/2010 12:30 APOS 3 Out (N-S) 5.47 30.6 29.6 36 0.17 0.18 0.15 32.06 0.16
05/11/2010 19:50 APOS 3 In (S-N) 5.47 17.4 18 19.9 0.31 0.3 0.27 18.4 0.29
05/11/2010 12:45 APOS 1 Out (N-S) 4.36 16.9 13 / 0.25 0.33 / 14.95 0.29
05/11/2010 19:35 APOS 1 In (S-N) 4.36 8.5 9 9.9 0.51 0.48 0.44 9.13 0.47
05/11/2010 13:00 GOZZ Out (W-E) 10.13 59.3 54.7 55.4 0.17 0.19 0.18 56.5 0.18
05/11/2010 19:25 GOZZ In (E-W) 10.13 101 138 128.9 0.1 0.07 0.08 122.6 0.08
05/11/2010 13:16 GESU 2 Out (N-S) 4.24 27.7 24 20 0.15 0.17 0.2 24.9 0.17
05/11/2010 19:15 GESU 2 In (S-N) 4.24 20.6 21.8 18.6 0.2 0.19 0.22 20.6 0..20
05/11/2010 13:30 CATE 3 Out (W-E) 4.47 55.7 55.3 45.2 0.08 0.08 0.09 52 0.083
05/11/2010 19:00 CATE 3 In (E-W) 4.47 41.8 50 59 0.1 0.08 0.08 50.2 0.086
06/11/2010 12:18 VEST 2 Out (W-E) 4.39 55.4 60 56.7 0.08 0.07 0.08 57.4 0.08
06/11/2010 20:22 VEST 2 In (E-W) 4.39 58.1 57.3 59.2 0.08 0.08 0.08 58.2 0.08
06/11/2010 12:43 ANZO 2 Out (W-E) 4.52 35.8 34.6 24.2 0.13 0.13 0.19 31.53 0.15
06/11/2010 20:10 ANZO 2 In (E-W) 4.52 36.4 35 33.5 0.12 0.13 0.13 35 0.13
06/11/2010 13:15 SANT Out (N-S) 4.64 29.5 28 21.6 0.16 0.17 0.21 26.4 0.18
06/11/2010 19:53 SANT In (N-S) 4.64 29.3 29.2 30 0.16 0.16 0.15 29.5 0.16

110
06/11/2010 13:45 PROC Out (E-W) 5.06 45.1 43.8 52.8 0.11 0.12 0.10 47.3 0.11
06/11/2010 19:36 PROC In (W-E) 5.06 73.1 72 80.1 0.07 0.07 0.06 75.1 0.07
06/11/2010 14:13 FERA 2 Out (W-E) 4.43 40.1 40.2 40.4 0.11 0.11 0.11 40.2 0.11
06/11/2010 19:22 FERA 2 In (E-W) 4.43 48.3 55.8 56.7 0.09 0.08 0.08 53.6 0.08
06/11/2010 14:30 BARE 1 Out (N-S) 7.8 66 57.2 58.1 0.12 0.14 0.13 60.43 0.13
06/11/2010 19:00 BARE 1 In (S-N) 7.8 111.1 101.3 117.2 0.07 0.08 0.07 109.8 0.07
20/11/2010 11:44 DOMI OUT (N-S) 7.12 51.8 48.3 54.9 0.13 0.14 0.12 51.6 0.13
20/11/2010 21:40 DOMI IN (S-N) 7.12 48.9 / / 0.14 / / 48.9 0.14
20/11/2010 12:00 2TOR2 OUT (E-W) 9.18 34.9 35.7 33.3 0.26 0.26 0.27 34.6 0.26
20/11/2010 21:15 2TOR2 IN (W-E) 9.18 43.4 45.4 43.5 0.21 0.20 0.21 44.1 0.20
20/11/2010 12:09 ORIO1 OUT (NE-SW)
12.8 131.1 128.8 / 0.09 0.09 / 129.9 0.09
20/11/2010 20:53 ORIO1 IN (NE-SW) 12.8 125.1 115.2 106.8 0.10 0.11 0.12 115.7 0.11
20/11/2010 12:35 STIN OUT (E-W) 8.32 65 86 76.9 0.128 0.097 0.108 75.9 0.11
20/11/2010 20:30 STIN IN (W-E) 8.32 145.5 129.5 151.5 0.05 0.06 0.05 142.16 0.053
20/11/2010 12:46 FRAR1 OUT (N-S) 8.45 70 72.3 / 0.12 0.116 / 71.15 0.118
20/11/2010 19:47 FRAR1 IN (S-N) 8.45 99.5 101.4 93.1 0.08 0.08 0.09 96.7 0.083
21/11/2010 12:32 LIO OUT (N-S) 5.03 148 179.7 176.9 0.03 0.027 0.028 504.6 0.028
21/11/2010 20:15 LIO IN (S-N) 5.03 71.1 68.2 / 0.07 0.07 / 69.65 0.07
21/11/2010 13:15 TETT1 OUT (W-E) 4.73 20.3 20.4 20.8 0.23 0.23 0.22 20.5 0.226
21/11/2010 20:00 TETT1 IN (E-W) 4.73 36.2 34.4 34.6 0.13 0.13 0.13 35.06 0.13
21/11/2010 13:28 PEST1 OUT (W-E) 14.14 25.4 24.8 22.2 0.55 0.57 0.63 24.13 0.58
21/11/2010 19:45 PEST1 IN (E-W) 14.14 48.5 49.1 48.1 0.29 0.28 0.29 48.56 0.286
21/11/2010 13:35 FORM OUT (SW-NE)
10.6 162.9 157.6 156.7 0.065 0.067 0.067 159.06 0.066
21/11/2010 19:30 FORM IN (NE-SW) 10.6 97.6 100.3 97.5 0.11 0.10 0.11 98.46 0.106
22/11/2010 13:00 TOMA OUT (W-E) 6.6 29.4 28.7 30.3 0.22 0.22 0.21 29.5 0.216
22/11/2010 22:22 TOMA IN (E-W) 6.6 30.16 30.4 34.08 0.21 0.21 0.19 31.54 0.20
22/11/2010 13:20 POLO4 OUT (S-N) 4.57 37.1 / / 0.12 / / 37.1 0.12

111
22/11/2010 21:55 POLO4 IN (S-N) 4.57 22.6 22.0 23.0 0.20 0.20 0.19 22.5 0.196
04/12/2010 11:35 CATE2 OUT (W-E) 8.26 48.8 50 / 0.16 0.16 / 49.4 0.16
04/12/2010 19:45 CATE2 IN (E-W) 8.26 98.3 96.8 91.9 0.084 0.085 0.089 95.6 0.086
04/12/2010 11:45 CATE1 OUT (W-E) 10.6 43.5 42.3 44.3 0.24 0.25 0.23 43.36 0.24
04/12/2010 19:37 CATE1 IN (E-W) 10.6 95.4 91.0 84.8 0.11 0.11 0.125 90.4 0.115
04/12/2010 12:00 PRIU3 OUT (NA) 8.9 NA NA NA 0 0 0 NA 0
04/12/2010 19:30 PRIU3 IN (NA) 8.9 NA NA NA 0 0 0 NA 0
04/12/2010 12:03 PRIU2 OUT (NA) 10.4 NA NA NA 0 0 0 NA 0
04/12/2010 19:20 PRIU2 IN (NA) 10.4 NA NA NA 0 0 0 NA 0
04/12/2010 12:05 PRIU1 OUT (NA) 2.9 NA NA NA 0 0 0 NA 0
04/12/2010 19:12 PRIU1 IN (W-E) 2.9 81.5 80.5 85.0 0.035 0.036 0.034 82.3 0.035
04/12/2010 12:05 CREA OUT (NW-SE)
7.1 57.4 55.0 65.2 0.12 0.12 0.10 59.2 0.113
04/12/2010 20:13 CREA IN (SE-NW) 7.1 181.2 187.2 169.8 0.039 0.037 0.041 179.4 0.039
04/12/2010 12:30 GIOB OUT (S-N) 6.45 100.7 103.7 98.2 0.064 0.062 0.065 100.86 0.063
04/12/2010 19:39 GIOB IN (S-N) 6.45 99.0 90.2 89.3 0.065 0.071 0.072 92.8 0.069
04/12/2010 14:22 BATE1 OUT (NW-SE)
4.4 12.8 13.7 12.6 0.34 0.32 0.34 13.0 0.33
04/12/2010 19:28 BATE1 IN (SE-NW) 4.4 16.7 19.6 17.2 0.26 0.22 0.25 17.8 0.243
04/12/2010 14:37 GHET OUT (S-N) 3.69 42.8 43.7 35.6 0.08 0.08 0.10 40.7 0.086
04/12/2010 19:04 GHET IN (N-S) 3.69 76.5 73.2 75.4 0.048 0.05 0.048 75.03 0.048
05/12/2010 11:41 SALU1 OUT (N-S) 6.5 114.3 104.7 98.9 0.05 0.06 0.065 105.96 0.055
05/12/2010 20:53 SALU1 IN (N-S) 6.5 23.8 22.8 22.7 0.27 0.28 0.28 23.1 0.27
05/12/2010 11:50 FORN1 OUT (N-S) 10 60.7 65.1 70.9 0.16 0.15 0.14 65.5 0.15
05/12/2010 20:39 FORN1 IN (N-S) 10 20.8 19.2 18.4 0.48 0.52 0.54 19.4 0.51
05/12/2010 12:00 FORN2 OUT (N-S) 7.2 86.4 73.7 / 0.08 0.097 / 80.05 0.088
05/12/2010 20:33 FORN2 IN (N-S) 7.2 54.5 41.1 40.0 0.13 0.17 0.18 45.2 0.16
05/12/2010 12:15 VIO OUT (NA) 10 NA NA NA 0 0 0 NA 0
05/12/2010 10:21 VIO IN (N-S) 10 70.0 81.1 / 0.14 0.12 / 75.55 0.13

112
05/12/2010 12:25 TROV3 OUT (NA) 7.53 NA NA NA 0 0 0 NA 0
05/12/2010 20:07 TROV3 IN (N-S) 7.53 42.2 45.0 41.2 0.17 0.16 0.18 42.8 0.17
05/12/2010 12:26 TROV2 OUT (NA) 7.86 NA NA NA 0 0 0 NA 0
05/12/2010 20:01 TROV2 IN (N-S) 7.86 39.8 39.7 38.8 0.19 0.19 0.2 39.4 0.19
05/12/2010 12:40 OGNI1 OUT (NA) 7.53 NA NA NA 0 0 0 NA 0
05/12/2010 19:44 OGNI1 IN (W-E) 7.53 46.2 47.1 / 0.16 0.15 / 46.6 0.155
05/12/2010 12:45 OGNI2 OUT (W-E) 6.01 95.0 100.3 103.6 0.06 0.05 0.05 99.6 0.053
05/12/2010 19:38 OGNI2 IN (W-E) 6.01 57.1 56.8 44.3 0.105 0.105 0.13 52.7 0.113
05/12/2010 13:00 ROMI1 OUT (N-S) 2.52 43.0 44.2 40.0 0.058 0.057 0.063 42.4 0.059
05/12/2010 17:35 ROMI1 IN (N-S) 2.52 23.5 21.9 20.1 0.107 0.115 0.125 21.8 0.115
05/12/2010 11:38 MUNE OUT (N-S) 10.5 63.8 68.3 62.2 0.16 0.15 0.16 64.76 0.156
05/12/2010 20:34 MUNE IN (S-N) 10.5 71.4 72.5 63.4 0.14 0.14 0.16 69.1 0.146
05/12/2010 11:53 MAGA OUT (E-W) 9.4 232.0 286.9 216.9 0.040 0.032 0.043 245.2 0.038
05/12/2010 20:21 MAGA IN (NA) 9.4 NA NA NA 0 0 0 NA 0
05/12/2010 12:12 BURC OUT (N-S) 10.0* 77.8 81.6 55.4 0.12 0.12 0.18 71.6 0.14
05/12/2010 20:11 BURC IN (S-N) 3.8* 40.3 41.4 41.2 0.094 0.091 0.092 40.9 0.092
05/12/2010 12:35 MAGG3 OUT (N-S) 7.55 64.4 68.7 67.3 0.11 0.10 0.11 66.8 0.115
05/12/2010 19:57 MAGG3 IN (NA) 7.55 NA NA NA 0 0 0 NA 0
05/12/2010 12:48 TERE1 OUT (N-S) 3.2 47.5 53.8 48.3 0.067 0.059 0.062 49.8 0.062
05/12/2010 19:41 TERE1 IN (S-N) 3.2 120.7 142.7 108.3 0.026 0.022 0.029 123.9 0.025
05/12/2010 12:53 MAGG2 OUT (N-S) 5.5 65.7 51.7 58.4 0.083 0.106 0.094 58.6 0.094
05/12/2010 19:34 MAGG2 IN (S-N) 5.5 297.3 303.8 306.9 0.018 0.018 0.017 302.6 0.017
05/12/2010 13:10 MAGG1 OUT (N-S) 9.1 131.4 129.2 141.7 0.069 0.07 0.064 134.1 0.067
05/12/2010 19:27 MAGG1 IN (NA) 9.1 NA NA NA 0 0 0 NA 0
05/12/2010 13:34 TREP3 OUT (N-S) 5.8* 35.0 34.8 43.8 0.16 0.16 0.13 37.86 0.15
05/12/2010 19:06 TREP3 IN (S-N) 3.8* 122.3 131.8 126.1 0.031 0.028 0.03 126.7 0.029
113
APPENDIX E – PAST HYDRODYNAMICS RESULTS & DATA
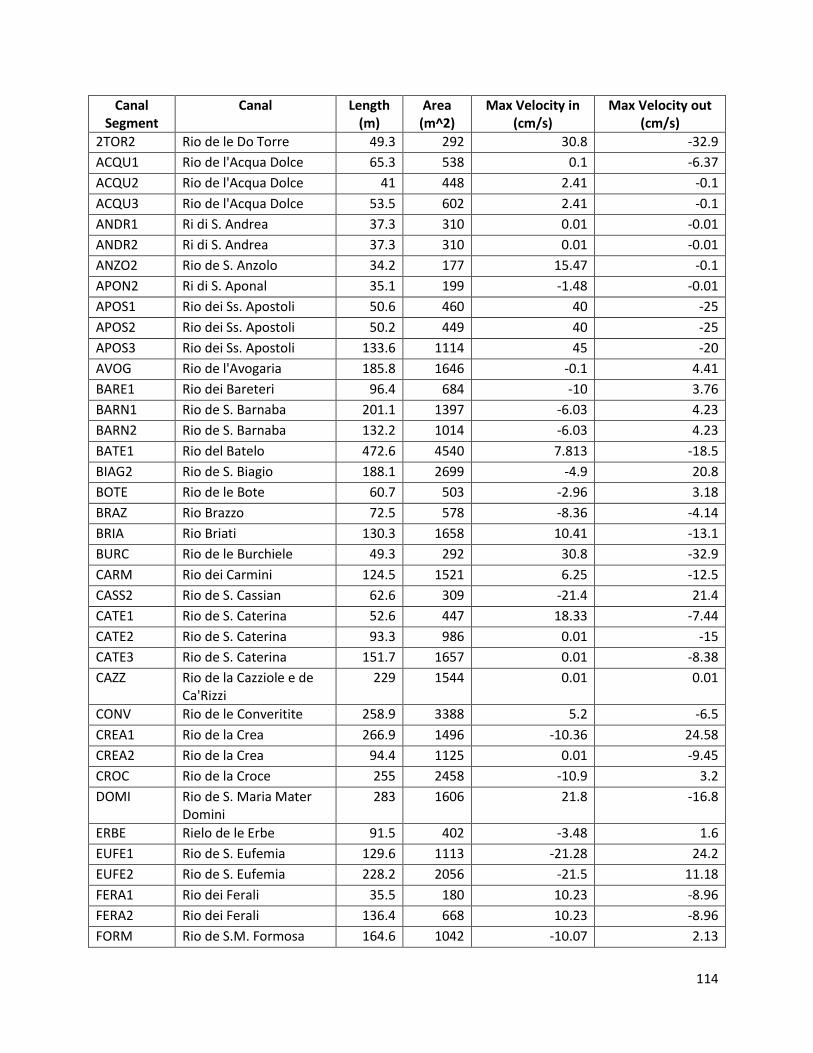
114
Canal Segment
Canal Length (m)
Area (m^2)
Max Velocity in (cm/s)
Max Velocity out (cm/s)
2TOR2 Rio de le Do Torre 49.3 292 30.8 -32.9
ACQU1 Rio de l'Acqua Dolce 65.3 538 0.1 -6.37
ACQU2 Rio de l'Acqua Dolce 41 448 2.41 -0.1
ACQU3 Rio de l'Acqua Dolce 53.5 602 2.41 -0.1
ANDR1 Ri di S. Andrea 37.3 310 0.01 -0.01
ANDR2 Ri di S. Andrea 37.3 310 0.01 -0.01
ANZO2 Rio de S. Anzolo 34.2 177 15.47 -0.1
APON2 Ri di S. Aponal 35.1 199 -1.48 -0.01
APOS1 Rio dei Ss. Apostoli 50.6 460 40 -25
APOS2 Rio dei Ss. Apostoli 50.2 449 40 -25
APOS3 Rio dei Ss. Apostoli 133.6 1114 45 -20
AVOG Rio de l'Avogaria 185.8 1646 -0.1 4.41
BARE1 Rio dei Bareteri 96.4 684 -10 3.76
BARN1 Rio de S. Barnaba 201.1 1397 -6.03 4.23
BARN2 Rio de S. Barnaba 132.2 1014 -6.03 4.23
BATE1 Rio del Batelo 472.6 4540 7.813 -18.5
BIAG2 Rio de S. Biagio 188.1 2699 -4.9 20.8
BOTE Rio de le Bote 60.7 503 -2.96 3.18
BRAZ Rio Brazzo 72.5 578 -8.36 -4.14
BRIA Rio Briati 130.3 1658 10.41 -13.1
BURC Rio de le Burchiele 49.3 292 30.8 -32.9
CARM Rio dei Carmini 124.5 1521 6.25 -12.5
CASS2 Rio de S. Cassian 62.6 309 -21.4 21.4
CATE1 Rio de S. Caterina 52.6 447 18.33 -7.44
CATE2 Rio de S. Caterina 93.3 986 0.01 -15
CATE3 Rio de S. Caterina 151.7 1657 0.01 -8.38
CAZZ Rio de la Cazziole e de Ca'Rizzi
229 1544 0.01 0.01
CONV Rio de le Converitite 258.9 3388 5.2 -6.5
CREA1 Rio de la Crea 266.9 1496 -10.36 24.58
CREA2 Rio de la Crea 94.4 1125 0.01 -9.45
CROC Rio de la Croce 255 2458 -10.9 3.2
DOMI Rio de S. Maria Mater Domini
283 1606 21.8 -16.8
ERBE Rielo de le Erbe 91.5 402 -3.48 1.6
EUFE1 Rio de S. Eufemia 129.6 1113 -21.28 24.2
EUFE2 Rio de S. Eufemia 228.2 2056 -21.5 11.18
FERA1 Rio dei Ferali 35.5 180 10.23 -8.96
FERA2 Rio dei Ferali 136.4 668 10.23 -8.96
FORM Rio de S.M. Formosa 164.6 1042 -10.07 2.13

115
FORN1 Rio de Is Fornasa 104.3 489 -22 -30.56
FORN2 Rio de Is Fornasa 168.6 1469 -22 -30.56
FOSC2 Rio de. S. Fosca 138.7 1471 14.33 -5.93
FRAR1 Rio dei Frari 87.6 747 1.15 -7.02
FRAR2 Rio dei Frari 34.3 249 1.15 -7.02
GESU1 Rio dei Gesuiti 128.4 2330 12.68 0.01
GESU2 Rio dei Gesuiti 44 456 19.95 -6.49
GHET Rio del Ghettio Novo 196.3 1687 -5.18 12.35
GIAR2 Rio dei Giardini 68.7 2020 24.04 27.02
GIAR3 Rio dei Giardini 359.2 6397 24.04 27.02
GIOB Rio dei Giobbe 274.4 1648 6.17 13.47
GOZZ Rio del Gozzi 163.5 1171 15.63 -6.93
GRIM1 Rio Grimani 37.6 184 23.19 -17.32
GRIM2 Rio Grimani 42.2 277 17.5 -19.19
GRIS1 Rio de S. Giovanni Grisostomo
141.3 645 -12.5 0.01
GRIS2 Rio de S. Giovanni Grisostomo
77.9 442 -12.5 0.01
LIO Rio de S. Lio 89.3 676 27 -30
LUST Rio dei Lustraferi 76.3 436 36.16 -16.33
MADA2 Rio de la Madalena 203.6 1231 23.6 -25.8
MAGA Rio del Magazen 63.9 504 -2.59 -9.7
MAGG1 Rio de S. Maria Maggior 169.6 1439 0.01 0.01
MAGG2 Rio de S. Maria Maggior 74.6 880 0.01 0.01
MAGG3 Rio de S. Maria Maggior 57.3 723 0.01 0.01
MALP1 Rio del Malpaga 153.4 1026 -7.98 4.54
MALP2 Rio del Malpaga 50.4 416 -9.33 5
MALP3 Rio del Malpaga 52.5 339 -9.25 7.93
MALP4 Rio del Malpaga 150 1148 -9.25 7.93
MARC1 Rio de S. Marcuola 39.5 200 37.13 -19.92
MARC2 Rio de S. Marcuola 97.8 628 37.13 -19.92
MARC3 Rio de S. Marcuola 46.4 319 37.13 -19.92
MARG Rio de S. Margherita 279.1 3117 -4.44 -27.7
MIRA Rio de S. Miarcoli 18.3 609 23.63 -24.04
MOND3 Rio del Mondo Novo 72.4 520 0.01 -9.59
MORO Rio de Ca'Moro 80.8 1732 6.77 -8.04
MUNE Rio de le Muneghete 349.6 22052 14.19 -16.41
MUTI Rio dei Muti 75.9 631 11.04 -5.52
NICO1 Rio de S. Nicolo dei Mendicoli
172.7 1464 6.27 -17.39
NOAL3 Rio de Noal 45.2 631 43.33 -28.88
NOVO4 Rio Novo 236.3 3522 19.86 -20.7

116
OGNI1 Rio dei Ognisanti 193.8 1636 0.1 -8.27
OGNI2 Rio dei Ognisanti 49 596 0.01 -8.27
ORIO1 Rio de S. Giacomo dell'Orio
51.6 395 5.8 6.18
ORSE Rio e Bacino Orseolo 120.1 1140 0.01 0.01
PALA Rio de la Palada 158.6 2541 0.01 3.13
PANA1 Rio de la Panada 119.7 1400 14.3 -8.66
PANA2 Rio de la Panada 222.5 1142 21.84 -27.99
PANA3 Rio de la Panada 85 565 14.94 -25.84
PEST1 Rio del Pestrin 79.7 763 0.01 -0.8
PEST2 Rio del Pestrin 120.6 901 24.25 -19.4
PIER3 Rio di S. Pietro di Castello
104.1 5169 7.9 7.9
POLO3 Rio de S. Polo 90.5 990 10.86 -3.06
POLO4 Rio de S. Polo 76 882 10.86 -3.06
PRIU1 Rio Priuli 49.2 379 11.15 7.06
PRIU2 Rio Priuli 83.7 745 0.01 0.01
PRIU3 Rio Priuli 47.8 547 0.01 0.01
PROC Rio de le Procuratie 105.2 578 7.23 -4.03
PROV2 Rio de S. Provolo de l'Osmarin
35.4 144 14.48 -10.5
RACH1 69.5 291 9.7 0.01
RAFF1 Rio de l'Anzolo Rafael 211.9 1852 0.01 -4.45
RAFF2 Rio de l'Anzolo Rafael 113.4 1320 0.01 -4.45
ROMI Rio de le Romite 176.9 1254 0.01 0.01
SALU1 Rio de la Salute 89.9 649 -14.48 -13.55
SALU2 Rio de la Salute 95.9 649 -14.48 -13.55
SALV Rio de S. Salvador 216.5 1072 10.86 -13.03
SANT Rio del Santissimo 275.3 1596 17.84 -17
SCOA1 Rio dei Scoacamini 99.6 631 16.3 -15.4
SCOA2 Rio dei Scoacamini 25.6 208 16.3 -15.4
SEBA Rio de Sebastian e S. Basegio
257 2765 24.59 -14.92
SENS4 Rio de la Sensa 82.7 844 37.03 -16.39
SERV2 Rio dei Servi 137.2 1478 25.88 -14.44
STIN Rio de S. Stin 111.9 935 1.15 -7.02
TENT1 Rio del Tentor 49.3 548 7.17 -12.53
TENT3 Rio del Tentor 249.8 3109 0.01 0.01
TERE1 Rio de le Terese 64.7 1429 0.01 -5.08
TERE2 Rio de le Terese 153 1942 0.01 -11.77
TETT1 Rio de la Tetta 39.9 264 0.01 -7.29
TOLA1 Rio de la Toletta 67.7 371 0.01 0.01

117
TOLA2 Rio de la Toletta 123.6 575 0.01 0.01
TOMA Rio de S. Toma' 165.2 844 1.15 -7.02
TRAP Rio del Trapolin 175.5 1281 7.73 1.57
TRAS Rio dei Trasti 74.9 484 -11.6 -11.6
TREP3 Rio dei Tre Ponti 36.7 477 3.97 -21.16
TROV2 Rio de S. Trovaso 261.9 2493 0.01 -14.08
TROV3 Rio de S. Trovaso 48.7 709 0.01 -8.06
TRTE Rio de le Torete 87.4 440 10.32 0.01
VERG2 Rio de le Vergini 71.2 863 16.03 -14.09
VEST2 Rio de le Veste 35.5 374 0.01 -9.81
VIN Rio del Vin 232.2 1351 24.6 -24.28
VIO Rio de S. Vio 267.6 2354 -9.09 -18.51
WIDM1 Rio Widman 114.9 782 12.75 -18.79
WIDM2 Rio Widman 22.3 157 12.75 -18.79
ZECA 69.5 558 5.77 6
ZIRA1 Rio de Sant'Andrea se la Zirada
57.7 404 0.01 -5.47

118
APPENDIX F – HYDRODYANIMCS COMPARISONS BETWEEN SUMMER
1999 & FALL 2010

119
Cannaregio
Canal Seg. 1999 Out Velocity (cm/s)
2010 Out Velocity (cm/s)
1999 In Velocity (cm/s)
2010 In Velocity (cm/s)
Comments
PANA1 -8.6 -9.6 14.3 7.6 Open to lagoon so accurate data is hard to obtain due to lagoon activities influencing canal segment
PANA2 -27.99 -31 21.84 31
WIDM1 -18.79 -24 12.75 15
MIRA -24.04 -25 23.63 24
APOS3 -20 -16 45 29 Very hard to measure – Possibly related to slower than expected flow?
APOS1 -25 -29 40 47
GOZZ -6.93 -18 15.63 8
GESU2 -6.49 -17 19.95 20
CATE3 -8.38 -8.3 0.01 8.6
CATE1 -7.44 -24 18.33 11.5
CATE2 -15 -16 0.01 8.6
PRIU1 7.06 0 11.15 3.5 Dredging on adjacent canals
PRIU2 0.01 0 0.01 0 Dredging on adjacent canals
PRIU3 0.01 0 0.01 0 Dredging on adjacent canals
CREA3 -9.45 -11.3 0.01 3.9
GIOB 13.47 6.3 6.17 6.9
BATE1 -18.5 -33 7.813 24.3
GHET 12.35 8.6 -5.18 -4.8

120
0
10
20
30
40
PA
N…
PA
N…
WI…
MIR
A
AP
…
AP
…
GO
ZZ
GES
…
CA
T…
CA
T…
CA
T…
PR
I…
PR
I…
PR
I…
CR
E…
GIO
B
BA
T…
GH
ET
Ve
loci
ty (
cm/s
_
Canal Segments
Cannaregio Water Velocities from Summer 1999 and Fall 2010 - Tide Going Out
Summer 1999
Fall 2010
0
10
20
30
40
50
PA
N…
PA
N…
WID
…
MIR
A
AP
O…
AP
O…
GO
ZZ
GES
…
CA
TE3
CA
TE1
CA
TE2
PR
IU1
PR
IU2
PR
IU3
CR
EA3
GIO
B
BA
TE1
GH
ET
Ve
loci
ty (
cm/s
)
Canal Segments
Cannaregio Water Velocities from Summer 1999 and Fall 2010 - Tide Going In
Summer 1999
Fall 2010

121
San Marco
Canal Seg. 1999 Out Velocity (cm/s)
2010 Out Velocity (cm/s)
1999 In Velocity (cm/s)
2010 In Velocity (cm/s)
Comments
VEST2 -9.81 -8 0.01 8
ANZO2 -0.1 -15 15.47 13
SANT -17 -18 17.84 16
PROC -4.03 -11 7.23 7
FERA2 -8.96 -11 10.23 8
BARE1 3.76 13 -10 -7
Summer 1999
Fall 20100
5
10
15
20
VEST2ANZO2 SANT
PROCFERA2
BARE1
Ve
loci
ty (
cm/s
)
Canal Segment
San Marco Water Velocities from Summer 1999 and Fall 2010 - Tide Going Out
Summer 1999
Fall 2010

122
Summer 1999
0
5
10
15
20
VEST2 ANZO2 SANT PROCFERA2
BARE1
Ve
loci
ty (
cm/s
)
Canal Segment
San Marco Water Velocities from Summer 1999 and Fall 2010 - Tide Going In
Summer 1999
Fall 2010

123
San Polo
Canal Seg. 1999 Out Velocity (cm/s)
2010 Out Velocity (cm/s)
1999 In Velocity (cm/s)
2010 In Velocity (cm/s)
Comments
DOMI1 -16.8 -13 21.8 14
2TOR2 -32.9 -26 30.8 20
ORIO1 6.18 9 5.8 11 Somewhat windy along surface of water
STIN -7.02 -11 1.15 5.3
FRAR1 -7.02 -11.8 1.15 8.3 Somewhat windy along surface of water
TOMA -7.02 -21.6 1.15 20
POLO4 -3.06 -12 10.86 -19.6
0
10
20
30
40
DOMI1 2TOR2 ORIO1 STINFRAR1 TOMA
POLO4
Ve
loci
ty (
cm/s
)
Canal Segments
San Polo Water Velocities from Summer 1999 and Fall 2010 - Tide Going Out
Summer 1999
Fall 2010

124
0
10
20
30
40
DOMI1 2TOR2 ORIO1 STIN FRAR1 TOMA POLO4
Ve
loci
ty (
cm/s
)
Canal Segments
San Polo Water Velocities from Summer 1999 and Fall 2010 - Tide Going In
Summer 1999
Fall 2010

125
Castello
Canal Seg. 1999 Out Velocity (cm/s)
2010 Out Velocity (cm/s)
1999 In Velocity (cm/s)
2010 In Velocity (cm/s)
Comments
LIO -30 -2.8 27 7 Rainy and windy day
TETT1 0.01 22.6 -7.29 -13 Rainy and windy day
PEST1 0.01 58 -0.8 -28.6 Rainy and windy day
FORM 2.13 6.6 -10.07 -10.6 Rainy and windy day
Summer 1999
Fall 20100
10
20
30
40
50
60
LIOTETT1
PEST1FORM
Ve
loci
ty (
cm/s
)
Canal Segments
Castello Water Velocities from Summer 1999 and Fall 2010 - Tide Going Out
Summer 1999
Fall 2010

126
Summer 1999
Fall 20100
5
10
15
20
25
30
LIOTETT1
PEST1FORM
Ve
loci
ty (
cm/s
)
Canal Segments
Castello Water Velocities from Summer 1999 and Fall 2010 - Tide Going In
Summer 1999
Fall 2010

127
Dorsoduro
Canal Seg. 1999 Out Velocity (cm/s)
2010 Out Velocity (cm/s)
1999 In Velocity (cm/s)
2010 In Velocity (cm/s)
Comments
SALU1 -13.55 -5.5 -14.48 -27.0
FORN1 -30.56 -15.0 -22 -51.0
FORN2 -30.56 -8.8 -22 -16.0
VIO -18.51 0 -9.09 -13.0
TROV3 -8.06 0 0.01 -17.0
TROV2 -14.08 0 0.01 -19.0
OGNI1 -8.27 0 0.01 -15.5
OGNI2 -8.27 -5.3 0.01 -11.3
ROMI1 0.01 -5.9 0.01 -11.5
0
10
20
30
40
SALU1 FORN1 FORN2 VIO TROV3 TROV2 OGNI1 OGNI2 ROMI1
Ve
loci
ty (
cm/s
)
Canal Segments
Dorsoduro Water Velocities from Summer 1999 and Fall 2010 - Tide Going Out

128
0
20
40
60
SALU1 FORN1 FORN2 VIO TROV3 TROV2 OGNI1 OGNI2 ROMI1
Ve
loci
ty (
cm/s
)
Canal Segments
Dorsoduro Water Velocities from Summer 1999 and Fall 2010 - Tide Going In
Summer 1999
Fall 2010

129
Santa Croce
Canal Seg. 1999 Out Velocity (cm/s)
2010 Out Velocity (cm/s)
1999 In Velocity (cm/s)
2010 In Velocity (cm/s)
Comments
MUNE -16.4 -15.6 14.19 14.6
MAGA -9.7 3.8 -2.56 0
BURC -32.9 -14.0 30.8 9.2
MAGG1 0.01 -6.7 0.01 0
MAGG2 0.01 -9.4 0.01 1.7
MAGG3 0.01 -11.5 0.01 0
TERE1 -5.08 -6.2 0.01 2.5
TREP3 -21.16 -15.0 3.97 2.9
0
10
20
30
40
MUNE MAGA BURCMAGG1 MAGG2 MAGG3 TERE1
TREP3
Ve
loci
ty (
cm/s
)
Canal Segments
Santa Croce Water Velocities from Summer 1999 and Fall 2010 - Tide Going Out
Summer 1999
Fall 2010

130
0
10
20
30
40
MUNE MAGA BURCMAGG1 MAGG2 MAGG3 TERE1
TREP3
Ve
loci
ty (
cm/s
)
Canal Segments
Santa Croce Water Velocities from Summer 1999 and Fall 2010 - Tide Going In
Summer 1999
Fall 2010

131
APPENDIX G – HYDROYNAMICS DATABASE

132
CANNAREGIO

133
APOS1

134
APOS3

135
BATE1

136
CATE1

137
CATE2

138
CATE3

139
CREA3

140
GESU2

141
GHET

142
GIOB

143
GOZZ

144
MIRA
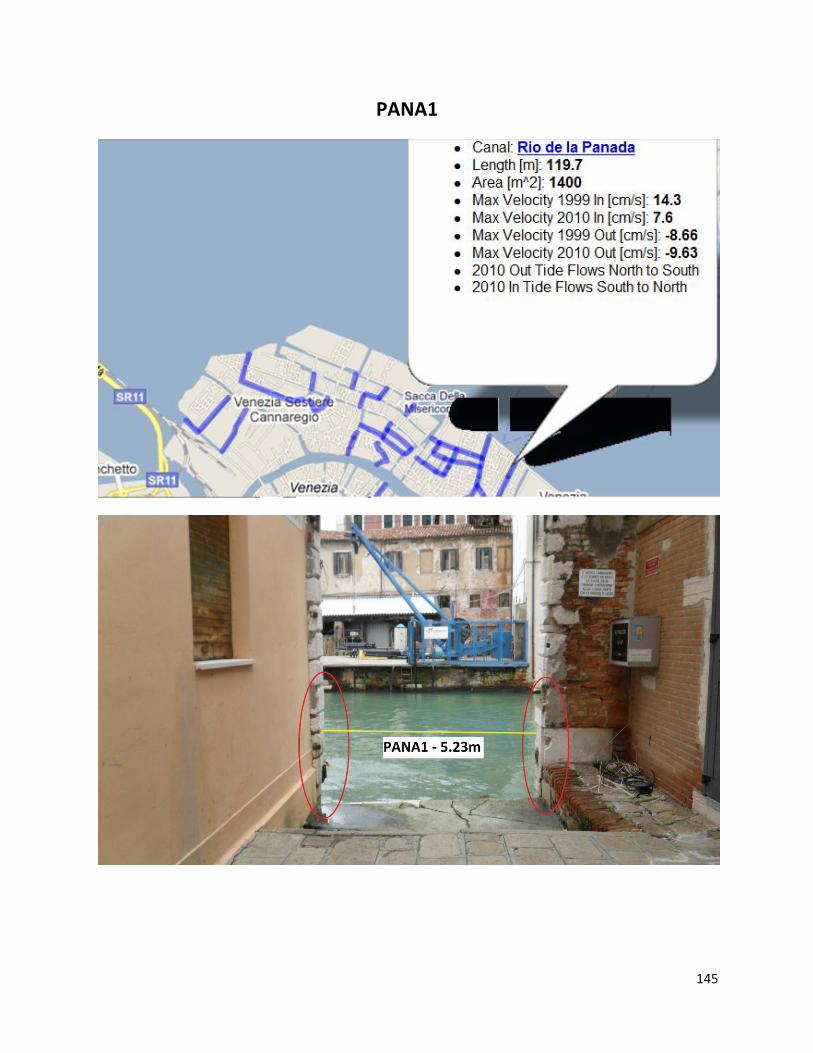
145
PANA1

146
PANA2

147
PRIU1

148
PRIU2

149
PRIU3

150
WIDM1

151
SAN MARCO

152
ANZO2

153
BARE1

154
FERA2

155
PROC

156
SANT

157
VEST2

158
SAN POLO

159
2TOR2

160
DOMI1

161
FRAR1

162
ORIO1

163
POLO4

164
STIN

165
TOMA

166
CASTELLO

167
FORM

168
LIO

169
PEST1

170
TETT1

171
DORSODURO

172
FORN1

173
FORN2

174
OGNI1

175
OGNI2
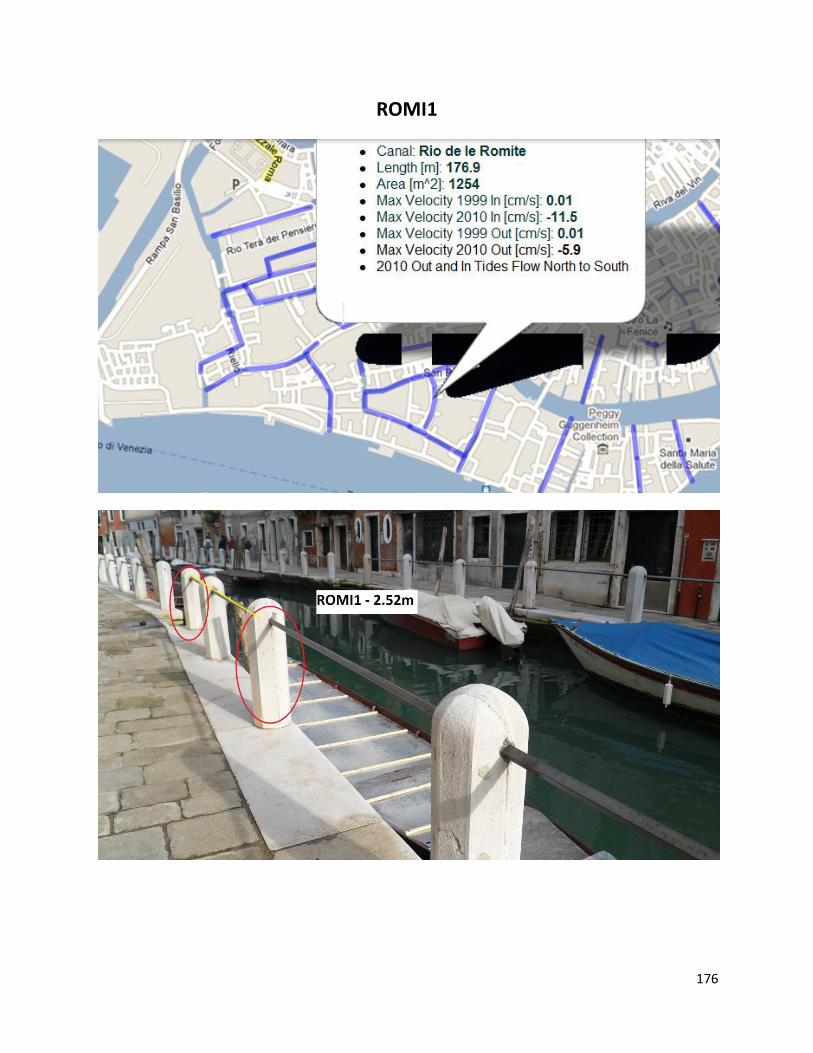
176
ROMI1

177
SALU1

178
TROV2

179
TROV3

180
VIO

181
SANTA CROCE

182
BURC

183
MAGA

184
MAGG1

185
MAGG2

186
MAGG3

187
MUNE

188
TERE1

189
TREP3

190
APPENDIX H - TIDE DELAY DEVICE

191
Tide Delay Device

192
APPENDIX I - SCHEDULE FOR TIDE DELAY TESTING

193
November 20th-22nd 2010 – FULL MOON

194
November 20th – Saturday (Day before full moon)
High Tide Forecasted at 9:30
Cannaregio – PANA2, GOZZ
San Polo – DOMI, ORIO
Low Tide Forecasted at 16:00
Castello – VIN, FORM
San Marco – SALVE, BARE1
High Tide Forecasted at 22:30
Santa Croce – MAGA, BURC
Dorsoduro – ROMI, TOLA1

195
November 21st – Sunday (Day of full moon)
High Tide Forecasted at 9:30
Santa Croce – NOVO4, MUNE
Dorsoduro – VIO, FORN1
Low Tide Forecasted at 16:30
San Polo – SEVE2, APON2
San Polo – TOMA, POLO4
High Tide Forecasted at 00:00
Castello – PEST2, MOND3
San Marco – FERA2, ORSE

196
November 22nd – Monday (Day after full moon)
High Tide Forecasted at 10:05
Dorsoduro – BRIA, MAGG1
Santa Croce – ZIRA1, TOLE
Low Tide Forecasted at 17:05
Castello – PROV2, PEST1
Cannaregio – MARC2, FOSC2
High Tide Forecasted at 23:45
San Polo – 2TOR2, CASS2
Cannaregio – CATE3, MIRA

197
December 4th-6th 2010 – NEW MOON

198
December 4th – Saturday (Day before new moon)
High Tide Forecasted at 8:55
San Polo – CASS1, MELO
Cannaregio – MADA2, MISE
Low Tide Forecasted at 15:55
San Marco – DUCA, MAUR
Castello – TETT2, LATE1
High Tide Forecasted at 22:35
Santa Croce – MARN, DEGO4
Castello – MOND2, ZANI

199
December 5th – Sunday (Day of new moon)
High Tide Forecasted at 9:30
Santa Croce – GAFF, TREP3
Dorsoduro – BARN1, BARN2
Low Tide Forecasted at 16:30
Cannaregio – TRAP, FELI2
San Polo – ERBE, MELO
High Tide Forecasted at 23:15
San Marco – CORN, GARZ

200
December 6th – Monday (Day after new moon)
High Tide Forecasted at 10:05
San Marco – CANO, ZULI
Castello – VIGN, GIUS
Low Tide Forecasted at 17:05
Dorsoduro – MARG, CAFO2
Dorsoduro – TORE, SALU1
High Tide Forecasted at 23:55
Cannaregio – APOS4, APOS3

201
APPENDIX J - FIELD FORMS FOR TIDE DELAY

202
GOZZ - Cannaregio - November 20th 2010 - High Tide
# Time Distance from Sidewalk (cm)
1 9:06 -16
2 9:12 -14
3 9:20 -13
4 9:25 -13
5 9:30 -11
6 9:35 -13
7 9:40 -15
8 9:45 -15
9 9:50 -16
ORIO - San Polo - November 20th 2010 - High Tide
# Time Distance from Sidewalk (cm)
1 9:17 -35
2 9:20 -33
3 9:21 -33
4 9:27 -31
5 9:28 -31
6 9:30 -30.5
7 9:32 -32
8 9:34 -33
9 9:35 -32.5
10 9:38 -32
11 9:42 -33
12 9:44 -32
13 9:46 -32
14 9:48 -33
15 9:50 -33
16 9:53 -33
BARE1 - San Marco - November 20th 2010 - Low Tide
# Time Distance from Sidewalk (cm)
1 15:25 -89
2 15:35 -91
3 15:40 -93
4 15:45 -95

203
5 15:52 -96
6 15:57 -97
7 16:00 -97
8 16:04 -98
9 16:06 -96
10 16:10 -93
SALVE - San Marco - November 20th 2010 - Low Tide
# Time Distance from Sidewalk (cm)
1 15:35 -149.4
2 15:42 -149.4
3 15:45 -148.9
4 15:48 -138.2
5 15:53 -147.7
6 15:55 -147.8
7 15:57 -147.9
8 15:59 -147.1
9 16:00 -145.5
10 16:03 -145.7
11 16:08 -145.7
12 16:15 -146.2
13 16:17 -146.9
FORM - Castello - November 20th 2010 - Low Tide
# Time Distance from Sidewalk (cm)
1 15:22 -145
2 15:30 -146
3 15:36 -147
4 15:44 -147.5
5 15:52 -148.5
6 16:00 -150
7 16:08 -149.5
8 16:11 -150
9 16:17 -151
10 16:23 -149.5

204
11 16:29 -149
VIN- Castello - November 20th 2010 - Low Tide
# Time Distance from Sidewalk (cm)
1 15:27 -85.5
2 15:30 -84.5
3 15:34 -88
4 15:36 -88
5 15:38 -87.5
6 15:40 -87
7 15:42 -87
8 15:48 -87
9 15:51 -87
10 15:56 -86.5
11 15:58 -86
12 16:00 -86
13 16:05 -86
BURC - Santa Croce - November 20th 2010 - High Tide
# Time Distance from Sidewalk (cm)
1 22:14 -35
2 22:18 -35.5
3 22:23 -35
4 22:27 -34.5
5 22:29 -34
6 22:31 -33.5
MAGA - Santa Croce - November 20th 2010 - High Tide
# Time Distance from Sidewalk (cm)
1 22:12 -57
2 22:17 -51
3 22:21 -51
4 22:25 -51
5 22:27 -49
6 22:30 -49
7 22:33 -47
8 22:36 -46
9 22:40 -51

205
APON2 - San Polo - November 20th 2010 - High Tide
# Time Distance from Sidewalk (cm)
1 22:10 3.5
2 22:15 3
3 22:20 3
4 22:24 3.5
5 22:25 3.7
6 22:26 4
7 22:28 4.2
8 22:30 4.4
9 22:32 4.5
10 22:34 5
11 22:37 5.2
12 22:39 5.5
13 22:42 5.2
14 22:43 5
FORN1 - Dorsoduro - November 21st 2010 - High Tide
# Time Distance from Sidewalk (cm)
1 9:10 -11
2 9:15 -7
3 9:20 -3
4 9:25 -1
5 9:27 0
6 9:30 2
7 9:33 0
8 9:35 -4
9 0:00 -5
VIO - Dorsoduro - November 21st 2010 - High Tide
# Time Distance from Sidewalk (cm)
1 9:08 -18
2 9:11 -17
3 9:14 -16
4 9:17 -15.5
5 9:20 -15
6 9:24 -14.5

206
7 9:27 -14.5
8 9:31 -15
9 9:34 -16
10 9:37 -17
11 9:40 -18
MUNE - Santa Croce - November 21st 2010 - High Tide
# Time Distance from Sidewalk (cm)
1 9:23 -46
2 9:27 -46
3 9:28 -47
4 9:30 -46
5 9:31 -45.5
6 9:33 -45.5
7 9:34 -45.5
8 9:35 -45.5
9 9:38 -45.7
10 9:40 -45.7
11 9:43 -46
12 9:47 -46
NOVO4- Santa Croce - November 21st 2010 - High Tide
# Time Distance from Sidewalk (cm)
1 9:26 -34.5
2 9:29 -34.5
3 9:30 -32
4 9:31 -31.5
5 9:32 -30
6 9:34 -28
7 9:36 -28
8 9:37 -28
9 9:40 -33
10 9:41 -32
11 9:45 -33.5
12 9:47 -34
MAGG – San Polo - November 21st 2010 - Low Tide

207
# Time Distance from Sidewalk (cm)
1 16:13 -105.5
2 16:15 -105.5
3 16:18 -106
4 16:20 -106
5 16:23 -106.5
6 16:25 -107
7 16:28 -107
8 16:30 -107.5
9 16:33 -108
10 16:35 -107
11 16:38 -106.5
POLO4 - San Polo - November 21st 2010 - Low Tide
# Time Distance from Sidewalk (cm)
1 16:12 -87
2 16:17 -89
3 16:22 -91
4 16:25 -91
5 16:27 -92
6 16:30 -94
7 16:34 -91
8 16:38 -91
TRTE - Cannaregio - November 21st 2010 -Low Tide
# Time Distance from Sidewalk (cm)
1 16:14 -103
2 16:15 -104
3 16:16 -103
4 16:17 -102
5 16:22 -104
6 16:25 -105
7 16:28 -104
8 16:35 -104
BATE1- Cannaregio - November 21st 2010 - Low Tide
# Time Distance from Sidewalk (cm)

208
1 16:17 -78
2 16:20 -78.5
3 16:22 -79
4 16:24 -82
5 16:26 -80
6 16:28 -80
7 16:30 -79
8 16:32 -79
9 16:35 -78
10 16:40 -78
FERA2 - San Marco - November 21st 2010 - High Tide
# Time Distance from Sidewalk (cm)
1 23:45 -19
2 23:49 -20
3 23:52 -20
4 23:55 -20
5 0:00 -22
6 0:03 -21
7 0:05 -21
8 0:08 -20
ORSE - San Marco - November 21st 2010 - High Tide
# Time Distance from Sidewalk (cm)
1 23:54 4
2 23:55 5
3 0:00 5
4 0:10 4.5
5 0:12 4
LORE - Castello - November 21st 2010 - High Tide
# Time Distance from Sidewalk (cm)
1 23:40 7
2 23:43 7.5
3 23:45 8
4 23:48 8
5 23:50 8.5
6 23:53 8.5

209
7 23:55 8
8 23:58 8.5
9 0:00 8.5
10 0:03 8.5
11 0:05 8.5
12 0:08 8.5
13 0:10 8.5
14 0:13 8.5
15 0:15 9
16 0:18 8.5
17 0:20 8
18 0:23 7.5
19 0:25 7
SEVE2- Castello - November 21st 2010 - High Tide
# Time Distance from Sidewalk (cm)
1 23:42 20.5
2 23:43 20.5
3 23:44 20.75
4 23:45 20.75
5 23:46 20.8
6 23:47 20.8
7 23:48 20.8
8 23:49 20.9
9 23:50 21
10 23:51 21.5
11 23:52 21.5
12 23:53 21.5
13 23:54 21.5
14 23:55 21.5
15 23:56 21.5
16 23:57 21.5
17 23:58 21.5
18 23:59 21.5
19 0:00 21.5
20 0:01 21.5
21 0:02 21.5
22 0:03 21.5
23 0:04 21.5

210
24 0:05 21.5
25 0:06 21.5
26 0:07 21.5
27 0:08 21.5
28 0:09 21.5
29 0:10 21.5
27 0:11 21.5
28 0:12 21.5
29 0:13 21.5
30 0:14 21.5
31 0:15 21.5
32 0:16 21.5
33 0:17 21.75
34 0:18 22
35 0:19 22
36 0:20 22
37 0:21 22
38 0:22 22
39 0:23 21.5
40 0:24 21.5
41 0:25 21.5
42 0:26 21.5
43 0:27 21
44 0:28 21
45 0:29 20.75
46 0:30 20.75
47 0:31 20.75
BRIA - Dorsoduro - November 22nd 2010 - High Tide
# Time Distance from Sidewalk (cm)
1 9:50 -17
2 9:55 -16.5
3 10:00 -15.5
4 10:05 -15
5 10:10 -15
6 10:15 -14
7 10:20 -15
8 10:25 -15.5

211
ZIRA2- Dorsoduro - November 22nd 2010 - High Tide
# Time Distance from Sidewalk (cm)
1 9:40 9.5
2 9:41 10
3 9:42 9.5
4 9:43 9.5
5 9:44 9
6 9:46 9
7 9:47 9
8 9:48 8.5
9 9:49 8.5
10 9:50 8.5
11 9:51 7.5
12 9:52 7.5
13 9:53 7.5
14 9:54 7.5
15 9:55 7.5
16 9:56 7.5
17 9:57 7
18 9:58 7
19 9:59 6.5
20 10:00 6.5
21 10:01 7
22 10:02 7
23 10:03 7
24 10:04 7
25 10:05 6.5
26 10:06 6.5
27 10:07 7
28 10:08 6.5
29 10:09 7
30 10:10 7
31 10:11 7
32 10:12 7.5
33 10:13 7
34 10:14 7
35 10:15 7.5
36 10:16 8
37 10:17 8.5
38 10:18 8.5

212
39 10:19 9
40 10:20 9
41 10:21 9
42 10:22 9
43 10:23 9
44 10:24 8.5
45 10:25 9
46 10:26 9
47 10:27 9
48 10:28 8.5
49 10:31 8.5
50 10:32 8
51 10:33 7.5
52 10:34 7
53 10:35 7
54 10:36 6.5
55 10:37 6
56 10:38 6
TOLE - Santa Croce - November 22nd 2010 - High Tide
# Time Distance from Sidewalk (cm)
1 9:40 4.5
2 9:42 5
3 9:44 3.5
4 9:47 2.8
5 9:50 2
6 10:07 2
7 10:16 4
8 10:25 4
9 10:30 2.5
FOSC2 - Cannaregio - November 22nd 2010 - Low Tide
# Time Distance from Sidewalk (cm)
1 16:45 -85
2 16:50 -86
3 16:53 -86
4 16:57 -88

213
5 17:00 -88
6 17:03 -88
7 17:05 -89
8 17:08 -87
9 17:11 -84
MARC1 -Cannaregio- November 22nd 2010 - Low Tide
# Time Distance from Sidewalk (cm)
1 16:45 -112
2 16:46 -112
3 16:47 -112
4 16:48 -111.5
5 16:49 -111.5
6 16:50 -112
7 16:51 -112
8 16:52 -112
9 16:53 -112
10 16:54 -112
11 16:55 -112.5
12 16:56 -112.5
13 16:57 -112.5
14 16:58 -112.5
15 16:59 -113
16 17:00 -114
17 17:01 -114
18 17:02 -114
19 17:03 -116
20 17:05 -116
21 17:06 -117
PEST1 - Castello - November 22nd 2010 - Low Tide
# Time Distance from Sidewalk (cm)
1 16:54 -94
2 16:55 -93.5
3 16:57 -94
4 17:00 -93.5
5 17:04 -92
6 17:05 -98.5

214
7 17:07 -96.5
8 17:09 -94
PROV2 - Castello - November 22nd 2010 - Low Tide
# Time Distance from Sidewalk (cm)
1 16:43 -115
2 16:45 -115
3 16:48 -115.5
4 16:50 -115.5
5 16:53 -115.5
6 16:55 -115.5
7 16:58 -116
8 17:00 -116
9 17:03 -116.5
10 17:05 -116
11 17:08 -115.5
12 17:10 -115.5
13 17:13 -115
CASS2 - San Polo - November 22nd 2010 - High Tide
# Time Distance from Sidewalk (cm)
1 23:34 5.5
2 23:35 6
3 23:36 6
4 23:37 6
5 23:38 6.1
6 23:39 6
7 23:40 6
8 23:41 6.5
9 23:42 6.5
10 23:43 6.5
11 23:44 6.5
12 23:45 6
13 23:46 5.7
14 23:47 5.7
15 23:48 5.5
16 23:49 5.5
17 23:50 5.2

215
18 23:51 5
19 23:52 4.8
20 23:53 5.5
21 23:54 5
CATE3 - Cannaregio - November 22nd 2010 - High Tide
# Time Distance from Sidewalk (cm)
1 23:30 1
2 23:35 3
3 23:40 4
4 23:43 4
5 23:45 5
6 23:47 4
7 23:50 4
8 23:53 3
MIRA - Canneregio - November 22st 2010 - High Tide
# Time Distance from Sidewalk (cm)
1 23:30 -31
2 23:33 -30
3 23:35 -29.5
4 23:38 -30
5 23:40 -30
6 23:43 -30.5
7 23:45 -30.5
8 23:48 -31
8 23:48 -31
MADA2- Cannaregio - December 4th 2010 - High Tide
# Time Distance from Sidewalk (cm)
1 8:30 -2.5
2 8:31 -2
3 8:32 -2
4 8:33 -2
5 8:34 -3
6 8:35 -3
7 8:36 -3

216
8 8:37 -2.5
9 8:38 -2.5
10 8:39 -2.5
11 8:40 -2.5
12 8:41 -3
13 8:42 -3.5
14 8:43 -3
15 8:44 -3
16 8:45 -3
17 8:46 -3
18 8:47 -2.5
19 8:48 -2.5
20 8:49 -2
21 8:50 -2.5
22 8:51 -2
23 8:52 -2
24 8:53 -2
25 8:54 -2
26 8:55 -2
27 8:56 -2
28 8:57 -2
29 8:58 -2
30 8:59 -2
31 9:00 -2
32 9:01 -2
33 9:02 -2
34 9:03 -1.5
45 9:04 -1.5
36 9:05 -1.5
37 9:06 -2
38 9:07 -2
39 9:08 -2.5
40 9:09 -3
MISE - Cannaregio - December 4th 2010 - High Tide
# Time Distance from Sidewalk (cm)
1 8:25 24
2 8:30 26
3 8:35 26

217
4 8:40 26
5 8:45 26
6 8:50 27
7 8:53 27.5
8 8:55 28
9 8:58 27
10 9:02 27
11 9:05 26
MELO - San Polo - December 4th 2010 - High Tide
# Time Distance from Sidewalk (cm)
1 8:30 10.5
2 8:35 11
3 8:40 11
4 8:45 11.5
5 8:50 11.5
6 8:55 12
7 9:00 12.5
8 9:05 12
9 9:10 11
CASS1 - San Polo -December 4th 2010 - High Tide
# Time Distance from Sidewalk (cm)
1 8:30 12
2 8:33 12
3 8:35 12
4 8:40 12
5 8:45 11.8
6 8:46 12.3
7 8:49 12.5
8 8:51 12.7
9 8:53 13
10 8:55 13.2
11 8:58 13.5
12 9:00 13.3
13 9:05 13.3
14 9:07 13
15 9:10 12.5

218
16 9:15 12
MAUR- San Marco - December 4th 2010 - Low Tide
# Time Distance from Sidewalk (cm)
1 15:33 -114
2 15:34 -114
3 15:35 -114
4 15:36 -114
5 15:37 -114.5
6 15:38 -114.5
7 15:39 -115
8 15:40 -115
9 15:41 -115
10 15:42 -115.5
11 15:43 -115.5
12 15:44 -115.5
13 15:45 -115.5
14 15:46 -116
15 15:47 -116
16 15:48 -116
17 15:49 -116
18 15:50 -117
19 15:51 -118
20 15:52 -118
21 15:53 -118
22 15:54 -119
23 15:55 -119
24 15:56 -120
25 15:57 -120
26 15:58 -120
27 15:59 -120
28 16:00 -119.5
29 16:01 -119.5
30 16:02 -119.5
31 16:03 -119.5
32 16:04 -119.5
33 16:05 -119.5
34 16:06 -119.5

219
45 16:07 -119.5
36 16:08 -119.5
37 16:09 -119.5
38 16:10 -119.5
39 16:11 -119.5
40 16:12 -119
41 16:13 -119
DUCA - San Marco - December 4th 2010 - Low Tide
# Time Distance from Sidewalk (cm)
1 15:30 -161
2 15:35 -161
3 15:40 -163
4 15:45 -163
5 15:50 -164
6 15:53 -164.5
7 15:55 -165
8 16:00 -164
9 16:05 -163.5
LATE1 - Castello - December 4th 2010 - Low Tide
# Time Distance from Sidewalk (cm)
1 15:34 -101.5
2 15:38 -101.5
3 15:40 -101.5
4 15:42 -102
5 15:44 -102.5
6 15:46 -103
7 15:48 -103
8 15:50 -104
9 15:52 -104.5
10 15:54 -105
11 15:56 -105
12 15:58 -105.5
13 16:00 -106
14 16:02 -106
15 16:04 -106

220
16 16:06 -106
17 16:08 -106.5
18 16:10 -107
19 16:12 -108
20 16:14 -107
21 16:16 -106.5
22 16:18 -106
TETT2 - Castello - December 4th 2010 - Low Tide
# Time Distance from Sidewalk (cm)
1 15:46 -153.9
2 15:48 -153.7
3 15:51 -154.3
4 15:52 -152.9
5 15:54 -152.9
6 15:55 -152.4
7 15:59 -153.1
8 16:06 -150.9
9 16:08 -150.4
10 16:10 -149.9
11 16:16 -148.4
12 16:19 148.9
13 16:25 -148.9
14 16:27 -146.9
ZANE - Castello - December 4th 2010 - High Tide
# Time Distance from Sidewalk (cm)
1 22:15 -51
2 22:20 -51
3 22:25 -51
4 22:30 -50
5 22:33 -50
6 22:35 -49
7 22:38 -48
8 22:40 -49
9 22:45 -50

221
MOND2- Castello- December 4th 2010 - High Tide
# Time Distance from Sidewalk (cm)
1 22:20 -53
2 22:21 -53
3 22:22 -53
4 22:23 -53
5 22:24 -53
6 22:25 -53
7 22:26 -51
8 22:27 -51
9 22:28 -51
10 22:29 -49
11 22:30 -49
12 22:31 -43
13 22:32 -43
14 22:33 -43
15 22:34 -42.5
16 22:35 -42
17 22:36 -42
18 22:37 -42.5
19 22:38 -42
20 22:39 -42
21 22:40 -42
22 22:41 -42
23 22:42 -42
24 22:43 -43
25 22:44 -43
26 22:45 -43
ZUAN - Santa Croce - December 4th 2010 - High Tide
# Time Distance from Sidewalk (cm)
1 22:20 -70
2 22:22 -70
3 22:24 -69
4 22:26 -69
5 22:28 -69

222
6 22:30 -69
7 22:32 -69
8 22:34 -68.5
9 22:36 -69
10 22:38 -69
11 22:40 -69.5
12 22:42 -69.5
MARN - Santa Croce - December 4th 2010 - High Tide
# Time Distance from Sidewalk (cm)
1 22:22 -45
2 22:24 -44.5
3 22:25 -44.5
4 22:29 -42.5
5 22:30 -42.5
6 22:32 -43.5
7 22:35 -43.8
8 22:36 -43.5
9 22:40 -44
10 22:42 -42
11 22:43 -42.5
12 22:44 -41
13 22:46 -41.5
14 22:50 -42
15 22:51 -43
16 22:52 -44
BARN2 - Dorsoduro - December 5th 2010 - High Tide
# Time Distance from Sidewalk (cm)
1 9:10 -7
2 9:15 -6
3 9:20 -5
4 9:25 -4
5 9:28 -4
6 9:30 -3
7 9:35 -4
8 9:40 -5

223
BARN1- Dorsoduro- December 5th 2010 - High Tide
# Time Distance from Sidewalk (cm)
1 9:18 8
2 9:19 7.5
3 9:20 7
4 9:21 7
5 9:22 6.5
6 9:23 7
7 9:24 7
8 9:25 7.5
9 9:26 8
10 9:27 8.5
11 9:28 7.5
12 9:29 7.5
13 9:30 7
14 9:31 7
15 9:32 7
16 9:33 7.5
17 9:34 7
18 9:35 6.5
19 9:36 6
20 9:37 6
22 9:38 5.5
23 9:39 5.5
24 9:40 5.5
GAFF - Santa Croce - December 5th 2010 - High Tide
# Time Distance from Sidewalk (cm)
1 9:16 -10
2 9:18 -9.5
3 9:20 -9
4 9:22 -8
5 9:24 -7
6 9:26 -8
7 9:28 -8.25
8 9:30 -8

224
9 9:32 -9
10 9:34 -9
11 9:36 -9.5
TREP3 - Santa Croce -December 5th 2010 - High Tide
# Time Distance from Sidewalk (cm)
1 9:21 -45
2 9:23 -44
3 9:25 -43
4 9:29 -44.5
5 9:30 -45
6 9:32 -45.6
7 9:35 -45
8 9:40 -46
MELO - San Polo - December 5th 2010 - Low Tide
# Time Distance from Sidewalk (cm)
1 16:15 -115
2 16:20 -117
3 16:25 -118
4 16:28 -118
5 16:30 -119
6 16:34 -117
7 16:38 -117
8 16:40 -116
ERBE- San Polo- December 5th 2010 - Low Tide
# Time Distance from Sidewalk (cm)
1 16:20 -124
2 16:21 -124
3 16:22 -124
4 16:23 -124
5 16:24 -124
6 16:25 -124
7 16:26 -124

225
8 16:27 -125
9 16:28 -125
10 16:29 -125
11 16:30 -125
12 16:31 -125
13 16:32 -125
14 16:33 -125.5
15 16:34 -125.5
16 16:35 -125.5
17 16:36 -125.5
18 16:37 -125
19 16:38 -125
20 16:39 -125
21 16:40 -124
FELI2 - Cannaregio - December 5th 2010 - Low Tide
# Time Distance from Sidewalk (cm)
1 16:10 -93
2 16:15 -93
3 16:20 -93.5
4 16:22 -93.5
5 16:24 -93.5
6 16:26 -94
7 16:28 -94
8 16:30 -94
9 16:32 -94.5
10 16:34 -94
11 16:36 -94
12 16:38 -93.5
13 16:40 -93.5
TRAP - Cannaregio - December 5th 2010 - Low Tide
# Time Distance from Sidewalk (cm)
1 16:20 -148
2 16:22 -148
3 16:24 -149
4 16:25 -150

226
5 16:26 -150
6 16:28 -150
7 16:29 -149.5
8 16:30 -149
9 16:31 -151
10 16:32 -150
11 16:33 -149
12 16:35 -149.5
13 16:36 -150
14 16:38 -151
15 16:40 -152
16 16:41 -151.5
17 16:44 -151
18 16:45 -151
19 16:49 -150
20 16:55 -149
GARZ - San Marco - December 5th 2010 - High Tide
# Time Distance from Sidewalk (cm)
1 23:00 -35.5
2 23:02 -35.5
3 23:04 -34.5
4 23:06 -34
5 23:08 -33.5
6 23:10 -33.5
7 23:12 -33
8 23:14 -33
9 23:16 -32.5
10 23:18 -32
11 23:20 -32.5
12 23:22 -32.5
13 23:24 -32
14 23:26 -31.5
15 23:28 -32
16 23:30 -31
17 23:32 -31.5
18 23:34 -30
19 23:36 -30.5

227
20 23:38 -31
21 23:40 -31.5
CORN - San Marco - December 5th 2010 - High Tide
# Time Distance from Sidewalk (cm)
1 22:06 -34
2 22:08 -32
3 22:10 -32
4 22:12 -32
5 22:14 -33.5
6 22:16 -34
7 22:20 -31.5
8 22:22 -33
9 22:24 -33
10 22:26 -32
11 22:30 -31
12 22:32 -32.5
13 22:38 30
14 22:40 29
ZULI - San Marco - December 6th 2010 - High Tide
# Time Distance from Sidewalk (cm)
1 9:50 -1
2 9:55 0
3 10:00 1
4 10:05 2
5 10:07 1
6 10:10 1
7 10:15 -1
CANO- San Marco- December 6th 2010 - High Tide
# Time Distance from Sidewalk (cm)
1 9:54 2
2 9:55 2
3 9:56 2

228
4 9:57 2.5
5 9:58 2.5
6 9:59 3
7 10:00 3
8 10:01 3.5
9 10:02 3.5
10 10:03 4
11 10:04 4
12 10:05 4
13 10:06 3.5
14 10:07 3.5
15 10:08 3
VIGN - Castello - December 6th 2010 - High Tide
# Time Distance from Sidewalk (cm)
1 9:52 -35.5
2 9:54 -35.5
3 9:56 -35
4 9:58 -35
5 10:00 -35
6 10:02 -35
7 10:04 -34.5
8 10:05 -34.5
9 10:06 -34
10 10:08 -34.5
11 10:10 -35
12 10:12 -35
SALU1 - Dorsoduro -December 6th 2010 - Low Tide
# Time Distance from Sidewalk (cm)
1 16:57 -122.1
2 17:00 -121
3 17:04 -121
4 17:05 -120.6
5 17:07 -120.8
6 17:10 -122
7 17:12 -122.5

229
TORE- Dorsoduro- December 6th 2010 - Low Tide
# Time Distance from Sidewalk (cm)
1 16:55 -110
2 16:56 -11
3 16:57 -112
4 16:58 -112.5
5 16:59 -112.5
6 17:00 -113
7 17:01 -113
8 17:02 -113.5
9 17:03 -113.5
10 17:04 -113
11 17:05 -113
12 17:06 -113
13 17:07 -113.5
14 17:08 -113.5
15 17:09 -113.5
16 17:10 -113.5
18 17:11 -113.5
19 17:12 -114
20 17:13 -114
21 17:14 -114.5
22 17:15 -115
APOS3 - Cannaregio - December 6th 2010 - High Tide
# Time Distance from Sidewalk (cm)
1 23:41 -16
2 23:45 -14
3 23:50 -13
4 23:53 -13
5 23:55 -12
6 23:59 -12
7 0:04 -10
8 0:10 -12
9 0:13 -13

230
APOS4 - Cannaregio - December 6th 2010 - High Tide
# Time Distance from Sidewalk (cm)
1 23:43 13.5
2 23:45 14
3 23:47 14
4 23:49 14.5
5 23:51 15
6 23:53 14.5
7 23:55 14.5
8 23:57 14.5
9 23:58 15
10 23:59 14.5
11 0:00 15
12 0:01 15
13 0:02 15
14 0:03 15
15 0:04 15
16 0:05 15
17 0:06 15
18 0:07 14.5
19 0:08 14.5
20 0:09 14.5
21 0:10 14
22 0:11 14
23 0:12 13

231
APPENDIX K – TIDE DELAY TABLE OF RESULTS

232
Segment Date Tide Type
Actual Time at Salute/Misericordia
Actual Time Recorded at Segment
Delay?
GOZZ 20/11/10 High 9:20 9:30 10
ORIO 20/11/10 High 9:20 9:30 10
BARE1 20/11/10 Low 16:25 16:04 -11
SALVE 20/11/10 Low 16:25 16:00 -25
FORM 20/11/10 Low 16:25 16:17 -8
VIN 20/11/10 Low 16:25 15:36 -49
BURC 20/11/10 High 23:15 22:18 3
MAGA 20/11/10 High 23:15 22:36 -39
APON2 20/11/10 High 23:15 22:39 -36
FORN1 21/11/10 High 9:50 9:30 -20
VIO 21/11/10 High 9:50 9:24 -26
MUNE 21/11/10 High 9:50 9:34 -16
NOVO4 21/11/10 High 9:50 9:37 -13
MAGG 21/11/10 Low 16:45 16:33 -12
POLO4 21/11/10 Low 16:45 16:30 -15
TRTE 21/11/10 Low 16:45 16:25 -20
BATE1 21/11/10 Low 16:45 16:24 -21
FERA2 21/11/10 High 0:05 0:00 -5
ORSE 21/11/10 High 0:05 0:00 -5
LORE 21/11/10 High 0:05 0:15 10
SEVE2 21/11/10 High 0:05 0:22 17
BRIA 22/11/10 High 10:15 10:15 0
ZIRA2 22/11/10 High 10:15 10:27 12
TOLE 22/11/10 High 10:15 9:42 -33
FOSC2 22/11/10 Low 16:40 17:05 25
MARC 22/11/10 Low 16:40 16:49 9
PEST1 22/11/10 Low 16:40 17:05 25
PROV2 22/11/10 Low 16:40 17:03 23
CASS2 22/11/10 High 23:35 23:43 8
CATE3 22/11/10 High 23:35 23:45 10
MIRA 22/11/10 High 23:35 23:35 0
MADA2 4/12/2010 High 8:55 9:05 10
MISE 4/12/2010 High 8:55 8:55 0
MELO 4/12/2010 High 8:55 9:00 5
CASS1 4/12/2010 High 8:55 8:58 3
MAUR 4/12/2010 Low 16:45 16:11 -34
DUCA 4/12/2010 Low 16:45 15:55 -50
LATE1 4/12/2010 Low 16:45 16:12 -33
TETT2 4/12/2010 Low 16:45 15:51 -54
ZANE 4/12/2010 High 23:55 22:38 -77

233
MOND2 4/12/2010 High 23:55 22:42 -73
ZUAN 4/12/2010 High 23:55 22:34 -81
MARN 4/12/2010 High 23:55 22:44 -71
BARN2 5/12/2010 High 9:15 9:30 15
BARN1 5/12/2010 High 9:15 9:27 12
GAFF 5/12/2010 High 9:15 9:24 9
TREP3 5/12/2010 High 9:15 9:25 10
MELO 5/12/2010 Low 17:00 16:30 -30
ERBE 5/12/2010 Low 17:00 16:36 -24
FELI2 5/12/2010 Low 17:00 16:32 -28
TRAP 5/12/2010 Low 17:00 16:40 -20
GARZ 5/12/2010 High 0:15 23:34 -41
CORN 5/12/2010 High 0:15 22:30 -105
ZULI 6/12/2010 High 10:30 10:05 -25
CANO 6/12/2010 High 10:30 10:05 -25
VIGN 6/12/2010 High 10:30 10:06 -24
SALU1 6/12/2010 Low 17:20 17:05 -15
TORE 6/12/2010 Low 17:20 17:05 -15
APOS3 6/12/2010 High 0:00 0:04 4
APOS4 6/12/2010 High 0:00 0:06 6

234
APPENDIX L – DELIEVERABLES: OTHER MAPS

235
Sedimentation Related Maps

236
Sedimentation Volumes in Canal Segments
From Quantifying Sediment in the Venetian Canals – WPI IQP – E’99
http://maps.google.com/maps/ms?ie=UTF8&hl=en&msa=0&msid=110440766011273321622.00049460b340bf0
02b07d&ll=45.438454,12.355757&spn=0.022645,0.060854&z=14

237
Boat Traffic Related Maps

238
Rules and Regulations of the Inner Canals of Venice
From UNESCO Report – The Evolution of Venetian Boat Traffic – 2000
http://maps.google.com/maps/ms?ie=UTF8&hl=en&msa=0&msid=110440766011273321622.000493fb7eea632
1cc4b7&ll=45.438032,12.337904&spn=0.022645,0.093555&z=14
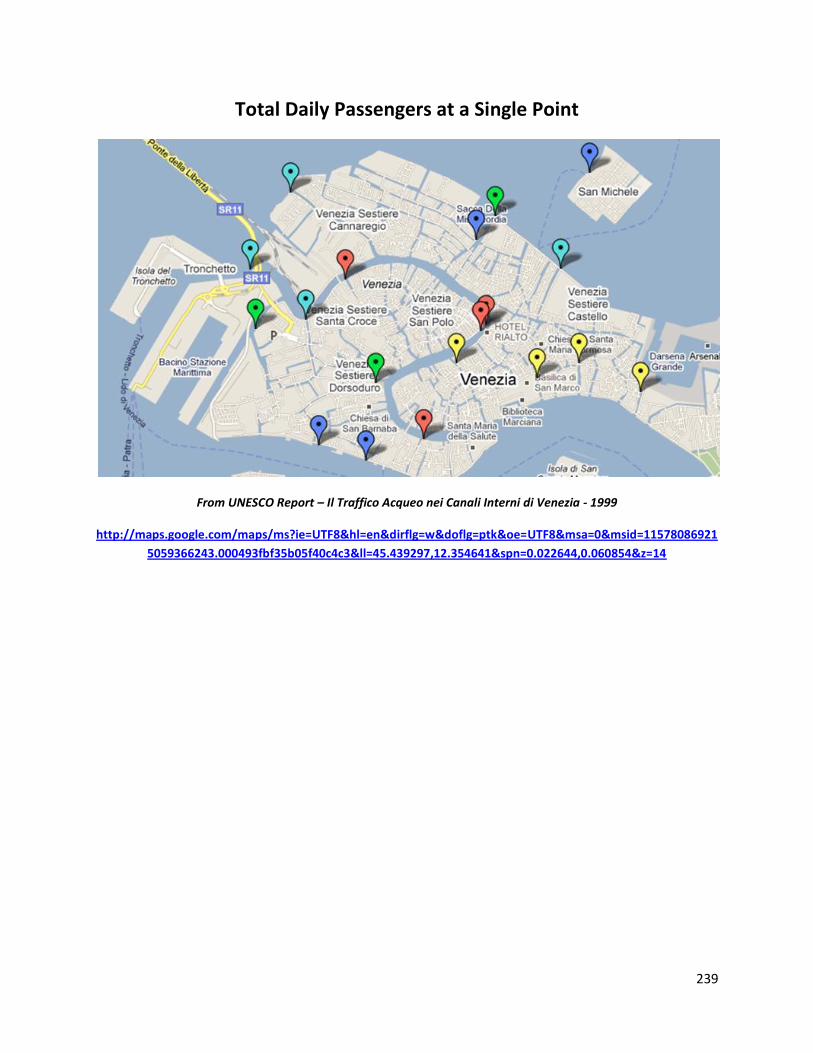
239
Total Daily Passengers at a Single Point
From UNESCO Report – Il Traffico Acqueo nei Canali Interni di Venezia - 1999
http://maps.google.com/maps/ms?ie=UTF8&hl=en&dirflg=w&doflg=ptk&oe=UTF8&msa=0&msid=11578086921
5059366243.000493fbf35b05f40c4c3&ll=45.439297,12.354641&spn=0.022644,0.060854&z=14

240
Total Daily Boats at Selected Intersection
From UNESCO Report – Il Traffico Acqueo nei Canali Interni di Venezia - 1999
http://maps.google.com/maps/ms?ie=UTF8&hl=en&dirflg=w&doflg=ptk&oe=UTF8&msa=0&msid=11578086921
5059366243.000493fa654fbdce43d55&ll=45.438393,12.340136&spn=0.022645,0.093555&z=14

241
Most Frequent ‘Links’ From Lagoon to Central Venice
From UNESCO Report – The Evolution of Venetian Boat Traffic – 2000
http://maps.google.com/maps/ms?ie=UTF8&hl=en&msa=0&msid=110440766011273321622.000493fa654e0c17
6a531&ll=45.437972,12.343826&spn=0.04529,0.187111&z=13

242
Distribution of Private Crafts in the Canals of Venice
From UNESCO Report – Il Traffico Acqueo nei Canali Interni di Venezia - 1999
http://maps.google.com/maps/ms?ie=UTF8&hl=en&oe=UTF8&msa=0&msid=103140249760910180705.000493f
a6ca0132c5c24f&ll=45.438514,12.352839&spn=0.022645,0.060854&z=14

243
Total Daily Passengers at Select Canal Segments
From UNESCO Report – Il Traffico Acqueo nei Canali Interni di Venezia - 1999
http://maps.google.com/maps/ms?ie=UTF8&hl=en&oe=UTF8&msa=0&msid=101570310457053562333.000493f
a660d9614d57d8&ll=45.437129,12.337818&spn=0.022645,0.093555&z=14

244
APPENDIX M – CALENDAR

245
Write Background Sections and Methodology
Start Individual
Background
Research
Combine Background Sections & Methodology
PQP – Discuss
Focus
PQP – Discuss
Background
PQP – Discuss Intro again
PQP – Discuss
Introduction
Edit Background
and
Methodology
PQP – And so it
begins
Group Meeting
1PM – Edit Intro
Group Meeting
1PM
Group Meeting 1PM – Wrote Introduction
Group Meeting 1PM – Discuss Background and Meth Progress
Group Meeting
1PM – Present
Initial Research
Group Meeting 1PM – Go Over Background and Meth Edits
Group Meeting
1PM – Edit Intro
Research
Research Research Research Research
Research Research
Start Individual Background Write Up & Methodology
Write Background Sections and Methodology
Write Background Sections and Methodology
Group Meeting
1PM – Split up
Background
Edit Background
and
Methodology
Individual Work on Lit Reviews and Graphics
Edit Background Sections Individually & Lit Reviews

246
Sort through UNESCO boat reports
Sort through UNESCO boat reports
Sort through UNESCO boat reports
IQP Meeting - Built Hydro Device and tested it
Observed/document canals that will be tested on new moon
First IQP Meeting Discussed first “plan of attack”
Orientation Get de-jetlagged Arrive in
Venice
Depart for Venice
Fall Break
Fall Break Fall Break Fall Break Fall Break Fall Break Fall Break
Fall Break
FINALIZED PROPOSAL POWER POINT
Create Appendix Edit Proposal POWER POINT
Create Appendix Edit Proposal POWER POINT
PQP – Discuss Deliverable POWERPOINT
PQP DELIVERABLE POWERPOINT
Final Presentation Proposal Due
Group Meeting 1PM – Edit Methodology
Group Meeting
1PM - Proposal
Group Meeting 1PM – Review Background POWER POINT
Group Meeting
1PM Group Meeting 1PM – Update Proposal POWERPOINT
Edit Background Sections & Lit Reviews POWERPOINT
Edit Background Sections & Lit Reviews POWERPOINT
Combine Intro, Background, Meth and Lit Reviews
Create Appendix Edit Refworks POWERPOINT

247
Map data from UNESCO boat reports
IQP Meeting – Discuss data and where to analyze
Scheduled Hydro testing and worked on presentation
Thanksgiving Break – Work on report/website
Meeting with Jim regarding writing. Work on report. Work on website.
3rd Presentation Work on report/website
Fix report – Remove sed. and damage and add tide delay
IQP Meeting to discuss data and scope of project. Fix Report.
Observed Canals Worked on Report/ Worked on Website
Visit Tide Center Demo for Ships Worked on website
Create canal wiki template for future IQPs - Build Sed. device
Write Report and Observing Canals and WIKI meetings
Analyze UNESCO sedimentation reports – Make Map of Data
Full Moon – Hydro and tide delay testing
New Moon – Hydrodynamics Testing/Observing
New Moon – Hydrodynamics Testing
1st Presentation New Moon – Hydro Testing and
Worked on Website/Worked on Report
2nd Presentation Observed Canals
Worked on Website/Worked on Report
Thanksgiving Break – Work on report/website
Thanksgiving Break – Work on report/website
Thanksgiving Break – Work on report/website
Fix report – Remove sed. and damage and add tide delay
Fix report – Remove sed. and damage and add tide delay
Full Moon – Hydro and tide delay testing
Full Moon – Hydro and tide delay testing
Work on report. Work on website.
Work on report. Work on website.
Observe canals for hydro testing Work on report and website

248
Observe canals for hydro testing Work on report and website
Arrive in US. Final Report and website due!
Depart for US. Final report and website done!
Work on report, website, and presentation
4th Presentation Work on report and website. Prep for testing and build devices
New Moon – Hydro and tide delay testing
New Moon – Hydro and tide delay testing
Work on report – Results, analysis, exec. summary, appendix
Discuss results with advisors - Work on report and presentation
Final Presentation at UNESCO
Finish report and website! Dress Rehearsal
Finish report and website!
Finish report and website!
Finish report and website!
Final touches on report and website!
Observe canals for hydro testing Work on report and website
5th Presentation Work on report and website
Work on report, website, and presentation
6th
Presentation Finish report and website!

249
APPENDIX N - BUDGET
Hydrodynamics Device:
- Fishing Line $2.00
- Soda Cans for Metal $4.00
- Plastic Bottle for Buoyancy $1.50
- 30g Fishing Weight $2.00
- Tape Measure $8.00
Tide Delay Devices:
- Rope $5
- Weights $10
$45 was also spent on the sedimentation device - This topic was
dropped from our project in the 4th week in Venice