documents.worldbank.orgdocuments.worldbank.org/.../pdf/multi0page.pdfreturn to i restricted reports...
TRANSCRIPT
RETURN TO I RESTRICTED
REPORTS DESKj Report No. EA- 160b
WITHINONE WEEKiK
They do not accept responsibility for its accuracy or completeness. The report maynot be published nor may it be quoted as representing their views.
INTERNATIONAL BANK FOR RECONSTRUCTION AND DEVELOPMENT
INTERNATIONAL DEVELOPMENT ASSOCIATION
THE ECONOMY
OF
IRELAND
October 5, 1966
Europe and Middle East Department
Pub
lic D
iscl
osur
e A
utho
rized
Pub
lic D
iscl
osur
e A
utho
rized
Pub
lic D
iscl
osur
e A
utho
rized
Pub
lic D
iscl
osur
e A
utho
rized
CURRENCY EQUIVALENTS
Irish E 100 = U. S. $280TT- $q100 = Trish oi . 1 4/3A'
Irish L 1 = Sterling P 1
This report is based on the findings of
an economic mission to Ireland in April,
1966. The mission members were Messrs.
J. Faaland (Consultant to the Bank),
Chief of Mission, J. R. Parkinson (Con-
sultant to the Bank), Loreto M. Dominguez
(Bank), and Risto Harma (Bank).
MTTT.' 7XAT % f NT 'r~ TI T A 7ITM
Irl zuvivurllu r -ri.ELP'UM
Table of Contents
Page
BASIC DATA.................................................
SUMMARY AND CONCLUSIONS..... ......................... ito iv
Structure of Government....................... iThe Developing Structure of the Economy....... i-11The Current Situation......................... iii-iv
THE ECONOMY OF IREIAND........................
I. The Setting............................... 1
II. The Developing Structure of the Economy... 3
A. Economic Growth....................... 3
B. Industry............................
C. Agriculture........................... 8
D. Tourism............................... 10
III. Trade, Money and Public Finance........... 11
A. Balance of Trade and Payments......... 11
B. Money and Banking........... .... 1[
C. Public Finance and Public Bodies...... 16
TV. Assessment of the Current Situntion...... 2
V. The Evolution of the Eonomy until 1970... 27
SqTATITICAL1j APPE1\MIY: T.ist- of tablen given aft.0r ma-in Rport.
T--o--nI* BASTC DATA!
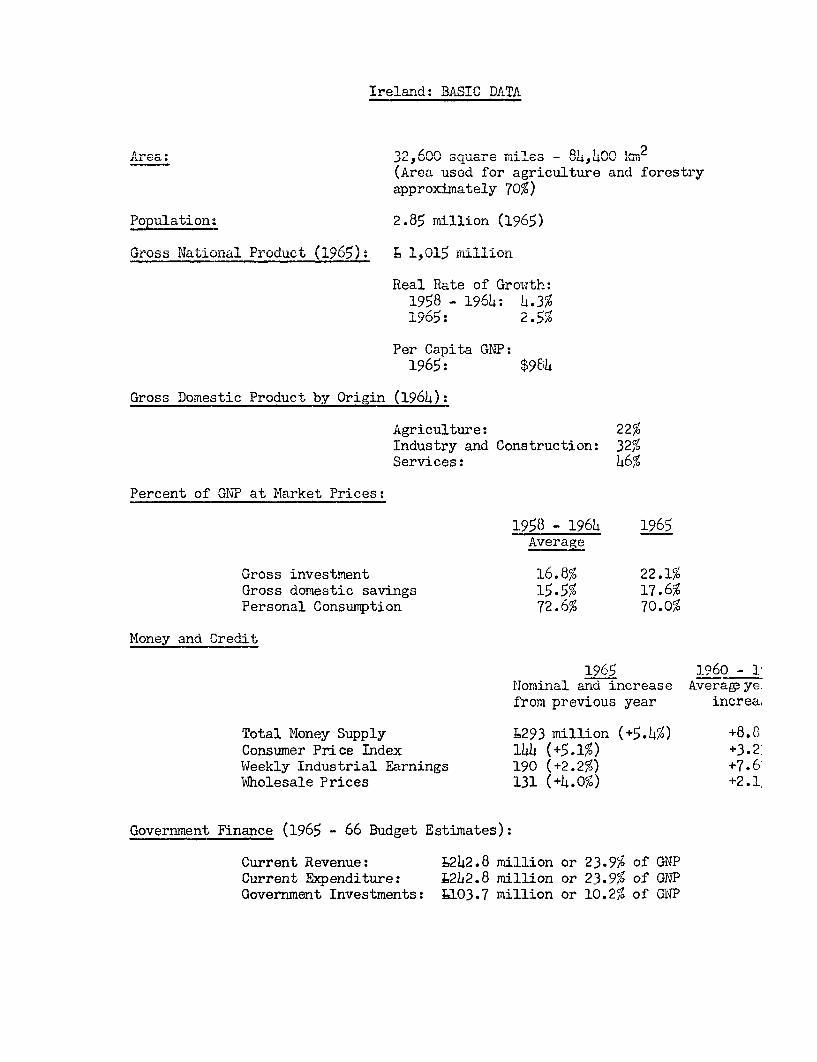
Area:iC~C Ai .n -2A
(Area used for agriculture and forestryaproxiM.li ae-ly I V/OJ
fl...n Oe.t ---nn f n nz r 1 Vl%Poul ~i±xa ruc~~L j r- ±U 11LL.LL.u
neaLi nao 0 urown:1958 - 1964: 4.3%1965: 25
Per Capita GvP:1965: $984
Gross Domestic Product by Origin (1964):
Agriculture: 22%Industry and Construction: 32%Services: 46%
Percent of GNP at Market Prices:
1958 - 1964 1965Average
Gross investment 16.8% 22.1%Gross domestic savings 15.5% 17.6%Personal Consumption 72.6% 70.0%
Money and Credit
1965 1960 - 1Nominal and increase Averagpyefrom previous year increa
Total Money Supply L293 million (+5.4%) +8.8Consumer Price Index 14h (+5.1%) +3.2Weekly Industrial Earnings 190 (+2.2%) +7.6Wholesale Prices 131 (+4.0%) +2.1,
Government Finance (1965 - 66 Budget Estimates):
Current Revenue: L242.8 million or 23.9% of GNPCurrent Exoenditure: :&2L2.8 million or 23.9% of GNPGovernment Investments: L103.7 million or 10.2% of GNP

Balance of Payments (L million):
1965 1960 - 1964Nominal and increase Average yearlyfrom previous year increase
Commodity exports (f.o.b.) 214 (+0.5%) +12.1%Commodity imports (c.i.f.) 361 (+6.8%) +10.6%Net invisibles +103 (+8.4%) + 5.6%Balance of Current Payments - h4 -22.0
(absolute aver:
Forein ExchanLe ReservesEnd year 224 (-7.4%) + 3.7%
(1961 - 196
Extprnail Publi n Dnht*
Tntanl deht at March 'Al 190"* L(-1 - m Til IinAnnual debt interest payments: T 2.2 millionDtha if.regnq ecenernings:0 oftotal foreign exchange earnings: 0.6%
Structure of Government
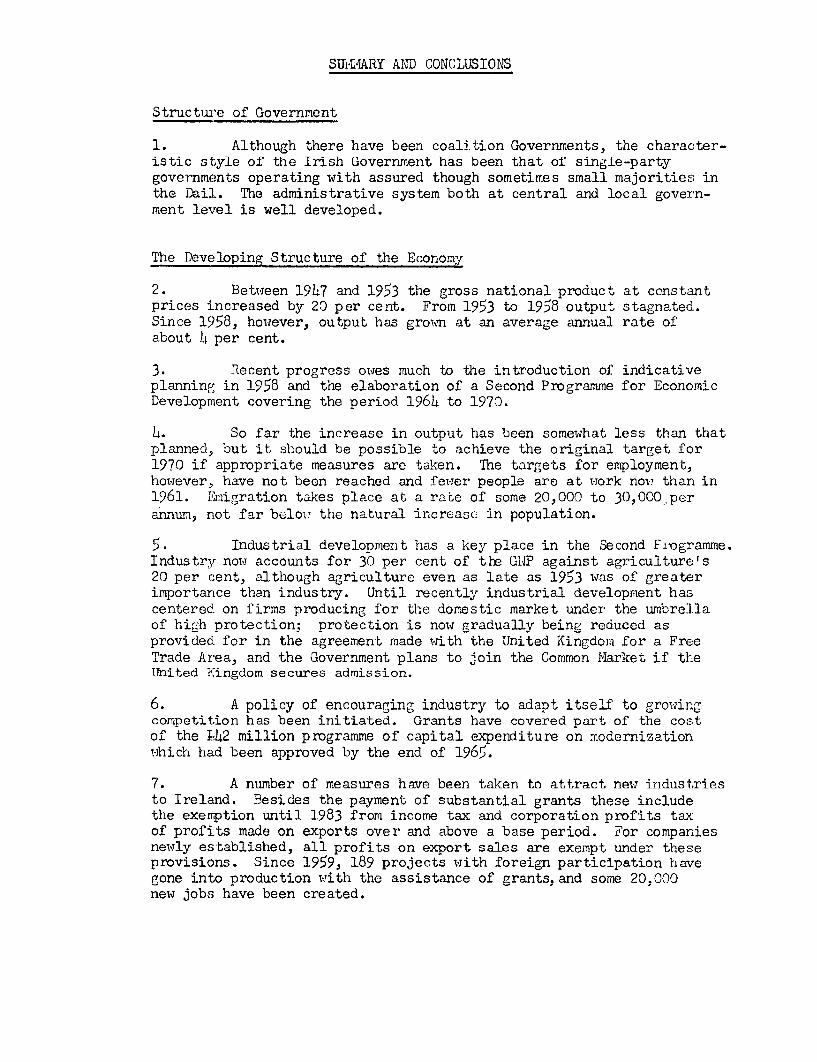
1. Although there have been coalition Governments, the character-istic style of the Irish Government has been that of single-partygovernments operating with assured though sometimes small majorities inthe Dail. The administrative system both at central and local govern-ment level is well developed.
The Developing Structure of the Economy
2. Between 1947 and 1953 the gross national product at constantprices increased by 20 per cent. From 1953 to 1958 output stagnated.Since 1958, however, output has grown at an average annual rate ofabout I per cent.
3. Recent progress owes much to the introduction of indicativeplanning in 1958 and the elaboration of a Second Programme for EconomicDevelopment covering the period 1964 to 1970.
4. So far the increase in output has been somewhat less than thatplanned, but it should be possible to achieve the original target for1970 if appropriate measures are taken. The targets for employment,however, have not been reached and fewer people are at work now than in1961. Emigration takes place at a rate of some 20,000 to 30,OCO.perannum, not far below the natural increase in population.
5. Industrial development has a key place in the Second Fiogramme.Industry now accounts for 30 per cent of the GNP against agriculture's20 per cent, although agriculture even as late as 1953 was of greaterimportance than industry. Until recently industrial development hascentered on firms producing for the domestic market under the umbrellaof hi,,'h protection, protection is now gradually being reduced asprovided for in the agreement made with the United Kingdoia for a FreeTrade Area, and the Government plans to join the Common Market if theUnited Kingdom secures admission.
6. A policy of encouraging industry to adapt itself to growingcometition has been initiated. Grants have covered part of the costof the L2 million programme of capital expenditure on modernizationihich had been approved by the end of 1965.
7. A number of measures have been taken to attract new industriesto Ireland. Besides the payment of substantial grants these includethe exemption until 1983 from income tax and cornoration nrofits taxof profits made on exports over and above a base period. For companiesnewly established, all lrofits on exoort sales are exemnt under theseprovisions. Since 1959, 189 projects with foreign participation havegone into production with the assistance of grants.and some 20,000new jobs have been created.

8. The growth of agricultural output has been slow. However,
productivity consequently has improved considerably. The Second11 ;aWW _.UL1MJi1 i.IL'. JJ.U V.LU -O -U. -Ul 11 L ICLOJ. t L11u c
agricultural output in terms of 1960 prices from L207 million in 1963UO) Mc I ki Mi-LL.LonJI . -L7 I '. OU LCL.L Llai0 [ L~.L..L(J_11 jL1(V1-U 01. UfaU
envisaged. In order to make up for this shortfall, a major jump in4.n- _Pu U- gYwo wo2 v- !euvu Xo iouot 1- -nt can ueUiit- ICLZ ±d U l r,. .L UV ULI IJUU.LU Ut; I L_ LLtU. JLU .Lj tAU UU .L Ll. UfLIZi U&II UU~
achieved. The Free Trade Agreement makes special concessions foragricultural t.uO, UUU J1 Wte uuIpuU tUrgeu canno UU u.ULLyachieved, then the shortfall will be directly reflected in exports.
9. Tourism is a dynamic sector of the economy which is beingpromoted by the Touri1t Board witn imagination, sophistication andbusiness acumen. A good deal of Government assistance is given tothe industry. It is estimated that expendiure by tourists visitingIreland amounted to L78 million in 1965, and it is reasonable tosuppose Uat this will be increased to biL milon in 1970 kat Lyo>prices) as intended.
10. The Irish economy is highly dependent on trade with theUniued Kingdom and roughly 70 per cent of exports go to that countryand 50 per cent of imports are received from it. Cattle are a majorexport, as is beer and other agricultural products, out a wice rangeof manufactured goods is exported and sales overseas have increasedccansiderably in recent years.
_1. between 1953 and ly6> the volume or imports increased by77 per cent and that of exports by 73 per cent. The deficit oncommodity trade has increased much more rapidly because of deterior-ation in the terms. of trade. In spite of an improvement on invisibleitems, the balance on current account has become increasingly indeficit. In 1963 the deficit was 222 million, in 1964 -31 millionand in 1965 approximately L1' million.
le_. Vhe increase in imports in recent years in part reflectedrapidly growing foreign capital inflows for investment in the Irisheconomy. Reserves rose or remained constant every year from 1958 to1964. In 1965, per contra, reserves fell by some Lh0 million in thefirst half of the year, but half of this fall was recovered by theend of the year. Reserves are now equivalent to about six months'imports compared with almost a year's imports in 1958.
13. The operation of the Irish banking system is dominated bythe fact that there is complete freedom of movement of money betweenthe Republic and the United Kingdom. This limits the extent to whichan independent monetary policy is possible, but recently the CentralBank has been developing a more active policy of monetary controlinvolving advice to the "Associated Banks" as to the increase inadvances that they can make.
(iii)
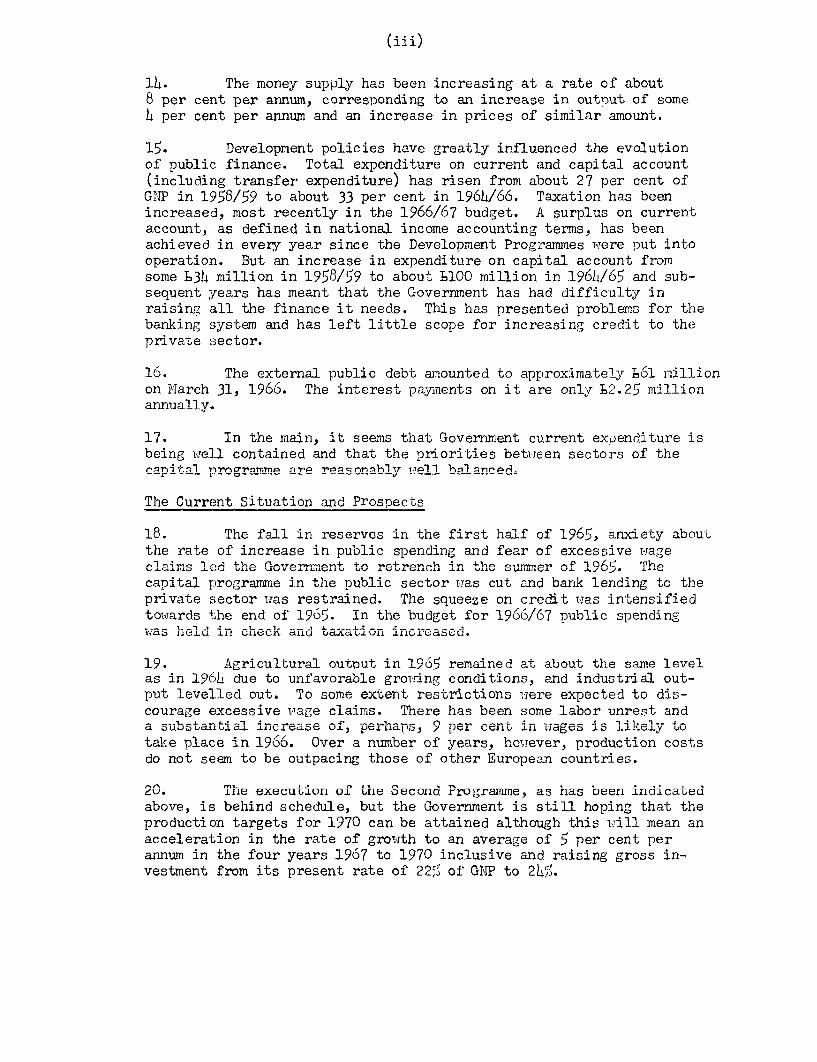
14. The money supply has been increasing at a rate of about8 per cent per annum, corresponding to an increase in output of someh per cent per annum and an increase in prices of similar amount.
15. Development policies have greatly influenced the evolutionof public finance. Total expenditure on current and capital account(including transfer expenditure) has risen from about 27 per cent ofGNP in 1958/9 to about 33 per cent in 196h/66. Taxation has beenincreased, most recently in the 1966/67 budget. A surplus on currentaccount, as defined in national income accounting terms, has beenachieved in every year since the Development Programmes were put intooperation. But an increase in expenditure on capital account fromsome L34 million in 1958/9 to about l100 million in 196/65 and sub-sequent years has meant that the Government has had difficulty inraising all the finance it needs. This has presented problems for thebanking system and has left little scope for increasing credit to theprivate sector.
16. The external public debt amounted to anroximately T61 millionon March 31, 1966. The interest payments on it are only L2.25 millionannually.
17. Tn t±he main, it q -.m thnt vnment crrent exnature isbeing well contained and that the priorities between sectors of thecanitq n-rermm np rAnnPhlv iTpl 1 hlqnI rr-A
The r"ront. Situiorn aqnd4 ProsnPcs
the rate of increase in public spending and fear of excessive wage
capital programme in the public sector was cut and bank lending to thepivat secto -,,,a re USLJ~straLined.. 1.±e squez on,i creCl k, -,-.TaS 4 ntenS4 4-1
towards the end of 196. In the budget for 1966/67 public spendingwasdZ hld~L 11n chier c I and axat.L l~~
Agricu&L ura± output in '9 5 remained auout ULle same 'evelas in 1964 due to unfavorable growing conditions, and industrial out-
UL _e..Lt :;U ~ UU. i.U o ll some ZlL exen reticion vier expecte L to U.LO
courage excessive wage claims. There has been some labor unrest and
take place in 1966. Over a number of years, however, production costsdo not seem to be outpacing those of other European countries.
ev. The execution of the Second Programme, as has been indicatedabove, is behind schedule, but the Government is still hoping that theproduction targets for 1970 can be attained although this wiall mean anacceleration in the rate of growth to an average of 5 per cent perannum in the four years 1967 to 1970 inclusive and raising gross in-vestment from its present rate of 22% of GNP to 245.

21. In our judgment the capacity of the Irish economy effectivelyto a-obfo~reign" andl domestic^ investmennts is Q)nt I-i~ pprahdBut to raise savings sufficiently to meet these investment needs is amuch moe4r4.b -e1, * h,,e
4c ,- ,4A4a11 0
of GNP in 1958 before deductions for depreciation, 17.6 per cent in1965- --;- are- exece IR 7 pe cent in 10AX, T Iti
not felt realistic to suppose that they will exceed 20 per cent of
r-, r- . -1 s e pe t dU LX% tj. tLL11t ±11U UVVti±. 1 IA,11 WJ.i1U-L L.LQ"-
to 13 per cent of GNP in 1970 (compared with 12 per cent in 1965), andthatU Utre WlJl be a gap*J in tLe baLLclance ofL PaYmets;U ofL _:._J perI cent ofLGNP (compared to nearly 4.5 per cent in 1965).
23. On these assumptions, consumption will amount to 66 per centof the -N T 170 compared with 70 per cent in 196r and 76 per centin 1958. Between 1965 and 1970 an increase of only 2.5 per cent perannum in pers onal consuM-p tion is proviueu f1, atuough reaL IMcom1U
are expected to rise by 5 per cent per annum.
24. The pressure on resources will show itself in an increasein the deficit on the balance of payments. The deficit for 196 isestimated at 128 million and the projection for 1970 suggests a deficitof around h5 million.
25. The inflow of private capital has amounted to as much as425 million in some years, but the private sector is likely to requireperhaps as much as .10 million more than this in 1970.
26. Foreign capital has played a most useful role in financinginvestment and the need for it on an increasing scale will continue ifthe Second Programme is to be fulfilled. Efforts to increase the flowof foreign capital are likely to be impeded by restrictions presentlyexercised on the flow of investment funds from the United Kirgdom andthe United States. Considerable reliance on private capital is desir-able and inevitable, but it would be helpful if it could be supplementedby other sources of finance to assist in meeting the needs of the publicas well as the private sector of the economy for capital for developmelpurposes.
27. Government financial requirements from the banks and foreignlending will continue to be heavy in future years. Requirements fordomestic finance from the banks can be reduced by increasing taxation,but the public sector will most probably have to use bank financingfor part of its needs, perhaps to the extent of some L10 million in1970. A substantial sum of money, perhaps of the order of l10 millionor more per year, may have to be obtained by public borrowing abroadas development proceeds. The external public debt of Ireland is smalland the debt service burden is light.
THE ECONOMY OF IRE,LAND
I. THE SETTING
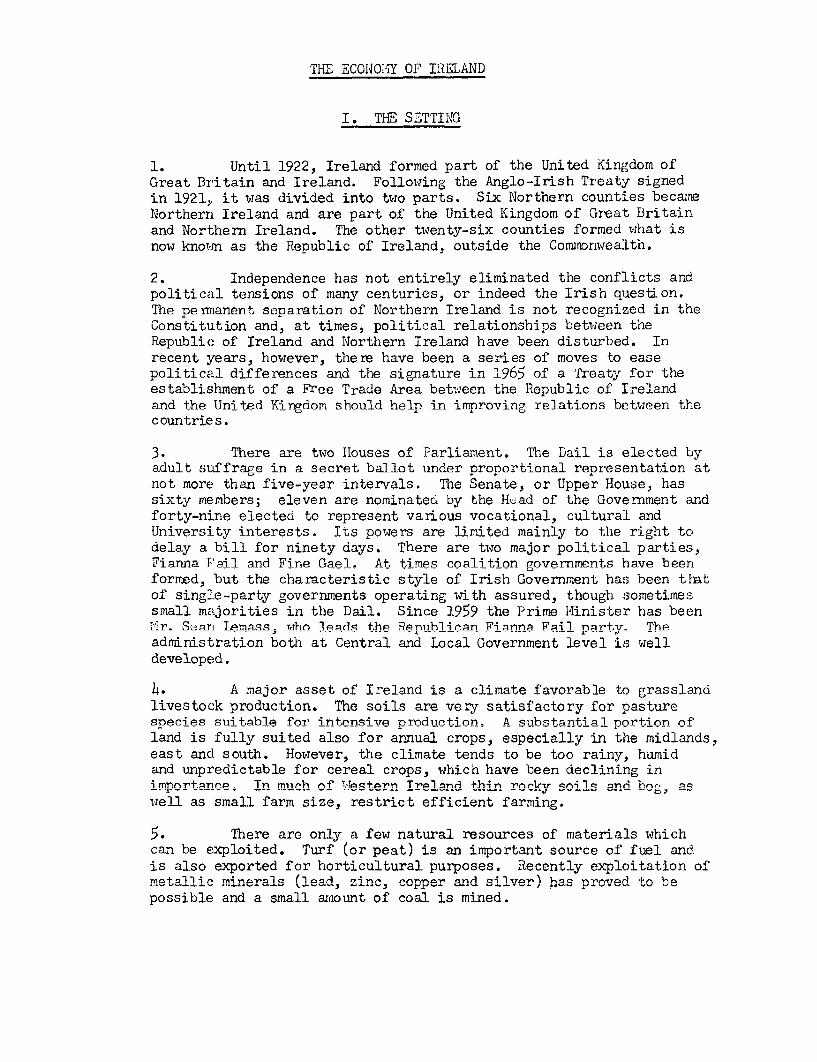
1. Until 1922, Ireland formed part of the United Kingdom ofGreat Britain and Ireland. Following the Anglo-Irish Treaty signedin 1921, it was divided into two parts. Six Northern counties becameNorthern Ireland and are part of the United Kingdom of Great Britainand Northern Ireland. The other twenty-six counties formed what isnow knowin as the Republic of Ireland, outside the Commonwealth.
2. Independence has not entirely eliminated the conflicts andpolitical tensions of many centuries, or indeed the Irish questLon.The permanent separation of Northern Ireland is not recognized in theConstitution and, at times, political relationships between theRepublic of Ireland and Northern Ireland have been disturbed. Inrecent years, however, there have been a series of moves to easenolitical differences and the signature in 1965 of a Treaty for theestablishment of a Free Trade Area between the Republic of Irelandand the Uni ted Ki rdom should heln in imoroving relations between thecountries.
3. There are two Houses of Parliament. The Dail is elected byadult suffrage in a secret ballot under pronortional representation atnot more than five-year intervals. The Senate, or Upper House, hassixty members: eleven are nominated by the Head of the Government andforty-nine elected to represent various vocational, cultural andUniversitv interests. Its nowers are limited mainly to the right todelay a bill for ninety days. There are two major political parties,Fianna Fnil and Fine Gnel. At times noalition governments have beenformed, but the characteristic style of Irish Government has been thatof sinrrle-nartv gnvernments onerating with assured- though sometimessmall majorities in the Dail. Since 1959 the Prime Minister has beenMr. Sean Lmass. who lpads the Rnublinan Fianna Fail narty. Theadministration both at Central and Local Government level is welldevel onf.d-
ii. A major asset of Ireland is a climate favorable to grasslandlivestock production. The soils are very satisfactory for pasturesnpcies suitable for intensive nrnduntion. A .nnbstntial portion ofland is fully suited also for annual crops, especially in the midlands,east and south. However,h +.hp r1mn*.itends to be nn rainy, humid
and unpredictable for cereal crops, which have been declining inimnortPnnP Tn milh of Wastern Treland thin rocky snils and bng n
well as small farm size, restrict efficient farming.
There are only a few natural resources of materials whichC-) hm Pwn1~r%i+.ori_ ivrnf~ (r%-r r-v,+) ic4 ni imn^-y-fnn+ ce%iy-n rrf' fiiml nvir
is also exported for horticultural purposes. Recently exploitation ofmetallic mieneals (smaleamunc coal and silver) isa mirove n ed.possible and a small amount of coal is mined.

- 2 -
6. The total population is approximately 2.8 million - less thanhalf that at the time of the famine in the mid-nineteenth century.The historical decline in population has continued until recently.Emigration is still at a high level and has averaged around 30,000 peryear in recent years - about the natural rate of increase of thepopulation. There are marked differences in income within the country,between east and west, and also within occupations. Income per headaverages 1300 compared to roughly L425 in Northern Ireland and a littleless than 1600 in the United Kingdom. Relatively low incomes, combinedwith limited employment oportunities, explain the high rate ofemigration.
7. Education is compulsory up to the age of 14 and childrenusually attend school from the ape of L years. Although the Statemeets the cost of most primary schools, management is entrusted mainlyto various religious denominations. Secondary schools are given con-siderable assistance by the Department of Education, but again they aregenerally nrivate institutions. There are two universities. one withthree colleges in different parts of the country, and a number of otherinst.ituntqes for tpchninal and other snpnialist. education.
R. Ireland has aImiyed" i-rnromv- Privantep Pnteprprise i s t.vnicalof both industry and agriculture, but a number of public corporationshave been established and a considerable measure of Government assist-ance is given to most forms of economic activity.
9. Industry now provides approximately 30 per cent of the GNP-gainst. 2 nPr rPnt for ariciture nevertheless,. more nAonle are
employed in agriculture than in industry.
10. Ireland has particularly good access to tl-e United Kingdommarket whprp qho qol 70 nr cent of her Por,+.q in 196O. Under
existing arrangements the entry of most Irish manufactures is unrestrictedqnd duty-.free. Many nods for the United Kinrm are sibect to
preferential duties at present, but these are often high. Under theFree Trade Area A,reement the fem remaining restrictions on Trish
industrial exports will be eliminated and restrictions on agriculturalexports ased. Tt i. hni +hnt i+ will ensuro ii nt.-rrin+rd _ae
to the United Kingdom market for manufactured goods in future. Thecounternart of this is that+ thn T4h markefor- manufactured gndAwill be increasingly opened to the United Kingdom as tariffs are
ducely aAod --nd conmnIn+n-lir t-- rakmn +hnn A "nnman+ f+n aPvll n-P-rnefgradually reduced and copetl wThen I.- eff +~f~1 ~ectin 1975.
11. Capital has moved freely between Ireland and the United Kingdom.&. L.L~ A.UJ CALLl.J U~ ~~Q 'o'.aI/o,%At O.LJ. . JJ.Wa .J .'.4 ~J L I LA _ Li . Ll
but there is net emigration from Ireland on balance. This great mobilityof -~4
rA 1 -r , e -l" 1 a, g,4 .c .mens that- --1, - 1- ., a ,oa of thier C -V
Republic is strongly influenced by developments in the United1IIngdoi. The L u.. .1.Kudm iX."1r,%AU111 ULV a. domia.tU ef.ect o11wages, costs and prices in the Irish economy; and this circumscribes the

U. TH DEVELOPUZi STR-UCUREUz OF T111E, ECOru"FfL
A. Economic Growth
12. Three fairly distinct periods may be distinguished in theevolution of the economy over the last two decades, as may be seen fromTable 1 below. In the first period, 1947 to 1953, the Irish economywas activated by the high postwar demand, particularly from the UnitedKingdom, and was able to draw.on sterling balances accumulated duringthe war. The gross national product at constant market prices increasedby 20 per cent. Output in agriculture, however, increased rather slowly,the upward movement being at the rate of one per cent per annum.Industrial output, on the other hand, increased at the rate of ten percent per annum. The effect of this was that by the end of this periodindustry's contribution to the GNP was becoming as great as that ofagriculture.
13. The second period, from 1953 to 1958, was one of stagnation.There were recurrent balance of payments crises which affected foreignexchange reserves, while resultant pessimism destroyed confidence inthe economy and eroded willingness to invest in it. Industrial outputin 1958 was scarcely greater than in 1953. The trend of agriculturaloutput was slowly upwards but gross output in 1958, which was a badyear, showed no increase over 1953 and net output was less than in thatyear. The contribution of services to the GNP was virtually unchangedbetween 1953 and 1958.
14. The third period, from 1958 to 1965, was one of relativelyrapid growth largely due to the expansion of industrial output. Thelimitations of the domestic market were seen and for the first timethe economic gaze was turned outwards to take account of growing liberal-ization in world trade. In total, GNP at constant prices increased bynearly one-third.
Table 1.
EXPENDITURE ON GROSS NATIONAL PRODUCT AT CONSTANT (1958)MARKET PRICES 1947-1966
L million1947 1953 1956 1964 1965 1966
Est. F'castPersonal expenditure on
consumer goods & services 407 438 458 571 582 595Net expenditure by public
authorities on currentgoods and services 0 72 71 87 89 91
Gross domestic fixed capital4-1. 14 14
Value of physical change in
Exports of goods & services 181 213 221 318 320 341Less - Imorts of goods and
services -200 -222 -222 -374 -391 -399GNP at constant market prices,505 601 600 772 791 822
1. In 1958 the Irish Government adopted a "Programme" ofeconomic develoDment trends outlining various proposals designed torealize economic opportunities over a period of five years. Objectiveswere modest and an increase of only two per cent per annum in GNP wassought. In fact, as has been seen, the economy grew much faster thanthis.
16. The Second Proaramme. introduced in 1963, covered the period1964 to 1970, and was somewhat more ambitious. It was framed in termsof an increase in GNP of 50 per cent in the decade 1960/1970, andit set targets for each major sector of the economy. The approachadopted was that of indicative planning backed up with strong policymeasures directed to the attainment of both general and specificobiectives.
17. So far- the increase in outnut is below target. An exnansion
in GNP of about 4.3 per cent per annum was postulated. The averagein the ners 19h t.o 1966 is unlikely to -qd . npr rpnt nper
annum, and this would have to be stepped up to 5 per cent per annumif' +h roriinnl +n t 1rcp 1970 wor +rn h nff.+.inP8-
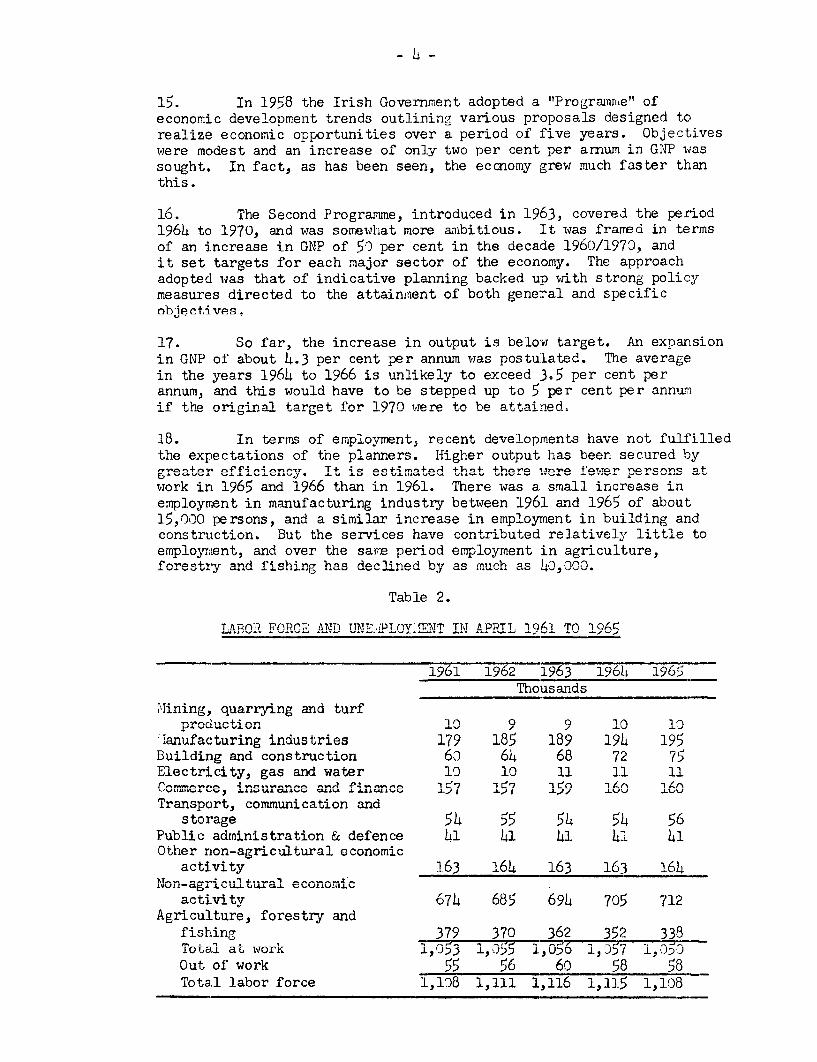
T8 n nem f' employimnnt T recent. deopi -ments have nn+. fiillpAthe expectations of the planners. Higher output has been secured bygreoae efficin4cy T+ 4a e4en +h n+ +hi-r 1un." fawo-r nsDy-cnez mfgreate ~',7. It is estmated that there ..- re feerpesons awork in 1965 and 1966 than in 1961. There was a small increase inemplwoymn in manufactunga inustr En o TOAT ~An 1OAC rof chan+t15,000 persons, and a similar increase in employment in building and
- +- . -u+ +-- seMri lne haeve +v 4c-nr'uted rle+nivly 1y l+le toemployment, and over the same period employment in agriculture,
1'nhlm 9
TABR FORCE AMT) TT7.q-PTVTM%TT TN APPTIL 141 TO 1Ac
1961 1962 1963 196h 1965Thousands
Mining, quarrying and turfprdtino+n IO nA Ci
lanufacturing industries 179 185 189 194 195Buildinjg and constrution 6,) A) 68A 72 7 f
Electricity, gas and water 10 10 11 11 11Coiere insurnce A ff4 .7 1 Cf' I if 1) i n 1 'n
Transport, communication and
Public administration & defence L1 41 41 41 4101 aV , -non-g-dcltu -1 econom,A.C
activity 163 164 163 163 164NoTn-agri cultua ecnoi
activity 674 685 694 705 712rL u u U L0ivly EMIU
fishing 379 370 362 352 338Total at work 1,U53 1,355 1,056 A,){ 1,U UOut of work 55 56 60 58 58Total labor force 1,108 1,111 1,116 1,115 1,108

19. It appears that the present policies are not sufficient toexpand employment ano it is unlikely that the target oi L..Ll lilliOnpersons at work in 1970 will be attained. 1Je comment below on thesIgnificance of this for the Development Progrramme.
20. In spite of the failure of employment opportunities toincrease, there has been no significant rise in unemployment. Thenatural increase in population is about one per cent per year. However,emigration is traditional and most of those who cannot find jobs moveto Great Britain or further afield. In recent years net emigrationhas been about 20,000 to 30,000 per annum; that is somewhat less thanthe natural increase in population of about 30,000 a year. As a resultof emigration, the age distribution of population is unfavorable.Between the census years 1951 and 1961 total population declined by140,000 or 5" for the 10-year period. The number of people in the agegroup 15 to 44 years dropped by no less than 185,000 or more than150, the numbers of children and persons 45 years and above both in-creased by about 2.5 per cent.
21. Imports, for a variety of reasons, have been increasingfaster than planned. Exports have been lagging slightly behind, butit is expected that they will increase considerably in 1966.
22. The balance of payments deteriorated rather sharply in 1964and 19o_, current deficits of approximately L31 and LUh millionrespectively being recorded. This was more than was felt to be safeeven when seen in relation to an inflow of private capital of some125 million per year. The position in the first quarter of 1966 wasmuch improved.
B. Industry
23. Until recently industrial development has been centered onfirms nroducins for the domestA. market under thp nmhrrlla of highprotection. The level of protection afforded to Irish industry ishigh. duties of O Der cent on manufactured soods being not uncommon.
2h. With only a small home market. it is renoonizedi that furtherindustrial growth must be based largely on exports and that thisreqires industry to become flly nomneAtitive. Two main stran ofpolicy are being developed to bring this about. The first of these isconcerned --it St~~ilat±i ng di rect+ ePrt+ nrrbdir-H n~n nn with -reduciingprotection to Irish industry and reorganizing it to increase its
new markets for Irish exports. The Free Trade Area Agreement withthe ni sted Kingdom orti ahn relin ill Joindu l olIn Maretbeing shaped for a time whffen Ireland will join the Common Market.

25. It has been realized for some time that a massive programmeof adantation would h r -rri if nlrier industriq were to pt them-selves in a position to develop their output and sales in a compet-itive7 mnrkpt. hnth n. E)np an br nnhrniq_ innnnrn fnr +hii-
has been provided in a number of ways. Special grants of up to9 nr cont. are aai lable +nards +h enc+ o machinery, -nln
equipment and buildings in order to increase efficiency. Grants ofun to O per cent of the cost of the empnommnt of industral consultants and of training are also made and there are a number ofothen riyc r%faSnczQ c!+Yen
26 An imotn instiUtional- innovation has been the formationof Adaptation Councils to assist firms in particular industries to
four Adaptation Councils and Trade Union Advisory bodies in existence.
27. The Committee on Industrial Organisation (C.I.O.) withmembers from both sideS u inustry and the public UervicP U waappointed by the Government in June 1961 to make a critical appraisalof the measure that might have to be taken to adapt Irisa Industryto conditions of more intensive competition in home and export markets.The Committee has surveyed and reported on twenty-six sectors ofindustry. It has also produced a number of general reports and theGaverxnment has accep ted reco!mmendations inade by It.
'). o Le ui*±icult to judge how far these measures aresucceeding. At the end of 1965, 361 applications for financialassLtance with adaptation, involving total capital expenditure of_42.5 million had been approved. It had been intended to concludethe rVgramme by iarCn 16, out in order to give further opportuAityto firms which had not undertaken the adaptation measures needed, theUovernment decided to extend tne period during which grants could begiven to December 31, 1967.
29. A number of measures have been taken to attract and developnew industries to Ire'land .
ki) The most general form of assistance is the payment ofgrants by Government to attract new industry. Fora new industrial undertaking grants of up to two-thirds of t1 total cost of sites, buildings and equip-ment and of the training of workers may be made toindustrialists establishing themselves in undevelopedareas, mainly areas in the west of the country. Inother areas, up to one-half of these costs can be met,though it does not appear to be usual to give themaximum pemissible in either case.
(2) A major factor in attracting new industry is exemptionfrom income tax and corporation profits tax on profitsattributable to increases in exports of goods manufactured

in the State over corresponding exports in astanIdard peiod.. F£O nt iew-~iIJd~ ll-4.. iI1 I,L
effect of giving exemption from tax on the wholeof profit de-Je from.V~ exot sales Lu
intended at present that this concession will bewihrawn by 197.
Tax relief is also given in the form of aninitial allowance of 20 per cent of capital expend-iture on industrial buildings. For machinery andplant the annual allowance is five-fourths of thenormal basic rate, but may be higher in some irEances.
(3) The Government has promoted tre Industrial CreditCompany to assist in furnishing medium- and short-term credit to industry (see below).
(4) An industrial estate in a customs-free zone has beenestablished at Shannon and other estates are plannedat !'aterford and Galway.
(5) The Industrial Development Authority has been estab-lished by the Irish Government to stimulate thedevelopment and expansion of Irish industry. TheAuthority is charged with the task of assistingindustrialists from other countries who may wish toestablish manufacturing undertakings in Ireland. Ithas a budget of approximately L250,000 per year ofwhich some 1130,000 approximately is used foradvertising. A number of representatives are main-tained abroad and the Authority works in close con-tact with the Grants Board which was set up toadminister the capital grants described above for newindustrial projects.
Since 1959, 189 projects with foreign partic-ipation have gone into production. Forty per cent ofthese were promoted by British firms, 20 per cent byGerman firms, 15 per cent by American, and the remainderby firms of various other nationalities. The totalcapital involved in these new industries is aboutLS million.
30. These policies have provided considerable stimulus to indus-trial development and diversification, to the growth of exports and tothe inflow of foreign capital, tecInical know-how and entrepreneurship.The contribution to employment has been less strikine. It has beenestimated that when full production is attained by new establishmentsto which grants have been aiven since 1952, some 30.000 new jobs willhave been created. This is equivalent to only some 2,000 jobs per year.
31. The outstanding feature of industrial development has beenits export orientation. iany small new industries or manufacturingoperations have been introduced, ranging from the manufacture of pipesto the production of pharmaceuticals. There has been considerablegrowth in chemicals and in metal-processing. There has also been alarge grouth in textile output, largely because there has been aplentiful and cheap supply of female labor, and successful attempts toincrease exports. A start has been made with food-processing on amoderate scale which could be a useful supplementary activity to thatof agriculture.
32. The growth of industrial exports can be seen from Table E-1.
C. Agriculture
33. The main characteristics of the recent past and the currentsituation is that agriculture is going through adjustments associatedwith expanding production and with improving efficiency, which havestrengthened the competitive position of Irish agriculture in theUnited Kingdom market. These adjustments involve all-round improve-ments of' agricultural practices, modernization and commercialization.A very commendable momentum has been attained in introducing thesechanges. While the growth rate of acricultural production hasaccelerated only modestly, with the declining labor force, productivityhas made raoid gains. Progress has been relatively narrow. but isspreading to those parts of agriculture where traditional farmingDatterns prevail. Until recently. livestock production has laged asagainst production of tillage crops.
3h. The gross output of agriculture (including turf) increasedby about 1.5 ner cent ner annum in the latter nart of the last decadewhile in the early 1960's the growth rate accelerated to about 2 percent per year. lbst of this acceleration is attributable to theexpansion of turf output. In the last few years there have beenindications that the growth rate of iericultural outout is acceleratin:further. Up to the last two or three years most of the growth in live-stock production has been in Digs and sheep. In most recent years.cattle production has risen sharply in response to the strong exportmarket for beef, and also to subsidies for increasing herd numbers.
3.+.+ n- n,on+j and a rplativelv slov risp inper capita consumption of agricultural products, a large part of theincreased nroduction is exnorted. Cnnqnuentv exnorts have risensharply since about 1960. The value of agricultural exports wasrough1v nne-cnarter cr-atPr in 19W'A thpn durinv the nrending fiveyears. In 1964 a further increase took place, but in 1965 exportsdeclined. This dron can nrobhl he eopnined in t.rm.s of the i mnrev.d

-9-
long-term prospects for beef combined with the Introducton of asubsidy (in early 1964) of ,15 for each calved heifer added to theherd. As a result, more stock was retained on farms for expandingbreeding herds.
36. Government officials and the most progressive farmers nowrealize that the best competitive opportunities of Irish agricultureboth now and in the future lie with grassland faning. We concur inthis judgment and find that the heavy emphasis placed on better grass-land management is fully justified as a key to increasing stockingrates and increasing output per acre.
37. Hajor emphasis in pasture improvements has been based on theapplication of fertilizers and also of lime where necessary. Plowing-up of grasslands and reseeding is not generally required. Fertilizeruse has expanded rapidly, but only 30 per cent of the total pasturearea is now fertilized. The use of commercial feeds and agriculturalmachinery have also increased rapidly. Traditionally, inadequatesupplies of fodder have been kept for winter feeding. Only a verysmall percentage of farmers have so far adopted the practice of makingsilage. Hore emphasis should be given to the problem of improvingwinter fodder supplies.
38. The sharp expansion of sheep production is attributable tobetter pasture management, heavier stocking rates and improving sheephusbandry. This, in turn, has been based on a reasonable level ofprices. A striking development in pig production is the sharp increasein the use of commercial compound rations, but skim milk is also ofimportance. The increased use of commercial rations and the emergenceof a number of large-scale pig production enterprises strongly suggeststhat the cost and price relationships for pig meat have been favorable.
39. The most immediate problem related to production of beef(as beef production is considered possible on a national scale onlyon the basis of dual-purpose cows), has been to dispose of the increasedoutput of dairy products. This has been done with the help of exportsubsidies which have increased greatly in recent years. Also theexport subsidies for bacon have increased.
4O. During the last seven or eight years a number of major aspectsof agricultural marketing and processing have been surveyed by specialcommittees. This has resulted in the establishment of marketing boardsfor grain, pigs and bacon, and milk. A board for meat and cattle market-ing is being contemplated. Consolidation of small, obsolescent dairyplants and many other improvements are under consideration.
41. An important recent step in improving marketing is the newFree Trade Agreement with the United Kingdom which gives a guaranteeof unrestricted access to the British market for Irish store cattle,store sheep and store lambs. Under the Agreement a reduction from3 to 2 months in the waiting period before Irish store animals canqualify for the British fat stock guarantee payments is to be made;
- 10 -
the differential of 3/4d. per pound deadweight between guaranteedprices for British sheep and lambs and those for Irish sheep and lambsfattened in the United Kingdom is to be abolished. British deficiencypayments are to apply to 25,000 tons of Irish carcase beef, and to5,500 tons of lamb; the basic quota for Irish butter exports is to beincreased from roughly 13,000 to 23,000 tons per annum; and otherundertakings of value have been given.
42. The agricultural improvements have been strongly encouragedby financing provided under the development programme. Since 1958Government expenditure on agriculture has more than doubled. The vastproRramme of expenditure is decisively geared to encouraging anddeveloping private initiative. Subsidies to encourage improved pro-duction methods and improvements in marketing have played a major role.Substantial amounts have been paid in subsidies to lower the price offertilizers and of lime to farmers, to reduce their investment costsin livestock housing, silos, hay sheds, machinery, drainage, andvarious other permanent farm imorovements. Major expenditure has beenincurred for eradicating bovine tuberculosis (this programme has beenpractically completed). and a new nrogramme for the eradication ofbrucellosis has been undertaken. There has also been a considerableinvestment in agricultural research. Broadly snpeaking. the imnrovementprogramme is geared to promote grassland agriculture and is thus inline with the main comnarative advantage of Trish agrinilture.
D. Tourism
43. Tourism in Ireland is a highly organized activity. It con-tributes to the economy by cranting Pmn1nvmknt nrtici1nrv in rpmnt.p
areas, and as a substantial earner of foreign exchange.
44. Total expenditure by foreign tourists is estimated to haveAnove- aA f-rnm 12h millin-n in IO<7 +n L7A rmilli^n 4-n 10AC nT +_+O n
receipts in 1961, "29 million was estimated to come from visitors
visitors crossing the Northern Ireland border, of which half representedd-+.rinners An imr-raV+n+ lemet Jtmotal+ vns +rf1 n+ fy"m +niivm'-rn i'
that of Irish air companies which amounted to .10 million (gross) in
)tT- 4 - '~--A 4-- 4 nc e s re en e fr m o is, to..., ____~ T-11r4.5., .5.54 LQ ~ . wj) 4JL54 O54 I. '- %VII.L CLO. 4Z US LAS UUSs' OviS~Sliu ML..LUJ
million (at 1965 prices) by 1970. If this target is to be attainedULL~ .~4.L.L LLSV US V U 1 .1ul J. Q.JVCX .5. L .L L-L U 111 Vi4. 1PVY41)JS.L51L VUL) I JUI
cent per annum. On past performance this appears to be within thecap .j~.L1). UL1 .54 V. L' .)IJJ
with considerable imagination. Good use is being made of Ireland'sILstoricu monuments, and "activity nolidays", taking auvaUage of
fishing, riding and sailing facilities, are being developed. Whilethe Board has followed a poLic.y of encouraging the development of
tourism at all levels, it has laid particular stress in the past onattractin- tourists wnose average expenditure is high (L n who areprepared to use the best hotels of international standard). Experiencedhoteliers have been attracted to construct high-class hotels, forexample those built by the Intercontinental Group. Bord Failte'spublicity is outstandingly good and is backed by a sustained programmeof promoting tourist activities and furnishing accommodation.
47. Assistance to tourism has ranged from grants for the con-struction and improvement of hotels to the development or resorts.Cash grants for the construction of additional bedrooms in existinghotels, or for the construction of new hotels, amount to about 2u percent of the cost involved. Similar grants are also available forimprovement to public rooms and entertainment facilities for guests;staff accommodation is also eligible for grants.
48. The tourist industry is heavily dependent on bank credit forthe finance of its investment and recent credit restrictions have limitedthe industry's expansion plans. A further problem is the scarcity ofmedium- and long-term credit for construction purposes.
III. TRADE, IW\EY AND PUBLIC FINANCE
A. Balance of Trade and Payments
49. The smallness of the Irish economy and its open nature haveresulted in a high level of imports amounting to about 40 per cent ofGNP. This ratio has remained remarkably ccnstant over a number ofyears.
5o. The United Kingdom is the dominant trading partner both forcommodity trade and for services. For commodity trade, 70 per cent ofIrish exports went to the United Kingdom and 50 per cent of her importswere supplied by that country.
51. The volume of imports is approximately one-and-three-quartertimes what it was in 1958, or in 1953. Although in the year 1965 thevolume of exports failed to increase while imports rose, the trend hasbeen for commodity imports and exports generally to keep pace witheach other.

- 12 -
Table 3.
VOLUME OF COM0DITY TRADE AND TERIS OF TRADE
Year Volume Index Terms of Trade1953 100 1953 = 100
Imports Exports
1953 100 100 1001954 98 103 981955 108 95 961956 93 98 901957 89 117 871958 100 114 941959 110 110 991960 114 130 961961 131 156 941962 137 109 951963 152 165 951964 170 175 1001965 177 173 100
52. Between 1960 and 1965, imports of producers' capital goodsincreased in value by no less than 140 per cent; imports of con-sumption goods and of materials for production increased by a littlemore than 50 per cent. There was a steep rise in imports of cerealsand feeding stuffs reflecting both a slow growth of domestic suppliesand a continued increase in the number of animals on the farms.The effect of these changes on the composition of imports has beenrather small, the main change being an increase in the percentage oftotal imports represented by producers' capital goods.
Table 4.
PERCENTAGE DISTRIBUTION OF IPORTS ACCORDING TO HAIN USES
Use categryr 1961 1962 1963 1964 1965~
Producers' capital goods readyfor use 13.3 14.4 15.4 15.0 16.2
Consumption goods ready for use 20.7 21.0 21.2 20.5 21.5
Food, drink & tobacco 6.1 6.3 6.5 5.7 6.2
Materials for further production 61.2 60.5 58.9 60.9 59.1Agriculture .1 5.8 55 4.8 4.Other 56.1 514.8 53.14 56.2 514.3
Total 100l 100 100 100f N.0

-13
53. It may be seen from Table 5 that the proportion of totalkUo&ae UL-L c AJ t&. U LbO L e-- iuo iue~u '/d £LULL . LL-t-,OU1.Y CUIU .O1. LL
produce has been declining but is still over 55 per cent. Industrynias ueen maing a gretl- uontri'Duu.Lll LA tur IIU ulu lui LAULUIU LUI37 per cent of the total. Exports of cattle amounted to L45 million in.IYV) coipareu W.LiAu s m1IL-L-o1 in iyu, L)UL 16 uremaxtueu ue riol L0
important export earner. In 1965 as in 1964, exports of beef amountedto Ta" million, bacon exports to 19 million and mutton and lamb exportsto Lh million, while pork exports of 2'5.$ million more than doubled.Exports of milk products amounted to approximately 13. milion, exportsof chocolate crumb and chocolate preparations to approximately16 million and exports of beer, including stout, to L7 million.
LI. A wide range of manufactured goods is exported and most ofthem have increased considerably in recent years (see Table E-1 inthe Appendix). The comparatively slow increase in industrial exportsin 1965 reflected to some extent the imposition of an import surchargeby the United Kingdom.
Table 5.
DISTRIBUTION OF DOJESTIC EXPORTS
Category . -L L7%j L ;7,JL4
L million
Agricultural, forestry andfishing produce lu14 YY.Y 11.L 125.Y iu.o
Industrial 53.4 54.8 62.2 77.2 81.4Unclassified 14.5 14.2 14.0 14.6 16.0
Total 175.2 168.9 191.5 217.6 218.0
Percentage distribution
Agricultural, forestry andfishinr produce 61.3 59.2 59.8 57.8 55.3
Industrial 30.5 32.4 32.5 35.5 37.3Unclassified 8.3 8.L 7.7 6.7 7.3
Total 100 100 100 100 100
account can be seen in Table 6.
- 1)4 -
.lau-Le U.
113 BALANCEF UP rALITId N U UTii AUUUNvI
1958 1959 1960 1961 1962 1963 1964 1965Lmillion
Commodity imports 190 205 218 252 265 296 338 361P n - enn =xv -~nm-14 +-,
trade -68 -83 -74 -82 -100 -110 -125 -147
Emigrants' remittances,etc. 17 17 19 20 20) 20) 21
Balance not accountedfor 7 9 6 1 1
Balance on invisibles +67 +7h +73 +83 +87 +88 +94 103TA.'h.ir~y - A nnr,n -1 _..Q *... 1 - 9 , 1 _)
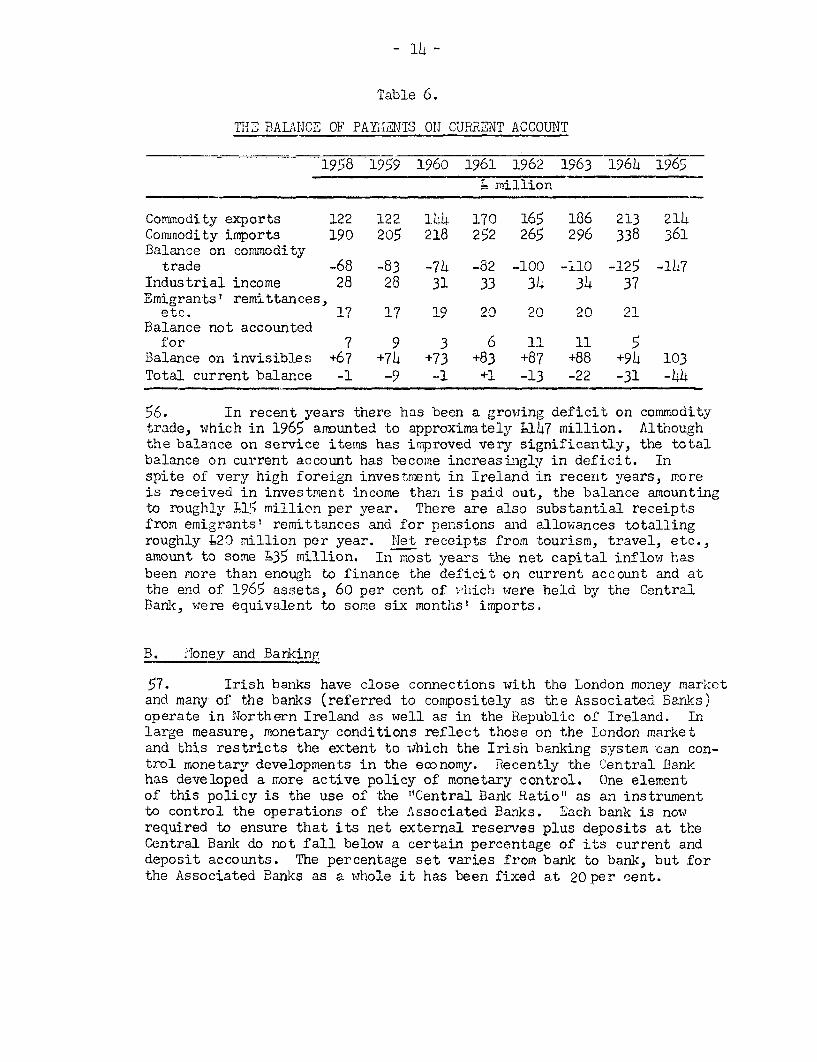
o. In recent years there has been a growing deficit on commoulaytrade, which in 1965 amounted to approximately 1147 million. Althoughthe balance on service items has improved very significantly, the totalbalance on current account has become increasingly in deficit. Inspite of very high foreign investment in Ireland in recent years, moreis received in investment income than is paid out, the balance amountingto roughly ;1 million per year. There are also substantial receiptsfrom emigrants' remittances and for pensions and allowances totallingroughly -20 million per year. Net receipts from tourism, travel, etc.,amount to some '535 million. In most years the net capital inflow hasbeen more than enough to finance the deficit on current account and atthe end of 1965 assets, 60 per cent of which were held by the CentralBank, were equivalent to some six months' imports.
B. .oney and Banking
57. Irish banks have close connections with the London money marketand many of the banks (referred to compositely as the Associated Banks)operate in Northern Ireland as well as in the Republic of Ireland. Inlarge measure, monetary conditions reflect those on the London marketand this restricts the extent to which the Irish banking system can con-trol monetary developments in the economy. Recently the Central Bankhas developed a more active policy of monetary control. One elementof this policy is the use of the "Central Bank Ratio" as an instrumentto control the operations of the Associated Banks. Each bank is nowrequired to ensure that its net external reserves plus deposits at theCentral Bank do not fall below a certain percentage of its current anddeposit accounts. The percentage set varies from bank to bank, but forthe Associated Banks as a whole it has been fixed at 20per cent.
58. In July 1965, the Central Bank advised the Associated Banksas to the policy that they should follow on advances, both in relationto amount and purpose. The unintended effect of this in the secondhalf of 1265 was to discriminate against the private sector, since thepublic sector of the economy required the whole of the additionalcredit advanced. For some years the Bank also has pursued a moreactive policy in relation to the discounting of Government paper heldby the Associated Banks and fixes the discount rate at which it isprepared to operate in relation to the monetary position. A substantialproportion of the liquid assets of the banks is now held in the form ofdeposits in the Central Bank whereas formerly they were held almostentirely in London.
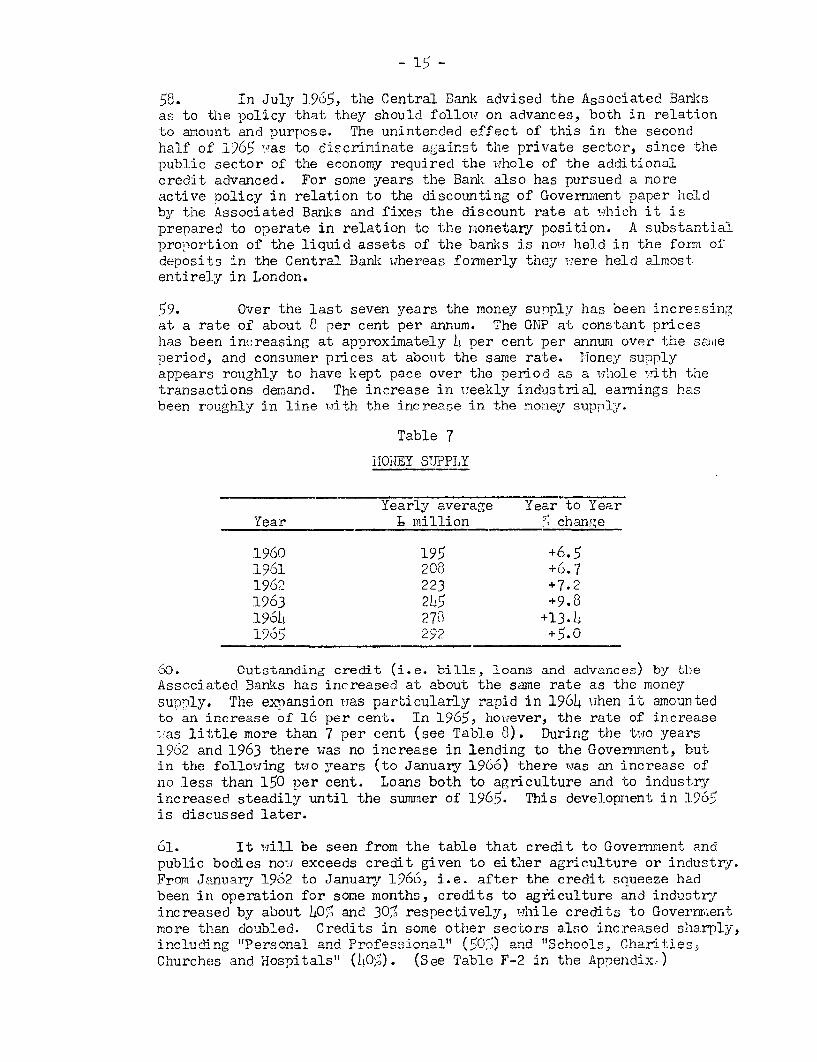
59. Over the last seven years the money suply has been increasingat a rate of about 8 per cent per annum. The GNP at constant priceshas been increasing at approximately b per cent per annum over the sUieperiod, and consumer prices at about the same rate. Money supplyanears rou2hlv to have kept pace over the period as a whole ith thetransactions demand. The increase in weekly industrial earnings hasbptn rnnahlv in line wi-t.h the incren-e in the noneyr sunnl_'y.
Table 7
MONEY SUPPLY
ie arly averacre Learx to Year
Year , million S change
1960 195 +6.5
1962 223 +7.2.. 963 24h5 +9.01961 278 +13.41965 292 +5.0
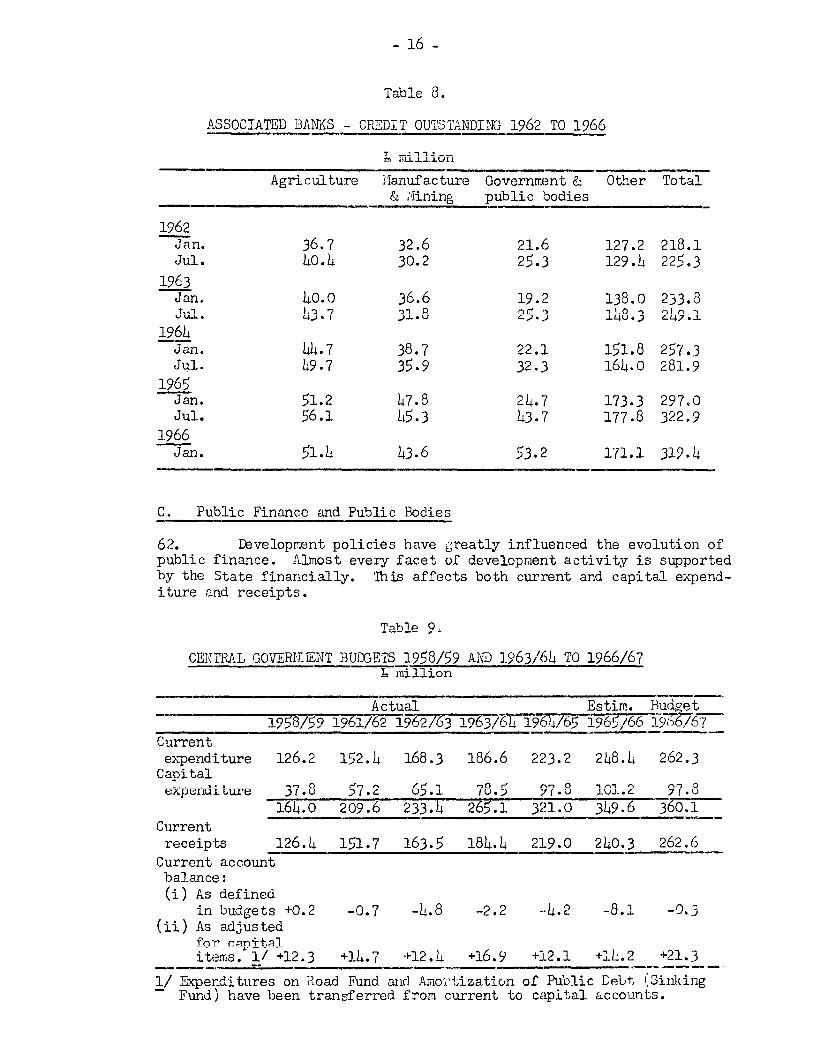
bO. Outstanding credit (i.e. bills, loans and advances) by theAssociated Banks has increased at about the same rate as the moneysupply. The expansion was particularly rapid in 1964 when it amountedto an increase of 16 per cent. In 1965, however, the rate of increase--as little more than 7 per cent (see Table 8). During the two years1962 and 1963 there was no increase in lending to the Government, butin the following two years (to January 1966) there was an increase ofno less than 150 per cent. Loans both to agriculture and to industryincreased steadily until the summer of 1965. This development in 1965is discussed later.
61. It will be seen from the table that credit to Government andpublic bodies now exceeds credit given to either agriculture or industry.From Tnmry 1962 to January 1966. i.e. after the credit saueeze hadbeen in operation for some months, credits to agriculture and industryinresend by 1 bout 1Oc nnrO man rsTtively, while nrp.Hits to Governrentmore than doubled. Credits in some other sectors also increased sharply,
Churches and Hospitals" (A0). (See Table F-2 in the Appendix )
- 16 -
AcQQr PTAtT 1)AAIVQ - (OTlVM n~TTM,m-p\1YrTf, -in4n rrn~ -ir)K1'Ut~.LJJ ~ 1U~JJL. I U.'L VI.,,JL U -L7UC( .IV -L;UU
Agriculture ilanufacture Government & Other Total& ining public bodies
1962Jan. 36.7 32.6 21.6 127.2 218.1Jul. 40.4 30.2 25.3 129.4 225.3
Jan. 40.0 36.6 19.2 138.0 233.8
1964Jan. 44.7 38.7 22.111. 273Jul. 49.7 35.9 32.3 164.0 281.9
1965Jan. 51.2 47.8 24.7 173.3 297.0Jul. 56.1 45.3 43.7 177.8 322.9
1966Jan. 51.4 43.6 53.2 171.1 319.4
C. Public Finance and Public Bodies
62. Development policies have greatly influenced the evolution ofpublic finance. Almost every facet of development activity is supportedby the State financially. This affects both current and capital expend-iture and receipts.
Table 9,
CENTRAL COBVERTENT BUDGETS 1958/q9 AND 1963/6L TO 1966/67L million
Actual Estim. Budet
Currentexp-_erU teure L4Uo.c 6 c_.u 4 00U.) _L00.Q 4 .c C o. 64uc
Capitalexpenditure 37.8 57.2 65.1 78.5 Y.8 101.2 7.u
164.0 209.6 233.4 265.1 321.0 349.6 360.1Currentreceipts 126.4 151.7 163.5 184.4 219.0 240.3 262.6
Current accountbalance:(i) As defined
in bud.ets +0.2 -0.7 -L.8 -2.2 -L.2 -8.1 -0.3(ii) As adjusted
for canitalitems. 1/ +12.3 +14.7 +12.4 +16.9 +12.1 +14.2 +21.3
1/ Expenditures on Road Fund and Amoitization of rublic Debt ksinkingFund) have been transferred from current to capital accounts.

- 17 -
63. Total expenditure on current and capital account roughlydoubled between 19.58/9 and 196li/65 and as a proportion of GNP itincreased frcm about 27 per cent to about 33 per cent. Expenditure oncapital account increased proportionately more than current expenditure.Current receipts increased by about 75 per cent. In 1964/65 there wasa current account surplus (adjusted) of about 12 million, about thesame as in 1958/59.
Ah. In 1965/66 current expenditure aaain increased and the budaetestimate for 1966/67 continues the upward movement. Capital expend-iture, on the other hand. has been stabilized since 196L/65. Increasesin taxation in 1966/67 resulted in the surplus on current account beingincreased to L21 million. Tf this surnlhs is realized it will renresenta considerable accomplishment which has involved raising currentreceints from annroximatelv 21 ner cent of GNP in 1958/A9 to more than2L per cent in 1966/67.
65. It may be seen from Table 10 for current expenditure thatthe lars7st absolute and nronortionatp increases have been in economicservices. Expenditure on general services has ipcreased only moder-atelv and tn line with (INP. Snrvi of the nublic debt is increasingreflecting increased borrowing by the Government. It amounts to aboutone-fifth of i tnl curront expnditure Drfnce xponrdi.ure are nomore than one percent of GNP.
1/ There are trnom the fac ain rime rof hes f nq -io Tnh d 0and. 10, due to the fact that different sources had to be used.

- 18 -
Table 10.
GOVERNPENT CURRENT EXPENDITURE BY ilAIN HEADINGSV million
Actual Estim. Budget1958/59 1963/6L 196h/65 1965/66 1966/67
Service of Public Debt 21.6 38.2 L2.8 L8.9
Social Services: 46.9 63.2 75.2 84.5 89.1Social Welfare 30). u.9 4 39.9Education 13.5 20.6 26.1 29.5 30.5Health 8.0 11.7 14.2 15.9 16.4
Economic Services: 22.6 39.2 47.6 Sh.8 57.5Agriculture 13.3 24.0 30.0 35.6 38.0Industry 1.6 3.1 3.5 4.5 4.6Transport 7.0 10.7 12.2 12.7 12.7Forestry & Fisheries 0.8 1.4 1.9 1.9 2.1
General Services: 23.4 33.6 40.6 43.0 43.1Post Office 7.T 10.1 13.3 17.6 13.9Defence 6.1 8.7 11.3 11.9 10.8Justice- incl. Gardai .0 7.3 7.9 8.3 8.7Public Service Pensions 4.9 7.5 8.1 9.2 9.7
0l.a nnc n +1 n' r,c 1-
expenditure as
66. Social Services are moderately wel1 developed in Irelandthough in many respects they do not go so far as arrang'ements inGreat Britain and Northern Ireland, and it would be difficult toadvocate any curtailment of expenditure on social welfare, educationand health.
67. Expenditure on economic services is estimated at 58 millionfor 1966/67. Of this.L38 million is to be s ent on ariculture.The largest item in this is subsidies of approximately L3 million forthe marketin of dairy roduce (mainly subsidies for exnort. Paymentsto the Pigs and Bacon 'ommission for the support of prices amount toa2.hc million. Part of exnenditure on fertialer subsidies is includedas current expenditure, the rest is in the capital budget. Expenditureon bovine tuberculosis and bruellosid s oadirion i s l so divi dedbetween the two budgets. There are a variety of other types of currenteynpndit.nrr of' smaller amounts inclding that on st.iff- rpPqrch nndeducation. The balance of expenditure amounting to T13.5 million con-.qi s1-z r)F' monny paid to r thecl aut-- m+hori ties. in relief of'rts
- 19 -
a subsidy to exporters designed to offset in part the surcharge imposedby the TT4n-Ite inodom jn- -1961- ~ aeas ~ tecsof technical assistance projects, a subsidy of ;200,000 to the ship-
Board for general expenses, and the payment of interest subsidiesamouningu to) ze_ L±i-i L . LO C.LLU CL tCiL J V L Mr LL.4UL Lii i.4
(the transport authority).
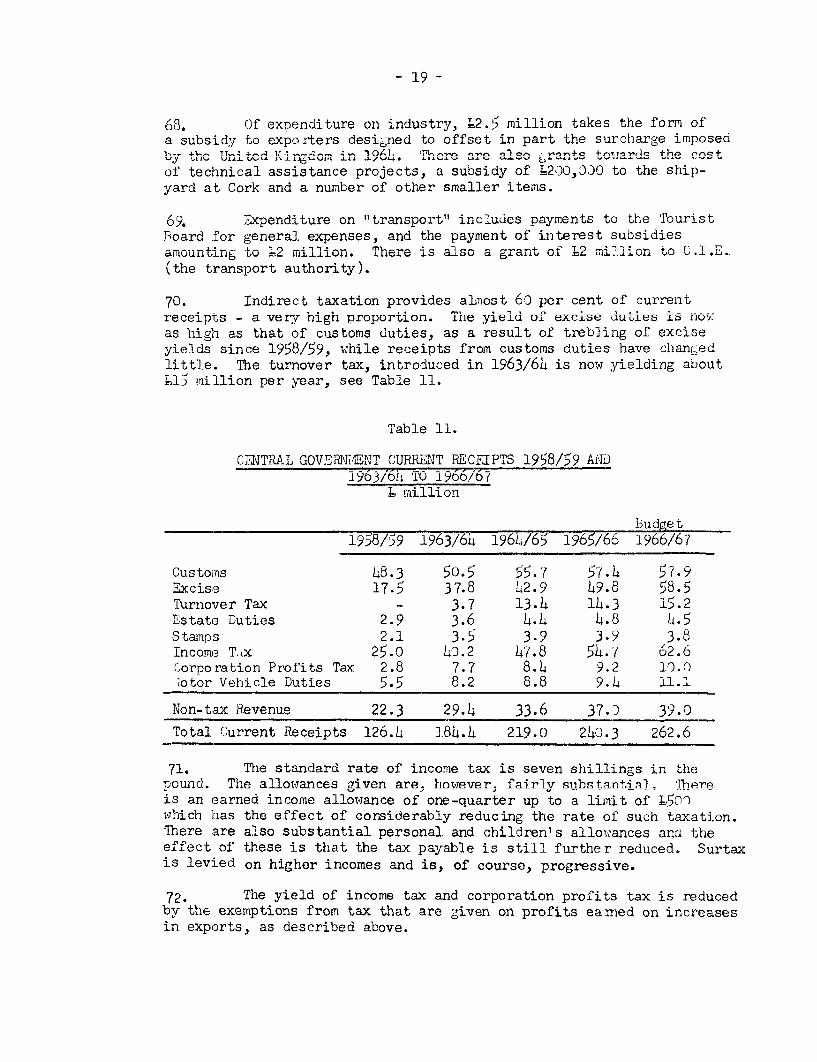
70. Indirect taxation provides alnost 60 per cent of currentreceipts - a very high proportion. The yield ol excise duties is nowas high as that of customs duties, as a result of trebling of exciseyields since 9y8o;y, while receipts from customs duties have cuaneu
little. The turnover tax, introduced in 1963/64 is now yielding about-15 million per year, see Table 11.
Table 11.
CENTRAL GOVERNMENT CURRENT RECFIPTS 1958/59 AND1963/61 TO 1966/67
L million
Budget1958/59 1963/64 9 6 4/65 -1965/66 1966/6 7
Customs 48.3 50.5 55.7 57.4 57.9Excise 17.5 37.8 L2.9 49.8 58.5Turnover Tax - 3.7 13.4 14.3 15.2Estate Duties 2.9 3.6 4.4 4.8 4.5Stamps 2.1 3.5 3.9 3.9 3.8Income Ttx 25.0 40.2 47.8 54.7 62.6Corporation Profits Tax 2.8 7.7 8.i 9.2 10.0lotor Vehicle Duties 5.5 8.2 8.8 9.4 11.1
Non-tax Revenue 22.3 29.4 33.6 37.) 39.0
Total Current Receipts 126.4 184.4 219.0 240.3 262.6
71. The standard rate of income tax is seven shillings in thepound. The allowances given are. however. fairly substantial. Thereis an earned income allowance of one-quarter up to a limit of 1,500which has the effect of considerably reducing the rate of such tqXtion-There are also substantial personal and children's allowances and theeffect of these is that the tax navable is still further rprili-p- Slurt.nxis levied on higher incomes and is, of course, progressive.
72. The yield of income tax and corporation profits tax is reducedby the exemotions from tax that are given on nrofits emar on inin exports, as described above.

- 9n -
73. Table 12 shows expenditure in the budget for the 1966,67"Public Capital Programme" divided between the various bodies respons-ible for it.
Table 12.
PUBLIC CAPITAL PROGRA:14E, 1966/67
L million
1. Central Government 31.1a. ~ J dA i-U- - iu - U -Lloan M ai.LiJ 1 .U J . LiV cLkor Ot: LA.L U.*
of which:
(i) Industrial Credit Co. Ltd. L.0(ii) Agricultural Credit Corporation 3.6
(iii) State Investment Board 0.6(iv) National Building Agency 0.5
3. Public Corporations for Production and Tistribution 33.5of which:
(i) Electricity Supnv 'ard 1nr(ii) Transport Authority 3.3
(iii) Air Comnanies 5.n(iv) Irish Shipping Company 0.9(v) Turf and Peat ADency 0.9
(vi) Shannon Free Airport Development Co. 0.9(vii ) Snaar Comnany 0.7
(viii) Fertilizer Company 0.5(ix) Radio 1 ir n .h(x) Telephone Services 6.2
(vi) thner 1.2
4. Local Authorities 24.h
Total Public Capital Progra-me 97.8
71. Nearly one-third of the nanital expenditure is tn be crrriedout by Central Government departments. Besides public works andbnilriincygs i entral Government annital outlay innlides L2-1/)l millionspent on the farm buildings scheme (largely related to livestock production)and L2.5 million on the land nrnint (concerned with drainna and other
land improvements) which are unquestionably of a capital nature; but ital inclides nrt of the onpnditurn on fpretli ver anbhii i (19 . milinn)
grants for calved heifers (L2.5 million) to increase cattle numbers inordler to -lr-vide more forr expr, nnci n'- f' +}.hm,-.11
ication scheme (O.3 million) to reduce substantial milk and calf losses.
75. Expenditure on grants to industry is also included as acap;i+n ependiture and is excted to Wmin+ to L) million in 10AA/A 7 .Since the grants are used to provide industrial capital, this seems toh aropr r c d-4 Ner Oervepent, -et.. 4 nl +Ia+ conharbors, airports and resort development, etc..
- 21 -
public corporations which play an important role in the Irish economy.
but the Board is composed largely of leading private industrialists.Atb the ---' ± nn6r I C -- -' 1 4n~ ,U-ted I'un U-3 dI t I UUUU LA. "C' V M.L±L ULI.
Two-thirds of this was in secured loans and about one-fifth in shares.Most of the money invested was provided from public funU. ToverUnenU
will contribute r-4 million in new capital to the Industrial CreditCompany in 19oo/or, somewhat less than in ±yo>;'oo.
78. The Agricultural Credit Corporation has issued loans since itsestablishment totalling more than L25 million. Half of this was issuedin the three years ending ;arch 31, 190. Its snare capital amounts toL6 million, of which L3.5 million is paid up, and it has borrowing powersof 120 million. It is estimated that its capital at the end of larch1966 will amount to roughly L15.5 million of which the State will haveprovided 510.5 million and borrowing from other sources -k- million.
7. The provision for the Corporation in the budget of 1966/67 wasL3.6 million compared with 2=.75 million in 1965/66. The Governmenttook the view that as it had decided that loans were not to be made forland purchase and debt funding in 1966/67, it would be possible toincrease credit for productive purposes by =5-0,00) in 1966/67.Nevertheless, there are clear indications that the provision of agricult-ural credit is at present quite inadequate in relation to the increasein production and exports intended in the Second Programme. In the longrun, adequate credit facilities might enable subsidies to be curtailed.
80. The Electricity Supply Board is responsible for the productionand distribution of electricity. Its management is highly efficient,but its operations are not profitable primarily because of lossesincurred on rural electrification. The first stage of the programme ofrural electrification is nearly complete, but further expenditure isplanned in order to maintain and develop the system.
81. In 196L/65 a net loss of some L400,000 was incurred afterproviding liberally for depreciation and paying interest on debts toGovernment. Even if losses on the supply of electricity to rural areasare excluded, it appears that a return of no more than 5 per cent oncapital was obtained. This return is low in relation to current interestrates, and there appears to be a case for raising the price of elec-tricity both on general grounds and in order to provide a higher pro-portion of the money needed for new investment from profits. In 1966/67all. capital requirements were met out of internal depreciation fundsand by borrowing on the market.
82. The Transport Authority controls the railway network, urbantransport, a large share of the public trucking business, and operatesvessels, canals, restaurants and hotels in connection with its passengeroperations. In 1965 there was a working loss of 11.25 million on therailway operations. Small working losses were incurred on vessels,
- 22 -
canals and docks, harbors and wharves. Road passenger and freghtoperations and the operation of hotels on the other hand were profit-able, bringing in L850,000. After allowing for the payment of intereston transport stock the ccmbined operations of the Authority resultedin a total loss of some 11.5 million.
83. A similar authority in Northern Ireland was recently re-organized into separate comanies concerned with particular types ofundertakings. In the process it was decided that certain road trans-nort onPerations conld he nerformed best by nrivate enterorise. andthe authority's responsibility in this field was correspondinglyrianrPd. The annliability of similar measures to the Irish Trans-port Authority might be considered.
1.Thei twoj Ai-r ;.nmnna Q npyn, n. on rrz- n1 7 r,ies
large capital contribution from Government in 1966/67 of L million
marginal profits, but the return on the capital irrirested is negligible.O rn 11 a_-ble on have hoon invae+od e n nd + marr ha +. t -a+.
will take some time before these investments attain their full yield.
89. The Telephone S_9nvices are run by the Departmcnt of Pcsts andTjL-fl c.a'' -x rrp_
0 1 __, k_. +--'-,.- 1 -0 ~, r,n- +ar+ 4. nm 1
a*,i . - nC +
since 1 but have providod inadequate service. The prov'sion ofC . .J4 A . 11L U,-- V&1 ,UL.L.~ U*'. -S '4 A.-,L - -oXL.J~ __j 'S - -
ewvi .iLhcn.s. There is a very long waiting-list for telephcnes and
renewed. The profit made is low in relation to capital expered and
ularly for installation.
86. About one-ouarter of the Public Capital Programme isCcannel.AU through oal 1uortes. Te bulk fU Local auhULriycapital expenditure is fcr housing construction cnd the rest for such411'aigs ao W<AUZ:wuVVM0, L1Va.P.;.a1_ anu -vu0CatU1na_L euucaton. 1_3 LUesspending on capital formation local authorities have large currente x:nendJtu - %'UC , 1 -LA-7ULW U,, LM1 _LUUUZ5U Ytar c u- "1 W"IL1[ Ut:Cj_L6~ du-vU Vrd.LL-
ale, they spent T76 million on current services. Housing subsidiesk , u 1AUU L_U s acuounseu for about m.5 million of this and intereston debt for about L9 million. Expenditure on the running- of local govern-ment srvice6 amounr,ed to some 5o( m1110n. Roout nal 01 this wenton health and more thanlf, million on sanitary services, the restUeing used for general purposes. Only one-third of current expenditurewas met from the rates (a tax on property); over 130 million wasreceived from the Central Government and extra-budgetary funds(including the contribution made in respect of agricultural de-rating,'.miscellaneous receipts accounted for the remainder.

- 23 -
87. From a public finance point of view, expenditures on housing -current and capital - are rapidly growing and appear high. From anoverall economic and social point of view, however, the standard ofhousing is not extravagant and the numbers of new housing units con-structed is probably not sufficient to meet replacement needs and toprovide adequate housing in new centers of growth. This raises thequestion of finding more efficient ways of public spending and policyin support of house construction and modernization.
88. It is now possible to summarize the main aspects of financialpolicy in the public sector. In the past two years it has been recog-nized increasingly that too large a Government programme of expenditurecan have adverse effects on development if it does not leave enoughroom for other sectors of the economy to expand. This is one reasonwhy expenditure, particularly on capital account, has been cut back.
89. iost capital expenditure by the Government is being spentproductively. Many financial provisions on capital account have theeffect of channelling financial resources needed for economic develcp-ment by the private sector of the economy to that sector. The selectionof this channel for the provision of finance, rather than relying toa greater extent on financial intermediaries, is largely connected withthe general methods of economic development that have been pursued.This may well be appropriate to the Irish economic and institutionalsetting, as the initial key problem is to encourage private initiativeand to draw on entrepreneural talent, both domestic and expatriate.
90. Grants and tax exemptions have been used on a large scale topromote economic activity along the lines indicated in the developmentprogrammes, and this has greatly affected the current financial positionof the Government. The use of grants and tax exemption for this purposehas proved an effective instrument of development and can be justifiedon general grounds.
91. iuch economic activity that is immediately unprofitable toprivate interests may be of benefit to other persons or to the State(for example, the construction of hotels encourages tourists to useIrish air lines). Many activities of this kind reinforce each otherand in time all can became profitable. From the psychological point ofview subsidies can be of great importance and the existence of a subsiyoften encourages potentially active members of the community to lookcritically and hopefully at the productive opportunities that Dresentthemselves. When the payment of subsidies is closely related to measuresto foster improvements in production, they may serve a double purpose.This applies, for example, to subsidies for the use of fertilizers,industrial adaptation or management education.
99. In assessing the effects of subsidies on develonment it isnecessary also to remenber that the policies adopted by Ireland areaffected by those nursued by the United Kinadom in relation to repionaldevelopment, and in particular, the way that these are applied inMorthern Treland. Tn Morthern Treland rrants towards Pxnenditure onmachinery and buildings in industry amount to 40 per cent of the cost
- 24 -
involved. There are also buildings available and special loan facilities.Moreover, industry is channelled to Northern Ireland by the United Kin,domBoard of Trade. On balance it appears that the inducements offered bythe Irish Government are no more than is necessary to match the lavishinducements offered by Northern Ireland. For some highly efficientfirms the inducements offered, particularly exemption from taxes onexports, have probably been more than the minimum needed to attractthem. But these are generally firms of international standing who makea substantial contribution to development in many ways, not least inattractinr others by their success.
93 ~ hc~fnr nagricultuire must. qlson be seePn in t.he light, oflarge-scale subsidies paid by the United Kingdom, and again in thennprntion ef n Pvrn more in inrnmq qr.qtPr of quiiP in Northern
Ireland. Ireland's main market for food is in the United Kingdcm andnrniction os+q have to be kePt down +n those made nonsible by sub-.sidies in that country.
94. Subsidies for housing might seem less justified, but hereagain the nattern est.ablished clnsly folnow that of the TTited Kingdomand must be seen both in this light and as an attempt to prevent too
g e t a d -ue ge c of ~ nnn"nrn4 r' rv 4 +i nV)I + 111M 4-T.7-, 11n?~,;~' a
Although subsidies may be regarded as a device to initiate progress,
11. oru ULi~ U.L~ U J. ~U U.L LJ4 U1jV ±i~l U peIJ~iU IU. ne a1 i~J
expenditure on roads may be somewhat larger than is needed at thepresnt tme. The Irish Government is now endeavouring to evaluatethe economic returns obtained from public expenditure in various fields,including expenditure on agricultural development.
- 25 -
IV. ASSESSMENT OF THE CURRENT SITUATION
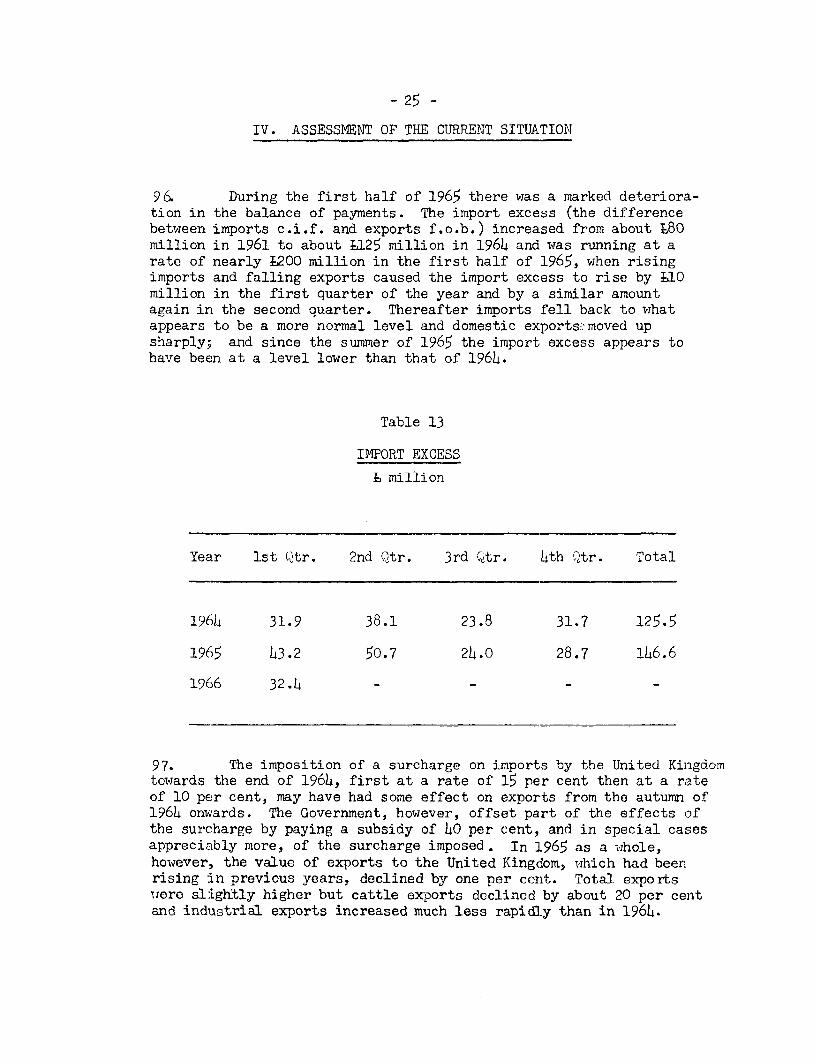
96. During the first half of 1965 there was a marked deteriora-tion in the balance of payments. The import excess (the differencebetween imports c.i.f. and exports f.o.b.) increased from about L80million in 1961 to about 1125 million in 1964 and was running at arate of nearly L200 million in the first half of 1965, when risingimports and falling exports caused the import excess to rise by L10million in the first quarter of the year and by a similar amountagain in the second quarter. Thereafter imports fell back to whatappears to be a more normal level and domestic exports.:moved upsharoly; and since the summer of 196q the imnort excess annears tohave been at a level lower than that of 1964.
Table 13
IMPORT EXCESS
b million
Year 1st Qtr. 2nd Qtr. 3rd Qtr. 4th Qtr. Total
1964 31.9 38.1 23.8 31.7 125.5
1965 43.2 50.7 24.0 28.7 146.6
1966 32.4 - - - -
97. The imposition of a surcharge on imports by the United Kingdomtowards the end of 196, first at a rate of 15 per cent then at a rateof 10 per cent, may have had some effect on exports from the autumn of1964 onwards. The Government, however, offset part of the effects ofthe surcharge by paying a subsidy of 40 per cent, and in special casesappreciably more, of the surcharge imposed. In 1965 as a whole.however, the value of exports to the United Kingdom, which had beenrising in previous years. declined by one ner cent. Total ex-ortswere slightly higher but cattle exports declined by about 20 per centand industrial exDorts increased much less ranidlv than in 1961.

- 26 -
98. Ireland's competitive position in export markets may alsohave been affected by the increase of 12 per cent in wage rates givenin the early part of 1964. Although initially the effects of thismay have been of some significance, they should have diminished withtime as wage increases in other countries caught up and as product-ivity increased. Over the two years 196 and 1965, which include the12 per cent wage increase, wage costs per unit of output rose by only4-3/ Der cent in Ireland compared with 5-3/4 per cent in the UnitedKingdom.
99. Foreign currency reserves, as might be expected, reflectedthe deterioration in the balance of payments in 196h-65 and fell byabout E40 million in the first half of 1965. The loss of reserveswas seen to call for corrective measures to restrain demand. Govern-ment expenditure and borrowing from the banking system was rising andlarge wage claims were also feared. These considerations led theGovernment to introduce a series of measures designed to reduce demand,as announced hv the Prime Minister on July 13- 1965. The most imnort-ant were a cut in planned Government capital expenditure of approxi-mately X._ million on the rrnt. hiriet. nrnvision_ the imnonit.ion of
an import surcharge on a limited range of imports, and the introductionof oredi+. rs+.rictinn The t+.nk the form of an instrt.ion from
the Central Bank to the commercial banks that lending during the ninemonths ending December 31 1QAC later extended to the yea endingMarch 31, 1966, should not expand as rapidly as during the year ended
kjf ULILta4 tJ. v-1L±O X ,fL_ .dll ULS u1 .i. v actoLdS ± .I4.
severity as time went on. It may be seen from Table 8 above that in
10 per cent although the need for credit does not fall at this period of-L1_L - -UU 7- 4-1 .~ 'I [ I L ± U UJ 1 ule samIe pe-4 1 -L, U 4-U
here there is normally a considerable seasonal expansion in requirements.redit extended to the Government, on the other hand, had by the enu U
January 1966 risen to a level four times as high as in any previouslar.iuary.
4 per cent in each of the previous two years. The reduction in therato expann occurred both in agriculture and in industry. Terewas a fall in crop output in 1965. The effect of this was to reduceUne IUnUreae in unr uy UIe per cent compareu wira wnat would navehappened if agricultural output had increased in line with previoustrenus.
102. industrial production continued to rise but the rate ofincrease in production measured in relation to the correspondingquarter of the previous year declined quarter by quarter from mid-1964 to the end of 1965.

- 27 -
1U.. In March 1966 further steps were taken. The banks wereinstructed not to increase their lending by more than 6 per cent inthe coming year. In the budget as already described taxation wasincreased sharply. There was a considerable increase in duties onbeer, spirits and tobacco, a 25 per cent increase in the road taxon private vehicles, an increase of four pence a gallon on petroland diesel oil (excluding diesel oil for buses), and an increase ofeight pence on the standard rate of income tax, bringing it up toseven shillings in the pound. The adjusted current account surpluswas budgeted to increase fron 5,14 million to 124 million as a resultof taxation increases.
104. The developments in 1965 and 1966 clearly illustrate thedifficulties that are liable to arise from time to time in attempt-ing to achieve a high rate of growth of an economy as dependent onexternal transactions as that of Ireland. At times it is necessaryto reduce excess demand and even curtail demand to prevent balanceof payments difficulties, but such policies can reduce production andgrowth potential. Determination is required both in imposing re-strictions when needed and in taking steps to resume expansion whenthere is scope to do so.
V. THE RV1TT.TTTON nR TU-HE PMTOAV TUPTT. 1 970
105. The Government is still hoping that the output targets setfor 1970 can be attained, although this ill entail an accelerationin the rate of growth to an average of 5 per cent per annum duringthe four years 1967-70 inclusive, but believes this depends on asubstantial inflow of capital.
106. There are a number of ways in which the evolution of theeconom- has deviated from that exnected in the Second Proqrmnme.which is, in consequence, being reviewed by the Government. Themost. imnortnnt deviations from the Prornmme arp the fAilurp toattain employment targets; the fact that output has risen moreslowly than planned; evidence that the planned rate of investmenthas had to be raised; and the fact that both imports and exportshave deviated from the .lan with the result that the deficit inthe current balance of payments has been greater than projected.Durinr the nre.ent. Pro.ramnp there has been little chann in Pmnlov-
ment, but net emigration has declined somewhat and per capitainnomp- hq.q rispn.
- 28 -
107. If the political decision were taken to accelerate economicdevelopment so as to find employment for many who now emigrate, dif-ferent policies, including a much larger investment programme (byabout LEO - L100 million per year, largely in industry) than at pres-ent contemplated would be needed, and the whole development programmewould have to be radically changed to aim at a growth rate of, perhaps,6 per cent per annum of GNP. There would be even greater need toattract foreign entreoreneurs and foreian capital to Ireland. evenmore emphasis on training labour for industry, greater efforts toincrease public savings and to contain public consumption. Therewould be a clear need for increases in taxation and for restraintin thp rAnourRP to mihidi nd tax Pximntions as instruments ofpolicy, etc.
108. In looking forward to future developments no such shiftsin poli cy-x are mcnnsue andi antionArn is confimr+ne snyeqrnirifon ofthe implications of achieving the Second Programme targets.
109. The Irish economy has shown no signs of having exhaustedit ecoomi potential fo m~pid growth ada rat of pow t+h ofper cent per annum or even higher should be possible. It will, how-evr, knnnecessa,r.-y.- t
4 giveatte4n+ f
4n k +-4-,4- vi,,,nl rAer
ensure that suitably skilled workers are available for those indus-4-. r, LJ a" -; s J' U4- sL/ wh L L J 14 U. UL O.L. ULIU-L.L U/VTL V LJ W .LLL.
Government has taken the first steps towards establishing a trainingprogramme and has set out -th itsue JJUJQ5 VU&U
-A-- ob[ugl[i gh t appears trda ULM~ L.C.Ldi iuVaiu"Fly .Lb vuia.L±iuig
competitive with that of neighbouring countries and in particularte UniteU finguom, au the increase in the cot of living it mod-
erate, there is still anxiety about future wage increases. TheincUence of StriKes has Oeen increasing and pressures for majorwage increases have been growing. In April 1966 it seemed clearthat weekly earnings would increase by about 9 per cent, althoughthe average for the year might be less if awards were not retro-spective. High as this might seem, it does not appear to be muchout of line with that expected for many other European countries,and consumer prices should also Keep in line.
111. The prospects for industrial development are good, andcondition future progress in large measure. Industrial output hasbeen growing at the rate of 8 per cent per annum in previous yearsand there is no reason why it should not continue to grow at thisrate in the future, as recent discussions with industrialists haveconfirmed.
112. The increase in industrial output would be assisted ifmore foreign firms could be persuaded to start manufacturing inIreland. With the incentives offered, the operations of manyinternational firms have been very profitable and there does not
- 29 -
appear to be any need to increase these incentives. The operationsof the Industrial Development Authority might be extended at littlecost to bring the advantages of Ireland as an industrial locationto the notice of a wider circle of industrialists.
113. The Second Programme called for an increase of 3.6 percent per annum in gross agriculture output (including turf) and2.7 per cent per annum in net output. Attaining this would requirea growth rate of 3.9 per cent per annum in the period 1964-70.This would mean a major jump in annual growth rates above previouslevels.
114. The continuation of the current agricultural improvementprogrammes is of major importance in continuing to provide incent-ives for further investments. However, certain major questionsremain, such as, what additional steps are going to be taken toprovide more adequate fodder supplies for winter, and how thepresent credit squeeze on agriculture is to be resolved. The pro-jected acceleration is, therefore, in doubt.
111. In view of the new Free Trade Agreement with the UnitedKingdom, the market prospects are better than ever before. ...If.however, the production targets are not fully achieved, the effectwill be felt mainly on exports, for almost all of the increasedproduction is destined for export.
116. It is difficult to gauge the prospects for the servicesector: outnut there has risen rather slnwlv in the naAt.hut.
as other forms of output and incomes increase, the demand for ser-vires should exrand anr in inrrAn.q of 1 per cent per annum (an-preciably less than the average increase of industry and agricul-
may- Theasezsedinvtbular oftheosc of trhe m:caecmay be summarized in tabular form:
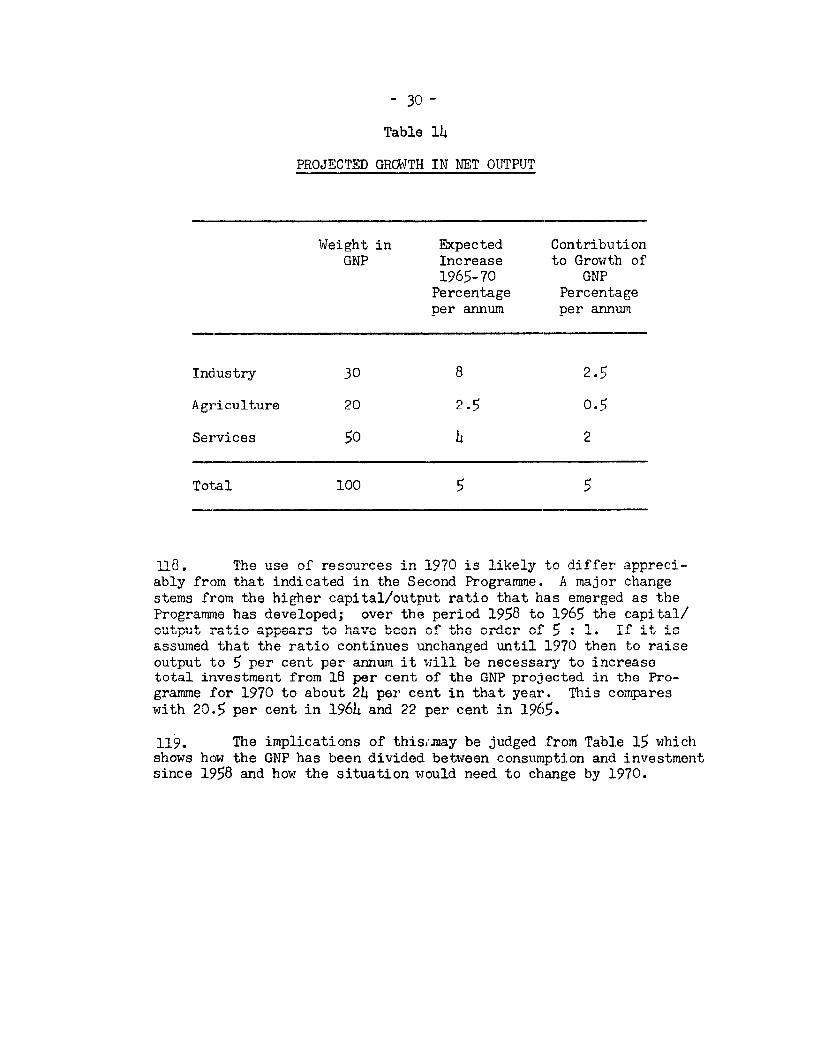
- 30 -
Table 14
PROJECTED GROWTH IN NET OUTPUT
Weight in Expected ContributionGNP Increase to Growth of
1965-70 GNPPercentage Percentageper annum per annum
Industry 30 8 2.5
Agriculture 20 2.5 0.5
Services 5O 4 2
Total 100 5 5
118. The use of resources in 1970 is likely to differ appreci-ably from that indicated in the Second Programme. A major changee+n Prom +hn h4her npi4+al/opatn+ a +ha+ he aenargA +ho
Programme has developed; over the period 1958 to 1965 the capital/ou+pu+ ra+4 appears +o have beann +a ofth Ane , P o : 1 T' 4+ 4 s
assumed that the ratio continues unchanged until 1970 then to raise
output to 5 per cent per annum it will ve necessary to icasetotal investment from 18 per cent of the GNP projected in the Pro-gwmMa fr 1070 +o abn+u . pa na+ 4 +ha+ yan This compsrewith 20.5 per cent in 1964 and 22 per cent in 1965.
119. The implications of thisc.may be judged from Table 15 whichsnw how the si unu at ivn wod ween onsumpton bny 19vesmentsince 1958 and how the situation would need to change by 1970.
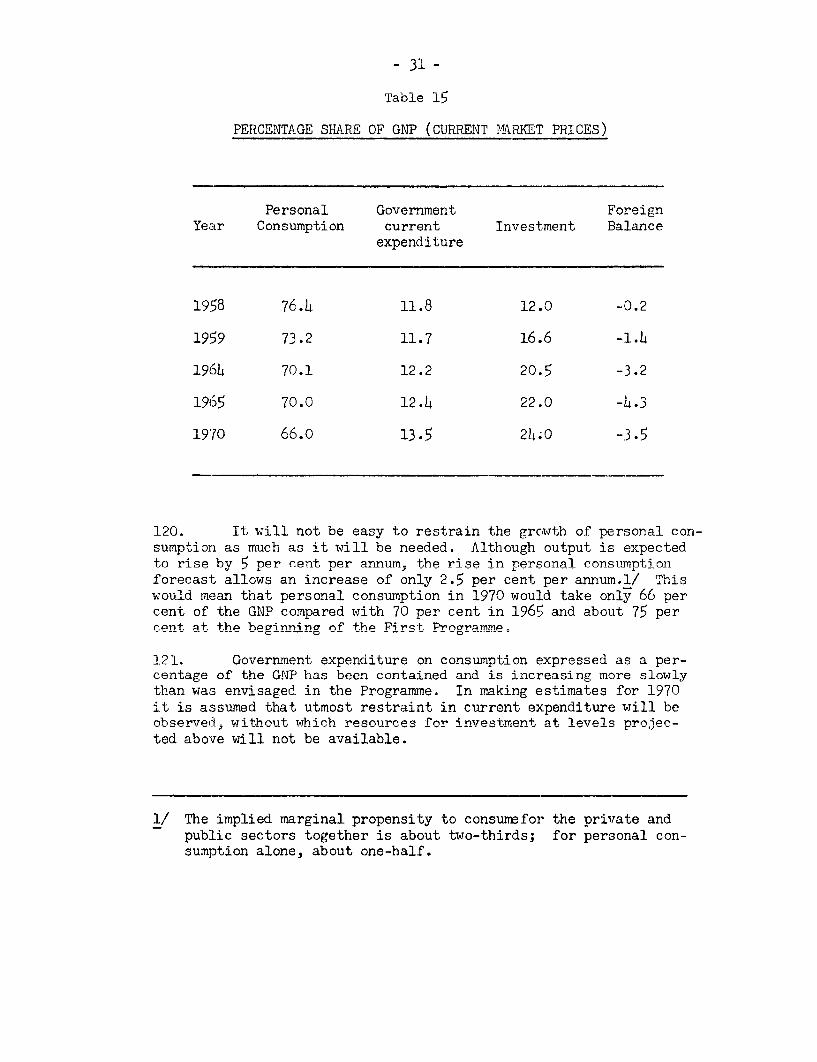
- 31 -
Table 15
PERCENTAGE SHARE OF GNP (CURRENT MARKET PRICES)
Personal Government ForeignYear Consumption current Investment Balance
expenditure
1958 76.4 11.8 12.0 -0.2
1959 73.2 11.7 16.6 -1.4
1964 70.1 12.2 20.5 -3.2
1965 70.0 12.4 22.0 -L.3
1970 66.0 13.5 24.0 -3.5
120. It will not be easy to restrain the growth of personal con-sumption as much as it will be needed. Although output is expectedto rise by 5 ner cent ner annum. the rise in nersonnal consumnti onforecast allows an increase of only 2.5 per cent per annum.l/ Thiswould mann that nersonal consnmntion in 1970 would take only A nPrcent of the GNP compared with 70 per cent in 1965 and about 75 percent at thi hiinning of' fhp First. Prornmmp.
121. Government expenditureon cnumption exresled s ap nor-
centage of the GNP has been contained and is increasing more slowlythan was envi.qqaP in the Proarnmme. Tn mnking estimates for 1970it is assumed that utmost restraint in current expenditure will beahmarved, without which reconrron foa i nvestmpn+.at levels proe-ted above will not be available.
c/ n Intrs toenter , r +In persna+ n-public sectors together is about two-thirds; f'or personal con-
.. , . ,-, l- .rn+ r,, 11 ol

- 32 -
122. As shown in Table 16, gross domestic savings before deduct-ing provision for depreciation increased from 12 per cent of GNP atthe beginning of the First Programme to between 17 and 18 per cent in1964 and 1965, and they are expected to increase to about 18.7 percent in 1966.
Table 16
INVESTMENT AND DOMESTIC SAVINGS AS A PERCENTAGE OF GNP
1958 1959 1960 1961 1962 1963 1964 1965 1966 1970Esti- Fore- Pro-matedA cast jected
Total Capital 12.1 16.6 14.8 16o1 17.9 192 '.3 206 20 1 40formation
Foreign balance -0.2 -1.4 -0.1 +0.2 +1.6 -2.7 -3.3 -4.3 -2.6 -3.5
Domestic savings 11.9 15.1 14.7 16.3 16.2 16.6 17.2 17.6 18.7 20.5
'Net' domestic
savings l/ 6.2 9.3 8.8 10.1 9.6 9.9 10.8 11.1 11.8 13.0
123. ±LTe1I1JLdLU imlcain of 1 the U~ prjetons~ for 170 are that t otld
gross investments of 24 per cent of the GNP will be financed to theextent of 20.5 per cent by domestic savings, the balance of 3.5 percent having to be financed by net capital imports.
124. The increase in the saving ratio so far realised is mostencouraging and exceeds by a handsome margin the original projectionsmade in 1963. While in the Second Programme it was expected that sav-ings would rise to 17 per cent of the GNP only in 1970, this level wasin fact reached in 1964.
1/ Excluding depreciation allowance

125. Domestic savings will have to rise to some 20 per cent ofthe GNP in 1970 if the projections are to be realised. The estimatesprepared for 1970 assume that financial policies will be directed toincreasing savings. Corporate savings are low in relation to personalsavings, though it is anticipated that as industrialisation proceedsthey will increase. An increase in savings in the next five yearswill require an increase in taxation and in the budget surplus. Thiscan be done by increasing taxation rates as incomes rise, but newsources of revenue will also have to be developed, and this will inany case be needed to replace the loss that will result from a reduc-tion in customs duties, in forming the free trade area with the UnitedKingdom. It must be recognised that even with restraint in Governmentexpenditure as assumed above, public savings can increase by the re-quired amount only if tax revenues increase more than in proportionto GNP.
126. Even with the operation of policies firmly directed to in-creasing savings it appears that domestic savings will be inadequateto finance domestic investment. The projections show that a gapequivalent to 3.5 Der cent of the GNP is likely to emerge.
127. A gan of this order is also indicated in nrolections of thecurrent balance of payments prepared by the Department of Finance forour 11R.
Table 17
ESTIMATED SUMMARY BALANCE OF CURRENT PAYMENTS -
CURN ACCOUNTL' -
Year Fxports Imports DefIcItVisible Invisible Total Visible Invisible Total
_LJ, f~L .LL V)L4 I LI ~ L4 C- J 1
-I Q~L rr% nn -10 nO-LYUU O 1$2' LUUJ 14CU uoI. 4"'U r- UI
.>'U ( 2(L 7 ±UU 4UVJ 42UO 14 ",-U
19609 3 61 203 56h 4 522 0o 02 380
1970 01 212 630 "93 92 675

- 34), -
They assume that the export targets for agriculture laid down in
doubts have been expressed above. On the other hand, the projected
these differences will tend to offset each other, leaving thed fiitL~~ rising fro U2 milA.lionL in 1966, year bJy yea wih increasf±
ing pressures of development, to 145 million in 1970.
129. The conclusions to be drawn from this forecasting exer-cise can be summarized as follows. A increase in output of soM"
5 per cent per annum to 1970 is feasible. The level of domesticsavings, based on current policies, is unlikely to be adequate tofinance the investment needed. A net foreign capital inflow ofsome 0)4 million would roughly correspond to the anticipated deficiton the current balance of payments. How this could be financed isdiscussed after considering Government financial requirements forthe capital budget.
130. Government financial requirements are closely related tothe expansion of public capital expenditure. This proceeded rapidlyfrom 1958 onwards and led the Government to seek financial resourcesfrom the banks on a large scale at the same time as the privatesector of the economy was also in need of rapidly increasing financialaccommodation. Restraints were enforced that seriously affected theextension of credit to the private sector as described above.
131. In 1966-67 when the capital programme was approximatelylOO million it was necessary to budget for L28 million to be foundfrom the Irish banking systam and foreign borrowing. If, for ex-ample, no change were to be made in the pattern of financing ofcapital expenditure this requirement might well increase to135 million in 1970.
132. It should be within the resources of the banks to pro-vide 10 million of the L35 million required without impairing theirability to lend to the private sector. It would also be reasonableto suppose that perhaps bl5 - L20 million could be raised by in-creasing taxation beyond what would be required to meet risingcurrent expenditure.
133. This would mean that in 1970 up to L10 million might haveto be sought by the Government from overseas sources though it is,of course, impossible to be precise about this. In recent years itappears that on balance foreign capital investment has amounted to125 million per year. By 1970 the nrivate sector's need for forei2ninvestment might rise to 35 million requiring an additional inflowof WO million.
- 35 -
134. Until recently Ireland had, during the post war period, madelittle resort to the external capital market to finance Government in-vestment. Two Marshall Aid loans made in 1948 and 1950 accounted forthree quarters of the external public debt outstanding at the end oflast year. At the beginning of 1966 L7 million was raised by a publicissue. Ireland has not borrowed from the Bank and until the late1950's, when investment was increased with the expansion of the economyin association with the First Programme of Economic Development, Irelandwas regarded as a potential source of funds for public investment else-where rather than a possible borrower from the Bank. Including the re-cent public issue, peak service payments on the present external debtamount to some 2 per cent of export earnings. The scale of externalpublic borrowing contemplated in this report should not, therefore, pre-sent servicing difficulties. Furthermore, prospects for increasing ex-ternal earnings are good.
134. Although Irish economic policies stress rapid growth, empha-sis is also placed on competitive ability and on maintaining a strongbalance of payments position. Ireland, with its many other advantagesof efficient public administration, political stability and a dynamicbusiness community is, therefore. likely to rate as highly creditworthywhen it borrows externally. The free trade association now being es-tablished with the United Kinpdom offers onnortuni-tie for Trish indus-trialists whilst securing traditional markets for the farmers. To takeadvantge of +.hse nrnnor+aunitAiP A -nntinued inflnw of PYtPrnal anitalis likely to be needed both by the Government and private undertakings.Normally Trpland should he ahle t.rn rni.q fnni. rprnirpd Pv+.Prnalv onprivate capital markets. If the generally tight situation in the worldcapitajl rrn-rc+.,z rnncrnt-i v T-rel-nnr mri+ nino-rlsr +nr rn~mc +*rn +)io PnL Fin-ance provided by the Bank would replace funds ordinarily to be expectedto be raiSed in the market and Should therefOre, be prOvi t marketrates.
THE ECONOMY OF IRELAND
Statistical Appendix

CIM A T,-rCMT n'AT A nnL~TnTV
.ULst±L)~ k - .1Z a'D- L A
Aal to 5: NKElUNAL AU;UUUNTS
A.!: National income and GNP: 197 to 196o.
A.2: Expenditure of GNP by Categoriesin constant (1958) prices.
Percentage annual changes 1958to 1965,
A3: Expenditure of GNP by Categories in currentprices: 1958 to 1965.
A.h: Capital Formation and its Financing: 1958 to 1965.
A,.5: Flow and Use of Savings: 1958 to 1964.
B.1 and 2: IFDUSTRY
B,l: Volume of Production by Major IndustrialGroups: 1958 to 1965.
B.2: Net Output Growth Rates of Industry: 1961to 1970.
C.1 to 14: AGRICULTURE
C,1: Size Distribution and Total Number of ARri-cultural Holdings.
C,2: Land Use.
C.3: Volume Indexes of Agricultural Output.
C,4: Number of Cattle.
C.5: Value of Exports of Principal AgriculturalEx'oort Products.
C.6t Price Indexas of Agrinltural Products andInputs,
C.7: Yields per Acre.

C.8: Consumption of Fertilizers in terms of N,
F2 O5 and K20.
C.9: Output of Compound Feeds.
C.10: Number of Selected Agricultural Machines andImplements on Farms.
C.11: Agricultural Credit Outstanding by Main Sources.
C.12: Lending by Agricultural Credit Corporation Ltd.
C.13: Government Expenditure Related to Agriculture.
C.14: Functionc-lBreakdounof Agricultural CapitalExpenditures.
D.1 to 3: TOURISM
D.l: Number of Foreign Tourists: 1957 to 1965.
D.2: Income from Tourism and Travel: 1957 to 1965.
D.3: Hotel and Guest House Receipts: 1957 to 1965.
E.1 to 3: TRADE AND PAYMENTS
E.l: Imports and Exports by Main Categories: 1960
B,, 2: C alnc of I.0 nternationa-l Pa-7 ts -96 to --1965.
E..3: Balance of Payments on Current Account: 1960,
p.1: uoDOilQaueG ouLaiemenb 01 Aiseb anQ £LilbJ.e8of Banks: December, 1960 to March, 1966.
F.2: Associated Banks' Outstanding Credits by Type
of Borrower: January, 1959 to January, 1960.
F.3: Indicators of Prices and Wages: 1953 to 1965.

G.1 to 5: PUBLIC FINANCE
G.l: Central Governmental Current Receipts and Ex-penditures: 1958/59 to 1966/67.
G.2: Capital Expenditures of ,entral Government,Local Authorities and State Bodies: 1958/59to 1964/65.
G.3: Receipts and Expenditures of Local Authorities:1958/59 ro 1964/65.
G.h: Financing of Public Sector C.pital Expenditures:1958/59 to 1966/67.
G.5: Categories of Expenditures on Roads and Sourcesof Finance: 1955/56 to 196L/65.
H. 1 and H.2: EXTERNAL PUBLIC DEBT
H.1: External ledium- and Long-Term Public Debt Out-.q+.nnrii nrd Iin d c, TInrIichiirqP.H q r)f PPm.him r 'A11965 with Major Reported Additions January 1 -Mifnrrh 11 1 CAA
N. 29 Estj IfAe Co rntractuaIIA ServiceP PAyIMents. on T-._')r.PrnnI.edium- and Long-Term Public Debt OutstandingInoluding Undisbured son Decrhr 31 1ac withLiajor Reported Additions January 1 - '!arch 31, 1966.
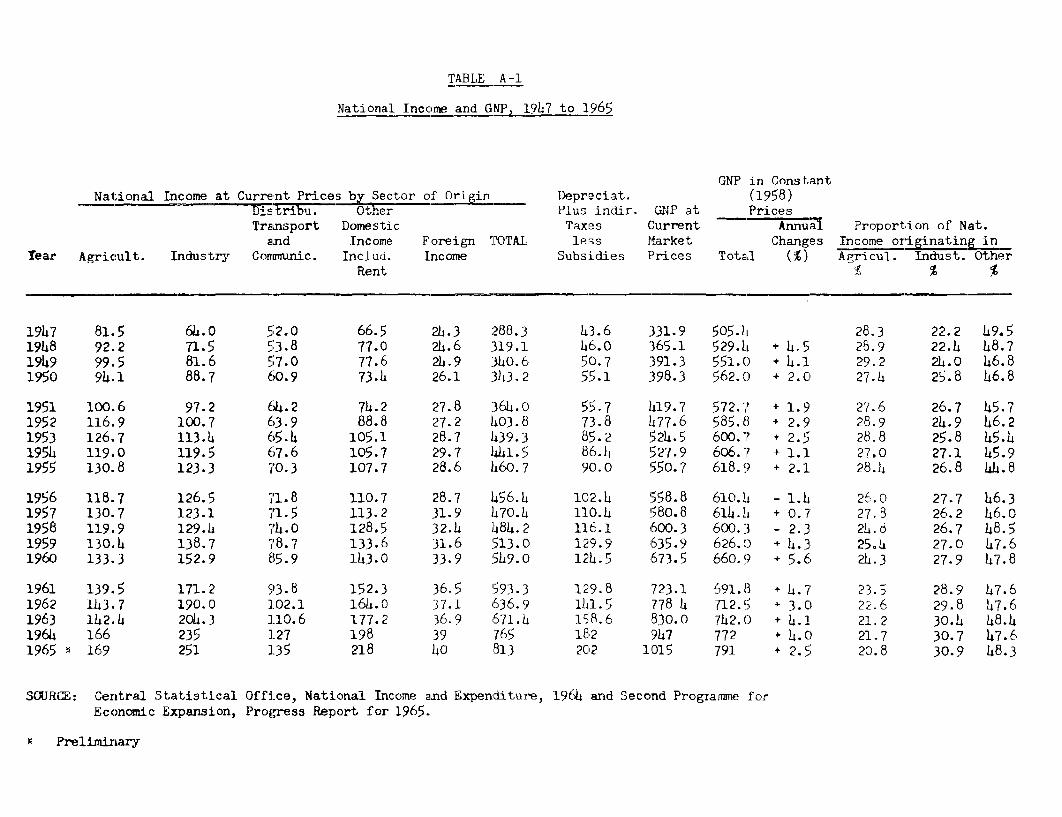
TABLE A-1
National Income and GNP 1947 to 1965
GNP in ConstantNationa1 Income at Current Prices by Sector of Origin Depreciat. (1958)
DDistribu. other Plus indir. GNP at PricesTransport Domestic Taxes Current Annual Proportion of Nat.
and Income Foreign TOTAL less Market Changes Income originating inYear Agricult. Industry Cormunic. Includ. Income Subsidies Prices Total (M) Agricul. Indust. Other
Rent %
1947 81.5 64.D 52.0 66.5 2h.3 288.3 43.6 331.9 505.4 28.3 22.2 49.51948 92.2 71.5 53.8 77.0 24.6 319.1 46.o 365.1 529.1 • h.5 28.9 22.4 h8.71949 99.5 81.6 57.0 77.6 2h.9 36o.6 50.7 391.3 551.0 + .1 29.2 2h.0 6.81950 94.1 88.7 60.9 73.h 26.1 343.2 55.1 398.3 562.0 + 2.0 27.4 25.8 46.8
1951 100.6 97.2 64.2 71.2 27.8 364.0 55.7 419.7 572.7 + 1.9 27.6 26.7 45.71952 116.9 100.7 63.9 88.8 27.2 403.8 73.8 477.6 585.8 + 2.9 28.9 2h.9 h6.21953 126.7 113.4 65.4 105.1 28.7 439.3 85.2 524.5 500.7 2.5 28.8 25.8 45.4195h 119.0 119.5 67.6 105.7 29.7 441.5 86.4 527.9 606.7 + 1.1 27.0 27.1 45.91955 130.8 123.3 70.3 107.7 28.6 h6o.7 90.0 550.7 618.9 + 2.1 28.4 26.8 44.8
1956 118.7 126.5 7,1.8 110.7 28.7 h56.h 102. 4 558.8 610. ± - 1.4 26.0 27.7 h6.31957 130.7 123.1 71.5 113.2 31.9 470.1 110.1 580.8 61h.h • 0.7 27.B 26.2 h6.01958 119.9 129.1 74.0 128.5 32.4 484.2 116.1 600.3 600.3 - 2.3 21.8 26.7 48.51959 130.1 138.7 78.7 133.6 31.6 513.0 129.9 635.9 626.0 + 4.3 25.4 27.0 7.6196) 133.3 152.9 85.9 143.0 33.9 519.0 12h.5 673.5 660.9 + 5.6 21.3 27.9 h7.8
1961 139.5 171.2 93.8 152.3 36.5 593.3 129.8 723.1 591.8 + .7 23.5 28.9 47.61962 1h3.7 190.0 102.1 16h.0 37.1 636.9 1å1.5 778 h 712.5 3.0 22.6 29.8 47.61963 142.4 204.3 110.6 177.2 36.9 671.å 158.6 B30.0 742.0 + .1 21.2 30.4 48.41964 166 235 127 198 39 765 182 947 772 +h.c 21.7 30.7 47.61965 * 169 251 135 218 ho B13 202 1015 791 + 2.5 20.8 30.9 48.3
SOURCE: Central Statistical Office, National Income and Expenditure, 1964 and Second Progra,me for
Economic Expansion, Progress Report for 1965.
* Preliminary
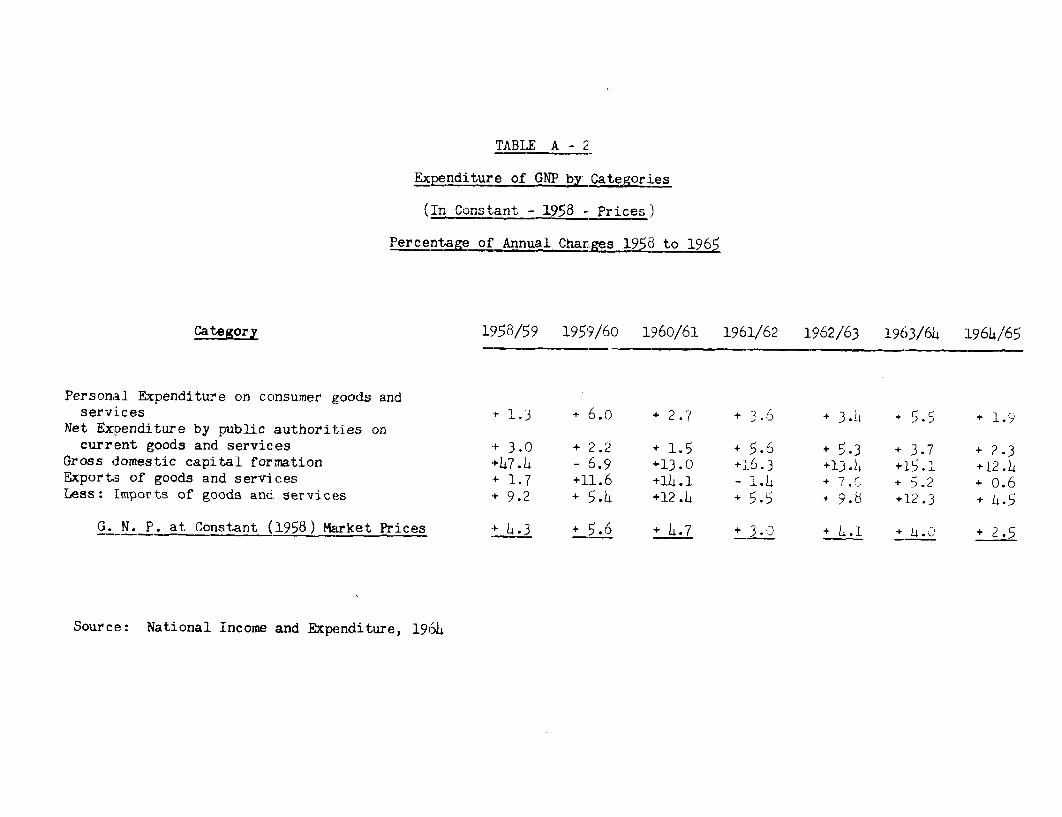
TABLE A - 2'
Exnditure of GNP_byCategoies
(In Constant - 1958 - Prices)
Percentage of Annual Changes 1958 to 1965
2ategoE 1958/159 1959/60 1960/61 1961/62 1962/63 1963/64 1964/65
Personal Expenditure on consumer goods andservices + 1.3 + 6.0 + 2.7 + 6 + 3.L + 5.5 + 1.9
Net Expenditure by public authorities oncurrent goods and services + 3.0 + 2.2 + 1.5 + 5.6 + 5.3 + 3.7 + 2.3Gross domestic capital formation +47.L4 - 6.9 +13.0 +16.3 +13. +1.1
Exports of goods and services + 1.7 +11.6 +14.1 - 1.h + 7.Q + 5.2 + 0.6Less: Imports of goods and services + 9.2 + 5.4 +12.L + 5.5 + 9.8 +12.3 + L.5
G. N. P. at Constant (1958) Market Prices + h.3 + 5.6 + 4.7 + 3A + .1 + L.C + 2.5
Source: National Income and Expenditure, 1964
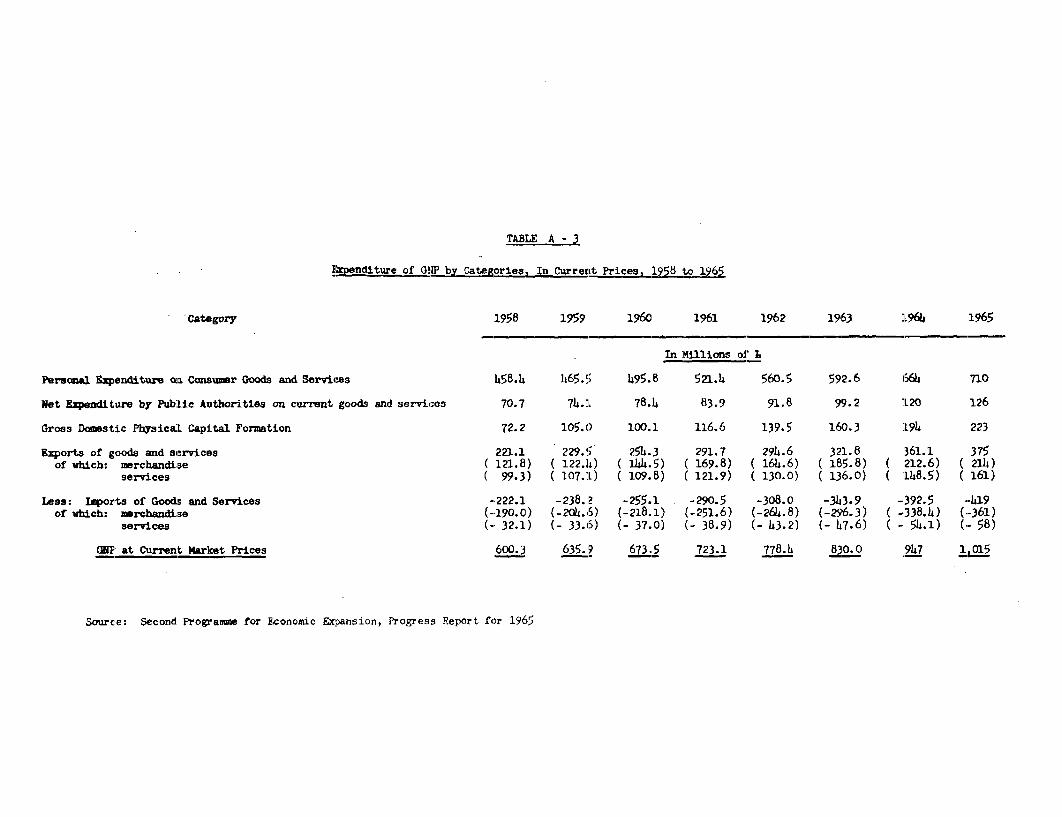
TABLE A -
perwditure of GNPb2 Categorie, In Current Prices, 1958 t
Category 1958 1959 1960 1961 1962 1963 L964 1965
In Millions of L.
Persaonal Expenditure on Consuvmer Goods and Services 658.4 465.5 495.8 521.h 560.5 592.6 664 710
Net Expenditure by Public Authorities on current goods and services 70.7 74. 1 78.4 83.9 91.8 99.2 120 126
Gross omestic Physical Capital Formation 72.2 105.0 100.1 116.6 139.5 160.3 194 223
Exports of goods and services 221.1 229.5 254.3 291.7 294.6 321.8 361.1 375of which: merchandise ( 121.8) ( 122.14) ( 1IJ.5) ( 169.8) ( 164. 6 ) ( 185.8) ( 212.6) ( 214)
services ( 99.3) ( 107.1) ( 109.8) ( 121.9) ( 130.0) ( 136.0) ( 148.5) ( 161)
Leas: Imports of Goods and Services --222.1 -238.2 -255.1 -290.5 -308.0 -343.9 -392.5 -4l9of which: merchandise (-,190.0) ( -204. 6 ) (-218.1) (-251.6) (-261.8) (-296.3) ( -338.4) (-361)
services (- 32.1) (- 33.6) 37.0) (- 38.9) (- U3.2) (- b7.6) ( - 54.1) (.- 58)
GNF at Current Market Prices 600.3 635.9 673.5 723.1 778.4 830.0 947 1 015
Source: Second Prolramme for Economic Expansion, Progress Report for 1965

Table A - 4
apital Formation and Its Financing: 1950 to 1965
( mill 'urrent Prices)
1958 1959 1960 1961 1962 1963 1964 1
Gres Domestic Fixed Capital Formation 79.9 82.8 89.8 108.7 128.9 19.0 176 198Value of Changes in numbers of livestock on farm + 3.2 +11.0 + 1.7 3.1 + 4.0 + '3.6 +10Increase in value of non--agricultural stocks ) +29
and work in progress -11.6 +11.0 + 9.8 +13.8 +10.6 +11.4 +18Adjustnent for stock appreciation + 0.7 + 0.2 - 1.2 - 2.8 - 4.0 - 3.7 -10 - 4
Total Gross Domestic Physical Capital Formation 72.2 105.0 100.1 116.6 139.5 160.3 196 223
Of which Public Authorities * (16.9) (17.4) (17.9) (21.9) (25.6) (30.2) (37)
Less Foreign Saving (Deficit in balance ofpayments current account) - 1.0 - 8.7 - 0.8 + 1.2 -13.4 -22.1 -31-
Eals Domestic Financin 71.2 96.3 99.3 117.8 126.1 138.2 163 179
Of which Provisions for Depreciation 33. 36.8 39.6 4L.5 51.2 55.7 61 67Savings - of which 37.0 59.3 60.9 76.1 78.,9 86.2 112
Company Savings (11.4) (12.3) (22.3) (22.h) (22.8) (24.9) 29 )Public Authority Savings ( 7.1) ( 4.7) ( 1.9) (-1.2) (-1.5) ( 5.7) 2 ) 116Personal Savings (18.5) (42.3) (36.7) (54.9) (57.6) (55.6) 81 )
Adjustment for stock appreciation + 0.7 0. 2 - 1.2 - 2.8 - L.0 - 3.7 _10 - 4
Source: Ireland: Second Program for Economic Expansion. Progress Report for 1965
* Not comparable since saving of public authorities is computed on a fiscal year basis.
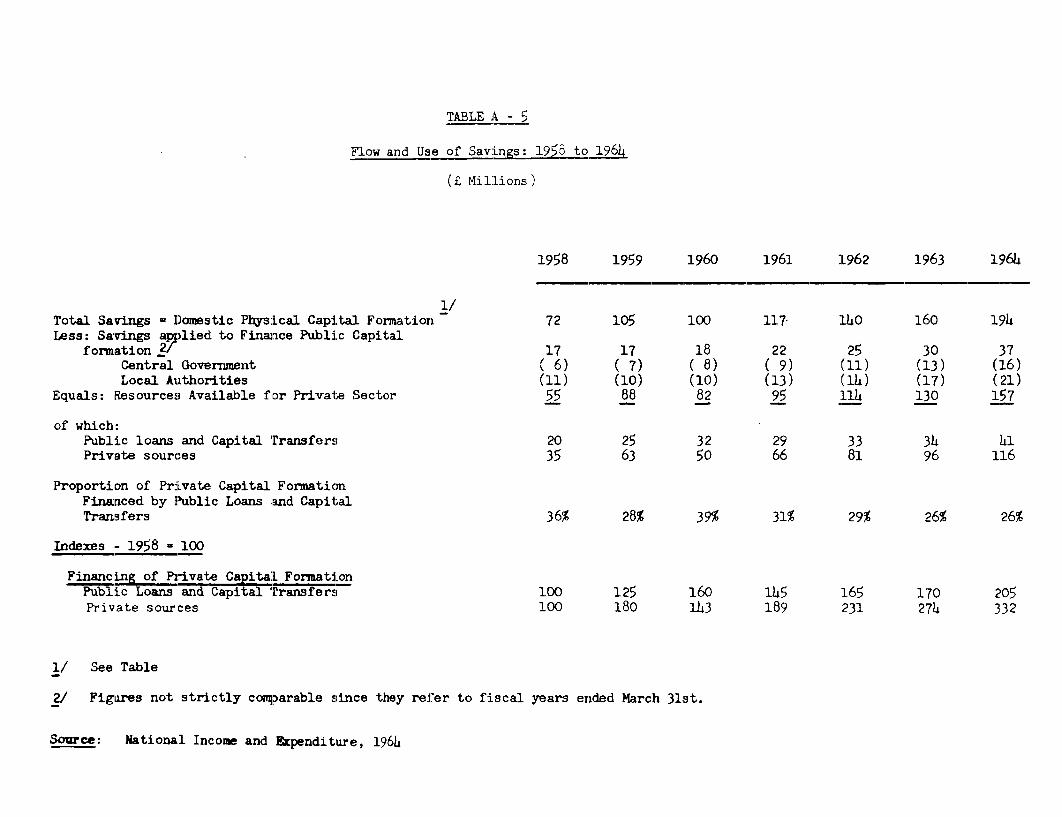
TABLE A - 5
Flow and Use of Savngs: 1958 to 19 6 )4
(z Millions)
1958 1959 1960 1961 1962 1963 196h
1/Total Savings = Domestic Phys:ical Capital Formation 72 105 100 117- 140 160 194Less: Savings a)>lied to Finance Public Capital
formation V 17 17 18 22 25 30 37Central Government ( 6) ( 7) ( 8) ( 9) (11) (13) (16)Local Authorities (11) (10) (10) (13) (14) (17) (21)
Equals: Resources Available for Private Sector 55 88 82 95 114 130 17
of which:Public loans and Capital Transfers 20 25 32 29 33 34 41Private sources 35 63 50 66 81 96 116
Proportion of Private Capital FormationFinanced by Public Loans and CapitalTransfers 36% 28% 39% 31% 29% 26% 26%
Indexes - 1958 = 100
Financing of Private Capital FormationPUblic Loans and Capital Transfers 100 125 160 15 165 170 205Private sources 100 180 143 189 231 274 332
1/ See Table
2/ Figures not strictly comparable since they refer to fiscal years ended March 31st.
Source: National Income and Ependiture, 1964

Table B.1
VOLUME OF PRODUCTION BY MAJOR INDUSTRIAL GROUPS:1958 TO 1965
Averagenumber
Industrial ofgroups persons Index Numbers (Base 1953=100)
1964Nmber 1958 1959 1960 1951 19A2 19A3 1964 1965(000)
Food 3905 89 94 98 106 l 114 119 122
Drink & Tobacco 10.3 99 99 104 109 109 109 114 117Textiles 22 2 12A 138 161 176 183 180 20A 215Clothing & footwear 22.8 98 103 112 122 130 140 158 157Wood furniture,
brushes & brooms 7.7 94 95 99 105 117 133 148 168Pae &. rnting+- 15.1 12 137 144 155 164L 169 184L 171Chemicals & chemical
Structural clay pro-
Metal & engineering(incl.transport e-quipment) 32.3 124 142 162 181 198 222 259 260Other manufacturingindustries 10.5 122 164 184 202 223 252 301 346
industries 173.7 106 115 124 135 144 151 166 172Mning & quarrying(incl.turf) 9.9 115 181 159 186 199 207 223 201Total transportablegoods 183.6 107 118 126 137 146 154 169 174
Source. Seconud rugranme W Econunic Expansion. rogress
Report for 1965, p. 95.

NKT\"I OUTPT RON'. RATES'( OF INDUTY:1.i +_ i,. cor)
Percentage rate of growth per annum
Industry Group Second
Programme Realized Forecast Required
1961/70 1961/63 1964/66 1967/70
I. Food 6.9 9.1 4.5 7.1II. Drink and Tobacco 4.3 3.9 5.3 3.7I11. Textiles 7.3 7.1 7.8 7.uIV. Clothing and Footwear 6.2 10.2 h.5 4.7V. Wood and Furniture 10.4 12.5 8.5 10.3
VI. Paper and Printing 7.0 6.2 4.1 9.7VII. Chemicals 13.0 12.6 13.2 12.9
VIII. Structural Clay and Cement 9.5 13.0 9.6 6.8IX. Metals and Engineering 11.4 12.4 8.6 12.7X. Other Manufacturing 14.6 16.2 15.6 12.6XI. Mining and Turf 11.1 7.1 17.7 9.4
XII. Building and Construction 7.2 9.9 7.2 5.2XIII. Service-type Industries 6.5 3.0 11.2 4.2
Total Manufacturing Industry(I - x) 8.6 9.5 7.4 8.9
Total Transportable GoodsIndustries (I - XI) 8.7 9.4 7.9 8.9
Total all Industries (I - XIII) 8.3 9.0 8.1 7.9
Source: Second Programme for Economic Expansion: Progress Reportfor 1965, p. 122.
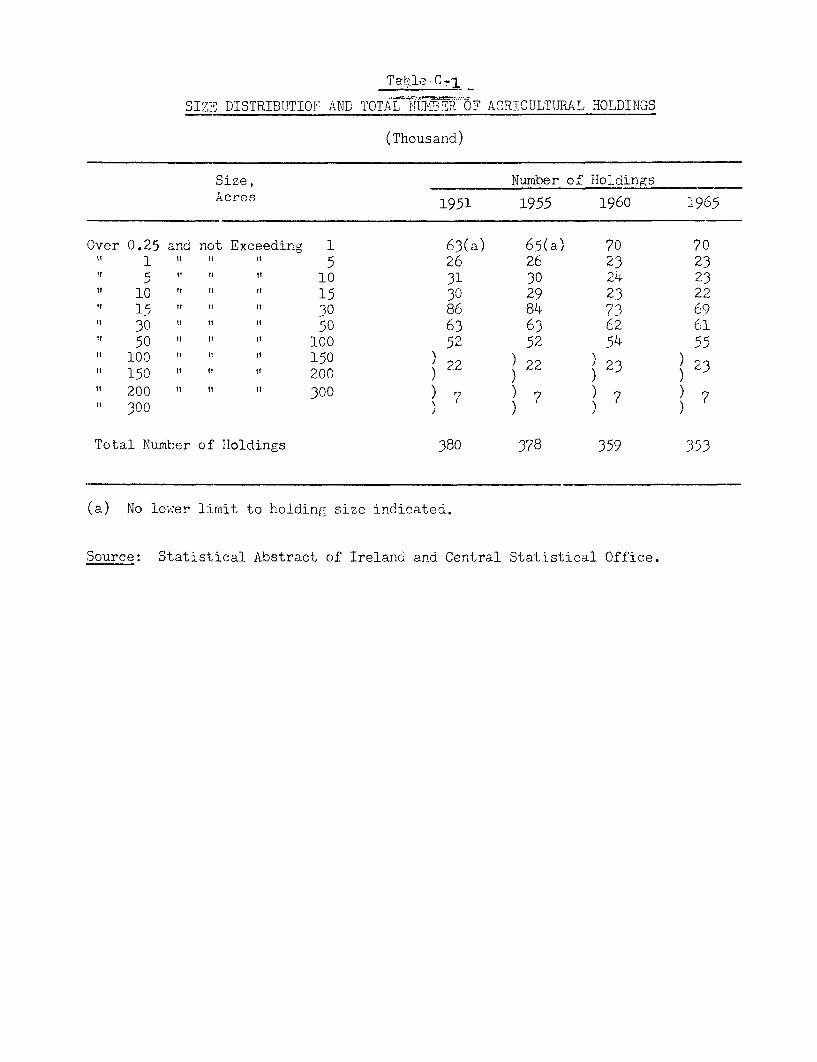
T aleC.-1
SIZE DISTRIBUTIO! AND TOTALIG T F AGRICULTURAL HOLDINGS
(Thousand)
Size, Number of HoldingsAcres 1951 1955 1960 1965
Over 0.25 and nct Exceeding 1 63(a) 65(a) 70 70" 1 I 5 26 26 23 23
5 "1 U " 10 31 30 24 2310 " " " 15 30 29 23 2215 " " " 30 86 84 73 6930 " " " 50 63 63 62 61
" 50 " " 100 52 54 5"f 100 "1 "1 " 150))))ifit i 22 22 ~ 23 ~ 23" 150 " " " 200 222232" 200 " " " 300 )7 )7 )7 7it qonl
Total Number of Holdings 380 378 359 353
(a) No low,er limit to holding size indicated.
Source: Statistical Abstract of Ireland and Central Statistical Office.

?oble C-2
LAND USE
(Thousand Acree) OronsTotal Tillage ja Y and Woods
r w1orop Root and Green Crops Crops, Corn,Root Ist Paeture and TotalBean Grass for other Root & ard Green Crops, Tsar% Other Grand flan- fther Land
Yar West Oats Barley , & Peas Total Pot es T Ps Manels het Cabbags Enslge Green Crops T fax Fit Fla & Fruita H Fasture Total tions and res
1931 21 623 116 b (0.10 763 346 182 84 5 25 2 10 654 1 7 1,425 331 1,982 7,989 11,727 236 5,o61 17,02h
Average peryar 393L-38 192 580 132 2 (0.L) 907 333 151 85 55 19 2 10 556 b 8 1,57L 271 1,910 7,981 11,635 21,6 5,11,3 17,0?,
Average per i--- -ysar 191.-e 609 863 150 8 3 1,633 392 153 85 75 15 : 23 71 26 1 2,hn1 130 1,3. 7,190 n1,561 289 0,173 1',07!
Average peryear 3939-50 321 620 172 b 2 1,122 326 129 71 60 12 27 628 10 12 1,773 379 1,572 7,865 11,599 303 5,131 17,0J
Malt-ing Fesdar- Bar-
195L 186 533 163 4 2 1,187 292 120 64 71- 9 15 33 607 2 12 1,808 329 1,5b9 7,029 1,616 331- f,071 " -,
1955 358 515 213 3 2 1,1 286 129 63 55 10 11 39 593 2 1l 1728 330 1,650 8,ooR 1,62: 311 , ro ,
1956 310 525 236 3 2 1,106 283 n9 62 59 n 13 Li 588 1 12 1,707 328 1,560 8,028 13,631 n.o. ',7? 17(
1957 106 461 106 200 2 2 1,177 266 108 57 71 - 15 51(c) 568 - 12 1,757 356 1,606 7,097 1,716 n.a. L,f 17,'
1958 19 157 0 200 3 3 1,192 263 105 5b 85 . 11. 5 3 (e) 557 - 12 1,778 328<01,601 7,918 11,665 n.a. r,
Average (a) (C)(>per year 102 50L 1.oSa 2( 3 2 1,157 278 116 60 69 10 11 13, 583 1 12 756 33 6(d1,5 7 5 ',982 11,69 330ýc) 5,2hl i,nO)
1959 282 162 12b 209 3 1 1,08, 260 105 53 69 - 11 57(c) 557 - 12 1,651 328 1,553 8,118 11,653 - 6,3'1 17,91,
1960 366 126 118 210 2 5 1,127 23 103 67() 68 3. (d) 30 536 - n1 1,675 350 ,631 7,578 11,233 - 5,790 1',"2!
1961 315 368 121 24:1 1 5 1,081 213 97 62(U) 79 31, - (d) 21 506 - 12 1,599 311 1,5. 7,780 11 ,26 - ý,756 17,')!
1962 314 346 128 278 2 6 1,074 209 97 49 78 29 11± 25 502 - ni 1,588 306 1,518 7,96b ni,LoI - 5,620 17,02L
1963 233 332 121 308 2 6 1,02 205 97 46 88 25 13 25 500 - 11 1,513 333 1,585 7,982 11,1.3 - 5,611 17,021
Åverage per 308 387 122 2419 2 . 5 1,074 224 LOD 55(g) 76 30(h) l]it) 32 520 - ni 1,606 332(j)1,573 7,88 11,39L n.a,. 5,630(k) 17,021year
196 21. 269 125 329 2 6 965 182 99 1i 80 24 12 47 85 - (11) 1,61 302 1,611 R,039 1,b13 - (56,611() 17,021
1965 182 28 136 329 2 7 9b0 17L 107 40 66 21 10 50 b68 - (11) 1,1.19 295 1,659 8,263 11,636 568 L,820 17,021
Anerage of 1957 and 1958, _/ iverage of 1954-56; e/ Includes also Cabbqe. 2/ Includen ry- gra,n far sed in 1958; a/ Average or 1951-55; f/ Includes ~oods and piantatlo for 1956-58;Fodder bet included with mangela in 1963«61; h/ Includes kale and field Cabbage in 1960-62; -year average 1960«63; i/ 3.year aerage; a/ Includes ry Frase for ,eed; k/ Includes woodr and DiantationejAsumed to be the sass as year bofore.
Sourcey Statietical Ibetract of Ireland and Central Statistical Bureau; all figures for 1965 preliminary.
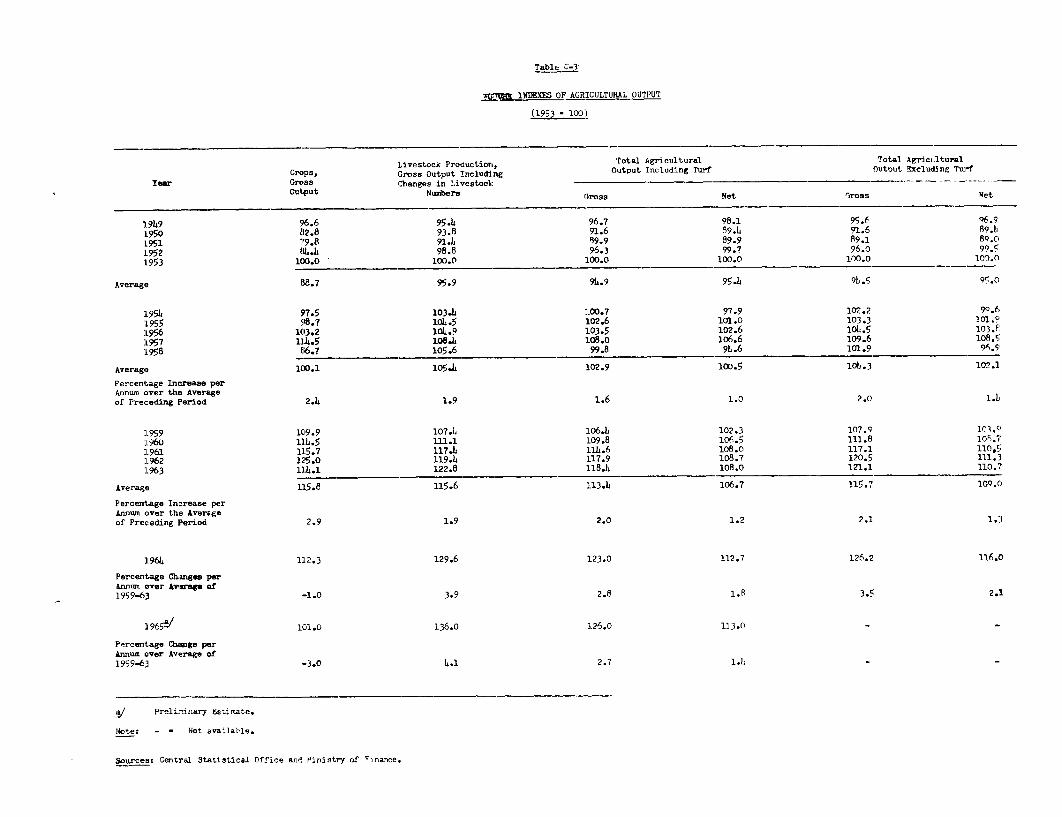
Table C-3
T 1 NIEXS OF AGRICULTURAL OUTPUT
193 - 100)
Livestock Production, Total Agricultural Total AgriculturalCrops, Gross Output Including Output Including Turf Outout Excluding Turf
Year Gross Changes in Livestock - ---------Output Numbers Gross Net rross Net
1949 96.6 95.4 96.7 98.1 95.6 96.91950 82.8 93.8 91.6 89.4 91.6 89.11951 79.8 91.b 89.9 89.9 89.1 8Q.01952 SM.h 98.8 96.3 99.7 96.0 99.51953 100.0 100.0 100.0 100.0 100.0 100.0
Average 88.7 95.9 94.9 95.6 9h.5 ge.0
195. 103.4 100.7 97.9 102.2 90.61955 1.5 102.6 101.0 103.3 101.91956 103.2 104.9 103.5 102.6 loh.5 103.F1957 UIi.5 108.4 108.0 io6.6 109.6 108.51958 E6.7 l05.6 99.8 9h.6 101.9 9A.SAverage 100.1 lo5.4 102.9 100.5 10h.3 102.1Percentage Increase perAnnum over the Averageof Preceding Period 2.7 1.9 1.6 1.0 2.0 1.
1L959 109.9 107.h 106.h 102.3 107.q 103.0I960 1114.5 0I.a 109.8 106.5 111.8 108.51961 115.7 117.6 10b.6 108.0 117.1 110,51L962 125.0 119.6 117.9 108.7 120.5 111.31963 116.1 122.8 118.6 108.0 121.1 110.7Average 115.8 115.6 113.A 106.7 115.7 109.0Percentage Increase perAnnum over the Averageof Preceding Period 2.9 1.9 2.0 1.2 2.1 1.3
1966 112.3 129.6 123.0 112.7 126.2 116.0Percentage Changes perAnnum over Average of1959-63 -1.0 3.9 2.8 1.8 3.5 2.1
196L* 101.0 136.0 126.0 133.0 - -Percentage Clumge perAnnum over Average of1959-63 -3.0 4.1 2.7 1.-
8/Prelininary &stimnate.
Notet - * Not ava;lable.
sourcest Central Statistical Office and Vinistry of vinance.
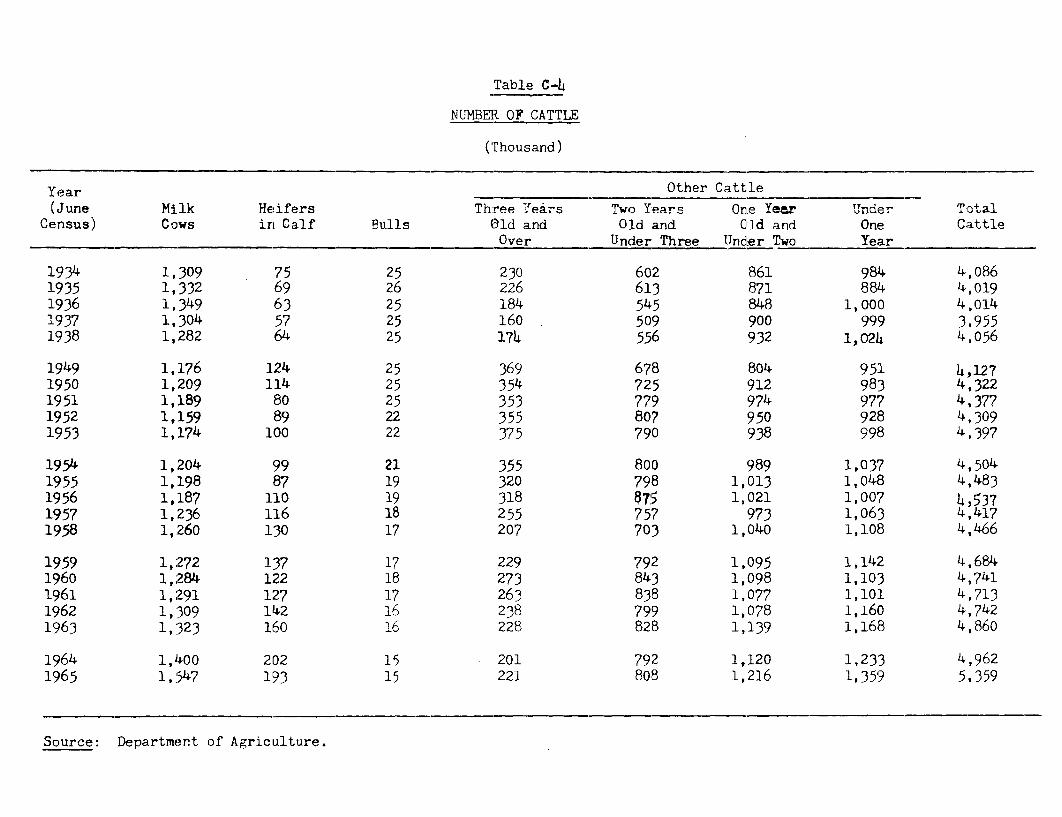
Table C-4
NUMBER OF CATTLE
(Thousand)
Year Other Cattle(June Milk Hifers Th:ree eärs Two Years One Year Under Total
Census) Cows in Calf Bulls Old and Old and Cld and One CattleOver Under Three Undler Two Year
1934 1,309 75 25 230 602 861 984 4,0861935 1,332 69 26 226 613 871 884 4,0191936 1,349 63 25 184 545 848 1,000 4,0141937 1,304 5? 25 160 509 900 999 3,9551938 1,282 64 25 174 556 932 1,024 4,056
1949 1,176 124 25 369 678 804 951 4,1271950 1,209 114 25 354 725 912 983 4,3221951 1,189 80 25 353 779 974 977 4,3771952 1,159 89 22' 355 807 950 928 4,3091953 1,174 100 22 375 790 938 998 4,397
1954 1,204 99 21 355 800 989 1,037 4,5041955 1,198 87 19 320 798 1,013 1, 048 4,4831956 1,187 110 19 318 875 1,021 1,007 4,5371957 1, 236 116 16 255 757 973 1,063 4,4171958 1,260 130 17 207 703 1,040 1,108 4,466
1959 1,272 137 17 229 792 1,095 1,142 4,6841960 1,284 122 18 273 843 1,098 1,1103 4,7411961 1,:291 127 17 263 838 1,077 1,101 4,7131962 1,309 142 16 238 799 1,078 1,160 4,7421963 1, 323 1,60 16 228 828 1,139 1,168 4,860
1964 1,400 202 15 201 792 1,120 1,233 4,9621965 1,'547 193 15 221 808 1,216 1, 359 5,359
Source: Department of Agriculture.

Table C-5
VAL'7 OF EXPCb'S OF -2?IICIPAL A20I:CTAL EXPORT PRODUCTS
19149-53 ange P---- T hge - Tange5-Year Average 9-Year Year from 9-Year Per Year Fron Per Year % Change Per
Million Average Average of 199 1960 1961 1962 1963 Average Average of Million From 1959-63 Million Year FromProduct r Million L Precedinp Period - iTIn F Million t Preceding Period r Average E 1959-63 Average
Live Cattle
Fat Cattle 6.9 7.2 5.3 1L.7 18.7 9.6 6.0 10.3 11.8 12.1
Store Cattle lh.9 30.4 26.4 18.6 25.0 26.5 35.2 26.o L2.5 31.6
Other Cattle 1.3 0.5 0.3 0.3 0.4 0.1 0.4 0.3 0.5 10
Sub-.total 23.1 38.1 10.6 3)0.0 33.6 44.1 36.2 I1.6 37.1 .e5 !1.8 13.8 U.7 4.8
Meat and Meat Products
Beef 5.9 8.7 12.8 19.6 21.5 17.4 17.7 17.0 15.9 16.9
Mutton and Lamb 0.5 1.3 1.5 2.4 1.8 3.7 4.1 2.7 4.1 3.9
Pork 3.1 1.5 0.2 0.5 0.7 2.2 2.6 1.2 2.3 5.5
nacon and Ham 1.0 14.0 9.9 6.2 7.1 6.0 6.7 6.3 9.1 8.9
Poultry (Dead) 3w8 2.3 1.3 0.9 0.8 0.6 0.3 0.8 0.2 0.1
Other Meat Products 14 1.9 1.8 2.0 2.2 2,h 2.4 2.2 2.9 3.2
Sub.-total 19.7 19.7 4.6 23.1 27.6 34.1 32.3 33.8 30.2 9.0 34.5 14.5 38.5 6.3
Dairy Products
Creamery Butter 0.2 2.1 0. 2.0 3.7 4.5 6.3 3.h 6.5 6.8
Cheese 0.2 0.1 0.2 0.2 0.9 0.9 1. 0.6 2,h 2,9
Other Dairy Products 1.3 0.6 0.4 0.7 0.6 0.6 0.7 0.6 0.9 1.1
Dried or Powdered Milk 0.5 0.L 0.6 0.7 1.5 2.0 2.7 1.5 3.1 3.0
Sub.-total 2.2 3.2 7.8 1.7 3.6 6.3 8,0 11.1 6.1 13. 12.9 23.3 13.b 21.7
Other Livestock Products
Eides and Skins 0.4± 0.7 1.0 1.0 1.2 1,0 1.3 1.1 1.9 1.7
Sheep and Launb Wool 2.8 3.7 5.0 1.5 1.9 9.0 9.6 5.0 4.2 5.6
Sub..total 3.2 4.4 6.5 6.0 5.5 6.1 6,0 6.9 6.1 6.8 5.7 3.2 7.3 4.5
All Livestock Products 4L.2 65.4 8.3 0.8 70.3 90.6 82.5 93.4 79.9 4.u 107.9 10.7 103.9 6.9
Miscellaneous
Cereals and Cereal Products 0.1 0.2 1., 0.8 3.0 1.0 3.0 1.9 0.6 0.
Fruits and Vegetables 2.5 0.6 O,6 1.0 0.9 1.9 ?.8 1.9 2.7 2,7
Other A:ricultural Products 10.0 9.0 8.3 9.2 11..L 12."1 13.3 10.9 12.7 11.5
12.6 ;.3 L.1 10.3 11.0 15.3 1.3 19.1 14.3 7.7 16.o 3.8 1L.7 o.6
Agricultural ILxports, Grand Total 56.8 75.2 5.5 71.1 81.3 105.9 97.8 112.9 93.B L.5 123.9 9.7 i18.6 6.0
Sources Computed by the ODartment of A-r1culture frit t'e Cff-::ial Statastics.
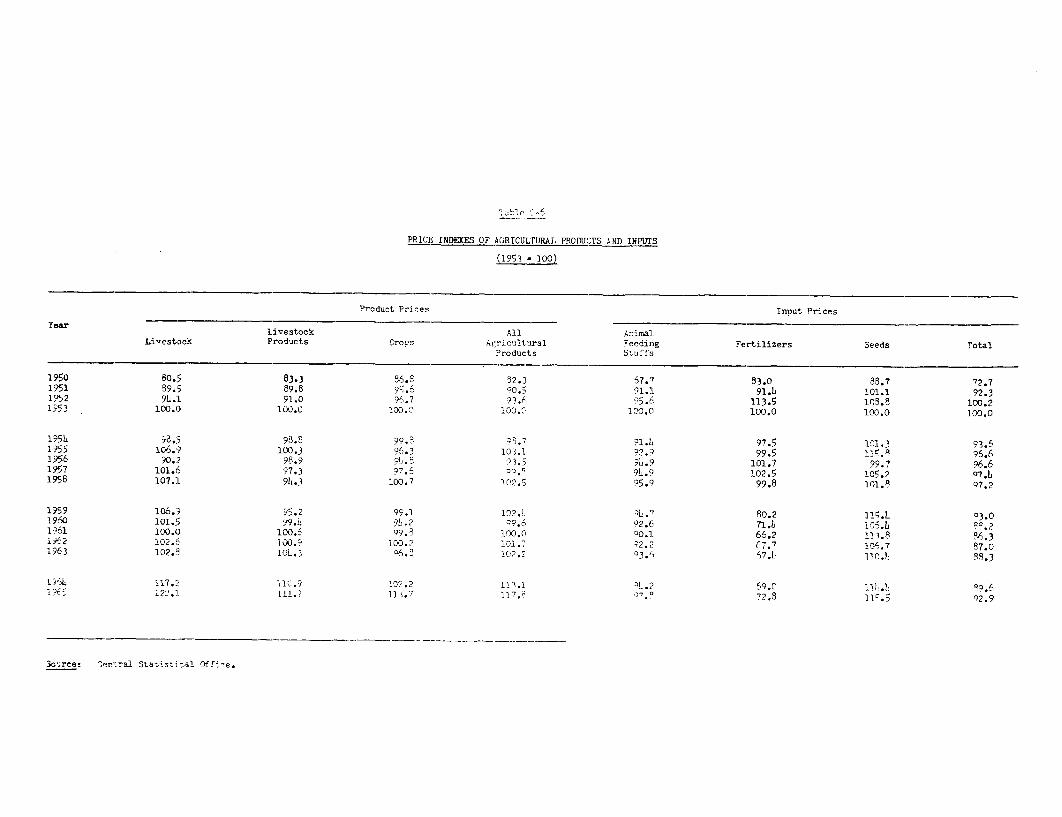
PRICE INDEXES OF AGRICULTURAL PRODUCTS N) INPUTS
(1953 - 300)
Product Prices Irnput Prices
Livestock All Animal.Livest:ck Products Crops Arricultural Feeding Fertilizers Seeds Total
Products Stuffs
1950 80.5 83.3 86.8 32.3 67.7 83.0 88.7 72.71951 89.5 89.8 9L.6 00.5 91-1 91.L 101.1 92.31952 9.1 91.0 96.7 953.6 9.6 113.5 108.8 100.21953 100.0 100.0 100D.9 100.C 100.0 100.0 100.0 100.0
195L 98.5 98.8 99. 1.8 97.5 101.3 93.51955 106.9 100.3 96.3 10-3.1 92.9 99.5 115.8 96.61956 90.2 98.9 9.5 93. 9b.9 101.7 99.7 96.61957 101.6 97.3 97.6 .9.9 102.5 105.2 97.81958 107.1 9h.3 100.7 10. 95.9 99.8 101.8 97.2
1959 106.9 95.2 99.1 102. 2.7 80.2 115.L 03.01960 101.5 99. 9. . 49.6 92.6 71.b 106.b ^P.21961 100.0 100. 99. 100.0 00.1 66.2 133.8 5.319:2 12.5 10,0.9 100.2 10 92.2 67.7 1.2.7 87.01963 102.I 1oL. 3 06.5 10. 03.6 67. 110.I 58.3
968 117.2 11.9 102.2 1 131 Ob.? 69.0 m.o122.1 111.7 11. 7
37. ?.7 72.8 . 2.9
Sou.rce: Oentral Statistisu1 Office.
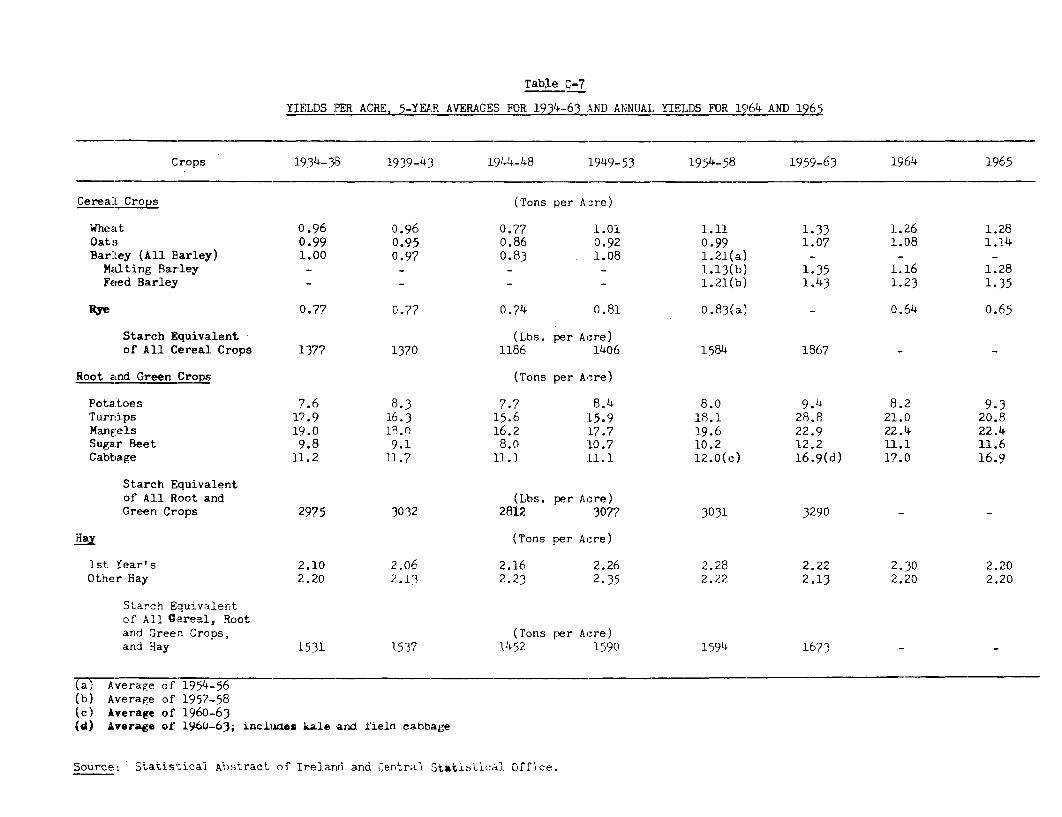
Table 0-7
YIELDS PER ACRE 5-YEAR AVERAGES FOR 19Y6 _6AND ANNUAL YIELDS FOR 1964 AND 196)
Crops 1934-38 1939-43 1944-48 1949-53 1954-58 1959-63 1964 1965
Cereal Crops (Tons per Acre)
Wheat 0.96 0.96 0.77 1.01 1.11 1.33 1.26 1.28Oats 0.99 0.95 0.86 0.92 0.99 1.07 1.08 1.14Barley (All Barley) 1.00 0.97 0.83 . 1.08 1.21(a) - - -
Malting Barley - - - 1.13(b) 1.35 1.16 1.28Feed Barley - - - - 1.21(b) 1.43 1.23 1.35
Rye 0.77 0.77 0.74 0.81 0.83(a) - 0.64 0.65
Starch Equivalent (Lbs. per Acre)of All Cereal Crops 1377 1370 1186 1406 1584 1867 - -
Root and Green CropE (Tons per Acre)
Potatoes 7.6 8.3 7.7 8.4 8.0 9.4 8.2 9.3Turnips 17.9 16.3 15.6 15.9 18.1 28.8 21.0 20.8Mangels 19.0 18.0 16.2 17.7 19.6 22.9 22.4 22.4Sugar Beet 9.8 9.1 8.0 10.7 10.2 12.2 11.1 11.6Cabbage 11.2 11.7 11.1 11.1 12.0(c) 16.9(d) 17.0 16.9
Starch Equivalentof All Root and (Lbs. per Acre)Green Crops 2975 3032 2812 3077 3031 3290 - -
Ha (Tons per Acre)
1st Year's 2.10 2.06 2.16 2.26 2.28 2.22 2.30 2.20Other Hay 2.20 2.13 2.23 2.35 2.22 2.13 2.20 2.20
Starch Equivalentof All Cereal, Rootand 'Ireen Crops, (Tons per Acre)and Hay 1531 1537 1452 1590 1594 1673 - -
(aT Average of 1954-56(b) Average of 1957-58(c) Average of 1960-63(4) Average of 1960-63; includes kale and fieln cabbage
Source: Statistical Abstract of Ireland and Central Statistical Office.

Table C-8
CONSUMPTION OF FERTILIZERS IN TERMS OF N, P205 AND K2 0
(Tons)
Nitrogen Phosphate PotashYear (N) (P205 ) (K20)
13, 06Uu
15,9007 1 55,100 47.,/o00
195-71>8 18,000 OL, OUU >;ej u
Average 15,800 58.00 50,ooo
1958/59 20,600 76,000 52,600
1959/60 21,700 82,700 58,000
1960/61 24,600 80,600 66,hoc
1961/62 29,000 94,000 79,200
1962/63 33,000 112,000 89,000
Average 26,800 89,100 69,000
1963/64 34,200 116,500 90,700
1964/65 29,100 111,800 90,100
1965/6' 30,500 117,400 94,600
Average 31,300 115,200 91,800
1/ Preliminary estimate.
Source: Department of Agriculture.

Table C-9
nTTrIlDTTrr' r-W OnMDATTIT PREDSVJu 11 U .L WK.JJ . JL 'j WW,V A,
(Thousand Tons)
Type of RationYear Pia Poultry inqtt.1 Othpr Total
1950 81 30 16 - 127
1951 73 30 17 - 120
1952 93 42 13 - 148
1953 157 43 16 - 216Average 101 36 16 - ---
1954 179 32 22 - 233
1955 169 38 23 2 232
1956 166 47 21 4 238
1957 191 38 19 3 251
1958 252 46 26 3 327
Average 191 40 22 2 256
1959 236 46 29 4 315
1960 248 52 24 4 328
1961 329 59 28 5 421
1962 410 77 41 6 534
1963 418 92 45 1 556Average 328 65 33 4 431
1964 483 110 55 3 651
.L7u,) ?Y.) -L.. o>). y oe4
Note: Due to roundings there may be minor deviations betweenvertical and horizontal additions.
S c .n * r% '- n---+ -. .rnf p..LJ'd'A-jj WP'A W* XL&LyO -n,, t 4.%,L.V#.~ L V
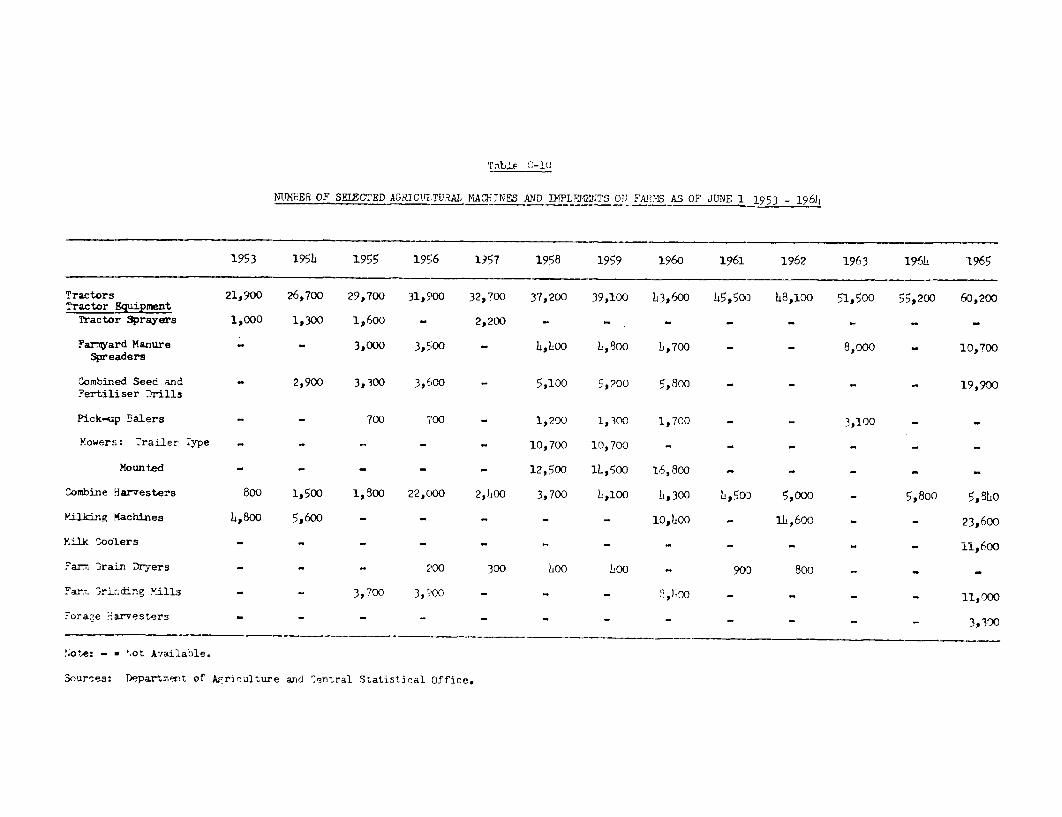
T. blC C-10
NUMER OF SELECTED AGI UCULTURiAL MACHTNES AND IMPLENMITS CO FARMS AS OF JUNE 1 1953 - 196h
1953 195h 1955 1956 1957 1958 1959 1960 1961 1962 1963 196h 1965
Tractors 21,900 26,700 29,700 31,900 32,?00 37,200 39,100 L3,600 h5,50D 148,10() 51,500 55,200 60,200Tractor EumentT'actor Sprayers 1,000 1,300 1,600 - 2,200 - - - - - - - -
Far.yard Manure - - 3,000 3,500 - 4,400 b,800 b,700 - - 8,000 - 10,700Spreaders
Combined Seed and 2,900 3,300 3,600 - 5,100 5,200 5,800 - - - 19,900Fertiliser Drills
Pick-up Balers - 700 700 - 1,200 1,300 1,700 - - 3,100 - .
Yowers: 7railer- ,ype - - - - - 10,700 10,700 - - - - - -
Mounted - - - - - 12,500 1l,500 16,800 - - -
Combine Harvesters 800 1,500 1,500 22,000 2,1-00 3,700 L,100 b,300 L,50D 5,000 5,8oo 5,8LOYilking Rachines 4,800 5,600 - - - - 1O,hCO - 1b,60c - - 23,600
Milk oolers * " - - " - " - - - - - 11,600Farm rain Dryers - - - 200 300 Loo L0 - 90D 800 - -
Far. 3ri.nding Mills - - 3,700 3,900 - - - h - - - - 11,000Fora2e ?aresters - - - - - " - - - - - - 3,300
Note: - * ot Available.
lources: Department of Ariculture and -entral Statistical Office.

Table 0-11
AGEULTURAL GDIT OUTTAFDSTAYING -AIN SUCES, AS OF ABXT JULY 19-20
(Million 1)
BandYAdvanoes to BanU Advamf to Co-opera- Agricultural Credit Hire Purchase Advances Advances under r.and ProjetFarmers and tive trading Soceties Corporation to Parmers tertlizer Fchemes of nerart-
Year Agriculture and Creameries loans (estimated) ment of Avriculture Total
1950 13.3 1.2 1.å n.a. - I¢.3
1951 14.1 2.6 1.5 n.a. 0.0 1R.21952 13.9 l.9 1.7 n.a. 0.11953 13.6 1.7 2.0 n.a. 0.1 17.)
195L 15.2 1.5 2.3 n.a. 0.2 70,.1955 16.8 2.7 2.6 n.a. 0.3 ?,1956 18.5 1.8 2.7 n.a. 0.) ",1957 17.3 2.6 2.6 n.a. 0.21958 18.8 2.6 ?.t 1.2 0.9 r 7
1959 26 .2 3.1 2.7 1.3 0.6 , o1960 33.0 > 9 3-o i A 1. 1 ,1961 35.8 2.9 3.5 2.5 D.O Il :1962 36.7 3.7 . 2.7 0.91963 ,0.2 3.5 5.1 2.7 1.0 C .
196L 15.5 1.2 7.6 2.9 1.1 fl51965 50.L 5.7 12.8 3.0 1.1 73,fl
Commercial Banks (The Associated Banks)
n.a. m Not Available.
Source: Department of Finance

Table C-12-
T7DING0 P THE A7,TC"L'LTURAL CRV,TT 0RPlO?ATTCP LTD
(Filion E)
First Progra Second rram
1958/511 152L20 1960/61L 94S/62 LS962/63 1963).6NL 12L,/65 196/66 196/ 196/68 196A/6 19690
Agricultural Credit, Programed Lendingacortdizg to 1st and 2nd Prograsa forconoic Rmpension. - 0.9 1.LS - 2.10 2.85 3.70 3.0 3.30 3.60 3.70 3.85 .20
Programs and Lending as Adjusted in theCourse of the Plan Periods:
banding as Projected in the AnualCapital Bvqdgets of Ovirennt 1.0 1.0 1.02 1.1, 1.0 3.00 5.25 3.60 - -
Actual Lnt"n (FInancial Year March 31 toAFril 1) 0.65 0.81, 0.90 1.12 1.55 2.O 5.02 5.70 3.60 - -
Sources of Finance: (a)
(b) est.)3Public Funds - Government Advances Nil Nil Nil 0.6
0.) 0. 0t6 3.85 3.15 1.00
Internal Resources - Recollection of Loans 0.65 0.5L 0.8 0.):8 0.59 0.7L 0.97 1.13 1.60 1.9 - -
Other Sources - Deousits and Savings Bondsand Bank Over-draft NiL 0.33 0.32 Nil 0.91 0.80 0.20 1.A2 1.00 - * -
(Per cent of annual lending)
Brakdom of qrI? t Programme by Major Purposeof Lending %aj
Funding Debts 30.0 30.7 32.9 33.3 35.8 AL.7 2A.1 (c)Lmd purchase 3. 12.7 10.8 13.2 16.7 22.2 21.0 (c)Livestock 33.8 25.1 2h.6 21.6 21.9 18.7 22.? -Buildings 21.0 18. 19.r 19.L 11.3 16.8 1L.2
ftsc. incl, Machinery, Fertiliters, Seeds, etc. 11.8 13.1 13.2 12.5 11.3 7.6 18.5 - - -
(a) Figures for Actual Operations Through Financial Year 1965/5
(t) Government Advances and share capital
(c) Lending for these purposes discontinued August, 1955, apart from meeting unavoidable commityrnts. All lendinrs in 1966/67 are for directly oroductive puroses.Note Not availAble.
Soures:Department of Firance and Agricultural redit lorporation Ltd.

rabJ- -13
MVFmRNMENT EXPE,DITUIRE RELATED TO AORTCUMLTIE
(MillianE
1952/53 1958/59 1959/60 1960/61 1961/62 1962/63 1963/6b 196b/65 1965/66 1966/67
Total Expenditure Related to Agriculture 13.55 20.71 22.98 26.25 36.77 37.00 38.52 h,9.96 53.93A/ 52.413
Capital Expenditure 4.84 7.25 12.78 12.15 17.8 15.21 1b.82 20.hh 18.1,9a /
Department of Agriculture:capital 3.00 10.01 9.61 13.73 12.00 10.69 13.02 11. 11
Current 2.81 6.91 3.1h 6.97 11.51 11.57 12.73 16.27 20.862/ 22.15z
Total 5.81 11.75 13.18 16.58 25.2L 23.57 23.L2 29.29 32.76a/ 33.97Y
Office of Public Works:Capital n.a. n.a. 0.93 0.95 0.95 1.7 1.63 1.h8 1.26 1.03
Current n.a. n.a. 0.18 0.18 0.26 0.31. 0.56 0.61 0.56 0.36
Total 0.7A 0.77' 1.11 1.13 1.21 1.78 2.19 2.09 1.82a/ 1.39'
Rural Electrification -, (CentralFund Advances Towards Cost ofCapital Works) - Capital 0.51 1.00 1.11, 0.97 0.76 0.95 0.90 1.25 12 .
Agricultural Credit Corp tion,Government AdvanceW - 1.76 0.05 o.86 3.85 3.15'
Department of Lendas
Capital 0.56 0.6h 0.67 0.62 0.6 0.71 0.0h 0.8h 0.93 0.1
Current 0.77 0.8 0.85 0.86 0.88 0.90 0.96 0.97 1.02 1.08
Total 1.33 1.48 1.52 1 .1h8 1.52 1.61 1.70 1.81 1.958a 1 9 bJ
Employment and Energency Scheeaas:Current 0.48 0.6 0.45 0.3 0.4h 0.8 0.,50 0.h8 0.51a! O.21b/
Agricultural Grant, Relief of Rates(Relief of Local Taxes) onAgricultural lend:
Current U.65 5.25 5.58 5.66 5.8b 8.53 8.95 11.19 12. 9A 13.52Y
a/ Provisional.
b/ Estimated.
c/ Breakdown given in Appendix 11L,
d/ Breakdown between capital and current expenditures not available; all included in the total
capital exPenditcre for ag-iculture.
N.A. i Not A-aixlable.
So,trcez: Deoartmmnt of Fnance an An.ual Budgets.
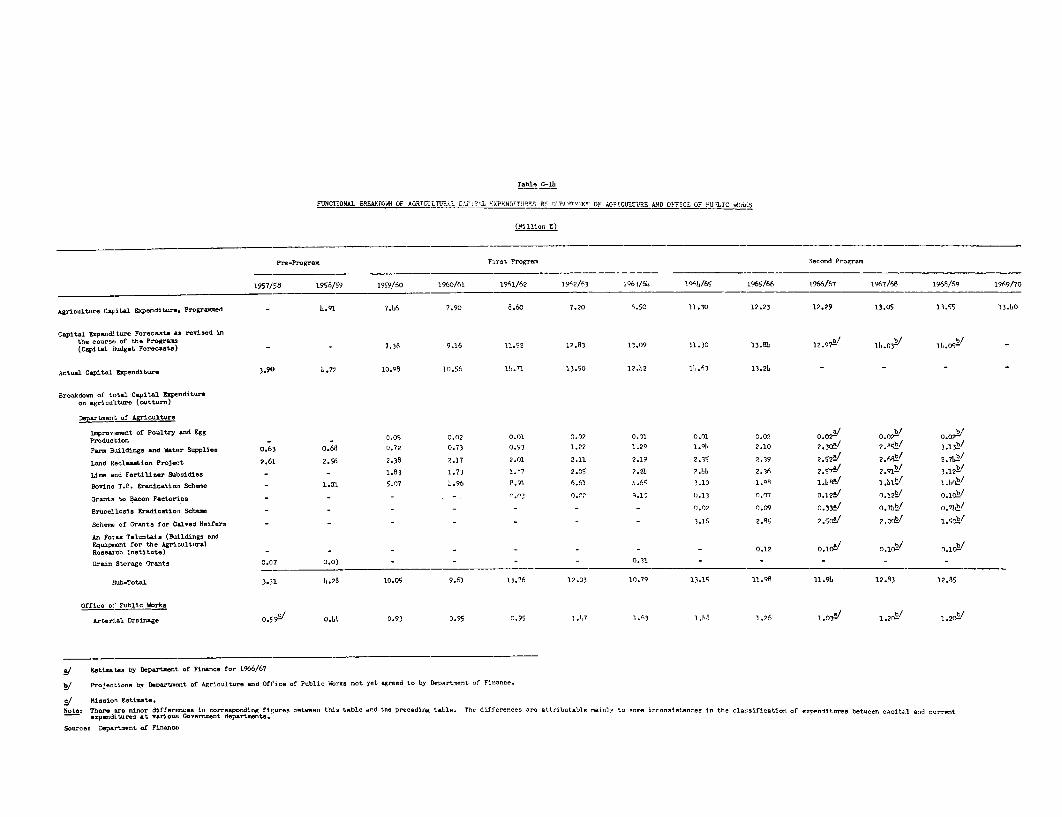
Table C-1h
FUNCTIONAL BREAKiIÄN OF AGRTCULTUJ.IL C O011L EXPENDJTUR, By y3 NRICULTURE ND OFFICE OF PULIC wJrKS
1illion r)
Pre-Progr F:Lrt Program second ProFravn
1957/58 1958/59 1959/60 1960/61 1961/62 19'2/63 1963/64 191A/65 1965/66 1966/67 1967/68 1968/69 1969/70
Agricultur Capital Expenditure, Prograoed - 4.91 7.46 7.90 8.60 7.20 6.50 11.30 12.23 12.29 13.05 13.55 13.ä0
Capital Expenditure Forecasts as revied inthi. ...- oa f tJne Progre-(: cpi ta dget P Fore ts) - - 7.38 9.16 11.52 12.83 13.09 11.30 13.8L 12.97 1b.03b 1 ;.0h
Actual Capital Expenditure 3.90 4.72 10.98 1.56 1.71 13.50 12.1,2 11,.63 13.2L - - -
Breakdown of total Capita1 Expenditureon agriculture (outtum)
Departmen t of oultury
Improe ent of Poultry and Egg 0.05 0.02 0.01 0.02 0.01 0.01 0.02 0.02a0.0 0.02
Fara Buildings and Water Supplie. 0.63 0.68 0.72 0.73 0.93 1.22 1.29 1.91b 2.10 2.30t1 ?.O>/ 3.13Y
Land Reclamation Project 2.61 2.56 2.38 2.17 2.01 2.11 2.19 2.35 2.39 2.52/ 2.680 2.7,
Li- and Fertiliser Sub.idies - - 1.83 1.73 1.P7 2.05 2.21 p.åb 2.36 2.57V 2.91 3.12-
Bovine T.B. Eradicatio Scheme - 1.01 5.07 L.96 8.91 6.61 ).65 3.13 1.98 1.äp6a 1.1är1b
Oranto to Bacon Factories -- , .3 0.07 9.1 1.13 0.07 0.126/ 0.12Y 0.10tV
Brucellosis Eradication Sch~m - - - - - n.02 0.09 0.73 0, 7 07 h,7
Schem- of Grant. for C&Ived HeferB - - - - - - 3.16 2.85 ?.50 2.0053/ I.5gdb0
An Foras TalUntai. (Buildings andEquipment for the AgrinulturalResearch Institut.) - - - 0.12 0.10-/ n.iOY
Grain Storage Granto 0.07 0.03 - - - 0.31 --
sub-Total 3.31 1.2B 10.05 9.61 13.76 12.03 19.79 13.15 11.8 11.9L 12.83 12.85
Office of Public Wrks
ArteriLal Drairage O.59Ý 0.44 0.93 0.95 0.95 3.7 1.Å3 1.18 1.26 1.031/ 1.20t 1.2-
Ey Katimates by Departm-nt of Finane for 1966/67
_/ Prjection. by Department of Agriculture and Office of Public Work. not yet agreed to by Department of Finance.
a/ Mislon Estimate.
Notet Ther are minor difference. in corresponding figures between this table and the preceding table. The differences are attributable mainly to soe inconsItance, Jn the classification of expenditures between coital ond currentexpe:ndLtures at variou, Governent departments.
Source Department of Finance
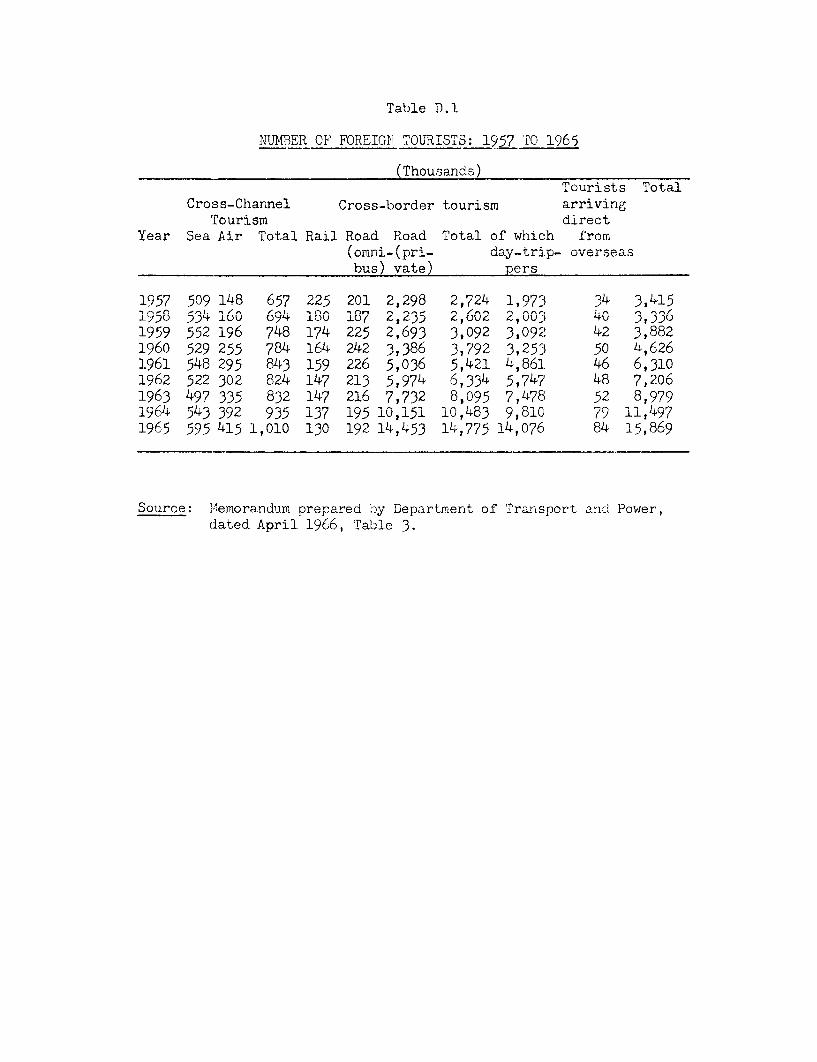
Table D.1
NUMBER OF FOREIGN TOURISTS: 1957 TO 1965
(Thousands)
Cross-Channel Cross-border tourism arriving
Year Sea Air Total Rail Road Road Total of which from\ULT11.- p9i- dy-trip- overseas
bus) vate) pers
1957 509 148 657 225 201 2,298 2,724 1,973 34 3,4151958 534 160 694 180 187 2,235 2,602 2,003 40 3,3361959 552 196 748 174 225 2,693 3,092 3,092 42 3,882196u 2 2 784 164 42 3,386 3,792 3,253 50 4,6261961 548 295 843 159 226 5,036 5,421 4,861 46 6,3101962 522 302 824 147 213 5,974 6,334 5,747 48 7,2061963 497 335 832 147 216 7,732 8,095 7,478 52 8,9791964 543 392 935 137 195 10,151 10,483 9,810 79 11,4971965 595 415 1,010 130 192 14,453 14,775 14,076 84 15,869
Source: Memorandum prepared by Department of Transport and Power,dated April 1966, Table 3.
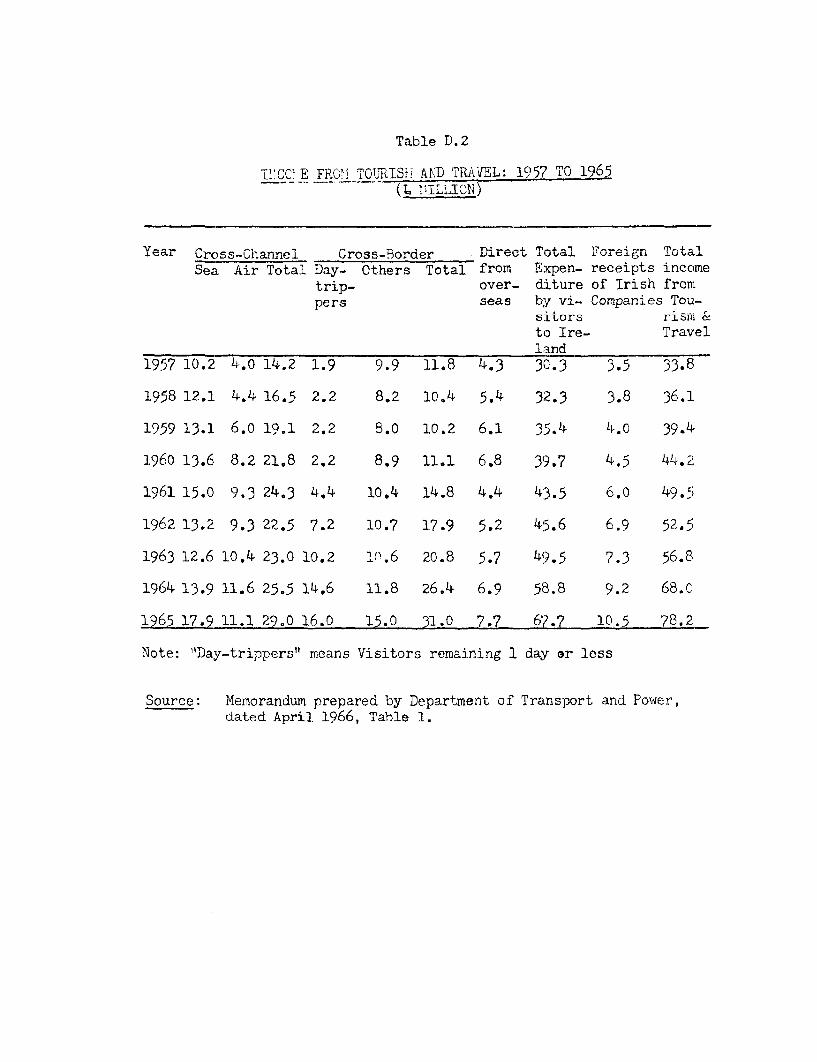
Table D.2
"I-CC E FROMC TOURISiH AND TRAiEL: 1957 T0 1965
Year Cross-Channe! Gross-border DI tu o aul. Fregn Toal
Sea Air Total Day- Others Total from Expen- receipts income
trip- over- uture o 'L I ro i roiipers seas by vi- Companies Tou-
tOrs r rln 6to Ire- Travelland
1957 10.2 4.0 14.2 1.9 9.9 11.8 4.3 30.3 3.5 33.8
1958 12.1 4.4 16.5 2.2 8.2 10.4 5.4 32.3 3.8 36.1
1959 13.1 6.0 19.1 2.2 8.0 10.2 6.1 35.4 4.0 39.4
1960 13.6 8.2 21.8 2.2 8.9 11.1 6.8 39.7 4.5 44.2
1961 15.0 9.3 24.3 4.4 10.4 14.8 4.4 43.5 6.0 49.5
1962 13.2 9.3 22.5 7.2 10.7 17.9 5.2 45.6 6.9 52.5
1963 12.6 10.4 23.0 10.2 1o.6 20.8 5.7 49.5 7.3 56.8
1964 13.9 11.6 25.5 14.6 11.8 26.4 6.9 58.8 9.2 68.0
1965 17.9 11.1 29.0 16.0 15.0 31.0 7.7 67.7 10.5 78.2
Note: "Day-trippers" means Visitors remaining 1 day or less
Source: Memorandum prepared by Department of Transport and Power,dated April 1966, Table 1.
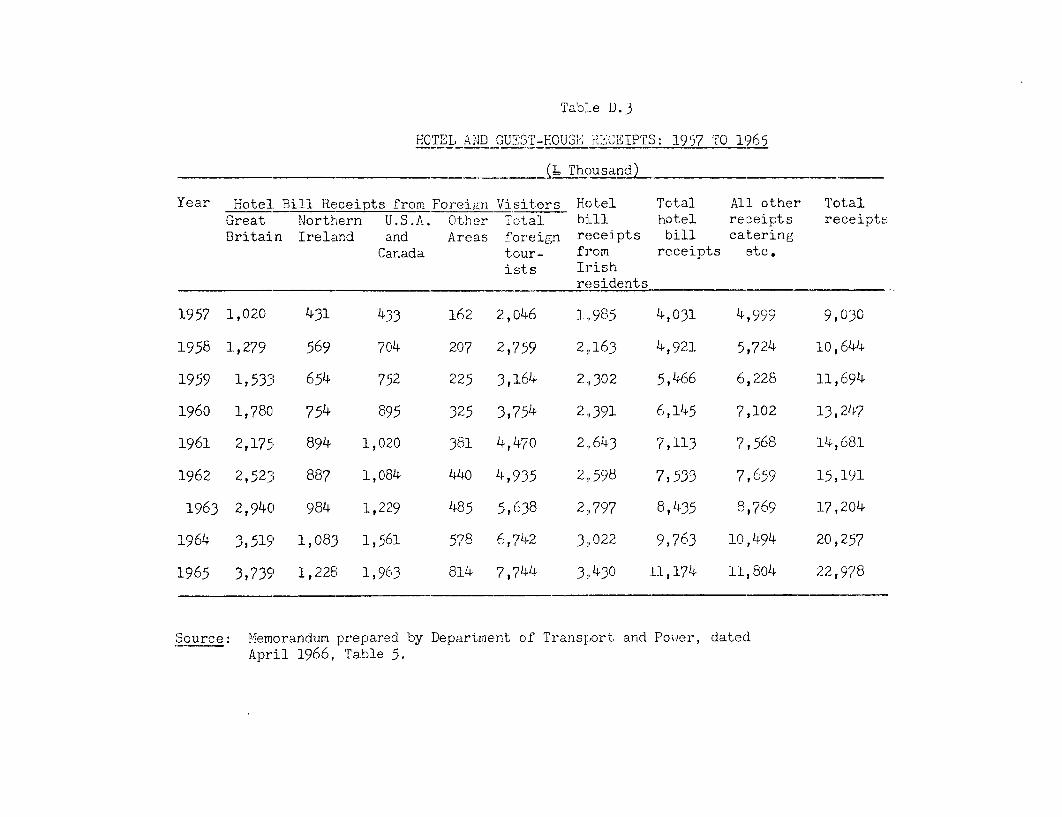
Table D.3
HOTEL AND GUEST--HOUSE i{CEIPTS: 1957 To 1965
(Thousand)
Year Hotel Bill Receipts from Foreign Visitors Hotel Total All other TotalGreat Northern U.S.A. Other Total bill hotel receipts receiptsBritain Ireland and Areas foreigri receipts bill catering
Canada tour- from receipts etc.ists Irish
residents
1957 1,020 431 433 162 2,046 1,985 4,031 4,999 9,030
1958 1,279 569 704 207 2,759 2,163 4,921 5,724 10,644
1959 1,533 654 752 225 3,164 2,302 5,466 6,228 11,694
1960 1,780 754 895 325 3,754 2,391 6,145 7,102 13,247
1961 2,175 894 1, 020 381 4, 470 2,643 7,113 7,568 14,681
1962 2,523 887 1,084 440 4,935 2,598 7,533 7,659 15,191
1963 2,940 984 1,229 485 5,638 2,797 8,435 8,769 17,204
1964 3,519 1,083 1,561 578 6,742 3,022 9,763 10,4 20,257
1965 3,739 1,228 1,963 814 7,744 3,430 11,174 11,804 22,978
Source: Memorandum prepared by Department of Transport and Power, datedApril 1966, Table 5.
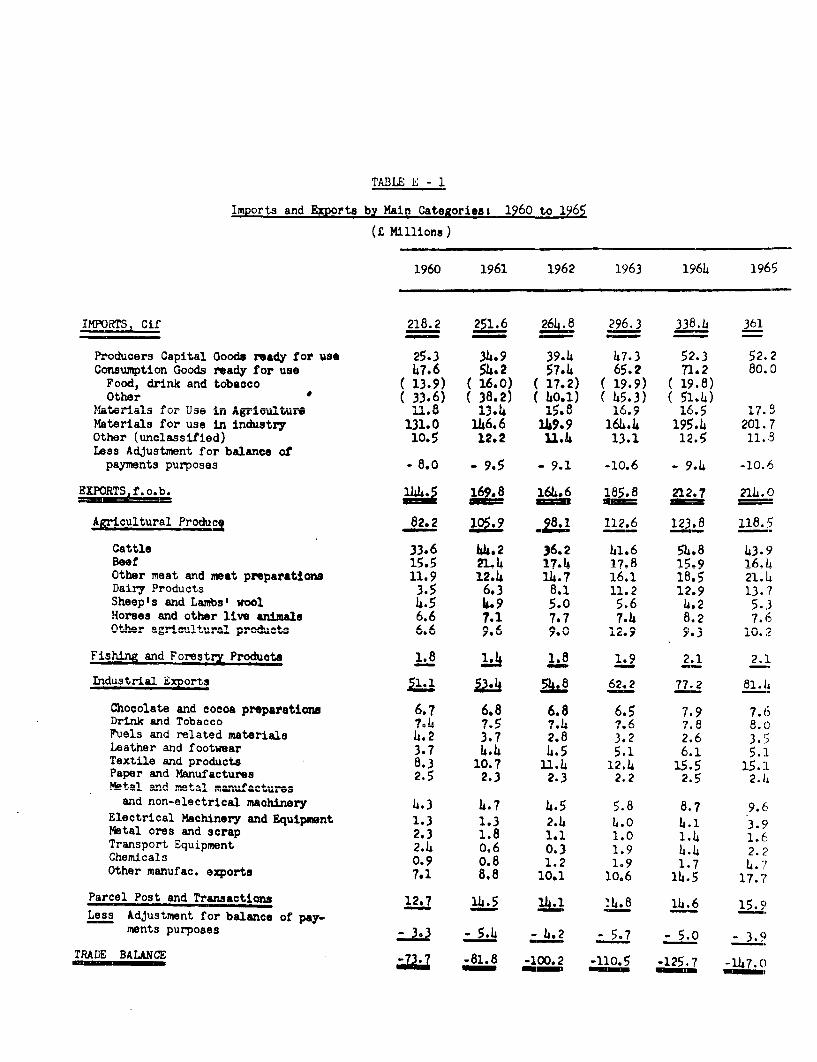
TABLE E - 1
Imports and Exports by Main Categories. 1960 to 1965
(Z Millions)
1960 1961 1962 1963 196h 1965
IMPORTS, Cif 218.2 21 .6 6 8 296.3 338.4 361
Producers Capital Goods ready for use 25.3 34.9 39.4 47.3 52.3 52.2Consumption Goods ready for use 47.6 54.2 57.4 65.2 71.2 80.0
Food, drink and tobacco ( 13.9) ( 16.0) ( 17.2) ( 19.9) ( 19.8)Other ( 33.6) ( 38.2) ( 40.1) ( 4.3) ( 51.4)
1&Mterials for Use in Agimitr " ~ W ; &6 150 80 *Z
Materials for use in industry 131.0 146.6 19.9 164.4 195.1 201.7Other (unelassifiAd) 10.q 12.2 11-h 11.1 19_ 11.8Less Adjustment for balance of
payments purposes - 8.0 - 9.5 - 9.1 -10.6 - 9.4 -10.6
EXPORTS, f.o.b. 166.5 169.8 164.6 185.8 212.7 21L.0mm um _ - -
Agricultural Produet 82.2 105.9 .. 112.6 123.8 118.5
Cattle 33.6 h4.2 36.2 61.6 54.8 43.9Beef 15.5 21.h 17. h 17.8 15.9 16. hOther meat and meat preparations 11.9 12. 11.7 16.1 18.5 21.14Dairy Products 3.5 6.3 8.1 11.2 12.9 13.7Sheepis and Lambsi wool 4.5 h.9 5.0 5.6 4.2 5.3Horses and other live animals 6.6 7.1 7.7 7.4 8.2 7.6Other agrcltra pro-ducts 61 f1. A I .. -
7 U 7 V 1'C9.73 1.2Fishing and Forestry Products 1.8 1.1) 1.8 1.9 2.1 21Industrial Exports 5 62.2 77.2 81.14
Chocolate and cocoa preparations 6.7 6.8 6.8 6.5 7.9 7. 6Drink and Tobacco 7J). 7. cP .1. *7.6 7.8 8Fuels and related materials .2 3.7 2.8 3.2 2.6Leather and footwear 3.7 4.4 4.5 5.1 6.1 5.1Textile and products 8.3 10.7 11.4 12.4 15.5 15.1Paper and Manufactures 2.5 2.3 2.3 2.2 2.5 2. 4P eai and meal man-factuns
and non-electrical machinery 4.3 4.7 4.5 5.8 8.7 9.6ElAe-tri-ial MaehinAw v d n . 1.3 2.4 4.3Metal ores and scrap 2.3 1.8 1.1 1.0 1.4 1.6Transport Equipment 2.hI 0.6 0.3 19 o.1.2.Chemicals 0.9 0.8 1.2 1.9 1.7 .Other manufac. exports 7.1 8.8 10.1 10.6 14.5 17.7
Parcel Post and Transactions 12.7 14.5 11a-1 24.8 14.6 15.9LSS uUmenat for usiance of pay-
ments purposes 33 *.4 - 4.2 - 5.7 - 5.0 - 3.9
TRAD B..A E -81.8 -100.2 -110.5 -125.7 -147.0emm ammms mmm mmm umm
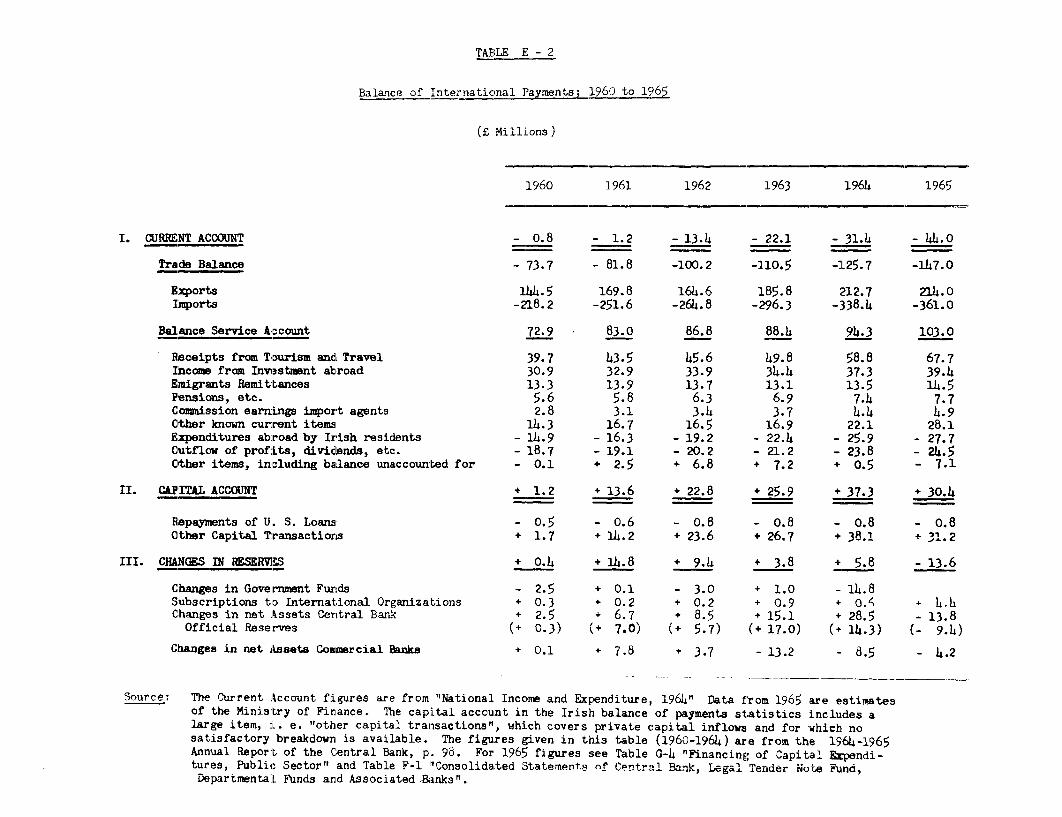
TABLE E - 2
Balance of International Payments; 196,0 to 1965
(£ Millions)
1960 1961 1962 1963 1964 1965
I. CURURNT ACCOUNT -_0.8 - 1.2 - 13.4 - 22.1 - 31.) - 44.0
Trade Balance - 73.7 - 81.8 -100.2 -110.5 -125.7 -147.0
Exports 144.5 169.8 164.6 185.8 212.7 21h.0lmports -218.2 -251.6 -264.8 -296.3 -338.h -361.0
Balance Service Account 72.9 83.0 86.8 88.4 94.3 103.0
Receipts from Tourism and Travel 39.7 43.5 45.6 49.8 58.8 67.7Income from Investment abroad 30.9 32.9 33.9 34.-4 37.3 39.4Emigrants Remittances 13.3 13.9 13.7 13.1 13.5 14.5Pensions, etc. 5.6 5.8 6.3 6.9 7.4 7.7Commission earnings import agents 2.8 3.1 3.4 3.7 4.4 14.9Other known current items 14.3 16.7 16.5 16.9 22.1 213.1Expenditures abroad by Irish residents - 14.9 - 16.3 - 19.2 - 22.4 - 25.9 - 27.7Outflow of profits, dividends, etc., - 18.7 - 19.1 - 20.2 - 21.2 - 23.8 - 21.5Other items, including balance unaccounted for - 0.1 + 2.5 + 6.8 + 7.2 + 0.5 - 7.1
II. CAPITAL ACCORNT 1.2 + 13.6 + 22.8 + 25.9 + 37.3 D 30.14
Repayments of U. S. Loans - 0.5 - 0.6 - 0.8 - 0.8 - 0.8 - 0.8Other Capital Transactions + 1.7 + 1.2 + 23.6 + 26.7 + 38.1 31.2
III. CHANGES IN RESRVES + 0.4 + 14.8 + 9.4 + 3.8 + 5.8 - 13.6
Changes in Government Funds - 2.5 + 0.1 - 3.0 + 1.0 - 14.8Subscriptions to International Organizations + 0.3 + 0.2 + 0.2 + 0.9 + 0.4.Changes in net Assets Central Bank + 2.5 + 6.7 + 8.5 + 15.1 + 28.5 - 13.8
Official Reserves (+ 0.3) (+ 7.0) (+ 5.7) (+ 17.0) (+ 14.3) (- 9.4)Changes in net Assets Commercial Banka + 0.1 + 7.8 + 3.7 - 13.2 - 8.5 - 4.2
Source: The Current Account figures are from "National Income and Expenditure, 1961." Data from 1965 are estimatesof the Ministry of Finance. The capital account in the Irish balance of payments statistics includes alarge item, L. e. "other capital transactions", which covers private capital inflows and for which nosatisfactory breakdown is available. The figures given in this table (1960-1964) are from the 1964-1965Annual Report of the Central Bank, p. 98. For 1965 figures see Table 0-4 "Financing of Capita! Ezpendi-tures, Public Sector" and Table F-1 "Consolidated Statement.q of' Contra1 Bank, Legal Terder Note Fund,Departmental Funds and Associated Banks".
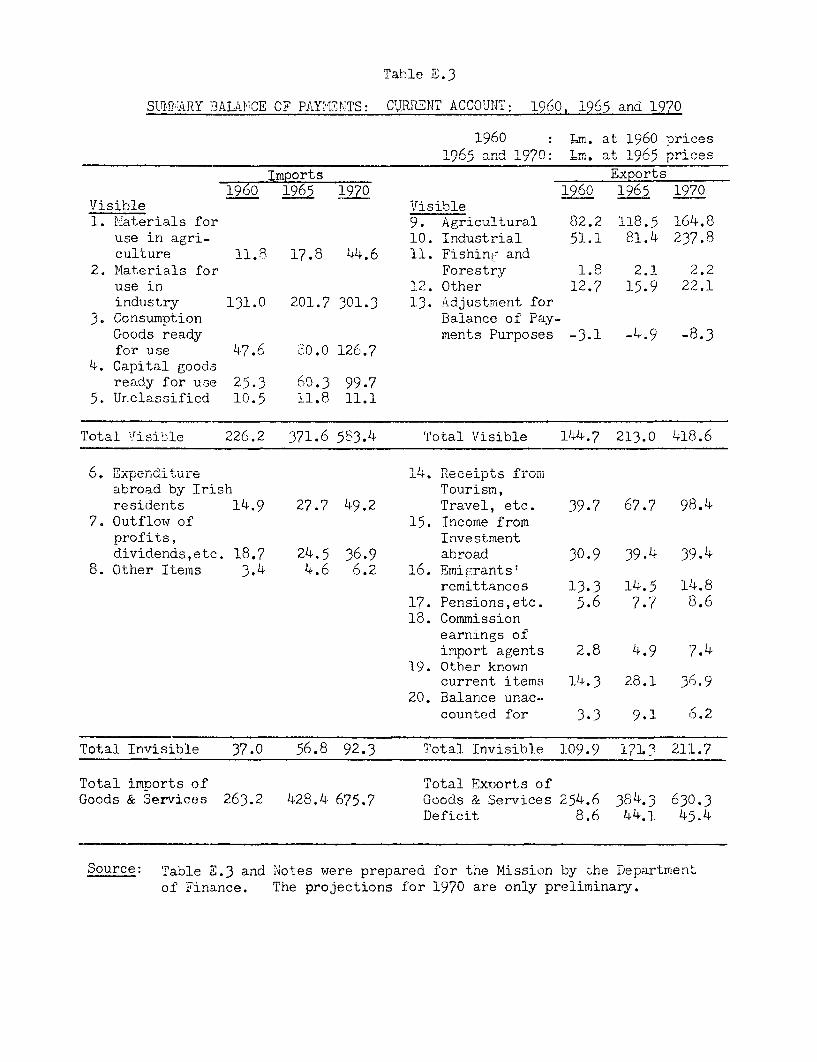
Table E.3
SUMTARY BALAICE CF PAYMENTS: CURRENT ACCOUNT: 1960, 1965 and 1970
1960 : Am. at 1960 prices1965 and 1907n: Tm, at 196 OAlryi
Imports Exports16 193 1970 1960 1965 1970
Visible Visible. iaIeras lor '. Agricultural o4.4 110.) 10 +.0
use in agri- 10. Industrial 51.1 81.4 237.8culture 11.8 170 44.6 11. Fishin and
2. Materials for Forestry 1.8 2.1 2.2use in it. Uther 12.7 15.y 22.1industry 131.0 201.7 301.3 13. Adjustment for
3. Consumption Balance of Pay-Goods ready ments Purposes -3.1 -4.9 -8.3for use 47.6 00.0 126.7
4. Capital goodsready for use 25.3 60.3 99.7
5. Unclassified 10.5 11.8 11.1
Total Visible 226.2 371.6 583.4 Total Visible 144.7 213.0 418.6
Expen.4-L1U L1 -L*. Reeit from
abroad by Irish Tourism,resients 1+. 27. 49Y.2 Travel, etc. 3. 77 9.
7. Outflow of 15. Income fromprofits, investmentdividends,etc. 18.7 24.5 36.9 abroad 30.9 39.4 39.4
8. Other items 3.4 4.6 6.2 16. Emigrants!remittances 13.3 14.5 14.8
17. Pensions,etc. 5.6 7. 8.618. Commission
earnings of
import agents 2.8 4.9 7.419. Other known
current items 14.3 28.1 36.9
20. Balance unac-counted for 3.3 9.1 6.2
Total Invisible 37.0 56.8 92.3 Total Invisible 109.9 171.3 211.7
Total imports of Total Exports ofGoods & Services 263.2 428.4 675.7 Goods & Services 254.6 384.3 630.3
Deficit 8.6 44.1 45.4
Source: Table E.3 and Notes were prepared for the Mission by the Department
of Finance. The projections for 1970 are only preliminary.

Notes t. Table E.3
Nany of the 1965 figures are provisional and items 7, 8, 15, 18, 19
and 20 in particular are estinnates based on the trend:s in recent years.
in making the revised tentative estimates for 1970 regaru was hau tOa number of factors: (1) the Programme's projections which were based ona large volume of detailed analysis e.g. the projected rate of increase inpersonal consumption 1960-1970; (2) trends in the period since 1960 andespecially in the years 1963-1965 - at the time of the Programme's prepara-tion firm figures were available only for years up to 1962; (3) variousfactors likely to influence these trends in the period 1965-1970. Somerevision of this estimate may have to be made when the review of theSecond Programme targets, now in progress, is completed and firmer figuresabout such items as investment and consumption become available.
The original assumptions upon which the 1970 exports and importsfigures were based were outlined in Appendix 5 to Part II of the SecondProgramme for 'Economic Expansion. Imports have been shown unadjusted forbalance of payments purposes but per contra, re-exports have been excludedon the export side of the account.
INFORITS
Visible
1. Materials for use in Agrculture:
The revised estimate for 1970 is based on a irowth in these importsfive times as fast as the rate of increase of net output in agriculturewhich it is expected will recover to the rate projected in the Programme(2.8o p.a.) In the period 1960-1965 material imports rose six times as fastas net output.
2. Materials for use in Industry:
The revised figure for 1970 is based on the assumption that thesectoral product of industry in 1970 will be about ;365m. at 1960 prices -see Progress Report for 1965 on Second Propramme for Economic Expansion,Note to Table 26. It also allows for a further rise in the importedmaterial content of industrial output over that prevailing in the period1960-1965 which was in turn larger than projected.
3. Consumption Goods ready for use:
The revised figure is based on an assumed increase in personalconsumntion 1Q6-70 of 31V npr innum- T. i- nlso Asmimpd thnt. the rate ofincrease in these imports will continue to be the same multiple of the rateof' i nerici i n npersonal connsmio n as ir the) nprio n196 t'0_195 i.e.JP 2.6..
4. Capital Goo0s ready for use:
The revised estimate is based on an assumed rate of gross fixedcapital formation to GNP in 1970 of 22. It also assumes a rise in theproportion of capital. formation accounted for by investment in plant andmachinery to about 534 and a rise in the share of imports in such invest-ment to about 75%.
5. Uncl-assified:
The revised estimate was based on continuance of the trend inthe period 1960-1965 when these imports oscillated around a stable level.
Invisible
6. Expenditure abroad by Irish residents:
The revised figure assumes the same average rate of increase asin the period 1960-1965 which was considerably higher than that proiected.
7. Outflow of Profits. Dividends. etc-
The revised fi .iire is bnaspd nn an annual PvPrqe rate of increise1964-1970 of 5%, a rate mid-way between that originally projected and thatprevnilina in the nrrind iQOn_1Q4_
8. Other.
,Assnmod rate of J7Ceno-ase 10tL_107n n-r 4 , no in lIAne a 16+h1 + v-nrl
in 1960-64.
EXPORTS
Vis ible
9. A ricultural:
The original 1970 target was retained, on the advice of the
terms of access to the British market give good grounds for assuming that44t will b0e achieved. mihe origina target was up on a cormo
LV0 ;!Inuu U L .L.
lilt: V1.L ',LI 1- t-:. WC0 C11 L Ctit tt U.L Lim; LUdL~Lt z C±4.'Le U W _ L'lI
representatives of the different industries, in the light of all the rel-evant factors in each case. LU was puui-ueu o Ile iVC Report onDiscussions with Industry on the Second Programme Targets - Report No. 5.It has now been increased in line with the aggregate increase in the tarwet

for All Industries (over the target for All Industries published inReport No.5) agreed with industry in the course of the review discussionsin the winder of 1965. The target for each industry was reconsidered inthe light of the new trading conditions likely to follow the conclusionof the Free Trade Area Agreement with Britain and of trends in recent years.
11. Fishing and Forestry:
Assumed that these exports will be static. It was assumed thatthere would be no extension of fishing operations into middle waters before1970.
12. Parcel Post, etc.:
The projection was revised downwards in view of the below-targettrend in the early years of the decade.
13. Adjustment for Balance of Payments Purposes:
Assumed that this adjustment would be the same proportion of thetotal as in the original projection.
Invisible
14. Reeints from Tourism. Travel. etc.:
Tn th.ho nPri nrlI 1Q()0_1 Q thisc it+.m innreaqpd at. a rate somewhatlower than projected but it is assumed that the target will be achieved invi s rf t.hp v'y vi nanni . nnri nrnc -rPe-i irly-% f'n.z-r rrnwt.h in the "v-]i m
proper" element.
15. Income from Investment Abroad:
The target was reduced slightly in view of the trend in thenprinrl 10(O_1C)AL an the liklihlnnid that. it nibahf he nPr aq-rv ton renntriAt.
externally-held assets to finance payments deficits. It was assumed thatthere would be no chan-e from the 194 position.
It is based on the recent trend towards a flattening out of the fall ir
25,000 p.a. over the rest of the decade. It is assumed that receipts in
.LY(U~ Vt uu!± _LL LZ5U a0builit'uil ±u~
These receipts have been static in recet ,years. it is assumedthat they will be the same in 1970 as in 1965.

18. Commission Earnings of Import Agents:
Based on the assumed rate of' increase 1965-1970 in total imports.It is assumed that the relationship between the rates of growth of the twoitems in the period 1965-1970 will be the same as that which prevailed1960-1965.
19. Other Known Current Items:
This heading includes foreign receipts of Irish carriers whichhave been growing much faster than projected. It is assumed that they willcontinue to do so but at a slightly slower rate. It is assumed, in viewof the trend 1960-1964 that the 1970 projection for Other Items will berealised.
20. Balance Unaccounted for:
The original projection was retained.
Department of Finance.May 1966.

TABLE F - 1
Consolidated +-n+ Anat and Liabilities of Banks. Dec. 1960 to March 1966
(f Millions)
Actual - End of Period
1960 1961 1962 1963 1964 1965 1966
n1 0, 01. n a1 n n., 0 an1sCurrency in uirculation 0 .4 U1.l U .Up .u 9u1.. J.Iu 1041.7Demand Deposits 122.8 131.7 17.2 165.1 181.3 188.6 182.5
Money Supply (198.2) (212.9) (232.2) (256.5) (285.8) (296.4) (287.2)Time Deposits - Public 209.8 225.4 2h1.2 241.4 256.7 273.6 277.8Govern. Accounts - Assoc. Banks 10.5 9.7 6.8 7.2 11.0 11.7 9.3Govern. Accounts - Central Bank * 17.1 17.1 14.6 15.6 1h.4 10.9 13.6
External Liabilities 1/ Officialborrowing abroad - - - - - - 15.1
Other Liabilities (domestic) 13.8 1h.7 16.9 20.5 21.b 23.6 23.9
Capital and Internal Reserves 17.5 17.1 20.6 23.3 25.5 27.2 26.7
WWAT. T.TAIT.TTTI.ES = TOTAT. ASSETS 466.9 496.9 52m3 56. 01). 8 6121 6 53-6
External Assets (net) 209.9 224.5 234.0 236.9 242.1 22h.1 227.1-tral Bnk'i .ad Goverranient+ x (i48n a TA 1 fat0 1.6) Al 11L.8 111.1)
Associated Banks (103.6) (111.5) (115.1) (101.9) ( 93.5) ( 89.3) ( 93.8)Loans and Advances to Public 216.7 227.2 248.1 265.8 306.7 309.0 299.7Credit to Government 23-5) ( 2y. 34-1 4.5 )U. 4 ) ( 00.0) (LUD.Y
Associated Banks 18.9 24.8 24.8 36.7 32.2 59.2 59.6Central Bank h.6 5.0 9.3 7.8 lb.3 29.6 47.3C. B. K. - External borrowing - - - - - -
Other Domestic Assets 16.8 15.4 16.1 17.3 19.5 20.5 19.9
Annual Changes (L million)
Currency in Circulation . 5.8 + 3.8 + 6.4 +13.1 + 3.3 - 3.1Demand Deposits + 8.9 +15.5 +17.9 +16.2 + 7.3 - 6.1
Monev Supply (+1L.7) (+19.3) (+2h.3) (+29.3) (+10.6) (- 9.2)Time Deposits - Public +15.6 +15.8 + 0.2 +15.3 +16.9 + 4.2Govern. Accounts - Associated Banks - 0.8 - 2.9 + 0.4 + 3.d - 0.3 - 1.4Govern. Acnunts - Central Rank * - - 2.5 + 1.0 - 1.2 - 3.5 2.7External Liabilities 1/ - - - - - +15.1Other Liabilities (domestic) + 0.9 + 2.2 + 3.6 + 0.9 + 2.2 + 0.3Capital and Internal Reneres - u.4 + 3.5 + 2.7 * 2.2 + 1.7 - 0.
TOTAL LIABILITIES = TOTAL ASSETS *30.0 +35.4 +32.2 +50.3 +27.6 +11.2
External Assets (net) * .14.6 + 9.5 * 2.9 5.2 -18.0 + 3.0Loans and Advances to Public +10.5 +20.9 +17.7 -O.9 + 2.3 - 9.3Credit to Government (+ 6.3) (+ 4.3) (+10.3) (+ 2.0) (+62.3) (+18.1)
Associated Banks + 5.9 - +11.9 - (.5 +27.0 + 0.4Central Bank + 0.4 + 4.3 - 1.5 * 6.5 +15.3 *17.7Central Bank - External borrowing - -
Other Domestic Assets - 1.4 + 0.7 + 1.2 + 2.2 + 1.0 - 0.6
1/ In consolidatine the accounts. foreign assets and liabilities were netted out AreAt in 14-nrph 1QAA and a,r nonly in..nf,as the IMF drawing and I/DM bond issue made between December 1965 and March 1966. This operation is shown as creating anexternal liability (L 15.1 million) supporting a domestic credit extension to the Government on the asset side. Thus externalassets remai ann a net bais througdhout. T. ahould al beon h nntAd tha +ht t+sI a+en al, +. ast +hese cns4oA.aA
accounts exclude Ireland's capital subscription to the IMF; in this respect= figures in this table differ from those inthe "Monetary Survey" published in the Fund's International Financial Statistics. Increasing external assets by the amount
of Ireland .- 4. pitalM-A --.. 1A --+ -41 . 44~~ - - .--- - ---.-- -......... ~~~~~~~0 .~ifI4W... - .0 a- th pi-w miow0n,uu i n -- ab-e 04.nuu the recent I1W
drawing - after Ireland's increase in its capital subscription to the Fund - does not exceed Ireland's capital subscriptionin gold.
Includes "Departmental Funds" in the form of external assets, as follows: 1960 16 17.1 million, 1961 1. 17.2 million;1963 L 15.6 million, 1964 b 0.8 million, and 1966 . 0.8 million.
Source: Central Bank of Ireland
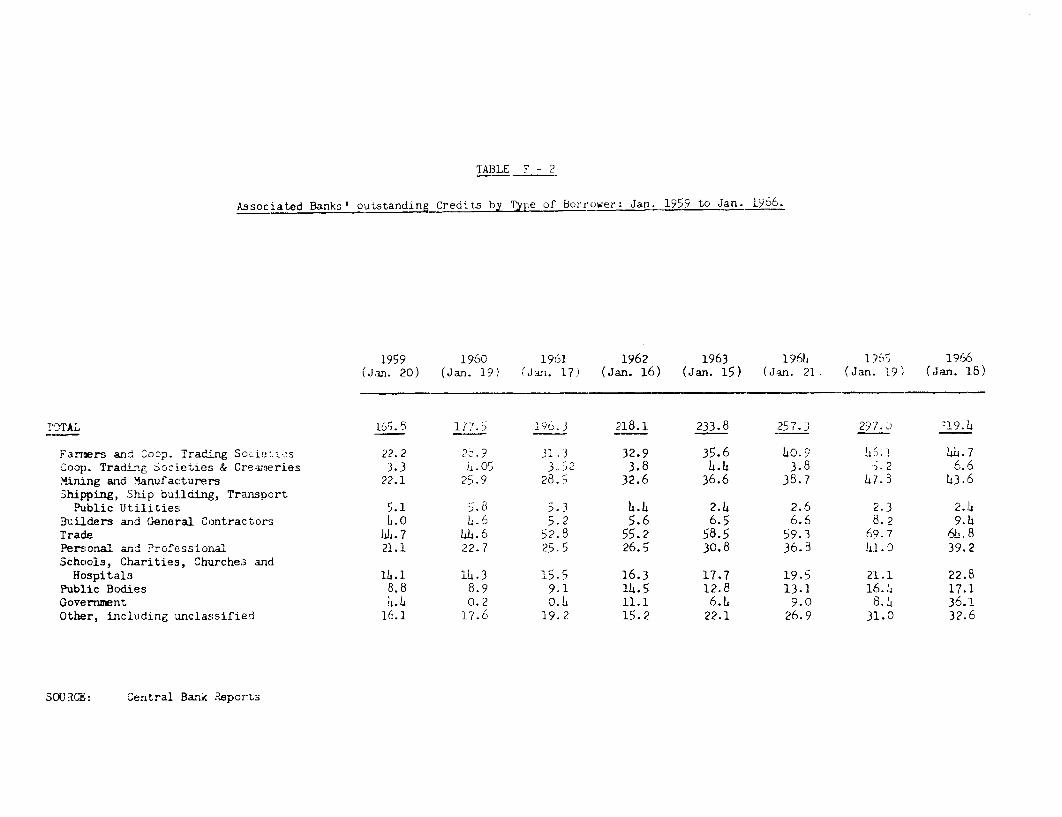
TABLE F - 2
Associated Banks' outstanding Credit.s by Type of Borrower_: Jan. 1959 to Jan. 1966.
1959 1960 1961 1962 1963 19611 1965 1966(Jan. 20) (Jan. 19) (Jan. 17) (Jan. 16) (Jan. 15) (Jan. 21 (Jan. 19) (Jan. 18)
r5AL 16.8 17.5 19.3 218.1 233.8 257.3 29 19
Farmers and Coop. Trading Socieis 22.2 2-.9 31.3 32.9 35.6 40.9 66.1 Ws.7Coop. Trading Societies & Cre-meries 3.3 3.05 3.2 3.8 4.4 3.8 5.2 6.6Mining and anufacturers 22.1 25.9 28.5 32.6 36.6 38.7 47. 3 43.6Shipping, Ship building, TransportPublic Utilities 5.1 5.8 5.3 h.h 2.4 2.6 2.3 2.43uilders and General Contractors o.0 4.6 5.2 5.6 6.5 6.6 8. 2 9.Trade Uj.7 44.6 52.8 55.2 58.5 59.3 69.7 6.ElPersonal and Professional 21.1 22.7 25.5 26.5 30.8 36.8 1. 39.2Schools, Charities, Churches andHospitals 1.1 14.3 15.5 16.3 17.7 19.5 21.1 22.BPublic Bodies 8.8 8.9 9.1 14.5 12.8 13.1 16.h 17.1Government .I 0.2 0.1 11.1 6.4 9.0 8.L 36.1Other, including unclassified 16.1 17. 6 19.2 15.2 22.1 26.9 31.0 32.16
SIXU4CE: Central Bank Reports
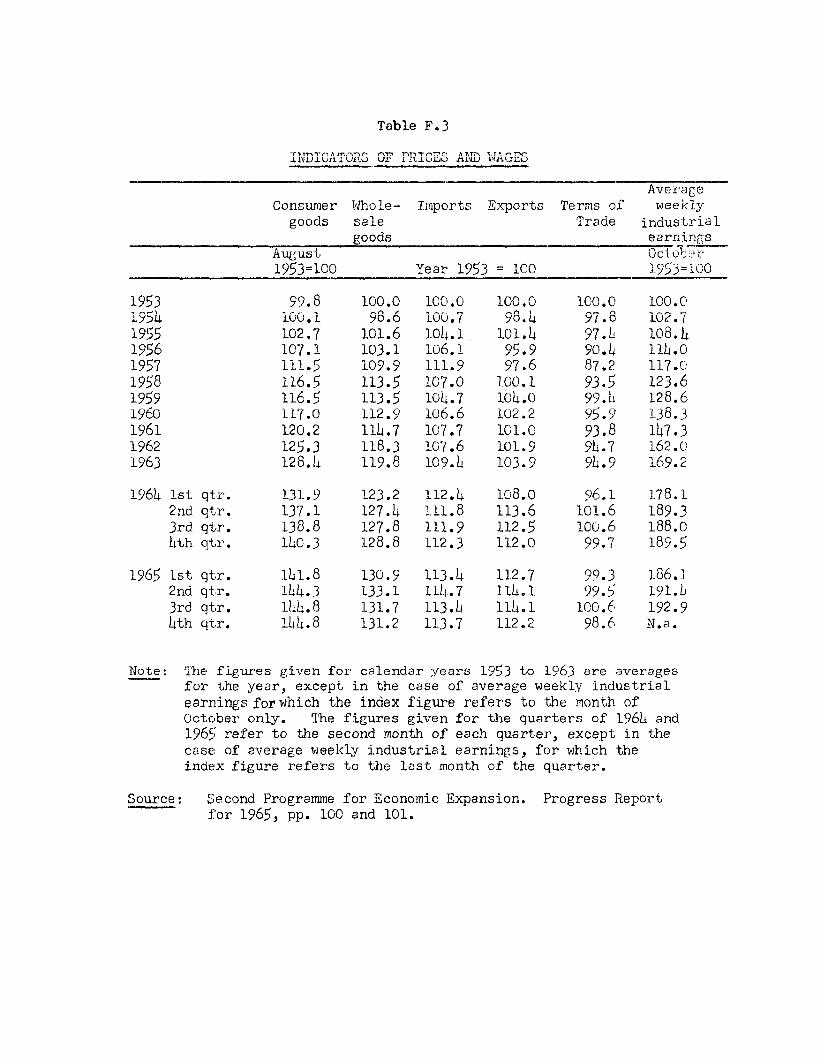
Consumer Whole- Imports Exports Terms of weeklygooum eaLe 1raue inaustrictl
goods earningsAugust a
1953=10o Year 1953 = 10o 1953=1co
1953 99.8 100.0 100.0 100.0 100.0 100.0
Ly~~~~f V LUU.L yo. LUU, yoR10 LU.
1955 102.7 101.6 10h.1 101.h 97.L 108.h
1957 111.5 109.9 111.9 97.6 87.2 117.01958 116.5 LL3.5 L07.0 L00.1 93.5 L23.61959 116.5 113.5 10L6.7 10h.0 99.L5 128.61960 117.0 112.9 106.6 102.2 95.9 138.31961 120.2 11h.7 107.7 101.0 93.8 1L67.31962 125.3 118.3 107.6 101.9 9L8.7 162.01963 128.h 119.8 109.Lt 103.9 9b.9 169.2
196C 1st qtWl. 131.9 123.2 112. 108.0 96.1 178.12nd qtgr. 137.1 127. 111.5 113.6 101.6 189.33rd qtr. 138.8 127.8 111.9 112.5 100.6 188.0hth qtr. 10).3 128.8 112.3 112.0 99.7 189.7
1965 1st qtr. 111.8 130.9 113.9 112.7 99.3 186.12nd qt1r. 16.3 133.1 114.7 11.1 99.5 191.63rd qtr. 128.8 131.7 113.h 113.1 100.6 192.9hth qtr. 138.8 131.2 113.7 112.2 98.6 N.a.
Note: The figures given for calendar years 1953 to 1963 are averagesfor the year, except in the case of average weekly industrialearnings for which the index figure refers to the month ofOctober only. The figures given for the quarters of 1964 and1965 refer to the second month of each quarter, except in thecase of average weekly industrial earnings, for which theindex figure refers to the last month of the quarter.
Source: Second Programme for Economic Expansion. Progress Reportfor 1965, p. 100 and 101.

TABLE G - 1
Detail of Central Government Current Receipts and Expenditures - 1958/59 to 1966/67
(L Million)
Outturn 1965/66 1966/67
Provi. Budget, incl.
1958/59 1959/60 1960/61 1961/62 1962/63 1963/64 196h/65 Budget Estimate new taxmeasures
Total Current Revenue 126.1 129.9 U8.8 151.7 163.5 184.4 )210.3 262.6lax ne-venue yo.o6; ;i-T7uL) k.10uu L")k120 10) k±oo 1.uuo ;±,0.u ;.).j k-17-3)r (T"). Mr
Ciuatoms Duties 48.3 1.9 1.0 44.9 4~6.9 50.3 55.7 57.5 5-,.1h 57.9Excise Taxes 17.5 21.2 30.2 33.5 34.7 37.8 42.9 L6.9 49.8 58.5Estate, etc. Duties 2.9 3.0 3.2 2.9 3.5 3.6 h.L 4.5 h. 7 b.5Stamp Duties 2.1 2.6 2.7 3.0 3.1 3.5 3.9 4.0 3.9 3.7Income Tax 22.9 21.6 26.3 29.4 33.9 38.0 15.2 52.0 52.0 59.9Surtax & Super Tax 2.2 1.9 1.7 1.9 2.2 2.2 2.6 2.7 2.7 2.7Corporation Profit Tax 2.8 3.0 3.3 J.7 4.5 7.7 8.1 9.2 9.2 10.0Turnover Tax - - - - 3.7 13.1 11.5 14.2 15.1
MtrVhceDuis( 5.5) (5.9) (6.1) (6.9M 7.4) (&82) (&8 ) 9=0) C 9-0 ( 1.i)Non-Tax Revenue ( 22.3) (22.5) C23.9) C25.5) C27.3) C29.4) (33.6) C36.6) C37.0) C39.2)
Postal Service 4.4 1.5 1.8 1.9 5.3 5.5 7.0 7.5 7.6 7.9Telegraph Service O.1 0.1 0.4 0.5 0.1 0.1 0.5 0.5 0. 5 0.5Telephone Service 3.9 4.2 4.6 5.2 5.7 6.2 7.1 8.2 6.3 9.1Interest on Exchequer Advances 7.1 7.1 7.6 8.0 8.5 9.1 9.8 10.6 11.0 11.7Other non-tax revenue 2/ 6.5 6.3 6.5 6.9 7.4 8.3 8.9 9.8 9.6 10.0
Tol Crrn 151.1 1tDun 202.7 221.1 228.3 1.3Inersto Public VDt 3§ T3 17h ~ l 73Public Works & Buildings 1. 1.5 1.4 2.2 1.8 2.2 2.9 3.2 3.1 3.2Agriculture 3/6.8 3.2 un/a 12.0 12.3 13.7 17.3 19.0 21.6 23.4Agricultural Grants / .9 5.0 5.1 5.2 8.5 8.9 11.2 12.5 12.5 13.5Forestry and isheries 1.4 n/a 1.1 1.4 1. 2.0 2.2 1.9 1.1Education 919 16.6 .20.3 2.8 . 30.2 5..Industry and Commerce 0.9 1.6 1.9 1.5 1.0 2.0 1.9 1.0 1.7 5.0Transport and Power 2.3 1.7 n/a 1.9 2.7 3.6 6.7 7.6 5.8 5.7Posts and Telegraphs /8.8 9. 7.1 11.2 13.0 13.8 17.8 18.7 18.6 19.6Local Government 2.4 2.8 3.0 3.3 3.6 3.6 4.1 4.6 4.6 5.1Office of the Revenue Commsision 2.0 2.1 2.3 2.1 2.6 2.8 3.1 3.8 3.7 4.1Social Welfare 6/ 25.1 25.5 34.4 25.6 27.9 31.0 35.0 35.5 39.2 L2.2Healt 7/ 80 a- I, 9.Defense and Army Pensions 7.7 8.2 2.2 9.3 10.3 10.7 13.6 12.8 13.3 13.hPolice 1.8 5.1 5.6 5.9 6.1 7.6 8.5 8.9 8.7 9.1Other Current Exenditures 10.6 10.0 n/a 10.7 9.8 8.8 11.h 15.3 13.1 12.6Aid to Industry 8/ - - - - - - - - .2 2.5
Current Account Surplus 12.28 14.22 13.51 11.65 12.36 16.89 16.36 16.17 12.05 21.32
Th- officially asignated "Current Budget" - as opposed to the "Capital Budget" is in Ireland presented to Parliament showing the balance betweenreceipts and expenditures. In fact, however, at least since fiscal year 1958/59 the balance of the current budgets has been only formal, withrelatively small deficits (up to L1.0 millions or 1.6% of expenditures) covered by the inclusion on the expenditure side, of a negative itemdesignated as "errors of estimation." Upon the closing of the fiscal years the current budget has shown since 1958/59 the following surplus (+)or deficits (-): 1958/59, L m. c0.16; 1959/60 b m.+1.17; 1960/61 L m. -0.73; 1961/62, 1-0.71; 1962/63, L m.-4.85; 1963/61, b m. -2.22: 196h/65.L m.-b.07; 1965/66, L m.-8.0. The current account as defined in the budget includes, however, expenditures to cover repayment of principal (sinking-fund on the public debt as well as transfers to the "Road Fund" which finances, together with other resources provided by Local Authorities,construction, improvement and upkeep of Ireland's road network. Since expenditures on construction and improvement of roads are nonnally higherthan the Exchequer contribution to the Road Fund, in this table Exchequer payments' to the Road Fund are excluded, i. a. treated as a capital expen-diture, thus appearing as part of the surplus (savings) of the Central Government. The corresponding adjustment is made in Table0 2
deeling with thefinancing of Public Capital Budget. Repayment of public debt (sinking fund, etc.) has also been transferred from the Current to the Capital Budget.After these adjustments the current government account, on a standard economic definition, can be said to show the surplus (savings) given in thelast line of this table.
2/ Includes land annuities, i.e. repayments on value of land sold by the State (approximately L m. 1.7 per year); American Loan - Marshall Plan Aid -Counterpart Fund (approximately 1 m. 1.0 per year); Central Bank Surplus Income (between L m. 2 and L m. 3 per year) plus fees and miscellaneousreceipts.
3/ Includes subsidies of final products such as butter and other milk products, wheat, bacon, carcass beef and grain storage grants: also grants forthe relief land annuities (on land sold by the state) and rates (land taes) on agricultural land.
Includes current expenditures on all forms of education. Primary and Secondary education account for 75% to 80% of the totals.5/ Gross receipts and Expenditures of the Department of Posts and Telegraphs, responsible for postal and telegraph as well as telephone lervices, areintegrated with the Central Gove.rnment account..
6/ Ccvers a variety of social benefits of a non-contributary nature such as old age and blind pensions, unemployment assistance with extensions foradults and children dependents, widows pensions, etc.
7/ Covers a variety of medical services, medicines, drugs as well as institutional and other services offered by the State to which various groupsof population.depending on their income bracket, are eligible.
8/ This item covers subsidies extended to Irish exporters to compensate them in part for a 15% surcharge on imports imposed by the U. K. in October19t - surcharge which was later reduced to 10%. The expenditure appears in the "Capital" budget, but because of its nature it has been addedin this table to Current Expenditures.
Souc;Arinual Budget Statements
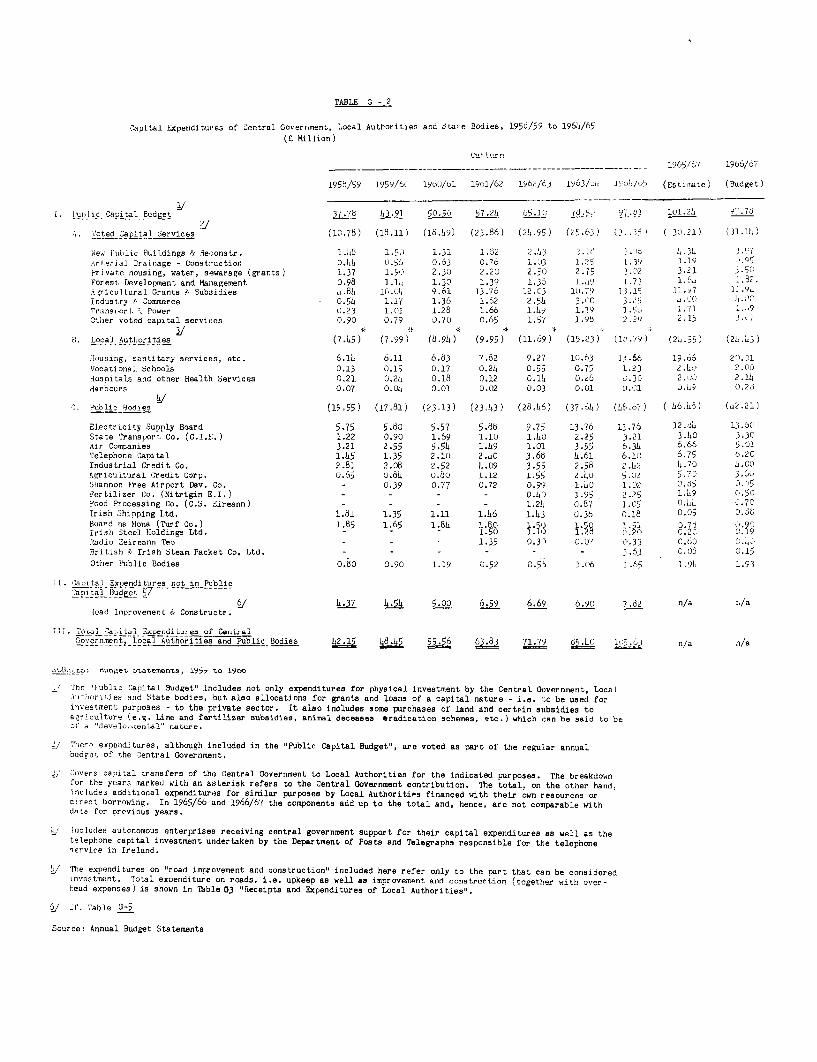
TABLE G - 2
Capital Expenditures of Central Government, Local Authorities and Stave Bovaes, i 195o/5(1 1o/6-
(f, Million)
ttunrn1965/67 1966/67
1956/59 1959/6( 1960/01 1901/62 1962/63 1963/,, 16lU/h (Estimate) (Budget)
1. lublic Caital_Budget 37.78 Q.91 50.56 J.2 A 7d 9 .4 11.2 97.76
A. Voted Capital Services (10.78) (18.11) (18.59) (23.86) (25.95) (25.63) (j ( 30.21) (31.15)
New unic Buildings & Reconstr. 1.h6 1.1 i.31 .1 2.u1,rterial Drainage - Construction 0.15 0.56 0.63 0.76 1.13 1.2 1. 3' -45l-rivate housing, water, sewarage (grants) 1.37 1.90 2.30 2.20 2.50 2.75 3. 02 3.21 3.51Fores. TDeelopment and Manaement- r98 1.h 1.3A 13O 1.35 1 1. 7, 1.1 1.62.
Aricultural Grants F, Subsidies 5.85 16.94 9.61 13.76 12 .C3 10. 79 1 1 11.)7 1 .94Industry 4 Commerce 0.55 1.17 1.36 1.62 2.55 3 .n P . 5.iTransrort ^ Power 0.23 1.01 1.28 1.66 1.59 1.19 . 40 1.71 1. 19Other voted capital services 0.90 0.79 0.70 0.65 1.57 1.9b 221) 2.15 3. 7
B. Local Authorities (7.55) (7.99) (8.95) (9.95) (11.69) (15.23) (O .) (2b.55) (2.53)
ousing, santitary services, etc. 6.14 6.1 6.83 7.82 9.27 10.63 13.66 19.66 20.01Vocational Schools 0.13 0.15 0.17 0.25 0.55 0.75 1.23 2.6 2.00
noaitaus amd other nealth Services 0.21 v.2 0.12 . 1 o .cu -2C2. 2. 11
Harbours 0.07 0.0 0.01 0.02 0.03 0.01 0 .1 0.h9 0.2d
f, Public Bois (19.55) (17.81) (23.13) (23.43) (28.L6) (3 7t) ( o 8 567 L6.15) (62.21)
Electricity Supply Board 5.75 5.80 5.57 5.86 9.75 13.76 13.76 12.o4 13.6State Transport Co. (C.I.E.) 1.22 0.90 1.69 1.10 1.50 2.25 3.21 3.40 3.30Air Companies 3.21 2.55 5.5L 1.59 1.01 3.55 6 35 6.66 5.01Telephone Capital 1.55 1.35 2.10 2.ho 3.68 5.61 6. 10 6.-5 6.20Industrial Credit Co. 2.81 2.08 2.52 4.09 3.55 2.58 22 1j.70 L .105
1
Agricultural Credit Corp. 0.65 0.85 0.80 1.12 1.55 2 60 5 52 .7uShannon Free Airport Dev. Co. - 0.39 0.77 0.72 0.99 1.D 1 .02 o.:5 D.5Fertilizer Co. (Nitrigin E.I.) - - - - 0.4o 1.95 2.25 1.59 0.5
Irish Shipping Ltd. 1.81 1.35 1.11 1.h6 1.53 0D36 C.18 0 05 o MBoard na Mona (Turf Co.) 1.85 1.65 1.85 1.80 1.50 1.50 .510Irish Steel Holdings Ltd. - - - 1.0 1.10 1.26 2Radio Eeireann Teo - - - 1.35 0.30 0.07 0.33 0.60 .4,British & Irish Steam Packet Co. Ltd. - - - - - - C3 D. 15Other Public Bodies 0.0 0.90 1.19 0.52 0.55 1.06 1 .6q 1.9 1.93
ft. -anital Exuenditures not in Publicapital Bud get 1
6J/ 67 l4 5.00 62 6.69 6.90 7.82 n/a r./aRoad Improvement & Constructr. 40.2
oyEnment,_Local Authorities and Public Bodies 1 L .7) 85.50 t. n/a n/a
4u6 tro) nunge statements, 1S9 to l9oc
/ The "lubloc Capital Budget" Includes not only expenditures for physical investment by the Central Government, LocalAuthorites and State bodies, but also allocations for grants and loans of a capital nature - i.e. to be used forinvestment purposes - to the private sector. It also includes some purchases of land and certrin subsidies toaprnculture (e.g. Lime and fertilizer subsidies, animal deceases eradication schemes, etc.) which can be said to beo' a ldevelopm.nt" -L- Iaue
2/ Tiee expenditures, although included in the "Public Capital Budget", are voted as part of the regular annualbudPn. of the cntral novarnment.
' Covers capital transfers of the Central Government to Local Authorities for the indicated purposes. The breakdownfor the years marked with an asterisk refers to the Central Government contribution. The total, on the other hand,includes additional expenditures for similar purposes by Local Authorities financed with their own resources ordirect borrowing. In 1965/66 and 1966/67 the components add up to the total and, hence, are not comparable withdata for previous years.
_i Includes autonomous enterprises receiving central government support for their capital expenditures as well as thetelephone capital investment undertaken by the Department of Posts and Telegraphs responsible for the telephone"prvira in Treland.
5/ The expenditures on "road improvement and construction" included here refer only to the part that can be consideredinvestment. Total exmenditure on roads, i.e. upkeep as well as improvement and construction (tonether with owve.head expenses) is shown in Table 03 "Receipts and EKpenditures of Local Authorities".
C. Table G-5
Source: Annual Budget Statements

n n. rnMQ' A %7n "U=11TMT TDO'V n~tl T nM'A T ATTrUnDTrrTVC2 -I o i o C rr) 1 oA
1958/59 1959/60 1960/61 1961/62 1962/63 1963/66. 196i/65
T million
Current ReceiptsRates 20.9 21.9 22.6 23.7 23.4 25.1 26;6Taxes on expenditure 1.0 1.2 1.2 1.3 1.1 1.4 1.4Gross rental income 5.2 5.4 5.6 5.8 5.9 6.2 6.3Current grants 18.4 19.6 21.0 21.4 25.1 27.2 32.8Repayment of loans 1.7 1.9 2.0 2.2 2.4 2.6 2.7Miscellaneous receipts 4.4 4.7 5.0 5.1 5.4 5.8 B.1
Total 51.7 54.7 57.3 59.6 63.5 68.3 77.9Capital Receipts
Capital grants 5.5 5.5 5.4 7.1 7.4 7.7 8.2Loans received 8.0 7.0 7.6 10.2 12.2 13.8 19.1Miscellaneous receipts 0.5 0.4 0.4 0.5 0.6 0.7 0.8
11. 12.9L 13 Y .L4 17. 20.2 22.2 28.
Mt . current and ,loual recelps - caoital 65.b 7.6 70.7 77.L 83.7 90.4 106.0
Current ExpenditureSubsidies, mainly housing 4.5 .7 L.9 5.1 5.3 5. :7National debt interest 6.4 6.8 7.0 7.4 7.7 8.2 9.1Current transfers 3.h 33 33 3.. 37 )-3Current expenditure on 34.7 36.0 38.0 40.7 44.3 46.9 56.8
goods and services
Total 49.1 50.9 53.1 56.5 60.7 64.4 75.9
Capital ExpenditureCapital transfer payments 0.5 0.6 0-9 0.9 10 12 1.hLoan repayments 3.3 3.6 3.6 3.8 4.0 4.4 4.7Loans to nrnn 1F7 29 3. 1 3 3-3 2 1Gross physical capital 11.1 10.4 10.3 13.1 14.4 17.1 20.9
formT in-
Total 16.6 16.7 17.6 20.9 23.C 26.1 30.1
Total expenditure -Totalnt endt e i 65.6 67.6 70.7 77.L 83.7 90.4 106.0
Source: National Income and Expenditure 1964.
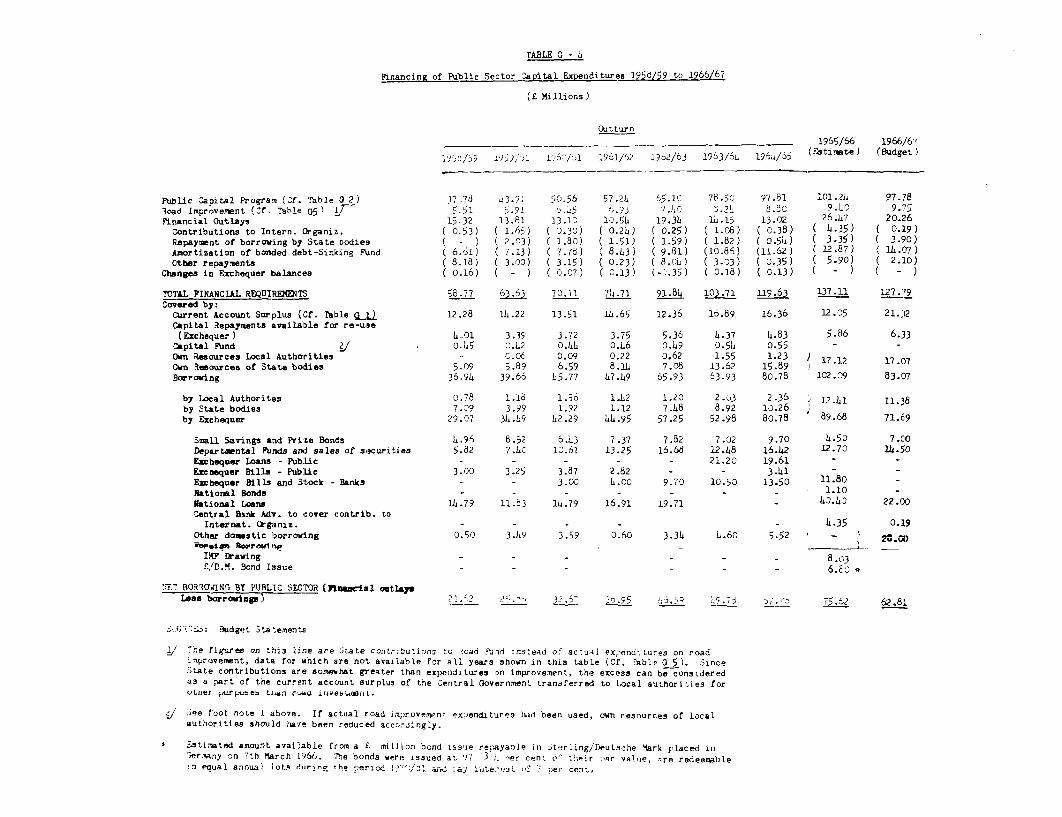
TABLE G - 6
Pinancing f Public Sector CaDital xpditures 19'tjj 667
(Z Millions)
Outturn
1965/66 1966/67
1350/59 19527/u I 1960/1 1961/52 1?62/63 1963/60 1968/65 (Estimate) (Budget
Public Capital Program (Cf. %ble 0 2) 37.7 L3.9) 50.56 57.2L8 65.10 78.50 97.81 101.2) 97.78load Improvement (Cf. Table 0
1 iff 5,51 5.5i 6.5. 6.73 7.I0 R.21 .S C.50 9.75Pinancial Outlays 15.32 13.82 13 .10 10.5L 19.3L 1L.15 13.02 26.7 20.26
Contributions to Intern. Organiz. ( 0.53) ( 1.65) ( 0.30) ( 0.2h) ( 0.25) ( 1.08) ( c.38) ( 6.35) ( 0.19)RApayment of borrowing by State bodies (- ) ( 2.03) ( 1.80) ( 1.51) ( 1.59) C 1.82) ( 0.5h) ( 3.35) ( 3.90)Amortization of bonded debt-Sinking Phnd ( 6.61) ( 7.13) ( 7.78) ( 8.63) ( 9.61) (10.86) (11.62) ( .1287) ( 1h.07)Ctber repayments ( 8.18) ( 3.00) ( 3.15) ( 0.23) ( 8.0) ( 3.03) ( 0.35) ( 5.90) ( 2.10)
Changes in Exchequer balances ( 0.16) ( - ) ( 0.07) ( 0.13) (-0.35) ( 0.18) ( 0.13) - ) ( -
TOTAL FINANCIAL REIRREMTS 58.77 3., 70.11 74.71 91.84 103.71 119.a 137.11 127.79Covered by:
Current Account Surplus (Cf. Table 12.28 16.22 13.51 16.65 12.36 16.89 16.36 12.05 21.32Capital Repayments available far re-use
(Exchequer ) 4.01 3.39 3.72 3.75 5.36 6.37 4.83 5.86 6.33Capital Fund . 0.45 C.L2 0.6h 0.66 0.69 0.5L 0.55 - -Own qesources Local Authorities -- c.06 0.09 0.22 0.62 1.55 1.23 ) 17.12 17.07Own Resources of State bodies 5.09 5.89 6.59 8.1h 7.08 13.62 15.89 'Barroring 36.94 39.66 65.77 L7.h9 65.93 63.93 8C.78 102.09 83.07
by Local Authorites 0.78 1.18 1.56 1.62 1.2C 2.03 2.36 121 11.38by State bodies 7.09 3.99 1.92 1.12 7.68 8.92 10.26by Exchequer 29.07 3. L9 h2.29 4.95 57.25 52.98 80.78 89.68 71.69
Small Savings and Prize Bonds 6.96 8.52 6.13 7.37 7.82 7.02 9.70 6.50 7.CODepartmental Runds and sales of securities 5.82 7.b0 12.61 13.25 16.68 12.68 16.62 12.70 14.50Exchequer Loans - Public - - - - - 21.20 19.61 -Exchequer Bills - Public 3.00 3.25 3.87 2.82 - - 3.61 -Exchequer Bills and Stock - Banks - - 3.00 4.00 9.70 10.50 13.50 11.80 -National Bonds . - - - - - 1.10 -National Loans 16.79 11.83 14.79 16.91 19.71 - 60.63 22.00Central Bank Adv. to cover contrib. to
Internat. (rganiz. - - - - - 6.35 0.19Other domestic borrowing 0.50 3.69 3.59 0.60 3.34 L.6o 5.52 - 28.0
IEV Drawing - - - . - - 8.03/D.M. Sond Issue - - - - - - 6.80.EtBORT (0WING B! PUBLIC SECTOR (Financial outla&s
less horrai-2 25 ."' ~2.5 2.95 L. .73 D7.73 2 62.81
J;U.E'.: Budget 3ta:ements
1/'e c-figures on this line are State contr:butions to ?oad ?Aid Instead or actual ex-'enditures on roadimprovement, data, for which are not available for all years shown in this table (Cf. ,able 0 5). SinceState contributions are somewhat greater than expenditures on improvement, the excess can be consideredas a part of the current account surplus of the Central Government tranferred to L:cal authorities forvLi.er purpute: ti.n rau investant.
iee foot note 1 above. If actual road improvenment exDenditures id been used, own resources of localauthorities should have been reduced accordingly.
* &stirated amount available from a i, milHon bond issue repayanle in Jterling/Deutsche Mark placed in,ermany on 7th March 1966. The bonds were issued at v7 3, J er cent, r" their 1',r value, *re redeemablei eaual annual lot.q. dring the jerod aQ7'/61 Ur.i r-y lintered f 7 per cent,
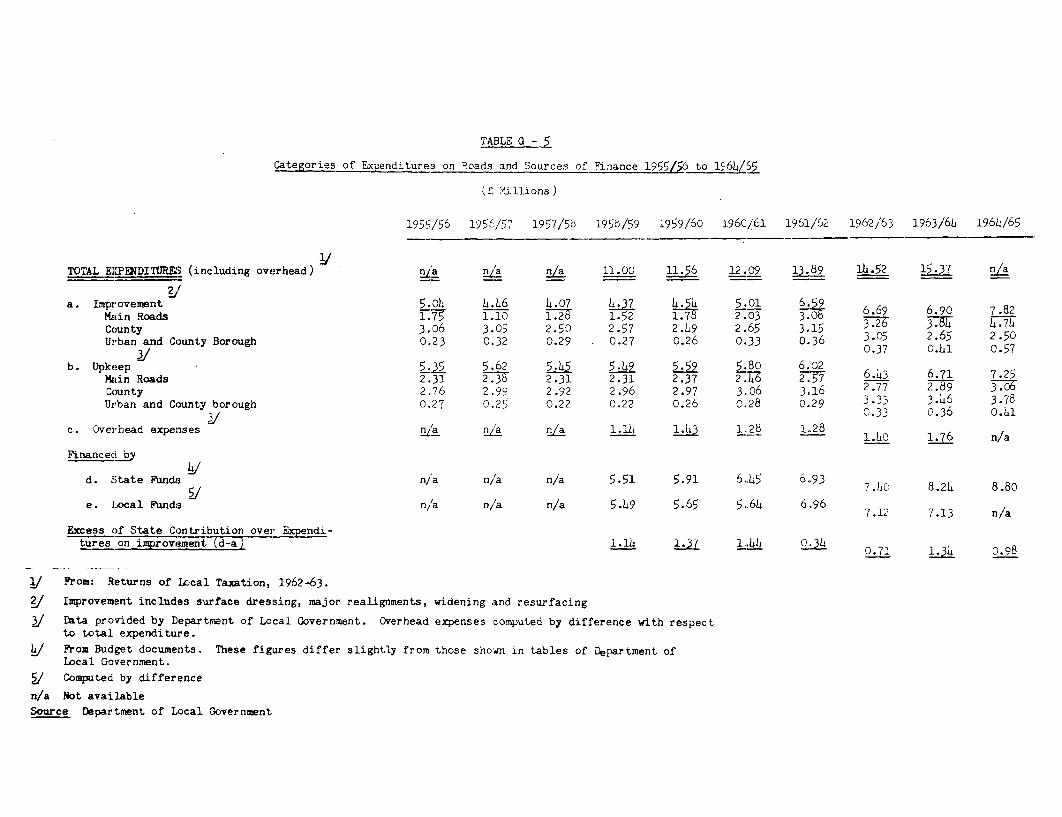
TABLE G0 j
Categories of Expenditures on Roads and Sources of Pinance 1955/ to 156h/65
(. Millions)
1955/56 1956/57 1957/56 1956/59 1959/60 1960/61 1961/62 1962/63 1963/6L 1964/65
TOTAL EXPENDITURES (including overhead) /a Ia /a 11.00 ll.6 12.09 11.89 14-.52 15.37 Ia
a. Improvement 5.0L b.h6 4.07 4. 7. .ol 6.69.8Main Roads 1.7 1.10 1.1.7 2.03 3. -- --County 3.06 3.05 2.50 2.57 2.L9 2.65 3.15 32 2- 3.74Urban and County Borough 0.23 0.32 0.29 0.27 0.26 0.33 0.36 3.05 2.65 2.50
3/ 0.37 0.L1 0.57b. Upkeep 5.L 5.62 5.5 5.h9 5 .g 5.80 6.02
Main Roads 2.31 2.W 2.31 2.31 2.37 2.49 2.57 6.L3 6.71 7.25County 2.76 2.99 2.92 2.96 2.97 3.06 3.16 2.77 2.89 3Urban and County borough 0.27 0.25 0.22 0.22 0.26 0.28 0.29 3.33 3.46 3.78
0.33 0.36 0.41c. Overhead expenses nZa 21a 2Za 1.1h 1. .28 1.28 1.40 1.76 n/aFinanced 11
d. State Funds n/a n/a n/a 5.51 5.91 6.45 6.,93 7.hC 8.24 8.80
e. Local Funds n/a n/a n/a 5.9 5.65 5.64 6.96 7.12 7.13 n/a
Excess of State Contribution over Expendi-tures on irVrovement d-a1.1
1. 1. 0.0.71 13 0.98
1/ From: Returns of Local Taxation, 1962-63.
2] Improvement includes surface dressing, major realignments, widening and resurfacing
/ ata provided by Department of Local Government. Overhead expenses computed by difference with respectto total expenditure.
From Budget documents. These figures. differ slightly from those shown in tables of Department ofLocal Government.
/ Computed by difference
n/a Not available
Source Department of Local Government
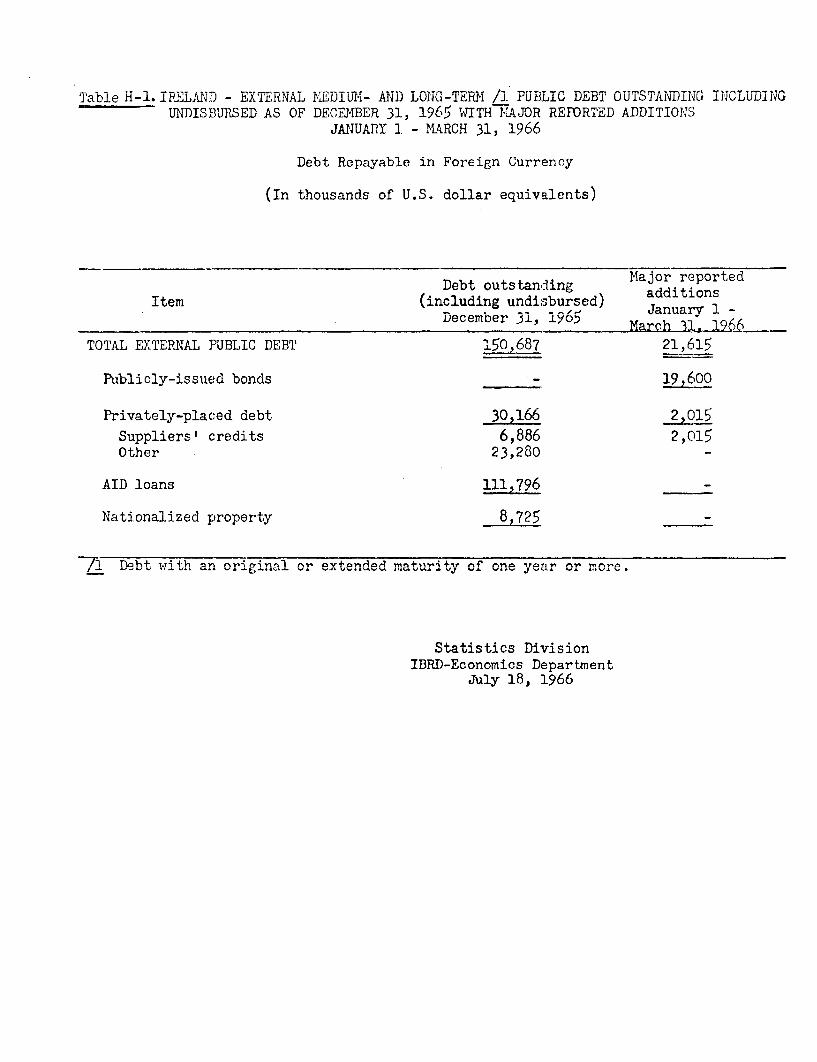
Table H-1. !RELMA - EATERNAL KEIuU- AND LUNG-TEM /1 UDi,-LU DEBT UUTS'TA1N DIK I0ULUDINGUNDISBURSED AS OF DECEMBER 31, 1965 WITHTMAJOR REFORTED ADDITIONS
jANUARY 2. - MARCH 31, 1966
Debt Repayable in Foreign Currency
(In thousands of U.S. dollar equivalents)
Major reportedDebt outstanding additions
Item (including undisbursed) anuarionsI --1 ,Januarv 1 -December 31, 1y> March 31, 1966
TOMAT VVTMMAT 1TT T( TVr1' I c AA7 s1 Al '
ruUy-_u0 u vuu -nub 7V U,V
Privately-placed debt 30,166 2,015Suoliersf credits 6.886 2,015Other 23,280 -
AID loans 111,796
Nationalized property 8,725
/I DTah+ I+i an original ov+ exnded mn+%4i+ ty of one y a o more.
Statistics DivisionIBRD-Economics Department
July 18, 1966

Table H-2.IRELAND - ESTIMATED CONTRACTUAL SERVICE PAYMENTS ON EXTERNAL MEDIUM- AND
LONG-TERM PUBLIC DEBT OUTSTANDING INCLUDING UNDISBURSED AS U DEUEMB .. L, .Ly1:>
WITH MAJOR REFORTED ADDITIONS JANUARY 1 - MARCH 31, 1966 1.
Debt Repayable in Foreign Currency
(In thousands of U.S. dollar equivalents)
PE ]
( GlU\ E.F PERICL) tPY:aKTS DING F ILD
II_tINC E RT S-
166 P ,67 7.74P 4.C 12, v5 5I967 164,553 6,C42 5,916 13,9 5&
196 cA56,51. ;i1 17291 5,rg 3, 7- I.'L I>7-. J .. ? .. 71 . -
1969 148,62c 5,n41 5,271 13,31719W7t 1/..,579C 0 ,.I24 <, 133, 7
1,1 47 132,1C 4,65 - 13, 31119171 1323, 9 2,7CC 1 5 31.
1973 114,799 b,67C 3,97C 12,641197A 6,2 ,39 36C1,31975 96,72C 976t 3,284 13,C 51976 86,954 A,93E 2,912 ,£J11977- 7,G1ó 9,79 -,51; 12,376
1979 5241 1 ,172 1,899 12,071193C 4e,06 12,225 1,544 13,169
l :~o in T-i(ZI2T
CET CUT ST(eEGIN EF FEFZICD) PAY.ErxTS CURIr.G FERICDO
1. ~ ~ ~ ~ P - U 1' ,- DTT
YEAR i. ISURSER 5Ec ZATCAi i ERST TCTAL
1967 19,6CC - 1,372 1,372
i962 19,6CC - 1,372 1,3721969 19,6CC . - . 1,372 1,372
197C 19,6 c 1,63 1,372 -3,C2197^1 - 1 7, -97 L f,6.3Ce---- 1,25 .2, E1972 16,341 1,63C 1,144 2,7731.973 14,711 1,63C 1,C3, 2,6591974 13,CE? 1,631 116. 2,5451975 11,452 1,63 EC2 2,431
1976 9,322 1,63C 688 2,?171977- -- , 153 .1,6 . . ..... 73 -2,2:'31978 6,563 1,63C 459 2,CC91979 4,934 1,63C . 345 1,97519d0 3,394 1,63 231

Tale H--2. IRELAND - RSTTMÅTT) CONTRACTUAL SERVICE PAYMENTS ON EXTERNAL MEDIUM- ANDIölMTERM PUBLIC DEBT OUTSTANDING INCLUDING UNDISBURSED AS OF DECEMBER 31, 1965
WITH MAJOR REPORTED ADDITIONS JANUARY 1 - MARCH 31, 1966 1 (CONT.)
Debt Repayable in ren rn
(In tlousands o U.4 IT.C d a eui~~.LI& ~ ~ ~ 4 UJV. ~ ~/L U.i. . .L.La£ V4ULM C.L VO.A VUJ
PAGE 2
PR]VATELY-FLACEC CERT --LTTAL
DE8T GUTST(PEGIN CF PERICO) PPYVI-iTS GURING FERID
INCLU1INC AyCRI -YEAR UNrISlURSE e.ZAlT-iGN -- INTEREST--- TGTAL
1966 30,166 3,939 1,591 5,53C1967 28,242 4,117.1,453 5,57C1968 24,125 3,20E 1,24C 4,4481969 20,917 3 r 1,i63 4,2841970 17,696 1,833 941 2,774I107 1 0£~i1 1. fIC1 CI
1972 14,716 1,C2C 79C 1,8101973 1,6 ll 016 7 -1,5 2Ä- ýLi U t.L *~J e-.? .d
1974 12,280 6Cc 695 1,1951 9J
1976 11,53C 75C 623 1,373,-- 197 7 - 10,7FC -- 75C 5 83 l1,333
1978 10,c30 75C 542 1.,2921979 -9,28C 75c 5e 2- 1, 2521980 8,53C 1,83( 462 2,292
SUPPLIES CREITS
OEUT CUTST(BEGIN CF PERICO) - PAYMENTS DURING FERIJD--
INCLUCING AVGRTI-YEAR UNDISBURSEC ZATION INTEREST TOTAL
1966 6,8E6 1,939 381 2,3201967 6,962 2,117 353 - - 2,4711958 4,845 1,2CS 251 1,4591969 -- - 3,637 - 1,22C 184 . 1,4C4197C 2,416 1,233 117 1,35C
1972 636 42C 3C 45C1973 216 216 - 8 224

Table H-2. IRELAND - ESTIMATED CONTRACTUAL SERVICE PAYMENTS ON EXTERNAL MEDIUM- ANDLONG-TERM PUBLIC DEBT OUTSTANDING INCLUDING UNDISBURSED AS OF DECEMBER 31, 1965
WITH MAJOR REPORTED ADDITIONS JANUARY 1 - MARCH 31, 1966 Q (CONT.)
Debt Repayable in Foreign Currency
(In thousands of U.S. dollar equivalents)
PAGE 3
PRIV-PLACEC CE8T-uIHER
DEBT CUTST(REGIN CF PERICD)- PAYMENTS GURING FERI6X
INCLUDOING AMERTI--YEAR UNCISCURSEC -- ZATION -INTEREST TOTAL
1966 23,2EC 2,C0C 1,209 3,2C91967 21,28 0 2 t 0 CC...-1,099 - 3,0991968 19,280 2,COC 989 2,9891969 17,2E0-2,000 879. 2,879197C 15,2EC 60C 824 1,424
-- 197 1-----14,668 C - .60 --7-9 2 -.--- - 1, 3921972 14,C8c 6CC 76C 1,3601973 13,4f0l 60 *72C 1,321974 12,88C 6Cc 695 1,2951975 12,28 75C 663 1,4131976 11,530 75C 623 1,373191,777 - 75C 583 - 1,333197E8 10,030 75C 542 1,2921 28r 72 1, 252
1980 8,530 1,83C 462 2,292
A1C LCANS
DEET CUTSTÅPE.GIN -IF PERICD) - PAYMENTS DIRING FERIcr~
INCLUCING tCR71I--- YEAR UNOIS2URSEC--- -ZATIGN.INT.EST TT.AL.
1966 111,796 3,123 2,775 5,EgE1967 108,673 -3,203 2,690 5,8931968 1C5,470 3,925 2,604 6,5291969 - 101,545 C4, 2 - 2-,513. _653E1970 97,52C 4, 126 2,412 -6, 53
-1.97 - -- 9 3,9 39.4 '. 91 3? £. T, 30 -1972 88,391 5,129 2:178 7,3071973 _' 83,262 _92-5,25e 248 -7 1,3061974 78.C4 614. 1,9'11,C-1975 71,84 --6,32C 1,762.- b,C821976 65,520 6,477 1,59 8,C75
-5 9 t~5 C-434 J-t.131,41 c-_a3- 79,. -7 1 2 1 4 r a, l
1979 .44,027- 79.1,051 8,544iCaC 36, )2 7 5 ,
~~~~7 Lv--- -. J.-- -- . - --
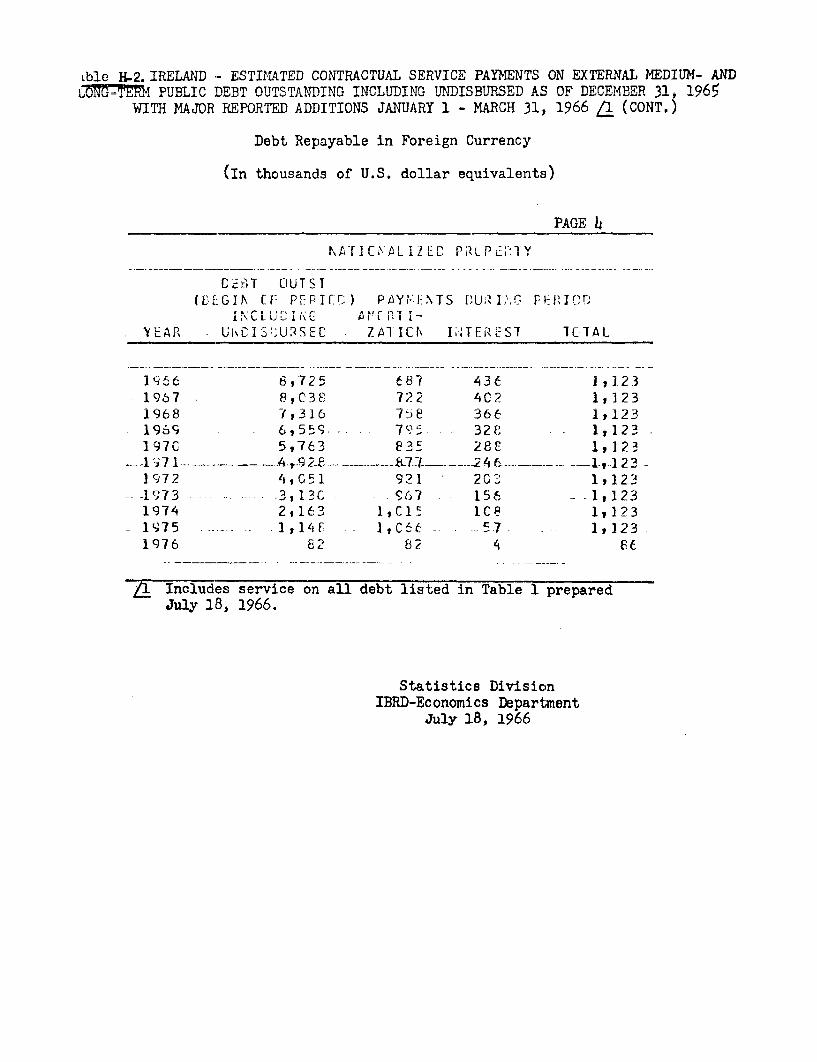
ible H-2. IRELAND - ESTIMATED CONTRACTUAL SERVICE PAYMENTS ON EXTERNAL MEDIUM- AND1. DEB 02 -- - -- -JJJ' .- 7JLPUBLICr' ~J DET1 UT~TDIN INCLUDINGJr UNDISBURSED AS OF DECEMBER 31, 1965
WITH MAJOR REPORTED ADDITIONS JANUARY 1 - MARCH 31, 1966 / (CONT.)
Debt Repayable in Foreign Currency
(In thousands of U.S. dollar equivalents)
PAGE it, -r T r \ A i i ? i: r~ nl -3 1 v
1 >1 L L L, r INL _l
fl n 1 r rUiiT 45T
(ELGI\ [F PEPIf-) PAYNETS DU! I 1 G FiRICDrIITLUC1ING r' I
Y AR UiC1S: USED ZA1 ICt\ I 1TEREST 1G1AL
i956 6,725 67 1112.31967 8,38 722 4C2 1,1231968 7,316 75C 366 1,1231969 6,559 795 328 1,123197C 5,763 e3z 28E 1,123
-197 - 928 --.-- l7~L 46 - - 1-,123-1972 4,C51 921 203 1,123-1973 .3,13C 967 156 -- -1,123197,4 2,163 1,C15 1Ce 1,123
- 1975 1,14F 1,C6 57 1,1231976 82 82 4
Includes service on all debt listed in Table 1 preparedJuly 1.8, 1966.
Statistics DivisionIBRD-Economics Department
July 18, 1966