retrofitting an atomic force microscope with photothermal...
TRANSCRIPT

Retrofitting an atomic force microscope with photothermal excitation for aclean cantilever response in low Q environmentsAleksander Labuda, Kei Kobayashi, Yoichi Miyahara, and Peter Grütter Citation: Rev. Sci. Instrum. 83, 053703 (2012); doi: 10.1063/1.4712286 View online: http://dx.doi.org/10.1063/1.4712286 View Table of Contents: http://rsi.aip.org/resource/1/RSINAK/v83/i5 Published by the American Institute of Physics. Related ArticlesThe additive effect of harmonics on conservative and dissipative interactions J. Appl. Phys. 112, 124901 (2012) Note: Radiofrequency scanning probe microscopy using vertically oriented cantilevers Rev. Sci. Instrum. 83, 126103 (2012) Switching spectroscopic measurement of surface potentials on ferroelectric surfaces via an open-loop Kelvinprobe force microscopy method Appl. Phys. Lett. 101, 242906 (2012) Enhanced quality factors and force sensitivity by attaching magnetic beads to cantilevers for atomic forcemicroscopy in liquid J. Appl. Phys. 112, 114324 (2012) Invited Review Article: High-speed flexure-guided nanopositioning: Mechanical design and control issues Rev. Sci. Instrum. 83, 121101 (2012) Additional information on Rev. Sci. Instrum.Journal Homepage: http://rsi.aip.org Journal Information: http://rsi.aip.org/about/about_the_journal Top downloads: http://rsi.aip.org/features/most_downloaded Information for Authors: http://rsi.aip.org/authors
Downloaded 18 Dec 2012 to 132.206.186.116. Redistribution subject to AIP license or copyright; see http://rsi.aip.org/about/rights_and_permissions

REVIEW OF SCIENTIFIC INSTRUMENTS 83, 053703 (2012)
Retrofitting an atomic force microscope with photothermal excitationfor a clean cantilever response in low Q environments
Aleksander Labuda,1 Kei Kobayashi,2 Yoichi Miyahara,1 and Peter Grütter1
1Department of Physics, McGill University, Montreal, Quebec H3A 2T8, Canada2Office of Society-Academia Collaboration for Innovation, Kyoto University, Katsura, Nishikyo,Kyoto 615-8520, Japan
(Received 27 February 2012; accepted 22 April 2012; published online 10 May 2012)
It is well known that the low-Q regime in dynamic atomic force microscopy is afflicted by instru-mental artifacts (known as “the forest of peaks”) caused by piezoacoustic excitation of the cantilever.In this article, we unveil additional issues associated with piezoacoustic excitation that become ap-parent and problematic at low Q values. We present the design of a photothermal excitation systemthat resolves these issues, and demonstrate its performance on force spectroscopy at the interface ofgold and an ionic liquid with an overdamped cantilever (Q < 0.5). Finally, challenges in the interpre-tation of low-Q dynamic AFM measurements are discussed. © 2012 American Institute of Physics.[http://dx.doi.org/10.1063/1.4712286]
I. INTRODUCTION
Dynamic atomic force microscopy1 (dAFM) has becomea ubiquitous tool in surface science in the last two decades,and its versatility is made evident by the wide span of stud-ies in environments ranging from ultrahigh vacuum, to cryo-genic temperatures, and to liquids. It has recently been iden-tified that piezoacoustic excitation of cantilevers can preventaccurate interpretation of data in all of these environments,2–4
when using frequency modulation (FM) AFM.5 This articleextends the discussion to low-Q environments (near and be-low Q values of 1), where amplitude modulation (AM) AFMis the preferred dAFM method.
Section II discusses problems with piezoacoustic exci-tation that are unique to low-Q environments – in contrastto the well-behaved photothermal excitation.6 Afterwards,the design of our photothermal excitation unit – dubbed“the photothermal panther” – is presented and its perfor-mance is benchmarked in water. Then, photothermal ex-citation is employed for imaging and force spectroscopyon Au(111) in 1-butyl-3-methylimidazolium hexafluorophos-phate [BMIM][PF6] – a highly viscous ionic liquid. The pho-tothermal dAFM measurement is compared to simultaneouslyacquired static AFM (sAFM) data, as both provide indepen-dent measurements of the solvation stiffness profile. Finally,limitations and complications that pertain to dAFM in low-Qenvironments are discussed.
II. PROBLEMS WITH PIEZOACOUSTIC EXCITATION
The benefits of photothermal excitation over piezoacous-tic excitation in FM-AFM have recently been outlined in greatdetail.4 The “forest of peaks”7 observed using piezoacousticexcitation severely complicates the interpretation of the mea-sured signals. In fact, accurate recovery of the conservativeand dissipative forces may become impossible if the tempera-ture of the instrument changes by as little as a few mK becausethe “forest of peaks” is temperature-dependent4 – it can driftand distort throughout the experiment.
Driving the cantilever at a fixed frequency greatly sim-plifies the interpretation of data as the frequency-dependenceof the piezoacoustic excitation can be disregarded. This factfavors the use of AM-AFM for piezoacoustic excitation inliquids. However, the ratio of the cantilever excitation thatarises from fluid vibrations (fluid-borne excitation), as op-posed to movement of the cantilever base (structure-borneexcitation),8 is unknown a priori; knowledge of this ratiois necessary for extracting quantitative force and dissipationmeasurements.9
Nevertheless, fundamental problems with piezoacousticexcitation persist in low-Q environments when used in con-junction with the optical beam deflection method:10 the mea-sured oscillation amplitude of the cantilever and the true os-cillation of the tip do not relate in any simple manner, as isgraphically represented in Figure 1.
To illustrate this problem, we have used recent modellingof cantilever dynamics in liquids9 to plot the transfer func-tion of the cantilever in the limiting case of structure-borne
FIG. 1. (a) Piezoacoustic excitation drives the cantilever by moving the baseof the cantilever, leading to complex cantilever dynamics that are frequencydependent: the measured angle of the cantilever tip does not relate to os-cillation amplitude in any simple way for Q factors around and below 1.(b) Photothermal excitation drives the cantilever via stress-induced cantileverbending: the shape of the cantilever is well defined. (Artistic rendition ofcantilevers and gold background courtesy of Magdalena Wielopolski).
0034-6748/2012/83(5)/053703/8/$30.00 © 2012 American Institute of Physics83, 053703-1
Downloaded 18 Dec 2012 to 132.206.186.116. Redistribution subject to AIP license or copyright; see http://rsi.aip.org/about/rights_and_permissions

053703-2 Labuda et al. Rev. Sci. Instrum. 83, 053703 (2012)
loading only. We restrict the following discussion to the firsteigenmode, as it suffices to illustrate the primary problem athand. Figure 2 demonstrates that the measured oscillation am-plitude strongly deviates from the true amplitude if it is drivenoff-resonance. In other words, the deflection sensitivity (inunits of nm/V) is only valid around the resonance. Conversely,photothermal excitation has a constant sensitivity throughoutthe usable spectrum because the bending shape is frequency-independent.11 Figure 2(b) suggests that a measurement of os-cillation amplitude is reliable throughout the spectrum whenusing photothermal excitation, as opposed to piezoacousticexcitation.
This calibration predicament becomes especially prob-lematic in overdamped environments (Q < 0.5), where thecantilever is excited below resonance. In fact, it would per-haps be foolish to excite the cantilever at its natural frequency,because the second eigenmode may have a larger response atthat frequency. In any case, for piezoacoustic excitation, thedAFM sensitivity becomes a function of the drive frequency,the natural frequency, the Q factor, and the ratio of fluid-borneto structure-borne excitation. Calibrating the AFM sensitivitybecomes difficult, if not impossible.
The above-mentioned problems do not only affectinterpretation of acquired data, they can also prevent regulartopographical imaging. Depending on the ratio between fluid-borne and structure-borne excitation, the measured amplitudemay increase or decrease as the tip approaches the surface,potentially prohibiting stable feedback required for imaging.For example, if structure-borne excitation dominates, thebase of the cantilever moves with an amplitude larger thanthe cantilever tip, as illustrated in Figure 1(a). In that case, themeasured angular deflection of the cantilever becomes larger
(a)
(b)
FIG. 2. (a) The first eigenmode of a driven cantilever with Q = 2 is simu-lated for photothermal excitation (with fixed force amplitude) and for piezoa-coustic excitation (with fixed base amplitude) around the natural frequency(10 kHz). The photothermal response is simply that of a harmonic oscillator,i.e., the transfer function of the cantilever. As illustrated in Figure 1(b), theamplitude measured by piezoacoustic excitation does not correspond to theactual oscillation amplitude, except near the resonance frequency. (b) In otherwords, there is an amplitude calibration error when driving the cantilever off-resonance, which becomes inevitable for very low Q environments.
as the cantilever approaches the surface, rendering AM-AFMimaging difficult, if not impossible.
All the above-mentioned problems are resolved by em-ploying photothermal excitation instead of piezoacousticexcitation.
III. THE PHOTOTHERMAL PANTHER
The photothermal panther is a retrofit to our exist-ing home-built electrochemical (EC) AFM12 designed foratomic-scale friction force microscopy in electrochemicalenvironments.13 The only hardware modification to the pre-vious design was the addition of a magnetic docking stagethat allows the panther to be mounted effortlessly and rigidlywith ∼μm repeatability.
A. Optomechanical design
The design of the photothermal panther and its integra-tion to the existing ECAFM is best explained graphically. Thissection describes some additional details, with reference toFigure 3.
A 20 mW blue laser-diode (DL-LS5042, Sanyo) lightbeam is collimated to ∼1 mm by an aspheric collimation lens(352610-A, Thorlabs) with 4 mm effective focal length. Thecollimated light beam is reflected off a polarizing beamsplit-ter towards a 567 nm longpass dichroic mirror (DMLP567R,Thorlabs) that combines the red detection light beam and theblue excitation light beam. The existing optics of the ECAFMfocus both light beams onto the cantilever, as well as rotatetheir polarization directions by 90◦. The rotation in polariza-tion guides the red light towards the photodetector after reflec-tion, as well as prevents blue light from returning into the bluelaser-diode which could cause lasing instabilities. Instead, theblue light is mostly absorbed by a yellow filter, which alsoacts as a sight glass for aiding the alignment of both lightbeams onto the cantilever. Two micrometer thumbscrews con-trol the rotation angle of the laser-diode and the beamsplitter,thereby enabling 2-axis positioning of the blue laser onto thecantilever.
Additionally, since the previous description of our home-built ECAFM,12 the collimated diameter of the detection lightbeam was reduced to 0.65 mm, and the effective focal lengthwas increased to 25 mm. These changes reduced the diver-gence of the light beam by 4.5×, and therefore reduced thedetection noise by the same ratio.14
The fully assembled ECAFM 3D technical drawingand the internal components can be interactively viewed inFigure 4.
B. Electronics
The blue laser-diode is driven in constant-power mode(WLD3343, Wavelength Technology) by using the in-tegrated photodetector of the laser-diode for feedback.The drive current is modulated at 300 MHz using avoltage-controlled oscillator (POS-535+, Mini-Circuits) to
Downloaded 18 Dec 2012 to 132.206.186.116. Redistribution subject to AIP license or copyright; see http://rsi.aip.org/about/rights_and_permissions

053703-3 Labuda et al. Rev. Sci. Instrum. 83, 053703 (2012)
FIG. 3. The photothermal panther integrates a blue light beam into the existing AFM optical system to enable photothermal excitation of the cantilever.
Downloaded 18 Dec 2012 to 132.206.186.116. Redistribution subject to AIP license or copyright; see http://rsi.aip.org/about/rights_and_permissions

053703-4 Labuda et al. Rev. Sci. Instrum. 83, 053703 (2012)
FIG. 4. Interactive 3D technical drawings of (a) the assembled ECAFM and (b) the internal optics and mechanics. Click image to activate. Use ctrl, shift, tozoom and pan.
reduce optical feedback and interference as described inRef. 15.
Most importantly, the blue light power is modulated forphotothermal excitation of the cantilever using a power split-ter/combiner (PRSC-2050, Mini-Circuits). An input AC drivesignal modulates the laser power output with a modulationdepth determined by the drive amplitude. The circuit allowsmodulation of the laser power for frequencies between 1 kHzand 3 MHz, which covers the range of typical cantilever drivefrequencies.
Also, our previous controller was replaced by the Nano-nis SPM controller, allowing reliable imaging, the acquisitionof transfer functions, and enabling fast force spectroscopy.
IV. PROOF-OF-PRINCIPLE IN MODERATE Q
We first demonstrate the capabilities of the photothermalpanther in a moderate Q environment – water – where a clearcantilever resonance peak is observable. A gold-coated can-tilever was used because it has higher photothermal efficiencythan an uncoated one.16
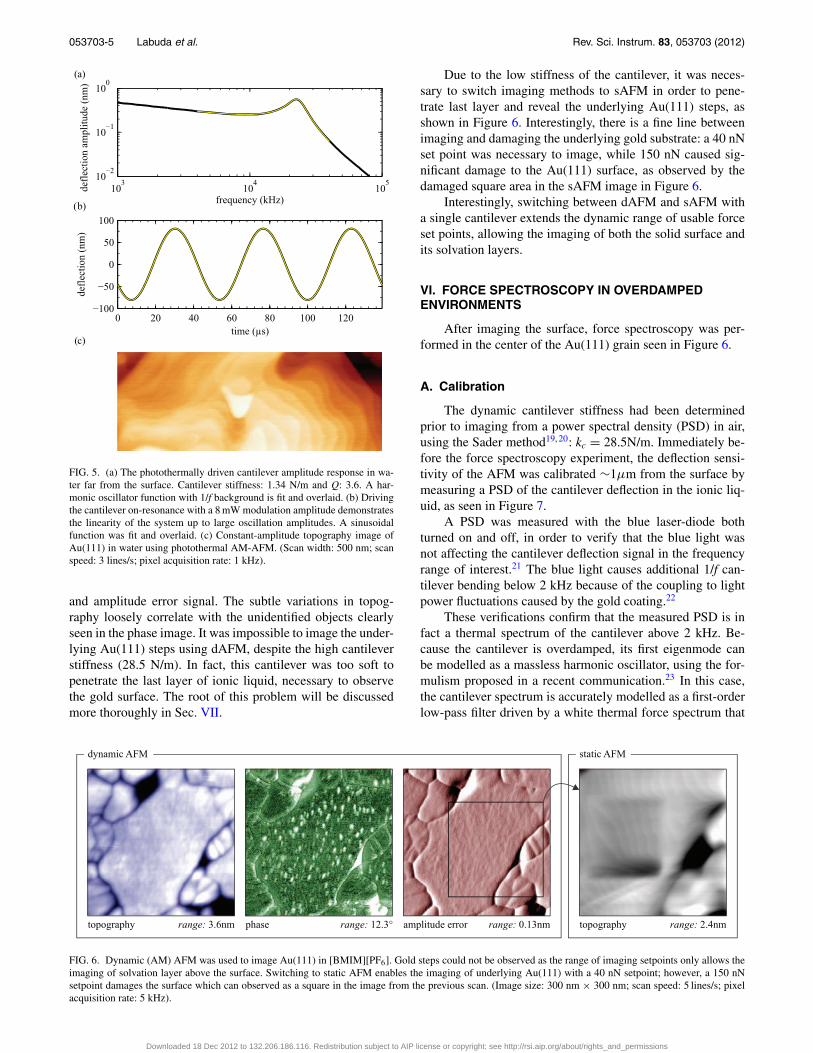
A photothermally driven transfer function of the can-tilever is shown in Figure 5(a). Overlaid is a fit to a har-monic oscillator model with a multiplicative 1/f background;
the model fits the data impeccably. The 1/f background (withan exponent of 0.36 set as a free fitting parameter) is attributedto the frequency-dependence of the photothermal driving ef-ficiency, i.e., the photothermal excitation transfer function.4
The close agreement to the harmonic oscillator model isreassuring, as any AM-AFM theory1, 17, 18 used to interpret themagnitude and phase response throughout the experiment isbased on the assumption that the cantilever can be describedas a harmonic oscillator.
In Figure 5(b), the linearity of the system is demonstratedby driving the cantilever on-resonance at high power (15 mWat roughly 50% modulation depth) and measuring its deflec-tion. A sinusoidal fit suggests highly linear behaviour; theresidual plot deviates by no more than 0.3% of the oscillationamplitude (not shown).
Finally, the imaging capability of the system is illustratedin Figure 5(c) by the constant-amplitude topography image ofAu(111) steps acquired in water using AM-AFM.
V. IMAGING IN OVERDAMPED ENVIRONMENTS
A gold sample was imaged in [BMIM][PF6] using AM-AFM. Figure 6 presents a constant-amplitude topography im-age of a Au(111)-oriented grain, along with the phase signal
Downloaded 18 Dec 2012 to 132.206.186.116. Redistribution subject to AIP license or copyright; see http://rsi.aip.org/about/rights_and_permissions
053703-5 Labuda et al. Rev. Sci. Instrum. 83, 053703 (2012)
FIG. 5. (a) The photothermally driven cantilever amplitude response in wa-ter far from the surface. Cantilever stiffness: 1.34 N/m and Q: 3.6. A har-monic oscillator function with 1/f background is fit and overlaid. (b) Drivingthe cantilever on-resonance with a 8 mW modulation amplitude demonstratesthe linearity of the system up to large oscillation amplitudes. A sinusoidalfunction was fit and overlaid. (c) Constant-amplitude topography image ofAu(111) in water using photothermal AM-AFM. (Scan width: 500 nm; scanspeed: 3 lines/s; pixel acquisition rate: 1 kHz).
and amplitude error signal. The subtle variations in topog-raphy loosely correlate with the unidentified objects clearlyseen in the phase image. It was impossible to image the under-lying Au(111) steps using dAFM, despite the high cantileverstiffness (28.5 N/m). In fact, this cantilever was too soft topenetrate the last layer of ionic liquid, necessary to observethe gold surface. The root of this problem will be discussedmore thoroughly in Sec. VII.
Due to the low stiffness of the cantilever, it was neces-sary to switch imaging methods to sAFM in order to pene-trate last layer and reveal the underlying Au(111) steps, asshown in Figure 6. Interestingly, there is a fine line betweenimaging and damaging the underlying gold substrate: a 40 nNset point was necessary to image, while 150 nN caused sig-nificant damage to the Au(111) surface, as observed by thedamaged square area in the sAFM image in Figure 6.
Interestingly, switching between dAFM and sAFM witha single cantilever extends the dynamic range of usable forceset points, allowing the imaging of both the solid surface andits solvation layers.
VI. FORCE SPECTROSCOPY IN OVERDAMPEDENVIRONMENTS
After imaging the surface, force spectroscopy was per-formed in the center of the Au(111) grain seen in Figure 6.
A. Calibration
The dynamic cantilever stiffness had been determinedprior to imaging from a power spectral density (PSD) in air,using the Sader method19, 20: kc = 28.5N/m. Immediately be-fore the force spectroscopy experiment, the deflection sensi-tivity of the AFM was calibrated ∼1μm from the surface bymeasuring a PSD of the cantilever deflection in the ionic liq-uid, as seen in Figure 7.
A PSD was measured with the blue laser-diode bothturned on and off, in order to verify that the blue light wasnot affecting the cantilever deflection signal in the frequencyrange of interest.21 The blue light causes additional 1/f can-tilever bending below 2 kHz because of the coupling to lightpower fluctuations caused by the gold coating.22
These verifications confirm that the measured PSD is infact a thermal spectrum of the cantilever above 2 kHz. Be-cause the cantilever is overdamped, its first eigenmode canbe modelled as a massless harmonic oscillator, using the for-mulism proposed in a recent communication.23 In this case,the cantilever spectrum is accurately modelled as a first-orderlow-pass filter driven by a white thermal force spectrum that
FIG. 6. Dynamic (AM) AFM was used to image Au(111) in [BMIM][PF6]. Gold steps could not be observed as the range of imaging setpoints only allows theimaging of solvation layer above the surface. Switching to static AFM enables the imaging of underlying Au(111) with a 40 nN setpoint; however, a 150 nNsetpoint damages the surface which can observed as a square in the image from the previous scan. (Image size: 300 nm × 300 nm; scan speed: 5 lines/s; pixelacquisition rate: 5 kHz).
Downloaded 18 Dec 2012 to 132.206.186.116. Redistribution subject to AIP license or copyright; see http://rsi.aip.org/about/rights_and_permissions

053703-6 Labuda et al. Rev. Sci. Instrum. 83, 053703 (2012)
FIG. 7. Thermal spectrum of the cantilever in air, used to calibrate the stiff-ness, and the thermal spectrum in [BMIM][PF6] near the gold surface, usedto calibrate the damping. Turning on the blue light confirms that the measuredspectrum around 10 kHz is in fact a thermal spectrum, which therefore canbe used to calibrate the AFM using the fluctuation-dissipation theorem andthe measured damping.
can be determined by the fluctuation-dissipation theorem.24 Insummary, the thermal PSD for overdamped cantilevers equals
4kB T
kc(2π fro)
1
1 + ( f/ fro)2, (1)
where fro is the roll-off frequency of the low-pass filter, andkBT is the thermal energy of the harmonic oscillator. Fittingthe measured PSD in Figure 7 with this equation determinesfro and calibrates the sensitivity of the AFM.
Finally, the transfer function of the cantilever can be de-fined at any drive frequency f by its magnitude
|C| = 1
kc
1√1 +
(f
fro
)2(2)
and phase
θC = −atan
(f
fro
). (3)
B. Results
Two hundred approach curves were performed in thespan of 100 s. Both dAFM and sAFM signals were mea-sured simultaneously. The dAFM was performed by oscillat-ing the cantilever with a constant photothermal driving forceof 7 nN amplitude at 20 kHz, and measuring its magnituderesponse |C| and phase response θC . All 200 approach curveswere highly reproducible, as demonstrated by the movie inFigure 8. The high level of reproducibility (within noise) sug-gests that the tip remained stable throughout the measurementand warrants averaging the 200 approach curves.
Figure 9(a) presents the averaged dAFM data, along withthe averaged sAFM deflection. Note that the dAFM oscilla-tion amplitude was below 200 pm, which is much smaller thanthe [BMIM][PF6] ion-pair diameter, and the sAFM deflectionremained below 60 pm across the solvation profile. Therefore,the dAFM and sAFM are independent measurements25 of thesolvation profile.
FIG. 8. Movie of 200 approach curves towards Au(111) in [BMIM][PF6],acquired after the calibration in Figure 7. The magnitude response |C| andphase response θC of the cantilever is shown. The thick lines represent theaveraged profiles, while the thin lines represent single approach curves. Twoapproach curves were acquired per second, with an approach speed of 70nm/s. The sample position was corrected for drift; the drift was mostly linearwith a rate of 2 pm/s. No isolation hood was used. (enhanced online) [URL:http://dx.doi.org/10.1063/1.4712286.1].
In Figure 9(b), the interaction stiffness and damping mea-sured by dAFM were obtained by23
γi = − 1
ω
[sin θC|C| − sin θCs
|Cs |]
(4)
and
ki = cos θC|C| − cos θCs
|Cs | , (5)
where |Cs | and θCs are the magnitude and phase response mea-sured at the start of the experiment during the calibration pro-cedure. Although the calibration of the cantilever assumed amassless harmonic oscillator model, Eqs. (4) and (5) apply forAM-AFM at all Q values, and are mathematically identical tostandard AM-AFM theory.18
The interaction force measured by sAFM is proportionalto the tip position, related by kc, and the corresponding stiff-ness, plotted in Figure 9(c), is calculated as the derivative ofinteraction force with respect to tip-sample distance.
VII. DISCUSSION
Despite resolving all the complications that arise due topiezoacoustic excitation (discussed in Sec. II) by the use ofclean photothermal excitation, the interpretation of measuredsignals remains non-trivial. This section discusses the resultsin Figure 9.
A. Offset in stiffness and damping
Note that there are offsets in stiffness and damping at4.5 nm tip-sample distance for the dAFM data in Figure 9(b).These offsets represent changes in stiffness and damping be-tween the 4.5 nm and ∼1 μm tip-sample distances; the latteris the distance at which the cantilever was calibrated.
The offset in damping can be mostly attributed to squeezefilm damping of the cantilever. The offset in stiffness is due
Downloaded 18 Dec 2012 to 132.206.186.116. Redistribution subject to AIP license or copyright; see http://rsi.aip.org/about/rights_and_permissions

053703-7 Labuda et al. Rev. Sci. Instrum. 83, 053703 (2012)
FIG. 9. (a) Averaged data from Figure 8 and the simultaneously acquired(averaged) deflection signal. (b) The measured data were converted into phys-ical signals. (c) The independent measurements of stiffness (dynamic andstatic) are plotted together. The two correspond very well (up to an offset)far from the surface, however dynamic AFM breaks down near the surfacebecause the interaction stiffness becomes a large fraction of the cantileverstiffness (28.5 N/m).
to either a calibration error or a true change in effective can-tilever stiffness. These offsets are instrumental artifacts thatshould be disregarded during the interpretation of tip-samplephysics, and could be minimized by calibrating the cantilevermuch closer to the sample surface, say 15 nm instead of 1 μmaway. In other words, these offsets relate to cantilever-sampleinteractions, rather than tip-sample interactions.
Nevertheless, the offset in stiffness is worrisome, as itsuggests that the assumption of a constant cantilever stiff-ness (in air versus liquid) may be wrong. In fact, because the
damping and mass loading of the cantilever are not uniformacross the full length of the cantilever (due to the proximityto the surface at an angle), the modal shape of the cantilevermay be skewed and cause a change in effective stiffness26
that depends on the cantilever-sample distance. For the data inFigure 9, this effect is small.
B. Dynamic vs static stiffness
Figure 9(c) overlays the stiffness profile as measured bythe dynamic and static AFM methods. Disregarding the offsetin dynamic stiffness, explained in Sec. VII A, the two datasetsagree very well beyond 2 nm from the surface. But below 2nm, for the two or three last hydration layers, both methodsdeviate significantly.
Hooke’s law, used to interpret the sAFM measurement,remains accurate even for situations where the interactionstiffness greatly exceeds the cantilever stiffness – as long asthe quasistatic condition is respected and no jump instabilitiesoccur. We believe the sAFM stiffness profile in Figure 9(c) tobe very accurate.
On the other hand, the stiffness profile extracted fromdynamic AFM becomes questionable close to the surfacebecause the solvation layer stiffness rises to a significantpercentage of the cantilever stiffness (>10%). Therefore, thepoint-mass model approximation (Eq. (1)) begins to breakdown in proximity to the sample surface as the shape ofthe pinned cantilever takes precedence.27 Stiffer cantileversare required to obtain accurate data for the solvation layersclosest to the surface. Note that this shortcoming is universalto all dAFM techniques, irrespective of the Q factor of thecantilever, and therefore does not affect the validity of themassless model used to calibrate the cantilever. Even if thecalibration (Eqs. (1)-(3)) is perfectly accurate, the assumptionof a point-mass that led to the derivation of AM-AFM theory(Eqs. (4) and (5)) is violated, and the dynamic stiffnessmeasurement is expected to be incorrect.
C. Oscillations in damping
Damping could not be measured with sAFM as it is an in-trinsically velocity-dependent quantity. It is however expectedthat the damping profile measured by dAFM loses accuracy inproximity to the surface for the same reasons as the stiffnessprofile, described in Sec. VII B.
The monotonically increasing damping profile as the tipapproaches to 2 nm from the surface can therefore be trusted.However, the oscillations in damping between 1–2 nm arehighly questionable, and the decrease in damping below 1 nmis definitely meaningless.
D. Tip-sample distance
A commonly arising issue when imaging in liquids is thedetermination of the tip-sample distance. The plot thickensin viscous ionic liquids at the gold electrode as the last liq-uid layer may require very large pressure to be displaced bythe tip. Therefore, there is no clear force regime between theliquid removal, and the compression and damage of the gold
Downloaded 18 Dec 2012 to 132.206.186.116. Redistribution subject to AIP license or copyright; see http://rsi.aip.org/about/rights_and_permissions

053703-8 Labuda et al. Rev. Sci. Instrum. 83, 053703 (2012)
electrode; i.e., there is no hard-contact regime which can beused to zero the tip-sample distance. In fact, it is possiblethat the gold surface and the tip undergo significant defor-mation before the last liquid layer is displaced. This observa-tion is consistent with the low damage threshold (somewherebetween 40 nN and 150 nN) of the gold sample observed inFigure 6. Given these complications, the tip-sample distancein Figure 9 is poorly defined and somewhat arbitrary.
VIII. CONCLUSIONS
Our home-built AFM12 was retrofit with a photothermalexcitation unit with minimal modification to the original de-sign. Photothermal excitation provides a reliable method forexciting cantilevers in liquid environments and allows mucheasier interpretation of tip-sample physics than in the case ofpiezoacoustic excitation.
Static and dynamic AFM can serve as complimentarytechniques for imaging the solid-liquid interface, allowingimaging of both the solid surface and liquid layers, respec-tively. In essence, both imaging methods can be combinedto span a higher dynamic range of force measurements andimaging setpoints.
A comparison between dynamic and static force spec-troscopy performed simultaneously suggests that dynamicAFM reliability decreases as the interaction stiffness in-creases up to and above the cantilever stiffness. This is ex-plained by the fact that the cantilever changes modal shapeto a pinned cantilever, making the original point-mass ap-proximation fail. Cantilevers much stiffer than the interactionshould be used to maintain accurate recovery of stiffness anddamping profiles.
The complications that arise when imaging in viscousliquids are plentiful; they relate to cantilever dynamics andstrong tip-sample interactions (relative to the cantilever stiff-ness). Photothermal excitation allowed us to identify and ad-dress these difficulties confidently, because all the instrumen-tal complications caused by piezoacoustic excitation wereabolished.
ACKNOWLEDGMENTS
We acknowledge valuable discussions with Hirofumi Ya-mada, Daniel Kiracofe, and William Paul, as well as the
generosity of SPECS Surface Nano Analysis Inc., NSERC,FQRNT, and CIfAR.
1R. García and R. Perez, Surf. Sci. Rep. 47, 197–301 (2002).2R. Proksch and S. V. Kalinin, Nanotechnology 21, 455705 (2010).3A. Labuda, Y. Miyahara, L. Cockins, and P. Grütter, Phys. Rev. B 84,125433 (2011).
4A. Labuda, K. Kobayashi, D. Kiracofe, K. Suzuki, P. H. Grütter, and H.Yamada, AIP Adv. 1, 022136 (2011).
5T. R. Albrecht, P. Grutter, D. Horne, and D. Rugar, J. Appl. Phys. 69, 668–673 (1991).
6G. C. Ratcliff, D. A. Erie, and R. Superfine, Appl. Phys. Lett. 72, 1911(1998).
7T. E. Schäffer, J. P. Cleveland, F. Ohnesorge, D. a. Walters, and P. K.Hansma, J. Appl. Phys. 80, 3622 (1996).
8X. Xu and A. Raman, J. Appl. Phys. 102, 034303 (2007).9D. Kiracofe and A. Raman, Nanotechnology 22, 485502 (2011).
10G. Meyer and N. M. Amer, Appl. Phys. Lett. 53, 1045–1047(1988).
11To be exact, the bending shape converges to perfectly circular asf → 0 because the cantilever temperature profile becomes uniform at longtimescales. This suggests a frequency-dependence and a deviation from thefirst-eigenmode approximation used in this article. However, the deviationsare small (a few percent) in the usable frequency range for dAFM usingphotothermal excitation, and are negligible in our comparison with piezoa-coustic excitation where deviations can exceed an order of magnitude.
12A. Labuda, W. Paul, B. Pietrobon, R. B. Lennox, P. H. Grütter, and R.Bennewitz, Rev. Sci. Instrum. 81, 083701 (2010).
13A. Labuda, F. Hausen, N. N. Gosvami, P. H. Grütter, R. B. Lennox, and R.Bennewitz, Langmuir 27, 2561–2566 (2011).
14A. Labuda and P. H. Grütter, Rev. Sci. Instrum. 82, 013704 (2011).15T. Fukuma, M. Kimura, K. Kobayashi, K. Matsushige, and H. Yamada,
Rev. Sci. Instrum. 76, 053704 (2005).16D. Kiracofe, K. Kobayashi, A. Labuda, A. Raman, and H. Yamada, Rev.
Sci. Instrum. 82, 013702 (2011).17S. N. Magonov, V. Elings, and M.-H. Whangbo, Surf. Sci. 375, L385–L391
(1997).18S. J. O’Shea and M. E. Welland, Langmuir 14, 4186–4197 (1998).19J. E. Sader, J. W. M. Chon, and P. Mulvaney, Rev. Sci. Instrum. 70, 3967
(1999).20M. J. Higgins, R. Proksch, J. E. Sader, M. Polcik, S. Mc Endoo, J. P. Cleve-
land, and S. P. Jarvis, Rev. Sci. Instrum. 77, 013701 (2006).21O. Marti, A. Ruf, M. Hipp, H. Bielefeldt, J. Colchero, and J. Mlynek,
Ultramicroscopy 42–44, 345–350 (1992).22A. Labuda, J. R. Bates, and P. H. Grütter, Nanotechnology 23, 025503
(2012).23A. Labuda and P. Grütter, Langmuir 28, 5319–5322 (2012).24M. T. Clark, J. E. Sader, J. P. Cleveland, and M. R. Paul, Phys. Rev. E 81,
046306 (2010).25S. Kawai, T. Glatzel, S. Koch, B. Such, A. Baratoff, and E. Meyer, Phys.
Rev. B 80, 085422 (2009).26D. Kiracofe and A. Raman, J. Appl. Phys. 107, 033506 (2010).27U. Rabe, K. Janser, and W. Arnold, Rev. Sci. Instrum. 67, 3281
(1996).
Downloaded 18 Dec 2012 to 132.206.186.116. Redistribution subject to AIP license or copyright; see http://rsi.aip.org/about/rights_and_permissions