retroactivity controls the temporal dynamics of gene transcription
TRANSCRIPT

Retroactivity Controls the Temporal Dynamics of Gene TranscriptionShridhar Jayanthi,†,‡ Kayzad Soli Nilgiriwala,‡ and Domitilla Del Vecchio*,‡
†Electrical Engineering, University of Michigan, Ann Arbor, Michigan, United States‡Mechanical Engineering Department, Massachusetts Institute of Technology, Cambridge, Massachusetts, United States
*S Supporting Information
ABSTRACT: Just like in many engineering systems,impedance-like effects, called retroactivity, arise at theinterconnection of biomolecular circuits, leading to unexpectedchanges in a circuit’s behavior. In this paper, we provide acombined experimental and theoretical study to characterizethe effects of retroactivity on the temporal dynamics of a genetranscription module in vivo. The response of the module to an inducer was measured both in isolation and when the module wasconnected to downstream clients. The connected module, when compared to the isolated module, responded selectively to theintroduction of the inducer versus its withdrawal. Specifically, a “sign-sensitive delay” appeared, in which the connected moduledisplayed a time delay in the response to induction and anticipation in the response to de-induction. The extent of these effectscan be made larger by increasing the amounts of downstream clients and/or their binding affinity to the output protein of themodule. Our experimental results and mathematical formulas make it possible to predict the extent of the change in the dynamicbehavior of a module after interconnection. They can be employed to both recover the predictive power of a modular approachto understand systems or as an additional design tool to shape the temporal behavior of gene transcription.
KEYWORDS: retroactivity, dynamic response, control systems, modularity, synthetic biology
The temporal dynamics of gene transcription control anumber of important cellular processes, such as
responding to environmental changes, reaching adaptation toexternal perturbations, and executing the cell cycle andcircadian rhythms.1 Recent experimental evidence shows thatcell fate is determined on the basis of the temporal dynamics ofcompeting gene programs,2 suggesting that temporal dynamicsultimately controls a cell’s phenotype. In synthetic biology, theprecise control of the dynamics of gene transcription has beeninstrumental for designing a number of clocks3−5 andincoherent feedforward loops to reach adaptation.6 Under-standing the mechanisms that control temporal dynamics ingene transcription is also necessary to determine the extent ofmodularity in biomolecular circuits. In fact, it is well-knownthat the dynamic behavior of a system may not be modulareven when its static behavior is.7
Biomolecular networks are composed of recurrent structuralmodules such as transcription components in gene networksand covalent modification cycles in signal transductionnetworks. A fundamental question is whether these structuralmodules preserve their behavior whether they are connected toeach other or they are in isolation. In addition to having deepimplications from an evolutionary perspective,8 modularitymakes it possible to predict the behavior of a complex networkby simply composing the behavior of its subsystemscharacterized in isolation.9−11 Hence, modularity simplifiesthe problem of understanding the functionality of complexnatural systems and allows the design of synthetic biologycircuits through a bottom-up approach.Previous theoretical studies, however, suggested that the
dynamic behavior of a module characterized in isolation
changes upon interconnection with other modules due toloading effects, which were called retroactivity to extend thenotion of impedance to non-electrical systems.12−14 Retro-activity is the phenomenon by which a downstream systemchanges the dynamic state of an upstream system in the processof receiving information from the latter (Figure 1) and isrelated to the concept of fan-out in digital electronics.15
Consider the connection between two systems illustrated inFigure 1. By design, we expect the information to travel fromthe “upstream” to the “downstream” system. However, when a
Received: September 26, 2012
Figure 1. Retroactivity is the unavoidable back-action (indicated bythe red arrow s) from a downstream system to an upstream system. Itis due to the fact that the downstream system, in order to receive theinformation in y, uses up some of y. Hence, y cannot fully take part tothe network of interactions that constitutes the upstream system,resulting in a change of the upstream system behavior.
Research Article
pubs.acs.org/synthbio
© XXXX American Chemical Society A dx.doi.org/10.1021/sb300098w | ACS Synth. Biol. XXXX, XXX, XXX−XXX

downstream system receives (observes) information from anupstream system, exchange of “matter” must necessarily takeplace between the two systems. This exchange of matter, inturn, changes the state of the upstream system. For example, tomeasure the pressure of a tire (upstream system) we need toconnect it to a measurement device (downstream system). But,in doing so, some air will flow between the two systems,affecting the tire pressure. While measurement devices havebeen designed on purpose to minimize retroactivity, bio-molecular circuits may not minimize it and may actually use itin advantageous ways.As an example, consider an activator-repressor clock3 whose
signaling elements are transcription factors, an activator and arepressor protein. Suppose that the clock is “connected” to adownstream system, such as a reporter, so that a protein in theclock regulates the expression of the reporter. The biochemicalinteraction that allows this regulation is the binding of theprotein to operators in the reporter. When this binding occurs,the clock protein is not available anymore for the reactions thatmake the clock, leading to a change in the clock behavior. It hasbeen theoretically shown that this phenomenon can disrupt theclock if the protein used for connection is the activator, while itcan enhance the clock performance if the protein used is therepressor.16 Hence, it has been argued that retroactivity may beamong the possible reasons of unpredictable behavior ofcomposed synthetic circuits.17 Characterizing retroactivityeffects in a systematic way is thus necessary to recoverpredictable power when composing systems in a bottom-upfashion.A few experimental studies have recently appeared on
retroactivity in various types of biological networks both in vitroand in vivo.18−22 Of particular relevance to this paper are thoseconsidering dynamic behavior. Specifically, the effect ofretroactivity from DNA load on a synthetic transcriptionclock was studied through cell-free experiments in vitro, whichshowed a detrimental effect on the clock behavior from thedownstream load.22 Further in vitro experimental studiesfocused on retroactivity in signal transduction cascades. Thesestudies showed that retroactivity alters the temporal dynamicsof a covalent modification cycle by substantially decreasing thefrequency bandwidth.21
In this paper, we perform a combined theoretical andexperimental study to systematically characterize the effects of
retroactivity from downstream clients on the temporaldynamics of a gene transcription module in vivo.
■ RESULTS AND DISCUSSION
Gene Circuit To Study Retroactivity. Figure 2a shows thedetails of the gene circuit employed to characterize retroactivityeffects. The upstream transcription component takes as inputatc (u) and provides as an output LacI-LVA (y). LacI is in turntaken as an input by a reporter system assembled on the sameplasmid as the transcription component. The reporter systemproduces GFP-LVA as an indirect measurement of LacI. SinceLacI is a repressor, we should expect that GFP decreases as atcincreases. The downstream clients contain LacI operators andare assembled on a different plasmid. Both the reporter and thedownstream clients apply retroactivity to the upstreamtranscription component (see Figure 2b). Retroactivity fromLacI binding sites present in the bacterial genome were notincluded in the model since the genome relative concentrationis insignificant compared to the concentration of plasmids inthe cell, as discussed in the Methods section. Here, we areinterested in characterizing the effects of retroactivity s2 fromthe downstream clients on the response of the transcriptioncomponent to atc. Hence, we consider as the isolated system thecircuit of Figure 2a, in which the operator sites in thedownstream clients are absent, resulting in s2 = 0. We consideras the connected system the circuit of Figure 2a, in which theoperator sites in the downstream clients are present.Experimentally, we realize the isolated system through cells
in which we co-transformed the pACYC184-based plasmid(with the transcription component and reporter), which werefer to as circuit plasmid, with pUC18-based plasmid that doesnot have LacI operator sites, which we refer to as blank plasmid.We realize the connected system through cells in which we co-transformed the circuit plasmid with pUC18-based plasmidincluding the operator site for LacI, which we refer to as clientplasmid. The difference between the responses of GFP to atc inthe isolated and connected system configurations characterizethe effects of retroactivity s2 from the downstream clients onthe transcription component. These experiments wereperformed in E. coli strain KL-323, chosen due to its mutationsin its lacI and recA genes. Its genome also contains the LacZpromoter, which has affinity to LacI. However, due to its lowrelative concentration, the retroactivity from genome can beneglected.
Figure 2. Layout of gene circuit employed to study retroactivity. (a) Genetic diagram. The circuit plasmid contains both the transcriptioncomponent and the reporter system. The downstream clients to which the transcription component connects are realized by a plasmid containingone operator site with affinity to LacI. The connected system refers to cells co-transformed with both the circuit plasmid and the plasmid with operatorsites. The isolated system refers to cells co-transformed with the circuit plasmid and a plasmid that does not contain the operator site but is of thesame type as the one with the operator site. (b) Block diagram illustration of the different parts of the gene circuit. The transcription componenttakes as input u anhydrotetracycline (atc) and gives as output y the repressor LacI. This output is used as an input by both the reporter system andthe downstream clients. Upon interconnection with either the reporter or the downstream clients, retroactivities s1 from the reporter and s2 from thedownstream clients arise.
ACS Synthetic Biology Research Article
dx.doi.org/10.1021/sb300098w | ACS Synth. Biol. XXXX, XXX, XXX−XXXB

We modeled the circuit of Figure 2a by a set of ordinarydifferential equations (ODE) describing the rate of change ofLacI and GFP. Let pT be the concentration of the circuitplasmid (proportional to the circuit plasmid copy number) andqT be the concentration of the clients plasmid (proportional tothe clients plasmid copy number). Let λ = qT/pT, l = [LacI]/pT,g = [GFP]/pT, let c1 denote the concentration of LacI bound todownstream clients promoter sites divided by pT, and let c2denote the concentration of LacI bound to the promoter of thereporter divided by pT. Then, we have the following ODEmodel for the connected system:
in which u is the concentration of atc in units of its dissociationconstant from TetR; n is the cooperativity of atc binding TetR;kon, kon′ , koff, koff′ are the association and dissociation rateconstants, respectively, of LacI with the promoter and operatorsites; and δ is the decay rate constant (including dilution and
Figure 3. Retroactivity delays the response to sudden input stimulation. (a) Simulations from the model in eqs 1. The units in this simulation arenondimensionalized. Parameters used in this simulation are given in the Supporting Information. (b) Data from population measurements in a platereader show good agreement with the model. This plot shows a representative time course for the induction experiment with 0.095 μM atc. (c)Response times to induction with 0.095 μM atc. The average half-life of GFP (t50) post-induction increased by 43%, going from 85 ± 2 min to 122 ±16 min. The slow response occurs mainly in the early stages of induction and can be quantified by calculating the t20, the time it takes to remove 20%of the GFP. The t20 presents an average delay of 40 min, slightly higher than the 37 min delay in the half-life value (t50). (d) Higher levels of atc candecrease the t50, but the delay caused by retroactivity persists. In both panels c and d, averages were calculated from three different experiments. Errorbars denote 1 SD around the average. More data are given in the Supporting Information. Data displayed in panels b−d were obtained from platereader measurements.
ACS Synthetic Biology Research Article
dx.doi.org/10.1021/sb300098w | ACS Synth. Biol. XXXX, XXX, XXX−XXXC
degradation). Here, α1 and α2 are the maximal expression ratesper promoter. Since the complexes also decay, we are assumingthe non-asylum model according to which proteins are notprotected by decay when bound to DNA.23 The reader isreferred to the Supporting Information for the detailedderivation of the model and for the parameter values.Note that the retroactivity term s2 depends only on λ and not
on the absolute value of the downstream clients amount qT.This indicates that the effects of retroactivity depend on theratio between the circuit plasmid copy number and the clientsplasmid copy number, but not on the absolute value of thelatter. We remark that the binding/unbinding reactions aremuch faster than the production and decay of LacI.Furthermore, the dissociation constant Kd = koff/(pTkon) ofLacI with the operator sites is very small, implying that onceLacI binds, it unbinds very rarely. These features are relevant
for understanding the experimental results illustrated in thefollowing section.The retroactivity to the output of the transcription
component s appears as a rate in the equation for LacI andhas two components: s1 is the retroactivity due to the reporterand s2 is the retroactivity due to the downstream clients. Here,we study the effect that s2 has on the response of LacI to atc,indirectly measured through GFP. Hence, the isolated system isrepresented by the above equations, in which we have set s2 = 0,but s1 ≠ 0. It follows that the isolated system configuration stillhas an intrinsic retroactivity due to the reporter. Given that theexpressions of s1 and s2 are similar, the qualitative effects that s1has on the transcription component are the same as those thats2 has. Therefore, to characterize the qualitative effect ofretroactivity s on the transcription component, it is enough tocharacterize the effect of s2 on the response of GFP to atc.
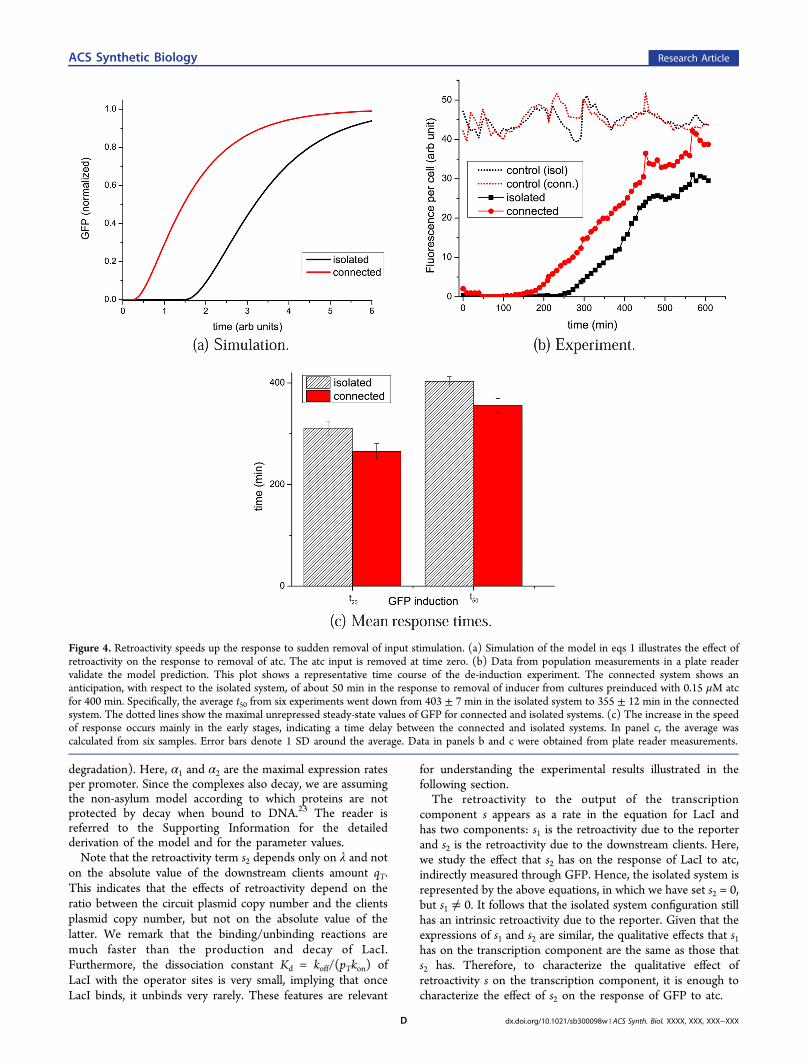
Figure 4. Retroactivity speeds up the response to sudden removal of input stimulation. (a) Simulation of the model in eqs 1 illustrates the effect ofretroactivity on the response to removal of atc. The atc input is removed at time zero. (b) Data from population measurements in a plate readervalidate the model prediction. This plot shows a representative time course of the de-induction experiment. The connected system shows ananticipation, with respect to the isolated system, of about 50 min in the response to removal of inducer from cultures preinduced with 0.15 μM atcfor 400 min. Specifically, the average t50 from six experiments went down from 403 ± 7 min in the isolated system to 355 ± 12 min in the connectedsystem. The dotted lines show the maximal unrepressed steady-state values of GFP for connected and isolated systems. (c) The increase in the speedof response occurs mainly in the early stages, indicating a time delay between the connected and isolated systems. In panel c, the average wascalculated from six samples. Error bars denote 1 SD around the average. Data in panels b and c were obtained from plate reader measurements.
ACS Synthetic Biology Research Article
dx.doi.org/10.1021/sb300098w | ACS Synth. Biol. XXXX, XXX, XXX−XXXD

Effects of Retroactivity on the Response of the GeneCircuit. We characterize the effects of retroactivity on thedynamic response of GFP to sudden changes of atc. Forcompleteness, we also show the effects on the steady-statetransfer curve from atc to GFP. For the dynamic response, weconsider two experiments: an induction experiment and a de-induction experiment. In the induction experiment, LacI startsfrom zero (GFP starts from its maximal unrepressed value) attime zero and a high constant non-zero value of atc is applied,so that LacI rises and GFP decreases reaching zero. In the de-induction experiment, LacI starts from a non-zero steady statereached through preinduction with a non-zero high value of atc(so that GFP starts from zero). Then, atc is suddenly removed(atc = 0) so that LacI decreases toward zero and GFP risestoward its maximal unrepressed value. This characterization wasperformed at the population level, by measuring culturesgrowing in a plate reader, and at the single cell level, by imaging
microcultures in a microscope. In order to quantify the effect ofretroactivity on dynamics, we measured the response time ofGFP, which mirrors that of LacI. There are several standardmetrics to determine the response time of a system. In thispaper, we consider the t50, which is given by the time thefluorescence changes by 50%, and t20, which is given by thetime the fluorescence changes by 20% of its maximalunrepressed value from when atc is applied or removed.
Dynamic Effects of Retroactivity: Induction. Figure 3ashows a simulation and Figure 3b shows a representativeresponse of GFP to sudden application of atc for both theisolated and connected systems as measured in a plate reader.The effect of retroactivity is basically a time delay. This can bequalitatively explained by recalling that the value of thedissociation constant Kd for LacI binding to its operator sites isextremely small and that the binding reactions are much fasterthan protein production and decay (see the Supporting
Figure 5. Effects of retroactivity at the single cell level. (a) The sequence of images illustrates the response of microcolonies of isolated andconnected systems to addition and removal of 0.125 μM atc. As with the population experiments in the plate reader, the connected system responseis slower during an induction and faster during a de-induction when compared to the isolated system. (b, c) Quantification of the representativemicrocolonies to induction and de-induction shown in panel a. Data points correspond to the total fluorescence displayed by the microcolonydivided by total microcolony area.
ACS Synthetic Biology Research Article
dx.doi.org/10.1021/sb300098w | ACS Synth. Biol. XXXX, XXX, XXX−XXXE

Information for the exact values). In fact, LacI is sequestered bythe operator sites as soon as it is produced. Only when theoperator sites are filled is any additional LacI produced free totake part in other reactions and, in particular, in those of thereporter. Hence, before LacI can rise (GFP can decrease), thereis a time delay, which is the time it takes for LacI to fill theoperator sites. This time delay, monotonically increases withthe relative amount λ of these sites. The reader is referred tonext section for a precise mathematical explanation.Figure 3c shows the response times for isolated and
connected systems. The response time of the connectedsystem increases in average by 40% with respect to the one ofthe isolated system. The minimal and maximal increases are of24% and of 64%, respectively. Figure 3d shows that with anincreasing amount of atc, the response times for both isolatedand connected systems decrease. However, the delay caused byretroactivity persists. This implies that the dynamic effect ofretroactivity cannot be removed nor attenuated by choosinghigher input values, that is, it cannot be precompensated. Thus,in order to keep the speed of response of the output in theconnected system close to the one of the isolated system,feedback control is required. Through feedback control, onecan design circuits that are effectively insulated fromretroactivity and behave the same whether connected orisolated.12,24
Dynamic Effects of Retroactivity: De-induction. Figure 4shows the response of GFP to sudden removal of atc for boththe isolated and connected systems, as measured in a platereader. Surprisingly, the connected system responds faster (byabout 50 min) than the isolated system when atc is suddenlyremoved. This apparently counterintuitive result can beexplained as follows. In the isolated system, the onlymechanism by which free LacI can be removed is throughdilution and/or degradation. In the connected system there isan additional mechanism by which LacI can be removed. Sincethe complex C2 of LacI bound to operator sites also dilutes butthe operator sites do not dilute or degrade, free LacI can beremoved by binding to the operator sites. The continuousdilution of LacI in complexes C2 guarantee the presence of free
operator sites during the de-induction, which can in turn bindto more free LacI. If the operator sites were protecting LacIfrom degradation and the system had no dilution (no growth),we should have observed a slower response in the connectedsystem just like in the induction experiment. The reader isreferred to the next section for a mathematical explanation ofthis phenomenon and to the Supporting Information for themathematical derivations.Hence, because of retroactivity a sign-sensitive delay arises:
when the input stimulation is suddenly applied, the connectedsystem presents a delay of about 40%. By contrast, when theinput stimulation is suddenly removed, the connected systempresents an anticipation of the response of about 50 min.
Retroactivity Impact at the Single Cell Level. Effectsobserved in population assays may be different from effects atthe single cell level.25 Figure 5 shows the effect of retroactivityon the dynamic response in microcolonies of isolated andconnected systems undergoing atc induction and de-induction.The measured half-life post induction with 0.125 μM atc wentfrom 53 ± 5 min in the isolated system to 75 ± 10 min in theconnected system (interval denotes 1 SD around the averageacross six microcolonies). For the de-induction experiment, theresponse time was calculated with the assumption that steadystate was reached at 300 min. The time until the microcoloniesreached 50% of the steady state went from 191 ± 35 min in theisolated system to 99 ± 26 min in the connected system(interval denotes 1 SD around the average across twomicrocolonies). These results are consistent with thoseobtained from population measurements in the plate reader.Additional data and details can be found in the SupportingInformation.
Effects of Retroactivity on the Steady-State TransferCurve. To obtain the steady-state transfer curve, we performeda series of experiments in which the steady-state value of GFPwas recorded in response to different constant values of atc (seethe Supporting Information for the full time traces). This isshown in Figure 6. The shape of the transfer curve is wellcharacterized by the point of half maximal induction, called u50,and by the apparent Hill coefficient nH. The u50 corresponds to
Figure 6. Retroactivity increases the point of half maximal induction u50. (a) Normalized simulation results obtained from the model in eqs 1. Theparameter values for the simulations are given in the Supporting Information. (b) Experimental data showing an increase of 30% of the u50. For eachdata point shown here, three replicates were obtained by growing cells in a plate reader. Data was fitted using nonlinear regression on a repression-type Hill function model. Error bars denote 1 SD around the average from 3 replicates.
ACS Synthetic Biology Research Article
dx.doi.org/10.1021/sb300098w | ACS Synth. Biol. XXXX, XXX, XXX−XXXF

the value of the input stimulation for which the output responseis 50% of the maximal. As seen in Figure 6, the experimentaldata showed an increase of about 30% in the u50, going from0.054 ± 0.001 μM in the isolated system to 0.069 ± 0.01 μM inthe connected system (standard error). There was nosignificant change in the apparent Hill coefficient nH (9.7 ±1.3 for the isolated system and 9.1 ± 1.5 for the connectedsystem, standard error). When the input stimulation atcincreases, LacI is produced but is immediately sequestered bythe high affinity operator sites, so that more atc must be appliedin order to have enough LacI that is available for the reportersystem.Note that for values of atc exceeding 0.095 μM, the steady-
state value of the circuit is not appreciably changed byretroactivity, while the temporal dynamics is substantiallyimpacted by retroactivity. This illustrates a concrete case inwhich understanding the extent of modularity requires studyingthe temporal dynamics.The increase of the u50 can lead to fairly unpredictable results
when the module is connected. In fact, on the basis of theresponse of the module characterized in isolation as seen fromthe black plot of Figure 6b, one expects that the maximalchange of the output y is obtained by changing the input u
about 0.05 μM. Hence, one would design the system upstreamof the transcription module so that it outputs u in a range about0.05 μM to lead to the maximal change in y. This process issometimes referred to as input/output matching. Unfortu-nately, once y connects to downstream clients, a change in theinput u about 0.05 μM leads to almost no response in y becausethe true transfer curve is the red one of Figure 6b. This problemcan be overcome by accounting for the increase of u50 due toretroactivity when one performs input/output matching. This isin net contrast with the dynamic effects of retroactivity, whichcannot be removed or attenuated by adjusting the inputstimulation in the connected system.
Parametric Study of Retroactivity Effects on a SimpleModel. In order to understand the mechanistic origin of theretroactivity effects observed experimentally and to understandhow the parameters of the interconnection control these effects,we consider a simple model suitable for analytical study. Forany species X, we denote in italics X its concentration. Considera transcription component with one input u (a transcriptionfactor or an inducer) and one output Z (a transcription factor),which in turn is used as an input for downstream transcriptionmodules (clients). The model of the isolated system (withoutthe downstream clients) can be written as
Figure 7. Effect of connection parameters on the t50. (a) t50 response time to a constant input stimulus. As the dissociation constant Kd decreases, theresponse time increases up to a limit after which it saturates. As λ increases, the response time continues to monotonically increase. (b) t50 incorrespondence to z decaying to zero from an initial value. As the dissociation constant decreases and as the amount of promoter increases, the t50monotonically decreases, that is, the response becomes faster. In these plots, the t50 for the isolated system can be found in correspondence to λ = 0(no client promoter sites) or Kd → ∞ (Z has no affinity to the promoter sites). (c) The effect of increasing λ for low values of Kd. (d) The effect ofincreasing λ for high values of Kd. In the simulations, we set k = 10, δ = 1, and pT = 1.
ACS Synthetic Biology Research Article
dx.doi.org/10.1021/sb300098w | ACS Synth. Biol. XXXX, XXX, XXX−XXXG

δ= −zt
k u zdd
( )
in which z = [Z]/pT with pT the concentration of the promoterexpressing Z. Here, k(u) is the standard Hill function, whoseform depends on whether u is an activator or a repressor.Assuming that u is an activator, as is the case in theexperimental system, we have that k(u) = α((un)/(1 + un)),in which n is the Hill coefficient and u is in units of itsdissociation constant. Parameter δ is the decay rate constantmodeling dilution and degradation, and α is the maximal Zexpression rate per promoter. We neglect the mRNA dynamicssince they are not significant for our purpose.When Z is taken as an input by another transcription
module, we need to modify the isolated model by including thebinding reaction of Z with downstream promoter sites q. Let qTdenote the total amount of promoter sites, kon the associationrate constant, and koff the dissociation rate constant. Let crepresent the concentration of the complex of Z with q dividedby pT and let λ = qT/pT be the ratio between the plasmid copynumber of the transcription component and the plasmid copynumber of the downstream clients. Then, the connected zdynamics are given by
Referring to the block diagram of Figure 1, the retroactivity tothe output of the transcription module is s = −konpT(λ − c)z +koffc, so that the isolated system is obtained by setting s = 0 inthe above equations.Steady-State Effects of Retroactivity. To determine the
effects that retroactivity s has on the steady-state characteristicfrom u to z, we equate to zero the time derivatives in system 2and solve both isolated and connected systems for the steadystate (see Supporting Information for the detailed derivations).In the limit in which the dissociation constant Kd (= koff/(pTkon)) is very small compared to z, we obtain that the maineffect of retroactivity is to increase the point of half maximalinduction such that
α δ λα δ λ
− ≈ +−
−⎛⎝⎜
⎞⎠⎟u u
//
1n
50connected
50isolated
1/
Hence, for λ = 0 (no downstream clients) there is no change inthe u50 and as λ increases, the u50 of the connected systemincreases. This increase is more prominent when the maximal zproduction rate α is smaller.Dynamic Effects of Retroactivity. To study the dynamics of
z, it is useful to reduce the connected system dynamics to aone-dimensional ODE model by exploiting the separation oftime scale between protein production and decay and binding/unbinding reactions. Specifically, the dynamics of the connectedsystem can be reduced to (see the Supporting Information fordetails)
δ δ
λ
=+
− −
=+
⎛⎝⎜
⎞⎠⎟
zt dg z dz
k u z g z g z
zK z
dd
11 ( )/
( ( ) ( )), ( )
d (3)
This expression becomes close to that of the isolated systemwhen both g(z) and dg(z)/dz are very small. For the induction
experiment it is possible to mathematically show that theresponse of the connected system is always slower for all valuesof parameters than the response of the isolated system (see theSupporting Information for details), that is, t50,20
connected > t50,20isolated.
Figure 7a further shows how the key parameters of theinterconnection, that is, λ and Kd, affect the t50. This responsetime increases monotonically as λ is increased and as Kddecreases. As Kd decreases, the t50 increases up to a limit, atwhich the effect of the interconnection becomes a finite timedelay (see Figure 7c). This time delay monotonically increaseswith λ and is given in good approximation by (see theSupporting Information for the detailed derivation)
δ λδ≈
−k
ktime delay
1ln
When instead Kd is higher, some of the z that is produced isfree to take place in other reactions even before c reaches itsquasi-steady-state value. Hence, the effect of the connection isto decrease the effective rate of production of z. Specifically, theeffective initial rate of production of z becomes equal to k(u)/(1 + λ/Kd) (see Figure 7d).For the de-induction experiment, it is possible to mathemati-
cally show that the response of the connected system is alwaysfaster for all values of parameters than the response of theisolated system (see the Supporting Information for details),that is, t50,20
isolated > t50,20connected. Figure 7b shows how the key
parameters of the interconnection, that is, λ and Kd, affect thet50. This response time decreases monotonically as λ isincreased and as Kd decreases. In the limit in which Kd isvery small, the t50 is given by
δα δ λ
α δ λ≈ +
+⎛⎝⎜
⎞⎠⎟t
1ln
//(2 )50
which decreases monotonically when λ increases.When the transcription component is taken as an input by m
> 1 downstream clients, as occurs in the experimental system,each of which with λi relative amount of downstream bindingsites with dissociation constant Kd,i, we obtain the reducedmodel for the connected system given by
∑δ δ
λ
=+ ∑
− −
=+
⎛⎝⎜⎜
⎞⎠⎟⎟z
t dg z dzk u z g z
g zz
K z
dd
11 ( )/
( ( ) ( )),
( )
im
i i
m
i
ii
d i,
It follows that the effects of retroactivity from the downstreamclients are qualitatively all the same, as each of the downstreamclients makes both the multiplying factor 1/(1 + ∑i
mdgi(z)/dz)and the effective production rate smaller.
Conclusions and Discussion. We have characterized theeffects of retroactivity on the temporal dynamics of tran-scription components in gene circuits in vivo. Specifically, weshowed that retroactivity from downstream clients leads to asign-sensitive delay, in which the connected system respondsslower to induction but faster to de-induction when comparedto the isolated system. Sign-sensitive delays are a commontemporal dynamic pattern in the response of microorganisms tochanges in environmental conditions and have a number offunctions, including noise filtering.1 A known mechanism toobtain sign-sensitive delays is coherent feedforward loops.6 Ourresults show that another and much simpler mechanism to
ACS Synthetic Biology Research Article
dx.doi.org/10.1021/sb300098w | ACS Synth. Biol. XXXX, XXX, XXX−XXXH

realize a sign-sensitive delay is retroactivity. Indeed, through theaddition of DNA binding sites, we can precisely control thespeed of response of a transcription circuit to its input stimuli,without changing the structure of the circuit itself. Ourformulas of the expected delays and anticipation provide atool to systematically design the DNA binding sites to obtainthe desired dynamic response. This study also reveals that anew, more subtle, role for the large number of inactivepromoter sites on the chromosome capable of bindingproteins23 is that of tuning the temporal dynamics of genetranscription.We also provide a concrete tool that can be used to predict
the effects of the composing synthetic biology modules whenmodularity fails due to retroactivity on a transcriptioninterconnection. From knowledge of the dissociation constantof the transcription factor with respect to its promoter and therelative amount of promoter sites, one can precisely character-ize the impact of the interconnection on the behavior of thesystem. As an example, consider the way synthetic gene circuitsare usually characterized. The output, a transcription factor, ismeasured by employing reporter genes regulated by thattranscription factor. These reporters are often placed in highcopy number plasmids to obtain a sufficiently high measure-ment range. As demonstrated in this work, this approachchanges the behavior of the circuit one is trying to characterize.However, our results provide a way to explicitly account for theeffect of the reporter system in this measurement assay, byadding the provided retroactivity expressions to the model usedin the prediction of the circuit behavior.The quantitative retroactivity models allow evaluation of how
particular design choices affect the retroactivity generated bysynthetic biology modules. From the mathematical expressions,one can see that by placing a downstream circuit in thechromosome or in a very low copy number plasmid, instead ofemploying a high copy number plasmid, one can dramaticallydecrease the effect of retroactivity. The same result can beobtained by picking a promoter with lower affinity to thetranscription factor. Of course, these choices must be balancedby other design specifications. For example, while a reporter inthe genome decreases the impact of retroactivity to the circuitbeing measured, it may also reduce the signal to a level in whichit is highly affected by noise. With a more careful analysis, itmay be even possible to understand how complex changes,such as temperature variation, impact retroactivity. In order todo so, it is necessary to understand the exact contribution ofthese changes to the key parameters in the model: expressionand decay rate of the transcription factor, dissociation constantbetween transcription factor and its binding site, and relativeratio of downstream DNA to upstream system DNA. As anexample, if we move the assays presented in this paper from 30to 37 °C, we know that the ratio λ will increase,26 which willincrease retroactivity. This increase in temperature could alsolead to a faster decay rate, due to higher doubling rate andstronger protease activity,27 which further increases the effect ofretroactivity as shown in mathematical expressions given in theSupporting Information.A phenomenon related to, but different from, retroactivity
occurs when two modules share a resource. If competition forthe resource arises between the modules, an indirectconnection between them appears,18,28,29 thus breaking themodularity. However, retroactivity is not a consequence of anunknown indirect connection linking unrelated modules, butthe back-effect from the interconnection itself. This subtle
difference is important when engineering a solution to theseproblems. For resource competition problems, a desirablesolution is to decouple the modules by employing orthogonalresources or by increasing their availability. For retroactivity,the solution is to enforce unidirectionality of the communica-tion path24 while preserving the interconnection. One approachto guarantee this is by employing insulation devices,12 systemsthat use feedback control and other mechanisms22,24 to make asystem insensitive to potentially high retroactivity, similar towhat operational amplifiers do in electronics.The core mechanism that generates retroactivity in
biomolecular circuits is the reversible association betweenbiomolecules. Hence, experimental studies analyzing the impactof protein sequestration by other proteins30 or by DNA sites31
on the dose−response curve of a system are related to ourwork. These studies focus only on the steady-state characteristicof circuits and do not provide information on the dynamicresponse, which is the focus of our work. Furthermore, thesestudies employ a titrating element (DNA, for example) atconcentrations that are several orders of magnitude larger thanwhat is observed in natural or synthetic circuits assembled onplasmids. Our experiments, by contrast, use the same amountsof downstream clients as they would be observed in anysynthetic circuit. As a consequence, the ultrasensitivity observedin previous studies31 was not observed with the smaller numberof binding sites used in our work. However, with the smallernumber of binding sites we have used, dramatic changes ondynamic behavior were observed. This suggests that syntheticcircuits built on plasmids will face significant effects ofretroactivity on the temporal dynamics, while more rarelythey will face effects on the steady state.
■ METHODSPlasmid Construction. The circuit plasmid contains three
genes. The genes Plac-gfp-lva, Ptet-lacI-lva, and Pconst-tetR-lvawere built from parts obtained from either the Registry ofBiological Parts or amplified from the E. coli K-12 genome. Theparts were then sequentially inserted into a pACYC184backbone in a manner that preserved the chloramphenicolresistance but disrupted the tetracycline resistance gene. Theclient plasmid employed is a pUC18 plasmid in which theentire lacZα was substituted by a LacI symmetric operator site.The control plasmid is a pUC18 plasmid in which the lacZαwas simply removed. In both plasmids, the bla gene thatconfers resistance to ampicilin was preserved. Both plasmidswere obtained as a courtesy from Prof. Alexander J. Ninfa Labat University of Michigan, Ann Arbor.
Strain and Growth Conditions. In these experiments, weused KL-323 strain32 obtained from the E. coli Genetic StockCenter at Yale University. This strain was chosen for itsmutation in the LacI gene, which could potentially interferewith the circuit, as well as for its lack of DNA repair genes,which gives appropriate stability to our constructs. The KL-323strain has an ochre mutation of the lacZ gene and therefore hasone copy of the lac promoter, identical to the one regulatingthe GFP-LVA expression in the circuit. The effect of theseadditional binding sites in the chromosome is negligible sincethe relative ratio of this chromosome copy number to circuitplasmid copy number was measured to be smaller than 1:20,while the ratio of the client plasmid is higher than 2:1, 40 timeslarger. The strains were made competent and subsequentlytransformed by employing the standard chemical protocol. Themedia used in the experiment is the M9 media supplemented
ACS Synthetic Biology Research Article
dx.doi.org/10.1021/sb300098w | ACS Synth. Biol. XXXX, XXX, XXX−XXXI
with 0.4% glucose, 0.2% casamino acids, 40 mg/L tryptophan,100 μg/mL ampicillin, and 34 μg/mL chloramphenicol. Cellswere inoculated into fresh media from plate or freezer stocksand incubated at 30 °C until midlog phase (spectrophotometryreading of 0.15 at 600 nm with 1 cm path length). At that pointthe cells were quickly washed and diluted 7/8-fold. Care wastaken to preserve the cells in log phase. These diluted cultureswere then placed in a plate reader/incubator (Synergy MX) at30 °C and mild agitation in all experiments. The doubling timeunder these conditions was approximately 100−150 min, withno significant difference between isolated and connectedsystems. In longer experiments, cells were kept in midlogphase via dilutions. No impact on the growth rate was observeddue to dilutions or addition or removal of atc (see SupportingInformation).Steady State and Dynamic Experiments in Plate
Reader. For the steady-state experiments, cells were kept inthe plate reader for one generation at which point differentlevels of atc were added to the individual wells. Cells reachedsteady state after approximately one generation. The steady-state level was preserved for at least another generation, atwhich point the cells moved into a late log phase. For theinduction experiments, cells grew two generations at whichpoint cells were induced. Data points were automaticallyacquired by the plate reader every 10 min. For the washexperiments, cells were induced with 0.15 μM atc. After 4generations (400 min), the inducer was removed by pelletingand resuspension of the cells in fresh media.Dynamic Experiments in Microscope. For these experi-
ments, cells were immobilized in a 2% agarose pad containingthe M9 salts, 0.4% glucose, 0.2% casamino acids, 40 mg/Ltryptophan, 100 μg/mL ampicillin, and 34 μg/mL chloram-phenicol. To prepare the pad, we added 70 μL of the moltenpreparation to a single channel of a CoverWell perfusionchamber (Grace Bio-Laboratories, no. 622503) with sealed inletand outlet pores. Ten microliters of overnight cells prepared asdescribed above was placed on top of the pad, which was sealedwith clean coverglass. This setup was placed on a stage-heaterin order to provide an internal chamber temperature of around30 °C. Stable steady-state fluorescence was observed for cellsafter around 3−4 h of incubation in the microscope setup.For induction assays, we prepared a pad similar to the one
described above, but with additional 0.125 μM atc. Cells fromthe initial pad displaying steady-state fluorescence weretransferred to the new pad by keeping them in contact foraround 15 s. The new agarose pad was sealed with new coverglass, and the setup was placed in the microscope for around5−6 h until all of the cells showed absence of fluorescence. Forde-induction, we prepared a pad as the one described above,with no atc. Cells from the induction pad were transferred tothe new pad in the same way described above. The agarose padwas then sealed with a new cover glass, and the setup wasplaced in the microscope.To quantify these experiments, individual cells were manually
segmented from the phase image, using MicrobeTracker.33
Cells belonging to the same microcolony were then quantifiedtogether. For each microcolony, the total fluorescence wasdivided by the total area of the cells in the colony.Quantitation of Plasmid Copy Number. In order to
obtain the ratio between the amounts of the pUC18-basedclient plasmid and the pACYC184-based circuit plasmid, wequantified the amount of DNA extracted from samples inexperimental conditions (exponential growth at 30 °C).
Plasmid DNA was extracted by employing a commercialmini-prep kit as in ref 34. Then, plasmids were linearized bydigestion with EcoRI-HF (NEB) to prevent trapping35 andquantified employing densitometric analysis.35,36
For the pACYC184-based circuit plasmid, the copy numberper cell obtained was 32 in the isolated system and 22 in theconnected system. The pUC18-based control plasmidpresented a copy number of 72, while the client plasmidpresented 62 plasmids per cell. Assuming an average of 1.5genomes per cell, the values obtained are consistent with thevalue of 30 (30 °C) to 70 (37 °C) copies per genome ofpUC1826 and 18 copies of pACYC184 per genome.37 The ratioof control to circuit plasmids was 2.2 in the isolated system, andthe ratio of client to circuit plasmids was 2.8 for the connectedsystem. Hence, the value of λ is between 2 and 3.
■ ASSOCIATED CONTENT*S Supporting InformationAdditional data related to the experiments as well as a detaileddescription of the models and analytical results. This material isavailable free of charge via the Internet at http://pubs.acs.org.
■ AUTHOR INFORMATIONCorresponding Author*E-mail: [email protected] authors declare no competing financial interest.
■ ACKNOWLEDGMENTSThe authors would like to thank Prof. Alexander J. Ninfa atUniversity of Michigan for having provided plasmids and for hissuggestions on the circuit construction and experiments. Thiswork was supported by AFOSR Grant FA9550-10-1-02.
■ REFERENCES(1) Yosef, N., and Regev, A. (2011) Impulse control: Temporaldynamics in gene transcription. Cell 144, 886−896.(2) Kuchina, A., Espinar, L., Cagatay, T., Balbin, A. O., Zhang, F.,Alvarado, A., Garcia-Ojalvo, J., and Suel, G. M. (2011) Temporalcompetition between differentiation programs determines cell fatechoice. Mol. Syst. Biol., DOI: 10.1038/msb.2011.88.(3) Atkinson, M. R., Savageau, M. A., Meyers, J. T., and Ninfa, A. J.(2003) Development of genetic circuitry exhibiting toggle switch oroscillatory behavior in Escherichia coli. Cell, 597−607.(4) Elowitz, M. B., and Leibler, S. (2000) A synthetic oscillatorynetwork of transcriptional regulators. Nature, 339−342.(5) Stricker, J., Cookson, S., Bennett, M. R., Mather, W. H., Tsimring,L. S., and Hasty, J. (2008) A fast, robust and tunable synthetic geneoscillator. Nature 456, 516−519.(6) Bleris, L., Xie, Z., Glass, D., Adadey, A., Sontag, E., and Benenson,Y. (2011) Synthetic incoherent feedforward circuits show adaptationto the amount of their genetic template.Mol. Syst. Biol., DOI: 10.1038/msb.2011.49.(7) Alexander, R. P., Kim, P. M., Emonet, T., and Gerstein, M. B.(2009) Understanding modularity in molecular networks requiresdynamics. Sci. Signaling 2, 1−4.(8) Kirschner, M. W., and Gerhart, J. C. (2005) The Plausibility ofLife: Resolving Darwin’s Dilemma, Yale University Press, New Haven.(9) Lauffenburger, D. A. (2000) Cell signaling pathways as controlmodules: complexity for simplicity? Proc. Natl. Acad. Sci. U.S.A. 97,5031−5033.(10) Hartwell, L., Hopfield, J., Leibler, S., and Murray, A. (1999)From molecular to modular cell biology. Nature 402, 47−52.(11) Alon, U. (2007) An Introduction to Systems Biology: DesignPrinciples of Biological Circuits; Chapman-Hall/CRC, Boca Raton.
ACS Synthetic Biology Research Article
dx.doi.org/10.1021/sb300098w | ACS Synth. Biol. XXXX, XXX, XXX−XXXJ

(12) Del Vecchio, D., Ninfa, A. J., and Sontag, E. D. (2008) ModularCell Biology: Retroactivity and Insulation. Mol. Syst. Biol. 4, 161.(13) Saez-Rodriguez, J., Kremling, A., and Gilles, E. (2005)Dissecting the puzzle of life: modularization of signal transductionnetworks. Comput. Chem. Eng. 29, 619−629.(14) Sauro, H. M. (2008) Modularity defined. Mol. Syst. Biol.,DOI: 10.1038/msb.2008.3.(15) Kim, K. H.; Sauro, H. M. Fan-out in gene regulatory networks. J.Biol. Eng. 2010, 4.(16) Jayanthi, S.; Del Vecchio, D. Tuning genetic clocks employingDNA binding sites. PLoS One 2012, 10.1186/1754-1611-4-16.(17) Cardinale, S., and Arkin, A. P. (2012) Contextualizing contextfor synthetic biology-identifying causes of failure of synthetic biologicalsystems. Biotechnol. J. 7, 856−866.(18) Kim, Y., Coppey, M., Grossman, R., Ajuria, L., Jimenez, G.,Paroush, Z., and Shvartsman, S. Y. (2010) MAPK substratecompetition integrates patterning signals in the drosophila embryo.Curr. Biol. 20, 446−451.(19) Kim, Y., Paroush, Z., Nairz, K., Hafen, E., Jime′nez, G., andShvartsman, S. Y. (2011) Substrate-dependent control of MAPKphosphorylation in vivo. Mol. Syst. Biol. 7, 467.(20) Ventura, A. C., Jiang, P., Van Wassenhove, L., Del Vecchio, D.,Merajver, S. D., and Ninfa, A. J. (2010) The signaling properties of acovalent modification cycle are altered by a downstream target. Proc.Natl. Acad. Sci. U.S.A. 107, 10032−10037.(21) Jiang, P., Ventura, A. C., Merajver, S. D., Sontag, E. D., Ninfa, A.J., and Del Vecchio, D. (2011) Load-induced modulation of signaltransduction networks. Sci. Signaling 4, No. ra67.(22) Franco, E., Friedrichs, E., Kim, J., Jungmann, R., Murray, R.,Winfree, E., and Simmel, F. C. (2011) Timing molecular motion andproduction with a synthetic transcriptional clock. Proc. Natl. Acad. Sci.U.S.A., DOI: 10.1073/pnas.1100060108 .(23) Burger, A., Walczak, A. M., and Wolynes, P. G. (2010)Abduction and asylum in the lives of transcription factors. Proc. Natl.Acad. Sci. U.S.A. 107, 4016−4021.(24) Jayanthi, S., and Del Vecchio, D. (2011) Retroactivityattenuation in bio-molecular systems based on timescale separation.IEEE Trans. Autom. Control 56, 748−761.(25) Wong, W.; Tsai, T.; Liao, J. Single-cell zeroth-order proteindegradation enhances the robustness of synthetic oscillator. Mol. Syst.Biol. 2007, 10.1038/msb4100172.(26) Lin-Chao, S., Chen, W. T., and Wong, T. T. (1992) High copynumber of the pUC plasmid results from a Rom/Rop-suppressiblepoint mutation in RNA II. Mol. Microbiol. 6, 3385−3393.(27) Purcell, O., Grierson, C., Bernardo, M., and Savery, N. (2012)Temperature dependence of ssrA-tag mediated protein degradation. J.Biol. Eng. 6, 10.(28) Cookson, N., Mather, W., Danino, T., Mondragon-Palomino,O., Williams, R., Tsimiring, L., and Hasty, J. (2011) Queueing up forenzymatic processing: correlated signaling through coupled degrada-tion. Mol. Syst. Biol., DOI: 10.1038/msb.2011.94.(29) Chu, D., Barnes, D., and von der Haar, H. (2011) The role oftRNA and ribosome competition in coupling the expression ofdifferent mRNAs in Saccharomyces cerevisiae. Nucleic Acids Res. 39,6705−6714.(30) Buchler, C. P., and Louis, M. (2008) Molecular titration andultrasensitivity in regulatory networks. J. Mol. Biol. 384, 1106−1119.(31) Lee, T.-H., and Maheshri, N. (2012) A regulatory role forrepeated decoy transcription factor binding sites in target geneexpression. Mol. Syst. Biol. 8, 576.(32) Birge, E. A., and Low, K. B. (1974) Detection of transcribablerecombination products following conjugation in Rec+, RecB- andRecC- strains of Escherichia coli K12. J. Mol. Biol. 83, 447−457.(33) Sliusarenko, O.; Heinritz, J.; Emonet, T.; Jacobs-Wagner, C.High- throughput, subpixel-precision analysis of bacterial morpho-genesis and intracellular spatio-temporal dynamics. Mol. Microbiol.2011, 80.(34) Schmidt, T., Friehs, K., and Flaschel, E. (1996) Rapiddetermination of plasmid copy number. J. Biotechnol. 49, 219−229.
(35) Projan, S. J., Carleton, S., and Novick, R. (1983) Determinationof plasmid copy number by fluorescence densitometry. Plasmid 9,182−190.(36) Pushnova, E., Geier, M., and Zhu, Y. S. (2000) An easy andaccurate agarose gel assay for quantitation of bacterial plasmid copynumbers. Anal. Biochem. 284, 70−76.(37) Chang, A. C. Y., and Cohen, S. N. (1978) Construction andcharacterization of amplifiable multicopy DNA cloning vehiclesderived from the P15A cryptic miniplasmid. J. Bacteriol. 134, 1141−1156.
ACS Synthetic Biology Research Article
dx.doi.org/10.1021/sb300098w | ACS Synth. Biol. XXXX, XXX, XXX−XXXK