retirement readiness - washington state … readiness 2 workplace-based retirement plan coverage and...
TRANSCRIPT

Retirement Readiness Washington State Retirement Preparedness Study
November 2017 Report to the Legislature Brian Bonlender, Director

Acknowledgements
Washington State Department of Commerce
Amber Siefer, Project Manager and Lead Researcher Carolyn McKinnon, Policy Advisor and Project Sponsor Jaime Rossman, Policy Advisor Gina Stark, Bank On Washington Program Director Buck Lucas, Research Services With thanks to: AARP Schwartz Center for Economic Policy Analysis at The New School The Center for Retirement Research at Boston College Center for Retirement Initiatives at Georgetown University Washington State Department of Revenue, Research and Fiscal Analysis Division Washington State Department of Social & Health Services,
Aging Long-Term Services Administration, and Research and Data Analysis Division Employee Benefit Research Institute Washington State Office of Financial Management, Forecasting and Research Division Carolyn McKinnon, Policy Advisor, [email protected] Washington State Department of Commerce Strategy and Innovation Unit 1011 Plum St. SE P.O. Box 42525 Olympia, WA 98504-2525 www.commerce.wa.gov For people with disabilities, this report is available on request in other formats. To submit a request, please call 360-725-4000 (TTY 360-586-0772).

Table of Contents
Executive Summary ........................................................................................................................ 1
Introduction ..................................................................................................................................... 5
Sources of Retirement Income ...................................................................................................... 8
Workplace-Based Retirement Plan Coverage and Participation .............................................. 13
Financial Capability: Beliefs, Attitudes, and Practices ............................................................. 27
Fiscal and Revenue Implications ................................................................................................ 33
Policy Discussion ......................................................................................................................... 45
Appendix A: Methodology ........................................................................................................... 50
Appendix B: Workplace-Based Retirement Savings Plans ....................................................... 52
Appendix C: State Policy Initiatives ............................................................................................ 65
Appendix D: 2017 Washington Report by Schwartz Center for Economic Policy Analysis ... 67
Appendix E: Elder Economic Security Standard Index ............................................................. 74

Retirement Readiness 1
Executive Summary
Washingtonians aren’t saving enough for retirement, at the risk of spending their later years with diminishing standards of living and more reliance on public safety net programs. To better understand this issue and how it impacts Washington, the Washington State Legislature directed the Department of Commerce to study the retirement preparedness of Washington residents, based on region, age, type of employment, and income (Supplemental Operating Budget. 2ESHB 2376. Chapter 36, Laws of 2016. Section 126 (48), Lines 28-36).
Key Findings
Overall, Washington’s workforce is underprepared for retirement. This study finds that Washingtonians have low retirement savings levels, declining levels of employer-sponsored coverage, and marginal financial capability to make savings for retirement a priority.
Sources of Retirement Income
For Washington’s population aged 65 and older, the most common source of post-retirement income is Social Security. Social Security is by far the most important source of income for the lowest-income group of seniors in Washington.
Washington and U.S. seniors are increasingly relying on earned income for many reasons, including:
o Declining asset-based income. o A rise in educated workers who choose to continue working. o Changes in the pension system that previously encouraged early retirement, and o A decline in the availability of retiree health insurance.
A substantial decline in the value of pre-retirement assets 2006, even after stock markets, housing, and earnings recovered from the Great Recession, dramatically affected lower-income households’ ability to prepare for retirement.
o For the lowest three income groups, net wealth actually declined by about $4,000 a year from 1992 to 2010.
Since the mid-1970s, the kind of retirement plans that employers primarily sponsor shifted from Defined Benefit (DB – traditional pensions) to Defined Contribution (DC) plans.
o In Washington, more than three in every four workers who have a plan are in DC plans.
o The trend is more pronounced for younger generations of workers, where here in Washington four out of every five covered workers aged 25-44 are covered by DC plans.
Money saved in DC plans is more liquid than investments in DB plans, and, one in four U.S. participants will use some or all of their DC funds to pay for non-retirement needs.
o The use of retirement funds before retirement significantly undermines retirement preparedness: a $5,000 hardship withdrawal from a 401k at age 35 could cause a $30,000 reduction in accumulation by retirement age.

Retirement Readiness 2
Workplace-Based Retirement Plan Coverage and Participation
Workers with access to a retirement savings arrangement at work, specifically through payroll deduction, are 15 times more likely to save for retirement than those without this level of access.
As of 2014, over 2 million working Washingtonians, or 61 percent of the employed workforce including self-employed, were not covered by a workplace-based retirement plan.
o In Washington and the U.S. alike, Hispanic workers are particularly disadvantaged in terms of retirement plan coverage: 79 percent of Hispanic workers in Washington aren’t covered.
o Washington’s workers with less than a high school diploma had by far the most substantial coverage gap at 89 percent while 48 percent with a bachelor’s degree or higher were uncovered.
Smaller and newer businesses are less likely to provide employer plans.
Overwhelmingly, workplace-based retirement plan coverage declined in Washington and nationwide over the past decade.
Not all employees who are covered actually participate in retirement plans. Seventy-eight percent of workers with access to a plan participate.
o There is a divergence in participation rates for defined benefit (DB) versus defined contribution (DC) plans: DB plans have an 85 percent take-up while DCs are at 69 percent.
o This divergence is more pronounced when full-time workers are compared to part-time and when looking at average-wage categories: the higher the number of work hours and wage, the higher the take-up rate.
Retirement Income Adequacy
The type of retirement plans that result in the greatest income replacement rates – DB plans alone, or DB plans combined with DC plans – are scarcely available to today’s workers.
o Just 19 percent of younger Washington workers aged 25-44 with workplace coverage have access to a DB plan (including DBs combined with DCs), compared to 29 percent of workers aged 55-64.
Many American seniors, including Washingtonians, enter retirement with potentially problematic mortgage debt.
o Fifty percent of Washington seniors own their homes outright, 22 percent are renters, and 28 percent are mortgage holders.
Even when other components of retirement income are added, the income replacement outlook is likely to be insufficient for much of Washington’s population closest to retirement:
o 41 percent of Washington’s workers age 55-64 have no projected retirement income from DC or DB plans.
o Another 42 percent have DC plans projected to replace a median of just 10 percent of their pre-retirement income.

Retirement Readiness 3
o The outlook is better for the 6 percent of workers in this cohort with a DB plan; the income replacement rate is 33 percent at the median.
o And for the 11 percent with both plan types, the median income replacement rate is 57 percent – the best case scenario produced by a model used in this study.
Financial Capability
For workers that do have access to workplace-based plans, many cannot afford to contribute or do not have the necessary skills and knowledge to make informed investment choices.
o This is especially troubling when combined with the systematic shift from a retirement system that rewards work tenure with a defined benefit of post-retirement income, to one that relies upon how well workers can make investment choices relative to market fluctuations through defined contribution-type savings vehicles.
The way that Washingtonians manage their finances indicates a lack of financial capability:
o Fifteen percent of Washingtonians spend more than they earn and 41 percent broke even; so, fully 56 percent of residents were not able to save money.
o Thirty percent of Washingtonians reported using high-interest borrowing methods like payday loans, while 34 percent increased their borrowing costs by only paying minimums on credit cards during some months.
Washingtonians are overwhelmed by financial stressors and complexities. Their financial decision-making is hampered because of it.
o Fifty-five percent of Washington households surveyed about retirement savings beliefs reported they are very or somewhat anxious about their retirement security.
o Respondents expect most of their retirement income to come from personal savings and retirement plans (401k, IRA, etc.), yet three in five of these workers have never calculated how much money they’ll need to save for retirement.
Fiscal and Revenue Implications
Over the next two decades, Washington’s senior population will grow dramatically, more than doubling in number by 2040.
o The proportion of our most vulnerable seniors aged 85+ will surpass those in their mid- to late-60s by 2027.
Washingtonians will be living longer, relying on inadequate retirement incomes, while enduring marked increases in cognitive issues.
o Either residents will increasingly rely on public assistance programs for their long-term needs while drastically reducing their standards of living, or they’ll need innovative ways to contribute to the costs of support services without becoming impoverished.

Retirement Readiness 4
Washington would save a total of $298 million from 2018 through 2032 on state-funded public assistance programs for seniors aged 65+ if the lowest two income groups of retirees had saved enough to increase their annual retirement income by $1,000.
o When federal savings are combined with state savings for the same period, the total savings to Washington would be $1.03 billion.
Increased retirement savings reduces state Medicaid spending. o If workers not currently covered by a retirement plan began saving in one,
Washington’s state Medicaid expenditures would be reduced by $58.6 million over a 10-year period.
Policy Considerations
Washington isn’t alone in this looming crisis. The national picture is much the same. The locus for action rests not on households alone, but must be shared by state and the federal governments, the financial services, banking and insurance sectors, and non-governmental organizations.
The findings of this study suggest four major areas of policy considerations: o Increasing retirement plan access and participation. o Increasing financial capability. o Smoothing financial volatility. o Addressing elements of life after retirement.
Retirement Readiness 5
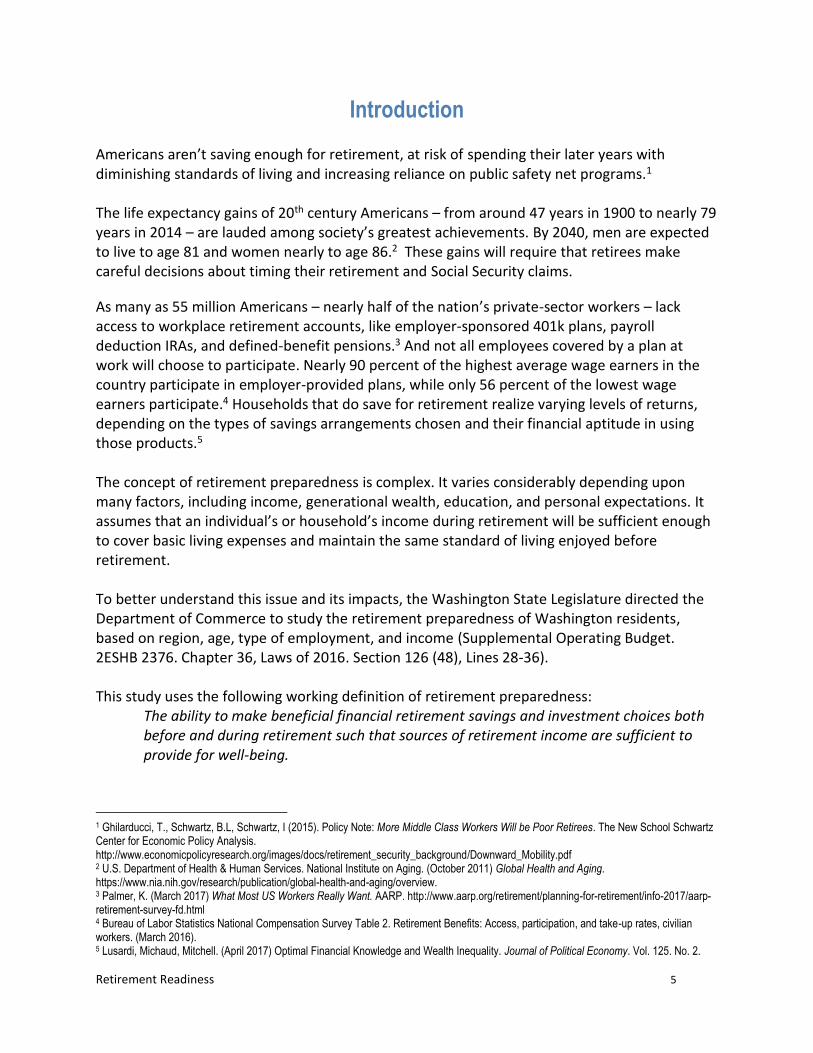
Introduction
Americans aren’t saving enough for retirement, at risk of spending their later years with diminishing standards of living and increasing reliance on public safety net programs.1 The life expectancy gains of 20th century Americans – from around 47 years in 1900 to nearly 79 years in 2014 – are lauded among society’s greatest achievements. By 2040, men are expected to live to age 81 and women nearly to age 86.2 These gains will require that retirees make careful decisions about timing their retirement and Social Security claims.
As many as 55 million Americans – nearly half of the nation’s private-sector workers – lack access to workplace retirement accounts, like employer-sponsored 401k plans, payroll deduction IRAs, and defined-benefit pensions.3 And not all employees covered by a plan at work will choose to participate. Nearly 90 percent of the highest average wage earners in the country participate in employer-provided plans, while only 56 percent of the lowest wage earners participate.4 Households that do save for retirement realize varying levels of returns, depending on the types of savings arrangements chosen and their financial aptitude in using those products.5 The concept of retirement preparedness is complex. It varies considerably depending upon many factors, including income, generational wealth, education, and personal expectations. It assumes that an individual’s or household’s income during retirement will be sufficient enough to cover basic living expenses and maintain the same standard of living enjoyed before retirement. To better understand this issue and its impacts, the Washington State Legislature directed the Department of Commerce to study the retirement preparedness of Washington residents, based on region, age, type of employment, and income (Supplemental Operating Budget. 2ESHB 2376. Chapter 36, Laws of 2016. Section 126 (48), Lines 28-36). This study uses the following working definition of retirement preparedness:
The ability to make beneficial financial retirement savings and investment choices both before and during retirement such that sources of retirement income are sufficient to provide for well-being.
1 Ghilarducci, T., Schwartz, B.L, Schwartz, I (2015). Policy Note: More Middle Class Workers Will be Poor Retirees. The New School Schwartz Center for Economic Policy Analysis. http://www.economicpolicyresearch.org/images/docs/retirement_security_background/Downward_Mobility.pdf 2 U.S. Department of Health & Human Services. National Institute on Aging. (October 2011) Global Health and Aging. https://www.nia.nih.gov/research/publication/global-health-and-aging/overview. 3 Palmer, K. (March 2017) What Most US Workers Really Want. AARP. http://www.aarp.org/retirement/planning-for-retirement/info-2017/aarp-retirement-survey-fd.html 4 Bureau of Labor Statistics National Compensation Survey Table 2. Retirement Benefits: Access, participation, and take-up rates, civilian workers. (March 2016). 5 Lusardi, Michaud, Mitchell. (April 2017) Optimal Financial Knowledge and Wealth Inequality. Journal of Political Economy. Vol. 125. No. 2.

Retirement Readiness 6
This definition, in part, captures the modern realities of retirement planning given changes in lifespan (longevity), benefit coverage, and shorter-term employment arrangements, while allowing for the variations in social and economic preconditions that must exist in order for an individual to prepare to retire. To what degree are Washingtonians underprepared for retirement? This study synthesizes existing research using an array of sources from think tanks, academic literature, government sources, and surveys. It uses two customized sets of analyses based on national survey data:
A customized analysis of the Census Bureau’s Current Population Survey data by the Center for Retirement Research at Boston College.
A customized analysis of the Current Population Survey’s Annual Earning File and Survey of Income Program Participation conducted by the Schwartz Center for Economic Policy Analysis (SCEPA) at The New School. This analysis is a partial follow-up to SCEPA’s robust report, “Are Washington Workers Ready for Retirement?” delivered to the Washington lawmakers during a retirement work session on April 8, 2014. Delayed data releases limited SCPEA’s ability to conduct a full update of that report for this study.
The first four sections of the study are largely descriptive, using a variety of sources to assemble a picture of Washingtonians’ retirement preparedness. The study first reviews the component parts of retirement income, describing an increasingly varied set of income sources when compared to that of already retired generations. It then proceeds to examine the extent to which Washingtonians are covered by retirement savings plans at work, and at what rates workers who are covered actually participate. The retirement income adequacy section looks at two distinct sets of data to understand how Washington residents are doing in terms of retirement income adequacy and financial wellbeing. A review of the financial realities faced by households gives context for a review of survey findings about Washingtonian’s beliefs, attitudes, and practices when it comes to saving for retirement. The study then turns to an exploration of the fiscal and revenue implications given that the majority of Washingtonians are not adequately preparing for retirement. First, recent studies of the fiscal impacts of savings shortfalls are gleaned for salient findings. Then, a deeper look is taken at factors that affect the costs of Long-Term Services and Supports (LTSS) for Washington seniors. Doing so provides an illustration of the negative impacts of savings shortfalls: Increased risk of declining standards of living coupled with increased fiscal impacts on the state and its taxpayers. The focus then shifts to tax revenue implications for the state given increasingly higher proportions of the senior population that could be low-income versus high-income in the near future. Post-retirement household spending patterns are explored in the context of Washington’s tax structure, which relies significantly on retail sales and use taxes. Two scenarios play out extreme examples of retirement savings shortfalls to illustrate their revenue impacts.

Retirement Readiness 7
Based on the findings uncovered in the first five sections, the study’s policy discussion focuses on four major opportunities for addressing Washington’s retirement savings gaps:
1. Increasing retirement plan access and participation.
2. Increasing financial capability.
3. Smoothing financial volatility.
4. Addressing elements of life after retirement.
Stakeholder and Subject-Matter Expert Engagement
Research for this study included engaging stakeholders and experts though meetings and conference calls. In addition to informal consultations, Commerce hosted two major events to seek formal input from stakeholders. Early study development. Commerce convened stakeholders in Olympia on March 15, 2017, to gather input on research design, methods, sources and scope. Attendees included representatives from organizations representing employed and retired workers, and state government. Draft study findings. Commerce and AARP hosted a policy forum in SeaTac on Aug. 30, 2017. Among the 26 participants were representatives from the Washington Retail Association, Washington Hospitality Association, Department of Social and Human Services, Department of Financial Institutions, Office of the State Treasurer, and the federal offices Sen. Patty Murray and Rep. Pramila Jayapal. Also attending were representatives of the Seattle City Council, Russell Investments, Drexel University, Pew Charitable Trust, organizations representing employed and retired workers, and nonprofit financial empowerment organizations. Participants previewed key findings from this study and the under-development Small Business Retirement Marketplace website, and learned about employer attitudes towards providing retirement benefits. They engaged in a robust conversation about the issues and strategies most influencing retirement security today, a discussion that directly informed the Policy Discussion section of this study. Thirteen individuals representing the financial services and insurance industries, state government, employed and retired workers, congressional staff, and a national think tank participated in a follow-up call on Nov. 8, 2017. The meeting included responses to the draft study findings and policy discussion sections, and prioritizing the issues and strategies most likely to improve the situation in Washington state.

Retirement Readiness 8
Sources of Retirement Income
Components of Retirement Income
Twentieth-century wisdom stated that an individual’s retirement income was comprised of three primary components: employer-provided pensions, personal savings, and social security. This is the well-known three-legged stool of retirement saving. However, the simplicity of this model doesn’t adequately represent the complexities of today’s retirement income equation for the majority of Americans.
Rather, the composition of retirement income is from a stack of income streams from a number of sources. The retirement income stack shows all potential sources of income for retired households. Seniors are dependent upon annuitized income built during their working years, such as from Social Security and pensions, and on other forms of accumulated wealth, such as equity in owner-occupied housing, or stocks and bonds.6
For Washington’s population aged 65 and older, the most common source of post-retirement income is Social Security – which has become nearly universal with 87 percent of the state’s seniors receiving this form of income, up from a nationwide level of 69 percent of seniors in 1962.
Forty-eight percent of Washington seniors have income from retirement benefits like pensions, IRAs, annuities, 401(k) plans, and government employee pensions.
Asset income is also a prevalent source of income for Washington seniors, with 71 percent of the population having some form of income from rentals, estates and trusts, interest, and dividends.
6 Poterba, J. Venti, S., Wise. D. (Fall 2011). The Composition and Drawdown of Wealth in Retirement. Journal of Economic Perspectives. Volume 25, No. 4. http://pubs.aeaweb.org/doi/pdfplus/10.1257/jep.25.4.95
Figure 1: The 3-Legged Stool of Retirement Income
Figure 2: The Retirement Income Stack
Social Security
retired worker, dependent, &
disability entitlement benefits
Retirement Benefits
distributions from pensions,
IRAs, Keoghs, 401k plans, etc.
Asset Income
interest, dividends, trusts,
rental income, royalties
Earnings
wages & salaries from current
employment
Veterans Benefits
Cash Public Assistance

Retirement Readiness 9
Some 32 percent of Washington’s seniors have some form of earned income, reflecting a national trend in increased earned income among seniors, discussed later in this section. Figure 3 illustrates the percentage of all Washington seniors receiving income from the various components of the income stack.
Importantly, not all retired households have equivalent retirement income stacks. Figure 4 shows income stacks for Washington’s lowest and highest income groups (quintiles) of the senior population. Social Security is by far the most important source of income for the lowest-income group of seniors in Washington: 79 percent of income is from Social Security, followed by assets (6 percent) and public assistance (6 percent). For the highest-income group, earnings provide the greatest share of income (42 percent) followed by retirement benefits (22 percent).
Social Security | Social Security is the most common source of income for Washington seniors, as shown in Figure 3. Social Security provides most of the retirement income for half of households age 65 and older, and is the largest source of income for retired people in the lowest income brackets.7 As of 2014, Social Security provided at least 50 percent of total income to 48 percent of married beneficiaries, and to 70 percent of aged non-married beneficiaries.8
7 Government Accountability Office (May 2015). Retirement Security Report. Most Households Approaching Retirement Have Low Savings. (GAO-15-419) http://www.gao.gov/assets/680/670153.pdf 8 Social Security Administration (April 2016) Income of the Aged Chartbook, 2014. SSA Publication No. 13-11727. https://www.ssa.gov/policy/docs/chartbooks/income_aged/2014/iac14.pdf
Figure 3: Percentage Population Receiving Income by
Source, Age 65+, Washington, 2016
Source: SCEPA calculations using 2014-16 Current Population Survey March Supplement 2014-16. Notes: (1) Earnings is the sum of income from wages and salaries and income from
self-employment. (2) Asset income includes interest, div idends, income from estates or trusts, and net rental income or royalties. (3) Cash public assistance includes Supplemental Security Income and other cash public assistance payments, such as temporary assistance to needy
families (TANF). (4) Pensions include payments from private pensions and annuities; government employee pensions; Railroad Retirement; and indiv idual retirement accounts
(IRAs), Keoghs, and 401(k) plans.
87%
71%
48%
32%
7%3%
0%
20%
40%
60%
80%
100%
SocialSecurity
Assetincome
Retirementbenefits
Earnings Veterans'benefits
Cash publicassistance

Retirement Readiness 10
The total amount of Social Security benefits paid in 2015 to retired workers and their families in Washington approached $1.3 billion.9 About 4 percent (34,846) of Washington’s seniors also received cash public assistance through Social Security Income payments.10 Social Security is declining as a share of retirement income, from replacing 40 percent of preretirement income in 1985 to a forecasted 31 percent by 2030 for those who retire at age 65.11 Current projections estimate that Social Security will become insolvent in 2034, with revenues covering only 75 percent of scheduled benefits.12 Earnings and Assets | The United States has seen a substantial shift in the composition of income for seniors aged 65+ since the 1990s, wherein earned income increased considerably as a share of total income while asset income fell proportionately.13 Asset income includes interest, dividends, income from estates or trusts, and net rental income or royalties. Asset-based income is typically associated with higher incomes.
As illustrated in Figure 4, earnings comprised 42 percent of high-income seniors’ income in Washington in 2014-16. Looking at similar figures for the U.S., earnings took the place of assets for the highest-income quintile of the senior population between 1990 and 2000, shown in Figure 5. Indeed, a 2012 analysis from Boston College found that the increasing importance of earnings to senior income is attributable, for the average population but even more so in the highest-income population, to:
9 Ibid (8) 10 Social Security Administration. (September 2016). SSI Recipients by State and County, 2015. https://www.ssa.gov/policy/docs/statcomps/ssi_sc/ 11 Munnell, A. (April 2015) Falling Short: The Coming Retirement Crisis and What to do About It. Center for Retirement Research at Boston College. Number 15-7. http://crr.bc.edu/wp-content/uploads/2015/04/IB_15-7_508.pdf 12 See footnote 7 (GAO) 13 Bosworth, B.P. and Burke, K. (November 2012). Changing Sources of Income Among the Aged Population. Center for Retirement Research at Boston College. CRR WP 2012-27.
Figure 4: Retirement Income Sources for Lowest & Highest Income Quintiles, Ages 65+, Washington, 2014-16
6% 3%
5%
42%
6%
13%
4%
22%
79%
20%
0%
20%
40%
60%
80%
100%
LowestQuintile
HighestQuintile
Social Security
Retirementbenefits
Assets
Earnings
Publicassistance/other
Source: SCEPA calculations using 2014-16 Current Population Survey
March Supplement 2014-16.

Retirement Readiness 11
Delayed exit from the labor force.
A rise in the proportion of more educated workers who choose to continue working.
Changes in the pension system that previously encouraged early retirement.
A decline in the availability of retiree health insurance.14 In net terms, the value of pre-retirement assets increased little from 1992 to 2005 and have been on a downward trend since 2006. This downward net asset trend continued even after stock markets, housing, and earnings recovered from the Great Recession. The downward trend was severe for low-income pre-retirement Americans, and the asymmetry of asset accumulation between the highest- and lowest-income levels increased dramatically since 2002. For the lowest three pre-retirement quintiles (by income), net wealth declined by about $4,000 a year from 1992 to 2010. 15 This illustrates what it looks like for household wealth to be increasingly concentrated at the top of the income distribution.
Retirement Plans | Also known as retirement benefits, this is income from the array of tax-favored retirement savings plans into which a worker, and in some arrangements their employer, contributes earned income that, upon retirement, is converted into income. Broadly construed, there are upwards of 15 types of retirement plans recognized by the Internal Revenue Service, each with specific requirements and limitations for participation, contributions and sponsorship:
Individual Retirement Arrangements (IRAs)
Roth IRAs
401(k) Plans
403(b) Plans
SIMPLE IRA Plans (Savings Incentive Match Plans for Employees)
SEP Plans (Simplified Employee Pension)
SARSEP Plans (Salary Reduction Simplified Employee Pension)
Payroll Deduction IRAs
Profit-Sharing Plans
Defined Benefit Plans
Money Purchase Plans
Employee Stock Ownership Plans (ESOPs)
Governmental Plans
457 Plans
409A Nonqualified Deferred Compensation Plan
Individual Plans | Individual retirement plans are generally established through a private financial institution. They include Traditional and Roth Individual Retirement Arrangements (IRA), SEP Plans, and SIMPLE IRA plans. About 8 percent of Americans participate in IRAs, with the Roth IRA being the most popular. Average annual contributions are greatest to SEP plans (e.g., $10,274 on average in 2007) because the tax code allows for higher contributions than to the other types of individual plans (e.g., $3,306 for Traditional IRAs).16
14 Ibid (13) 15 Trostel, Phillip. (February 2017). The Fiscal Implications of Inadequate Retirement Savings in Maine. The University of Maine Margaret Chase Smith Policy Center. 16 Treasury Inspector General for Tax Administration. (August 9, 2010). Statistical Trends in Retirement Plans. https://www.treasury.gov/tigta/auditreports/2010reports/201010097fr.pdf

Retirement Readiness 12
Employer-Sponsored Plans | Since the mid-1970s, the kind of plans that private sector employers primarily sponsor shifted from Defined Benefit (DB) to Defined Contribution (DC) plans. DB plans, often considered pensions in the truest sense, are plans that provide a specified and predictable post-retirement income based on a fixed formula based on worker earnings and length of service.17 DC plans are those in which an employee or the employer, often both, contribute to the employee’s retirement savings. Instead of the specified post-retirement income stream offered in DB plans, DC plan distributions depend on the contributions made to the plan plus any gains (or losses) from investments.18 In a DC plan, the individual employee is required to make decisions about how much to save, how to invest their contributions and how to manage disbursements from their plan upon retirement or in times of hardship. As of 2014, across the U.S., 93 percent of all employer-sponsored plans are DC plans.19 In both Washington and the U.S., more than three in every four covered workers are in DC plans, the inverse of the proportion found in the mid-1970s, when just one in four covered workers were in DC plans.20 The trend is more pronounced for younger generations of workers, where here in Washington four out of every five covered workers aged 25-44 are covered by DC plans.21 An important difference between plan types is that money saved in DC plans is more liquid than investments in DB plans, and, thus, can be accessed more easily to pay for expenses before retirement. Nationally, one in four people with a defined contribution plan will use all or some of their funds to pay for non-retirement needs, like paying a bill, buying a home, paying for a medical emergency, or to pay college expenses for a child.22 These are called “leakages” and, by far, the biggest source of retirement leakage is due to employees cashing out accounts when they leave or change jobs.23 The use of retirement funds before retirement significantly undermines retirement preparedness. For instance, one $5,000 hardship withdrawal from a 401(k) at age 35 could cause a $30,000 reduction over the life of the investment because of lost compound interest.24
17Internal Revenue Service. (June 2017). Choosing a Retirement Plan: Defined Benefit Plan. https://www.irs.gov/retirement-plans 18 Internal Revenue Service. (June 2017). Topics for Retirement Plans: Definitions. https://www.irs.gov/retirement-plans/plan-participant-employee/definitions 19 Ibid (18) 20 US Department of Labor. (September 2016). Private Pension Plan Bulletin Historical Tables and Graphs 1975-2014.
https://www.dol.gov/sites/default/files/ebsa/researchers/statistics/retirement-bulletins/private-pension-plan-bulletin-historical-tables-and-graphs.pdf 21 SCEPA Calculation based on CPS Annual Earning File 2013 and SIPP 2014. 22 Mitchell, D., Lynne, G. (June 2017). Driving Retirement Innovation: Can Sidecar Accounts Meet Consumer’ Short- and Long-Term Financial Needs? The Aspen Institute Financial Security Program. Issue Brief. https://assets.aspeninstitute.org/content/uploads/2017/06/FSP-Sidecar-Accounts-Brief.pdf 23 Ibid (22) 24 Ibid (22, 23)

Retirement Readiness 13
Workplace-Based Retirement Plan Coverage and Participation
Workplace-based retirement plan coverage is a substantial means by which American workers save for retirement. Workers with access to a retirement savings arrangement at work, specifically through payroll deduction, are 15 times more likely to save for retirement than those without this level of access.25
This section examines the extent to which Washingtonians have access to retirement savings plans in the workplace. It looks in detail at the characteristics of both uncovered workers and of employers that do not provide coverage. The last topic addressed in this section is the participation rates of workers with workplace access to retirement plans.
Appendix B provides tables detailing workplace-based plan coverage for Washington.
Uncovered Workers
As of 2014, over 2 million working Washingtonians, or 61 percent of the employed workforce including self-employed, were not covered by a workplace-based retirement plan. As shown in Table 1, 1.2 million worked for employers who did not offer a retirement benefit; the balance of 487,000 work for an employer that offers a plan but don’t qualify to participate in the plan, or are self-employed without a plan (308,000).26
25 Employee Benefit Research Institute, unpublished estimates of the 2004 Survey of Income and Program Participation Wave 7 Topical Module (2006 data) for workers earning between $30,000 and $50,000, 2006, as cited in AARP Public Policy Institute Fact Sheet: Access to Workplace Retirement Plans by Race and Ethnicity, February 2017. http://www.aarp.org/content/dam/aarp/ppi/2017-01/Retirement%20Access%20Race%20Ethnicity.pdf 26 Boston College Center for Retirement Research. (2016). Calculations from Current Population Survey, March Supplement 2015 (reflecting 2014 calendar year data). Note: Weighted using the Current Population Survey, March Supplement weights. Workers are not in the military, are not unpaid family workers, and are in the pension universe. Includes both private and public sector workers. All public sector workers are considered as working for an employer offering a plan.
Reason for not having coverage Number of workersShare of total
workforce
All Washington Workers 3,305,140 100%
Total uncovered 2,010,926 61%
Employer does not offer a plan 1,214,935 37%
Employer offers plan, not included 487,800 15%
Self-employed without plan 308,191 9%
Note: Weighted using the Current Population Survey, March Supplement weights. Workers are not in the
military , are not unpaid family workers, and are in the pension universe. Includes both private and public
sector workers. All public sector workers are considered as working for an employer offering a plan.
Source: Boston College Center for Retirement Research calculations from Current Population Survey, March
Supplement 2015 (reflecting 2014 calendar year data).
Table 1. Uncovered Workers in Washington by Reason for Lack of
Coverage, 2014
Retirement Readiness 14
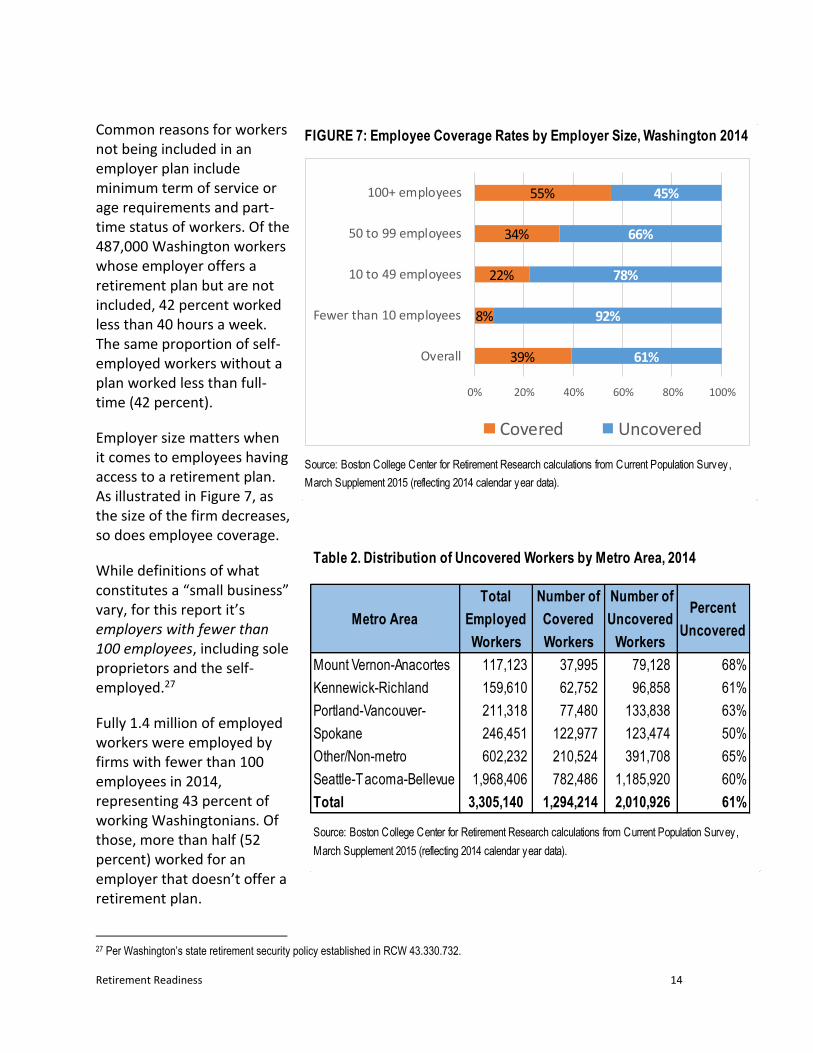
Common reasons for workers not being included in an employer plan include minimum term of service or age requirements and part-time status of workers. Of the 487,000 Washington workers whose employer offers a retirement plan but are not included, 42 percent worked less than 40 hours a week. The same proportion of self-employed workers without a plan worked less than full-time (42 percent).
Employer size matters when it comes to employees having access to a retirement plan. As illustrated in Figure 7, as the size of the firm decreases, so does employee coverage.
While definitions of what constitutes a “small business” vary, for this report it’s employers with fewer than 100 employees, including sole proprietors and the self-employed.27
Fully 1.4 million of employed workers were employed by firms with fewer than 100 employees in 2014, representing 43 percent of working Washingtonians. Of those, more than half (52 percent) worked for an employer that doesn’t offer a retirement plan.
27 Per Washington’s state retirement security policy established in RCW 43.330.732.
Source: Boston College Center for Retirement Research calculations from Current Population Survey,
March Supplement 2015 (reflecting 2014 calendar year data).
FIGURE 7: Employee Coverage Rates by Employer Size, Washington 2014
39%
8%
22%
34%
55%
61%
92%
78%
66%
45%
0% 20% 40% 60% 80% 100%
Overall
Fewer than 10 employees
10 to 49 employees
50 to 99 employees
100+ employees
Covered Uncovered
Metro Area
Total
Employed
Workers
Number of
Covered
Workers
Number of
Uncovered
Workers
Percent
Uncovered
Mount Vernon-Anacortes 117,123 37,995 79,128 68%
Kennewick-Richland 159,610 62,752 96,858 61%
Portland-Vancouver- 211,318 77,480 133,838 63%
Spokane 246,451 122,977 123,474 50%
Other/Non-metro 602,232 210,524 391,708 65%
Seattle-Tacoma-Bellevue 1,968,406 782,486 1,185,920 60%
Total 3,305,140 1,294,214 2,010,926 61%
Table 2. Distribution of Uncovered Workers by Metro Area, 2014
Source: Boston College Center for Retirement Research calculations from Current Population Survey,
March Supplement 2015 (reflecting 2014 calendar year data).

Retirement Readiness 15
Employers cite costs and complexity as the primary reasons to not offer a retirement plan to employees. Understandingly, then, smaller firms are less able to navigate costs and administrative complexities. This is presumably true for Washington’s 308,000 self-employed workers and proprietors without a retirement plan, who represent 21 percent of Washington’s uncovered employed workforce.
Coverage estimates for geographic subsets of Washington’s working population are sparse because the data used for these estimates are based on surveys that are unreliable for localized analyses. That said, Table 2 shows that the Seattle-Tacoma-Bellevue metro area is home to 1.18 million uncovered workers, about 60 percent of its employed workforce. The coverage gap appears to be the lowest in the Spokane metro area, where 50 percent of employed workers lack access. On the other end of the state, the relatively small Mount Vernon-Anacortes metro area posts the state’s highest coverage gap at 68 percent, still not a far reach from the overall gap of 61 percent.
Table 3, on the following page, examines the extent to which employed workers have coverage by key demographics, such as age, race, and education. Minimum age requirements are a significant reason why younger workers – 100 percent of those under 18 and upwards of 90 percent aged 18 to 24 – are excluded from employer-sponsored retirement plans. However, the majority of younger uncovered workers were employed by a firm that doesn’t offer a plan in 2014 (76 percent of workers under 18 and 67 percent aged 18-24).
About one-third of older uncovered workers are self-employed without a plan, a level not observed for younger cohorts. By age group, it’s the oldest workers – those aged 64+ – with the highest rates of worker for employers that offer plans but are not covered by those plans. More research would be required to accurately attribute causes for this: How many elder workers are uncovered by choice (opting-out of an employer plan) versus not being qualified for the employer plan?
With regards to race and ethnicity, the variation in overall worker coverage rates is minimal among all races, with the uncovered share ranging from 58 percent for Whites to 63 percent for Blacks, with Asians and “Other” in that range. When looking at Hispanics, however, the share of uncovered workers is substantially higher: 79 percent.28 This finding is consistent with national observations that Hispanics are particularly disadvantaged in terms of retirement plan coverage.29
28 This analysis uses race categories established by the US Census Bureau’s Current Population Survey, which includes Hispanic as a race. Survey respondents self-identify their race from the list provided. For purposes of the discussion in this section of the report, Hispanic is construed as an Ethnicity made up of multiple races, more commonly referred to as Latinx. 29 See, for example, The Pew Charitable Trusts, “Employer-Sponsored Retirement Plan Access, Uptake, and Savings: Workers report barriers and opportunities”. September 2016.

Retirement Readiness 16
Perhaps the most direct relationships illustrated in Table 3 is that between education level and worker coverage. Washington’s workers with less than a high school diploma had by far the most substantial coverage gap at 89 percent. Just 48 percent of employed workers with a bachelor’s degree or higher were uncovered.
Table 3. Uncovered Workers by Demographic, Washington, 2014
Worker
Characteristic
Total
Employed
Workers
Workers Not
Covered by a
Plan
Uncovered as % of Total
Employed Workers
Total 3,305,140 2,010,926 61%
Gender
Male 1,768,954 1,095,825 62%
Female 1,536,186 915,101 60%
Age
Under 18 26,219 26,219 100%
18 to 24 375,267 337,237 90%
25 to 54 2,118,553 1,197,385 57%
55 to 64 589,687 293,947 50%
64+ 195,414 156,138 80%
Race
White 2,401,210 1,389,130 58%
Black 106,297 67,184 63%
Asian 248,734 150,347 60%
Hispanic 385,521 303,714 79%
Other 163,378 100,551 62%
Nativity
Native 2,724,461 1,597,554 59%
Foreign-born 580,679 413,372 71%
Education
Less than HS 257,397 228,841 89%
High school only 780,047 530,115 68%
Some college 1,013,014 652,737 64%
Bachelor's or more 1,254,682 599,233 48%
Number of employers
Single employer 2,887,024 1,723,267 60%
Multiple employers 418,116 287,659 69%
No tax filing (under $4,000 income)
Not filing 147,610 140,873 95%
Source: Boston College Center for Retirement Research calculations from Current Population Survey, March Supplement
2015 (reflecting 2014 calendar year data).
61%
62%
60%
100%
90%
57%
50%
80%
58%
63%
60%
79%
62%
59%
71%
89%
68%
64%
48%
60%
69%
95%

Retirement Readiness 17
Firms
In 2014 Washington had 178,546 business entities, referred herein as firms. Of those, an estimated 131,231 (74 percent) did not offer retirement savings plans to their employees. Of those, the vast majority of them (129,154 firms) had fewer than 100 employees. Clearly, this reinforces the finding that employer size is a leading inverse driver of retirement plan coverage.
Another dynamic in employer provision of benefits is tenure – the number of years since a firm’s establishment. Prevailing wisdom is that start-ups, which are by nature small in number of employees, require years of operation before provisioning more than rudimentary employee benefits. Table 4 illustrates that 15 percent of all firms not offering retirement plans are under two years old. This group of newer firms employed 6 percent of the uncovered workers in 2015, suggesting, then, that the tenure “problem” is not one that dominates the coverage gap here in Washington.
When examining coverage rates by metro area, two observations stand out and call for further inquiry beyond the capabilities of this study. First, Washington’s non-metro areas are home to a substantially lower share of firms not offering retirement plans (52 percent) than metro areas (77-85 percent). Second, the share of firms without plans is disproportionately higher in the Seattle-Tacoma-Bellevue metro area, which is home to 56 percent of all firms but has 62 percent of firms without coverage. These figures are in Appendix B.
The Great Recession: Change in Coverage Rates
Table 4: Number of Firms Not Offering Retirement Plan by Size and Time in Existence, 2014
Size of firm Total Firms
Firms Not
Offering
Retirement
Plan
Employees
without
Retirement
Plan
Total Firms
Firms Not
Offering
Retirement
Plan
Employees
without
Retirement
Plan
Fewer than 10 employees 23,369 18,426 53,388 110,376 87,029 252,163
10 to 49 employees 1,767 1,171 16,211 31,006 20,541 284,461
50 to 99 employees 83 42 3,036 3,800 1,946 139,691
100+ employees 50 13 2,851 8,095 2,064 463,134
Total 25,268 19,651 75,486 153,278 111,580 1,139,449
Under 2 Years of Existence 2+ Years of Existence
Source: Boston College Center for Retirement Research calculations from U.S. Census Bureau Longitudinal Business Database, 2014 (reflecting
2013 calendar year data); U.S. Census Bureau County Business Patterns, 2014; and Current Population Survey, March Supplement 2015
(reflecting 2014 calendar year data). These data were then scaled by the number of firms with fewer than or more than two years of ex istence
based on the Longitudinal Business Database. Affected firms uses the non-coverage rate for private, non-self-employed workers by firm size in the
Current Population Survey, where the non-coverage rates are the same for both age categories. Affected employees splits the total number of
employees from the Current Population Survey that do not have a workplace-based retirement savings place offered by their firm's size and age.

Retirement Readiness 18
Through a partnership with the Schwartz Center for Economic Policy Analysis (SCEPA) at the New School for Social Research, this section examines what happened to retirement plan coverage rates for Washingtonians from the period immediately preceding the Great Recession, 2004-06, to the most recent period for which data are available, 2014-16. Readers should note that this analysis and its data sources differ from those earlier in this section, which explains the slight variation in total coverage estimates.
Overwhelmingly, workplace-based retirement plan coverage declined in Washington and nationwide. The declines for both Washington (-7.6 percentage points) and the rest of the U.S. (-8.7 percentage points) are statistically significant. This is cause for concern because the most effective way for workers to build retirement savings is through payroll deduction in the workplace.30 In 2014-16 there was about 54 percent of working Washingtonians with access to a retirement plan in the workplace, down from close to 62 percent before the Great Recession.
Rates of retirement plan sponsorship typically increase as firm size increases. However, the countervailing forces presented during the Great Recession pulled sponsorship down, even for the largest firms (Figure 8). The Great Recession hit all classes of workers when it came to reductions in retirement plan coverage in the workplace (Figure 9). Private-sector employees, union members and contract-covered workers were proportionately more affected, as illustrated in Figure 10. Further research is necessary to attribute how much of these declines were due to structural changes to the provision of employee benefits as opposed to those caused simply by the fluctuations of the business cycle. However, lead researchers at SCEPA
30 Segal Consulting. (Winter 2017). State Retirement Savings Initiatives Do More than Enhance Retirement Security for Private Sector Workers. https://www.segalco.com/media/2966/data-1-2017.pdf
FIGURE 8: Change in Retirement Plan Coverage Rates
by Size of Firm, Washington 2004-06 to 2014-16
FIGURE 9: Change in Retirement Plan Coverage Rates by Sector
and Union Status, Washington 2004-06 to 2014-16
Source: SCEPA Calculation based on CPS-ASEC pooled samples 2004-06 and 2014-2016. See Appendix C for detailed coverage changes for all demographics.
-6%
-11% -11%
-17%
-9%
-20%
-15%
-10%
-5%
0%
<10 10-99 100-499 500-999 1000+
perc
enta
ge p
oint
cha
nge
size of firm (number of employees)
-5%-6%
-10%
-7%
-10%
-20%
-15%
-10%
-5%
0%
Self-
Employed
Public
Sector
Private
Sector
Non-Union Union
Member
or Covered
by
Union
Contract
perc
enta
ge p
oint
cha
nge
Sector/Class of Worker

Retirement Readiness 19
describe the observed declines as largely structural. Appendix D shows detailed coverage rates by worker and firm characteristics for this period.
Other Factors Related to Workplace Coverage
Coverage, alone, will not solve the retirement-preparedness gap because not all eligible workers participate in workplace plans. In the next section, the study lays out detailed facts about retirement plan take-up rates for different classes of workers and different size employers. But first, there are other important factors that affect the adequacy of workplace-based retirement saving.
Inadequate contributions
Workers making inadequate levels of contributions, by keeping regular contributions at too low a dollar amount or by taking an abundance of contribution “holidays.”
Included in inadequate contributions are opportunity costs of leaving employer matches on the table by not “maxing out” matched contributions.
Leakages
Workers withdrawing savings before retirement through loans, hardship withdrawals, or cash-outs when they change jobs.31
Suboptimal investment selections and excessive fees
Workers, overwhelmed with choices and complexity, may select investment funds that perform sub optimally compared to other investment options in their given plan.
Excessive fees in poorly controlled plans deteriorate both the investment principal and potential for compound returns.
31 See leakage discussion about defined contribution plans in Sources of Retirement Income, Employers-Sponsored Plans.
Workplace retirement plan coverage
Eligible but not participating
Inadequate contributions
Leakages
Suboptimal investment selections,
excessive fees
Figure 10: Factors Affecting the Adequacy of Workplace-based Retirement Saving
Source: Department of Commerce illustration. Note: Size of concentric circles not
intended to denote actual scale of factors or their impacts on retirement savings.

Retirement Readiness 20
Retirement Plan Participation Rates
Not all employees who are covered and eligible actually participate in retirement plans.32 In Washington, about 16 percent of covered workers don’t participate compared to 17 percent nationwide. Naturally, workers will participate in retirement plans at different rates depending on industry sector, income bracket, and life stage, for instance. Reasons that workers say they don’t participate in their employer-based retirement plan are explored more fully in the next section, which examines beliefs, practices, and attitudes towards saving for retirement.
Of note, Washington’s participation rate increased by 1.3 percentage points from 2004-06 and 2014-16 (not statistically significant), but decreased in the rest of the U.S. by a statistically significant -1.4 percentage points.
Figure 11, Retirement Benefit Access and Take-Up Rates, Civilian Workers, U.S., March 2016
32 While this analysis focuses on workplace-based coverage, worth noting is that only 8-10 percent of workers eligible for IRAs- individual retirement accounts - participate in one. See Knoll, M.A. (2010) The Role of Behavioral Economics and Behavioral Decision Making in Americans’ Retirement Savings Decisions. Social Security Bulletin. Vol. 70, No. 4. https://www.ssa.gov/policy/docs/ssb/v70n4/v70n4p1.html
Take-up rate, 85%
Defined Benefit 27% of workers have
access
Take-up rate, 69%
Defined Contribution
58% of workers have access
Take-up rate, 81%
Full time workers80% of workers
have access
Take-up rate, 59%
Part time workers37% of workers have
access
Take-up rate, 56%
Lowest 25% of average wage
earners44% of workers have
access
Take-up rate, 74%
Second 25% of average wage
earners71% of workers have
access
Take-up rate, 84%
Third 25% of average wage
earners81% of workers have
access
Take-up rate, 89%
Highest 25% of average wage
earners89% of workers have
access
Source: Bureau of Labor Statistics, National Compensation Survey, Table 2. Retirement Benefits: Access, participation, and take-up rates, civilian workers. March 2016.

Retirement Readiness 21
Nationally, civilian workers – those in private industry and state/local government combined –have a take-up rate of 78 percent.33 That is, 78 percent of workers with access to a plan participate. However, there is a divergence in participation rates for defined benefit (DB) versus defined contribution (DC) plans: DB plans have an 85 percent take-up while DCs are at 69 percent. The take-up rate divergence is even more pronounced when full-time workers are compared to part-time and when looking at average-wage categories: the higher the average wage, the higher the take-up rate.
Workplace Coverage and Participation: Discussion
The body of work in the fields of behavioral economics and finance has demonstrated behavioral tools, or nudges, that are most effective at getting workers to save for retirement. The basic requirements to reach a level of savings that meaningfully impact savings inadequacies include:
1. Availability: More access to tax-favored retirement saving vehicles in the workplace (i.e., increase coverage).
2. Increased participation rates for those covered – best achieved through automatic enrollment.
3. Optimize contributions and returns on investments by using features such as a default investment rate, minimizing the number of investment fund choices, and automatically escalating contribution rates over time.34
Retirement Security Initiatives | State governments have incorporated these concepts into policies aimed at increasing private-sector workplace coverage and participation. As of September 2017, nine states have passed some form of retirement security legislation, and another 23 states and cities have introduced legislation35. These initiatives are still in the formulation and implementation stages; impacts and the relative merits of their differences won’t be realized for years to come. Details are provided in Appendix C: State Programs. These policies sort into four primary models.
1. Marketplace Washington and New Jersey have similar Small Business Retirement Marketplace programs. These programs establish online portals where employers and individuals may comparison shop for low-cost retirement savings plans. Participation is voluntary for both employers and employees.36 Conceptually, a variety of plan types may be made available on state marketplaces, including, IRAs, payroll deduction IRA, SIMPLE IRA, SEP
33 Bureau of Labor Statistics, National Compensation Survey, Table 2. Retirement Benefits: Access, participation, and take-up rates, civilian workers. March 2016. 34 Benartzi, Shlomo and Richard H. Thaler. (March 2013). Behavioral Economics and the Retirement Savings Crisis. Science: 1152-1153. 35 Georgetown University, Center for Retirement Initiatives. State Initiatives Transforming the Retirement Savings Landscape http://cri.georgetown.edu/states/ 36 Comparison of Retirement Plan Design Features, by State: Massachusetts, Washington and New Jersey. Georgetown University, Center for Retirement Initiatives, State Brief 16-02, November 30, 2016 Update.

Retirement Readiness 22
IRA, and, potentially, Defined Contribution and Defined Benefits plans. Employees of employers who select a plan offered on a Retirement Marketplace would be automatically enrolled only if it were an ERISA plan providing for automated participation. Otherwise, all employee participation would be on an opt-in basis.
2. Prototype Plan37
Prototype plans are pre-approved plans by the Internal Revenue Service under the Master and Prototype program. This consists of a basic plan document containing non-elective provisions, an adoption agreement containing elective provisions that an adopting employer selects, and a trust or custodial account.38 Massachusetts is the only state to establish this type of plan for small non-profit employers.
3. State Multiple Employer Plan (MEP) In June 2017, Vermont passed legislation to create a voluntary open multiple employer plan (MEP) supplemented by a retirement marketplace.39 The MEP establishes a single 401(k) type plan to be overseen by the state with oversight by a seven-member board chaired by the state treasurer. The plan will be available on a voluntary basis to Vermont employers with 50 or fewer employees not offering a retirement plan to their employees, and to self-employed individuals. Employees who work for employers that opt into the MEP will be enrolled in the plan automatically, but can opt out if they choose.
4. Automatic IRA Variously referred to as Auto-IRA and Secure Choice, this model combines a requirement that employers without a plan automatically enroll their workers in a state-sponsored or state-procured payroll deduction IRA. Covered workers can opt-out of the plans. The plans will implement elements of the automation features to help increase participation and contributions: automatic enrollment, automatic default to a certain contribution level (some with auto-escalation over time), and automatic default into a specific investment fund. Five states have adopted variations of this model: Oregon, California, Illinois, Connecticut, and Maryland. The city of Seattle is the first city to officially consider an auto-IRA policy; legislation is in process as of fall 2017.
37 Ibid (36) 38 Internal Revenue Service, Types of Pre-Approved Retirement Plans: https://www.irs.gov/retirement-plans/types-of-pre-approved-retirement-plans 39 Vermont S. 135, an act relating to promoting economic development, Sec. C.1. The Green Mountain Secure Retirement Plan.

Retirement Readiness 23
Retirement Income Adequacy
There are many ways to define adequate retirement income.40 This study takes the approach of placing retirement income adequacy in the context of an individual’s or household’s financial wellbeing. Financial wellbeing in retirement is determined by estimating whether post-retirement income streams are sufficient to cover basic living expenses without having to forego necessary expenses. This section looks at two distinct sets of data to understand how Washington residents are doing in terms of retirement income adequacy and financial wellbeing. The first is an examination of basic living expenses using the Elder Economic Security Index for Washington seniors produced by the National Council on Aging and The Gerontology Institute, University of Massachusetts-Boston. The second is a limited forecast of expected income replacement for Washington workers closest to retirement age produced by the Schwartz Center for Economic Policy Analysis (SCEPA) at the New School. Readers are cautioned that the post-retirement income and expense data sets presented here have distinct limitations and cannot be compared side-by-side.
Post-Retirement Costs of Living
Elder Economic Security Index | Washington’s Elder Economic Security Index offers a conceptual framework for understanding the expenses faced by senior individuals and households. The index measures a “market basket” of goods and expenses that, combined, make up the total monthly cost to live with a reasonable quality of live without having to go without necessities. The index represents seniors that live independently in the community, are no longer working, and are aged 65+. Appendix E provides a detailed index table and definitions. For the average senior person aged 65+ in good health the baseline for annual expenses is $21,372 for homeowners without a mortgage, $24,408 for renters and $33,756 for mortgage holders. Indices are adjusted accordingly for elder couples such that for the average Washington couple in good health, expenses are $32,604 for homeowners without a mortgage, $35,640 for renters, and $44,998 for those with mortgages. As a point of reference, the average annual Social Security retirement benefit in Washington was $17,078 in 2016. Fifty percent of Washington seniors own their homes outright, 22 percent are renters, and 28 percent are mortgage holders.41 Of note is that only 25 percent of U.S. households aged 55-64
40 GAO. Retirement Security. Most Households Approaching Retirement Have Low Savings. May 2015. 41 Wider Opportunities for Women. (2011). Elder Economic Security Initiative: The Elder Economic Security Standard Index for Washington.

Retirement Readiness 24
with mortgage debt have enough assets aside from their retirement savings and Social Security to cover their mortgage debt, indicating that these Americans are headed for retirement with problematic housing debt.42
Income Replacement: Defined Benefit and Defined Contribution
Income Replacement Rates |How much income a person should expect to live on after stopping work is often expressed in proportion to their preretirement income, their income replacement rate (IRR). It’s a metric for retirees’ well-being. Income streams from many sources replace an individual’s preretirement income. These streams include Social Security, defined-benefit or pension plan distributions; IRA distributions; cash streams from assets like rentals or royalties; and earnings in the form of wages.43 The IRR calculation shows the rate at which retirement assets replace pre-retirement cash flow after adjusting for taxes, savings, and age and/or work-related expenses.44 The IRR is a tool to help estimate potential retirement savings shortfalls and set savings goals. The target IRR, however, is anything but standard: recommended rates range from 65 percent to 95 percent depending on how preretirement earnings are measured and on expectations
42 See Appendix D: SCEPA Washington Report, Table: Household Non-Retirement Financial Assets and Mortgage Debt in the US. 43 GAO-15-419. Report Retirement Security. Most Households Approaching Retirement Have Low Savings. May 2015. 44 VanDerhei, J. Measuring Retirement Income Adequacy: Calculating Realistic Income Replacement Rates. Employee Benefit Research Institute. Issue Brief No. 297. September 2006.
Figure 13: Minimum Annual Income Levels for Retirement Financial Wellbeing,
Elder Economic Security Standard Index, Washington Statewide Average, 2016
Source: National Council on Aging and The Gerontology Institute, University of Massachusetts Boston, The Economic Security Database Note: For additional information on the Elder Index, see the Gerontology Institute’s The National Economic Security Standard Index. U.S., state and county-level Elder Index data can be viewed and downloaded at the Economic Security Database. The Elder Economic Security Standard™ Index (Elder Index) was developed by the Gerontology Institute at the University of Massachusetts Boston with Wider Opportunities for Women, and is maintained in partnership with the National Council on Aging.

Retirement Readiness 25
about retirement standards of living and lifespan.45 A common rule of thumb is that total annual retirement income from all sources should replace about 70 percent of the last pre-retirement annual earnings for an average worker and up to 90 percent for lower-wage workers.46 Projected Income Replacement for Washington’s Workers Aged 55-64 | Commerce partnered with the Schwartz Center for Economic Policy Analysis (SCEPA) to model income replacement rates for Washington’s working population aged 55-64. Because of data limitations, this is a conservative and narrowly construed set of estimates: Retirement income streams and replacement rates are estimated for only Defined Benefit (DB) and Defined Contribution (DC) plans; they exclude income from Individual Retirement Accounts (IRAs), non-retirement financial assets, Social Security, and cash public assistance.47 In other words, the following are estimates for just one of the components of the retirement income stack. Table 5 shows that that 41 percent of Washington’s workers who are closest to retirement haven’t any projected retirement income from DB or DC plans. Forty-two percent in this age group have DC plans that are projected to replace a median of just 10 percent of pre-retirement income. Even when other components of retirement income are added, the income
45 SEC’s Office of the Investor Advocate. Perspectives on Retirement Readiness in the United States: A White Paper. December 2016. https://www.sec.gov/advocate/staff-papers/white-papers/retirement-readiness-white-paper.pdf 46 Biggs, A., Springstead, G. Social Security Office of Retirement and Disability Policy. Alternative Measures of Replacement Rates for Social Security Benefits and Retirement Income. Social Security Bulletin, Vol. 68, No. 2, 2008. https://www.ssa.gov/policy/docs/ssb/v68n2/v68n2p1.html 47 For a more robust analysis using older data, see Saad-Lessler, et al., Are Washington Workers Ready For Retirement? Trends in Plan Sponsorship, Participation and Preparedness: http://www.economicpolicyresearch.org/images/docs/research/retirement_security/SCEPA_WA_report_March_2014.pdf
Table 5: Retirement Plan Coverage, Plan Balances, and Projected Retirement Income, Workers Aged 55-64, Washington, 2014
Source: SCEPA Calculation based on CPS Annual Earning File 2013 and SIPP 2014.
Notes: 1) Assumes workers retire from their current job at age 65, and receive a DB pension of 1.5 percent of salary for each year of service. 2) Assumes that 401(k) participants contribute 6 percent of salary, plus a 50 percent match, if they are not also covered by a DB plan. 3) Assumes a 4.5 percent real rate of return on plan assets, zero percent real wage growth, and that plan participants draw down DC wealth at retirement at 4 percent a year. 4) Some workers covered by only a DB plan have IRA plans as a result of rollover from prior DC employment or direct contribution. Assumes no future direct contributions to IRAs. 6) Calculations of replacement rates for older workers only due to the difficulties of projecting
contributions, leakages, and returns over many decades.
Plan Type
Percent of
Washington
Workers Aged
55-64 with This
Plan Type
Projected
Median
Annual
Income Stream
Projected
Median
Annual
Income
Replacement
Rate
None 41% $0 0%
DC only 42% $6,000 10%
DB only 6% $25,200 33%
DB & DC 11% $37,200 57%

Retirement Readiness 26
replacement outlook is likely to be insufficient for much of Washington’s population closest to retirement age. The outlook is better for the 6 percent of workers in this cohort with a DB plan; the income replacement rate is 33 percent at the median. And for the 11 percent with both plan types, the median income replacement rate is 57 percent – the best case scenario produced by this model. The type of retirement plans that result in the greatest income replacement rates – DB plans alone, or DB plans combined with DC plans – are scarcely available to today’s workers. Just 19 percent of younger Washington workers aged 25-44 with workplace coverage have access to a DB plan (including DBs combined with DCs), compared to 29 percent of workers aged 55-64.48 Further, plan participation rates differ by plan type; the previous section showed that DC take-up rates are under 70 percent, whereas DB plans are near 85 percent. Take-up rates are lower for younger workers, and so these figures degrade for younger cohorts of the workforce. Appendix D provides a detailed table with model estimates and findings.
Retirement Income Adequacy: Discussion
Generally, a retiree needs to be able to replace about 70-90 percent of annual pre-retirement income to maintain financial wellbeing into old age. The sequence of facts explored in this section tells a concerning, albeit incomplete, story that Washington workers are not adequately preparing for retirement. Two especially concerning factors surfaced. Mortgage Debt | Home ownership is an important form of wealth for retiring households, secondary to Social Security.49 The amount of mortgage debt remaining in retirement could force senior households to stretch their retirement income further, and be a lost opportunity to annuitize or draw down equity in order to have more income.50 Retirement Income from DC Plans | The majority of Washington’s current pre-retirement working population – 83 percent – have little to no expected retirement income from DC plans. The data in Table 5 (previous page) suggests further research is needed on total net worth, including liquid and other assets, in order to gain the full picture of what level of income Washington pre-retirees can expect. The data also points to questions about how well DC plans help workers prepare for retirement when compared to the past predictability and security inherent in DB plans.
48 SCEPA calculations for Washington workers based on CPS Annual Earning File 2013 and SIPP 2014. 49 Dushi, I., Friedberg, L., Webb, A. What is the Impact of Foreclosures on Retirement Security? Center for Retirement Research at Boston
College. November 2010. 50 ibid

Retirement Readiness 27
Financial Capability: Beliefs, Attitudes, and Practices
An array of factors hinder saving for retirement, from the lack of workplace-based retirement plans and fewer elders modeling good savings behaviors, to excessive consumerism and income volatility.
This section explores highly qualitative and variable beliefs, attitudes and practices as they relate to retirement savings behaviors of Washingtonians. Survey-based findings are used to identify barriers to saving for retirement, and to understand the importance of generational differences in abilities to build retirement wealth.
Before moving into an analysis of beliefs, attitudes, and practices about saving for retirement, a brief look is taken at the array of financial concerns aside from retirement faced by households.
Financial Concerns and Volatility
Financial Concerns | Finances are the number one worry of Americans, who often lack financial knowledge and role models. Sixty-five percent say that financial industry terminology is not user-friendly, and many feel that discussing personal finances is a social taboo. 51
51 Merrill Lynch Retirement Study, conducted in partnership with Age Wave. (2017). Finances in Retirement: New Challenges, New Solutions.
Figure 14: Concerns most frequently cited in open-ended questions on self-reported financial challenges (by family income), U.S., 2016
Source: Board of Governors of the Federal Reserve System. “Report on the
Economic Well-Being of U.S. Households in 2016”

Retirement Readiness 28
The types of financial concerns faced by households vary depending on socioeconomic status, as demonstrated in Figure 14, in which word clouds show the most frequently expressed concerns in the largest print. Families with incomes below $40,000 are most concerned with short-term expenses, such as paying rent and buying food. Health care is most common in the lower- and middle-income groups, while longer-term financial risks relating to retirement or education are most prevalent in the upper-income group.
The way that Washingtonians manage their finances indicates a lack of financial capability: In a 2015 study of financial capability, an estimated 15 percent of Washingtonians spend more than they earn and 41 percent broke even; so, fully 56 percent of residents were not able to save money. 52
In the same survey, 30 percent of Washingtonians reported using high-interest borrowing methods like payday loans, while 34 percent increased their borrowing costs by only paying minimums on credit cards during some months. Evidence of shortcomings in financial decision-making shows that 58 percent of Washingtonians do not compare offers or collect information from more than one company when shopping for credit cards.53
Volatility | In addition to low levels of financial capability, income and expense volatility make it more difficult for households to cover the full range of their financial needs.54
From 2013 to 2015, the median U.S. family saw a 29 percent change in total expenses from month to month, and almost four in 10 households had large medical, tax, or auto repair payments at some point within a 12-month period.55 A 2015 Pew Charitable Trust survey found that 60 percent of American households experienced a financial shock over the previous 12 months. Financial shocks are losses or expenses that are irregular, including from unanticipated reduction in pay or work hours, job loss, illness, injury, death, or a major home or vehicle repair.56
Forty-four percent of respondents to the 2015 Survey of Household Economics and Decision-making reported that paying for a hypothetical emergency expense of $400 would be challenging and they either could not pay the expense or would need to borrow or sell something.57
Out-of-pocket expenses for healthcare is a category of emergency expenses that concern many individuals.58 As of 2015, approximately 24 million Americans adults were carrying debt from
52 FINRA National Financial Capability Study. (2015). http://www.usfinancialcapability.org/results.php?region=WA 53 Ibid (FINRA) 54 See footnote 22 (Mitchell) 55 See footnote 22 (Mitchell) 56 The Pew Charitable Trusts. (October 2015). The Role of Emergency Savings in Family Financial Security. How Do Families Cope with Financial Shocks? http://www.pewtrusts.org/~/media/assets/2015/10/emergency-savings-report-1_artfinal.pdf?la=en 57 See footnote 10 (Fed Report) 58 Board of Governors of the Federal Reserve System. (May 2017). Report on the Economic Well-Being of U.S. Households in 2016. https://www.federalreserve.gov/publications/files/2016-report-economic-well-being-us-households-201705.pdf

Retirement Readiness 29
medical expenses incurred over the previous year. In the same year, an estimated 20 percent of Washingtonians reported carrying medical debt.59
The burden of financial anxiety and volatility substantially increase financial fragility in Washington households and cast a long shadow on hopes for financial security in old age.
Savings for Retirement: Practices, Beliefs, and Attitudes
A person’s level of financial knowledge affects his or her ability to save for retirement. The shift from DB to DC plans increasingly puts pressure on workers to take more actions to secure their own financial futures, while at the same time consumer financial products have become more sophisticated.60 The range of investment vehicles, tools, and choices is staggering for individuals and employers alike. Among Americans who are savings with self-directed retirement accounts, 53 percent reported that they are either not comfortable or only slightly comfortable in their ability to make the right investment decisions.61 Fifty-six percent have not tried to figure out how much money they need to save for retirement.62 In 2015, 63 percent of Washingtonians could not correctly answer three out of five financial knowledge questions about compound interest, inflation, and risk and diversification correctly.63
Indeed, the equation required for a person or household to get to the “right” financial situation by retirement combines the complexity of determining one’s income replacement requirements with real-time savings contribution amounts, investment decisions, returns on investments, inflation, income tax liabilities, life expectancy, and the annuitized value of earnings, assets, and savings minus debts.
In the summer of 2016, AARP-Washington surveyed 1,000 Washington adults about their beliefs, attitudes and practices related to saving for retirement.
More than half (55 percent) of respondents reported they are very or somewhat anxious about their retirement security, and this figure was about the same for each generation – Millennials (aged 18-34), Gen X (aged 35-50) and Boomers (aged 51-64).
The top reason Washingtonians reported to AARP that they aren’t saving adequately is due to current finances, but there are differences in financial stressors for each generation, illustrated in Table 6. Millennials cite a larger array of reasons at higher rates than the other generations.
59 FINRA National Financial Capability Study. (2015). http://www.usfinancialcapability.org/results.php?region=WA 60 See footnote 5 (Lusardi). 61 Board of Governors of the Federal Reserve System. (May 2017). Report on the Economic Well-Being of U.S. Households in 2016. https://www.federalreserve.gov/publications/files/2016-report-economic-well-being-us-households-201705.pdf 62 Georgetown University McCourt School of Public Policy Center for Retirement Initiatives. Fast Facts. What Does FINRA Tell Us About the Financial Capability of Americans in Retirement? 17-02. http://cri.georgetown.edu/wp-content/uploads/2017/05/Infographic_17-02.pdf 63 See footnote 58 (FINRA).

Retirement Readiness 30
Respondents to the AARP survey revealed paradoxical attitudes towards their retirement security.
While 55 percent said they’re anxious about retirement security, 77 percent of the same respondent group expressed that they are at least somewhat confident or extremely/very confident they will be able to retire and no longer work. This appears to be an aspirational goal: Among those who are confident they will retire say they will because they “Just want to stop working someday, so I will.” Other questionable reasons for confidence include the plan to start a business in order to get extra money (34 percent) and winning the lottery (9 percent).
The paradox in AARP’s findings extend into two other areas: First, despite high levels of anxiety about retirement and low savings balances, Washingtonians expect to retire young. The average age Millennials respondents think right for retirement was 62. For Gen Xers, it was 64 and age 65 for Boomers. Note that the age for full retirement benefits from Social Security is 67 and longevity gains expect the average American to live to 81 (men) and 87 (women) by 2040.
Table 6: Reasons for Not Saving More for Retirement by Generation, Washington, 2016
Source: AARP-Washington 2016 Survey: Ready or Not? Retirement Readiness among Washington State Adults Ages 18-64 in the
Workforce.
Reasons for Not Saving More for Retirement Millennial
(age 18-34)
Gen X
(age 35-50)
Boomer
(age 51-64)
I'm more concerned about my current finances that retirement 63% 55% 43%
I'm paying down debts 52% 53% 48%
I can't afford to save more 49% 53% 41%
I'm paying for education expenses 46% 35% 28%
I don't have specific retirement goals 45% 32% 27%
Retirement seems so far away -- I'll get to it later 40% 20% 15%
I spend too much money 35% 32% 26%
I had an unexpected medical expense for myself or a family member 24% 23% 30%
I have too much job uncertainty 22% 20% 20%
Something else 18% 20% 21%

Retirement Readiness 31
Second, respondents indicated that they expect most of their retirement income to come from personal savings and retirement plans (401k, IRA, etc.), yet three in five of these workers have never calculated how much money they’ll need to save for retirement!
FIGURE 15: Reasons Why People are Confident They Will Retire Among Those who are Extremely, Very, or Somewhat Confident, Washington, 2016
Source: AARP-Washington 2016 Survey: Ready or Not? Retirement Readiness among Washington State Adults Ages 18-64 in
the Workforce.
9%
15%
34%
36%
44%
44%
71%
72%
I will win the lot tery
I will inherit a large amount of money
I plan to start a business which
will give me extra money
I've already save much of
the money needed for retirement
I will get a job in the future
that has retirement benefits
I will invest in a company that
will have returns for my investment
Saving at my current rate will
save enough for retirement
Just want to stop working
someday, so I will

Retirement Readiness 32
Financial Capability: Discussion
Washingtonians clearly are overwhelmed by financial stressors and complexities – and their financial decision-making is hampered because of it.
When considering how to increase consumer financial wellbeing, the field of asset-building offers a helpful framework that models a progression from financial education – improving understanding – to financial literacy – using knowledge and skills – to financial capability – the ability to act on that knowledge combined with opportunities to act (Figure 16).
The preferred model for increasing financial capability is to integrate services into existing programs and places, such as in the workplace, community-based organizations, and human services agencies.64 The extent to which this level of integration is being implemented varies down to local and regional levels across the nation. As its definition states, in order to truly achieve financial capability, individuals need both the ability to act and opportunities to do so –meaning that financial capability requires access to real financial products and services. In other words, progress in this area requires a partnership between households and the financial services industry that serves them.
FIGURE 16: Components of Financial Capability
Source: Prosperity Now. A Federal Policy Blueprint to Close the Ever-growing Wealth Gap. September 2016.
64 See, for instance, Prosperity Now: Integrating Financial Capability (2017) and US Department of Health and Human Services (2015): Building Financial Capability: A Planning Guide for Integrated Services.

Retirement Readiness 33
Fiscal and Revenue Implications
Among the backdrop of complex conditions, Washington’s growing senior population, minimal levels of preretirement savings, poor financial capability, and deteriorating net assets could result in a substantial financial burden on Washington state taxpayers in the near future. A population inadequately prepared for retirement will increasingly rely on public assistance programs while experiencing a declining standard of living. After establishing population trends for Washington’s seniors, this section examines findings from recent studies of the fiscal impacts of retirement savings shortfalls and implications for states. Factors affecting the costs of Long-Term Services and Supports (LTSS) to Washington seniors are evaluated to provide a deeper exploration of potential fiscal impacts. Estimates from the section on retirement income adequacy are generalized in relation to program eligibility and the private cost of care in order to highlight the dual negative impacts of savings shortfalls: increased risk of declining standards of living for Washington’s seniors coupled with increased fiscal impacts on the state. The focus then shifts to tax revenue implications for the state. Post-retirement household spending patterns are explored in the context of Washington’s tax structure, which relies significantly on retail sales and use taxes. Two scenarios play out extreme examples of retirement savings shortfalls to illustrate revenue impacts. Factors outside the scope of this analysis that could shape future fiscal outcomes include:
Changes to Social Security Income (SSI) entitlement funding.65
Potential impacts to Medicaid and Medicare funding at the federal level.66
Increasing prices for healthcare and the consolidation of the healthcare market.67
Capability of younger generations to provide unpaid care services for aging populations.
68,69
65 AARP Public Policy Institute. (August 2013). Fact Sheet. Why Social Security and Medicare Are Vital to Older Americans in Washington. http://www.aarp.org/work/social-security/info-10-2011/Social-Security-Medicare-Importance-State-Profiles.html 66 Congressional Budget Office. (June 29, 2017). Longer-Term Effects of the Better Care Reconciliation Act of 2017 on Medicaid Spending. https://www.cbo.gov/publication/52859. Also see, Congressional Budget Office. (May 24, 2017). Cost Estimate. H.R. 1628 American Health Care Act of 2017. https://www.cbo.gov/system/files/115th-congress-2017-2018/costestimate/hr1628aspassed.pdf 67 Statement of Paul B. Ginsburg, Ph.D. Health Care Market Consolidations: Impacts on Costs, Quality and Access. California Legislature. Senate Committee on Health Informational Hearing. March 16, 2016. https://www.brookings.edu/wp-content/uploads/2016/07/Ginsburg-California-Senate-Health-Mar-16-1.pdf 68 Redfoot, D., Feinberg, L., Houser, A. (2013).The Aging of the Baby Boom and the Growing Care Gap: A Look at Future Declines in the Availability of Family Caregivers. AARP Public Policy Institute. http://www.aarp.org/home-family/caregiving/info-08-2013/the-aging-of-the-baby-boom-and-the-growing-care-gap-AARP-ppi-ltc.html. Also see; AARP Caregiving in the U.S. 2015. http://www.aarp.org/content/dam/aarp/ppi/2015/caregiving-in-the-united-states-2015-report-revised.pdf 69 Washington State Department of Social and Health Services Report to the Legislature. (January 2017). Feasibility Study of Policy Options to Finance Long-Term Services and Supports. ESSB 6052, Section 206(14)(a).

Retirement Readiness 34
Washington’s Aging Population
Over the next two decades, Washington’s senior population will grow dramatically, from just 15 percent of our population in 2016 to 22 percent by 2040.70 In real terms, the senior population will more than double by 2040, growing by over 900,000 as Baby Boomers reach retirement and grow into old age. The proportion of our most vulnerable seniors aged 85+ will surpass those in their mid- to late-60s by 2027. And the composition of our older population is aging, in that the oldest of the old will make up the majority of seniors by 2038.
70 Office of Financial Management Forecasting & Research Division. (February 2017). November 2016 Forecast of the State Population. http://www.ofm.wa.gov/pop/stfc/stfc2016/stfc_2016.pdf
FIGURE 17: Senior Population Projections, Ages 65-84 and 85+, Washington 2017-2040
Source: Washington Department of Commerce calculations from projected population figures published by the Office of Financial Management.
0
200,000
400,000
600,000
800,000
1,000,000
1,200,000
1,400,000
1,600,000
1,800,000
-10,000
0
10,000
20,000
30,000
40,000
50,000
60,000
2018 2023 2028 2033 2038
Annual Change inPopulation Aged 65-84
Total Population Aged65-84
0
50,000
100,000
150,000
200,000
250,000
300,000
350,000
400,000
450,000
0
5,000
10,000
15,000
20,000
25,000
2018 2023 2028 2033 2038
Annual Change inPopulation Aged 85+
Total Population aged 85+

Retirement Readiness 35
Washington’s aging population is economically concentrated in lower income brackets, with 54 percent falling below an annual income of $50,000 (Figure 18).
Recent Fiscal Impact Studies for the U.S. and States
Modeling the complexities of retirement income inadequacies’ impacts on Washington’s public assistance programs is beyond the scope and resources of this study. Fortunately, there exists a set of findings from a recent group of studies that can be drawn upon to understand how Washington may be impacted. Washington-AARP Analysis | An analysis conducted by AARP showed Washington would save a total of $298 million from 2018 through 2032 on state-funded public assistance programs for seniors aged 65+ if the lowest two income quintiles of retirees had saved enough to increase their annual retirement income by $1,000. When federal savings are combined with state savings for the same period, the total savings to Washington would be $1.03 billion.71 Using national background figures from the same analysis to provide context, an additional $1,000 in retirement income would translate to an average annual income gain of 20 percent for the lowest quintile and 7 percent for the second quintile of the post-retirement senior population.72 This model illustrated the extent to which increases in retirement income result in reductions in public assistance for different income levels:
Public assistance falls by 22 cents for each additional dollar of retirement income over
the first income quintile.
16 cents per dollar over the second income quintile.
3 cents per dollar over the middle-income quintile.
1 cent per dollar for the fourth income quintile.
Zero over the top quintile.73
71 Shiflett, William and Catherine Harvey. (May 2017). Fact Sheet: Washington Could Save $298 Million by Helping People Save for their Own Retirement. AARP Public Policy Institute 72 Trostsel, Phillip. (February 2017). The Fiscal Implications of Inadequate Retirement Savings in Maine. The University of Maine Margaret Chase Smith Policy Center. 73 Ibid (Trostel).
FIGURE 18: Income Distribution Aged 65+ by, Washington 2016
Source: SCEPA calculations using 2014-16 Current Population Survey March Supplement 2014-16.
29%
25%
17%
10%
18%
0%
5%
10%
15%
20%
25%
30%
35%
0
50,000
100,000
150,000
200,000
250,000
300,000
350,000
Up to$24,999
$25,000-49,999
$50,000-75,999
$75,000-99,999
$100,000+
Population Aged 65+
Percent of age 65+

Retirement Readiness 36
Washington-Segal Consulting Analysis | A narrowly-construed actuarial model constructed by Segal Consulting estimates potential state savings in Medicaid spending for workers if not currently covered by a retirement plan began saving in one. Their model showed that, if non-covered workers began participating in a retirement savings plan, 849 senior households in Washington would no longer rely on Medicaid over a five-year period, translating to a total savings of $8.9 million to the state.74 When run over a 10-year period, the same model estimates Washington’s state Medicaid expenditures would be reduced by a total of $58.6 million (2016 total present value). This study confirmed a positive correlation between increased retirement savings and a reduction in state Medicaid spending by way of low-income retirees gaining enough income from savings to remove them from the poverty rolls. Although savings are expressed as a number of senior households not relying on Medicaid for a specified five-year period, this doesn’t mean those households will never access Medicaid; rather, it means they will delay accessing Medicaid until an older age. North Carolina | A study of North Carolina’s aging population found that increasing the savings rate of its low- and middle-income pre-retirement population to 3 percent could result in a total savings of $448 million in state expenditures between 2018 and 2030, a savings of 8.25 percent of Medicaid spend on residents reaching age 65 during that time period.75 The impacts estimated for North Carolina were most pronounced for lower-middle income cohorts. By increasing this group’s savings rate, program participation rates would drop. Effects of increasing savings from 0 to 3 percent on the lowest-income cohorts of pre-retirees did not yield sufficiently large enough retirement income gains to meaningfully reduce costs to the state through program eligibility reductions alone. Utah | An analysis of the effect of individual retirement savings adequacy on direct expenditures for select Utah programs found that a 10 percent increase in net worth of the least-prepared third of Utahans turning 65 will save the state $194 million between 2016 and 2030 from a total cost of $3.7 billion.76 Fully 73 percent of these total public expenditures ($3.7 billion) are projected to accrue to the lowest-income third of the retiring population. The Utah study also found that, if no action is taken, 18 percent of new retirees during this time will retire with more debt than savings.
74 Segal Consulting. (April 2016). Estimated Offset Medicaid Cost Based on Increased Retirement Savings. Memorandum to Sarah Gill Dated April 29, 2016. 75 Galbraith, Craig S. (December 2016). Fiscal Benefits of Increasing the Savings Rates of North Carolina’s Aging Population. University of North Carolina Wilmington. 76 Goodliffe, Jay et al. (January 2015). The Cost of Retiring Poor: Cost to Taxpayers of Utahans Retiring Poor. Notalys, LLC.

Retirement Readiness 37
The study concludes that taking measures to increase savings rates among the lowest income near-retirees will result in the largest cost savings to the government; however, it stops short of testing and advancing recommendations on what those savings rates should be to return the best impact.
Long-Term Services and Supports
Washingtonians will be living longer, relying on inadequate retirement incomes, while enduring marked increases in cognitive issues. Either residents will increasingly rely on public assistance programs for their long-term needs while drastically reducing their standards of living, or they’ll need innovative ways to contribute to the costs of support services without becoming impoverished. Much work has recently been done in Washington about the costs of Long Term Support Services (LTSS).77 This section looks at elements of that work in order to magnify a tangible example of the dual negative impacts of savings shortfalls: Increased risk of declining standards of living for Washington’s seniors coupled with increased fiscal impacts to the state. LTSS Overview | LTSS provide personal care assistance to those who need help completing daily-living tasks due to aging, chronic illness, cognitive functioning, or disability. LTSS clients receive services in different settings, such as assisted living facilities, adult family homes, skilled nursing facilities, retirement communities, and in a person’s home.78 The cost of care is higher or lower depending upon the setting and the level of care needed. The state’s Medicaid-funded LTSS client population is forecast to increase by 91 percent (70,000 clients) by 2040, with the highest increase for those aged 85 and older.79 Costs of Care, Income and Asset Limits | Program innovations have led to sustained increases in Home and Community-Based Services (HCBS, includes both in-home and residential care) thereby significantly reducing state costs to provide care to seniors.80 The average total cost in 2016 for in-home care was $23,942; residential care $21,258; and $54,239 for nursing facilities.81 By contrast, very few seniors are able to afford the private cost of care for a private room in a secured nursing facility at $107,675 per year. For those seniors who can be in an assisted living
77 See the work products of the Washington Joint Legislative Executive Committee on Aging and Disability: http://leg.wa.gov/JointCommittees/ADJLEC/Pages/default.aspx. 78 ibid 79 Washington State Department of Social and Health Services. Report to the Legislature: Feasibility Study of Policy Options to Finance Long-Term Services and Supports. ESSB 6052, Section 206(14)(a). January 2017. 80 Washington State Department of Social and Health Services. Research and Data Analysis Division. PowerPoint Presentation re: LTSS Rebalancing: Estimated Savings Achieved by ALTSA from SFY 2000-2018. February 2017. 81 Washington State Department Social and Health Services. Aging and Long-Term Support Administration Long Term Care (LTC) EMIS
Report. July 1981 through June 2017. Received via email correspondence dated June 12, 2017.

Retirement Readiness 38
facility, the private cost is much lower at $54,000 per year; and for those who are able to remain in their homes, the annual private cost is $46,500 for a high level of care. There are income and asset limits in place to qualify for Medicaid-funded LTSS. All states allow households to spend down assets to qualify for services. Individuals cannot have more than $2,000 in assets to qualify for Medicaid-LTSS.82 Approximately 11 percent of Washingtonians who apply for Medicaid-funded LTSS must first spend down their assets to qualify for services.83 Separately, if income levels are too high to qualify for services after meeting asset requirements, medically needy individuals may spend down income by incurring qualified expenses.84 Anecdotally, individuals who spend down their income are generally in nursing home facilities and can afford the total cost of care at the public rate, but not the private rate.85 Because Home and Community-Based Services (HCBS) is less costly to deliver, income eligibility parameters are higher, up to $6,841 per month for an individual, based upon the Federal Benefit Rate (FBR) and monthly average state nursing facility rate changes.86 There are financial advantages for seniors who remain in their homes while receiving Medicaid-funded LTSS. Individuals can keep $1,005 per month of their income for personal needs, compared to just $62.79 per month in assisted living facilities. Married couples where the spouse is not receiving HCBS can keep $735 per month; if both spouses are receiving services, each person can keep $1,005 for a total of $2,010. Family caregivers provide the majority of LTSS to seniors, estimated at 80 percent of LTSS, or $10.7 billion annually.87 The ability of younger generations to provide this same level of care to their aging family members has changed. The ratio of caregivers to persons at high risk, or 80+ years of age, is expected to decline as the baby boomer generation transitions away from caregiving into their own old age. AARP reported that in 2010 that ratio was seven to one. By 2030, the ratio is projected to decline to four to one.88 LTSS Funding Sources | Medicaid is the primary funding source for all LTSS, covering 60 percent of the state’s nursing home residents.89 In 2011, approximately 62 percent of Medicaid and state-funded LTSS spending was for Home & Community Based Services (HCBS).90 As of 2017,
82 Reinhard, S., Kassner, E. Houser, A. et al. AARP. Raising Expectations. A State Scorecard on Long-Term Services and Supports for Older Adults, People with Physcial Disabilities, and Family Caregivers. 2014. http://www.aarp.org/content/dam/aarp/research/public_policy_institute/ltc/2014/raising-expectations-2014-AARP-ppi-ltc.pdf 83 See footnote 78 (ALTSA Feasibility) 84 Email correspondence between Washington State Department of Commerce staff and Acting Chief of LTC Financial Eligibility & Policy at DSHS dated May 25, 2017. 85 Ibid (Correspondence) 86 Ibid (Correspondence) 87 See footnote 78 (ALTSA feasibility) 88 See footnote 67 (Redfoot) 89 The Joint Legislative Executive Committee on Aging and Disability Issues 2016 Final Report. December 2016. https://app.leg.wa.gov/ReportsToTheLegislature/Home/GetPDF?fileName=2016%20Final%20Report%20Aging%20%20Disability%20JLEC_2ce27c42-dbc5-40ec-96be-119cf9dbbda7.pdf 90 See footnote 81 (Reinhard et al).

Retirement Readiness 39
that figure has increased to 65 percent with Washington ranking first in the nation for its LTSS performance.91 Other sources of funding for LTSS can include private insurance, and individual sources of income or wealth, such as pensions, earnings, or savings. As of 2015, 71 people out of 1,000 –7 percent – aged 40 and older in Washington state had a Long-Term Care insurance policy.92 Medicare also covers everyone age 65 and older; however, Medicare coverage is limited by caps on the number of days covered for nursing home visits, and it excludes long-term care costs.93 For Medicare Part B, generally 20 percent of expenses are the patient’s responsibility.94 Medicare premiums are rising faster than benefit levels, resulting in an increase from 5.4 percent of the average Social Security benefit for a person who retired in 1990, to 10.4 percent for a person who retires in 2030.95 LTSS Fiscal Impact Considerations | The proportion of Washington’s future senior population that qualify for LTSS services reflect two possible retirement preparedness outcomes.
First, there will be those seniors who have earned significantly less income over the course of their working years, who have been unable to access, afford, or maintain financial assets offered in the workplace or the marketplace. These individuals are not prepared for retirement because they have been unable to earn enough income to afford basic living expenses or to save enough pre-retirement income to raise their standard of living in retirement so that basic living expenses are affordable.
Second, there are those seniors who have earned enough income to be able to afford the cost of living, and to save for retirement, but are unable to afford increases in cost of living and rising healthcare expenses, and so must lower their standard of living in retirement to access needed services.
Importantly, this discussion differentiates the proportion of the aging population who already meet program eligibility requirements for Medicaid-funded LTSS, from those in the highest income brackets. This is to distinguish the percentage of retirees who are income and asset poor from those who have high incomes but whose retirement savings is inadequate to cover private cost of long-term care. As evidenced in the aging of the senior population, it’s expected that LTSS caseload will reflect increases in our oldest senior population who are experiencing increasing rates of Alzheimer’s
91 ibid (Reinhard et al). 92 AARP. (2017) Long-Term Services & Supports State Scorecard, Washington: http://www.longtermscorecard.org/databystate/state?state=WA 93 Banerjee, S. (February 2012).Expenditure Patterns of Older Americans, 2001-2009. Employee Benefit Research Institute. No. 368. https://www.ebri.org/pdf/briefspdf/EBRI_IB_02-2012_No368_ExpPttns.pdf 94 Ibid (Banerjee) 95 See footnote 11 (Munnell).

Retirement Readiness 40
Dementia (AD).96 Given increasing rates of AD, and high costs for private nursing facilities, an important cost consideration for the state will be increasing demand for nursing home placements relative to increasing incidents in clients with dementia and serious cognitive difficulties. It is also possible that higher income seniors with functional limitations that prevent them from receiving care in their homes are likely to substantially spenddown their retirement income and degrade their living standards in order to access services.
State Revenue Implications
Changing Spending Patterns | Because of Washington’s reliance on revenues from retail sales and use taxes, a discussion about the revenue implications of retirement savings adequacy needs first to consider consumer patterns after retirement. Is spending significantly different after retirement? Total spending in retirement generally declines with age, as shown in Figure 19.97 Older populations spend less on certain items like transportation, and more on healthcare expenses.98 Retired persons also do not pay FICA taxes, or incur work-related expenses.99 Nationally, home and home-related expenses is the single largest spending category for seniors in every age group.100 Health-related expenses steadily increase with age, and is the second-largest spending category for seniors aged 75 and older.101 Spending on durable goods, such as dishwashers, computers, and refrigerators, constitutes a very small portion of total spending overall.102 The basic assumption that senior households intentionally decrease their spending based on how their needs change over time, however, has been challenged in an array of recent
96 Mancuso, D., Sharkova, I. Projections of Alzheimer’s Dementia in Washington State. Washington State of Department of Social and Health Services. November 2014. 97 Banerjee, S. (November 2015). Change in Household Spending After Retirement: Results from a Longitudinal Sample. Employee Benefit Research Institute. No. 420. https://www.ebri.org/pdf/briefspdf/EBRI_IB_420.Nov15.HH-Exp.pdf 98 Banerjee, S. (September 2014). How Does Household Expenditures Change With Age for Older Americans? Employee Benefit Research Institute. Vol. 35, No. 9. https://www.ebri.org/pdf/notespdf/EBRI_Notes_09_Sept-14_OldrAms-WBS.pdf 99 See footnote 92 (Banerjee No. 368). 100 See footnote 97 (Banerjee 2014). 101 ibid 102 See footnote 96 (Banerjee 2015).
FIGURE 19: Change in Household Spending After Retirement, 2013 Dollars
Source: Employee Benefit Research Institute estimates from the Health and Retirement Study
(HRS) and the Consumption Activities and Mail Survey (CAMS), 2005-2013.
$46,452 $43,901
$40,651 $39,888
78%73% 71%
0%
25%
50%
75%
100%
$0
$10,000
$20,000
$30,000
$40,000
$50,000
$60,000
Preretirement After 1-2 Years After 3-4 Years After 5-6 Years
Median Household Spending % of Preretirement Spending

Retirement Readiness 41
studies.103 The Employee Benefit Research Institute, for instance, found a prevalence of involuntary spending adjustments – that is, declining consumption by the senior population, due to lack of funds.104 Seniors saved money by skipping or postponing doctor appointments, delayed paying monthly bills, and substituted prescription drugs with generics. These involuntary savings practices were most prevalent among single women, and more prevalent among Blacks than Whites.105 Importantly, the trend in declining consumption post-retirement does not hold true for all households. In fact, a high percentage of households experience higher spending following retirement. And, households that spend more after retirement are spread across the entire income distribution, meaning that this additional spending is not strictly a function of income.106 There are numerous explanations for why some households spend more after retirement; one could be increased living costs. Seventy-two percent of respondents from the 2009 Internet Survey of the Health and Retirement Study reported increased household spending needs as the most important cause of rising expenses, e.g., medication, food, gas, and utilities.107 Tax Revenue Scenarios | In 2014, senior households represented 24 percent of all households in Washington from which taxes were collected, and collectively paid 25 percent of all major state and local taxes in that year.108 While higher earning households contribute more in total tax dollars, lower income households pay a higher percentage of their income in taxes than do higher earning households. This holds true for Washington’s senior households: In 2014, households aged 65 and older with income under $10,000 a year encountered a state and local tax liability of 40.6 percent and paid an estimated at $89 million in taxes receipts. The highest income senior households – with incomes over $149,999 paid 5.7 percent of their income to taxes for a total of $637 million.109 It is a substantial undertaking, well beyond the reach of this study, to create an econometric model that validly estimates the fiscal and economic impacts of retirement savings shortfalls. However, there is value in exploring the implications though a simplified set of illustrations. To do so, consider placing all senior households into two income groups and use $50,000 as the annual income threshold to differentiate the groups:
103 See, for instance, Munnell, A., Rutledge, M., Webb, A. Are Retirees Falling Short? Reconciling the Conflicting Evidence. Center for Retirement Research at Boston College. November 2014. 104 See footnote 92 (Banerjee 368). 105 ibid 106 See footnote 96 (Banerjee 2015). 107 See footnote 92 (Banerjee 368) 108 Washington Department of Revenue. 2014 Washington State Households With at Least One Person 65+ Years Old. Table created by DOR for this study. 109 See footnote 107. Washington State Department of Commerce calculations on DOR data.

Retirement Readiness 42
In 2014, those with retirement incomes under $50,000 paid 9 percent of Washington’s
total tax receipts, while those in the higher income group paid 16 percent.
Fifty-four percent Washington’s of senior households fell into the lower income group,
while 46 percent fell into the higher ($50,000+).
Based on the projected retirement income in Table 5 (page 25), the majority of new retirees would be expected to fall into the lower income group – under $50,000, even after income from other sources is added. Using 2014 state tax receipts from households with at least one person aged 65+, holding tax rates constant, and increasing the count of senior households by rates published in state population forecasts, two revenue scenarios are presented in order to illustrate the implications of having a substantial portion of our senior population at the lower end of the income distribution.110 Baseline | After accounting for the increase in senior households from 2014 to 2017, senior households would collectively pay an estimated $4.1 billion in major state and local taxes in 2017. Current Revenue Scenario | For illustrative purposes, assume that 89 percent of new retirees will fall into the lower of the two income groups, while 11 percent fall into the higher group (Figure 20). These proportions are from Table 5 in which 11 percent of Washington’s preretirement population held a projected income replacement rate most likely to reach the threshold of $50,000 when combined with Social Security and other income sources. In this scenario, 2017 revenue collections would fall by $41.6 million. Future Revenue Scenario | For this scenario, the same analysis is applied to the year 2027, when senior households would represent 30 percent of Washington households. Holding all other factors from the 2017 baseline (above) constant, estimated tax receipts from senior households would be $5.1 billion for the year 2027. Then, applying the retirement savings shortfall assumption that most households will fall into the lower income group beginning in 2017, annual tax receipts from senior households would be $4.7 billion in 2027, $400 million below what the straight-line interpolation from the 2017 baseline would have yielded in 2027.
110 Each revenue scenario adjusts the proportion of households with at least one person aged 65 or older to total Washington households by an annual 0.5 percent increase through 2021, and a 0.4 percent annually from 2022 to 2027 based projections provided by the Washington Office of Financial Management. Projected senior household growth is distributed according to the 2016 income distribution of Washington seniors in the Current Population Survey cited elsewhere in this report.
FIGURE 20: Distribution of New Senior Households by Income Level for Revenue Scenarios

Retirement Readiness 43
Fiscal and Revenue Implications: Discussion
The review of current thinking about fiscal impacts, a deeper examination of LTSS, and a simple illustration of tax revenue impacts of an increasingly low-income senior population brings up three areas for reducing the potential impacts to the state of retirement savings inadequacies. 1. Increasing preretirement savings through workplace-based plans like 401ks and payroll
deduction IRAs, especially for Washington’s lower- and middle-income wage earners.111
2. Enable lower- and middle-income individuals to contribute toward the cost of LTSS without
impoverishing themselves.
3. Stabilize asset value and bolster accumulation, especially at lower- and middle-income
levels.
Increase Retirement Income from Workplace-Based Plans | What is required for Washington’s lowest-income retirees to increase their income by $1000 a year is a complex equation to solve. That said, the basic conditions and requirements to reach this level of impact would include:
1. Availability: More access to retirement saving vehicles in the workplace (i.e., increased
coverage).
2. Increased participation rates for those covered – best achieved through automatic
enrollment.
3. Optimize contributions and returns by using features like a default investment rate of 3
to 5 percent, minimizing the number of investment fund choices, and automatically
escalating contribution rates over time.112
Help Individuals Contribute to LTSS Costs without Becoming Impoverished | Seniors that are unable to afford the private cost of care after paying for basic living expenses are at greater financial risk to spend down their assets in order to qualify for needed medical services. ESSB 6052 Sec. 206(14)(a)(2015) directed the Washington Department of Social and Health Services to procure an independent study of public and private options for leveraging private resources to help individuals prepare for LTSS needs. The study, produced by Milliman and Associates, modelled two options:
1. A public long-term care benefits for workers funded through payroll deduction that
would provide a time-limited long-term care insurance benefit.
111 See, for instance, Zurlow, Karen A et al (2016). Retiring Poor in New Jersey: The Projected Expenditures of Government Programs for Older Adults. 112 See, for instance, Benartzi, Shlomo and Richard H Thaler. (March 2013). Behavioral Economics and the Retirement Savings Crisis. Science, vol. 339.

Retirement Readiness 44
2. A public-private reinsurance or risk-sharing model to provide a stable and ongoing
source of reimbursement to insurers for a portion of LTSS losses in order to provide
additional insurance capacity to the state.
The study found potential for costs savings to the Medicaid program through option 1, the payroll-deduction long-term care insurance benefit, if it’s designed as the first payer of LTSS.113 Stabilize Asset Value and Bolster Asset Accumulation | Given the severe downward trends in net assets, substantial asset building initiatives for lower-income households would be necessary in order to simply maintain the current fiscal impacts of retirement income inadequacy. Washington currently provides limited state support to one statewide and 14 local asset building coalitions to conduct these initiatives, currently at a total of $234,000 per year for the entire program. What is required in order to reverse the trends, thereby lowering fiscal impacts, is a much more difficult question to answer, and likely beyond the reach of a single state government to impact alone. It deals with the nationwide trend of widening income and wealth disparities that began in the late 1970s and appears to be deepening.
113 Washington State Department of Social and Health Services Report to the Legislature. (January 2017). Feasibility Study of Policy Options to Finance Long-Term Services and Supports. ESSB 6052, Section 206(14)(a).

Retirement Readiness 45
Policy Discussion
Washington’s working population is underpreparing for retirement. Among the concerning issues identified in this study are:
Over 60 percent of the workforce does not have access to a retirement savings plan at
work.
Significant drops in workplace coverage since the Great Recession.
Stagnant participation in workplace retirement savings plans.
Low levels of retirement savings in Defined Benefit and Defined Contribution plans.
A disconnect between confidence in being able to retire with a good nest egg and the
ability to actually get there.
A population that’s prepared for retirement will have retirement income sufficient to maintain standards of living enjoyed before retirement while obtaining the necessary medical and supportive services without becoming impoverished. Success will require working Washingtonians at all income levels to save a greater portion of their current earnings into retirement savings vehicles. Success will also require that all working adults establish and maintain short-term emergency savings sufficient to smooth over rough patches in both earnings and expenses without raiding their retirement accounts. For the vast majority of the state’s population to secure both their short- and long-term financial circumstances, real gains must be made in their financial literacy and access to financial tools. Washington isn’t alone in this looming crisis. The national picture is much the same. The locus for action rests not on households alone, but must be shared by state and the federal governments, the financial services, banking and insurance sectors, and non-governmental organizations. Based on the findings of this study, policy considerations sort into four major groups:
1. Increasing retirement plan access and participation.
2. Increasing financial capability.
3. Smoothing financial volatility.
4. Addressing elements of life after retirement.
Increasing Retirement Plan Access and Participation
The most substantial opportunity to increase Washington’s retirement preparation is to increase access to and participation in workplace-based retirement savings plans. A number of states and major cities are implementing policies to do this. Four major policy models are

Retirement Readiness 46
evolving: Marketplace, Prototype Plan, State Multiple Employer Plan, and Auto-IRA (aka, Secure Choice). Washington’s Small Business Retirement Marketplace | Of the nine states with such laws on the books, Washington is one of two states using the Marketplace model (New Jersey is the second, but implementation there hasn’t begun), creating an online portal where employers and individuals can comparison shop for state-verified, low-cost plans. The value of this model is its partnership between the state and the financial services industry. The state’s role to verify providers and plans according to certain blue sky and statutory criteria, and to provide a single website where many plans can be compared by consumers and where financial education materials are offered to consumers. Financial services firms provide low-cost, easy-to-use retirement plans. Washington’s Retirement Marketplace was established in 2015 by ESSB 5826. Full implementation is pending the requirement to have two state-verified plans carried on the Marketplace. Pricing and other administrative hurdles have caused fewer plans than anticipated to enter the verification process and kept others away. The U.S. Treasury’s cessation of the myRA retirement savings program in August 2017, originally a required plan on the Retirement Marketplace, further delayed the launch of the Marketplace. More time is required to allow the Retirement Marketplace to launch and be evaluated for impacts on Washington’s retirement preparedness. The Retirement Marketplace offers resource and referral services to help employers and workers find low-cost retirement plans. Its use and enrollment in any plan it carries is voluntary for both employers and workers. When compared to the requirements that behavioral finance experts say will have the most impact on retirement savings, the Marketplace model falls short in the areas of requiring employers to offer a retirement benefit, automatic enrollment (where workers are automatically enrolled by their employers; they can opt-out if they want), and establishing default contribution rates and investment funds. Thought leaders are advancing the idea that a Marketplace should be conceived as a component of a broader state retirement security policy rather than a stand-alone policy. For instance, Vermont’s newly passed state-sponsored Multiple Employer Plan (MEP) includes a requirement that a marketplace platform be provided a year after the MEP launches. This is so that employers that are interested in offering a plan but either don’t qualify for the state MEP or wish to adopt another plan can find an affordable plan with assistance from the state. Given Washington’s progress on implementing the Retirement Marketplace, other policy opportunities that could be further evaluated include the following.
1. Developing a Retirement Marketplace Consortium: It may be that Washington alone, with its 2 million unserved workers, doesn’t possess the scale required for a retirement
Retirement Readiness 47
plan to be customized to meet the fee limits and other requirements set forth in statute. In order to gain scale necessary, Washington could develop a marketplace consortium with other states. The state has already developed a robust web-based platform that could be adopted by other states as a component of their own retirement security initiatives.
2. Incorporating a publicly-sponsored plan into the Retirement Marketplace: The demise
of U.S. Treasury’s no-cost myRA plan left Washington’s Marketplace without a basic, no frills plan. Policymakers may wish to explore the possibilities of incorporating a plan either sponsored or procured by the state. Such a plan, for example, could use Washington State Investment Board funds to achieve low costs and simplicity. Or, the state could explore adopting another state’s auto-IRA plan as an offering on the Retirement Marketplace, in a fashion similar to how some states are collaborating on 529 college savings plans.
3. Studying the feasibility of an Auto-IRA policy: The auto-IRA policy includes a
requirement that employers of a certain size or tenure must provide a retirement savings plan to employees, coupled with a state-sponsored or state-procured payroll deduction IRA. This approach lends itself to the automation features promulgated in the behavioral finance literature –auto-enrollment, auto-contribution rates, auto-escalation, and default fund choice. However, past proposals for such a policy in Washington were not successful.
Increasing Financial Capability
Washington’s working age population needs more financial capability in order to achieve retirement security. Policy opportunities in this area that could be further developed include the following.
1. Developing a coordinated financial capability strategy that reaches all Washington
residents throughout their working lives. The findings in this study suggest that embedding financial capability resources in the workplace and at key points of transition for participants in the workforce development system will be especially important to meeting retirement savings goals. To achieve a high level of financial capability, Washington will need concerted coordination among providers.114
2. Increase resources for financial coaching and asset building. Resources are needed to provide an array of services so that Washingtonians gain more access to mainstream banking and other financial products, increase home ownership and home equity, and
114 See, for instance, Empowering Oregonians through Financial Literacy, a proposal
http://www.oregon.gov/treasury/ORSP/Documents/Recommendations%20for%20Improving%20Financial%20Literacy%20-
%2010172016%20(clean).pdf

Retirement Readiness 48
build household resiliency to financial volatility. Washington currently provides limited state support to one statewide and 14 local asset-building coalitions, currently at a total of $234,000 per year for the entire program. State support for professional staffing of the Bank On Washington program was discontinued in FY 2017. Further study could examine the extent to which new or expanded asset building and financial access initiatives could directly improve the financial capability and asset accumulation of Washington’s low- and moderate-income workers.
Smoothing Financial Volatility
Saving for retirement cannot be done in a vacuum; short-term financial security must be established so that people have the capacity to save for the long run. Policy opportunities in this area include the following.
1. Linking short-term savings vehicles to retirement savings accounts is a financial innovation that could help households cope with financial shocks without raiding retirement savings accounts. This approach may also create more direct pathways for low- and moderate-income households to fortify emergency savings accounts and begin saving for retirement in a direct, sequential way. This is the “side-car savings” proposal recently advanced by The Aspen Institute.115 In order to implement this concept, new structures and products must first be developed, likely at the national level but possibly at the state level.
2. Innovations in portability of retirement savings accounts could help reduce retirement plan cash outs when workers change jobs. A clearinghouse could automatically roll over a participant’s retirement plan balance to a new employer at each job transition. This concept has been recommended at the national level by private sector proponents and the Bipartisan Policy Center’s Commission on Retirement Security and Personal Savings, yet no legislative proposals have advanced to date.
Addressing Elements of Life After Retirement
Washingtonians need to adjust their retirement plans to accommodate longer life expectancy. This will include decisions about how long individuals and households should expect their retirement income to last, timing their final separation from employment, and at what age to claim Social Security retirement benefits. Spouses who live longer may be able to care for each other longer, or there could also be an increased demand for assisted residential living arrangements for couples.116
115 See, for instance, Driving Retirement Innovation: Can Sidecar Accounts Meet Consumers’ Short- and Long-Term Financial Needs? https://www.aspeninstitute.org/publications/driving-retirement-innovation-can-sidecar-accounts-meet-consumers-short-long-term-financial-needs/ 116 Ortman, J., Velkoff, V., Hogan, H. (May 2014) An Aging Nation: The Older Population in the United States. United States Census Bureau. P25-1140. https://www.census.gov/content/dam/Census/library/publications/2014/demo/p25-1140.pdf

Retirement Readiness 49
Washington has already implemented innovations in Home and Community-Based Services and a number of other measures to increase access to Long Term Services and Supports without seniors becoming impoverished. Further work in addressing elements of life after retirement could focus on the following. Diminishing Assets and Maximizing Social Security: State retirement security initiatives focus on enabling working people to accumulate savings in tax-preferred Defined Contribution (DC) vehicles. Assuming the vast majority of savers will continue to use DC plans rather than Defined Benefit plans, the challenge of retirement security, doesn’t end on the first day of retirement. Even the best-prepared retiree will need help navigating the complexities of converting their savings and assets into an income stream. For lesser-prepared retirees, careful savings draw-down strategies are critical to any chance of maintaining a comfortable standard of living; missteps can be devastating. The stakes are likewise high when it comes to deciding when to begin claiming Social Security benefits, where delaying up to age 70 can reap substantially increased monthly benefits. With the help of state retirement security initiatives like Washington’s Retirement Marketplace, late-to-start savers may be able to accumulate enough in a DC plan to bridge the gap between retirement and a delayed Social Security claim. Given the stakes and complexities at hand, more work is needed in order to determine the right role of Washington state government in addressing the population’s needs related to diminishment of assets and timing of Social Security claims. Long-Term Care Insurance Benefit: A study produced by Milliman and Associates for Washington’s Department of Social and Health Services found potential for delaying the need for Medicaid-funded services through a public long-term care benefits program for workers funded through payroll deduction that would provide a time-limited long-term care insurance. This policy proposal is expected to be further explored in the 2018 legislative session.

Retirement Readiness 50
Appendix A: Methodology
Retirement Income, Plan Coverage and Participation
Retirement income is estimated using two public surveys:
Current Population Survey (CPS) conducted jointly by the US Census Bureau and the
Bureau of Labor Statistics.
Survey of Income and Program Participation (SIPP) conducted by the Census Bureau.
Analysis of SIPP and CPS data was conducted by the Schwartz Center for Economic Policy Analysis (SCEPA) at The New School, and the Center for Retirement Research at Boston College. CPS is updated monthly and is the primary source of labor force statistics for the population of the United States. In this study, CPS is used to provide current earnings and key demographics of covered and uncovered workers, and participation rates, but not by plan type. Analysis of CPS data on employer plan sponsorship and employee participation rates provided by SCEPA and the Center for Retirement Research at Boston College is included to inform the discussion of Washingtonians’ access to retirement savings plans by metropolitan region, age, and type of employment. SIPP collects income and participation data for many topics including economic well-being, educations, assets, and health insurance. This study uses SIPP income and asset data by plan type across various socioeconomic characteristics to study the state of retirement savings for Washingtonians. The latest release of SIPP data for 2014 does not include participation and eligibility data as it has in former years; however, it is possible to identify defined benefit participants and those with non-zero 401(k) balances. Additional participation and eligibility data will be released separately, likely in late summer 2017, as part of the Social Security Administration (SSA) Supplement.117
Geographic Limitations
Smaller regional breakouts, such as by county, result in large margins of error and inaccurate estimates. For this reason, we do not attempt to provide a regional or local analysis other than by metro area. A high-level regional analysis of plan coverage is possible using CPS based on six metropolitan areas.
117 Email correspondence dated May 1, 2017 between U.S. Census and Washington State Department of Commerce staff.

Retirement Readiness 51
The 2014 SIPP sample size for Washington State is too small to draw statistically valid inferences. For this reason, data obtained from Washington CPS respondents are used for a state-level analysis. Findings on the retirement preparedness of Washingtonians are provided using SCEPA’s analysis of SIPP, which examines socioeconomic predictors of retirement wealth at the national level. Again, given the small sample size for Washington State in the SIPP panel, CPS is used to determine how the Washington workforce differs from national averages across predictive characteristics. The SIPP retirement wealth data is then imputed, or distributed across Washington CPS respondents.
Income Replacement Rates
To estimate the percentage of Washington households that are least likely to have adequate retirement income, this study examines income replacement rates by plan type, using data from the Survey of Income and Program Participation for pre-retirees ages 55-64 as provided by the Schwartz Center for Economic Policy Analysis. . The income replacement rate is also used to calculate an estimated monthly income. While other factors, such as race and gender, impact retirement outcomes e.g., asset ownership and lifespan, it is not practical to provide an income replacement rate calculation for all socioeconomic factors. Income replacement values calculated by plan type illustrate savings shortfalls, but cannot provide a present value of savings shortfalls. Despite this shortcoming, the value in taking this approach is that the analysis can be replicated both for other states and for Washington over time.

Retirement Readiness 52
Appendix B: Workplace-Based Retirement Savings Plans: Washington Covered and Uncovered Workers
Table 1. Key Demographics of Covered and Uncovered Workers, 2014
Covered by a plan Not covered by a plan
Characteristic Number Share Number Share
Total 1,294,214 100% 2,010,926 100%
Gender Male 673,129 52.0% 1,095,825 54.5%
Female 621,085 48.0% 915,101 45.5%
Age Under 18 0 0.0% 26,219 1.3%
18 to 24 38,030 2.9% 337,237 16.8%
25 to 54 921,168 71.2% 1,197,385 59.5%
55 to 64 295,740 22.9% 293,947 14.6%
64+ 39,276 3.0% 156,138 7.8%
Race White 1,012,080 78.2% 1,389,130 69.1%
Black 39,113 3.0% 67,184 3.3%
Asian 98,387 7.6% 150,347 7.5%
Hispanic 81,807 6.3% 303,714 15.1%
Other 62,827 4.9% 100,551 5.0%
Nativity Native 1,126,907 87.1% 1,597,554 79.4%
Foreign-born 167,307 12.9% 413,372 20.6%
Education Less than HS 28,556 2.2% 228,841 11.4%
High school only 249,932 19.3% 530,115 26.4%
Some college 360,277 27.8% 652,737 32.5%
Bachelor's or more 655,449 50.6% 599,233 29.8%
Number of employers Single employer 1,163,757 89.9% 1,723,267 85.7%
Multiple employers 130,457 10.1% 287,659 14.3%
No tax filing (under $4,000 income) Not filing 6,737 0.5% 140,873 7.0%
Source: CRR calculations from Current Population Survey, March Supplement 2015 (reflecting 2014 calendar year data).

Retirement Readiness 53
Table 2. Uncovered Workers in Washington by Reason for Lack of Coverage, 2014
Reason for not having coverage Number of workers Share of total
workforce
All Washington Workers 3,305,140 100%
Total uncovered 2,010,926 61%
Employer does not offer a plan 1,214,935 37%
Employer offers plan, not included 487,800 15%
Self-employed without plan 308,191 9%
Source: CRR calculations from CPS, March Supplement 2015.

Retirement Readiness 54
Table 3. Distribution of Uncovered Workers by Metro Area, 2014
All workers Employer does not
offer a plan
Employer offers plan, not included
Self-employed without plan
Metro Area Number Number Share Number Share Number Share
Total 3,305,140 1,214,935 100% 487,800 100% 308,191 100%
By Metro Area
Kennewick-Richland
159,610 67,073 5.5%
21,621 4.4%
8,164 2.6% Mount Vernon-Anacortes
117,123 45,006 3.7%
14,401 3.0%
19,721 6.4%
Portland-Vancouver-Beaverton
211,318 68,036 5.6%
49,968 10.2%
15,834 5.1%
Seattle-Tacoma-Bellevue
1,968,406 730,487 60.1%
274,499 56.3%
180,934 58.7%
Spokane
246,451 70,056 5.8%
37,008 7.6%
16,410 5.3%
Other/Non-metro
602,232 234,277 19.3%
90,303 18.5%
67,128 21.8%
Source: Center for Retirement Research calculations from U.S. Census Bureau and Current Population Survey, March Supplement 2015 (reflecting 2014 calendar year data).

Retirement Readiness 55
Table 4. Distribution of Uncovered Workers by Firm Size, 2014
All
workers Employer does not
offer a plan Employer offers
plan, not included Self-employed without plan
Number of employees Number Number Share Number Share Number Share
Total 3,305,140 1,214,935 100% 487,800 100% 308,191 100%
By firm size Fewer than 10
employees 672,580 305,551 25.1% 34,029 7.0% 278,718 90.4%
10 to 49 employees 470,293 300,672 24.7% 55,651 11.4% 8,794 2.9%
50 to 99 employees 291,026 142,727 11.7% 39,839 8.2% 8,062 2.6%
100+ employees 1,871,241 465,985 38.4% 358,281 73.4% 12,617 4.1%
Source: Center for Retirement Research calculations from U.S. Census Bureau and Current Population Survey, March Supplement 2015 (reflecting 2014 calendar year data).

Retirement Readiness 56
Table 5. Distribution of Uncovered Workers by Industry, 2014
Employer does not
offer a plan Employer offers
plan, not included Self-employed without plan
Industry Number Share Number Share Number Share
Total 1,214,935 100% 487,800 100% 308,191 100%
By Industry
Non-professional services 224,639 18.5% 65,055 13.3% 41,303 13.4%
Professional services 415,194 34.2% 213,384 43.7% 130,823 42.4%
Construction 123,390 10.2% 6,424 1.3% 54,245 17.6%
Raw materials 87,781 7.2% 4,679 1.0% 40,662 13.2%
Manufacturing 125,706 10.3% 34,606 7.1% 15,462 5.0%
Retail/Wholesale 191,851 15.8% 92,403 18.9% 11,967 3.9%
Transport/Utilities 46,374 3.8% 71,249 14.6% 13,729 4.5%
Source: Center for Retirement Research calculations from U.S. Census Bureau and Current Population Survey, March Supplement 2015 (reflecting 2014 calendar year data).

Retirement Readiness 57
Table 6. Distribution of Uncovered Workers by Hours Worked and Median Wages, 2014
Employer does not offer a
plan Employer offers plan, not
included Self-employed without plan
Usual hours a week Number Share Median wage Number Share
Median wage Number Share
Median wage
Total 1,214,935 100% $28,357 487,800 100% $26,783 308,191 100% $31,073
By Hours Worked
1 to 9 hours 34,695 2.9% $5,000 12,913 2.6% $6,700 17,889 5.8% $4,500
10 to 19 hours 80,042 6.6% $5,000 39,283 8.1% $9,800 12,730 4.1% $10,500
20 to 29 hours 99,209 8.2% $13,000 67,902 13.9% $13,312 32,571 10.6% $10,000
30 to 39 hours 186,308 15.3% $17,500 85,452 17.5% $20,000 66,284 21.5% $15,000
40+ hours 814,681 67.1% $36,000 282,250 57.9% $35,360 178,717 58.0% $45,000
Source: Center for Retirement Research calculations from U.S. Census Bureau and Current Population Survey, March Supplement 2015 (reflecting 2014 calendar year data).

Retirement Readiness 58
Table 7. Key Demographics of Uncovered Workers, 2014
Employer does not offer a plan
Employer offers plan, not included
Self-employed without plan
Characteristic Total Employed Workers
Workers Not Covered by a Plan Number Share Number Share Number Share
Total 3,305,140 2,010,926 1,214,935 60% 487,800 24% 308,191 15%
Gender
Male 1,768,954 1,095,825 656,075 60% 229,827 21% 209,923 19%
Female 1,536,186 915,101 558,860 61% 257,973 28% 98,268 11%
Age
Under 18 26,219 26,219 20,048 76% 6,171 24% 0 0%
18 to 24 375,267 337,237 225,135 67% 110,568 33% 1,534 0%
25 to 54 2,118,553 1,197,385 763,129 64% 278,105 23% 156,151 13%
55 to 64 589,687 293,947 140,445 48% 51,949 18% 101,553 35%
64+ 195,414 156,138 66,178 42% 41,007 26% 48,953 31%
Race
White 2,401,210 1,389,130 788,698 57% 341,007 25% 259,425 19%
Black 106,297 67,184 34,601 52% 27,246 41% 5,337 8%
Asian 248,734 150,347 102,081 68% 40,203 27% 8,063 5%
Hispanic 385,521 303,714 229,546 76% 50,961 17% 23,207 8%
Other 163,378 100,551 60,009 60% 28,383 28% 12,159 12%
Nativity
Native 2,724,461 1,597,554 930,387 58% 427,665 27% 239,502 15%
Foreign-born 580,679 413,372 284,548 69% 60,135 15% 68,689 17%
Education
Less than HS 257,397 228,841 177,738 78% 26,874 12% 24,229 11%
High school only 780,047 530,115 350,506 66% 121,972 23% 57,637 11%
Some college 1,013,014 652,737 390,048 60% 186,951 29% 75,738 12%
Bachelor's or more 1,254,682 599,233 296,643 50% 152,003 25% 150,587 25%
Number of employers
Single employer 2,887,024 1,723,267 1,035,024 60% 404,111 23% 284,132 16%
Multiple employers 418,116 287,659 179,911 63% 83,689 29% 24,059 8% No tax filing (under $4,000 income)
Not filing 147,610 140,873 77,106 55% 23,549 17% 40,218 29%
Source: Center for Retirement Research calculations from U.S. Census Bureau and Current Population Survey, March Supplement 2015 (reflecting 2014 calendar year data).

Retirement Readiness 59
Table 11. Financial situation, interaction, and literacy by retirement plan coverage in Washington and the United States.
Washington United States
Not covered Covered
Not covered
Covered
Number of Observations 152 222 8,315 11,305
Financial situation
Spends more than makes 20% 18% 24% 18%
Can come up with $2,000 11% 51% 13% 47%
Receives government transfers 40% 16% 28% 16%
Receives money form family 18% 18% 25% 19%
Used unconventional credit sources. 44% 29% 40% 26%
Interaction with the financial system
Has a checking account 83% 97% 79% 97%
Owns non-retirement investments 9% 46% 9% 49%
Gets paid in cash or check 47% 18% 42% 21%
Uses credit cards to purchase things 42% 68% 46% 79%
Uses debit cards to purchase things 45% 80% 73% 79%
Pays for things online 54% 81% 55% 80%
Financial literacy
Understands compounding 77% 90% 68% 82%
Understands diversification 39% 61% 34% 57%
Learned about finance at school 9% 20% 13% 20%
Learned about finance at work 3% 17% 4% 12%
Source: Center for Retirement Research calculations from Financial Industry Regulatory Authority (FINRA) National Financial Capability Study.

Retirement Readiness 60
Source: Center for Retirement Research calculations from U.S. Census Bureau Longitudinal Business Database, 2014 (reflecting 2013 calendar year data); U.S. Census Bureau County Business Patterns, 2014; and Current Population Survey, March Supplement 2015 (reflecting 2014 calendar year data).
Source: Center for Retirement Research calculations from U.S. Census Bureau Longitudinal Business Database, 2014 (reflecting 2013 calendar year data); U.S. Census Bureau County Business Patterns, 2014; and Current Population Survey, March Supplement 2015 (reflecting 2014 calendar year data).
Table 13. Number of Affected Firms by Metro Area, 2014
Metro Area Number of firms Estimated share not offering plan Affected firms
Share of affected firms
Total 178,546 73.5% 131,231 100.0%
By metro area
Kennewick-Richland 5,533 84.5% 4,675 3.6%
Mount Vernon-Anacortes 3,361 82.8% 2,784 2.1%
Portland-Vancouver-Beaverton 10,079 76.6% 7,725 5.9%
Seattle-Tacoma-Bellevue 99,432 81.7% 81,244 61.9%
Spokane 12,389 81.7% 10,120 7.7%
Other/Non-metro 47,752 51.7% 24,683 18.8%
Table 14. Estimated Number of Affected Firms by Size and Time in Existence, 2014
Under 2 Years of Existence 2+ Years of Existence
Number of employees Firms Affected
Firms Affected
employees Firms Affected
firms Affected
employees
Fewer than 10 employees 23,369 18,426 53,388 110,376 87,029 252,163
10 to 49 employees 1,767 1,171 16,211 31,006 20,541 284,461
50 to 99 employees 83 42 3,036 3,800 1,946 139,691
100+ employees 50 13 2,851 8,095 2,064 463,134
Total 25,268 19,651 75,486 153,278 111,580 1,139,449

Retirement Readiness 61
Table 15. Estimated Number of Affected Firms by Industry, 2014
Number of
firms
Estimated share not
offering plan Affected firms Share of
affected firms
Total 178,546 73.5% 131,231 100.0%
By Industry
Non-professional services 33,331 77.9% 25,975 19.8%
Professional services 79,990 73.2% 58,518 44.6%
Construction 20,484 77.7% 15,908 12.1%
Raw materials 1,606 83.0% 1,333 1.0%
Manufacturing 6,933 65.6% 4,549 3.5%
Retail/Wholesale 30,890 67.4% 20,813 15.9%
Transport/Utilities 5,313 77.8% 4,135 3.2%
Source: Center for Retirement Research calculations from U.S. Census Bureau County Business Patterns, 2014, and Current Population Survey, March Supplement 2015 (reflecting 2014 calendar year data).

Retirement Readiness 62
Table 1 Notes: Weighted using the Current Population Survey, March Supplement weights. Workers are not in the military, are not unpaid family workers, and are in the pension universe. Includes both private and public sector workers. All public sector workers are considered as working for an employer offering a plan. 'Not covered by a plan' includes workers whose employers do not offer a plan, workers that are not included in their employer's plan, and the self-employed that don't have a plan. Table 2 Notes: Weighted using the Current Population Survey, March Supplement weights. Workers are not in the military, are not unpaid family workers, and are in the pension universe. Includes both private and public sector workers. All public sector workers are considered as working for an employer offering a plan. Table 3 Notes: Weighted using the Current Population Survey, March Supplement weights. Workers are not in the military, are not unpaid family workers, and are in the pension universe. Includes both private and public sector workers. All public sector workers are considered as working for an employer offering a plan. 'Other/Non-metro' includes individuals from the Bellingham, Bremerton-Silverdale, Olympia, and Yakima metro areas as well as workers in non-metro areas. Table 4 Notes: Weighted using the Current Population Survey, March Supplement weights. Workers are not in the military, are not unpaid family workers, and are in the pension universe. Includes both private and public sector workers. All public sector workers are considered as working for an employer offering a plan. Table 5 Notes: Weighted using the Current Population Survey, March Supplement weights. Workers are not in the military, are not unpaid family workers, and are in the pension universe. Includes both private and public sector workers. All public sector workers are considered as working for an employer offering a plan. Industries are sorted using the 1950 Census Bureau industrial classification system. Table 6 Notes: Weighted using the Current Population Survey, March Supplement weights. Workers are not in the military, are not unpaid family workers, and are in the pension universe. Includes both private and public sector workers. All public sector workers are considered as working for an employer offering a plan. For the self-employed, "wages" includes business income. Table 7 Notes: Weighted using the Current Population Survey, March Supplement weights. Workers are not in the military, are not unpaid family workers, and are in the pension universe. Includes both private and public sector workers. All public sector workers are considered as working for an employer offering a plan. Table 11 Notes: A respondent is covered when they have a retirement plan through their employer or acquire it privately. Table 13 Notes: Number of firms is estimated using county-level data on business establishments from the County Business Patterns (CBP). Since the CBP does not have data split by firm size and metro area, the estimated number of affected firms uses non-coverage rates for private, non-self-employed workers by firm size and metro area in the Current Population Survey and estimates of the number firms by firm size and metro area from the Longitudinal Business Database. The total number of affected firms relies on non-coverage rates for private, non-self-employed workers by firm size to avoid the combination of metro areas within 'Other/Non-metro'.

Retirement Readiness 63
Table 14 Notes: Number of firms is estimated using county-level data on business establishments from the County Business Patterns (CBP). These data were then scaled by the number of firms with fewer than or more than two years of existence based on the Longitudinal Business Database. Affected firms use the non-coverage rate for private, non-self-employed workers by firm size in the Current Population Survey, where the non-coverage rates are the same for both age categories. Affected employees splits the total number of employees from the Current Population Survey that do not have a workplace-based retirement savings place offered by their firm's size and age. Table 15 Notes: Number of firms is estimated using county-level data on business establishments from the County Business Patterns (CBP). Industries are defined according to 2-digit NAICS codes. Number of affected firms is estimated by applying non-coverage rates for private, non-self-employed workers from the Current Population Survey within each industry by firm size. Excludes firms with zero employment.

Retirement Readiness 64
Appendix for Tables 5 and 15. Industry Details
Table 5: CPS 1950 Census Bureau industrial classification
system Table 15: 2-digit 2002 NAICS
codes
Industry Non-professional services 826-849: Personal services;
857-859: Entertainment and recreation services; 816: Auto repair services and garages; 817: Miscellaneous repair services; 679: Eating and drinking retail places
72: Accommodation and food services; 81: Other services (except public administration)
Professional services 868-899: Professional and related services; 716-746: Finance, insurance, and real estate; 806-808: Business services; 856: Radio broadcasting and television
51: Information; 52: Finance and insurance; 53: Real estate and rental and leasing; 54: Professional, scientific, and technical services; 55: Management of companies and enterprises; 56: Administrative and support and waste management and remediation services; 61: Educational services; 62: Health care and social assistance; 71: Arts, entertainment, and recreation
Construction 246: Construction 23: Construction
Raw materials 105-126: Agriculture, forestry, and fishing; 206-236: Mining; 306: Logging
11: Agriculture, forestry, fishing and hunting; 21: Mining, quarrying, and oil and gas extraction
Manufacturing 307-399: Durable goods; 406-499: Nondurable goods
31-33: Manufacturing
Retail/Wholesale 606-627: Wholesale trade; 636-669 and 686-699: Retail trade
42: Wholesale trade; 44-45: Retail trade
Transport/Utilities 506-568: Transportation; 578-579: Telecommunications; 586-598: Utilities and sanitary services
22: Utilities; 48-49: Transportations and warehousing
Source: U.S. Census Bureau and Current Population Survey, March Supplement 2015.

Retirement Readiness 65
Appendix C: State Policy Initiatives
There are nine states currently implementing programs.118 Table 14: State policy interventions
State Program Implementation Status as of August 2017 California
Secure Choice: Employers with 5 or more employees that don’t already provide a retirement plan will be required to offer a plan or provide employee access to Secure Choice, an auto-enroll payroll deduction IRA.
Under development. Expected launch in 2018 with 3-year phased-in mandate. http://www.treasurer.ca.gov/scib/index.asp
Connecticut
Connecticut Retirement Security Authority: Qualified employers with 5 or more employees that do not currently offer a plan will be required to offer a plan or provide employee access to Roth IRAs from a marketplace of selected vendors and plans.
Under development. The legislation is effective January 1, 2017. Employer mandate will be phased over a 3-year period once the program is implemented. http://www.osc.ct.gov/crsb/index.html
Illinois
Secure Choice: Requires Illinois businesses with at least 25 employees, which have been in business for at least two years, and choose not offer a qualifying savings program, to either offer a qualified retirement savings plan or automatically enroll their employees into Secure Choice (a payroll deduction IRA).
Under development. Phased-in implementation scheduled to begin in 2018. http://illinoistreasurer.gov/Individuals/Secure_Choice
Maryland
Maryland Small Business Retirement Savings Program: Requires that all employers that pay employees through a payroll system or service and don’t currently offer retirement plans to enroll employees in a state board-selected payroll deposit IRA. There is a 2-year deferral for new businesses. Employers retain the option of providing a plan available on the open market.
Under development. The target for program implementation is to be determined, either by end of calendar year 2018 or in 2019. http://msa.maryland.gov/msa/mdmanual/25ind/html/66smallbusret.html
Massachusetts
Massachusetts Retirement Plan for Non-Profits: Establishes a prototype defined contribution 401(k) plan for non-profit organizations with 20 or fewer employees to voluntarily offer to employees.
Implementation timeline not specified. Website link unavailable.
New Jersey
New Jersey Small Business Retirement Marketplace: Online marketplace for employers with fewer than 100 employees to
Implementation timeline not specified. Website link unavailable.
118 Georgetown University, Center for Retirement Initiatives. State Initiatives Transforming the Retirement Savings Landscape
http://cri.georgetown.edu/states/) and Comparison of Retirement Plan Design Features, by State: Massachusetts, Washington and New Jersey. Georgetown University, Center for Retirement Initiatives, State Brief 16-02, November 30, 2016 Update.

Retirement Readiness 66
voluntarily compare and select retirement savings plans.
Oregon
OregonSaves: Employers that don’t currently offer qualified retirement savings plans are required to participate in OregonSaves, a state-sponsored payroll deduction IRA, or establish alternative qualified retirement plans for some or all of their employees
As of July 2017, the pilot phase is underway, with phased-in full implementation to begin with the largest employers beginning November 2017 and continuing through 2020 with the smallest employers phased-in last. https://www.oregonsaves.com/
Vermont
The Green Mountain Secure Retirement Plan: Offers a voluntary Multiple Employer Plan (MEP) to employers with 50 or fewer employees that don’t currently offer a retirement plan.
Vermont shall implement the plan on or before January 15, 2019, based on recommendations of the Committee. http://www.vermonttreasurer.gov/content/retirement/Study-Committee
Washington
Washington Small Business Retirement Marketplace: Online marketplace for employers and individuals to voluntarily comparison shop for low-cost, low-burden retirement plans.
Launch expected in fall 2017. http://www.commerce.wa.gov/growing-the-economy/business-services/small-business-retirement-marketplace/

Retirement Readiness 67
Appendix D: 2017 Washington Report by Schwartz Center for Economic Policy Analysis (SCEPA)

Retirement Readiness 68

Retirement Readiness 69

Retirement Readiness 70

Retirement Readiness 71
Table 1: Trends in Sponsorship by Demographics
Notes: 1) Civilian non-institutionalized population ages 25-64 who did any work the year before. 2) CPS sample
weights. 3) Levels – in both 2004-06 and 2014-16, sponsorship rates were significantly lower for younger workers
relative to prime age workers, those in small firms relative to workers in firms with 500 or more employees, non-
citizens relative to citizens, and Hispanics relative to non-Hispanics. Differences between men and women and
between blacks and whites were small and not statistically significant. 4) Levels – in both 2004-06 and 2014-16,
sponsorship rates were lower for workers in construction, wholesale and retail, and business and repair services,
relative to an arbitrarily chosen base case of manufacturing. 5) Trends – the decline in sponsorship was statistically
significant for almost all sub-groups. 6) Trends - the decline in sponsorship are expressed in percentage points, not
percentages, and we therefore expect those with lower sponsorship rates in 2004-06 to experience smaller
percentage point declines. Non-citizens experience significantly larger percentage point and percent declines
relative to citizens. Relative to workers in the largest firms, workers in firms with 500-999 workers experienced
significantly higher percentage and percentage point declines in coverage.

Retirement Readiness 72
Table 2: Retirement Plan Coverage, Plan Balances, and Projected
Retirement Income, Washington
Notes: 1) Sample: Civilian non-institutionalized population ages 25-64 who did any work in the reference month of the CPS during 2013. 2) CPS and SIPP sample weights. 3) For workers with both DB and DC plans, the DB plan is assumed to be the primary plan in their current job. 4) We assume workers with non-zero 401(k) balances are participating in their current job. 5) The plan type and coverage rates are imputed nationwide based on demographic and job characteristics including industry, income, and union coverage, without state fixed effects. 6) For purposes of calculating replacement rates, we assume workers retire from their current job at age 65, and receive a DB pension of 1.5 percent of salary for each year of service. 7) We further assume that 401(k) participants contribute 6 percent of salary, plus a 50 percent match if they are not also covered by a DB plan. 8) We further assume a 4.5 percent real rate of return on plan assets, zero percent real wage growth, and that plan participants draw down DC wealth at retirement at 4 percent a year. 9) Some workers covered only by a DB plan have IRA plans as a result of rollovers from prior DC employment or direct contribution. We assume no future direct contributions to IRAs. 10) Multiple replacement rates exist for different combinations of plans due to the fact that some workers may have carried over DC wealth from a previous job.

Retirement Readiness 73
Table 3: Household Non-Retirement Financial Assets and Mortgage
Debt in the U.S.

Retirement Readiness 74
Appendix E: Elder Economic Security Standard Index
2016 Washington State Elder Economic Security Standard Index, Statewide Average
Elder Person (age 65+) Elder Couple (both age 65+)
Monthly
Expenses
Owner w/o
Mortgage
Renter Owner w/
Mortgage
Owner w/o
Mortgage
Renter Owner w/
Mortgage
Housing $561 $814 $1,593 $561 $814 $1,593
Food $256 $256 $256 $470 $470 $470
Transportation $222 $222 $222 $343 $343 $343
Health Care
(good Health)
$445 $445 $445 $890 $890 $890
Miscellaneous $297 $297 $297 $453 $453 $453
Total Monthly
(Elder Index)
Expenses
$1,781 $2,034 $2,813 $2,717 $2,970 $3,749
Total Annual
(Elder Index)
Expenses
$21,372 $24,408 $33,756 $32,604 $35,640 $44,988
Source: Source: National Council on Aging and the Gerontology Institute, University of Massachusetts Boston, The Economic Security Database Note: For additional information on the Elder Index, see the Gerontology Institute’s The National Economic Security Standard Index. U.S., state and county-level Elder Index data can be viewed and downloaded at the Economic Security Database. The Elder Economic Security Standard™ Index (Elder Index) was developed by the Gerontology Institute at the University of Massachusetts Boston with Wider Opportunities for Women, and is maintained in partnership with the National Council on Aging (NCOA). http://www.basiceconomicsecurity.org/EI/location.aspx
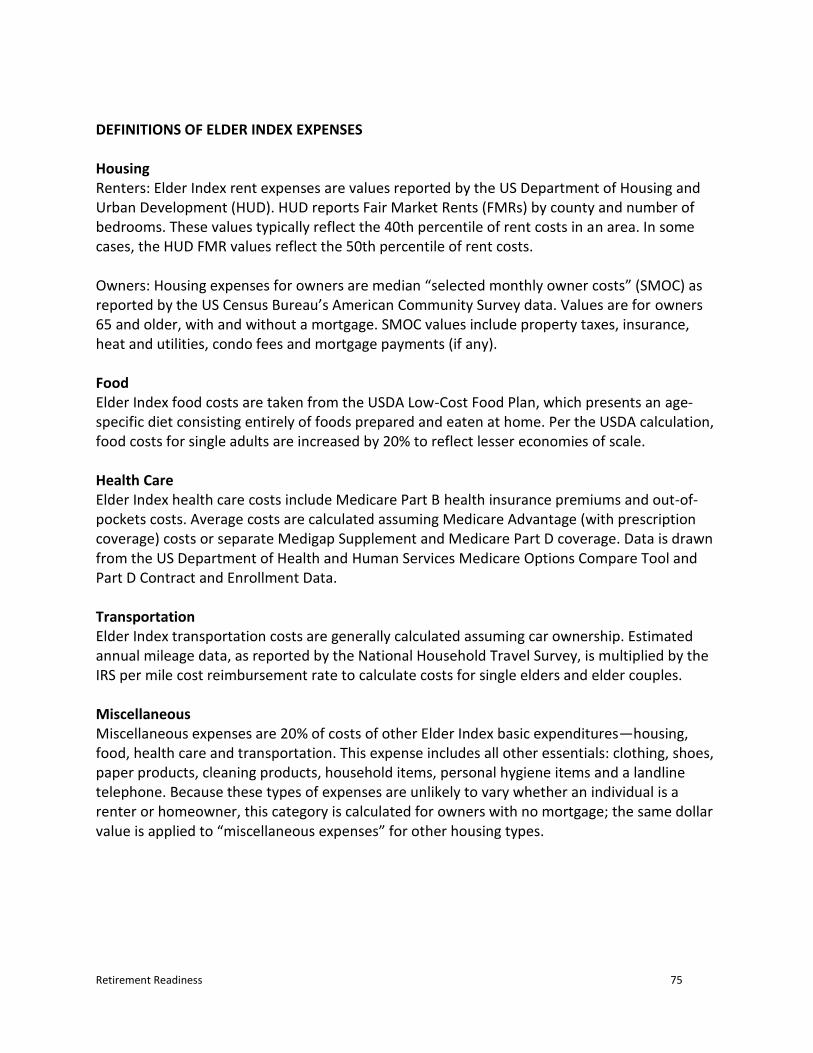
Retirement Readiness 75
DEFINITIONS OF ELDER INDEX EXPENSES
Housing Renters: Elder Index rent expenses are values reported by the US Department of Housing and Urban Development (HUD). HUD reports Fair Market Rents (FMRs) by county and number of bedrooms. These values typically reflect the 40th percentile of rent costs in an area. In some cases, the HUD FMR values reflect the 50th percentile of rent costs.
Owners: Housing expenses for owners are median “selected monthly owner costs” (SMOC) as reported by the US Census Bureau’s American Community Survey data. Values are for owners 65 and older, with and without a mortgage. SMOC values include property taxes, insurance, heat and utilities, condo fees and mortgage payments (if any). Food Elder Index food costs are taken from the USDA Low-Cost Food Plan, which presents an age-specific diet consisting entirely of foods prepared and eaten at home. Per the USDA calculation, food costs for single adults are increased by 20% to reflect lesser economies of scale.
Health Care Elder Index health care costs include Medicare Part B health insurance premiums and out-of-pockets costs. Average costs are calculated assuming Medicare Advantage (with prescription coverage) costs or separate Medigap Supplement and Medicare Part D coverage. Data is drawn from the US Department of Health and Human Services Medicare Options Compare Tool and Part D Contract and Enrollment Data.
Transportation Elder Index transportation costs are generally calculated assuming car ownership. Estimated annual mileage data, as reported by the National Household Travel Survey, is multiplied by the IRS per mile cost reimbursement rate to calculate costs for single elders and elder couples.
Miscellaneous Miscellaneous expenses are 20% of costs of other Elder Index basic expenditures—housing, food, health care and transportation. This expense includes all other essentials: clothing, shoes, paper products, cleaning products, household items, personal hygiene items and a landline telephone. Because these types of expenses are unlikely to vary whether an individual is a renter or homeowner, this category is calculated for owners with no mortgage; the same dollar value is applied to “miscellaneous expenses” for other housing types.