rethinking the uninsured greg scandlen. rethinking the uninsured we’ve been working on this issue...
TRANSCRIPT

Rethinking the Uninsured
Greg Scandlen

Rethinking the Uninsured
We’ve been working on this issue since I first got into this business -- 30 years ago.
Medicaid Expansions SCHIP High Risk Pools Small Group and Individual Market Reforms COBRA, HIPAA Cost control
Nothing we’ve tried has solved anything.
Sometimes when a problem seems intractable, it is time to reframe the issue.


Insured versus Uninsured --False Dichotomy
This conference has added “the underinsured.”• Why not “the over-insured?”• Why not “the well-insured who can’t get services?”• Why not “the well-insured for 8 months a year?”• Why not “the uninsured who are eligible for Medicaid and can be instantly enrolled when something serious happens?”
Is insurance really the point, or should it be accessing and paying for health care services?

Counting the Uninsured
Uninsured (percent of non-elderly population)1998 1999
Uninsured all yearSIPP 9.1 n/aMEPS 13.3 12.2
Uninsured at any time during yearSIPP 24.5 n/aMEPS 25.3 25.1
Uninsured at a point in timeSIPP 16.6 15.7MEPS 18.3 17.4NHIS 16.5 16.0CPS 18.4 16.2
(Source: Congressional Budget Office, May, 2003)

Counting the Uninsured
0102030405060708090
100
1987
1989
1991
1993
1995
1997
1999
2001
2003
2005
UninsuredInsured
Percent insured versus uninsured, 1987 - 2005
SOURCE: US Census Bureau, http://www.census.gov/hhes/www/hlthins/hihistt4.html

Counting the Uninsured
In fact, virtually everyone is insured for something, and no one is insured for everything.
Young males, age 21 - 24 are the least likely to have health insurance of any age/gender category (40.7% were uninsured in 2004).
But even they are usually covered for the things most likely to happen to them - auto accidents and workplace injuries.
Are they really “uninsured?” At the same time, people who are considered “fully insured”
are not covered for everything. People on Medicare on average spend 21.7% of their income
on OOP services, according to Karen Davis, or 15.% as a median according to Patricia Neuman.
Which group is better insured?

Defining the Underinsured
Probably the most common definition is 10% of income spent on health care.
But why, when national spending is 16%? Why is it bad to spend 10%+ on directly on health care,
but not bad to spend 10%+ on taxes that pay for health care?
If 10% is the standard, then Medicare is terrible. According to Banthin and Bernard in JAMA:
19.4% of Medicaid and SCHIP spent 10%+ 18.2% of privately insured But only 10.5% of the uninsured do
Is it best to be uninsured?

Defining the Underinsured
1918 1961 1987
Food 41.1% 26.0% 19.4%
Housing 26.8 29.2 33.7
Transportation
3.1 15.1 25.7
Clothing 17.6 10.3 5.2
Health Care 4.7 6.6 4.0
Other 6.7 12.8 12.0
Where Does the Family Budget Go?

Sources of HC Spending
0
10
20
30
40
50
60
1960 1980 2000
Out-of-PocketPublic PayersPrivate 3rd Party

Rethinking the Issue
Considerations in Expanding Coverage: Who decides what to cover -- insurance
companies, employers, the government -- or consumers?
Adverse Selection versus Moral Hazard Insurance versus Third-Party Payment Risk Pooling versus Pre-Paid Health Care Pre-paid Health Care versus Post-paid
Health Care Premiums versus Benefits

Third Party Payment
Consumer
Insurer
Provider

Two-Party Contracts
Consumer
InsurerProvider
Employer
Consumer
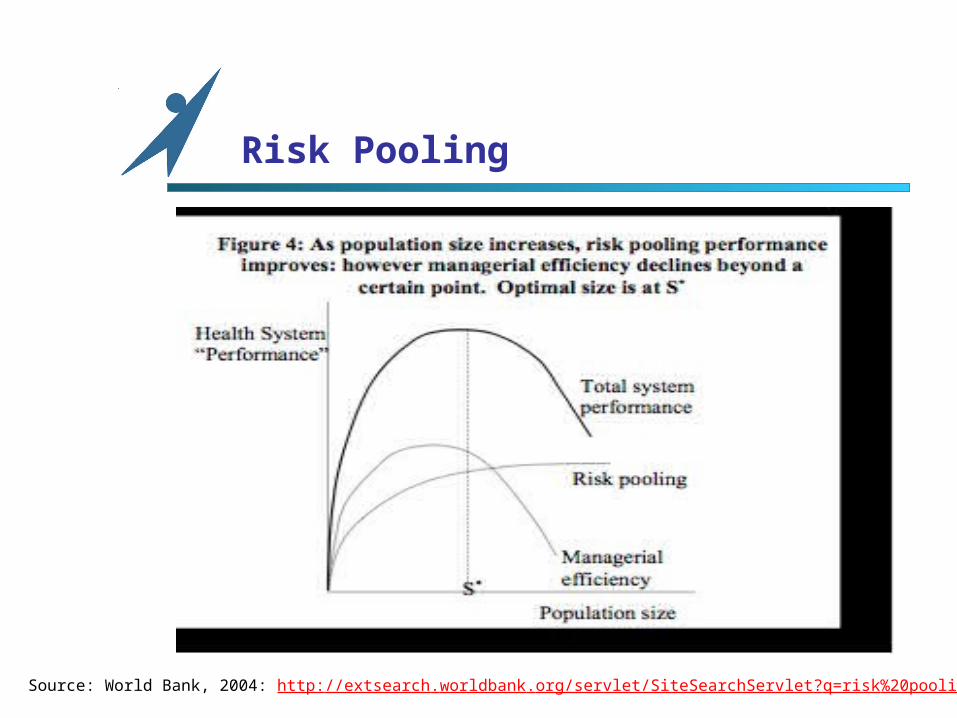
Risk Pooling
Source: World Bank, 2004: http://extsearch.worldbank.org/servlet/SiteSearchServlet?q=risk%20pooling

Employer-Based Tax Subsidy, by Household Income, 2004
$0
$500
$1,000
$1,500
$2,000
$2,500
$3,000
< $10 k $20-30K
$40-50K
$75-100K
Average
Fed. Tax Expenditure

How Much Change is Needed?
0%10%20%30%40%50%60%70%80%90%
100%
NZ Aus US Can UK
Complete
Fundamental
Minor Change
