retention and risk factors for attrition among adults in
TRANSCRIPT

Portland State University Portland State University
PDXScholar PDXScholar
OHSU-PSU School of Public Health Faculty Publications and Presentations OHSU-PSU School of Public Health
9-2014
Retention and Risk Factors for Attrition among Retention and Risk Factors for Attrition among
Adults in Antiretroviral Treatment Programmes in Adults in Antiretroviral Treatment Programmes in
Tanzania, Uganda and Zambia Tanzania, Uganda and Zambia
Olivier Koole
Follow this and additional works at: https://pdxscholar.library.pdx.edu/sph_facpub
Let us know how access to this document benefits you.
Citation Details Citation Details Koole O, Tsui S, Wabwire-Mangen F, Kwesigabo G, Menten J, Mulenga M, Auld A, Agolory S, Mukadi YD, Colebunders R, Bangsberg DR, van Praag E, Torpey K, Williams S, Kaplan J, Zee A, Denison J. Retention and risk factors for attrition among adults in antiretroviral treatment programmes in Tanzania, Uganda and Zambia. Trop Med Int Health. 2014 Sep 17. doi: 10.1111/tmi.12386
This Post-Print is brought to you for free and open access. It has been accepted for inclusion in OHSU-PSU School of Public Health Faculty Publications and Presentations by an authorized administrator of PDXScholar. Please contact us if we can make this document more accessible: [email protected].
Retention and risk factors for attrition among adults in antiretroviral treatment programmes in Tanzania, Uganda and Zambia
Olivier Koole1,2, Sharon Tsui3,4, Fred Wabwire-Mangen5, Gideon Kwesigabo6, Joris Menten2, Modest Mulenga7, Andrew Auld8, Simon Agolory8, Ya Diul Mukadi3, Robert Colebunders2,9, David R. Bangsberg10,11, Eric van Praag3, Kwasi Torpey3, Seymour Williams8, Jonathan Kaplan8, Aaron Zee8, and Julie Denison3,4
1Department of Infectious Disease Epidemiology, London School of Hygiene and Tropical Medicine, London, UK 2Clinical Sciences Department, Institute of Tropical Medicine, Antwerp, Belgium 3FHI 360, Durham, NC, USA 4Department of International Health, Johns Hopkins Bloomberg School of Public Health, Baltimore, MD, USA 5Infectious Diseases Institute, Makerere University College of Health Sciences, Kampala, Uganda 6Muhimbili University of Health and Allied Sciences, Dar es Salaam, United Republic of Tanzania 7Tropical Diseases Research Centre, Ndola, Zambia 8Division of Global AIDS, United States Centers for Disease Control and Prevention, Atlanta, GA, USA 9Epidemiology and Social Medicine, University of Antwerp, Antwerp, Belgium 10Massachusetts General Hospital, Boston, MA, USA 11Harvard Medical School, Boston, MA, USA
Abstract
OBJECTIVES—We assessed retention and predictors of attrition (recorded death or loss to
follow-up) in antiretroviral treatment (ART) clinics in Tanzania, Uganda and Zambia.
METHODS—We conducted a retrospective cohort study among adults (≥18 years) starting ART
during 2003–2010. We purposefully selected six health facilities per country and randomly
selected 250 patients from each facility. Patients who visited clinics at least once during the 90
days before data abstraction were defined as retained. Data on individual and programme level
risk factors for attrition were obtained through chart review and clinic manager interviews.
Kaplan–Meier curves for retention across sites were created. Predictors of attrition were assessed
using a multivariable Cox-proportional hazards model, adjusted for site-level clustering.
RESULTS—From 17 facilities, 4147 patients were included. Retention ranged from 52.0% to
96.2% at 1 year to 25.8%–90.4% at 4 years. Multivariable analysis of ART initiation
characteristics found the following independent risk factors for attrition: younger age [adjusted
hazard ratio (aHR) and 95% confidence interval (95%CI) = 1.30 (1.14–1.47)], WHO stage 4
([aHR (95% CI): 1.56 (1.29–1.88)], >10% bodyweight loss [aHR (95%CI) = 1.17 (1.00–1.38)],
Corresponding Author Olivier Koole, Department of Infectious Disease Epidemiology, London School of Hygiene and Tropical Medicine, Keppel Street, London WC1E 7HT, UK. Tel.: +265 997 680 108; [email protected].
This paper was presented in part at the XIX International AIDS Conference 2012, 22–27 July, Washington DC, USA.
Published in final edited form as:Trop Med Int Health. 2014 December ; 19(12): 1397–1410. doi:10.1111/tmi.12386.
Author M
anuscriptA
uthor Manuscript
Author M
anuscriptA
uthor Manuscript

poor functional status [ambulatory aHR (95%CI) = 1.29 (1.09–1.54); bedridden aHR1.54 (1.15–
2.07)], and increasing years of clinic operation prior to ART initiation in government facilities
[aHR (95%CI) = 1.17 (1.10–1.23)]. Patients with higher CD4 cell count were less likely to
experience attrition [aHR (95%CI) = 0.88 (0.78–1.00)] for every log (tenfold) increase. Sites
offering community ART dispensing [aHR (95% CI) = 0.55 (0.30–1.01) for women; 0.40 (0.21–
0.75) for men] had significantly less attrition.
CONCLUSIONS—Patient retention to an individual programme worsened over time especially
among males, younger persons and those with poor clinical indicators. Community ART drug
dispensing programmes could improve retention.
Keywords
ART; HIV; retention; sub-Saharan Africa
Introduction
At the end of 2013, two-thirds of the estimated 35 million people globally living with HIV
lived in sub-Saharan Africa (UNAIDS 2014). The number of people receiving antiretroviral
treatment (ART) reached about 13 million in 2013. Sub-Saharan Africa achieved the
greatest increase in ART coverage by reaching 9 million people, to about 37% coverage
(UNAIDS 2014).
Corresponding with efforts to expand access to ART, there has been an increasing emphasis
on attaining the high levels of retention and adherence necessary to achieve good clinical
outcomes (Bangsberg et al. 2001; Hogg et al. 2002; Paterson et al. 2000; Nachega et al.
2007). Retention is a critical determinant of adherence as patients must actively attend and
participate in an ART care programme to receive their medication and to have their HIV
clinical indicators monitored. Therefore, retention is a key indicator of programme quality
(Giordano et al. 2007).
However, retention of patients in ART care remains a major challenge in sub-Saharan
programmes. Results from a meta-analysis of 32 studies from programmes in sub-Saharan
Africa showed that only 80% of patients started on ART were still in care after 1 year, 77%
after 2 years and 72% after 3 years (Rosen et al. 2007; Fox & Rosen 2010). Loss to follow-
up (LTFU) and recorded death were the major causes of non-retention or attrition.
This study is the first component of a study examining retention and adherence to
antiretroviral treatment among adults in three countries in sub-Saharan Africa. In this
manuscript, we report the results of a retrospective medical chart review of adult ART
patients from ART programme sites in Tanzania, Uganda and Zambia. The objectives of the
study were to characterise the level of retention of patients on ART across multiple and
different programme settings and to examine the relationship between individual and
programme level characteristics and retention proportions.
Koole et al. Page 2
Trop Med Int Health. Author manuscript; available in PMC 2016 January 25.
Author M
anuscriptA
uthor Manuscript
Author M
anuscriptA
uthor Manuscript

Methods
Design and study setting
A retrospective review of 4500 randomly selected medical records of ART patients from
Tanzania, Uganda and Zambia was conducted. In each country, six sites were purposefully
chosen to explore the impact that different programme characteristics may have on retention
and adherence outcomes. This process resulted in study sites from different levels in the
health system (ranging from primary/community-based health centres to national referral
hospitals), from different types of health facilities (public sector, nongovernmental
organisations (NGOs) or faith-based organisations), from urban-rural locations, and with
different ART provision experiences and adherence strategies.
Inclusion criteria for site selection
Only sites with a minimum cohort size of 300 patients at the time of the protocol
development (2006) were considered to fulfil the sample size requirement of 250 patients
per study site. The site-selection process was conducted in consultation with country-
specific stakeholders including Ministries of Health (MOH) and United States Government
(USG) partner organisations.
Inclusion and exclusion criteria for medical chart review
Patients who were at least 18 years of age at ART initiation, who initiated ART treatment (a
combination of 3 antiretroviral drugs) at the site when free drugs were available and who
had started ART at least 6 months prior to the data collection were included. Patients
involved in other ART-related research were excluded.
Data collection and sampling
During the period from April to July 2010, a retrospective chart review of 4500 medical
charts was conducted. During study start-up, the study team noticed that one facility in
Tanzania consisted of two clinics that served adults on ART: an adult-only clinic and a
family clinic where adults may seek care and treatment with their families. One hundred and
25 patients from each of the adult-only and the family clinics were selected.
The study team worked with sites to develop sampling frames consisting of patient
identification numbers (IDs). The study data analyst used these sampling frames to generate
the 250 random numbers using a computerised random number generator in Microsoft Excel
that indicated which patient charts would be abstracted. Data abstractors at each site pulled
the randomly selected charts and screened them for eligibility. They recorded on a screening
log if a chart was missing, ineligible, or eligible and abstracted. Replacement numbers were
generated for those charts that were either ineligible or were missing after a minimum of
three attempts to locate the chart over three consecutive weeks. Three sources of data were
used: patient medical files, pharmacy logbooks and laboratory registers.
The study sites varied greatly in terms of how specific their sampling frames could be. Some
sites had sampling frames consisting only of adult patients who had started on ART at that
site. Other sites could only produce sampling frames with all patients (adults and children)
Koole et al. Page 3
Trop Med Int Health. Author manuscript; available in PMC 2016 January 25.
Author M
anuscriptA
uthor Manuscript
Author M
anuscriptA
uthor Manuscript

ever registered in HIV care. The ability to focus the sampling frame depended on the site’s
data management systems.
Study teams underwent 1 week of data abstraction training and consisted of 2–3 data
abstractors (mainly data entry staff and nurses from the facility) and one supervisor
(typically the sister-in-charge or lead doctor managing the clinic). To better understand the
programme factors related to retention and adherence, each study-site ART programme
manager was interviewed about their ART clinic model in June 2011.
Data management and analysis
Data were double-entered in a study database using Epi-Data Entry 3.1 (EpiData
Association, Odense, Denmark, Europe) at the in-country research organisation and then
transferred to the central data office at FHI 360 for further cleaning and consistency checks.
Consistency checks across the different sources of data were performed. Data analysis
followed a statistical analysis plan, which was finalised before the completion of the study
database. All analyses were performed using Stata versions 10 and 12 (Stata Corporation,
College Station, TX, USA).
Attrition from the programme was defined as having no clinic, pharmacy or laboratory visit
in the 3 months prior to data collection among patients whose charts did not indicate being
transferred out or death. The primary outcome variable was time to discontinuation from the
programme, defined as the time from start of first antiretroviral (ARV) drug treatment
prescribed at the health facility until the last visit. The time to discontinuation was analysed
using survival data methods (Altman & Bland 1998) where lost to follow-up and known
deaths were considered the event of interest. Patients who were retained or transferred out
were censored.
Retention proportions were estimated using the Kaplan–Meier method (Pocock et al. 2002).
The analysis of risk factors for attrition was performed using Cox-proportional hazards
regression, with a shared frailty term to account for clustering of outcomes at each site
(Hougaard 1995). The proportional hazards assumption of predictors was assessed using
graphical methods. A multiple Cox-regression model was constructed using a hierarchical
approach. This approach included first individual level (P-value <0.1) and subsequently
programme level (P-value <0.2) characteristics. Variables that were missing in more than
30% of subjects or were not available at all sites or were present in a small minority of
patients (<10%) were excluded from the multiple Cox-regression model. The model was
simplified using Akaike’s Information Criterion, retaining predictors and clinically plausible
interaction terms that increased model fit, with a penalisation for increasing model
complexity (Collet 2003). Confidence intervals for effects were estimated using the Wald
method and P-values using likelihood ratio tests. The final Cox-regression model was
corrected for missing data in the predictors of attrition using Multivariate Imputation by
Chained Equations (Little 1992; Royston 2004). Ten data sets were imputed with baseline
predictors presumed to be missing at random, conditional on site and individual level
predictors. Estimates were combined across imputed data sets according to Rubin’s rules
(Little 1992).
Koole et al. Page 4
Trop Med Int Health. Author manuscript; available in PMC 2016 January 25.
Author M
anuscriptA
uthor Manuscript
Author M
anuscriptA
uthor Manuscript

Sample size
A random sample of 250 ART-treated patients in each site was needed to allow the
estimation of the retention proportion to be measured with a precision of 5% at site level,
assuming the retention proportion at 6 months after ART initiation was at least 80%.
Ethics statement
The study was approved by the Institutional Review Board (IRB) of the U.S. Centers for
Disease Control and Prevention (US), FHI 360’s Protection of Human Subjects Committee
(US), the Muhimbili University of Health and Allied Sciences’ Research and Publications
Committee (Tanzania), the National HIV/AIDS Research Committee (Uganda), the Uganda
National Council for Science & Technology, the Tropical Diseases Research Centre’s Ethics
Review Committee (Zambia), the Ministry of Health (Zambia), the Massachusetts General
Hospital’s IRB (US) and Universitair Ziekenhuis Antwerpen (Belgium).
As the study was a retrospective chart review with minimal risks, and requesting consent
would mean inclusion of only retained patients, the IRBs waived informed consent
requirements to abstract participant charts. Written informed consent was required prior to
interviewing the ART clinic managers.
Role of the funding source
This research was supported by a contract with FHI 360 by the U.S. Centers for Disease
Control and Prevention (CDC) and the Health Resources & Services Administration
(HRSA) with funds from the President’s Emergency Plan for AIDS Relief (PEFPAR). CDC
provided technical input into the study design, data collection, data analysis, data
interpretation and writing of the manuscript.
Results
A total of 7755 patient medical files were screened for eligibility at the participating sites.
Of these, 1951 were ineligible, 1310 files were missing, and 4494 files were abstracted.
During preparation for analysis, 84 duplicate files were excluded and another 22 were
excluded for not meeting the eligibility criteria. One site in Zambia used an incorrect
sampling frame (excluding patients who were known dead or lost to follow-up) which led to
the exclusion of that site’s 241 patients, leaving 4147 patients for the final analysis.
Characteristics of the study population
Patients started ART between 2003 and 2010. The median age at ART initiation was 36
years (interquartile range (IQR): 30–42), and 2670 (64.4%) were female. Three quarters of
patients (3141 or 75.7%) had a baseline CD4 cell count, with the median CD4 cell count of
134 cells/µl (IQR: 63–206). About half of patients (2197 or 53.0%) were in WHO stage 3 or
4. A vast majority were started on one of the four traditional non-nucleoside reverse
transcriptase inhibitor (NNRTI)-based regimens (3598 or 86.8%) and about 11% on a
tenofovir-based regimen. Other characteristics, stratified by country, are presented in Table
1.
Koole et al. Page 5
Trop Med Int Health. Author manuscript; available in PMC 2016 January 25.
Author M
anuscriptA
uthor Manuscript
Author M
anuscriptA
uthor Manuscript
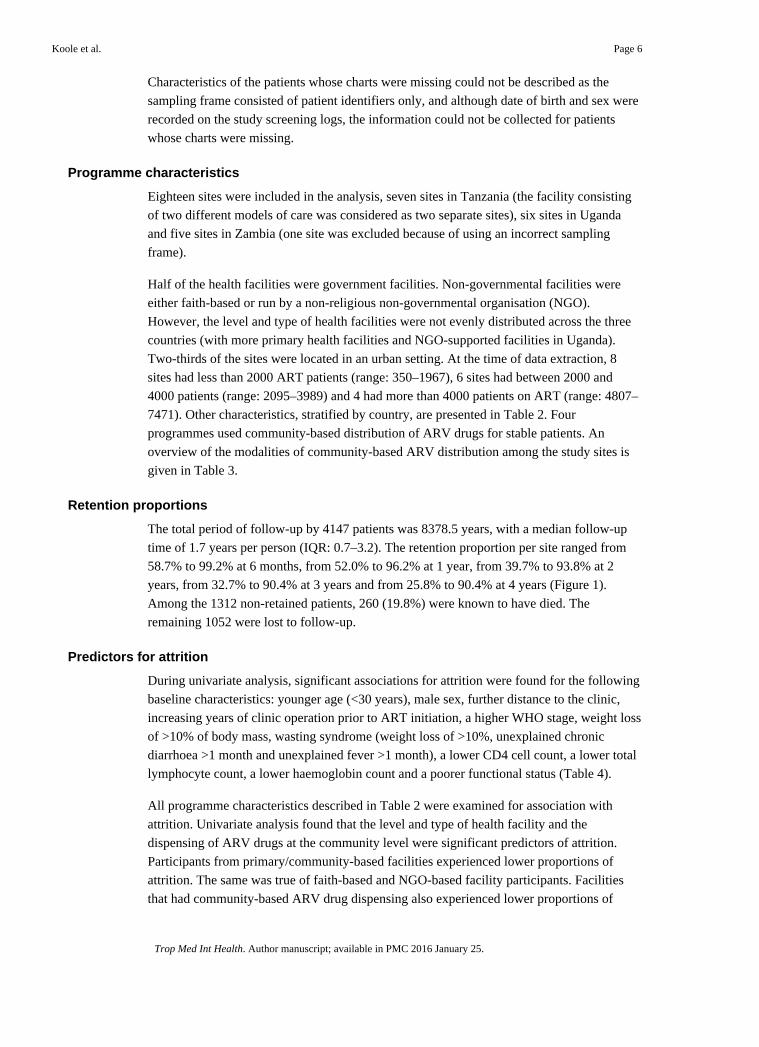
Characteristics of the patients whose charts were missing could not be described as the
sampling frame consisted of patient identifiers only, and although date of birth and sex were
recorded on the study screening logs, the information could not be collected for patients
whose charts were missing.
Programme characteristics
Eighteen sites were included in the analysis, seven sites in Tanzania (the facility consisting
of two different models of care was considered as two separate sites), six sites in Uganda
and five sites in Zambia (one site was excluded because of using an incorrect sampling
frame).
Half of the health facilities were government facilities. Non-governmental facilities were
either faith-based or run by a non-religious non-governmental organisation (NGO).
However, the level and type of health facilities were not evenly distributed across the three
countries (with more primary health facilities and NGO-supported facilities in Uganda).
Two-thirds of the sites were located in an urban setting. At the time of data extraction, 8
sites had less than 2000 ART patients (range: 350–1967), 6 sites had between 2000 and
4000 patients (range: 2095–3989) and 4 had more than 4000 patients on ART (range: 4807–
7471). Other characteristics, stratified by country, are presented in Table 2. Four
programmes used community-based distribution of ARV drugs for stable patients. An
overview of the modalities of community-based ARV distribution among the study sites is
given in Table 3.
Retention proportions
The total period of follow-up by 4147 patients was 8378.5 years, with a median follow-up
time of 1.7 years per person (IQR: 0.7–3.2). The retention proportion per site ranged from
58.7% to 99.2% at 6 months, from 52.0% to 96.2% at 1 year, from 39.7% to 93.8% at 2
years, from 32.7% to 90.4% at 3 years and from 25.8% to 90.4% at 4 years (Figure 1).
Among the 1312 non-retained patients, 260 (19.8%) were known to have died. The
remaining 1052 were lost to follow-up.
Predictors for attrition
During univariate analysis, significant associations for attrition were found for the following
baseline characteristics: younger age (<30 years), male sex, further distance to the clinic,
increasing years of clinic operation prior to ART initiation, a higher WHO stage, weight loss
of >10% of body mass, wasting syndrome (weight loss of >10%, unexplained chronic
diarrhoea >1 month and unexplained fever >1 month), a lower CD4 cell count, a lower total
lymphocyte count, a lower haemoglobin count and a poorer functional status (Table 4).
All programme characteristics described in Table 2 were examined for association with
attrition. Univariate analysis found that the level and type of health facility and the
dispensing of ARV drugs at the community level were significant predictors of attrition.
Participants from primary/community-based facilities experienced lower proportions of
attrition. The same was true of faith-based and NGO-based facility participants. Facilities
that had community-based ARV drug dispensing also experienced lower proportions of
Koole et al. Page 6
Trop Med Int Health. Author manuscript; available in PMC 2016 January 25.
Author M
anuscriptA
uthor Manuscript
Author M
anuscriptA
uthor Manuscript

attrition. We confirmed the effects of programme characteristics identified in the analyses
across countries by assessing these effects in each country separately. During the stratified
analysis by country, attrition was found to be significantly worse for governmental
programmes in Tanzania and Zambia, but not in Uganda. Country was also associated with
retention, with considerably less attrition found in Uganda compared with Tanzania and
Zambia (Table 5). This was explained by the fact that three of the four sites with
community-based ARV distribution were based in Uganda. Country was not formally
considered as a site-level predictor as sites were not necessarily representative for the
country as a whole, and including country as site-level predictor in the final model was not
possible due to computational difficulties.
According to the predefined statistical analysis plan, distance to the clinic was not included
in the multivariable Cox-regression model building because this variable was missing in two
of the research sites. Other known predictors (Coetzee et al. 2004) excluded due to missing
data include lymphocyte count, haemoglobin level (more than 30% missing data), oral
candidiasis and wasting (present in <10% of the patients). The final multiple Cox-regression
model, retaining only significant predictors and interactions, and correcting for missing data
using multiple imputations, revealed that patients of younger age (<30 years) were at higher
risk of attrition compared with older patients (≥30 years) [adjusted hazard ratio (aHR) for
attrition, (95% confidence interval) (95% CI) = 1.30 (1.14–1.47)]. Patients with baseline
WHO clinical stage of 3 or 4 had higher proportions of attrition compared with patients in
stages 1 and 2 [aHR (95%CI) = 1.12 (0.95–1.35) and 1.56 (1.29–1.88), respectively]. The
same was true for ambulatory (able to perform daily activities but not working) and
bedridden (not able to perform daily activities) (WHO 2006) patients compared with
working or active patients (able to perform usual work in or out of the house) [aHR (95%CI)
= 1.29 (1.09–1.54) and 1.54 (1.15–2.07), respectively]. Patients with a loss of more than
10% of body mass were at greater risk of attrition [aHR (95% CI) = 1.17 (1.00–1.38)]. The
probability of attrition decreased proportionally with an increase in CD4 count [aHR
(95%CI) = 0.88 (0.78–1.00) for every log (tenfold) increase].
At the programme level, community-based dispensing of ARV drugs was significantly
related to less attrition [aHR (95%CI) = 0.55 (0.30–1.01) for women and 0.40 (0.21–0.75)
for men] (Figure 2). This effect was particularly strong among males, with males and
females at facilities that offered community-based distribution having similar attrition
proportions [aHR (95%CI) = 0.95 (0.67–1.33)]. At sites without community distribution of
ART, however, males had a higher attrition risk than female [aHR (95% CI) = 1.33 (1.18–
1.50)]. In addition, government run facilities compared with faith-based or NGO facilities
were found to significantly predict attrition. No significant difference in retention was
observed between government and faith-based or NGO facilities during the first year of
operation. Attrition significantly increased over time in government facilities [aHR/year
(95%CI) = 1.17 (1.10–1.23)], but not in faith-based or NGO facilities [aHR/year (95% CI) =
1.03 (0.95–1.11)] resulting in an overall lower retention in government hospitals (Table 6).
A significant association was found between attrition and the number of randomly selected
patients for whom the patient chart could not be located. Sites that had more missing records
had less attrition (Table 5). Correcting the multiple Cox-regression model for the percentage
Koole et al. Page 7
Trop Med Int Health. Author manuscript; available in PMC 2016 January 25.
Author M
anuscriptA
uthor Manuscript
Author M
anuscriptA
uthor Manuscript

of selected records which were missing, by including this variable as a covariate, did not
significantly change the effect estimates for the predictors included in the final model (data
not shown).
Discussion
To date, most studies examining retention to ART care and treatment programmes focus on
individual pre-ART clinical predictors. This study makes an important contribution to our
understanding of ART retention by examining not only retention proportions across three
countries and 18 study sites, but by going beyond individual baseline clinical predictors of
attrition to examine the potential effect different programme characteristics may have on
retention.
Overall, retention proportions varied widely both across countries and study sites (25.8% to
90.4% at year 4 for example). These results are comparable to those from other studies in
sub-Saharan Africa settings (Coetzee et al. 2004; Ferradini et al. 2006; Calmy et al. 2006;
Weigel et al. 2012). These studies exemplify the challenges of defining retention in different
settings and systematically accessing information in clinics with different data collection
systems. Retention proportions are also greatly affected by the choice of LTFU definition
(Shepherd et al. 2013).
Many of the baseline clinical characteristics predictive of attrition reinforce findings from
other studies in sub-Saharan Africa, including younger age (<30 years), being male, having
a higher WHO clinical stage, weight loss of >10% of body mass, a lower CD4 cell count and
a poorer functional status (Coetzee et al. 2004; Ferradini et al. 2006; Calmy et al. 2006).
These findings reaffirm the need for early identification of HIV-infected individuals and
early initiation of ART. Increasing years of clinic operation, prior to when a patient initiated
ART, was also an independent risk factor for attrition. This finding has been confirmed by
other studies (Braitstein et al. 2006; Cornell et al. 2010). However, this effect was mainly
observed in government facilities and was not significant in facilities run by faith-based
organisations or NGOs. Rapid scaling-up may have considerably increased the workload for
government health workers. This in turn may have compromised the organisation of services
and quality of care provided. Faith-based and NGO facilities might have had better coping
mechanisms and funding to increase staff levels and to adapt their services and monitoring/
tracking systems to the increasing numbers of ART patients. The association between
attrition and older governmental programmes could also be partly explained by
misclassification of LTFU which, in reality, consists of unreported (silent) transfer to care
elsewhere (Geng et al. 2010). Initially, only hospital-based referral centres provided ART
treatment, but in the setting of rapid scale-up, patients often transferred to closer lower-level
facilities (Bedelu et al. 2007; Chan et al. 2010). Retention in an ART programme reflects a
number of heterogeneous outcomes including mortality, LTFU and transfer of care (both
silent and recorded). Geng et al. (2010) found that among 14 studies where outcomes in
some patients LTFU were reported, about 50% were in care elsewhere. This finding
highlights the importance of examining not only programme retention to specific ART
clinics, but also retention to care regardless of where the services are rendered.
Koole et al. Page 8
Trop Med Int Health. Author manuscript; available in PMC 2016 January 25.
Author M
anuscriptA
uthor Manuscript
Author M
anuscriptA
uthor Manuscript

The most important result of this study is that sites offering ARV drug dispensing in the
community had significantly greater programme retention. Of particular importance was the
effect of community-based ARV drug distribution on retention of men. As well established
in the literature (Geng et al. 2010; Ferradini et al. 2006; Cornell et al. 2009), being male is
an independent risk factor for attrition. However, in this study, this difference between the
sexes was only observed in sites without community distribution of ARV drugs, where
males were 30% more likely than females to experience attrition. In sites with community
ARV drug distribution, attrition proportions among both men and women were about 50%
smaller compared with women in sites without community distribution (the group with the
lowest attrition).
Greater retention in community-based ART programmes may be due to fewer patients
transferring out because many of the transfers seen to date are from initial centres to
community programmes (Bedelu et al. 2007; Chan et al. 2010). As noted above, these urban
centres probably had substantial unrecorded (silent) transfers with the rapid scale-up and
decentralisation of ART services (Geng et al. 2010).
What are the implications of these data regarding community-based distribution of ARV
drugs? Only four sites in this study had a system of community-based ARV drug
distribution. These systems varied from models where patients only pick up their ARV
drugs from a mobile point to models with mobile health posts with clinical check-up and
adherence counselling. However, most of these programmes still depended heavily on the
support of clinic-based staff for community-based ARV drug distribution.
Other models of community-based ART distribution, however, are emerging. In Rwanda,
for example, Rich et al. reported a retention rate of 92.3% after 2 years using a model with
intensive community-based treatment support that included ART distribution and directly
observed ART by community health workers (Rich et al. 2012). Other programmes use
trained HIV-infected peers (Community Care Coordinators) to visit ART patients monthly
and perform a systematic symptom review and dispense ARV drugs (Wools-Kaloustian et
al. 2009). In Mozambique, Medecins Sans Frontieres uses a Community ART model with
stable ART patients who dispense monthly ART and provide adherence and social support
to other ART clients in the community (Decroo et al. 2011). They reported retention rates of
97.5% after a median follow-up time of 13 months. The effectiveness of community
pharmacies where ART patients are trained to distribute ART at community distribution
points needs to be confirmed by further research (MSF & UNAIDS 2012). Although these
models are showing promising impact on retention, their feasibility and scalability still need
to be evaluated.
The implementation of the current WHO guidelines (WHO 2013) aims to increase ART
coverage and retention to save lives and to decrease HIV transmission. To achieve the
ambitious goal of universal coverage in rural Africa, treatment will need to expand to serve
communities beyond the reach of current clinics. The potential of decentralisation of ART
delivery (through mobile clinics and community pharmacies) and community participation
(through community health workers and the patients and their families) need to be explored
further.
Koole et al. Page 9
Trop Med Int Health. Author manuscript; available in PMC 2016 January 25.
Author M
anuscriptA
uthor Manuscript
Author M
anuscriptA
uthor Manuscript

Besides misclassification of transfer to care to LTFU, there are other limitations to this
study. Study sites were not randomly selected, and this could have introduced some
selection bias. However, the selection (performed in 2006) was conducted in consultation
with country-specific stakeholders and aimed to have a good balance of site characteristics
that might influence retention and adherence. The intrinsic differences among countries (for
example, in this study the majority of programmes with community-based distribution of
ARV drugs and programmes supported by faith-based or non-governmental organisations
were found in Uganda) could result in further confounding.
The strength of the current study is the use of consistent data collecting tools across diverse
sites and the possibility of controlling for individual patient characteristics. By design, our
research allowed studying interactions between programme level and individual
characteristics, as illustrated by the differential effects of community-based distribution of
ARV drugs between men and women. The design is less suited to study interactions between
programme level characteristics or differences between countries.
Other limitations relate mainly to the constraints of retrospective chart review and the
challenges of incomplete data (for example, WHO clinical stage and CD4 cell count) and the
absence of certain variables at some of the sites (for example, distance to the clinic). The
numbers of missing values for these variables are similar to numbers reported elsewhere
(May et al. 2010). They highlight the importance of strengthening data collection systems to
better respond and assess retention to care and treatment.
Because this was a retrospective chart review, other important structural predictors of
retention, such as mode of transport, educational level and income, could not be assessed.
The quality and completeness of the data varied among the study sites. Forster et al. (2008)
found that poor quality data were associated with poor retention. In this study, the sites with
a large proportion of missing records reported better retention proportions. While the
significant association between the number of missing records and retention may indicate
the presence of bias in this study, correcting for missing data did not change the conclusions.
This indicates the robustness of the findings.
Conclusion
Patient retention to an individual programme worsened over time especially among males,
younger persons and those with poor clinical indicators. Increased use of community
programmes for ART drug dispensing could be considered for broader implementation.
Acknowledgments
We wish to acknowledge the study participants and participating clinics for their critical role in this study. This research was been supported by PEPFAR through CDC and HRSA. The views, opinions and content of this publication are those of the authors and do not necessarily reflect the views, opinions or policies of the CDC, HRSA or any other federal agency or office.
References
Altman DG, Bland JM. Time to event (survival) data. BMJ. 1998; 317:468–469. [PubMed: 9703534]
Koole et al. Page 10
Trop Med Int Health. Author manuscript; available in PMC 2016 January 25.
Author M
anuscriptA
uthor Manuscript
Author M
anuscriptA
uthor Manuscript

Bangsberg DR, Perry S, Charlebois ED, et al. Non-adherence to highly active antiretroviral therapy predicts progression to AIDS. AIDS. 2001; 15:1181–1183. [PubMed: 11416722]
Bedelu M, Ford N, Hilderbrand K, Reuter H. Implementing antiretroviral therapy in rural communities: the Lusikisiki model of decentralized HIV/AIDS care. Journal of Infectious Diseases. 2007; 196(Suppl. 3):S464–S468. [PubMed: 18181695]
Braitstein P, Brinkhof MW, Dabis F, et al. Mortality of HIV-1-infected patients in the first year of antiretroviral therapy: comparison between low-income and high-income countries. Lancet. 2006; 367:817–824. [PubMed: 16530575]
Calmy A, Pinoges L, Szumilin E, et al. Generic fixed-dose combination antiretroviral treatment in resource-poor settings: multicentric observational cohort. AIDS. 2006; 20:1163–1169. [PubMed: 16691068]
Chan AK, Mateyu G, Jahn A, et al. Outcome assessment of decentralization of antiretroviral therapy provision in a rural district of Malawi using an integrated primary care model. Tropical Medicine and International Health. 2010; 15(Suppl. 1):90–97. [PubMed: 20586966]
Coetzee D, Hildebrand K, Boulle A, et al. Outcomes after two years of providing antiretroviral treatment in Khayelitsha, South Africa. AIDS. 2004; 18:887–895. [PubMed: 15060436]
Collet, D. Modelling Surival Data in Medical Research. 2nd. Boca Raton, FL, USA: Chapmann & Hall/CRC Press; 2003.
Cornell M, Myer L, Kaplan R, Bekker LG, Wood R. The impact of gender and income on survival and retention in a South African antiretroviral therapy programme. Tropical Medicine and International Health. 2009; 14:722–731. [PubMed: 19413745]
Cornell M, Grimsrud A, Fairall L, et al. Temporal changes in programme outcomes among adult patients initiating antiretroviral therapy across South Africa, 2002–2007. AIDS. 2010; 24:2263–2270. [PubMed: 20683318]
Decroo T, Telfer B, Biot M, et al. Distribution of antiretroviral treatment through self-forming groups of patients in tete province, mozambique. Journal of Acquired Immune Deficiency Syndromes. 2011; 56:e39–e44. [PubMed: 21084990]
Ferradini L, Jeannin A, Pinoges L, et al. Scaling up of highly active antiretroviral therapy in a rural district of Malawi: an effectiveness assessment. Lancet. 2006; 367:1335–1342. [PubMed: 16631912]
Forster M, Bailey C, Brinkhof MW, et al. Electronic medical record systems, data quality and loss to follow-up: survey of antiretroviral therapy programmes in resource-limited settings. Bulletin of the World Health Organization. 2008; 86:939–947. [PubMed: 19142294]
Fox MP, Rosen S. Patient retention in antiretroviral therapy programs up to three years on treatment in sub-Saharan Africa, 2007–2009: systematic review. Tropical Medicine and International Health. 2010; 15(Suppl. 1):1–15. [PubMed: 20586956]
Geng EH, Nash D, Kambugu A, et al. Retention in care among HIV-infected patients in resource-limited settings: emerging insights and new directions. Current HIV/AIDS Reports. 2010; 7:234–244. [PubMed: 20820972]
Giordano TP, Gifford AL, White AC Jr, et al. Retention in care: a challenge to survival with HIV infection. Clinical Infectious Diseases. 2007; 44:1493–1499. [PubMed: 17479948]
Hogg RS, Heath K, Bangsberg D, et al. Intermittent use of triple-combination therapy is predictive of mortality at baseline and after 1 year of follow-up. AIDS. 2002; 16:1051–1058. [PubMed: 11953472]
Hougaard P. Frailty models for survival data. Lifetime Data Analysis. 1995; 1:255–273. [PubMed: 9385105]
Little RJA. Regression with missing X’s: a review. Journal of the American Statistical Association. 1992; 87:1227–1237.
May M, Boulle A, Phiri S, et al. Prognosis of patients with HIV-1 infection starting antiretroviral therapy in sub-Saharan Africa: a collaborative analysis of scale-up programmes. Lancet. 2010; 376:449–457. [PubMed: 20638120]
MSF and UNAIDS. Closer to Home: Delivering Antiretroviral Therapy in the Community: Experience From Four Countries in Southern Africa. Geneva, Switzerland: MSF and UNAIDS; 2012.
Koole et al. Page 11
Trop Med Int Health. Author manuscript; available in PMC 2016 January 25.
Author M
anuscriptA
uthor Manuscript
Author M
anuscriptA
uthor Manuscript

Nachega JB, Hislop M, Dowdy DW, et al. Adherence to nonnucleoside reverse transcriptase inhibitor-based HIV therapy and virologic outcomes. Annals of Internal Medicine. 2007; 146:564–573. [PubMed: 17438315]
Paterson DL, Swindells S, Mohr J, et al. Adherence to protease inhibitor therapy and outcomes in patients with HIV infection. Annals of Internal Medicine. 2000; 133:21–30. [PubMed: 10877736]
Pocock SJ, Clayton TC, Altman DG. Survival plots of time-to-event outcomes in clinical trials: good practice and pitfalls. Lancet. 2002; 359:1686–1689. [PubMed: 12020548]
Rich ML, Miller AC, Niyigena P, et al. Excellent clinical outcomes and high retention in care among adults in a community-based HIV treatment program in rural Rwanda. Journal of Acquired Immune Deficiency Syndromes. 2012; 59:e35–e42. [PubMed: 22156912]
Rosen S, Fox MP, Gill CJ. Patient retention in antiretroviral therapy programs in sub-Saharan Africa: a systematic review. PLoS Medicine. 2007; 4:e298. [PubMed: 17941716]
Royston P. Multiple imputation of missing values. Stata Journal. 2004; 4:227–241.
Shepherd BE, Blevins M, Vaz LM, et al. Impact of definitions of loss to follow-up on estimates of retention, disease progression, and mortality: application to an HIV program in Mozambique. American Journal of Epidemiology. 2013; 178:819–828. [PubMed: 23785113]
UNAIDS. The Gap Report. Geneva, Switzerland: UNAIDS; 2014.
Weigel R, Estill J, Egger M, et al. Mortality and loss to follow-up in the first year of ART: Malawi national ART programme. AIDS. 2012; 26:365–373. [PubMed: 22095194]
WHO. Patient Monitoring Guidelines for HIV Care and ART. Geneva, Switzerland: WHO; 2006.
WHO. Consolidated Guidelines on the Use Of Antiretroviral Drugs For Treating and Preventing HIV Infection. Recommendations for a Public Health Approach 2013. Geneva, Switzerland: WHO; 2013.
Wools-Kaloustian KK, Sidle JE, Selke HM, et al. A model for extending antiretroviral care beyond the rural health centre. Journal of the International AIDS Society. 2009; 12:12–22. [PubMed: 19591693]
Koole et al. Page 12
Trop Med Int Health. Author manuscript; available in PMC 2016 January 25.
Author M
anuscriptA
uthor Manuscript
Author M
anuscriptA
uthor Manuscript

Figure 1. Kaplan-Meier estimates by site in Tanzania, Uganda and Zambia.
Koole et al. Page 13
Trop Med Int Health. Author manuscript; available in PMC 2016 January 25.
Author M
anuscriptA
uthor Manuscript
Author M
anuscriptA
uthor Manuscript

Figure 2. Kaplan-Meier estimates by Community-Based Distribution (CBD) of ARVs in Tanzania,
Uganda and Zambia.
Koole et al. Page 14
Trop Med Int Health. Author manuscript; available in PMC 2016 January 25.
Author M
anuscriptA
uthor Manuscript
Author M
anuscriptA
uthor Manuscript

Author M
anuscriptA
uthor Manuscript
Author M
anuscriptA
uthor Manuscript
Koole et al. Page 15
Table 1
Patient characteristics at ART initiation in multicountry retention study
CharacteristicTanzania(n = 1458)
Uganda(n = 1472)
Zambia(n = 1217)
Total number ofparticipants(N = 4147)
Demographics
Age (years): median (IQR) 37 (31–43) 35 (30–41) 35 (30–42) 36 (30–42)
Age 18–29 years: n (%) 266 (18.2) 344 (23.4) 291 (23.9) 901 (21.7)
Age ≥30 years: n (%) 1191 (81.7) 1122 (76.2) 923 (75.8) 3236 (78.0)
Gender: n (%)
Male 484 (33.2) 504 (34.2) 488 (40.1) 1476 (35.6)
Female 974 (66.8) 968 (65.8) 728 (59.8) 2670 (64.4)
Distance from clinic: n (%)
<10 km 631 (43.3) 1073 (72.9) 212 (17.4) 1916 (46.2)
10–25 km 251 (17.2) 185 (12.6) 15 (1.2) 451 (10.9)
>25 km 461 (31.6) 139 (9.4) 13 (1.1) 613 (14.8)
Missing 115 (7.9) 75 (5.1) 977 (80.3) 1167 (28.1)
ART related
Year of ART initiation: n (%)
2003–2004 36 (2.5) 54 (3.7) 51 (4.2) 141 (3.4)
2005 232 (15.9) 226 (15.4) 188 (15.5) 646 (15.6)
2006 278 (19.1) 229 (15.6) 278 (22.8) 785 (18.9)
2007 287 (19.7) 337 (22.9) 336 (27.6) 960 (23.2)
2008 360 (24.7) 296 (20.1) 212 (17.4) 868 (20.9)
2009–2010 265 (18.2) 330 (22.4) 152 (12.5) 747 (18.1)
Years of clinic operation prior to ART initiation: n (%)
<1 year 286 (19.6) 183 (12.4) 72 (5.9) 541 (13.1)
≥1 to <2 years 312 (21.4) 196 (13.3) 196 (16.1) 704 (17.0)
≥2 to <3 years 272 (18.7) 325 (22.1) 305 (25.1) 902 (21.8)
≥3 to <4 years 341 (23.4) 304 (20.7) 277 (22.8) 922 (22.2)
≥4 to <5 years 196 (13.4) 207 (14.1) 211 (17.3) 614 (14.8)
≥5 years 51 (3.5) 257 (17.5) 156 (12.8) 464 (11.2)
Prior ART experience: n (%) 112 (7.7) 85 (5.8) 55 (4.5) 252 (6.1)
Prior exposure to NVP for PMTCT: n (%) 0 (0.0) 86 (8.9) 94 (12.9) 180 (6.7)
Starting ART regimen: n (%)
D4T-3TC-NVP 991 (68.0) 540 (36.7) 404 (33.2) 1935 (46.7)
D4T-3TC-EFV 86 (5.9) 23 (1.6) 79 (6.5) 188 (4.5)
ZDV-3TC-NVP 128 (8.8) 542 (36.8) 240 (19.7) 910 (21.9)
ZDV-3TC-EFV 230 (15.8) 257 (17.5) 96 (7.9) 583 (14.1)
TDF-3TC/FTC-NVP/EFV 7 (0.5) 93 (6.3) 354 (29.1) 454 (11.0)
PI based 2 (0.1) 13 (0.9) 8 (0.7) 23 (0.6)
Other 1 (0.1) 1 (0.1) 33 (2.7) 35 (0.8)
Missing/non-sensical 13 (0.9) 3 (0.2) 3 (0.3) 19 (0.5)
Trop Med Int Health. Author manuscript; available in PMC 2016 January 25.

Author M
anuscriptA
uthor Manuscript
Author M
anuscriptA
uthor Manuscript
Koole et al. Page 16
CharacteristicTanzania(n = 1458)
Uganda(n = 1472)
Zambia(n = 1217)
Total number ofparticipants(N = 4147)
CTX prophylaxis: n (%) 981 (67.3) 1186 (80.6) 724 (59.5) 2891 (69.7)
Clinical characteristics
WHO clinical stage at start: n (%)
WHO stage 1–2 301 (20.6) 639 (43.4) 394 (32.8) 1334 (32.2)
WHO stage 3 539 (37.0) 508 (34.5) 553 (45.4) 1600 (38.6)
WHO stage 4 325 (22.3) 160 (10.9) 112 (9.2) 597 (14.4)
Missing 293 (20.1) 165 (11.2) 158 (13.0) 616 (14.9)
Functional status: n (%)
Working/active 748 (51.3) 904 (61.4) 488 (40.1) 2140 (51.6)
Ambulatory 261 (17.9) 73 (5.0) 352 (28.9) 686 (16.5)
Bedridden 31 (2.1) 13 (0.9) 71 (5.8) 115 (2.8)
Missing 418 (28.7) 482 (32.7) 306 (25.1) 1206 (29.1)
Laboratory parameters
CD4 (cells/µl): median (IQR) 133 (59–206) 136 (65–202) 134 (67–217) 134 (63–206)
Missing: n (%) 337 (23.1) 303 (20.6) 366 (30.1) 1006 (24.3)
TLC (cells/µl): median (IQR) 1700 (1100–3000) 1400 (980–1970) 1200 (500–1900) 1400 (900–2230)
Missing: n (%) 903 (61.9) 1151 (78.2) 695 (57.1) 2749 (66.3)
Haemoglobin (g/dl) 10.2 (8.9–11.8) 11.9 (10.5–13.2) 10.6 (9.0–12.1) 11.0 (9.5–12.5)
Missing: n (%) 683 (46.8) 604 (41.0) 512 (42.1) 1799 (43.4)
Opportunistic infections
Weight loss >10%: n (%) 310 (21.3) 96 (6.5) 435 (35.7) 841 (20.3)
Chronic diarrhoea >1 month: n (%) 159 (10.9) 41 (2.8) 282 (23.2) 482 (11.6)
Fever >1 month: n (%) 287 (19.7) 80 (5.4) 246 (20.2) 613 (14.8)
Oral candidiasis: n (%) 103 (7.1) 76 (5.2) 90 (7.4) 269 (6.5)
Wasting syndrome: n (%) 135 (9.3) 34 (2.3) 40 (3.3) 209 (5.0)
Pulmonary TB: n (%) 171 (11.7) 151 (10.3) 169 (13.9) 491 (11.8)
ART, antiretroviral treatment; IQR, interquartile range; PMTCT, prevention mother-to-child transmission; NVP, nevirapine; 3TC, lamivudine; D4T, stavudine; ZDV, zidovudine; EFV, efavirenz; TDF, tenofovir, FTC, emtricitabine; PI, protease inhibitor; CTX, cotrimoxazole; TLC, total lymphocyte count; TB, tuberculosis.
Working/active: able to perform usual work in or out of the house; ambulatory: able to perform activities of daily living but not able to work; bedridden: not able to perform activities of daily living.
Wasting syndrome: weight loss of >10%, unexplained chronic diarrhoea >1 month and unexplained fever >1 month.
Data are missing for age and gender when the total number of patient was less than 4147.
Trop Med Int Health. Author manuscript; available in PMC 2016 January 25.

Author M
anuscriptA
uthor Manuscript
Author M
anuscriptA
uthor Manuscript
Koole et al. Page 17
Table 2
Site characteristics in multicountry retention study
CharacteristicTanzania
(n = 7)Uganda(n = 6)
Zambia(n = 5)
Totalnumber of
sites(N = 18)
General information
Level of health facility
National referral hospital 2 1 1 4
Provincial/regional Hospital 2 0 2 4
District hospital 3 1 2 6
Primary/community-based health care 0 4 0 4
Type of health facility
Government 4 1 4 9
Mission facility 3 1 1 5
Non-religious NGO 0 4 0 4
Setting
Urban 4 5 3 12
Rural/periurban 3 1 2 6
ART-related information
Year ART was started at facility
2003 1 2 2 5
2004 3 2 3 8
2005 2 2 0 4
2006 0 0 0 0
2007 1 0 0 1
Number of adults currently on ARVs
<2000 6 1 1 8
2000–4000 1 4 1 6
>4000 0 1 3 4
Home-based care
No 0 3 4 7
Yes 7 3 1 11
Physician-based care
No 2 1 0 3
Yes 5 5 5 15
ARV-dispensing characteristics
Buddy needed for ART initiation
No 0 0 3 3
Yes 7 6 2 15
Three counselling sessions needed for ART initiation
No 1 2 1 4
Yes 6 4 4 14
Trop Med Int Health. Author manuscript; available in PMC 2016 January 25.

Author M
anuscriptA
uthor Manuscript
Author M
anuscriptA
uthor Manuscript
Koole et al. Page 18
CharacteristicTanzania
(n = 7)Uganda(n = 6)
Zambia(n = 5)
Totalnumber of
sites(N = 18)
Visit frequency after 6 months on ARVs
Monthly 5 1 0 6
Every 2 months 0 4 4 8
Every 3 months 2 1 1 4
Community-based distribution of ARVs
No 7 3 4 14
Yes 0 3 1 4
Trop Med Int Health. Author manuscript; available in PMC 2016 January 25.
Author M
anuscriptA
uthor Manuscript
Author M
anuscriptA
uthor Manuscript
Koole et al. Page 19
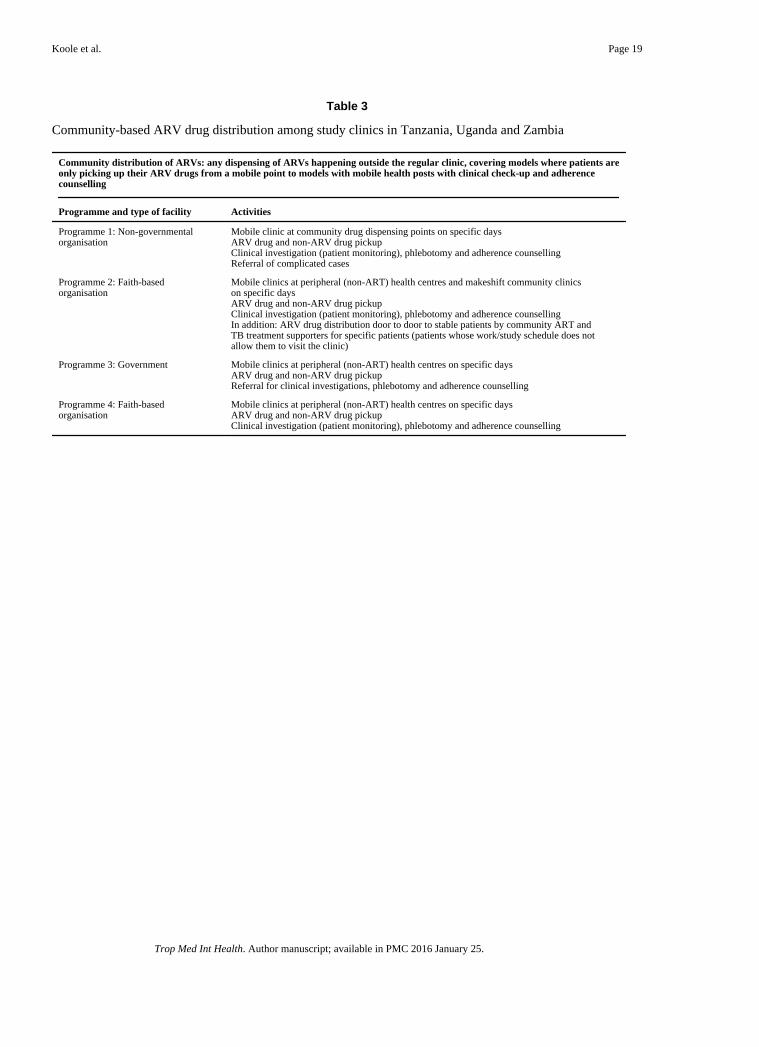
Table 3
Community-based ARV drug distribution among study clinics in Tanzania, Uganda and Zambia
Community distribution of ARVs: any dispensing of ARVs happening outside the regular clinic, covering models where patients areonly picking up their ARV drugs from a mobile point to models with mobile health posts with clinical check-up and adherencecounselling
Programme and type of facility Activities
Programme 1: Non-governmentalorganisation
Mobile clinic at community drug dispensing points on specific daysARV drug and non-ARV drug pickupClinical investigation (patient monitoring), phlebotomy and adherence counsellingReferral of complicated cases
Programme 2: Faith-basedorganisation
Mobile clinics at peripheral (non-ART) health centres and makeshift community clinicson specific daysARV drug and non-ARV drug pickupClinical investigation (patient monitoring), phlebotomy and adherence counsellingIn addition: ARV drug distribution door to door to stable patients by community ART andTB treatment supporters for specific patients (patients whose work/study schedule does notallow them to visit the clinic)
Programme 3: Government Mobile clinics at peripheral (non-ART) health centres on specific daysARV drug and non-ARV drug pickupReferral for clinical investigations, phlebotomy and adherence counselling
Programme 4: Faith-basedorganisation
Mobile clinics at peripheral (non-ART) health centres on specific daysARV drug and non-ARV drug pickupClinical investigation (patient monitoring), phlebotomy and adherence counselling
Trop Med Int Health. Author manuscript; available in PMC 2016 January 25.

Author M
anuscriptA
uthor Manuscript
Author M
anuscriptA
uthor Manuscript
Koole et al. Page 20
Tab
le 4
Indi
vidu
al p
redi
ctor
s of
attr
ition
in m
ultic
ount
ry r
eten
tion
stud
y
N
Ret
enti
on p
ropo
rtio
nH
azar
d ra
tio
(95%
CI)
P-v
alue
†1
year
2 ye
ars
3 ye
ars
Tot
al41
47
Dem
ogra
phic
s
Age
at s
tart
AR
T
1
8–29
yea
rs90
177
.469
.762
.81
0.00
1
≥
30 y
ears
3236
79.1
71.7
67.0
0.81
(0.
71, 0
.92)
Sex
F
emal
e26
7080
.673
.668
.51
<0.
001
M
ale
1476
75.1
67.1
61.4
1.26
(1.
13, 1
.41)
Dis
tanc
e to
clin
ic (
/10
km)
––
–1.
03 (
1.01
, 1.0
5)0.
007
AR
T-r
elat
ed a
nd o
ther
trea
tmen
t rel
ated
pre
dict
ors
Pri
or A
RT
exp
erie
nce
N
o38
9578
.871
.466
.10.
86 (
0.68
, 1.0
8)
Y
es25
276
.968
.563
.51
0.18
7
Pri
or e
xpos
ure
to N
VP
for
PMT
CT
N
o17
5379
.973
.067
.31
0.32
6
Y
es18
092
.184
.580
.00.
78 (
0.53
, 1.1
3)
M
issi
ng73
875
.167
.161
.40.
92 (
0.77
, 1.1
1)
Yea
rs s
ince
AR
T s
tart
ed a
t pro
gram
me
(/ye
ar)
––
–1.
10 (
1.05
, 1.1
5)<
0.00
1
TB
trea
tmen
t
N
o33
2780
.373
.468
.91
0.13
1
Y
es38
675
.867
.659
.01.
11 (
0.92
, 1.3
3)
M
issi
ng43
468
.858
.851
.11.
17 (
0.99
, 1.3
9)
CT
X p
roph
ylax
is
N
o69
380
.473
.368
.50.
96 (
0.82
, 1.1
2)
Y
es28
9176
.369
.262
.71
0.81
0
M
issi
ng56
372
.863
.457
.71.
02 (
0.86
, 1.2
0)
Clin
ical
Cha
ract
eris
tics
at A
RT
sta
rt
Trop Med Int Health. Author manuscript; available in PMC 2016 January 25.

Author M
anuscriptA
uthor Manuscript
Author M
anuscriptA
uthor Manuscript
Koole et al. Page 21N
Ret
enti
on p
ropo
rtio
nH
azar
d ra
tio
(95%
CI)
P-v
alue
†1
year
2 ye
ars
3 ye
ars
WH
O s
tage
at s
tart
AR
T
I
& I
I13
3486
.980
.073
.61
<0.
001
I
II16
0078
.570
.865
.81.
20 (
1.03
, 1.3
9)
I
V59
762
.555
.552
.41.
98 (
1.66
, 2.3
7)
M
issi
ng61
676
.668
.862
.91.
29 (
1.07
, 1.5
5)
Fun
ctio
nal s
tatu
s
W
orki
ng/a
ctiv
e21
4084
.077
.872
.81
<0.
001
A
mbu
lato
ry68
666
.254
.648
.41.
69 (
1.45
, 1.9
7)
B
edri
dden
115
51.4
47.4
44.7
2.61
(2.
00, 3
.41)
M
issi
ng12
0678
.971
.566
.01.
28 (
1.10
, 1.5
0)
CD
4 (l
og)
––
–0.
64 (
0.49
, 0.8
4)<
0.00
1
TL
C (
cells
/µl)
<
1200
cel
ls/µ
l58
172
.765
.058
.21.
21 (
1.00
, 1.4
6)
≥
1200
cel
ls/µ
l81
776
.668
.763
.71
<0.
001
M
issi
ng27
4980
.673
.468
.30.
86 (
0.74
, 1.0
1)
Hae
mog
lobi
n (g
/dl)
<
10 g
/dl
803
69.3
61.9
57.3
1.43
(1.
23, 1
.67)
≥
10 g
/dl
1545
84.1
77.3
72.1
1<
0.00
1
M
issi
ng17
9978
.270
.364
.70.
93 (
0.81
, 1.0
8)
Wei
ght l
oss
>10
%
N
o33
0680
.373
.267
.81
<0.
001
Y
es84
172
.163
.858
.71.
32 (
1.13
, 1.5
4)
Chr
onic
dia
rrho
ea >
1 m
onth
N
o36
6579
.371
.866
.21
0.65
1
Y
es48
274
.067
.464
.11.
04 (
0.87
, 1.2
6)
Fev
er >
1 m
onth
N
o35
3479
.972
.767
.01
0.06
2
Y
es61
371
.763
.159
.81.
16 (
0.99
, 1.3
6)
Ora
l can
didi
asis
N
o38
7879
.171
.466
.41
0.05
1
Trop Med Int Health. Author manuscript; available in PMC 2016 January 25.

Author M
anuscriptA
uthor Manuscript
Author M
anuscriptA
uthor Manuscript
Koole et al. Page 22N
Ret
enti
on p
ropo
rtio
nH
azar
d ra
tio
(95%
CI)
P-v
alue
†1
year
2 ye
ars
3 ye
ars
Y
es26
972
.269
.360
.71.
24 (
1.00
, 1.5
4)
Was
ting
synd
rom
e
N
o39
3879
.772
.266
.81
<0.
001
Y
es20
959
.154
.050
.52.
0 (1
.56,
2.5
7)
Pul
mon
ary
TB
N
o36
5679
.071
.466
.21
0.96
5
Y
es49
176
.369
.964
.21.
00 (
0.85
, 1.1
9)
AR
T, a
ntir
etro
vira
l tre
atm
ent;
CI,
con
fide
nce
inte
rval
; PM
TC
T, p
reve
ntio
n m
othe
r-to
-chi
ld tr
ansm
issi
on; N
VP,
nev
irap
ine;
CT
X, c
o-tr
imox
azol
e; T
LC
, tot
al ly
mph
ocyt
e co
unt;
TB
, tub
ercu
losi
s.
Was
ting
synd
rom
e: w
eigh
t los
s of
>10
%, u
nexp
lain
ed c
hron
ic d
iarr
hoea
>1
mon
th a
nd u
nexp
lain
ed f
ever
>1
mon
th.
Dat
a ar
e m
issi
ng f
or a
ge a
nd g
ende
r w
hen
the
tota
l num
ber
of p
atie
nt w
as le
ss th
an 4
147.
† P-va
lue
from
uni
vari
ate
Cox
reg
ress
ion
mod
els
desc
ribi
ng th
e ef
fect
s of
eac
h in
divi
dual
pre
dict
or w
ithou
t cor
rect
ion
for
othe
r fa
ctor
s, a
djus
ting
for
site
usi
ng s
hare
d fr
ailty
met
hods
.
Trop Med Int Health. Author manuscript; available in PMC 2016 January 25.

Author M
anuscriptA
uthor Manuscript
Author M
anuscriptA
uthor Manuscript
Koole et al. Page 23
Tab
le 5
Prog
ram
me
leve
l pre
dict
ors
of a
ttriti
on in
mul
ticou
ntry
ret
entio
n st
udy
Nr
Site
sN
rP
atie
nts
Ret
enti
on p
ropo
rtio
n
Haz
ard
rati
o (9
5% C
I)P
-val
ue*
1 ye
ar2
year
s3
year
s
Cou
ntry
Tan
zani
a7
1458
71.0
62.7
58.3
10.
005
Uga
nda
614
7290
.585
.381
.50.
35 (
0.19
, 0.6
2)
Zam
bia
512
1773
.264
.356
.81.
05 (
0.57
, 1.9
2)
Gen
eral
hea
lth f
acili
ty c
hara
cter
istic
s
Lev
el o
f he
alth
fac
ility
N
atio
nal r
efer
ral h
ospi
tal
474
976
.967
.361
.81
0.04
3
P
rovi
ncia
l/reg
iona
l hos
pita
l4
980
71.7
63.5
55.6
1.25
(0.
57, 2
.74)
D
istr
ict h
ospi
tal
614
3275
.267
.163
.01.
17 (
0.57
, 2.3
9)
P
rim
ary
heal
th c
entr
e/co
mm
unity
bas
ed4
986
91.8
87.8
83.4
0.37
(0.
17, 0
.82)
Typ
e of
hea
lth f
acili
ty
G
over
nmen
t9
2188
71.0
61.6
55.1
10.
007
M
issi
on (
faith
bas
ed)
597
385
.580
.575
.90.
44 (
0.24
, 0.7
9)
N
on-r
elig
ious
NG
O4
986
88.8
83.0
79.1
0.35
(0.
19, 0
.67)
Set
ting
R
ural
/per
iurb
an6
1441
74.2
66.7
62.7
10.
383
U
rban
1227
0681
.073
.767
.80.
74 (
0.38
, 1.4
5)
Num
ber
of a
dults
on
AR
Vs
<
2000
817
0374
.466
.762
.71
0.72
6
2
000–
4000
614
7483
.777
.372
.10.
74 (
0.36
, 1.5
3)
>
4000
497
078
.470
.161
.10.
93 (
0.41
, 2.1
1)
Hom
e-ba
sed
care
N
o7
1732
77.2
68.7
62.0
10.
625
Y
es11
2415
79.7
73.1
69.0
0.85
(0.
44, 1
.63)
Phy
sici
an-b
ased
car
e
N
o3
711
72.5
63.3
58.4
10.
308
Y
es15
3436
79.9
72.8
67.5
0.66
(0.
28, 1
.51)
Trop Med Int Health. Author manuscript; available in PMC 2016 January 25.

Author M
anuscriptA
uthor Manuscript
Author M
anuscriptA
uthor Manuscript
Koole et al. Page 24N
rSi
tes
Nr
Pat
ient
s
Ret
enti
on p
ropo
rtio
n
Haz
ard
rati
o (9
5% C
I)P
-val
ue*
1 ye
ar2
year
s3
year
s
AR
V-d
ispe
nsin
g C
hara
cter
istic
s
Bud
dy n
eede
d fo
r A
RT
initi
atio
n
N
o3
744
67.0
56.6
46.6
10.
078
Y
es15
3403
81.2
74.6
70.5
0.50
(0.
23, 1
.11)
Thr
ee c
ouns
ellin
g se
ssio
ns n
eede
d fo
r A
RT
initi
atio
n
N
o4
871
81.6
74.1
69.0
10.
614
Y
es14
3276
77.9
70.5
65.1
1.22
(0.
57, 2
.64)
Ref
ill f
requ
ency
(af
ter
6 m
onth
s)
M
onth
ly6
1223
74.0
65.8
61.6
10.
856
E
very
2 m
onth
s8
1978
80.9
74.0
67.6
0.83
(0.
40, 1
.72)
E
very
3 m
onth
s4
946
80.0
72.5
68.6
0.82
(0.
34, 1
.96)
AR
V d
rug
disp
ensi
ng in
com
mun
ity
N
o14
3190
74.4
66.0
60.2
10.
004
Y
es4
957
92.6
88.2
84.1
0.32
(0.
17, 0
.61)
Sam
plin
g
Per
cent
age
of s
elec
ted
patie
nt c
hart
s no
t fou
nd
<
10%
614
6563
.653
.545
.61
<0.
001
≥
10%
to <
20%
614
7588
.182
.478
.60.
31 (
0.21
, 0.5
4)
>
20%
612
0785
.178
.373
.70.
37 (
0.22
, 0.6
2)
AR
T, a
ntir
etro
vira
l tre
atm
ent;
AR
V, a
ntir
etro
vira
l; C
I, c
onfi
denc
e in
terv
al.
* P-v
alue
fro
m C
ox r
egre
ssio
n m
odel
s de
scri
bing
the
effe
cts
of e
ach
prog
ram
me
leve
l cha
ract
eris
tic, c
orre
ctin
g fo
r im
bala
nces
in p
atie
nt c
hara
cter
istic
s be
twee
n si
tes
and
adju
stin
g fo
r si
te u
sing
sha
red
frai
lty m
etho
ds.
Trop Med Int Health. Author manuscript; available in PMC 2016 January 25.

Author M
anuscriptA
uthor Manuscript
Author M
anuscriptA
uthor Manuscript
Koole et al. Page 25
Table 6
Final multivariate model for predictors of attrition in multicountry retention study*
Adjusted hazardratio (95% CI)
Individual characteristics
Age at start ART: <30 years (vs. ≥30 years) 1.30 (1.14, 1.47)
WHO stage at start ART
III vs. I & II 1.12 (0.95, 1.31)
IV vs. I & II 1.56 (1.29, 1.88)
Weight loss >10% 1.17 (1.00, 1.38)
CD4 count (/log [tenfold] increase) 0.88 (0.78, 1.00)
Functional status
Ambulatory vs. working/active 1.29 (1.09, 1.54)
Bedridden vs. working/active 1.54 (1.15, 2.07)
Sex (men vs. women)
In sites without community 1.33 (1.18, 1.50)
ARV drug dispensing
In sites with community 0.95 (0.67, 1.33)
ARV drug dispensing
Years of clinic operation by Type of health facility (/year)
Government facility 1.17 (1.10, 1.23)
Mission facility/non-religious NGO 1.03 (0.95, 1.11)
Programme characteristics
ARV drug dispensing in community by Sex
For women 0.55 (0.30, 1.01)
For men 0.40 (0.21, 0.75)
Type of health facility: Faith-basedfacility or NGO vs. Government(at start of the programme)
0.71 (0.42, 1.21)
ART, antiretroviral treatment; ARV, antiretroviral; CI, confidence interval; NGO: non-governmental organisation.
Working/active: able to perform usual work in or out of the house; ambulatory: able to perform activities of daily living but not able to work; bedridden: not able to perform activities of daily living.
*The model was simplified using Akaike’s Information Criterion, retaining predictors and clinically plausible interaction terms that increased
model fit, with a penalisation for increasing model complexity.
Trop Med Int Health. Author manuscript; available in PMC 2016 January 25.