retail strategy review - city of · pdf filecity of whitehorse retail strategy review prepared...
TRANSCRIPT

City of Whitehorse Retail Strategy Review
Prepared for City of Whitehorse MacroPlan Australia Pty Ltd August 2010 1
1
PREPARED FOR THE LOCAL GOVERNMENT ASSOCIATION OF SOUTH AUSTRALIA
Retail Strategy Review
Prepared for City of Whitehorse MacroPlan Australia Pty Ltd October 2010
MACROPLAN AUSTRALIA PTY LTDSYDNEY | MELBOURNE | BRISBANE | PERTH

City of Whitehorse Retail Strategy Review
Prepared for City of Whitehorse MacroPlan Australia Pty Ltd August 2010 2
Signed*
………………………………… DATE: OCTOBER 2010
Project Director
Richard Brice General Manager Economics and Research
[email protected] www.macroplan.com.au
CONTACT
MacroPlan Australia Pty Ltd Level 4, 356 Collins Street, Melbourne, Vic. 3000 t 03 9600 0500 f 03 9600 1477
© MacroPlan Australia Pty Ltd All Rights Reserved. No part of this document may be reproduced, transmitted, stored in a retrieval system, or translated into any language in any form by any means without the written permission of MacroPlan Australia Pty Ltd. All Rights Reserved. All methods, processes, commercial proposals and other contents described in this document are the confidential intellectual property of MacroPlan Australia Pty Ltd and may not be used or disclosed to any party without the written permission of MacroPlan Australia Pty Ltd
MACROPLAN AUSTRALIA PTY LTD SYDNEY | MELBOURNE | BRISBANE | PERTH
Project Contact
Justin Malkiewicz Manager Activity Centres
City of Whitehorse
Retail Strategy Review
Prepared for City of Whitehorse MacroPlan Australia Pty Ltd August 2010 3
EXECUTIVE SUMMARY ....................................................................................................... 5
INTRODUCTION 5 POLICY AND LITERATURE REVIEW .......................................................................................................... 6 STAKEHOLDER CONSULTATION ............................................................................................................. 7 POPULATION AND SOCIO-ECONOMIC CHARACTERISTICS ......................................................................... 8 RETAIL SUPPLY ANALYSIS ..................................................................................................................... 8 RETAIL DEMAND ANALYSIS ................................................................................................................... 9 KEY WHITEHORSE ACTIVITY CENTRES .................................................................................................. 11 POLICY AND ACTIONS ........................................................................................................................ 13
1 INTRODUCTION .......................................................................................... 18
1.1 PURPOSE OF STUDY ................................................................................................... 18 1.2 METHODOLOGY OVERVIEW ......................................................................................... 18 1.3 LOCATION AND CONTEXT ............................................................................................ 19 1.4 REPORT STRUCTURE .................................................................................................. 20 1.5 INFORMATION SOURCES ............................................................................................. 21 1.6 ABBREVIATIONS ......................................................................................................... 21 1.7 DISCLAIMER ............................................................................................................... 22
2 POLICY AND LITERATURE REVIEW........................................................... 23
2.1 STATE PLANNING POLICY FRAMEWORK ........................................................................ 23 2.2 LOCAL PLANNING POLICY FRAMEWORK (LPPF) ........................................................... 25 2.3 LOCAL PLANNING POLICY FRAMEWORK – SPECIFIC CENTRES ........................................ 27
3 STAKEHOLDER CONSULTATION .............................................................. 32
3.1 RETAIL BUSINESS SURVEYS......................................................................................... 32 3.2 IN CENTRE SURVEY ..................................................................................................... 36 3.3 WHITEHORSE RESIDENT SURVEY ................................................................................. 39 3.4 BUSINESS ASSOCIATIONS ........................................................................................... 44 3.5 SUMMARY.................................................................................................................. 45
4 POPULATION AND SOCIO-ECONOMIC CHARACTERISTICS .................. 47
4.1 POPULATION TRENDS ................................................................................................. 47 4.2 DEMOGRAPHIC AND SOCIO-ECONOMIC TRENDS ........................................................... 48 4.3 EMPLOYMENT TRENDS ................................................................................................ 51 4.4 JOURNEY TO WORK .................................................................................................... 51 4.5 SUMMARY.................................................................................................................. 52
5 RETAIL SUPPLY ANALYSIS ........................................................................ 53
5.1 SUPPLY DEFINITIONS .................................................................................................. 53 5.2 EXISTING SUPPLY ....................................................................................................... 53 5.3 RETAIL FLOOR SPACE BY TYPE .................................................................................... 60 5.4 FUTURE & PLANNED CENTRES .................................................................................... 61 5.5 SUPPLY CONCLUSIONS ............................................................................................... 62
6 RETAIL DEMAND ANALYSIS ...................................................................... 63
6.1 TRADE AREAS ............................................................................................................ 63 6.2 POPULATION .............................................................................................................. 65 6.3 RETAIL EXPENDITURE PROFILE .................................................................................... 66 6.4 RETAIL FLOOR SPACE DEMAND ................................................................................... 67 6.5 WORKER AND BEYOND TRADE EXPENDITURE ............................................................... 70 6.6 RETAIL POTENTIAL ...................................................................................................... 72 6.7 RETAIL DEMAND CONCLUSIONS .................................................................................. 72
Contents
City of Whitehorse
Retail Strategy Review
Prepared for City of Whitehorse MacroPlan Australia Pty Ltd August 2010 4
7 KEY WHITEHORSE ACTIVITY CENTRES ................................................... 73
7.1 KEY CENTRE ANALYSIS METHODOLOGY ....................................................................... 73 7.2 BOX HILL CENTRAL ACTIVITIES DISTRICT ...................................................................... 77 7.3 NUNAWADING/MEGAMILE MAJOR ACTIVITY CENTRE ..................................................... 83 7.4 FOREST HILL CHASE ACTIVITY CENTRE ........................................................................ 88 7.5 KMART / EAST BURWOOD PLAZA PRECINCT ................................................................. 93 7.6 KEY CENTRE SUMMARY .............................................................................................. 97
8 POLICY AND ACTIONS ............................................................................... 99
8.1 GUIDING PRINCIPLES .................................................................................................. 99 8.2 UNDERTAKING A RETAIL SUSTAINABILITY ASSESSMENT ................................................ 100 8.3 TRIGGER POINTS FOR A RETAIL SUSTAINABILITY ASSESSMENT BY HIERARCHY ................. 101 8.4 SPECIFIC POLICY INITIATIVES APPLYING TO THE LOCAL PLANNING POLICY ..................... 103 8.5 SPECIFIC ACTIONS BY CENTRE .................................................................................. 104 8.6 CONCLUDING RECOMMENDATIONS ........................................................................... 108
APPENDIX A – WHITEHORSE RETAIL PRECINCTS ...................................................... 109
City of Whitehorse
Retail Strategy Review
Prepared for City of Whitehorse MacroPlan Australia Pty Ltd August 2010 5
Executive Summary
Introduction
MacroPlan Australia has been commissioned by the Whitehorse City Council to research, develop and finalise a Retail Strategy for the City of Whitehorse. MacroPlan has also been commissioned to develop the recommendations and guidelines for those policies which are impacted as a result of the Whitehorse Retail Strategy.
A considerable amount of market surveying and research was completed in the initial stages of this study to collect data that guided MacroPlan in the development of the Whitehorse Retail Strategy.
This assessment includes an examination of strategic and statutory planning mechanisms; population and demographics of residents within the Whitehorse LGA; current levels of retail supply and demand; qualitative evaluations of the businesses, consumers and residents; and a detailed development strategy for key centres in the City of Whitehorse.
Included in the project scope is the development of a recommended future retail policy framework that will guide the development of relevant sections of Councils Local Planning Policy Framework (LPPF).
Models used in the report include but are not limited to:
• future population projection analysis,
• employment projection analysis,
• journey to work modelling,
• retail demand and floor space requirement analysis,
• centre catchment and retail expenditure modelling, and
• Centre competitiveness modelling.
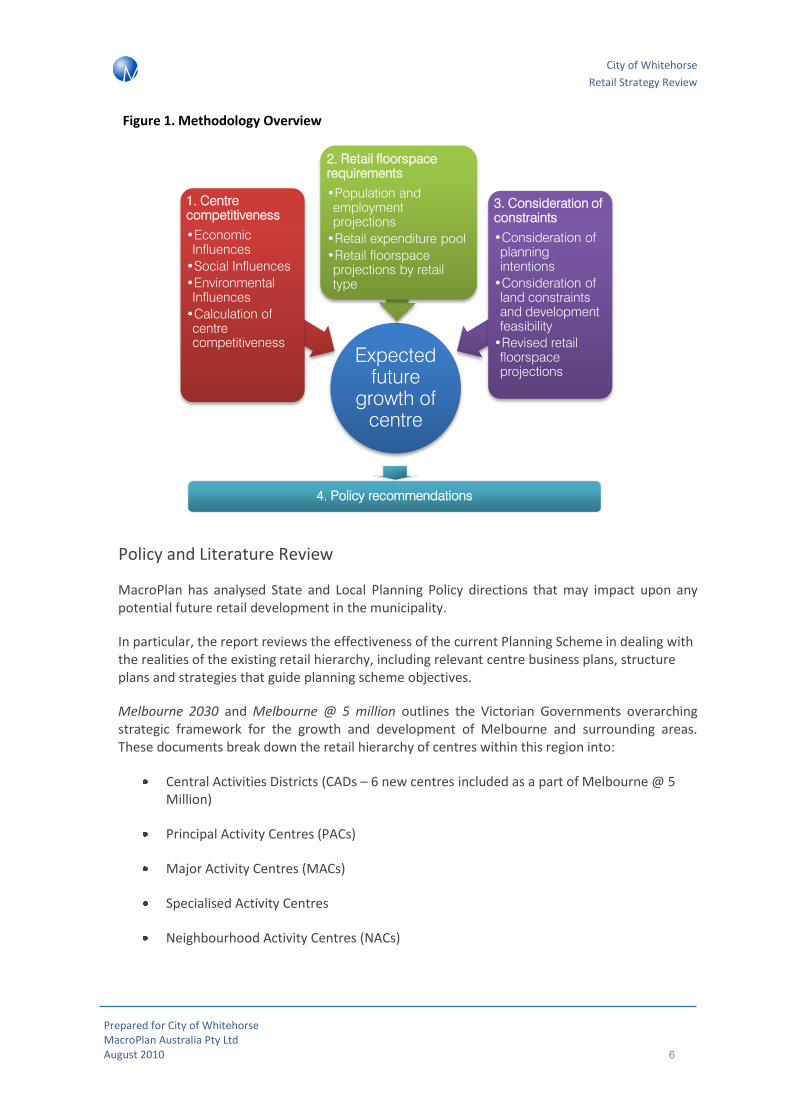
An overview of the methodology approach to this retail strategy appears in the figure below.
It depicts how the competitiveness of key retail centres is considered according to a triple bottom line framework with input from primary market research including business consultation and shopper surveys.
Future retail floorspace requirements are assessed subject to a review of population and employment in each centres catchment as well as consideration of incomes and the ability of the centres retailers to retain retail expenditure pools (i.e. what is the centres likely market share).
Policy recommendations are also considered based on any constraints a centre may face in regard to development feasibility, building restrictions; land availability, policy directions etc.
City of Whitehorse
Retail Strategy Review
Prepared for City of Whitehorse MacroPlan Australia Pty Ltd August 2010 6
Figure 1. Methodology Overview
Policy and Literature Review
MacroPlan has analysed State and Local Planning Policy directions that may impact upon any potential future retail development in the municipality.
In particular, the report reviews the effectiveness of the current Planning Scheme in dealing with the realities of the existing retail hierarchy, including relevant centre business plans, structure plans and strategies that guide planning scheme objectives.
Melbourne 2030 and Melbourne @ 5 million outlines the Victorian Governments overarching strategic framework for the growth and development of Melbourne and surrounding areas. These documents break down the retail hierarchy of centres within this region into:
Central Activities Districts (CADs – 6 new centres included as a part of Melbourne @ 5 Million)
Principal Activity Centres (PACs)
Major Activity Centres (MACs)
Specialised Activity Centres
Neighbourhood Activity Centres (NACs)
Expected future
growth of centre
1. Centre competitiveness
•Economic Influences
•Social Influences
•Environmental Influences
•Calculation of centre competitiveness
2. Retail floorspace requirements
•Population and employment projections
•Retail expenditure pool
•Retail floorspace projections by retail type
3. Consideration of constraints
•Consideration of planning intentions
•Consideration of land constraints and development feasibility
•Revised retail floorspace projections
4. Policy recommendations
City of Whitehorse
Retail Strategy Review
Prepared for City of Whitehorse MacroPlan Australia Pty Ltd August 2010 7
Depending on the strategic importance of the centre hierarchy there will be more of a focus on commercial, retail, higher order personal services, entertainment, education, government and tourism.
Box Hill has been designated as a CAD and for this reason has a large amount of future strategic importance to Whitehorse and metropolitan Melbourne more generally.
MacroPlan notes the importance of the centre hierarchy, specifically considering:
Box Hill Central Activities District
Nunawading/MegaMile Major Activity Centre
Forest Hill Major Activity Centre
Expansion of the Kmart / East Burwood Plaza Activity Centre to become of Major Activity Centre Status within the municipality.
Burwood Heights Major Activity Centre
The body of the report summarises relevant planning directions including the Planning Scheme in more detail and, where appropriate, have been commented on in the final section of the report where making future policy recommendations.
Stakeholder Consultation
As part of a qualitative review of centres in the City of Whitehorse, MacroPlan conducted a number of surveys across businesses, consumers and residents to better understand the needs, desires and characteristics of stakeholders for retail centres within the municipality.
The survey indicated that Whitehorse was facing a positive economic environment over the future six months, with more businesses seeking to employ additional staff than those who are looking to reduce employment. Businesses pointed to parking availability and economic conditions as issues and potential threats to their business.
Residents also outlined parking as the most dissatisfying aspect to shopping at centres within the municipality and there was also a low ‘positive’ reaction to the level of afterhours service provided.
The results of all three surveys were generally positive, revealing a well-functioning retail sector throughout the Whitehorse LGA. Overall, Whitehorse is viewed by respondents as a desirable shopping destination and by business owners as a good place to do business.
The primary issues of concern for local business owners revolve around the state of the economy and not around issues for which Council is responsible. Issues of concern that may be addressed by Council involve increasing convenient car parking and providing additional signage which may have the additional benefit of contributing to the identity of the centre.
The responses from the users of the centres provided an important link to the quantitative and strategic aspects of this report and assisted in the final policy recommendations.

City of Whitehorse
Retail Strategy Review
Prepared for City of Whitehorse MacroPlan Australia Pty Ltd August 2010 8
Population and Socio-economic Characteristics
MacroPlan has provided an analysis of the demographic and socio-economic characteristics of the municipality of Whitehorse. The purpose of this analysis is to provide a statistical and contextual framework for the assessment of retail market supply and demand conditions across a range of key sectors, as well as assisting in the identification of the role and function of centres across the City of Whitehorse.
Specifically, key indicators of demand have been reviewed, including:
• Population and Demographics: Historical population growth, age distribution, ethnicity, trends in household size, tenure type, household structure
• Socio-economic status: Individual and household income, Socio-Economic Index for Areas (SEIFA)
• Labour Force: Unemployment rates, occupation of the resident labour force
• Travel and Movements: Public transport usage, journey to work patterns
The City of Whitehorse is characterised by a diverse population both in age and ethnicity with a greater percentage of residents 65+ years than metropolitan Melbourne and almost one third of the population born abroad. However, compared to the metropolitan region, the area is comprised of an average population from a socio-economic perspective. In particular, residents in Whitehorse had similar taxable incomes compared to greater Melbourne. SEIFA scores in the area were 1,066 (where the mean score is 1,000) despite a median individual taxable income that was below the metropolitan average.
Generally residents are less likely to be renters and purchasers compared to the metropolitan region. This corresponds with the older population that have generally transitioned out of the rental phase of the housing life cycle. High incomes in the study area correlate with a significant capacity for retail expansion on discretionary goods (i.e. retail tenancies located in larger centres).
Retail Supply Analysis
The study investigated the amount and form of supply in the City of Whitehorse, focussing on the four key centres, but also assessing the retail floor space supply across the municipality as a whole, then comparing it to demand for retail floor space. Furthermore, the report outlines the types of centres within the Whitehorse LGA and considers the potential, if any, for further additions to floor space in the future.
City of Whitehorse
Retail Strategy Review
Prepared for City of Whitehorse MacroPlan Australia Pty Ltd August 2010 9
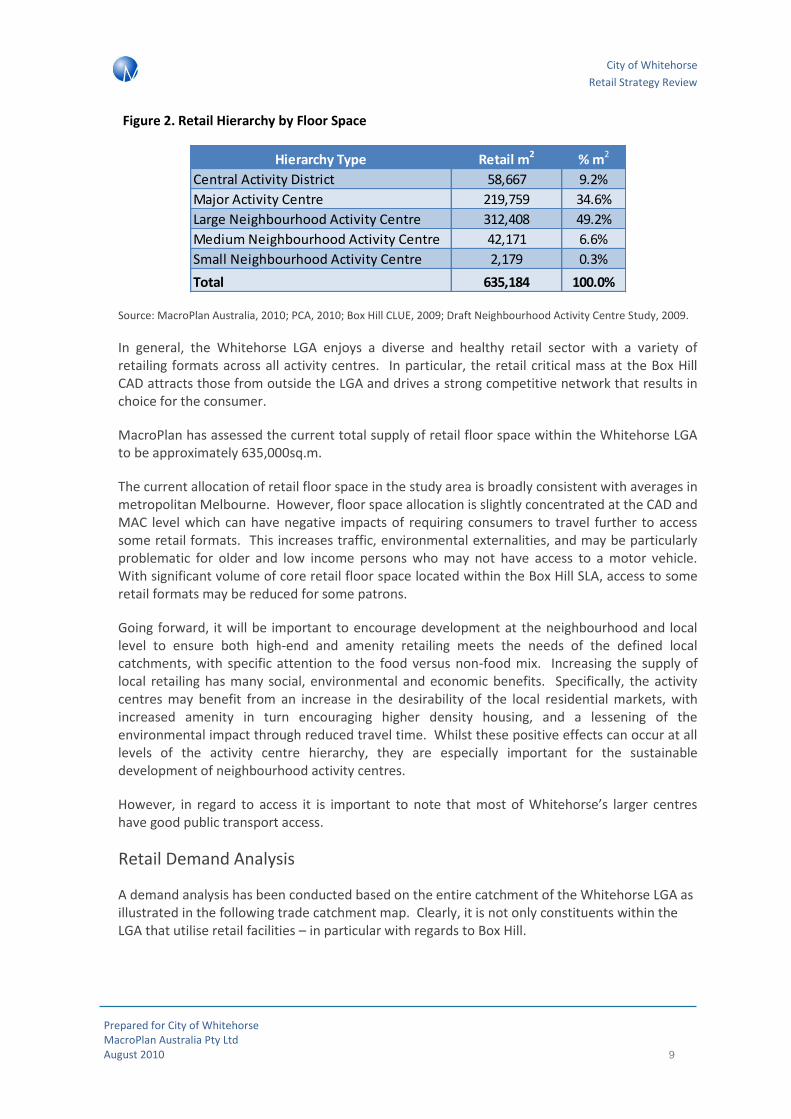
Figure 2. Retail Hierarchy by Floor Space
Source: MacroPlan Australia, 2010; PCA, 2010; Box Hill CLUE, 2009; Draft Neighbourhood Activity Centre Study, 2009.
In general, the Whitehorse LGA enjoys a diverse and healthy retail sector with a variety of retailing formats across all activity centres. In particular, the retail critical mass at the Box Hill CAD attracts those from outside the LGA and drives a strong competitive network that results in choice for the consumer.
MacroPlan has assessed the current total supply of retail floor space within the Whitehorse LGA to be approximately 635,000sq.m.
The current allocation of retail floor space in the study area is broadly consistent with averages in metropolitan Melbourne. However, floor space allocation is slightly concentrated at the CAD and MAC level which can have negative impacts of requiring consumers to travel further to access some retail formats. This increases traffic, environmental externalities, and may be particularly problematic for older and low income persons who may not have access to a motor vehicle. With significant volume of core retail floor space located within the Box Hill SLA, access to some retail formats may be reduced for some patrons.
Going forward, it will be important to encourage development at the neighbourhood and local level to ensure both high-end and amenity retailing meets the needs of the defined local catchments, with specific attention to the food versus non-food mix. Increasing the supply of local retailing has many social, environmental and economic benefits. Specifically, the activity centres may benefit from an increase in the desirability of the local residential markets, with increased amenity in turn encouraging higher density housing, and a lessening of the environmental impact through reduced travel time. Whilst these positive effects can occur at all levels of the activity centre hierarchy, they are especially important for the sustainable development of neighbourhood activity centres.
However, in regard to access it is important to note that most of Whitehorse’s larger centres have good public transport access.
Retail Demand Analysis
A demand analysis has been conducted based on the entire catchment of the Whitehorse LGA as illustrated in the following trade catchment map. Clearly, it is not only constituents within the LGA that utilise retail facilities – in particular with regards to Box Hill.
Hierarchy Type Retail m2 % m2
Central Activity District 58,667 9.2%
Major Activity Centre 219,759 34.6%
Large Neighbourhood Activity Centre 312,408 49.2%
Medium Neighbourhood Activity Centre 42,171 6.6%
Small Neighbourhood Activity Centre 2,179 0.3%
Total 635,184 100.0%
City of Whitehorse
Retail Strategy Review
Prepared for City of Whitehorse MacroPlan Australia Pty Ltd August 2010 10
In conducting this analysis, MacroPlan has looked at the population growth based on forecasts accepted by the City of Whitehorse council and adapted that growth, along with real growth in retail spend, in reaching the level of retail floor space required in future years.
Current retail floor space supply (from the section previous) has been compared to the current (2010) level of retail floor space demand to reach the current market gap in floor space.
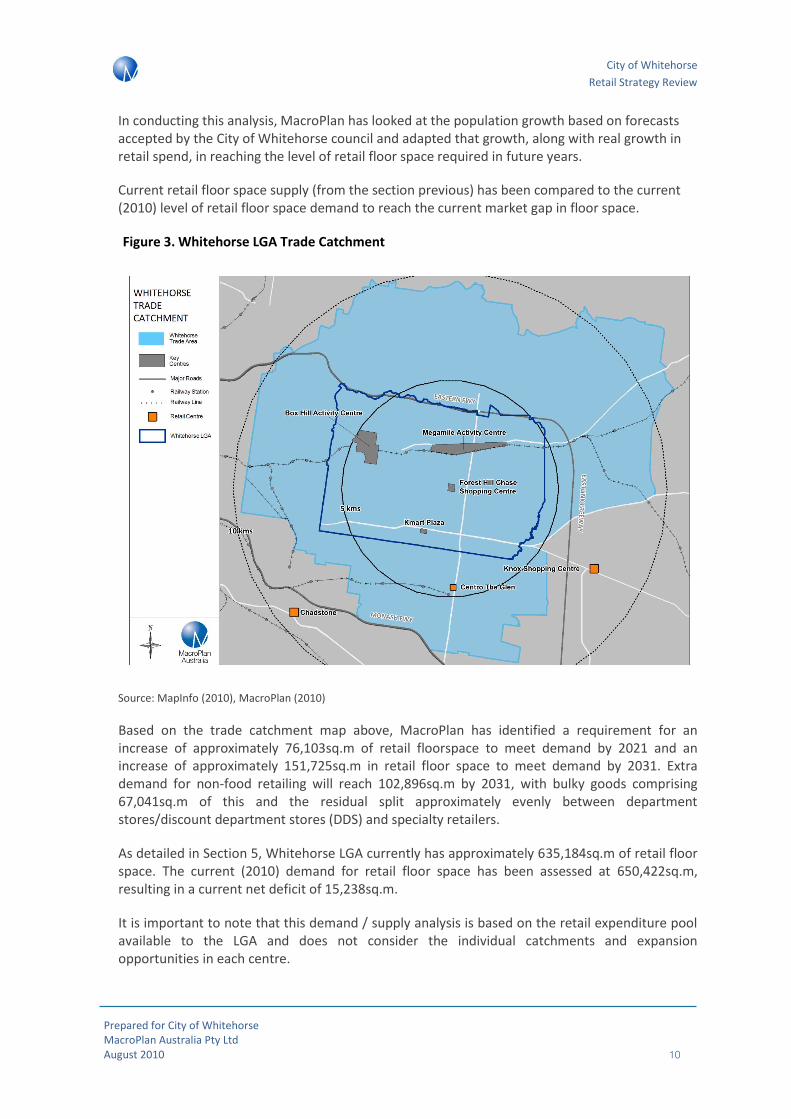
Figure 3. Whitehorse LGA Trade Catchment
Source: MapInfo (2010), MacroPlan (2010)
Based on the trade catchment map above, MacroPlan has identified a requirement for an increase of approximately 76,103sq.m of retail floorspace to meet demand by 2021 and an increase of approximately 151,725sq.m in retail floor space to meet demand by 2031. Extra demand for non-food retailing will reach 102,896sq.m by 2031, with bulky goods comprising 67,041sq.m of this and the residual split approximately evenly between department stores/discount department stores (DDS) and specialty retailers.
As detailed in Section 5, Whitehorse LGA currently has approximately 635,184sq.m of retail floor space. The current (2010) demand for retail floor space has been assessed at 650,422sq.m, resulting in a current net deficit of 15,238sq.m.
It is important to note that this demand / supply analysis is based on the retail expenditure pool available to the LGA and does not consider the individual catchments and expansion opportunities in each centre.

City of Whitehorse
Retail Strategy Review
Prepared for City of Whitehorse MacroPlan Australia Pty Ltd August 2010 11
Figure 4. Whitehorse Retail Floor space Requirements (incl. Beyond Trade)
Source: MacroPlan Australia, 2010
Retail floor space needs at the 2010 level are not currently being met. Evaluated in conjunction with the high levels of expenditure within the LGA (which are consistently above metropolitan Melbourne averages), the Whitehorse retail sector has the potential for expansion.
The existing floor space deficit may be mitigated by proposed future developments. However, the major proposed developments are clustered around the Kmart / East Burwood Activity Centre with smaller proposed developments (mostly in the form of supermarkets and few convenience retailers in mixed use developments) located in the other activity centres. Whilst the major developments will reduce any overall deficit, consideration should be given to meeting demand across the LGA and reflect this through the development of core retailing services.
In particular it is worth noting that there will be demand for an additional 13,200sq.m of supermarket retail floor space in the municipality over the period to 2021. These supermarkets should be delivered near or adjacent to NACs that may be underperforming and preferably adjacent to public transport subject to feasibility.
Key Whitehorse Activity Centres
MacroPlan has also conducted a more comprehensive analysis of four of the key centres within the Whitehorse LGA, providing a trade catchment analysis for each and assessing the competitiveness of the centre.
The competitiveness of Box Hill, Nunawading/MegaMile, Forest Hill and Burwood (Kmart) Plaza have been specifically assessed in the figure outlined below.
Total Trade (incl BT) 2010 2011 2016 2021 2026 2031Growth
2010-21
Growth
2010-31
Food retai l ing
Supermarkets 108,624 109,799 115,740 121,820 127,941 134,124 13,195 25,499
Food retail specialties 46,553 47,057 49,603 52,208 54,832 57,482 5,655 10,928
Food catering 77,589 78,428 82,671 87,014 91,386 95,803 9,425 18,214
Total food retailing 232,767 235,283 248,014 261,042 274,159 287,408 28,275 54,641
Non-Food retai l ing
Dept. stores / DDS 96,913 97,964 103,280 108,723 114,206 119,745 11,810 22,832
Non-food specialties 113,065 114,291 120,494 126,844 133,240 139,703 13,779 26,638
Bulky goods 209,978 212,254 223,774 235,567 247,445 259,448 25,589 49,470
Total non-food 419,956 424,509 447,548 471,133 494,891 518,896 51,178 98,941
Retai l services
Retail services specialties 48,456 48,982 51,640 54,362 57,103 59,873 5,905 11,416
Total retai l floorspace 701,178 708,774 747,202 786,537 826,152 866,177 85,358 164,998
City of Whitehorse
Retail Strategy Review
Prepared for City of Whitehorse MacroPlan Australia Pty Ltd August 2010 12
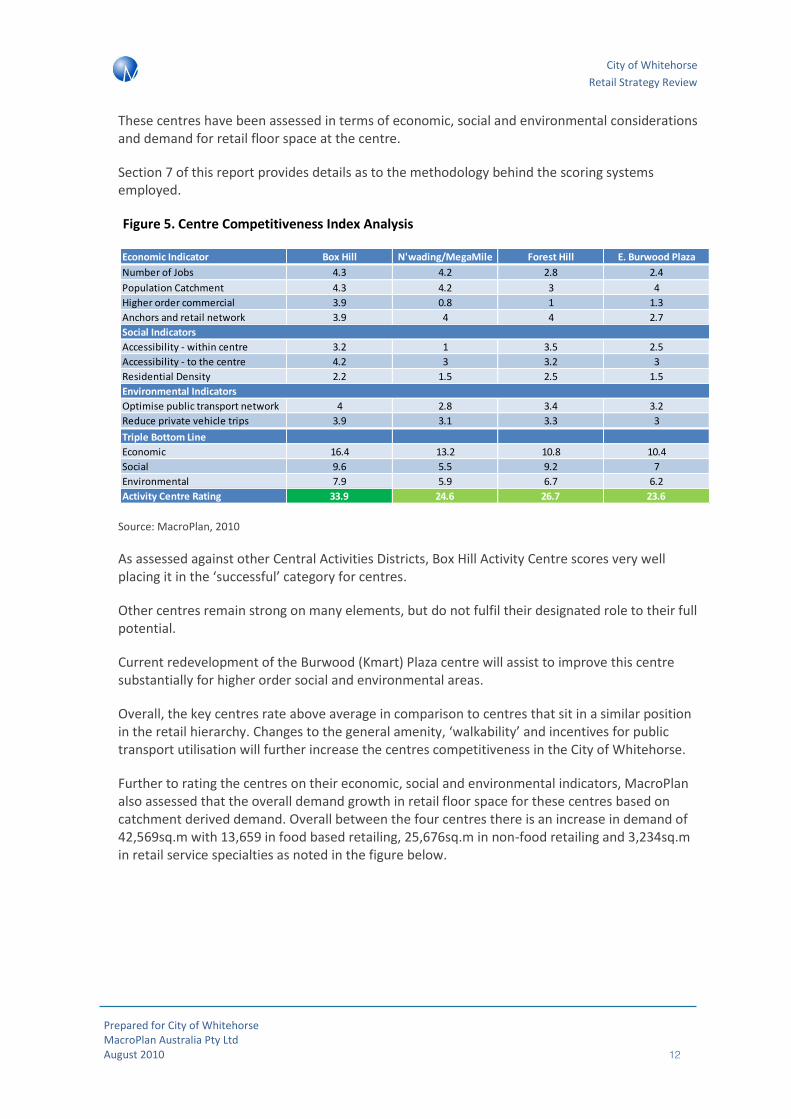
These centres have been assessed in terms of economic, social and environmental considerations and demand for retail floor space at the centre.
Section 7 of this report provides details as to the methodology behind the scoring systems employed.
Figure 5. Centre Competitiveness Index Analysis
Source: MacroPlan, 2010
As assessed against other Central Activities Districts, Box Hill Activity Centre scores very well placing it in the ‘successful’ category for centres.
Other centres remain strong on many elements, but do not fulfil their designated role to their full potential.
Current redevelopment of the Burwood (Kmart) Plaza centre will assist to improve this centre substantially for higher order social and environmental areas.
Overall, the key centres rate above average in comparison to centres that sit in a similar position in the retail hierarchy. Changes to the general amenity, ‘walkability’ and incentives for public transport utilisation will further increase the centres competitiveness in the City of Whitehorse.
Further to rating the centres on their economic, social and environmental indicators, MacroPlan also assessed that the overall demand growth in retail floor space for these centres based on catchment derived demand. Overall between the four centres there is an increase in demand of 42,569sq.m with 13,659 in food based retailing, 25,676sq.m in non-food retailing and 3,234sq.m in retail service specialties as noted in the figure below.
Economic Indicator Box Hill N'wading/MegaMile Forest Hill E. Burwood Plaza
Number of Jobs 4.3 4.2 2.8 2.4
Population Catchment 4.3 4.2 3 4
Higher order commercial 3.9 0.8 1 1.3
Anchors and retail network 3.9 4 4 2.7
Social Indicators
Accessibility - within centre 3.2 1 3.5 2.5
Accessibility - to the centre 4.2 3 3.2 3
Residential Density 2.2 1.5 2.5 1.5
Environmental Indicators
Optimise public transport network 4 2.8 3.4 3.2
Reduce private vehicle trips 3.9 3.1 3.3 3
Triple Bottom Line
Economic 16.4 13.2 10.8 10.4
Social 9.6 5.5 9.2 7
Environmental 7.9 5.9 6.7 6.2
Activity Centre Rating 33.9 24.6 26.7 23.6

City of Whitehorse
Retail Strategy Review
Prepared for City of Whitehorse MacroPlan Australia Pty Ltd August 2010 13
Figure 6. Comparison of growth in retail floorspace (2009 – 2031)
Source: MacroPlan, 2010; MarketInfo, 2009
Policy and Actions
MacroPlan has used the above analysis and our assessment and consideration of best practice policy in other jurisdictions to provide policy and action guidance in the following:
1. Guiding policy principles for retail strategy
2. A framework for the conduct of retail sustainability assessments (RSAs) submitted as part of a development application
3. Trigger points for the requirement for a RSA
4. Specific policy initiatives for the retail hierarchy in the study area
5. Specific policy actions for key centres
Guiding principles
There are a number of key guiding policies and principles that should be considered by developers / landowners as part of a development application for an expansion in retail floorspace that may be inconsistent with an endorsed Structure Plan.
MacroPlan recommends the following key principles are considered by stakeholders and highlighted in the Planning Scheme as key objectives:
ACCESS TO SERVICES: Insuring a distribution of retail floorspace throughout Whitehorse to allow for improved access to retail goods and services by all members of the community
Retai l format type
(Growth 2009 - 2031)Box Hi l l
N'wading/Me
gaMi leForest Hi l l
E.Burwood
PlazaTotal
Food retailing
Supermarket 1,346 567 1,684 451 4,047
Food retail specialties 887 144 469 311 1,812
Restaurants and cafés 3,652 747 1,510 766 6,676
Total food-based 5,885 1,459 3,663 1,528 12,535
Non-Food retailing
Dept. Stores / DDS 600 3,908 1,010 1,172 6,690
Non-food specialties 451 2,853 671 834 4,809
Bulky goods 128 14,117 373 434 15,052
Total Non-food based 1,179 20,878 2,054 2,441 26,551
Retail services
Retail services specialties 319 618 570 258 1,765
Total retai l 7,383 22,954 6,288 4,227 40,852

City of Whitehorse
Retail Strategy Review
Prepared for City of Whitehorse MacroPlan Australia Pty Ltd August 2010 14
COMPETITION: A catchment should be defined within reasonable boundaries to ensure consistency with the centres role in the retail hierarchy. This will assist in distributing market shares more evenly throughout the retail hierarchy.
EVIDENCE: Development applications that request an expansion in the size of a centre should be supported by evidence – preferably by a resident survey – to demonstrate why a centres catchment is growing and why demand exceeds existing supply.
INNOVATION: Innovation in retailing will continue to drive new retail formats and is supported where it can be demonstrated that consumer trends are evolving. In practice this means that new retail formats can be supported to meet changes in consumer preferences.
LOCATION: Activity centres should be located and planned to promote reduced transport energy demands and private vehicle kilometres per capita.
EMPLOYMENT IMPACT: A proposed development should consider the labour force profile of the catchment and demonstrate how it will assist in the improvement of employment self sufficiency across various industry sectors of the economy. Developments that improve employment self sufficiency in non-retail sectors as well as the retail sector will be viewed favourably.
ENVIRONMENTAL IMPACTS: Development applications should consider not only economic or turnover impacts on other centres but the environmental impact of the development in relation to traffic generation and emissions. MacroPlan notes for the purpose of this study it was not feasible to conduct an environmental assessment of centres throughout the Whitehorse LGA, however, Section 8 provides a number of general environmental guidelines.
RETURN ON GOVERNMENT INVESTMENT IN PUBLIC TRANSPORT: A development should encourage a more effective use of public transport (existing and planned) and retail expansions adjacent to principal public transport (particularly rail) will be considered more favourably.
SUPPORTING A HIERARCHY: A commitment to maintaining and enhancing the defined hierarchy of activity centres that balances the need for a distribution of retail floorspace with the importance of critical mass in non-food retailing at higher order centres.
SOCIAL IMPACTS: Development applications that include a Triple Bottom Line (TBL) assessment that clearly highlight positive social impacts will assist consideration of the application. Issues including impacts on night time activity, unemployment, community interaction, safety, amenity etc should be addressed for major development applications.
Subject to these policy principals MacroPlan has developed guidelines on what should be included in a RSA submitted as part of a development application and appropriate trigger points for the need for an RSA.
The purpose of these guidelines is to provided developers and centre owners with more certainty as to Council’s policy objectives and requirements.

City of Whitehorse
Retail Strategy Review
Prepared for City of Whitehorse MacroPlan Australia Pty Ltd August 2010 15
Undertaking a Retail Sustainability Assessment
Traditionally a RSA has as a minimum assessed turnover impacts on other centres and confirmed the demand for retail floorspace within a defined catchment.
Council’s clear commitment to sustainable economic development and triple bottom line consideration of development applications confirms that the overall costs and benefits of a proposed development including social and economic impacts is important in the consideration of activity centre development.
As a minimum a RSA should include the following:
Definition of a Primary and Secondary Trade Area for retail floorspace and a defined Main Trade Area
Calculation of the total retail expenditure pool generated by the catchment and the retained expenditure that is expected ‘pre’ and ‘post’ development.
Assessment of whether the volume of retail expenditure that is expected to be retained in the catchment ‘post’ development is consistent with the centres position in the retail hierarchy
An RSA should clearly define why the expected retail turnover per m2 has been chosen for a proposed retail format and compare it to State and National benchmarks. Variations in performance between the proposed retail tenancies and benchmark standards should be explained. (i.e. why is the proposed new supermarket expected to trade at $6,000 per m2 when existing older supermarkets are trading at $8,000 per m2)
Clear reporting on the market shares that are expected for retail floorspace across key retail categories in the Primary and Secondary trade areas including food and ‘non-food’ retail floorspace
Clear indications of where additional trade is expected to be sourced (i.e. from existing centres, future planned centres and centres outside the defined catchment (i.e. escape expenditure)
Expected trading impacts on existing and proposed centres for each stage of the development that is proposed in % and $ terms
Calculation of employment impacts and impacts on the unemployment rate in the region subject to the volume of jobs the centre is expected to support.
Trigger Points for a retail sustainability assessment by hierarchy
The trigger point for a retail sustainability assessment (RSA) is fundamentally important as it allows for the balancing of the sustainable development of activity centres in the City of Whitehorse with the target of ensuring an adequate supply of retail floorspace to meet consumer needs.
It is important that an RSA is not bluntly applied to any development application received for a retail centre. A trigger point for the requirement for an RSA is therefore critical. These trigger
City of Whitehorse
Retail Strategy Review
Prepared for City of Whitehorse MacroPlan Australia Pty Ltd August 2010 16
points will allow for greater developer certainty and a smoother development assessment process.
MacroPlan believes that a more rigorous RSA framework does have a place in the assessment process, however it is not appropriate at all levels of the retail hierarchy. An RSA should not be required for a centre that is developing within the boundaries of an endorsed Centre Structure Plan and should only be required for centres that plan to deliver a significant variation in retail floorspace above the volume endorsed within the Centre Structure Plan.
The figure below outlines recommendations on the trigger point for an RSA for development inconsistent with a Centre Structure Plan.
These triggers are not only applicable for a centre that may be expanding within its designated retail hierarchy; they are also potentially applicable if a centre is proposing to deliver a format of retail floorspace or a volume of retail floorspace that would effectively elevate its role to a new level of the centres hierarchy.
MacroPlan recommends that there are no restrictions on the supply of non-retail floorspace (i.e. office) at the Box Hill CAD or MACs.
Using the figure overleaf as general policy, MacroPlan developed a set of specific actions for the LGA and for a number of key specific centres as outlined in Section 8 of this report with particular focus on potential changes to the Local Planning Scheme in part 8.6 of this report.

City of Whitehorse
Retail Strategy Review
Prepared for City of Whitehorse MacroPlan Australia Pty Ltd August 2010 17
Figure 7. Trigger points for a RSA – CADs, MACs and NACs
Source: MacroPlan, 2010
• The Box Hill CAD should expand in line with market need and any endorsed centre structure plan.
• Council should consider how expansions at the existing centre will assist in the achievement of employment growth in Whitehorse
• There should be no retail floorspace or commercial floorspace cap at this level of the hierachy
• Any expansion in retail floorspace by Centro should be supported given the centres co-location to the PPTN and employment
Cen
tral
A
ctiv
itie
s D
istr
ict
•Existing MACs should be required to submit a RSA for any expansion in shop floorspace above 3,000m2 NLA .
•Retail catchments defined in an RSA should preferably be supported by a resident survey.
• The RSA should include elements listed in part 8.2 of this report
•Expansions in retail floorspace at MACs co-located to principal public transport infrastructure (particularly rail) could be supported without a RSA if Council has a policy objective to activate the centre as a Transit Oreinted Development.M
ajo
r A
ctiv
ity
Cen
tres
•An RSA should be submitted for expansions above 2,000m2 or 1,000m2 for an individual shop if a Centre Structure Plan is not in place or does not provide guidance on requirements for additional retail floorspace.
•The expansion should meet the requirements of an RSA outlined in part 8.2 of this report.
•Expansions in retail floorspace at Neighbourhood Centres co-located to public transport infrastructure (particularly rail) could be supported without an RSA at the discretion of Council if activation as a TOD is consistent with Council policy.
• Residential densification around existing NACs should be enhanced to encourage utilisation of existing commercial and social infrastructure.N
eigh
bo
urh
oo
d
Act
ivit
y C
entr
es
City of Whitehorse
Retail Strategy Review
Prepared for City of Whitehorse MacroPlan Australia Pty Ltd August 2010 18
1 Introduction
1.1 Purpose of Study
MacroPlan Australia has been commissioned by the Whitehorse City Council to research, develop and finalise a Retail Strategy for the City of Whitehorse. MacroPlan has also been commissioned to develop the recommendations and guidelines for those policies which are impacted as a result of the Whitehorse Retail Strategy.
A considerable amount of market surveying and research was completed in the initial stages of this study to collect data that guided MacroPlan in the development of the Whitehorse Retail Strategy.
This assessment includes an examination of strategic and statutory planning mechanisms; population and demographics of residents within the Whitehorse LGA; current levels of retail supply and demand; qualitative evaluations of the businesses, consumers and residents; and a detailed development strategy for key centres in the City of Whitehorse.
Included in the project scope is the development of a recommended future retail policy framework that will guide the development of relevant sections of Councils Local Planning Policy Framework (LPPF).
Models used in the report include but are not limited to:
• future population projection analysis,
• employment projection analysis,
• journey to work modelling,
• retail demand and floor space requirement analysis,
• centre catchment and retail expenditure modelling, and
• Centre competitiveness modelling.
1.2 Methodology Overview
An overview of the methodology approach to this retail strategy appears in the figure below.
It depicts how the competitiveness of key retail centres is considered according to a triple bottom line framework with input from primary market research including business consultation and shopper surveys.
Future retail floorspace requirements are assessed subject to a review of population and employment in each centres catchment as well as consideration of incomes and the ability of the centres retailers to retain retail expenditure pools (i.e. what is the centres likely market share).
Policy recommendations are also considered based on any constraints a centre may face in regard to development feasibility, building restrictions; land availability, policy directions etc.

City of Whitehorse
Retail Strategy Review
Prepared for City of Whitehorse MacroPlan Australia Pty Ltd August 2010 19
Figure 8. Methodology Overview
1.3 Location and Context
The City of Whitehorse is located in approximately 15km east of the Melbourne CBD and includes the Central Activities District, Box Hill as identified in Melbourne @ 5 million. The city has a population of 151,000 as per 2006 census data and covers an area of 64ksq.m.
As displayed in Figure 9, the municipality is bordered by the Koonung Creek in the north, Dandenong Creek and Heatherdale Road in the east, Highbury Road in the south, and generally Warrigal Road in the west. Surrounding LGA’s include Manningham, Maroondah, Knox, Monash and Boroondara.
Expected future
growth of centre
1. Centre competitiveness
•Economic Influences
•Social Influences
•Environmental Influences
•Calculation of centre competitiveness
2. Retail floorspace requirements
•Population and employment projections
•Retail expenditure pool
•Retail floorspace projections by retail type
3. Consideration of constraints
•Consideration of planning intentions
•Consideration of land constraints and development feasibility
•Revised retail floorspace projections
4. Policy recommendations

City of Whitehorse
Retail Strategy Review
Prepared for City of Whitehorse MacroPlan Australia Pty Ltd August 2010 20
Figure 9. Whitehorse LGA Context Map
Source: MapInfo (2010), MacroPlan (2010)
1.4 Report Structure
This report is divided into the following sections:
Section 1: Introduction
Section 2: Review of Strategic and Statutory Planning Documents
Section 3: Population and Demographics
Section 4: Retail Supply Analysis
Section 5: Qualitative Survey Analysis
Section 6: Retail Demand Analysis
Section 7: Key Activity Centre Analysis
Section 8: Policy Recommendations

City of Whitehorse
Retail Strategy Review
Prepared for City of Whitehorse MacroPlan Australia Pty Ltd August 2010 21
1.5 Information Sources
This report draws on a wide range of information sources as an input to our assessment. These sources include, but are not limited to:
Census of Population and Housing, Australian Bureau of Statistics (2006)
ABS population projections prepared for the Department of Health and Ageing (2008)
Latest trends in population growth using ABS Regional Population (Cat. No. 3218.0)
Household Expenditure Survey, Australian Bureau of Statistics (2003/04)
Population forecasts prepared by I.D. Consulting (2009)
Victoria in Future population projections (2008)
Melbourne 2030 – State Government Strategic Document (2006)
Melbourne @ 5 million - DPCD
1.6 Abbreviations
The following abbreviations are used in this report
ABS Australian Bureau of Statistics
CAD Central Activities District
CBD Central Business District
CCD Census Collection District
CLUE Census of Land Use and Employment
DDS Discount Department Store
GFC Global Financial Crisis
LGA Local Government Area
MAC Major Activity Centre
MTA Main Trade Area
NAC Neighbourhood Activity Centre
PTA Primary Trade Area
RSA Retail Sustainability Assessment

City of Whitehorse
Retail Strategy Review
Prepared for City of Whitehorse MacroPlan Australia Pty Ltd August 2010 22
RTD Retail Turnover Densities
SEIFA Socio-Economic Index For Areas
STA Secondary Trade Area
TBL Triple Bottom Line
TDZ Transport Destination Zones
TOD Transport Orientated Development
1.7 Disclaimer
This study has been prepared by MacroPlan Australia Pty Ltd and is intended for the purpose described in this report and not for any other purpose. The contents of this paper should not be reproduced without the express permission of MacroPlan Australia Pty Ltd.

City of Whitehorse
Retail Strategy Review
Prepared for City of Whitehorse MacroPlan Australia Pty Ltd August 2010 23
2 Policy and Literature Review
MacroPlan has assessed the existing planning framework at the state and local level as it relates to centre and retail development within the City of Whitehorse.
In particular, this section reviews the effectiveness of the current Planning Scheme in dealing with the realities of the existing retail hierarchy, including relevant Centre business plans, structure plans and strategies that guide planning scheme objectives.
This section reviews the appropriateness of the existing framework and provides guidance in terms of future centre and retail development across the City of Whitehorse.
2.1 State Planning Policy Framework
Melbourne 2030 and Melbourne @ 5 Million – A Planning Update
Melbourne 2030 sets out the overarching strategic framework for the growth and development of Melbourne and surrounding areas. A key objective of Melbourne 2030 is that designated ‘activity centres’ should be the focus for major change over the next 30 years.
Included within Melbourne 2030 is a hierarchy of activity centres by type, and the intended functions of each type of centre:
Central Activities Districts (CADs – 6 new centres included as a part of Melbourne @ 5 Million)
Principal Activity Centres (PACs)
Major Activity Centres (MACs)
Specialised Activity Centres
Neighbourhood Activity Centres (NACs)
Box Hill was identified through Melbourne @ 5 Million as one of six new Central Activities Districts (in addition to Melbourne CBD) located throughout the Melbourne Metropolitan area. Box Hill was also previously an identified Transit City, and was a focus for State Government investment in projects linked to improving the use of existing public transport in established metropolitan and regional centres.
The objectives for the CADs are that they will provide:
Similar services and functions to central Melbourne, such as commercial, retail, high specialised personal services, entertainment, educations government and tourism;
Significant employment concentrations; and
High quality, well designed living and working urban environments.
City of Whitehorse
Retail Strategy Review
Prepared for City of Whitehorse MacroPlan Australia Pty Ltd August 2010 24
These six centres are also recognised as focus areas for State Government planning and investment, and will be expected to cater for CBD-type jobs, with a strong and diverse retail sector. The investment in the new CADs will centre around land assembly, infrastructure development and facilitating private investment
In addition, Whitehorse has four designated Major Activity Centres:
Burwood East, Tally Ho
Burwood Heights
Forest Hill Chase, and
Nunawading/MegaMile
There is also one Specialised Activity Centre located within the City of Whitehorse; Deakin University at Burwood.
Economic Development
The State Planning Policy Framework (SPPF) sets out objectives and policy principles for the development of activity centres and ‘out of centre’ retail and commercial development.
Clause 17.01 provides general directions in regard to the development of activity centres and Clause 17.02 provides directions for the establishment of new businesses.
Clause 17.01 directs that activity centres should be planned to:
Provide a range of shopping facilities in locations which are readily accessible to the community.
Incorporate and integrate a variety of land uses, including retail, office, education, human services, community facilities, recreation, entertainment and residential uses where appropriate.
Provide good accessibility by all available modes of transport (particularly public transport) and safe pedestrian and cycling routes, and to encourage multi-purpose trip making to such centres.
Facilitate ease of pedestrian movement between components of centres, public transport interchanges and parking areas.
Maximise opportunities for the co-location, multiple use and sharing of facilities.
Minimise the effects of commercial development on the amenity of residential and parkland areas, for example as a result of traffic congestion, noise or overshadowing.
Therefore key success factors are accessibility (including by public transport), land use mix and the co-location of uses.

City of Whitehorse
Retail Strategy Review
Prepared for City of Whitehorse MacroPlan Australia Pty Ltd August 2010 25
Clause 17.02 of the SPPF directs that commercial facilities should be located in existing or planned activity centres unless they are:
New freestanding commercial developments in new residential areas which have extensive potential for population growth or will accommodate facilities that improve the overall level of accessibility for the community, particularly by public transport.
New convenience shopping facilities to provide for the needs of the local population in new residential areas and within, or immediately adjacent to, existing commercial centres.
Outlets of trade-related goods or services directly serving or ancillary to industry and which have adequate on-site car parking.
The key message from this policy direction is that retail floor space should preferably be located within an activity centre boundary, however in cases where there is growth in demand or access by public transport a new development can be considered.
2.2 Local Planning Policy Framework (LPPF)
The Whitehorse Planning Scheme (the scheme) provides direction on the development of activity centres within the City of Whitehorse.
There are several relevant clauses within this scheme. These components are reviewed as follows.
Clause 21.07 – Economic Development
In regard to retail floor space and activity centres, the planning scheme provides the following overarching directions:
Council will continue to recognise the one billion dollar turnover contribution that Mega Mile contributes to the local economy by developing, managing and promoting the retail strip as one of Melbourne’s largest shopping districts.
Support the creation of vibrant and economically viable activity centres that provide a full range of products and services for residents and businesses.
Instil a corporate approach to the management and development of activity centres through the adoption of business plans for key precincts such as Box Hill, Mitcham, Burwood Heights, Brentford Square, East Burwood Plaza, Blackburn Station, Blackburn South, Mont Albert Village and Wattle Park.
These specific directions for retail floor space are consistent with support for employment and economic development more generally, as outlined in the scheme.
Clause 22.06 – Activity Centres
The role of activity centres in supporting economic growth is recognised by Clause 22.06-1. Key policy intent is stated as follows:
City of Whitehorse
Retail Strategy Review
Prepared for City of Whitehorse MacroPlan Australia Pty Ltd August 2010 26
Within the City of Whitehorse, Box Hill is the nominated Central Activities District, while the Major Activity Centres are Forest Hill, Mega Mile (Nunawading), Burwood Heights and Burwood East – Tally Ho Business Park.
There are also a number of neighbourhood activity centres within the municipality. Each of the City’s seventy-eight centres makes a significant contribution to the City’s economy and plays a role in meeting the needs of the community.
One of the main retail strengths is the Whitehorse Road Mega Mile strip which Council wishes to consolidate its role through appropriate land use and development.
It is essential that these centres provide for appropriate community services and facilities consistent with their role and become a focus for social interaction. It is important to ensure that any new development assists Council’s aim to improve the amenity and visual appearance of each centre.
Council therefore supports the development of each of its activity centres however with the policy caveat that they can contribute to social interaction and improve amenity and visual appearance and accessibility including by sustainable transport modes.
This direction has been considered in this Strategy as part of the recommended directions for each centre, set out as follows:
Whitehorse Road Mega Mile shopping strip
This centre is the primary location in the City for homemaker retailing, supplemented by a significant motor vehicle retailing sector.
Development is of a high-quality design that enhances the streetscape.
New use and development should have regard to the vision and principles of the Nunawading/Mega Mile Major Activity Centre and Mitcham Neighbourhood Activity Centre Structure Plan.
Forest Hill Chase
Forest Hill Chase Shopping Centre continue as part of a Major Activity centre primarily providing convenience and comparison retail facilities, a cinema complex and entertainment facilities.
Burwood Heights
Burwood Heights includes a large vacant strategic development site. It offers a potential to be developed into an activity centre of a form envisaged by Melbourne 2030. A structure plan has been prepared to guide future development and improvement of Burwood Heights.
Neighbourhood Centres
The existing role of the East Burwood Plaza at the corner of Burwood Highway and Blackburn Road in the activity centre hierarchy will be maintained and enhanced.
City of Whitehorse
Retail Strategy Review
Prepared for City of Whitehorse MacroPlan Australia Pty Ltd August 2010 27
Large NACs continue to focus on providing convenience retailing with limited comparison retailing for the weekly shopping needs of the local community.
Smaller NACs continue to focus on providing limited convenience retailing.
The renovation of existing buildings and shop fronts, and other works should be encouraged to improve the visual amenity and streetscape of these centres.
Office and residential uses should be encouraged in appropriate centres where the retailing function is declining.
Adjoining NACs provide a supporting role to the Whitehorse Road Mega Mile retail precinct and Major Activity Centre.
New use and development should have regard to the vision and principles of the Nunawading/Mega Mile Major Activity Centre and Mitcham Neighbourhood Activity Centre Structure Plan.
These directions have significant application to the development of higher order retail centres and Neighbourhood Activity Centres (NACs).
In regard to higher order centres such as Nunawading / MegaMile and Forest Hill, their role as retail centres is to be enhanced, particularly in the case of Nunawading / MegaMile which is recognised as a key employer.
NACs that have a relatively higher volume of retail floor space are encouraged to continue to provide weekly and comparison shopping services, whereas smaller neighbourhood centres should supply retail products and services associated with a convenience shopping experience.
In all cases, centres that can build upon and enhance opportunities for social and commercial interaction are encouraged.
2.3 Local Planning Policy Framework – Specific Centres
2.3.1 Box Hill Central Activities District
Box Hill Structure Plan (2007)
As a Central Activities District (CAD), Box Hill will be the focus of a significant proportion of employment growth and public investment.
Box Hill provides a range of existing uses, with multi-modal public transport access and potential for major development. Council's Structure Plan intends to guide future development, improvement and investment of the CAD.
Objectives of the Structure Plan include: increase overall density, pedestrian access, public transport connectivity, minimise urban sprawl and minimise car dependency at Box Hill.
City of Whitehorse
Retail Strategy Review
Prepared for City of Whitehorse MacroPlan Australia Pty Ltd August 2010 28
Whitehorse Planning Scheme: Clause 22.07 Box Hill Central Activities District
The planning scheme describes the Box Hill CAD as providing retail, education, office, civic, medical, community service, entertainment, dining and recreational opportunities for the regional population, as well as acting as a hub for local community activities.
To achieve planning scheme directions, eight activity precincts and seven built form precincts were identified in the Box Hill Transit City Activity Centre Structure Plan.
These precincts aim to:
ensure that Box Hill provides accessible, lively and comfortable public spaces that offer diverse opportunities for recreation and social engagement
support walking as the primary means of access in and around Box Hill and encourage most trips of 1km or less to be taken on foot
encourage cycling as a sustainable and healthy means of travel within Box Hill and for trips of up to 5km between the Activity Centre and surrounding areas
encourage significantly increased use of public transport and reduced rates in the use of private vehicular transport for travel to and from the Box Hill Activity Centre
manage vehicular traffic in Box Hill to support choice of travel mode and create transit supportive roads (as defined by the Box Hill Transit City Activity Centre Structure Plan 2007)
ensure that car parking in Box Hill balances access, sustainable transport and land use needs
ensure that Box Hill accommodates a more intensive and diverse range of activities that increase choices and opportunities, support synergies between different uses, encourage use of sustainable transport and complement surrounding areas
Sustainable transport and travel is therefore a key focus of the development of Box Hill. It will be important for Council to consider and monitor how successfully the centre is utilising its public transport assets in promoting access by modes other than private vehicle.
Access for cyclists in and around the centre should be promoted, together with an increased supply of cycle bays. Pedestrian movement can be promoted by further improvements to passive and active surveillance which can be achieved by the delivery of residential development.
2.3.2 Burwood Heights Major Activity Centre
Burwood Heights Activity Centre Structure Plan
Clause 22.13 Burwood Heights MAC
Burwood Heights is acknowledged as a Major Activity Centre with potential to be a significant mixed use activity centre. The development of Burwood Heights should be consistent with the vision and principles developed for the Burwood Heights Structure Plan (see Section 2.3).

City of Whitehorse
Retail Strategy Review
Prepared for City of Whitehorse MacroPlan Australia Pty Ltd August 2010 29
Development should complement the role and function of other activity centres and the range of services currently available at the centre.
Clause 22.14 Former Brickworks Site
The Former Brickworks Site forms part of the Burwood Heights Major Activity Centre. It is identified in the MSS as a strategic redevelopment site. The site is intended to facilitate the staged development of the Burwood Heights MAC. Ultimately the site should support the function of Burwood Heights as a MAC.
Land uses should focus into three mixed use precincts: leisure and lifestyle retail, entertainment and leisure, residential.
Given the focus on leisure and lifestyle, the policy specifies that entertainment uses and higher density residential that meets future housing requirements should be encouraged, while large scale retail and trade supplies and standalone uses should be restricted.
2.3.3 Burwood Village
Burwood Village Neighbourhood Activity Centre Framework Plan
The purpose of the plan is to encourage the transformation of the Burwood Highway corridor into a more attractive urban corridor, improving visual appearance and pedestrian environment.
The Plan focuses on Land use, promoting quality development, activity centre, existing residential and industrial areas and transport. Key considerations include allowing for moderated increases in building heights, providing for additional residential, promoting a renewal of building stock and improving the availability of on-street parking. Furthermore, the plan seeks to ensure new development applications provide an Integrated Transport Plan that ‘rigorously assesses parking needs’.
2.3.4 Nunawading/Mitcham/MegaMile/Blackburn Activity Centres
Nunawading / Mitcham Structure Plans
The purpose of the structure plan is to guide future development of the Nunawading and Mitcham Activity Centres for future planning and enhancement. The structure plan is divided into three precincts of Nunawading, Mitcham and MegaMile.
Nunawading Village is recognised in the structure plans to be in ‘crisis’ with poor building stock and multiple small land ownership making rapid change difficult. The area is acknowledged to require significant reinvestment in its facilities and access.
Mitcham has the benefits of co-location to the MegaMile activity centre and the Mitcham Station. The structure plan notes the potential benefits to arise from opening up the street frontage and allowing shop-top developments to assist in the long term viability of the centre.
MegaMile is understood to have accessibility issues for pedestrian and bikes. Initiative promoted in the structure plan include: upgrading streetscapes and new linkages; improving Nunawading Station; signalisation of pedestrian and car links to Nunawading Village; further public transport
City of Whitehorse
Retail Strategy Review
Prepared for City of Whitehorse MacroPlan Australia Pty Ltd August 2010 30
linkages; extension of bike networks; and, the upgrade and expansion of public spaces at Nunawading Community Centre, Mitcham Village, and Daniel Robertson’s Brickworks.
MegaMile West and Blackburn Activity Centres Urban Design Framework
The purpose of the study is to guide change and development in the study area over the next 15 years, based on environmental, social and economic objectives. The study will investigate the opportunities and constraints of both the MegaMile West and Blackburn Activity Centres.
With regards to MegaMile West, the vision includes an increasing regional role as a bulky goods retailing destination, extending the streetscape in MegaMile east to the west. There is also an increasing focus on private vehicle access and improvement to the pedestrian environment.
Blackburn Neighbourhood Activity Centre will strengthen its role as an urban village focussed around the railway station. The plans vision includes a focus on a mix of retail, office, community and higher density residential.
2.3.5 Blackburn
Blackburn Station Village Business Plan
The business plan provides a road map to enable stakeholders to focus time and energy on the issues that achieve the vision which provides: an agreed consensus of the activity centre; a program of priorities and actions; identification of funding and people needed to deliver the results; a management system that enables coordination and integration of projects and activities; and, regular monitoring and review. Key areas of focus including marketing, physical environment (signage and parking), business development (business kit and service standards) and centre management (funding and performance).
Clause 22.12 Blackburn Station Shopping Centre
Blackburn Shopping Centre is identified in the Planning Scheme to be the preferred destination for local shopping, services and community uses. Council policy seeks to ensure that planning decisions are consistent with both the Blackburn Shopping Centre Business Plan and the Parking Strategy by providing a suitable mix of retail and office uses, enhancing the physical environment as well as appropriately addressing parking demands in the area.
The policy objectives highlight the need to encourage cluster of retail and community services at ground floor on the south of the railway line and office and supporting businesses on the north side of the railway line.
In regards to car parking, the policy aims to ensure that provision is appropriate to the demand generated at the centre. The rates of car parking should follow the guidelines provided in the policy (Table 1).
2.3.6 Neighbourhood Activity Centres
Draft Whitehorse Neighbourhood Activity Centre Study (April 2009)
The aim of this study was to provide a snapshot of the 53 Neighbourhood Activity Centres (NACs) located within the City of Whitehorse. The study identifies the future capacity of each NAC,
City of Whitehorse
Retail Strategy Review
Prepared for City of Whitehorse MacroPlan Australia Pty Ltd August 2010 31
including constraints on development, height controls where required and using this information establishes a strategic framework for the development of NACs within Whitehorse in the future.
The study notes that all 53 centres are zoned Business 1 (B1Z), and at the time were subject to the Design and Development Overlay – Schedule 4 (DDO4), which was an interim control implementing design and built form requirements for the centres, including height limitations. This control has since expired.
The study breaks down the various NACs into the following categories:
Large NACs – up to 10,000m2, including 1 or 2 full-line supermarkets, speciality shops, offices, and community facilities.
Medium NACs – up to 2,500m2, including a small supermarket or grocery store, plus speciality shops.
Small NACs – 100-1,000m2 comprising speciality/convenience shops.
The study also undertook spatial analysis of each of the centres, considering factors that would contribute to future development potential such as demographics, proximity to public transport, open space, educational and community facilities and other land uses. The performance of each centre was then compared to prioritise centres in need for redevelopment or further investigations.
The implementation section of the study recommended introducing permanent Design and Development Overlays for all NACs to provide direction for future development proposals.
This study should be considered in the overall approach taken by Council.
2.3.7 Summary
MacroPlan has assessed the existing planning framework at the state and local level as it relates to centre and retail development within the City of Whitehorse.
The summaries above of relevant planning documents have been used in MacroPlan’s analysis throughout the report and, where appropriate, have been commented on in Section 8 of this report where making future policy recommendations.
In particular, MacroPlan has considered relevant structure plans of key centres studied in Section 7 and the recent Draft Whitehorse Neighbourhood Activity Centre study. At the higher level, MacroPlan has incorporated policy framework recommendations from Melbourne 2030 into activity centre recommendations, particularly at the CAD and MAC level.
City of Whitehorse
Retail Strategy Review
Prepared for City of Whitehorse MacroPlan Australia Pty Ltd August 2010 32
3 Stakeholder Consultation
In order to understand the operational and logistical opportunities and constraints for business operators within the City of Whitehorse, MacroPlan has undertaken various forms of consultation with key stakeholders within the community. These stakeholders include local business, residents and shoppers. The four-part process was conducted as follows.
1. Retail Business Surveys – Paper surveys were distributed to a sample local business owners and were comprised of questions pertaining to business operations, the Whitehorse environment and business/retail networks.
2. In-Centre Surveys – Face-to-face, in-centre surveys were conducted at nine shopping centres throughout the Whitehorse LGA. Questions asked pertained to the personal characteristics of the respondent and destination characteristics.
3. Resident Survey – A telephone survey was conducted amongst Whitehorse residents with questions regarding their personal characteristics, preferred centre and the Whitehorse retail destination.
4. Business Association Consultations – To gain a background understanding of the range of views held regarding various centres and issues related to Whitehorse.
It must be noted that while the surveys provide an indication of views relating to retail trading in the Whitehorse LGA, the data may not always represent the general views of the population of businesses or residents in Whitehorse. Due to factors such as the time and location of the surveys, results may slightly vary from the overall view in the municipality.
The issues covered in these surveys have provided MacroPlan with specific indicators that guide the assessment of each activity centre and the degree to which trading needs are currently met and the potential to do so in the future.
The qualitative data from interviews with key stakeholders and surveys has been considered in conjunction with the quantitative data obtained for floor space demand/supply and retail expenditure, as enumerated in Sections 5-6. This multi-pronged approach allows MacroPlan to provide policy recommendations that align with the perceptions and needs of the local workforce, retailers and residents and duly provide a framework for a thriving retail sector.
3.1 Retail Business Surveys
The Business Survey questionnaire was comprised of 19 questions and was completed by 191 businesses throughout the municipality, providing a diverse and fair spread of the views of the business operators. Survey questions can be broken down into the three broad categories of business operations, the Whitehorse environment and business/retail networks, as displayed in the graph below.

City of Whitehorse
Retail Strategy Review
Prepared for City of Whitehorse MacroPlan Australia Pty Ltd August 2010 33
Figure 10. Business Survey Structure
Source: MacroPlan Australia, 2010
Business Operations
MacroPlan has assessed business operations according to the issues that are critical to trading successfully in an activity centre. Learning the financial well-being and sentiment of traders can present alternative information to quantitative data alone and as such, is an invaluable tool in judging the general economic activity within the municipality.
The following summary provides some key business indicators that point to a generally confident but cautious economic environment within the Whitehorse LGA. Key findings include:
14% of businesses are seeking to employ additional staff in the coming six months, while 6.7% said they expect to reduce staff. 79.2% will remain unchanged or are unsure about future staffing requirements. This is generally in line with the nationwide increase in business confidence after the GFC. The net difference between people seeking to employ over the coming months and those who are looking to reduce levels is a positive sign and points to stronger retail trade levels in the municipality.
68.8% of businesses employed 5 or less people, 25.9% employed 5 to 20 people and 5.3% employed more than 20 people. This large amount of very small businesses in the LGA indicates a healthy amount of competition, with the municipality not simply being dominated by larger businesses.
67% stated that their main trading days were during the week, whereas only 33% said the weekend. Businesses in the Box Hill Activity Centre generally had peak activity on weekdays, where as respondents from the more conventional Forest Hill centre had an even split between weekend and weekday trading.
Business / Retail
Networks
Whitehorse Environment
Business Operations

City of Whitehorse
Retail Strategy Review
Prepared for City of Whitehorse MacroPlan Australia Pty Ltd August 2010 34
There was a reasonable spread of trading across the day with 30.7% of businesses saying that their peak trading hours were in the morning, 21.6% at lunch time and 36.6% in the afternoon. Only 11.1% of businesses had peak trading hours at night time.
Many businesses who responded to the survey had been located at their premises for a lengthy period with 65.8% being operational at the current location for more than 5 years, 28.9% for 1 to 5 years and only 5.3% being at the premises for less than a year.
When asked about potential future threats to their business, operators are more concerned about wider economic issues than the local environment, with 32.5% stating that economic conditions was a major threat, 22.9% saying increased business costs, 17.2% saying a lack of trade, 16% noting Parking/traffic issues while new retail developments nearby ranked low at 6%.
Businesses in Whitehorse engage in a range of environmental measures with 30.9% recycling and 19.4% using water efficiency measures.
Whitehorse Trading Environment
MacroPlan’s analysis of the Whitehorse environment explores how businesses feel about the wider operating environment. This may include areas that are outside the businesses direct control but within the control of retail centre owners and different levels of government for the Whitehorse municipality.
Analysis of the wider landscape within which the business operates provides the City of Whitehorse with an indication of sentiment towards the environment in which they operate.
The survey found:
15.2% of businesses who completed the survey were located within the Box Hill Activity Centre. This high amount is representative of the size of the centre and its dominance in the Whitehorse LGA.
Businesses had a wide range of opinions in the attraction of their centre as an operating environment:
o Almost 20% said that expected trading levels was a factor in their choice of location
o 18.6% said that being located close to where they live was an attraction
o Co-location with other retailers was a factor with 12% of businesses, as was the level of rent payable
o Public transport and high pedestrian traffic levels were factors with only a small amount of businesses - rating 11% and 10.3% respectively
Businesses noted the following major issues of operating in their current location:
o 30.6% said parking availability was a major issue
City of Whitehorse
Retail Strategy Review
Prepared for City of Whitehorse MacroPlan Australia Pty Ltd August 2010 35
o 20.2% believed that the lack of trading activity was an issue
o 17.3% believed high rents were a problem with their location
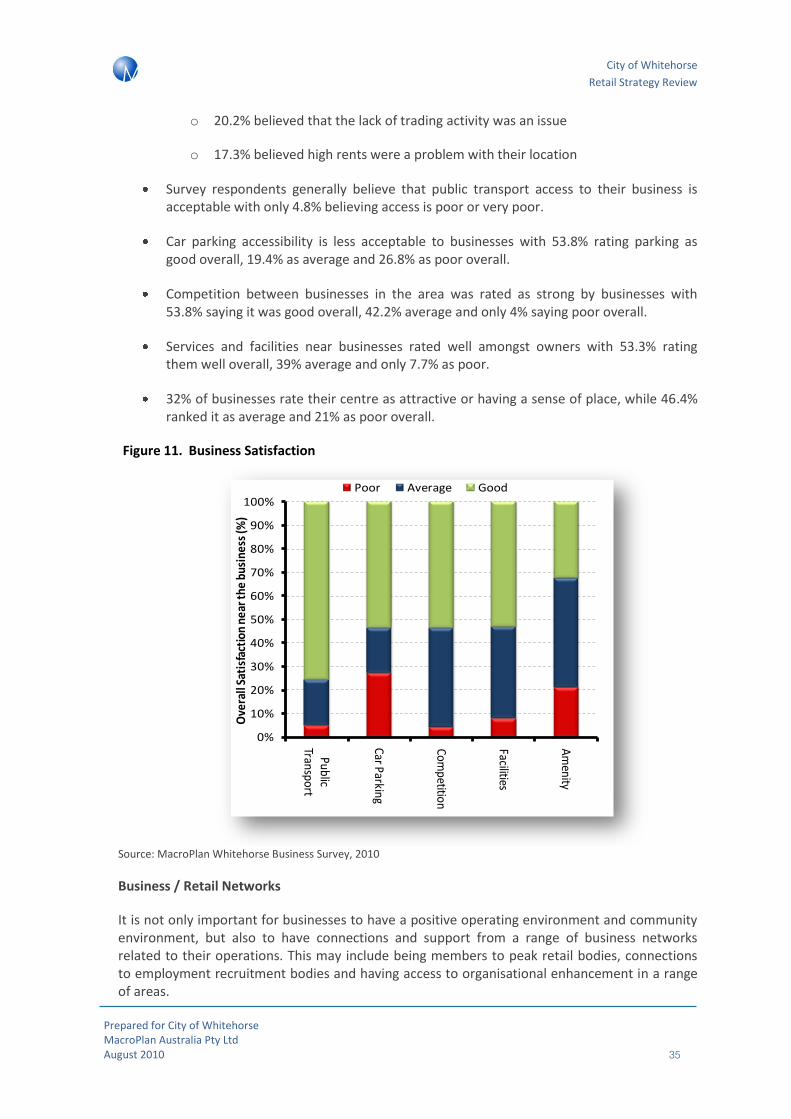
Survey respondents generally believe that public transport access to their business is acceptable with only 4.8% believing access is poor or very poor.
Car parking accessibility is less acceptable to businesses with 53.8% rating parking as good overall, 19.4% as average and 26.8% as poor overall.
Competition between businesses in the area was rated as strong by businesses with 53.8% saying it was good overall, 42.2% average and only 4% saying poor overall.
Services and facilities near businesses rated well amongst owners with 53.3% rating them well overall, 39% average and only 7.7% as poor.
32% of businesses rate their centre as attractive or having a sense of place, while 46.4% ranked it as average and 21% as poor overall.
Figure 11. Business Satisfaction
Source: MacroPlan Whitehorse Business Survey, 2010
Business / Retail Networks
It is not only important for businesses to have a positive operating environment and community environment, but also to have connections and support from a range of business networks related to their operations. This may include being members to peak retail bodies, connections to employment recruitment bodies and having access to organisational enhancement in a range of areas.
0%
10%
20%
30%
40%
50%
60%
70%
80%
90%
100%
Public Transport
Car Parking
Competition
Facilities
Am
enityO
vera
ll Sa
tisf
acti
on n
ear t
he b
usin
ess
(%)
Poor Average Good
City of Whitehorse
Retail Strategy Review
Prepared for City of Whitehorse MacroPlan Australia Pty Ltd August 2010 36
Business responses to the survey indicated that:
Only 19.1% of businesses who responded to the survey had access to business networks.
26.9% of businesses were involved in trader groups and/or associations.
Generally, the surveys found that the general level of competition between businesses in the area was good with:
o 12.7% saying competition between businesses in the area was very strong
o 41% said that competition was good
o 42.2% said average
o Only 2.9% said that it was poor
o Only 2 businesses said that completion was very poor – 1.2% of those surveyed
When asked what business development assistance the owners would seek, 47.8% said marketing assistance, 21.1% said staff training and customer service development, 15.8% said business and financial planning assistance, and only 7.9% would seek environmental development assistance.
Refer to Annexure A for the complete survey results.
3.2 In centre Survey
The in centre survey was conducted at nine shopping centres in Whitehorse throughout June 2010, collecting the view of 350 respondents. The centres surveyed were Blackburn Station Village, Box Hill, Brentford Square, Kmart / East Burwood Plaza, Forest Hill, Kerrimuir, Nunawading/MegaMile, Mitcham and Vermont South.
Questions centred around the demographic characteristics of the shoppers and their views on the characteristics of the centre in which they were surveyed. Further questions were asked with regards to other centres they frequented and the purchases they made at those centres.

City of Whitehorse
Retail Strategy Review
Prepared for City of Whitehorse MacroPlan Australia Pty Ltd August 2010 37
Figure 12. In-centre Survey Structure
Source: MacroPlan Australia, 2010
Personal Characteristics
Of the respondents in the in-centre survey, 81% were the primary purchaser in the household.
There was a more even gender spread than the resident survey (discussed further below) with 59% being female and 41% male.
The majority of those surveyed were middle-aged, with 34% within the 35 to 54 age bracket, while 28% were aged 55 to 74, 26% aged 18 to 34 and the remainder aged under 18 or over the age of 75.
31% of those surveyed were employed full time, 15% part time and 8% casually, while the remaining 46% were not in the labour force.
Destination Characteristics
Personal Characteristic
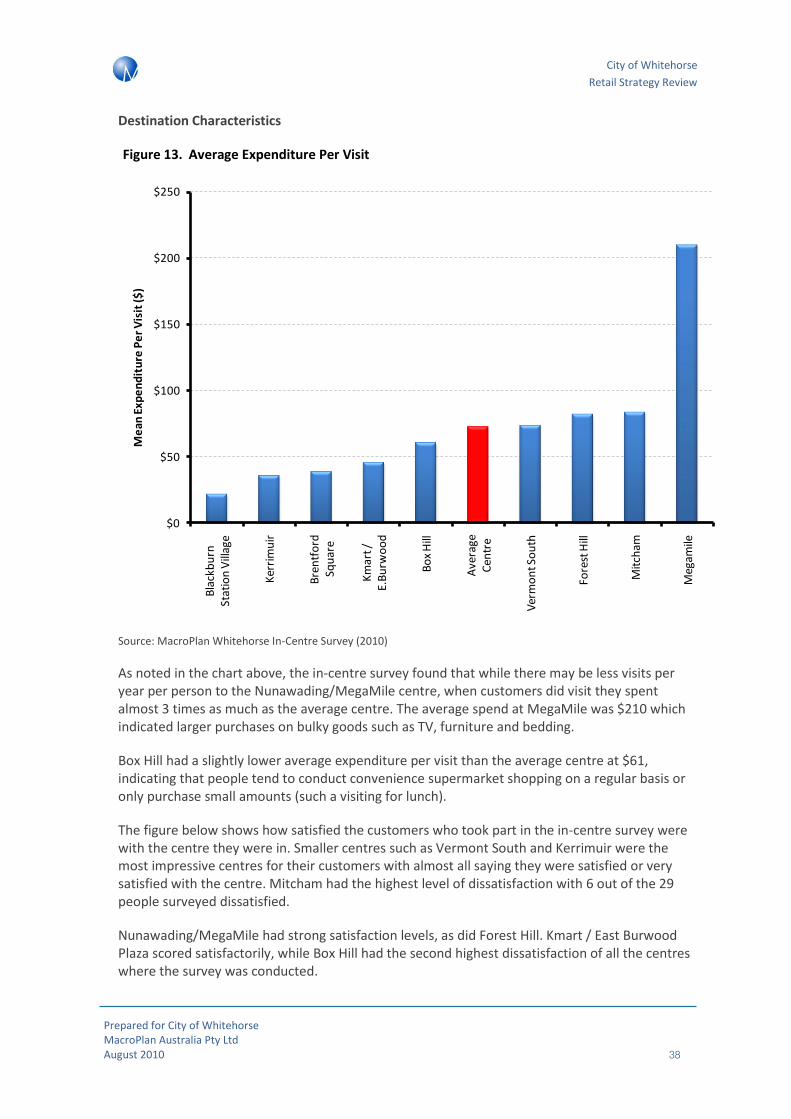
City of Whitehorse
Retail Strategy Review
Prepared for City of Whitehorse MacroPlan Australia Pty Ltd August 2010 38
Destination Characteristics
Figure 13. Average Expenditure Per Visit
Source: MacroPlan Whitehorse In-Centre Survey (2010)
As noted in the chart above, the in-centre survey found that while there may be less visits per year per person to the Nunawading/MegaMile centre, when customers did visit they spent almost 3 times as much as the average centre. The average spend at MegaMile was $210 which indicated larger purchases on bulky goods such as TV, furniture and bedding.
Box Hill had a slightly lower average expenditure per visit than the average centre at $61, indicating that people tend to conduct convenience supermarket shopping on a regular basis or only purchase small amounts (such a visiting for lunch).
The figure below shows how satisfied the customers who took part in the in-centre survey were with the centre they were in. Smaller centres such as Vermont South and Kerrimuir were the most impressive centres for their customers with almost all saying they were satisfied or very satisfied with the centre. Mitcham had the highest level of dissatisfaction with 6 out of the 29 people surveyed dissatisfied.
Nunawading/MegaMile had strong satisfaction levels, as did Forest Hill. Kmart / East Burwood Plaza scored satisfactorily, while Box Hill had the second highest dissatisfaction of all the centres where the survey was conducted.
$0
$50
$100
$150
$200
$250
Bla
ckb
urn
St
atio
n V
illag
e
Ker
rim
uir
Bre
ntf
ord
Sq
uar
e
Km
art /
E.
Bu
rwo
od
Bo
x H
ill
Ave
rage
C
entr
e
Ver
mo
nt S
ou
th
Fore
st H
ill
Mit
cham
Meg
amile
Me
an E
xpe
nd
itu
re P
er
Vis
it (
$)
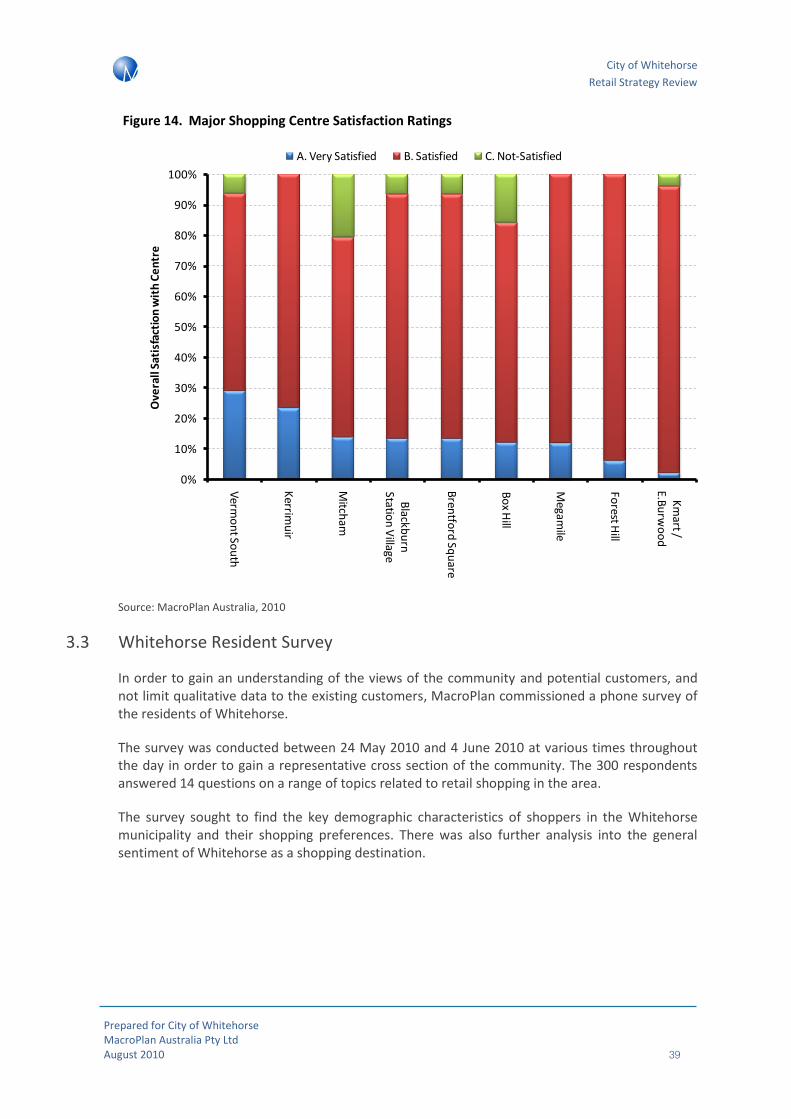
City of Whitehorse
Retail Strategy Review
Prepared for City of Whitehorse MacroPlan Australia Pty Ltd August 2010 39
Figure 14. Major Shopping Centre Satisfaction Ratings
Source: MacroPlan Australia, 2010
3.3 Whitehorse Resident Survey
In order to gain an understanding of the views of the community and potential customers, and not limit qualitative data to the existing customers, MacroPlan commissioned a phone survey of the residents of Whitehorse.
The survey was conducted between 24 May 2010 and 4 June 2010 at various times throughout the day in order to gain a representative cross section of the community. The 300 respondents answered 14 questions on a range of topics related to retail shopping in the area.
The survey sought to find the key demographic characteristics of shoppers in the Whitehorse municipality and their shopping preferences. There was also further analysis into the general sentiment of Whitehorse as a shopping destination.
0%
10%
20%
30%
40%
50%
60%
70%
80%
90%
100%
Verm
on
t Sou
th
Kerrim
uir
Mitch
am
Blackb
urn
Statio
n V
illage
Bren
tford
Squ
are
Bo
x Hill
Megam
ile
Forest H
ill
Km
art / E.B
urw
oo
d
Ove
rall
Sat
isfa
ctio
n w
ith
Ce
ntr
eA. Very Satisfied B. Satisfied C. Not-Satisfied
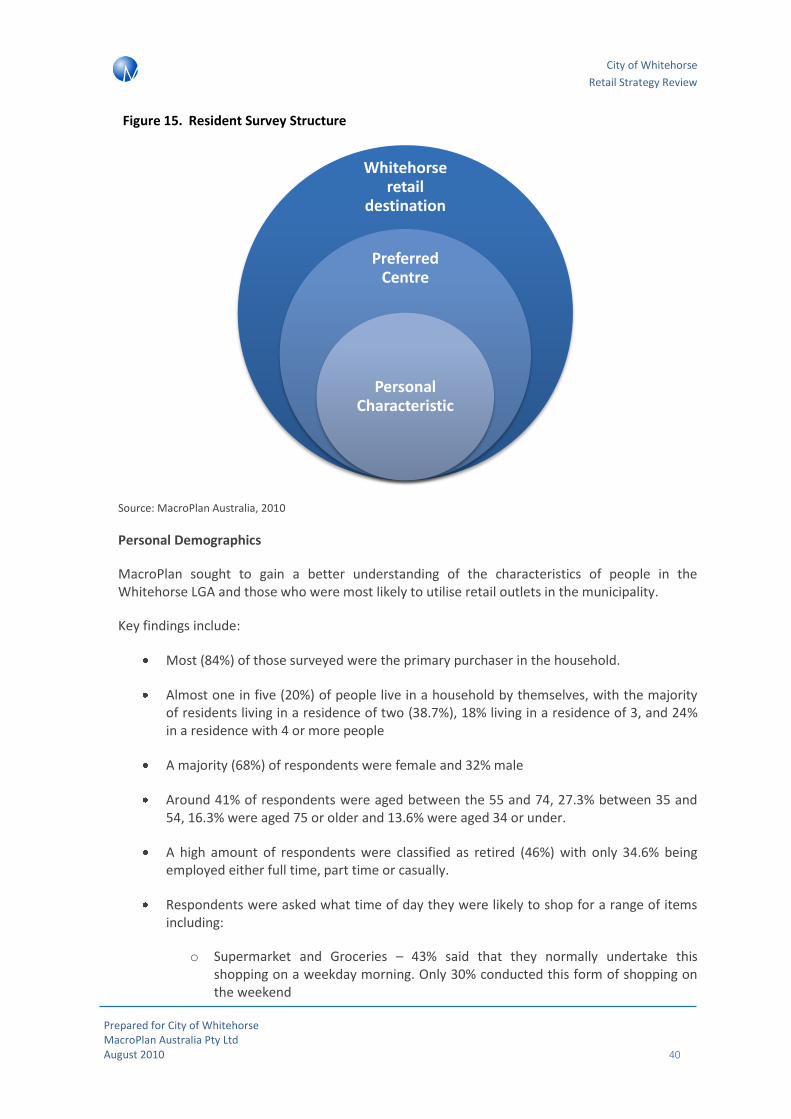
City of Whitehorse
Retail Strategy Review
Prepared for City of Whitehorse MacroPlan Australia Pty Ltd August 2010 40
Figure 15. Resident Survey Structure
Source: MacroPlan Australia, 2010
Personal Demographics
MacroPlan sought to gain a better understanding of the characteristics of people in the Whitehorse LGA and those who were most likely to utilise retail outlets in the municipality.
Key findings include:
Most (84%) of those surveyed were the primary purchaser in the household.
Almost one in five (20%) of people live in a household by themselves, with the majority of residents living in a residence of two (38.7%), 18% living in a residence of 3, and 24% in a residence with 4 or more people
A majority (68%) of respondents were female and 32% male
Around 41% of respondents were aged between the 55 and 74, 27.3% between 35 and 54, 16.3% were aged 75 or older and 13.6% were aged 34 or under.
A high amount of respondents were classified as retired (46%) with only 34.6% being employed either full time, part time or casually.
Respondents were asked what time of day they were likely to shop for a range of items including:
o Supermarket and Groceries – 43% said that they normally undertake this shopping on a weekday morning. Only 30% conducted this form of shopping on the weekend
Whitehorse retail
destination
Preferred Centre
Personal Characteristic
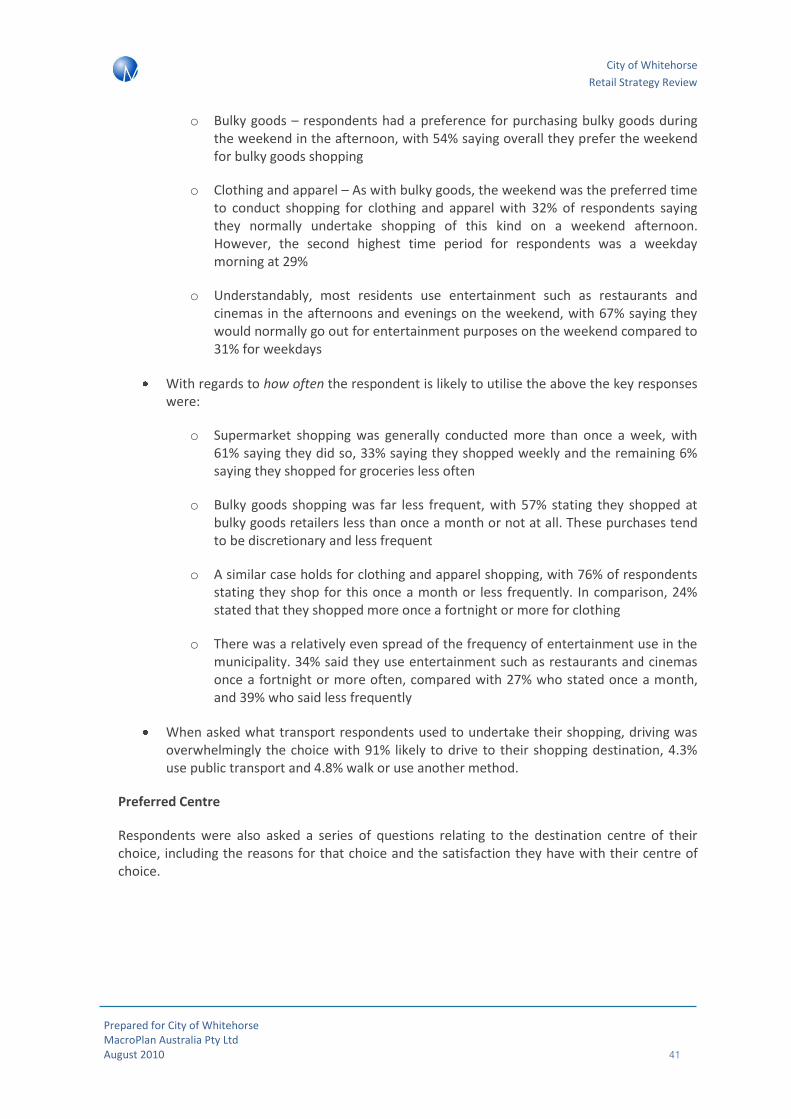
City of Whitehorse
Retail Strategy Review
Prepared for City of Whitehorse MacroPlan Australia Pty Ltd August 2010 41
o Bulky goods – respondents had a preference for purchasing bulky goods during the weekend in the afternoon, with 54% saying overall they prefer the weekend for bulky goods shopping
o Clothing and apparel – As with bulky goods, the weekend was the preferred time to conduct shopping for clothing and apparel with 32% of respondents saying they normally undertake shopping of this kind on a weekend afternoon. However, the second highest time period for respondents was a weekday morning at 29%
o Understandably, most residents use entertainment such as restaurants and cinemas in the afternoons and evenings on the weekend, with 67% saying they would normally go out for entertainment purposes on the weekend compared to 31% for weekdays
With regards to how often the respondent is likely to utilise the above the key responses were:
o Supermarket shopping was generally conducted more than once a week, with 61% saying they did so, 33% saying they shopped weekly and the remaining 6% saying they shopped for groceries less often
o Bulky goods shopping was far less frequent, with 57% stating they shopped at bulky goods retailers less than once a month or not at all. These purchases tend to be discretionary and less frequent
o A similar case holds for clothing and apparel shopping, with 76% of respondents stating they shop for this once a month or less frequently. In comparison, 24% stated that they shopped more once a fortnight or more for clothing
o There was a relatively even spread of the frequency of entertainment use in the municipality. 34% said they use entertainment such as restaurants and cinemas once a fortnight or more often, compared with 27% who stated once a month, and 39% who said less frequently
When asked what transport respondents used to undertake their shopping, driving was overwhelmingly the choice with 91% likely to drive to their shopping destination, 4.3% use public transport and 4.8% walk or use another method.
Preferred Centre
Respondents were also asked a series of questions relating to the destination centre of their choice, including the reasons for that choice and the satisfaction they have with their centre of choice.
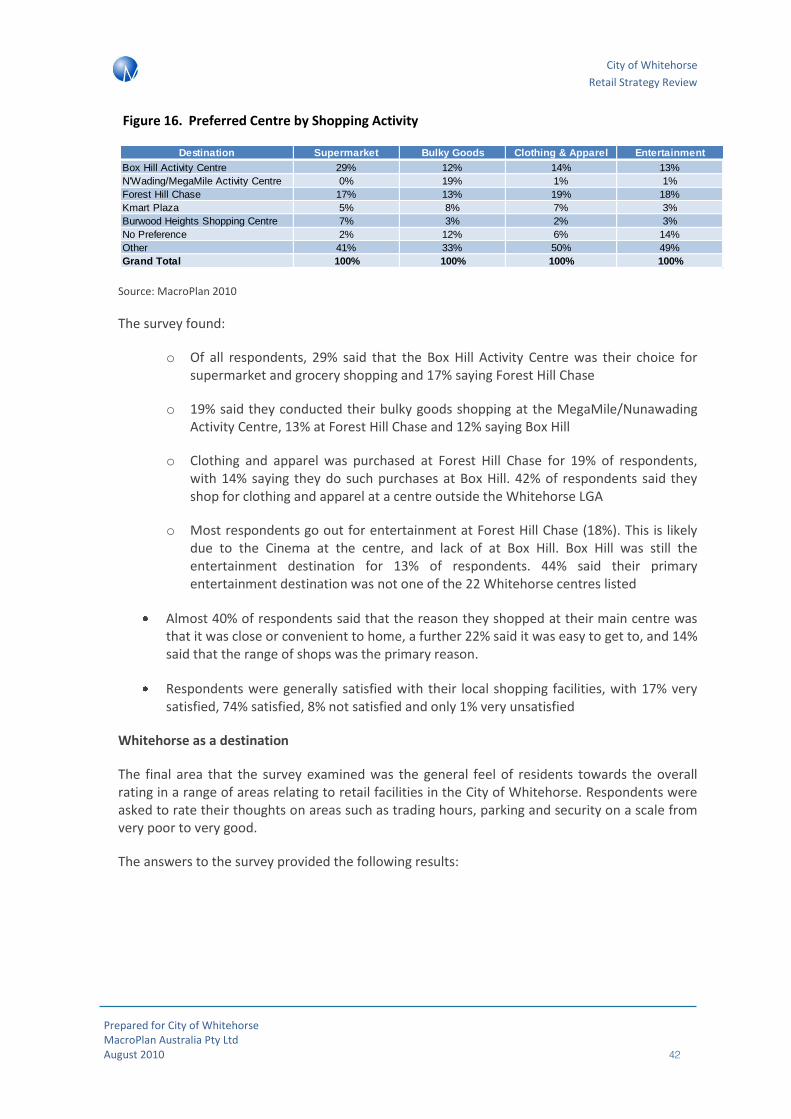
City of Whitehorse
Retail Strategy Review
Prepared for City of Whitehorse MacroPlan Australia Pty Ltd August 2010 42
Figure 16. Preferred Centre by Shopping Activity
Source: MacroPlan 2010
The survey found:
o Of all respondents, 29% said that the Box Hill Activity Centre was their choice for supermarket and grocery shopping and 17% saying Forest Hill Chase
o 19% said they conducted their bulky goods shopping at the MegaMile/Nunawading Activity Centre, 13% at Forest Hill Chase and 12% saying Box Hill
o Clothing and apparel was purchased at Forest Hill Chase for 19% of respondents, with 14% saying they do such purchases at Box Hill. 42% of respondents said they shop for clothing and apparel at a centre outside the Whitehorse LGA
o Most respondents go out for entertainment at Forest Hill Chase (18%). This is likely due to the Cinema at the centre, and lack of at Box Hill. Box Hill was still the entertainment destination for 13% of respondents. 44% said their primary entertainment destination was not one of the 22 Whitehorse centres listed
Almost 40% of respondents said that the reason they shopped at their main centre was that it was close or convenient to home, a further 22% said it was easy to get to, and 14% said that the range of shops was the primary reason.
Respondents were generally satisfied with their local shopping facilities, with 17% very satisfied, 74% satisfied, 8% not satisfied and only 1% very unsatisfied
Whitehorse as a destination
The final area that the survey examined was the general feel of residents towards the overall rating in a range of areas relating to retail facilities in the City of Whitehorse. Respondents were asked to rate their thoughts on areas such as trading hours, parking and security on a scale from very poor to very good.
The answers to the survey provided the following results:
Destination Supermarket Bulky Goods Clothing & Apparel Entertainment
Box Hill Activity Centre 29% 12% 14% 13%
N'Wading/MegaMile Activity Centre 0% 19% 1% 1%
Forest Hill Chase 17% 13% 19% 18%
Kmart Plaza 5% 8% 7% 3%
Burwood Heights Shopping Centre 7% 3% 2% 3%
No Preference 2% 12% 6% 14%
Other 41% 33% 50% 49%
Grand Total 100% 100% 100% 100%

City of Whitehorse
Retail Strategy Review
Prepared for City of Whitehorse MacroPlan Australia Pty Ltd August 2010 43
Figure 17. Satisfaction with Whitehorse as a Retail Destination - A
Source: MacroPlan Australia, 2010
Figure 18. Satisfaction with Whitehorse as a Retail Destination - B
Source: MacroPlan Australia, 2010
Generally, all areas scored relatively well with respondents.
It appears there is some relative discontent with the level of convenient car parking in the municipality with an even split between respondents who say that convenient car parking is good overall and those who say it is average or poor overall
Price levels in the municipality are also not as favourable
0%
10%
20%
30%
40%
50%
60%
70%
80%
90%
100%
Facilities
Tradin
g H
ou
rs
A/h
ou
rs services
Level of
security
Level of
cho
ice
Facility am
enity
Car p
arking
Price p
oin
tO
vera
l Sat
isfa
ctio
n w
ith
loca
l are
a
Poor Average Good
Very Poor Poor Average Good Very Good Total
Facilities 3.0% 4.0% 17.3% 51.7% 24.0% 100.0%
Trading Hours 0.3% 1.3% 18.0% 49.7% 30.7% 100.0%
After hours services 1.7% 4.3% 45.3% 36.3% 12.3% 100.0%
Level of security 5.0% 7.3% 30.3% 41.7% 15.7% 100.0%
Level of choice 2.0% 7.3% 24.3% 44.7% 21.7% 100.0%
Presentation of facilities 4.3% 7.3% 22.0% 45.3% 21.0% 100.0%
Convenient car parking 6.0% 8.0% 25.3% 27.3% 33.3% 100.0%
Price point 3.3% 6.7% 39.0% 39.7% 11.3% 100.0%
City of Whitehorse
Retail Strategy Review
Prepared for City of Whitehorse MacroPlan Australia Pty Ltd August 2010 44
Respondents tend to be very happy with the trading hours, with 80.3% saying they are good overall, however on the question of afterhours services, there are only 48.7% of respondents saying they are good overall. This could be in response to key essential services (medical, law and order etc.) rather than shopping outlets overall.
Approximately three-quarters (75.7%) of respondents believe the facilities are good or very good, and around two-thirds (66.3%) believe the presentation of facilities is good or very good. This points to a favourable response of Whitehorse residents to the facilities, but scope for improvement.
42.6% said that security in the local area was average or poor – pointing to another area of potential improvements for the City of Whitehorse.
3.4 Business Associations
In addition to the business, resident and shopper surveys with the project brief, MacroPlan project staff also undertook a number of consultations with a range of business associations.
The following overview of these consultations is not designed to make judgements about the views expressed. Discussion of the issues raised through this consultation process is analysed through the remainder of this report.
These consultations included:
Asian Business Association of Whitehorse Inc
Blackburn Chamber of Commerce. Traders' Association
Brentford Square Traders Association
Burwood Heights Business Association
Mont Albert Village Association
Whitehorse Business Group
All parties positively welcomed the opportunity to our request to discuss their various centres and their respective views about a range of issues relevant to Whitehorse. A number of parties are also not unexpectedly keenly interested to know the outcomes of Council’s policy development. It is recommended that at the appropriate time after Council’s consideration of this matter, that the specific stakeholders be advised accordingly.
Support for Council’s policy review
There was general support for Council’s review process to give improved policy direction to retail development and maximise the opportunity to update Council’s current strategic planning approach.

City of Whitehorse
Retail Strategy Review
Prepared for City of Whitehorse MacroPlan Australia Pty Ltd August 2010 45
There was clear support for Council acting quickly in considering its strategic planning approach and understanding time constraints of businesses for input into Council policy and special area rates reviews.
Strategic issues
There were a range of strategic planning issues raised including:
There was also a general view that there is a need to ensure that additions to the retail hierarchy are maintained for their original purpose. This was expressed explicitly for the Burwood Square development to ensure this development was delivered as an optimal outcome for the community in line with the development plan and not transform into a competing local shopping node.
Strong supported was given for the improvement in signage and place making for each centre. In particular, special rate centres highlighted the importance of signage from a marketing perspective, and queried the appropriateness of signage to be considered infrastructure issue in isolation.
Most parties recognised ongoing support for the specialised role, identity and the positive enhancements for each centre.
Most parties recognised that local employment and local convenience retail supporting residential populations was desirable.
A number of the stakeholders considered that the investment in time and resources, and the substantial capital required for their respective sites is undermined if it is not supported by an effective framework for the region.
Most stakeholders considered that lengthy and unnecessary legal planning appeals that delayed desired planning outcomes was undesirable.
General support for special area rate was highlighted where used appropriately.
Some stakeholders expressed concern for the structure of the City of Whitehorse Planning, Economic Development and Corporate Service teams, and their respective issues for local businesses.
3.5 Summary
The results of all three surveys were generally positive, revealing a well-functioning retail sector throughout the Whitehorse LGA. Overall, Whitehorse is viewed by respondents as a desirable shopping destination and by business owners as a good place to do business.
The primary issues of concern for local business owners revolve around the state of the economy and not around issues for which Council is responsible. Issues of concern that may be addressed by Council involve increasing convenient car parking and providing additional signage which may have the additional benefit of contributing to the identity of the centre.

City of Whitehorse
Retail Strategy Review
Prepared for City of Whitehorse MacroPlan Australia Pty Ltd August 2010 46
The shopping habits of residents is of important consideration in regard to the diversification of shopping hours. Council’s development assessment team should consider a supportive approach to the delivery of supermarkets, particularly in underperforming retail centres that improve convenience for the residents.
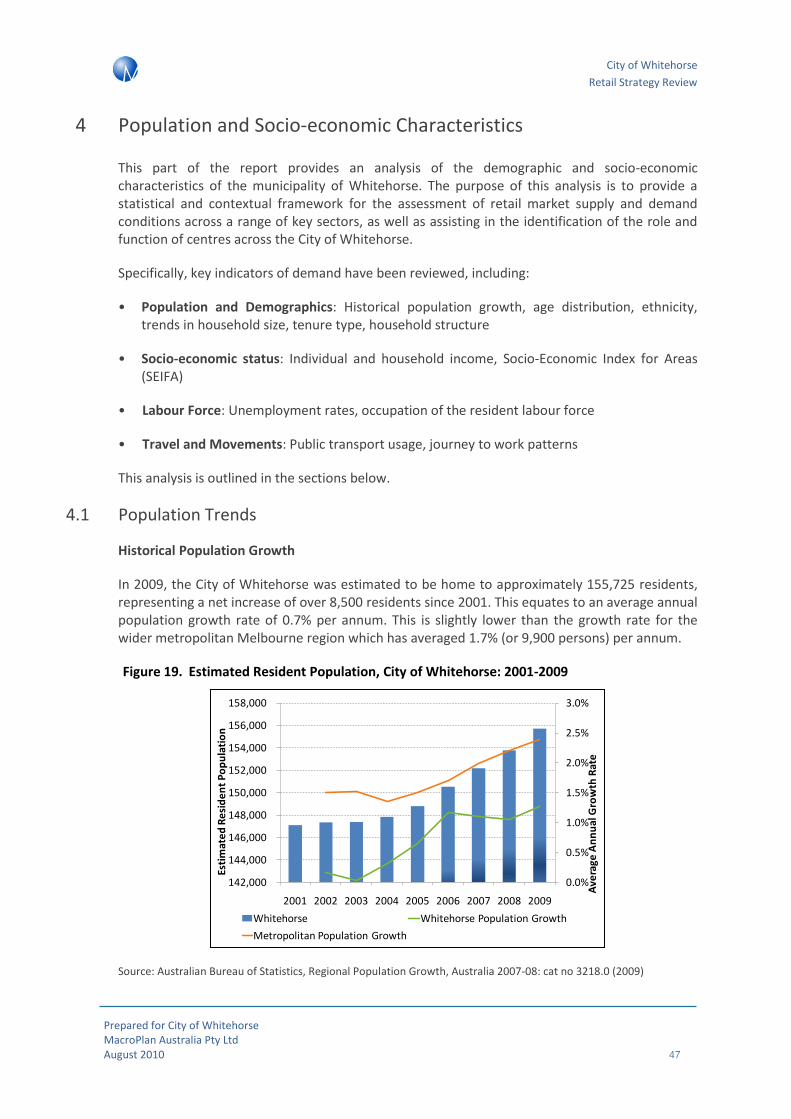
City of Whitehorse
Retail Strategy Review
Prepared for City of Whitehorse MacroPlan Australia Pty Ltd August 2010 47
4 Population and Socio-economic Characteristics
This part of the report provides an analysis of the demographic and socio-economic characteristics of the municipality of Whitehorse. The purpose of this analysis is to provide a statistical and contextual framework for the assessment of retail market supply and demand conditions across a range of key sectors, as well as assisting in the identification of the role and function of centres across the City of Whitehorse.
Specifically, key indicators of demand have been reviewed, including:
• Population and Demographics: Historical population growth, age distribution, ethnicity, trends in household size, tenure type, household structure
• Socio-economic status: Individual and household income, Socio-Economic Index for Areas (SEIFA)
• Labour Force: Unemployment rates, occupation of the resident labour force
• Travel and Movements: Public transport usage, journey to work patterns
This analysis is outlined in the sections below.
4.1 Population Trends
Historical Population Growth
In 2009, the City of Whitehorse was estimated to be home to approximately 155,725 residents, representing a net increase of over 8,500 residents since 2001. This equates to an average annual population growth rate of 0.7% per annum. This is slightly lower than the growth rate for the wider metropolitan Melbourne region which has averaged 1.7% (or 9,900 persons) per annum.
Figure 19. Estimated Resident Population, City of Whitehorse: 2001-2009
Source: Australian Bureau of Statistics, Regional Population Growth, Australia 2007-08: cat no 3218.0 (2009)
0.0%
0.5%
1.0%
1.5%
2.0%
2.5%
3.0%
142,000
144,000
146,000
148,000
150,000
152,000
154,000
156,000
158,000
2001 2002 2003 2004 2005 2006 2007 2008 2009
Ave
rage
An
nu
al G
row
th R
ate
Esti
mat
ed
Re
sid
en
t P
op
ula
tio
n
Whitehorse Whitehorse Population Growth
Metropolitan Population Growth
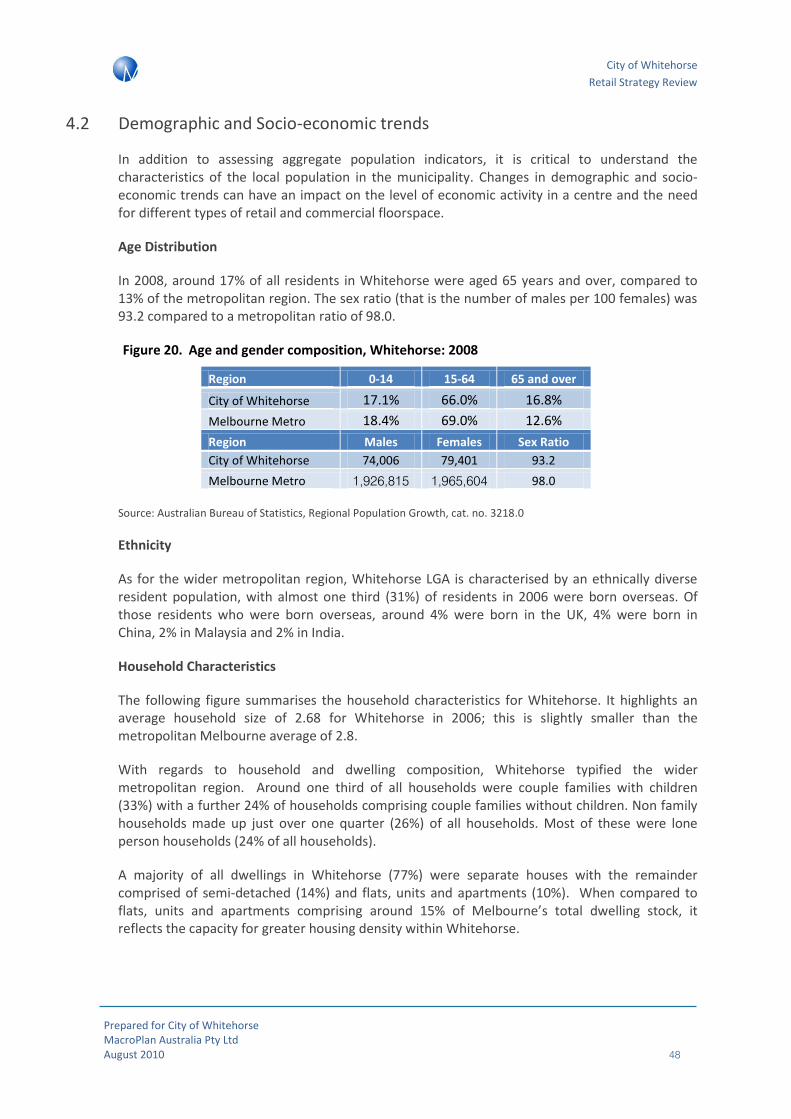
City of Whitehorse
Retail Strategy Review
Prepared for City of Whitehorse MacroPlan Australia Pty Ltd August 2010 48
4.2 Demographic and Socio-economic trends
In addition to assessing aggregate population indicators, it is critical to understand the characteristics of the local population in the municipality. Changes in demographic and socio-economic trends can have an impact on the level of economic activity in a centre and the need for different types of retail and commercial floorspace.
Age Distribution
In 2008, around 17% of all residents in Whitehorse were aged 65 years and over, compared to 13% of the metropolitan region. The sex ratio (that is the number of males per 100 females) was 93.2 compared to a metropolitan ratio of 98.0.
Figure 20. Age and gender composition, Whitehorse: 2008
Region 0-14 15-64 65 and over
City of Whitehorse 17.1% 66.0% 16.8%
Melbourne Metro 18.4% 69.0% 12.6%
Region Males Females Sex Ratio
City of Whitehorse 74,006 79,401 93.2
Melbourne Metro 1,926,815 1,965,604 98.0
Source: Australian Bureau of Statistics, Regional Population Growth, cat. no. 3218.0
Ethnicity
As for the wider metropolitan region, Whitehorse LGA is characterised by an ethnically diverse resident population, with almost one third (31%) of residents in 2006 were born overseas. Of those residents who were born overseas, around 4% were born in the UK, 4% were born in China, 2% in Malaysia and 2% in India.
Household Characteristics
The following figure summarises the household characteristics for Whitehorse. It highlights an average household size of 2.68 for Whitehorse in 2006; this is slightly smaller than the metropolitan Melbourne average of 2.8.
With regards to household and dwelling composition, Whitehorse typified the wider metropolitan region. Around one third of all households were couple families with children (33%) with a further 24% of households comprising couple families without children. Non family households made up just over one quarter (26%) of all households. Most of these were lone person households (24% of all households).
A majority of all dwellings in Whitehorse (77%) were separate houses with the remainder comprised of semi-detached (14%) and flats, units and apartments (10%). When compared to flats, units and apartments comprising around 15% of Melbourne’s total dwelling stock, it reflects the capacity for greater housing density within Whitehorse.
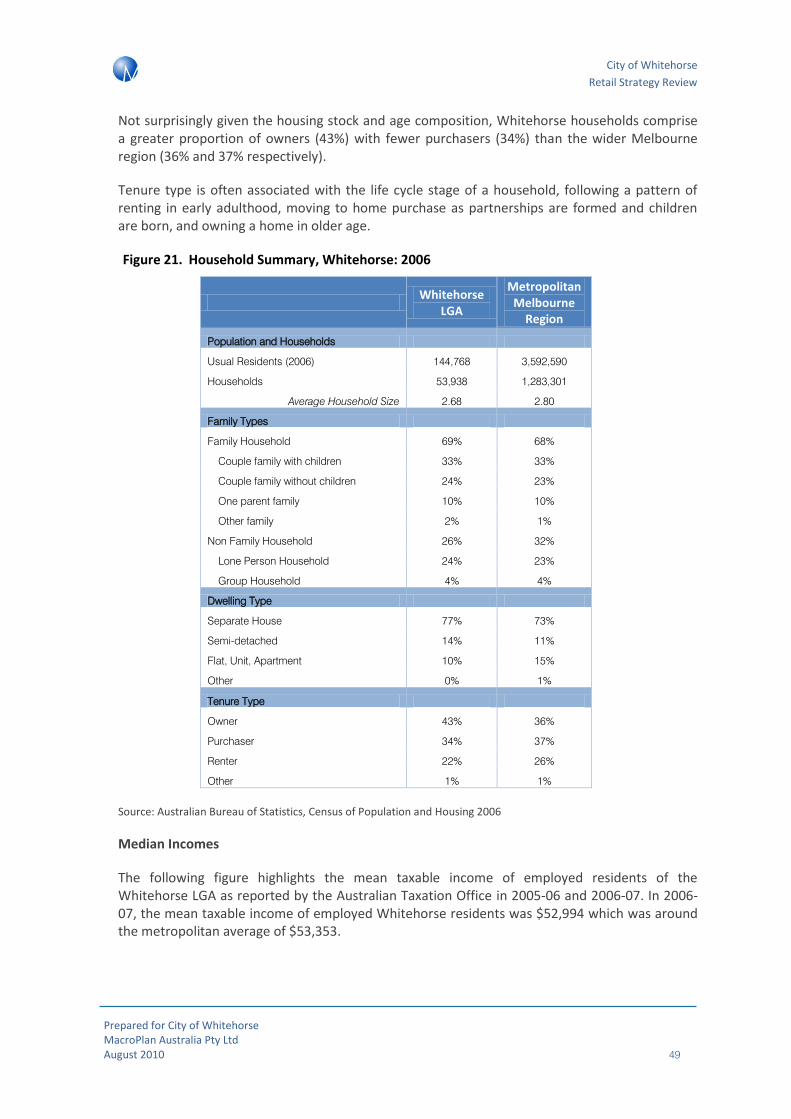
City of Whitehorse
Retail Strategy Review
Prepared for City of Whitehorse MacroPlan Australia Pty Ltd August 2010 49
Not surprisingly given the housing stock and age composition, Whitehorse households comprise a greater proportion of owners (43%) with fewer purchasers (34%) than the wider Melbourne region (36% and 37% respectively).
Tenure type is often associated with the life cycle stage of a household, following a pattern of renting in early adulthood, moving to home purchase as partnerships are formed and children are born, and owning a home in older age.
Figure 21. Household Summary, Whitehorse: 2006
Whitehorse
LGA
Metropolitan Melbourne
Region
Population and Households
Usual Residents (2006) 144,768 3,592,590
Households 53,938 1,283,301
Average Household Size 2.68 2.80
Family Types
Family Household 69% 68%
Couple family with children 33% 33%
Couple family without children 24% 23%
One parent family 10% 10%
Other family 2% 1%
Non Family Household 26% 32%
Lone Person Household 24% 23%
Group Household 4% 4%
Dwelling Type
Separate House 77% 73%
Semi-detached 14% 11%
Flat, Unit, Apartment 10% 15%
Other 0% 1%
Tenure Type
Owner 43% 36%
Purchaser 34% 37%
Renter 22% 26%
Other 1% 1%
Source: Australian Bureau of Statistics, Census of Population and Housing 2006
Median Incomes
The following figure highlights the mean taxable income of employed residents of the Whitehorse LGA as reported by the Australian Taxation Office in 2005-06 and 2006-07. In 2006-07, the mean taxable income of employed Whitehorse residents was $52,994 which was around the metropolitan average of $53,353.

City of Whitehorse
Retail Strategy Review
Prepared for City of Whitehorse MacroPlan Australia Pty Ltd August 2010 50
Figure 22. Median Annual Individual Incomes, Whitehorse LGA
Year Taxable
Individuals
Mean Individual Taxable Income
Mean Individual
Taxable Income -Melbourne
Variation from
Melbourne Metro
2005-06 72,660 $48,512 $48,722 -0.4%
2006-07 70,785 $52,994 $53,353 -0.7%
Source: Australian Taxation Office
Socio-Economic Index for Areas (SEIFA)
The Socio Economic Index for Areas – Advantage / Disadvantage is a summary measure of an area’s relative advantage or disadvantage. It is created using information about people and households at the Census Collection District (CCD) level.
The index for advantage / disadvantage takes into account 21 variables including (but not limited to) education levels, income levels, car ownership, skilled vs. non skilled workers and dwelling payments (rents and mortgages). This score is standardised against a mean of 1,000; areas with a score below 1,000 are seen to be relatively disadvantaged while areas with a score above 1,000 are perceived to be advantaged.
It is important to note that SEIFA uses a broad definition of relative socio-economic disadvantage and while it represents an average of all people living in an area, it does not represent the individual situation of each person and larger areas are more likely to have greater diversity of people and households.
At a whole-of-municipality (LGA) level, Whitehorse is considered to be at an average level of socio-economic advantage/disadvantage, with a score of 1,066. This is slightly higher than the mean score of 1,000. The SEIFA scores for each CD in the LGA are depicted in the following figure.
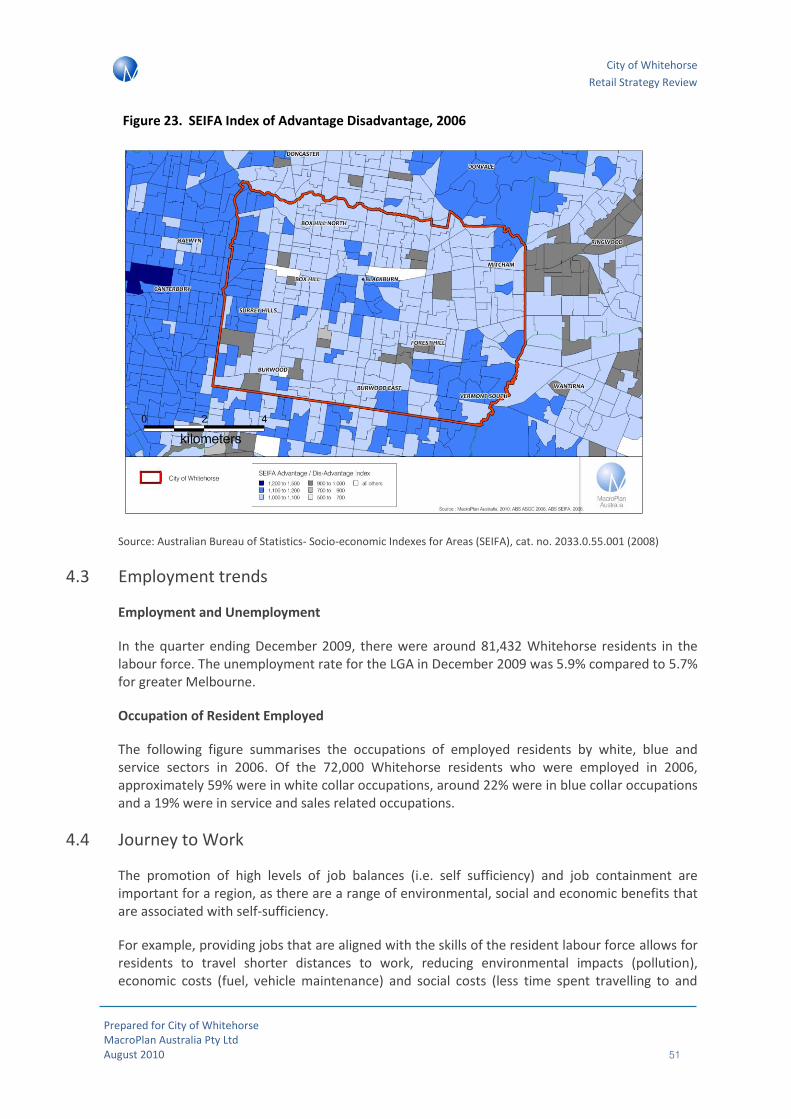
City of Whitehorse
Retail Strategy Review
Prepared for City of Whitehorse MacroPlan Australia Pty Ltd August 2010 51
Figure 23. SEIFA Index of Advantage Disadvantage, 2006
Source: Australian Bureau of Statistics- Socio-economic Indexes for Areas (SEIFA), cat. no. 2033.0.55.001 (2008)
4.3 Employment trends
Employment and Unemployment
In the quarter ending December 2009, there were around 81,432 Whitehorse residents in the labour force. The unemployment rate for the LGA in December 2009 was 5.9% compared to 5.7% for greater Melbourne.
Occupation of Resident Employed
The following figure summarises the occupations of employed residents by white, blue and service sectors in 2006. Of the 72,000 Whitehorse residents who were employed in 2006, approximately 59% were in white collar occupations, around 22% were in blue collar occupations and a 19% were in service and sales related occupations.
4.4 Journey to Work
The promotion of high levels of job balances (i.e. self sufficiency) and job containment are important for a region, as there are a range of environmental, social and economic benefits that are associated with self-sufficiency.
For example, providing jobs that are aligned with the skills of the resident labour force allows for residents to travel shorter distances to work, reducing environmental impacts (pollution), economic costs (fuel, vehicle maintenance) and social costs (less time spent travelling to and
City of Whitehorse
Retail Strategy Review
Prepared for City of Whitehorse MacroPlan Australia Pty Ltd August 2010 52
from place of work) for residents. High job containment also benefits the local economy as the expenditure of workers/residents is then retained in the region.
Key findings from the ABS Journey to Work, 2006 data are as follows:
Job containment in the City of Whitehorse was estimated at 26%. This means that 26% of residents (17,700 persons) both lived and worked within the municipal boundary.
Job balance (i.e. self sufficiency) was estimated at 87%. This means there were around 9 jobs for every 10 employed residents within the City of Whitehorse.
4.5 Summary
The City of Whitehorse is characterised by a diverse population both in age and ethnicity with a greater percentage of residents 65+ years than metropolitan Melbourne and almost one third of the population born abroad. However, compared to the metropolitan region, the area is comprised of an average population from a socio-economic perspective. In particular, residents in Whitehorse had similar taxable incomes compared to greater Melbourne. SEIFA scores in the area were 1,066 (where the mean score is 1,000) despite a median individual taxable income that was below the metropolitan average.
Generally residents are less likely to be renters and purchasers compared to the metropolitan region. This corresponds with the older population that have generally transitioned out of the rental phase of the housing life cycle.
City of Whitehorse
Retail Strategy Review
Prepared for City of Whitehorse MacroPlan Australia Pty Ltd August 2010 53
5 Retail Supply Analysis
MacroPlan has investigated existing retail context and supply in order to assess and make recommendations as to the future allocation of retail floor space in the City of Whitehorse.
This section of the report will outline the types of centres within the Whitehorse LGA and assess the potential, if any, for further addition of floor space to the centres in future.
5.1 Supply Definitions
At the outset, the consideration of the retail market and the distribution of floor space in the study area is important. This allows for consideration of how the market is operating and whether there are significant gaps or surpluses in the allocation of floor space based on the relative designation of centres and different hierarchical definitions.
As per City of Whitehorse strategy documents, MacroPlan has investigated activity centres with respect to the current activity centre hierarchy and potential changes to this hierarchy in future. Centres within Whitehorse are separated into the following categories.
Central Activities District (CAD) – There are only seven CADs throughout Victoria with Box Hill being the second largest outside of the Melbourne CBD. According to Melbourne 2030, CADs provide an essential ‘capital city’ role with a strong mix of retail, commercial, cultural, administrative and civic centre trade and function.
Major Activity Centre (MAC) – MACs play a significant secondary economic role to their surrounding areas, with the provision of retail, commercial and cultural activity and are commonly well linked to public transport. Major Activity Centres will generally have more than 10,000sq.m of retail floor space.
Neighbourhood Activity Centre (NAC) - NACs play an important ‘community’ based role in servicing the every-day needs of residents who live within close proximity to the centre. They are generally classified as:
o Large– up to 10,000sq.m of retail floor space
o Medium – up to 2,500sq.m of retail floor space
o Small – 100sq.m-1000sq.m of retail floor space
Section 5 below outlines the total current floor space in the City of Whitehorse, categorised by the centres classification. Furthermore, Section 7 of this report examines four key activity centres in the municipality – Box Hill, Forest Hill, Nunawading/MegaMile and Kmart / East Burwood Plaza – and their competitiveness against other centres based upon economic, social and environmental factors.
5.2 Existing Supply
This section of the report outlines the current supply of retail floor space in the City of Whitehorse, along with brief descriptions of the larger centres in terms of anchors, size, amenity and accessibility.
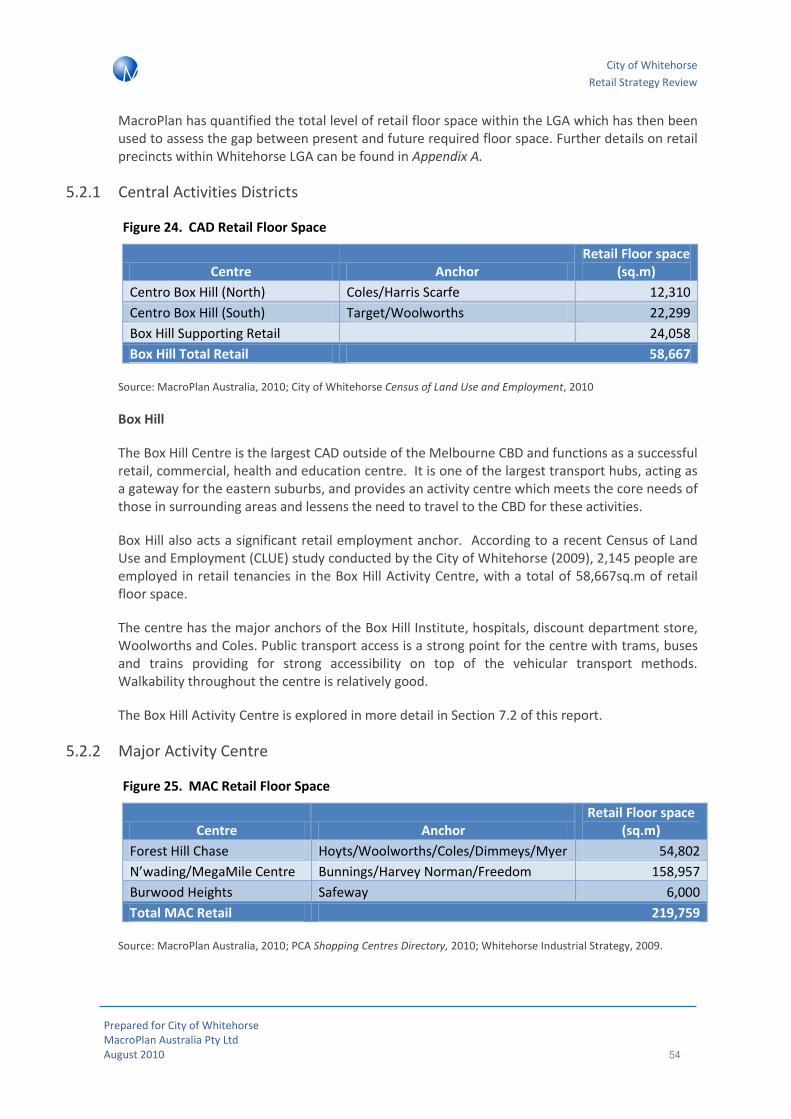
City of Whitehorse
Retail Strategy Review
Prepared for City of Whitehorse MacroPlan Australia Pty Ltd August 2010 54
MacroPlan has quantified the total level of retail floor space within the LGA which has then been used to assess the gap between present and future required floor space. Further details on retail precincts within Whitehorse LGA can be found in Appendix A.
5.2.1 Central Activities Districts
Figure 24. CAD Retail Floor Space
Centre Anchor Retail Floor space
(sq.m)
Centro Box Hill (North) Coles/Harris Scarfe 12,310
Centro Box Hill (South) Target/Woolworths 22,299
Box Hill Supporting Retail 24,058
Box Hill Total Retail 58,667
Source: MacroPlan Australia, 2010; City of Whitehorse Census of Land Use and Employment, 2010
Box Hill
The Box Hill Centre is the largest CAD outside of the Melbourne CBD and functions as a successful retail, commercial, health and education centre. It is one of the largest transport hubs, acting as a gateway for the eastern suburbs, and provides an activity centre which meets the core needs of those in surrounding areas and lessens the need to travel to the CBD for these activities.
Box Hill also acts a significant retail employment anchor. According to a recent Census of Land Use and Employment (CLUE) study conducted by the City of Whitehorse (2009), 2,145 people are employed in retail tenancies in the Box Hill Activity Centre, with a total of 58,667sq.m of retail floor space.
The centre has the major anchors of the Box Hill Institute, hospitals, discount department store, Woolworths and Coles. Public transport access is a strong point for the centre with trams, buses and trains providing for strong accessibility on top of the vehicular transport methods. Walkability throughout the centre is relatively good.
The Box Hill Activity Centre is explored in more detail in Section 7.2 of this report.
5.2.2 Major Activity Centre
Figure 25. MAC Retail Floor Space
Centre Anchor Retail Floor space
(sq.m)
Forest Hill Chase Hoyts/Woolworths/Coles/Dimmeys/Myer 54,802
N’wading/MegaMile Centre Bunnings/Harvey Norman/Freedom 158,957
Burwood Heights Safeway 6,000
Total MAC Retail 219,759
Source: MacroPlan Australia, 2010; PCA Shopping Centres Directory, 2010; Whitehorse Industrial Strategy, 2009.

City of Whitehorse
Retail Strategy Review
Prepared for City of Whitehorse MacroPlan Australia Pty Ltd August 2010 55
Nunawading/MegaMile Activity Centre
The MegaMile centre is stretched across nearly 4km of Whitehorse Road along the east and west sides of Springvale Road. It is estimated that the centre has almost 160,000sq.m of retail floor space with some of the key tenants being Bunnings, Harvey Norman, Freedom and the Good Guys. Furthermore, automotive outlets include Toyota, Lexus and Chrysler.
The Nunawading centre has an Australia Post and a small amount of commercial and general convenience retail. The nearby Nunawading station has recently completed a $120 million redevelopment to construct an overpass at Springvale Road and make it one of the most bicycle-friendly facilities in the state with 26 secure spaces.
Access to the centre is primarily by road, however, the Blackburn, Nunawading and Mitcham rail stations are spread along the southern aspect of the centre.
The Nunawading/MegaMile MAC is explored in more detail in Section 7.3 of this report.
Forest Hill Chase Shopping Centre
Forest Hill is a prime example of a typical shopping centre layout constructed at a large scale. The centre has 50,000sq.m of retail floor space with anchor tenants Myer, Target, Big W, Coles, Woolworths and Dimmey’s and approximately 165 specialty retail stores. Furthermore, strip shops to the east of the centre accommodates approximately an extra 5,000sq.m of retail floor space.
In terms of accessibility, there are about 3,200 car bays available, and the centre is serviced by the 765 bus route.
The Forest Hill Chase Shopping Centre is explored in more detail in Section 7.4 of this report.
Burwood Heights Shopping Centre
The Burwood Heights Shopping Centre includes a full line Woolworths, office floor space and 32 businesses in centre – which includes 6000sq.m of retail floor space. Public transport access and parking at the centre is good. Future expansion of the centre across the northern side of Burwood Highway has potential to add a large amount of retail floor space to the area at the large brickworks site.
Tally Ho Activity Centre
Tally Ho is a Major Activity Centre that is located in the west of Whitehorse. MacroPlan acknowledges that the centre does not have a significant retail component and is focussed primarily around business operations. This centre has been excluded from the retail assessment study.

City of Whitehorse
Retail Strategy Review
Prepared for City of Whitehorse MacroPlan Australia Pty Ltd August 2010 56
5.2.3 Large Neighbourhood Activity Centres
To prioritise the significant amount of retail floorspace that exists at the Neighbourhood Activity Centre level, MacroPlan has broken down retail floor space within small, medium and large NACs. The key retail centres within the large NACs are as follows.
Figure 26. Key Large NAC Retail Floor Space
Source: MacroPlan Australia, 2010; City of Whitehorse Draft NAC Study, 2009.
Kmart Plaza, Burwood East
The Kmart Plaza is anchored by a large-scale 24 hour Kmart, a Coles, and 34 specialty retail outlets. The 15,000sq.m centre is currently undergoing a major expansion to double in size to approximately 30,000sq.m (or around 26,000sq.m of retail floor space). This will make this centre significantly larger than most NAC’s
Despite being somewhat disjointed, the centre is relatively easy to navigate with convenience shops facing the outside and a small number of shops inside near the entrance of Coles. A large number of car spaces are at the northern side of the centre along with a tram stop along Burwood Highway.
The Kmart Plaza is explored in more detail in Section 7.5 of this report.
Blackburn Station Village
Blackburn Station Village surrounds the Blackburn Rail Station with the main part of the centre in the south running around 250 metres along South Parade and the northern aspect of the centre stretching approximately 400 metres along Railway Road. The centre has an estimated floor
Centre Retail m2
Kmart Burwood East 15,438
Blackburn Station Village 8,000
Blackburn South Shopping Centre 30,414
Mont Albert Village Centre 15,178
Kerrimuir SC 3,398
Brentford Square SC 23,877
Bennettswood SC 5,000
Wattle Park 12,247
Mitcham 30,000
Rangeview SC 6,524
Vermont Village 13,368
North Blackburn 11,429
Vermont South SC 10,700
Burwood Village 15,300
Houston Shops 8,368
Box Hill South 30,369
Key Large NAC 239,610
City of Whitehorse
Retail Strategy Review
Prepared for City of Whitehorse MacroPlan Australia Pty Ltd August 2010 57
space of 8,000sq.m and incorporates an estimated 160 businesses, many of whom are independent operators and a newly completed IGA.
Blackburn South Shopping Centre
The centre is situated across the northern and southern aspect of busy Cantebury Road in Blackburn South. It accommodates over 30,400sq.m of retail floor space with a Woolworths as the primary anchor.
Mont Albert Village Centre
The 15,178sq.m centre is located near the Mont Albert train station and is easily accessible by both rail and by bus. However, vehicle access is problematic due to a lack of car bays, particularly along Hamilton Street. The centre is anchored by a Foodworks and the train station. A commercial/retail building located adjacent to the Foodworks has been vacant for a prolonged period of time and has the potential to be utilised for further floor space.
Kerrimuir Shopping Centre
Located across the intersections of Middleborough Road and Springfield Road, the Kerrimuir centre has a range of specialty shops and fast food outlets across 3,400sq.m of floor space. Due to the split locality, walkability is poor but vehicular accessibility is adequate.
Brentford Square Shopping Centre
The centre contains around 24,000sq.m of retail floor space and is anchored by a Woolworths. There is a very good range of services including banks, fuel, restaurants and also includes a play area for children and disability accessible shops and toilets. Despite the centres age, general accessibility and walkability throughout the centre is sufficient.
Bennettswood Shopping Centre
The Bennettswood centre contains a number of specialty shops and restaurants which cater for trade gained from Deakin University and Greenwood Office Park, located adjacent. There are a number of fast food outlets, including a Subway, across an estimated 5,000sq.m of retail floor space. A large double storey car park located across from the centre caters for the majority of required car spaces, however, access via vehicle is generally relatively poor.
Wattle Park
The Wattle Park retail centre is located across the eastern and western sides of Elgar road near the Riversdale Road intersection. Tram and car access is reasonable at the centre but walkability is quite poor. In total, the centre has around 12,200sq.m of retail floor space.
Mitcham
The Mitcham centre is located near the Mitcham train station around the corner of Whitehorse Road and Mitcham Highway and to the north of Whitehorse Road. The centre is anchored by a full line Coles and Mitcham Tavern with other specialty retail totalling approximately 30,000sq.m of retail floor space. The physical layout of the centre is slightly disjointed with the majority of parking situated at the Mitcham station or near the Coles supermarket.
City of Whitehorse
Retail Strategy Review
Prepared for City of Whitehorse MacroPlan Australia Pty Ltd August 2010 58
Rangeview Shopping Centre
The Rangeview Centre is strip shopping located at the intersection of Mitcham Road and Carween Avenue. Anchored by an IGA, the centre incorporates 6,524sq.m of retail floor space. The centre is generally accessed by car with sufficient parking available.
Vermont Village Shops
The Vermont Village Shops, located at the corner of Canterbury Road and Boronia Road, incorporate restaurants, a cafe, pharmacy, bottle shop and other strip shop retail for a total of 13,400sq.m of retail floor space. The centre has low quality access by public transport but access by car is sufficient.
North Blackburn
The North Blackburn centre has a very good range of specialty stores across 11,429sq.m of retail floor space with anchor tenancies of Woolworths, Go-Lo and Maxi-Food Supermarket. Access by public transport or vehicle is to a high standard with 850 car bays available.
Vermont South Shopping Centre
The centre is anchored by Coles and includes 41 specialty stores across 10,700sq.m of retail floor space. Whilst access to the centre is relatively good by public transport and vehicle, general amenity and accessibility within the centre is very poor.
Burwood Village
Burwood Village is a strip centre located at the Whitehorse / Boroondara boundary and is comprised of an estimated 15,300sq.m of food services, commercial and retail floor space. The centre has good accessibility via public transport, however accessibility for vehicular traffic can be difficult at peak times.
Houston Shops
The Houston Shops include a number of specialty strip shops spread across 8,368sq.m of retail floor space. The centre includes a VFI and Quix Petrol Station as anchors. Access by car is relatively good but access via public transport is poor.
Box Hill South
The Box Hill South centre is located in close proximity to the Canterbury Road / Station Street intersection and includes 30,369sq.m of retail floor space. Access to the centre via public transport is relatively poor and there is a lack of car bays available.
5.2.4 Other Neighbourhood Activity Centres
Additional retailing exists outside the above named retail centres at the large, medium and small NAC level. Whilst the preceding section discussed the most significant retailing within large NACs, additional floor space exists within the large NACs but largely plays a convenience role with a smaller, defined catchment similar to the retailers within small and medium sized NACs. Additional Whitehorse retail floor space within defined NACs is listed overleaf.

City of Whitehorse
Retail Strategy Review
Prepared for City of Whitehorse MacroPlan Australia Pty Ltd August 2010 59
Figure 27. Other Neighbourhood Activity Centres
Source: City of Whitehorse Draft Neighbourhood Activity Centre Study (April 2009)
OUTSIDE STUDY CENTRES Centre Type Retail Floorspace sq.m
Canterbury Rd & Florence Rd, Surrey Hills Large NAC 14,465
Parkmore Village, Forest Hill Large NAC 8,215
Middleborough Rd & Whitehorse Rd, Blackburn Large NAC 7,714
Mitcham Rd & Andover Ave, Mitcham Large NAC 5,447
Woodhouse Grove & Station St, Box Hill North Large NAC 5,292
Dampier Grove Shops, Mitcham Large NAC 4,812
Dunloe Ave & Access Rd, Mont Albert North Large NAC 4,582
Hawthorn Road & Robinlee Rd, Burwood East Large NAC 4,579
Vicki Street Shops, Blackburn South Large NAC 3,260
Eley & Shaun Shopping Centre, Blackburn South Large NAC 3,259
Elgar Rd & Woodhouse Grove, Box Hill North Large NAC 2,881
Caroline Crescent & Katrina St, Blackburn North Large NAC 2,794
Riversdale Rd & Ferndale St, Surrey Hills Large NAC 2,754
Rooks Rd & Beech St, Nunawading Large NAC 2,744
Trawool St Neighbourhood Shopping Centre, Box Hill North Medium NAC 2,496
Vermont East Shopping Centre, Vermont Medium NAC 2,429
Laburnum Village Shopping Centre, Blackburn Medium NAC 2,299
Cromwell St & McIntyre St, Burwood Medium NAC 2,251
Mountain View Rd & Springfield Rd, Nunawading Medium NAC 2,060
Holland Rd & Fulton Rd, Blackburn South Medium NAC 1,939
Mount Pleasant Rd & Lorikeet St, Nunawading Medium NAC 1,847
Thames St & Station St, Box Hill North Medium NAC 1,650
Second Avenue Shops, Box Hill North Medium NAC 1,626
Diana Dr & Lulworth St, Blackburn North Medium NAC 1,621
Bettina St & Benwerrin Dr, Burwood East Medium NAC 1,507
Junction Rd & Charles St, Nunawading Medium NAC 1,494
Royton Street, Burwood East Medium NAC 1,444
Highbury and Middleborough Rd Shops, Burwood East Medium NAC 1,415
McKeon Rd & Quarry Rd, Mitcham Medium NAC 1,367
Indra St & Baratta St, Blackburn South Medium NAC 1,361
Sevenoaks Rd, Burwood East Medium NAC 1,332
Springfield Rd & Surrey Rd, Blackburn Medium NAC 1,249
Pendle St & Whitehorse Rd, Box Hill Medium NAC 1,248
Charlton St & Raymond St, Blackburn North Medium NAC 1,231
Banksia St, Burwood Medium NAC 1,717
Oakwood Shops, Blackburn South Medium NAC 1,139
Station St & Asquith St, Box Hill South Medium NAC 1,129
Centre Rd & Beddoe Rd, Vermont Medium NAC 1,108
Hutchinson St & Ruby St, Burwood East Medium NAC 1,107
Jolimont Rd & Longbrae Ave, Forest Hill Medium NAC 1,064
Birdwood St & Devon St, Box Hill South Medium NAC 1,041
Springvale Rd & Lindsay Ave, Nunawading Small NAC 780
Puerta St & Faelen St, Burwood Small NAC 715
Milne Rd & Sewell St, Mont Albert North Small NAC 684
TOTAL OTHER 117,148
TOTAL WHITEHORSE FLOORSPACE 635,184

City of Whitehorse
Retail Strategy Review
Prepared for City of Whitehorse MacroPlan Australia Pty Ltd August 2010 60
5.3 Retail Floor Space by Type
The table below summarises the total quantum of retail floor space currently within the Whitehorse LGA.
Figure 28. Retail Hierarchy by Floor Space
Source: MacroPlan Australia, 2010
The survey of retail floor space reveals a total of 58,667sq.m of retail floor space is located within the Box Hill CAD and a total of 532,167sq.m is distributed throughout the MACs and Large NACs. This is a significant amount of retailing that indicates a thriving, dynamic retail sector and the potential to effectively service those living within the retail catchments through a diverse and competitive retail offer.
Percentage of retail floor space by centre hierarchy is represented in the graph below.
Figure 29. Whitehorse Retail Hierarchy
Source: MacroPlan Australia, 2010
Hierarchy Type Retail m2 % m2
Central Activity District 58,667 9.2%
Major Activity Centre 219,759 34.6%
Large Neighbourhood Activity Centre 312,408 49.2%
Medium Neighbourhood Activity Centre 42,171 6.6%
Small Neighbourhood Activity Centre 2,179 0.3%
Total 635,184 100.0%
9%
35%
49%
7%0.3%
Central Activity District
Major Activity Centre
Large Neighbourhood Activity Centre
Medium Neighbourhood Activity Centre
Small Neighbourhood Activity Centre
City of Whitehorse
Retail Strategy Review
Prepared for City of Whitehorse MacroPlan Australia Pty Ltd August 2010 61
Retail floor space distribution between the CAD (9%), MACs (35%) and NACs (56%) is indicative of a well-distributed retail hierarchy throughout the Whitehorse LGA. The growing prominence of the CAD hierarchy is largely attributed to the success of the Box Hill CAD and its position as an employment, educational and transport hub.
5.4 Future & Planned Centres
MacroPlan has researched shopping centres in all stages of the development lifecycle to gain an understanding of the future supply of retail floor space within Whitehorse. The most significant proposed developments are as follows:
Burwood Heights
It is expected that there will be additional floor space supply created from the extension of the Burwood Heights Precinct in the medium-term. There is currently development approval, however, it is expected that construction will not commence in the short term. Development of the former brickworks site includes cinema and recreational facilities, 36,600sq.m of retail floor space (including a discount department store), 700 dwellings and a community centre.
Box Hill Tower
Whilst an application for a 38 storey mixed use tower has been rejected, developers still have a planning permit for a 23 storey building at Station Street and Carrington Road.
Located within the Box Hill CAD, the proposed site is approximately only 400m from the Box Hill Hospital and 1.2km from the Box Hill Institute of TAFE. The centre would increase the amount of retail critical mass within the CAD, increasing the competitive environment and providing consumers with choice. Notably, it capitalises on the opportunity for higher density housing within the CAD, which in its own right will create an increase in demand and generate retail spend.
The current permit allows for only 290sq.m of retail however also includes 8 cinemas (1667 seats) and 3 restaurants (160 seats) which would encourage further entertainment uses at the Central Activities District.
Kmart / East Burwood Plaza
As discussed further in the key centre analysis, the $50 million redevelopment is to include a Coles supermarket, Aldi supermarket, First Choice, Liquorland, more specialty shops, gymnasium and additional car parking. The floor area is expected to increase by 15,000sq.m to approximately 30,000sq.m (approx. 26,000 sq.m retail) and is currently under construction.
Aldi Supermarket, Office and Specialty Shops
Located in Burwood East, this $24,000,000, 6,741sq.m proposed development would create a four-storey building with basement car parking for use as an Aldi Supermarket and office. The town planning and re-zoning applications have been submitted to an independent panel.
Located within the Tally Ho MAC, the proposed Aldi faces competition from both Kmart and Coles along Burwood Highway. This would have a significant impact on the competitive network of the existing supermarkets and their ability to service their existing catchments.
City of Whitehorse
Retail Strategy Review
Prepared for City of Whitehorse MacroPlan Australia Pty Ltd August 2010 62
Burwood Highway Mixed Use Development
This proposed $13,000,000 mixed use development is located along Burwood Highway and in the heart of the Burwood Village Neighbourhood Activity Centre and would provide 34 residential units, commercial offices and retail floor space. The rezoning application is currently pending town planning approval. If approved, the development would take advantage of the gap for higher density housing, which serves as its own driver for convenience retailing.
A number of smaller retail developments are proposed throughout the Whitehorse LGA. These are mostly standalone supermarkets and small convenience retail developments. For the purposes of this report, these have been assumed to be approved and open for trading by approximately 2011 – 2014.
5.5 Supply Conclusions
In general, the Whitehorse LGA enjoys a diverse and healthy retail sector with a variety of retailing formats across all activity centres. In particular, the retail critical mass at the Box Hill CAD attracts those from outside the LGA and drives a strong competitive network that results in choice for the consumer.
MacroPlan has assessed the current total supply of retail floor space within the Whitehorse LGA to be approximately 635,000sq.m.
The current allocation of retail floor space in the study area is broadly consistent with averages in metropolitan Melbourne. However, floor space allocation is slightly concentrated at the CAD and MAC level which can have negative impacts of requiring consumers to travel further to access some retail formats. This increases traffic, environmental externalities, and may be particularly problematic for older and low income persons who may not have access to a motor vehicle. With significant volume of core retail floor space located within the Box Hill SLA, access to some retail formats may be reduced for some patrons.
Going forward, it will be important to encourage development at the neighbourhood and local level to ensure both high-end and amenity retailing meets the needs of the defined local catchments, with specific attention to the food versus non-food mix. Increasing local retailing has many social, environmental and economic benefits. Specifically, the activity centres may benefit from an increase in the desirability of the local residential markets, with increased amenity in turn encouraging higher density housing, and a lessening of the environmental impact through reduced travel time. Whilst these positive effects can occur at all levels of the activity centre hierarchy, they are especially important for the sustainable development of neighbourhood activity centres.
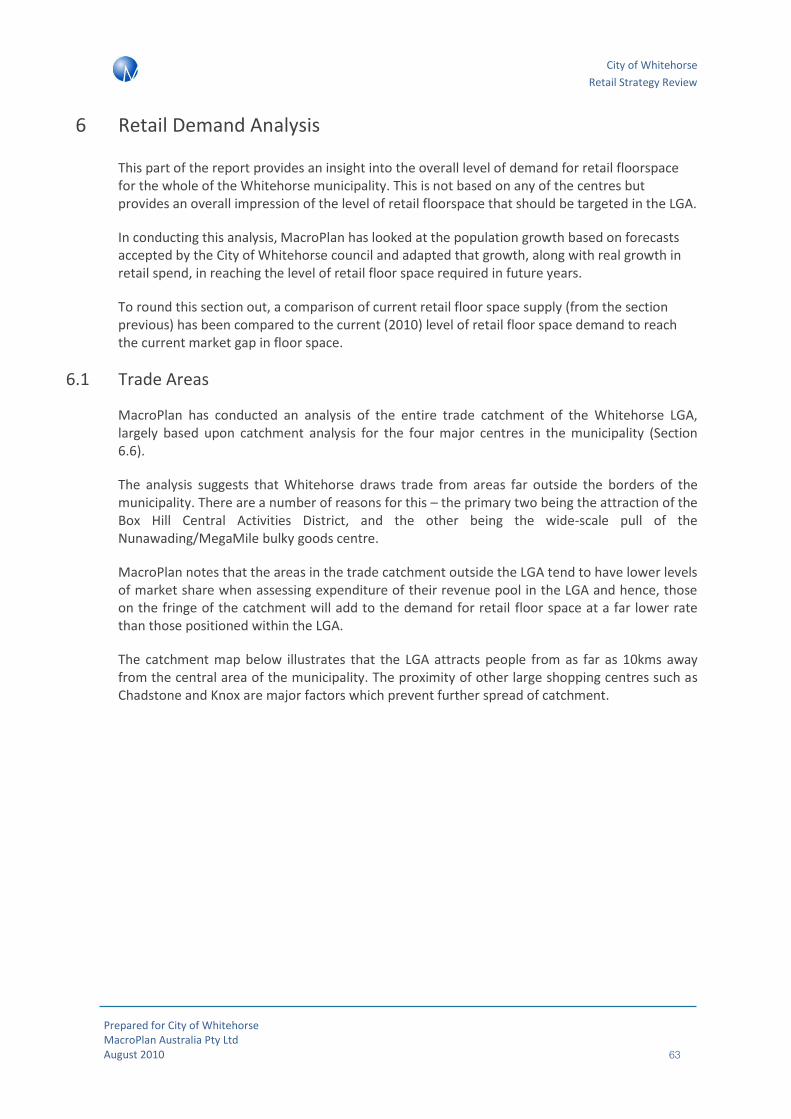
City of Whitehorse
Retail Strategy Review
Prepared for City of Whitehorse MacroPlan Australia Pty Ltd August 2010 63
6 Retail Demand Analysis
This part of the report provides an insight into the overall level of demand for retail floorspace for the whole of the Whitehorse municipality. This is not based on any of the centres but provides an overall impression of the level of retail floorspace that should be targeted in the LGA.
In conducting this analysis, MacroPlan has looked at the population growth based on forecasts accepted by the City of Whitehorse council and adapted that growth, along with real growth in retail spend, in reaching the level of retail floor space required in future years.
To round this section out, a comparison of current retail floor space supply (from the section previous) has been compared to the current (2010) level of retail floor space demand to reach the current market gap in floor space.
6.1 Trade Areas
MacroPlan has conducted an analysis of the entire trade catchment of the Whitehorse LGA, largely based upon catchment analysis for the four major centres in the municipality (Section 6.6).
The analysis suggests that Whitehorse draws trade from areas far outside the borders of the municipality. There are a number of reasons for this – the primary two being the attraction of the Box Hill Central Activities District, and the other being the wide-scale pull of the Nunawading/MegaMile bulky goods centre.
MacroPlan notes that the areas in the trade catchment outside the LGA tend to have lower levels of market share when assessing expenditure of their revenue pool in the LGA and hence, those on the fringe of the catchment will add to the demand for retail floor space at a far lower rate than those positioned within the LGA.
The catchment map below illustrates that the LGA attracts people from as far as 10kms away from the central area of the municipality. The proximity of other large shopping centres such as Chadstone and Knox are major factors which prevent further spread of catchment.
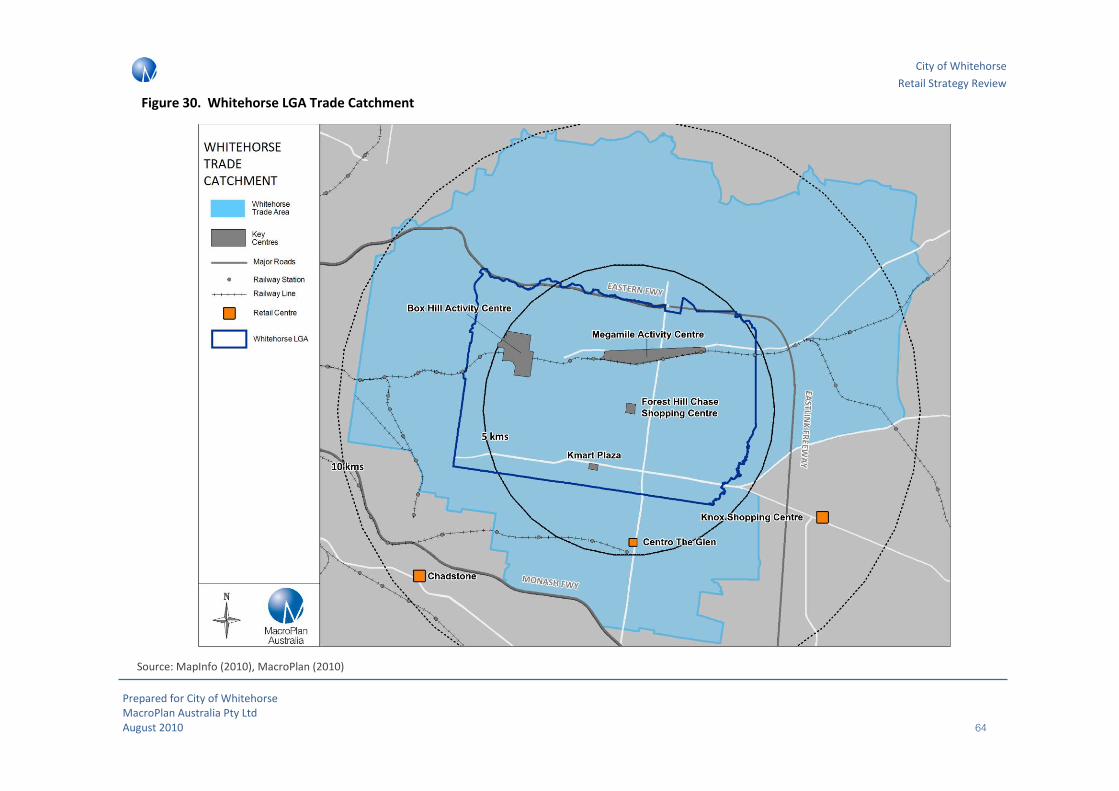
City of Whitehorse
Retail Strategy Review
Prepared for City of Whitehorse MacroPlan Australia Pty Ltd August 2010 64
Figure 30. Whitehorse LGA Trade Catchment
Source: MapInfo (2010), MacroPlan (2010)

City of Whitehorse
Retail Strategy Review
Prepared for City of Whitehorse MacroPlan Australia Pty Ltd August 2010 65
6.2 Population
In order to understand the requirements for retail floor space within the City of Whitehorse, one must first understand the present and future population of the LGA and of the catchment areas. Demand for retail floor space is in a large degree related to the population growth in the trade area of the municipality.
The following table outlines expected population growth for the Whitehorse LGA between 2010 and 2031. According to City of Whitehorse preferred forecasts (ID Forecasting), the municipality is expected to grow by an additional 7,461 residents over the designated time period which results in an average annual change of 0.22%.
This analysis includes the population growth of the identified trade areas outside the LGA which will likely have an impact upon demand for retail floor space into the future. As noted, those on the outer fringe are far less likely to spend the same amount in Whitehorse as those in the municipality, attributed to ‘leakage’. As discussed in further detail in the modelling below, MacroPlan does take into account this leakage from the additional trade area based on the hierarchy of centres and past experience.
Figure 31. Scenario analysis of population of Whitehorse using different forecasting
Source: ID Forecasting, 2010; Victoria in Future, 2008; ABS 2006-2009; MacroPlan, 2010.
140000
145000
150000
155000
160000
165000
170000
175000
180000
185000
20
01
20
02
20
03
20
04
20
05
20
06
20
07
20
08
20
09
20
10
20
11
20
12
20
13
20
14
20
15
20
16
20
17
20
18
20
19
20
20
20
21
20
22
20
23
20
24
20
25
20
26
20
27
20
28
20
29
20
30
20
31
ID Forecast Department of Health and Ageing
Victoria in future ABS 3218.0

City of Whitehorse
Retail Strategy Review
Prepared for City of Whitehorse MacroPlan Australia Pty Ltd August 2010 66
The figure above looks at different population forecasting for the Whitehorse LGA which may assist in assessing the requirement for future retail floor space. The blue line points to the ID estimation which the City of Whitehorse currently assess as their adopted figures.
Further to the projections for the City of Whitehorse, MacroPlan has calculated the population in the trade catchment of Whitehorse (using relevant council population figures) as outlined in the Figure below.
Figure 32. Adopted Population Projection for trade catchment
Source: City of Whitehorse, Id.forecast, MacroPlan Australia
6.3 Retail Expenditure Profile
Retail expenditure within the Whitehorse LGA is above metropolitan Melbourne averages in regard to total expenditure and each of the sub-categories of food and non-food retail. This indicates higher than average amounts of discretionary income within the catchment area and supports the further activation of activity centres, especially as housing increases in density and new employment generators are created outside the CADs.
Figure 33. Retail Expenditure Profile
2011 2016 2021 2026 2031
City of Whi tehorse 155,176 156,884 159,068 160,805 162,170
Additional Trade 177,365 182,393 187,709 193,460 199,706
2010-11 2011-16 2016-21 2021-26 2026-31
City of Whi tehorse 342 437 347 273
Additional Trade 1,006 1,063 1,150 1,249
2010-11 2011-16 2016-21 2021-26 2026-31
City of Whitehorse 0.2% 0.3% 0.2% 0.2%
Additional Trade 0.6% 0.6% 0.6% 0.6%
Est imated Resident Populat ion
Average Annual Change (No.)
Average Annual Change (%)
$0
$2,000
$4,000
$6,000
$8,000
$10,000
$12,000
$14,000
Total Food Non-Food Total Retail
City of Whitehorse Metropolitan Melbourne
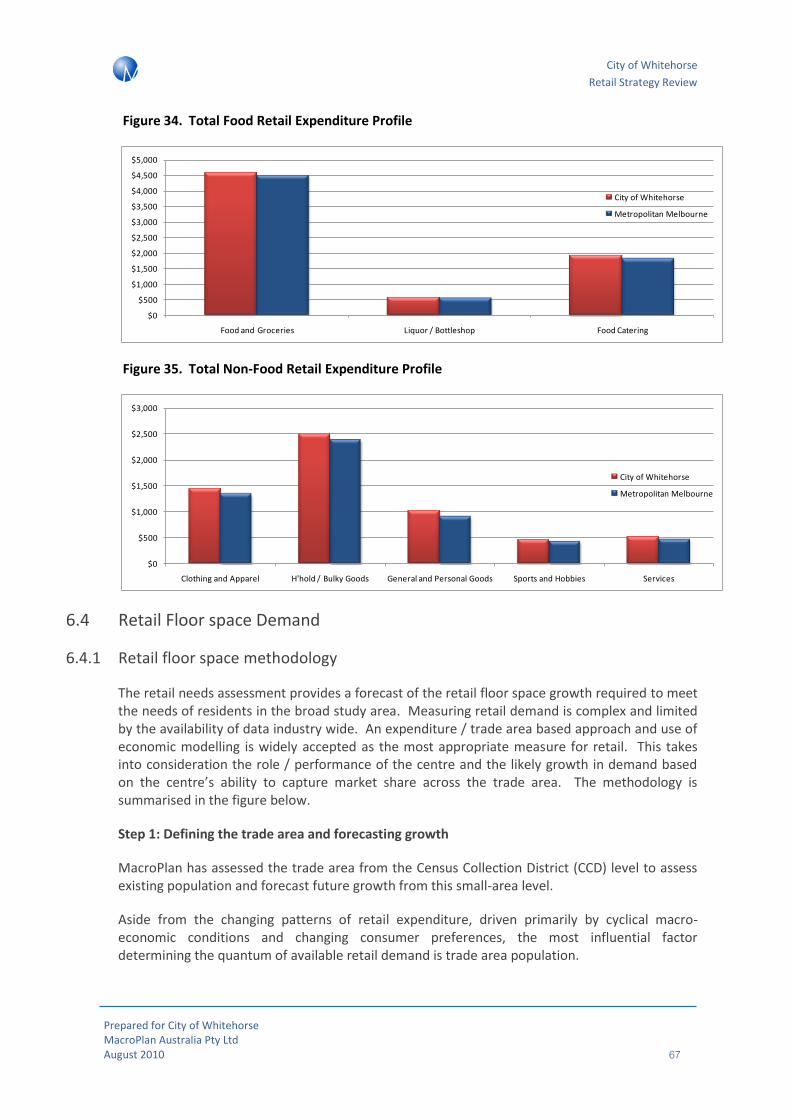
City of Whitehorse
Retail Strategy Review
Prepared for City of Whitehorse MacroPlan Australia Pty Ltd August 2010 67
Figure 34. Total Food Retail Expenditure Profile
Figure 35. Total Non-Food Retail Expenditure Profile
6.4 Retail Floor space Demand
6.4.1 Retail floor space methodology
The retail needs assessment provides a forecast of the retail floor space growth required to meet the needs of residents in the broad study area. Measuring retail demand is complex and limited by the availability of data industry wide. An expenditure / trade area based approach and use of economic modelling is widely accepted as the most appropriate measure for retail. This takes into consideration the role / performance of the centre and the likely growth in demand based on the centre’s ability to capture market share across the trade area. The methodology is summarised in the figure below.
Step 1: Defining the trade area and forecasting growth
MacroPlan has assessed the trade area from the Census Collection District (CCD) level to assess existing population and forecast future growth from this small-area level.
Aside from the changing patterns of retail expenditure, driven primarily by cyclical macro-economic conditions and changing consumer preferences, the most influential factor determining the quantum of available retail demand is trade area population.
$0
$500
$1,000
$1,500
$2,000
$2,500
$3,000
$3,500
$4,000
$4,500
$5,000
Food and Groceries Liquor / Bottleshop Food Catering
City of Whitehorse
Metropolitan Melbourne
$0
$500
$1,000
$1,500
$2,000
$2,500
$3,000
Clothing and Apparel H'hold / Bulky Goods General and Personal Goods Sports and Hobbies Services
City of Whitehorse
Metropolitan Melbourne
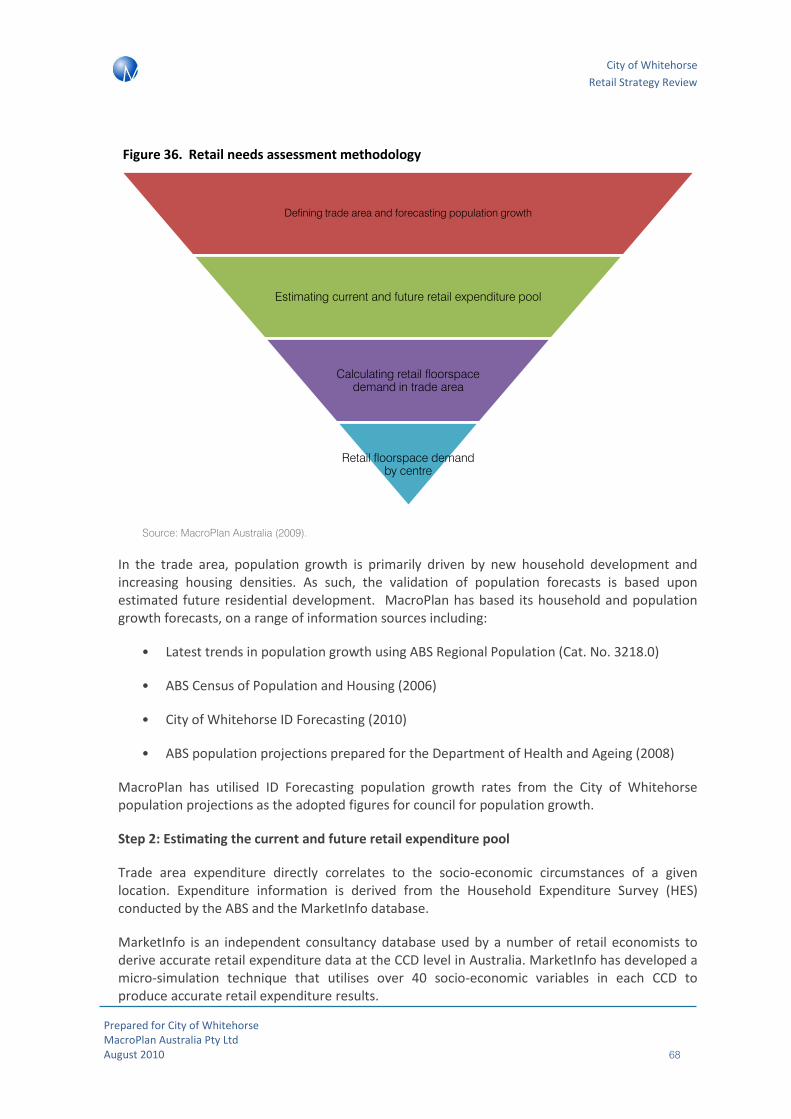
City of Whitehorse
Retail Strategy Review
Prepared for City of Whitehorse MacroPlan Australia Pty Ltd August 2010 68
Figure 36. Retail needs assessment methodology
Source: MacroPlan Australia (2009).
In the trade area, population growth is primarily driven by new household development and increasing housing densities. As such, the validation of population forecasts is based upon estimated future residential development. MacroPlan has based its household and population growth forecasts, on a range of information sources including:
• Latest trends in population growth using ABS Regional Population (Cat. No. 3218.0)
• ABS Census of Population and Housing (2006)
• City of Whitehorse ID Forecasting (2010)
• ABS population projections prepared for the Department of Health and Ageing (2008)
MacroPlan has utilised ID Forecasting population growth rates from the City of Whitehorse population projections as the adopted figures for council for population growth.
Step 2: Estimating the current and future retail expenditure pool
Trade area expenditure directly correlates to the socio-economic circumstances of a given location. Expenditure information is derived from the Household Expenditure Survey (HES) conducted by the ABS and the MarketInfo database.
MarketInfo is an independent consultancy database used by a number of retail economists to derive accurate retail expenditure data at the CCD level in Australia. MarketInfo has developed a micro-simulation technique that utilises over 40 socio-economic variables in each CCD to produce accurate retail expenditure results.
Defining trade area and forecasting population growth
Estimating current and future retail expenditure pool
Calculating retail floorspace demand in trade area
Retail floorspace demand by centre

City of Whitehorse
Retail Strategy Review
Prepared for City of Whitehorse MacroPlan Australia Pty Ltd August 2010 69
Estimates of expenditure are then linked to population forecasts within the defined catchment to build a forecasted expenditure pool. The growth in the expenditure pool provides an indication of what the net additional demand for retail floor space will be from 2009 onwards. In broad terms this assumes that the current demand and supply equation is in balance and that additional growth in floor space should be in line with growth in the expenditure pool.
However, in reality there are some gaps in supply demonstrated by above-average trading performance or lack of certain retail formats (i.e. full-line supermarket). This is addressed through consideration of other benchmarks including comparisons with a complementary retail floor space per capita analysis which acts as a ‘check’ to overall conclusions of retail demand.
Step 3: Conversion to retail floor space demand
Demand for retail floor space is determined by converting the retail expenditure into retail floor space. Retail Turnover Densities (RTD) can be applied to retail expenditure to determine the retail floor space demand. Estimates of RTD’s by retail store type have been based on ABS and other surveys on retail performance as well as MacroPlan’s experience in the retail sector.
Step 4: Retail floor space demand by centre
MacroPlan has assessed the development potential of each activity centre based on the current market share derived from existing retail supply levels and competition from other centres. The competitive framework that the centre operates in will have an impact on its market share and future growth. For example, if a retail centre faces competition from a number of other retail centres, it is likely that market share will be low within its trade area.
In this retail needs assessment, MacroPlan has assumed static market shares for each ABS retail category within each Activity Centre which provides a ‘status quo’ performance base to compare potential increases in retail.
6.4.2 Retail floor space assessment
MacroPlan has assessed the overall required floor space for those who reside in the MTA of Whitehorse including the requirements of those who reside outside the LGA but utilised the retail facilities of the LGA. The Box Hill Activity Centre and the Nunawading/MegaMile Activity Centre are key examples of centres within the municipality which draw a large catchment far beyond the border of the Whitehorse LGA. MacroPlan estimates the wider catchment outside the LGA provides almost 30% of current retail floor space demand to the overall municipality retail floor space demand level.
Total demand for retail floor space within the Whitehorse LGA as assessed by the trade catchment in Figure 30is summarised in the table below. This does not account for beyond trade expenditure which will be discussed in further detail in Section 6.5. The table has been adjusted to include a real growth in retail spending component. MacroPlan assesses real growth in retail spending at 0.5% for all retail categories apart from Bulky Goods which it believes spending will grow at a rate of 1%. MacroPlan has used these figures as very conservative estimates of real retail growth in the respective fields.

City of Whitehorse
Retail Strategy Review
Prepared for City of Whitehorse MacroPlan Australia Pty Ltd August 2010 70
Figure 37. Total Retail Floor space Requirements (excl. Beyond Trade)
Source: MacroPlan Australia, 2010
6.5 Worker and Beyond Trade Expenditure
As with an individual shopping centre, the Main Trade Area of the Whitehorse LGA as noted in Figure 30does not account for the total retail demand for an activity centre. A relatively small level of the trade of all retail centres within the municipality will come from areas outside the trade catchment. For example a worker who lives outside the catchment may purchase goods before heading home, or tourists who come past the centre may use retail facilities.
MacroPlan has assessed the ‘Beyond Trade’ catchment of the Whitehorse municipality to be 20% based on industry knowledge and past experience. This being the case, the final estimation for retail floor space demand is outlined below in Figure 38
Total Trade (excl BT) 2010 2011 2016 2021 2026 2031Growth
2010-21
Growth
2010-31
Food retai l ing
Supermarkets 80,755 81,462 84,847 88,579 92,325 96,120 7,824 15,365
Food retail specialties 34,609 34,912 36,363 37,963 39,568 41,194 3,353 6,585
Food catering 57,682 58,187 60,605 63,271 65,947 68,657 5,589 10,975
Total food retailing 173,047 174,561 181,815 189,813 197,840 205,972 16,766 32,925
Non-Food retai l ing
Dept. stores / DDS72,682 73,317 76,358 79,712 83,076 86,483 7,030 13,801
Non-food specialties 84,795 85,536 89,085 92,998 96,923 100,896 8,202 16,101
Bulky goods 171,787 174,168 186,090 199,275 213,085 227,632 27,488 55,845
Total non-food 329,264 333,021 351,533 371,984 393,084 415,011 42,721 85,747
Retai l services
Retail services specialties 39,707 40,060 41,766 43,641 45,537 47,474 3,933 7,766
Total retai l floorspace 542,019 547,642 575,114 605,438 636,461 668,456 63,420 126,438
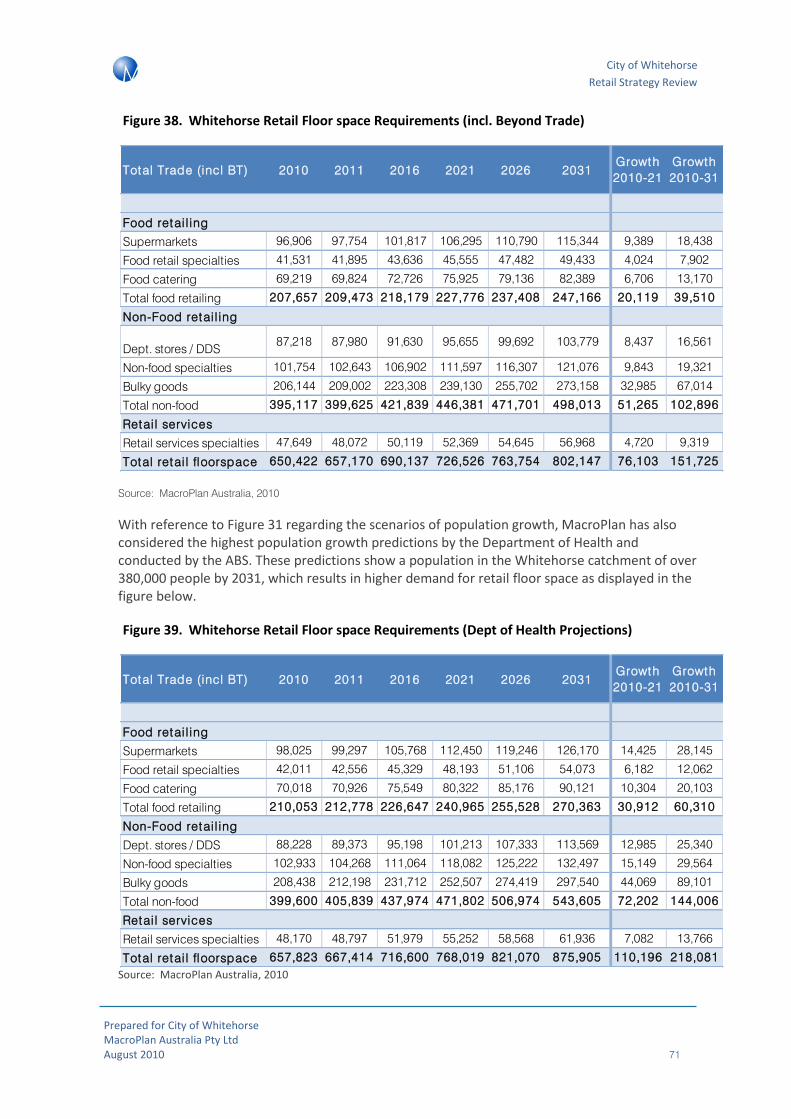
City of Whitehorse
Retail Strategy Review
Prepared for City of Whitehorse MacroPlan Australia Pty Ltd August 2010 71
Figure 38. Whitehorse Retail Floor space Requirements (incl. Beyond Trade)
Source: MacroPlan Australia, 2010
With reference to Figure 31 regarding the scenarios of population growth, MacroPlan has also considered the highest population growth predictions by the Department of Health and conducted by the ABS. These predictions show a population in the Whitehorse catchment of over 380,000 people by 2031, which results in higher demand for retail floor space as displayed in the figure below.
Figure 39. Whitehorse Retail Floor space Requirements (Dept of Health Projections)
Source: MacroPlan Australia, 2010
Total Trade (incl BT) 2010 2011 2016 2021 2026 2031Growth
2010-21
Growth
2010-31
Food retai l ing
Supermarkets 96,906 97,754 101,817 106,295 110,790 115,344 9,389 18,438
Food retail specialties 41,531 41,895 43,636 45,555 47,482 49,433 4,024 7,902
Food catering 69,219 69,824 72,726 75,925 79,136 82,389 6,706 13,170
Total food retailing 207,657 209,473 218,179 227,776 237,408 247,166 20,119 39,510
Non-Food retai l ing
Dept. stores / DDS87,218 87,980 91,630 95,655 99,692 103,779 8,437 16,561
Non-food specialties 101,754 102,643 106,902 111,597 116,307 121,076 9,843 19,321
Bulky goods 206,144 209,002 223,308 239,130 255,702 273,158 32,985 67,014
Total non-food 395,117 399,625 421,839 446,381 471,701 498,013 51,265 102,896
Retai l services
Retail services specialties 47,649 48,072 50,119 52,369 54,645 56,968 4,720 9,319
Total retai l floorspace 650,422 657,170 690,137 726,526 763,754 802,147 76,103 151,725
Total Trade (incl BT) 2010 2011 2016 2021 2026 2031Growth
2010-21
Growth
2010-31
Food retai l ing
Supermarkets 98,025 99,297 105,768 112,450 119,246 126,170 14,425 28,145
Food retail specialties 42,011 42,556 45,329 48,193 51,106 54,073 6,182 12,062
Food catering 70,018 70,926 75,549 80,322 85,176 90,121 10,304 20,103
Total food retailing 210,053 212,778 226,647 240,965 255,528 270,363 30,912 60,310
Non-Food retai l ing
Dept. stores / DDS 88,228 89,373 95,198 101,213 107,333 113,569 12,985 25,340
Non-food specialties 102,933 104,268 111,064 118,082 125,222 132,497 15,149 29,564
Bulky goods 208,438 212,198 231,712 252,507 274,419 297,540 44,069 89,101
Total non-food 399,600 405,839 437,974 471,802 506,974 543,605 72,202 144,006
Retai l services
Retail services specialties 48,170 48,797 51,979 55,252 58,568 61,936 7,082 13,766
Total retai l floorspace 657,823 667,414 716,600 768,019 821,070 875,905 110,196 218,081
City of Whitehorse
Retail Strategy Review
Prepared for City of Whitehorse MacroPlan Australia Pty Ltd August 2010 72
6.6 Retail Potential
MacroPlan has identified a requirement for an increase of approximately 76,103sq.m to meet demand for retail floor space by 2021 and an increase of approximately 151,725sq.m in retail floor space to meet demand by 2031. Extra demand for non-food retailing will reach 102,896sq.m by 2031, with bulky goods comprising 67,041sq.m of this and the residual split approximately evenly between department stores/discount department stores (DDS) and specialty retailers.
As detailed in Section 5, Whitehorse LGA currently has approximately 635,184sq.m of retail floor space. The current (2010) demand for retail floor space has been assessed at 650,422sq.m, resulting in a current net deficit of 15,238sq.m. This is not quite in equilibrium, however, current expansions of retail floor space around the municipality are assisting in keeping retail floor space supply in line with demand, however, there will be continuing need for expansion.
6.7 Retail Demand Conclusions
Retail floor space needs at the 2010 level are not currently being met. Evaluated in conjunction with the high levels of expenditure within the LGA (which are consistently above metropolitan Melbourne averages), the Whitehorse retail sector has the potential for expansion.
The existing floor space deficit may be mitigated by proposed future developments. However, the major proposed developments are clustered around the Kmart Activity Centre with smaller proposed developments (mostly in the form of supermarkets and few convenience retailers in mixed use developments) located in the other activity centres. Whilst the major developments will reduce any overall deficit, consideration should be given to driving demand across the LGA and reflect this through the development of core retailing services.
City of Whitehorse
Retail Strategy Review
Prepared for City of Whitehorse MacroPlan Australia Pty Ltd August 2010 73
7 Key Whitehorse Activity Centres
As part of a holistic retail strategy, MacroPlan has assessed key activity centres which attract a large amount of the municipality’s retail requirements. In the case of the City of Whitehorse, the four key activity centres studied are Box Hill, Nunawading/MegaMile, Forest Hill and East Burwood Plaza.
These centres rest at the top of the retail hierarchy in Whitehorse, with Box Hill being classified as the only Central Activities District (CAD) in the municipality and the other three centres as Major Activity Centres (MAC) or future sizeable centres (in the case of East Burwood / Kmart Plaza).
These centres have been assessed in terms of their competitiveness (including economic, social and environmental considerations) and demand for retail floor space at the centre.
7.1 Key Centre Analysis Methodology
MacroPlan has assessed the centres on a number of fundamental criteria. Initially, this section will seek to delineate the trade areas for the key centres and understand the demographics and preferences of the residents from which the centres receive higher turnover densities.
MacroPlan has also formulated a model to assess the competitiveness of the centres relative to comparable centres within the hierarchy. This analysis includes an economic, social and environmental score for each of the centres.
Finally, an estimation of the current and future retail floor space requirements for each of the centres is modelled, providing an estimation of any current supply differentials and requirements for the 20 years through to 2031.
7.1.1 Trade Area Analysis
A trade area is a geographical area from which the centre will draw the majority of retail trade. The delineation of a trade area typically comprises a primary, secondary and in some circumstances tertiary trade area. Trade areas are defined by the following factors which are discrete to each retail centre including:
• Existing retail role (i.e. a convenience based centre such as the Kmart / East Burwood Precinct, has the primary function of providing weekly convenience and limited higher order offer attracting the local and broader community)
• Site location, including the available road network and public transport system. This influences the ease of access and exposure to the development for the wider region.
• Proximity and pattern of existing and potential competitors. The relative attraction of the centre compared to alternative competing centres is assessed according to the scale, composition, quality, size and diversity of retail services provided in those centres and stores, and
• Physical barriers, such as lakes, railways and freeways can affect the size and composition of trade catchments.
City of Whitehorse
Retail Strategy Review
Prepared for City of Whitehorse MacroPlan Australia Pty Ltd August 2010 74
7.1.2 Centre Competitiveness Index
MacroPlan has assessed the competitiveness of Box Hill Activity Centre, Nunawading/MegaMile Activity Centre, Forest Hill Shopping Centre and Kmart/East Burwood Plaza Centre based on a range of economic, social and environmental indicators which help assess its performance as an Activity Centre. The indicators are broadly based on strategic policy directions in the role and function of a centre as detailed in the following table.
Figure 40. Centre competitiveness indicators
Indicator Description Statistical measurement
Economic
Economic Activity (jobs) Encourage economic activity, business
synergies and economies of agglomeration.
Number of jobs in centre
Economic Activity (population)
Primary Trade Area population.
Higher order commercial offer
Should provide for a mix of employment including higher order commercial for Major Activity Centres.
Number of commercial office jobs
Anchors and retail network
Should provide anchors (retail and non-retail) to support economic development
Number, size and type of anchors as well as total retail floor space.
Social
Accessibility (within Centre) Improving accessibility within and to the
centre through walking, cycling and public transport to services and facilities.
Safe access for bicycles and pedestrian
Accessibility (to Centre)
Accessibility of railway station by pedestrians and cyclists
Higher residential density
Medium and higher density residential development should be encouraged.
Volume of higher density residential within the Activity Centre
Environmental
Optimise public transport networks
Should integrate public transport into everyday life. Public transport networks should generate activity and reduce environmental impacts
Journey to work profile
Reduce private vehicle trips
Reduce the number of private vehicle (car) trips to and from activity centres.
Journey to work profile
Source: MacroPlan Australia (2010).
In this assessment, Activity Centres are awarded a score between 0 and 5 against 9 performance indicators for a total possible score of 45. Applying this approach, a score of 23 is therefore a critical threshold. Below this, the future success of the centre without significant public or private investment is questionable. Figure 41 provides an interpretation of scores.
It should be noted that MacroPlan’s assessment of the Activity Centres against these indicators has been undertaken as an independent expert and there is an element of subjectivity that exists. However, it is considered that MacroPlan’s assessment provides a general indication of the Activity Centres’ current strengths and weaknesses.
In order to reach an economic score for the centre, MacroPlan has evaluated ABS data to analyse the number of jobs in the centre (including those higher order service jobs which create a more holistic vibrant centre) population in the catchment of the centre as well as an assessment of the attraction to the centre through anchor tenancies. MacroPlan has analysed a number of data sources including the Property Council of Australia’s Shopping Centre Database.

City of Whitehorse
Retail Strategy Review
Prepared for City of Whitehorse MacroPlan Australia Pty Ltd August 2010
75
Figure 41. Activity Centre assessment criteria
Characteristic
Total Score
Exemplar
The Activity Centre is a leading example with a diverse range of key competitive advantages and characteristics that together achieve success in the market. These advantages should continue to be emphasised and enhanced.
40 – 45
Successful
The Activity Centre performs well in a broad range of key indicators. While its current performance is good, there are a number of areas that can be improved. These can generally be readily rectified and improved through minor amendments and adjustments.
30 – 40
Positive
The Activity Centre is performing positively but has a range of areas of improvement. The centre has many key advantages that can facilitate further development. While its development is constrained by a range of factors, the centre can improve its performance through strategic amendments and adjustments.
20 – 30
Marginal
The Activity Centre contains a range of positive and negative characteristics with overall performance being marginal. Development should focus on limiting the effects of its negative characteristics and aim to further nurture its positive characteristics.
15- 20
Testing The Activity Centre contains few key competitive advantages. Significant investment and strategies are required to transform the Activity Centre.
10 – 15
Challenging The Activity Centre contains little to no key competitive advantages. This will seriously inhibit its success in the market without significant public and private intervention.
5 – 10
Almost impossible
The Activity Centre contains no key competitive advantages. This will prevent its success in the market. Its designation as an Activity Centre should be reconsidered.
0 – 5
Source: MacroPlan Australia (2009).
The social analysis is based on an analysis of the activity centre including its surrounds, transport links and accessibility and walkability within the centre. Easy access to public transport and disability access are among the criteria assessed to allow MacroPlan to reach an expert assessment of the social score of the centre.
An environmental score has been derived by assessing the use of public transport and reduction of private vehicle uses to the centre. A centre with a higher use of public transportation will achieve a higher environmental score.
MacroPlan has assessed the number of jobs and journey to work profile of workers within the Activity Centres based on Transport Destination Zone boundaries (TDZ). It should be noted that TDZ do not necessarily align perfectly with activity centre boundaries but adjustments have been made to be as accurate as possible. The use of TDZ boundaries has been required to source 2006 Census statistics on employment profiles by industry category to provide input into the competitiveness of the centre.
Assessing the level of private vehicle trips subsequently provides an indication of the integration, or lack thereof, between an Activity Centre and its major public transport nodes. The following

City of Whitehorse
Retail Strategy Review
Prepared for City of Whitehorse MacroPlan Australia Pty Ltd August 2010
76
section provides a comparison of the travel behaviour of workers to activity centres in terms of the method of transport used.
This analysis suggests that successful activity centres are generally highly integrated with public transport nodes and interchanges. Furthermore, centres that have access to more forms of public transport (i.e. rail, tram and bus collectively) tend to have higher patronage of public transport. This is a reflection of a greater access to public transport.
MacroPlan’s Centre Competiveness Index analysis suggests that successful activity centres provide a good mix of industries but also perform a specialised role within the region such as for commercial office employment or health services. This specialisation allows them to become destination centres attracting increased visitation and activity levels. Furthermore, larger activity centres tend to rely less on retail services as the main driver of economic activity and employment within the centre.
7.1.3 Floor space requirements / consideration of constraints
MacroPlan has used a similar methodology as outlined in Section 6 to assess the retail floor space demand of the individual centres.
MacroPlan acknowledges that Activity Centres may not necessarily be able to accommodate all of the retail floor space growth required due to land constraints, planning intentions and other market factors (i.e. financing difficulties, developer attraction, etc.). As a result, estimate of retail floor space to be accommodated within each activity centre will need to consider these constraints to ascertain a realistic level of retail floor space that could be delivered.
Assessment of structure plans, previous consultancy reports and discussions with key stakeholders and Council will provide the basis for this assessment.

City of Whitehorse
Retail Strategy Review
Prepared for City of Whitehorse MacroPlan Australia Pty Ltd August 2010
77
7.2 Box Hill Central Activities District
7.2.1 Locational context
The Box Hill CAD is located 14 kilometres to the east of the Melbourne CBD. It comprises an area of 3.5 km. As noted in Figure 42 the centre is mainly situated around Whitehorse Road, and includes Box Hill and Epworth Hospital and Box Hill Institute to the north-west which are anchors to the centre in their own right. The hospital treats more than 48,000 patients per annum and employs over 4,400 staff. It has recently received $407.5 million in funding from the State Government for a major upgrade. The Box Hill Institute has more than 40,000 student enrolments and employs around 1,800 staff.
The main retail centre is located to the south of Whitehorse Road and to the west of Station Street and is located above and around the Box Hill Transport Interchange, allowing key public transportation access to this Central Activities District (CAD).
Centro Box Hill North and South both hold a large proportion of the attractions and retail premises for the centre, however, there is also a large amount of cafe and restaurant facilities spread along Station Street, Carrington Road Whitehorse Road.
Figure 42. Box Hill Satellite Image
Source: Google Maps 2006
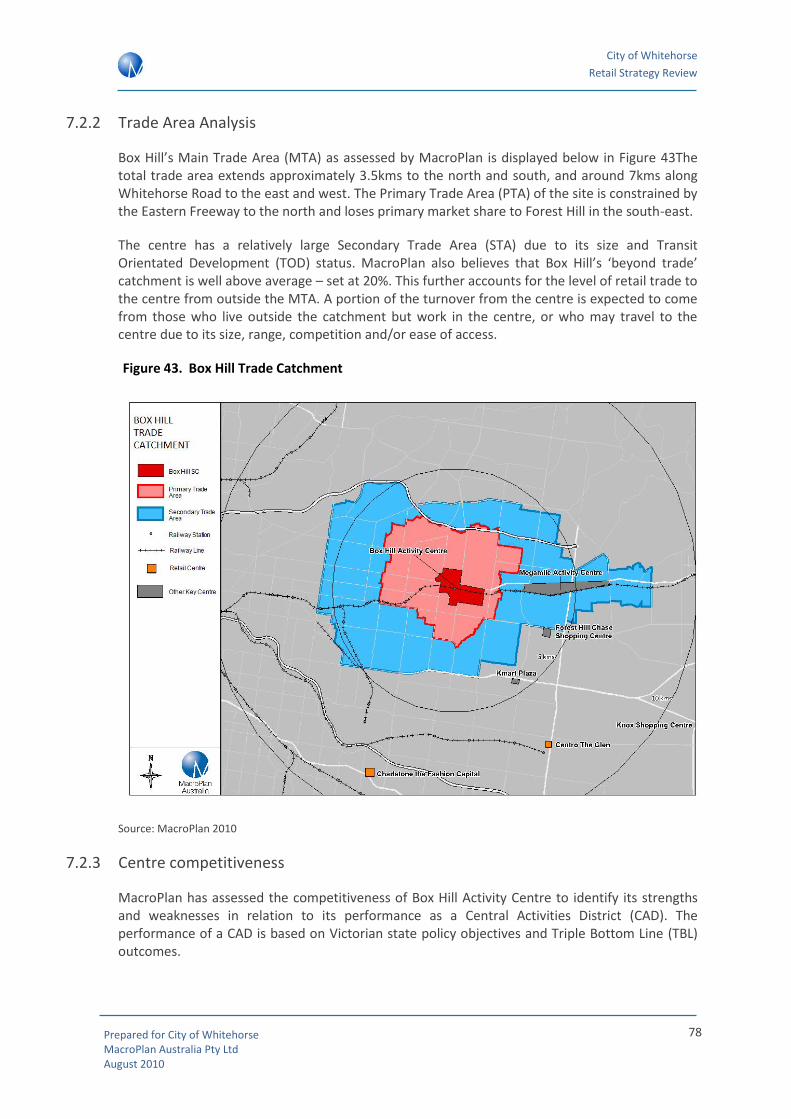
City of Whitehorse
Retail Strategy Review
Prepared for City of Whitehorse MacroPlan Australia Pty Ltd August 2010
78
7.2.2 Trade Area Analysis
Box Hill’s Main Trade Area (MTA) as assessed by MacroPlan is displayed below in Figure 43The total trade area extends approximately 3.5kms to the north and south, and around 7kms along Whitehorse Road to the east and west. The Primary Trade Area (PTA) of the site is constrained by the Eastern Freeway to the north and loses primary market share to Forest Hill in the south-east.
The centre has a relatively large Secondary Trade Area (STA) due to its size and Transit Orientated Development (TOD) status. MacroPlan also believes that Box Hill’s ‘beyond trade’ catchment is well above average – set at 20%. This further accounts for the level of retail trade to the centre from outside the MTA. A portion of the turnover from the centre is expected to come from those who live outside the catchment but work in the centre, or who may travel to the centre due to its size, range, competition and/or ease of access.
Figure 43. Box Hill Trade Catchment
Source: MacroPlan 2010
7.2.3 Centre competitiveness
MacroPlan has assessed the competitiveness of Box Hill Activity Centre to identify its strengths and weaknesses in relation to its performance as a Central Activities District (CAD). The performance of a CAD is based on Victorian state policy objectives and Triple Bottom Line (TBL) outcomes.

City of Whitehorse
Retail Strategy Review
Prepared for City of Whitehorse MacroPlan Australia Pty Ltd August 2010
79
MacroPlan’s assessment resulted in a total score for Box Hill Activity Centre of 33.9 out of 45 with all ‘bottom lines’ (economic, social, environmental) performing above average. This places the Box Hill Activity Centre within the ‘Successful’ assessment category and well above the critical 23 point threshold. This is an indication that the centre is currently performing above other CADs but can still improve in a number of areas, as outlined below.
Figure 44. Box Hill Centre competitiveness indicators
Box Hill Economic Indicators
For consistency between data sets, the jobs figures have been based on Census Catchment Districts figures from the 2006 ABS Census. Notably, these figures have grown quite substantially since that time, in particular with the government decision to focus on Box Hill as one of only six CAD’s surrounding the CBD. This figure has grown from Census data of around 10,700 in 2006 to
Economic Indicator Score Information
Number of Jobs 4.3 10,700 jobs in centre - more recent estimations at 15,600
Population Catchment 4.350,592 people in the Primary Trade Area and 116,893 people in
the Secondary Trade Area
Higher order commercial 3.9 39% of total jobs
Anchors and retail network 3.9
Anchors of – Box Hill Tafe, Hospitals, Retail (Target, Safeway,
Coles , Reject Shop, Dick Smith) Centrelink, however a lack of
large department store (Myer or David Jones), Cinema.
Perhaps with these there would be more use of the centre as a
destination (instead of a hub)
Social Indicators
Accessibility - within centre 3.2
Relatively good. Problems mainly associated with pedestrian-
vehicle interaction at main intersections and pedestrian
accessibility at transport hub
Accessibility - to the centre 4.2
Extremely High - Largest public transport system outside the
CBD. Need to improve quality rather than quantity. A few
parking issues.
Residential Density 2.2Require higher density due to proximity to major shop,
transport, education and health services.
Environmental Indicators
Optimise public transport network 420% of journey to work trips in Primary Trade Area are via
public transport
Reduce private vehicle trips 3.974% of journey to work trips in Primary Trade Area are solely
by car
Triple Bottom Line
Economic 16.4
Performs well with a large amount of jobs including office jobs
and a high level of retail, has a high catchment and a good
degree of anchor tenants to draw people to the centre
Social 9.6
Accessibility to the centre is good, but parking problems are an
issue. Residential density around the centre at present is
adequate
Environmental 7.9Use of public transport for the centre is extremely high given
its transport node status
Activity Centre Rating 33.9 SUCCESSFUL CENTRE
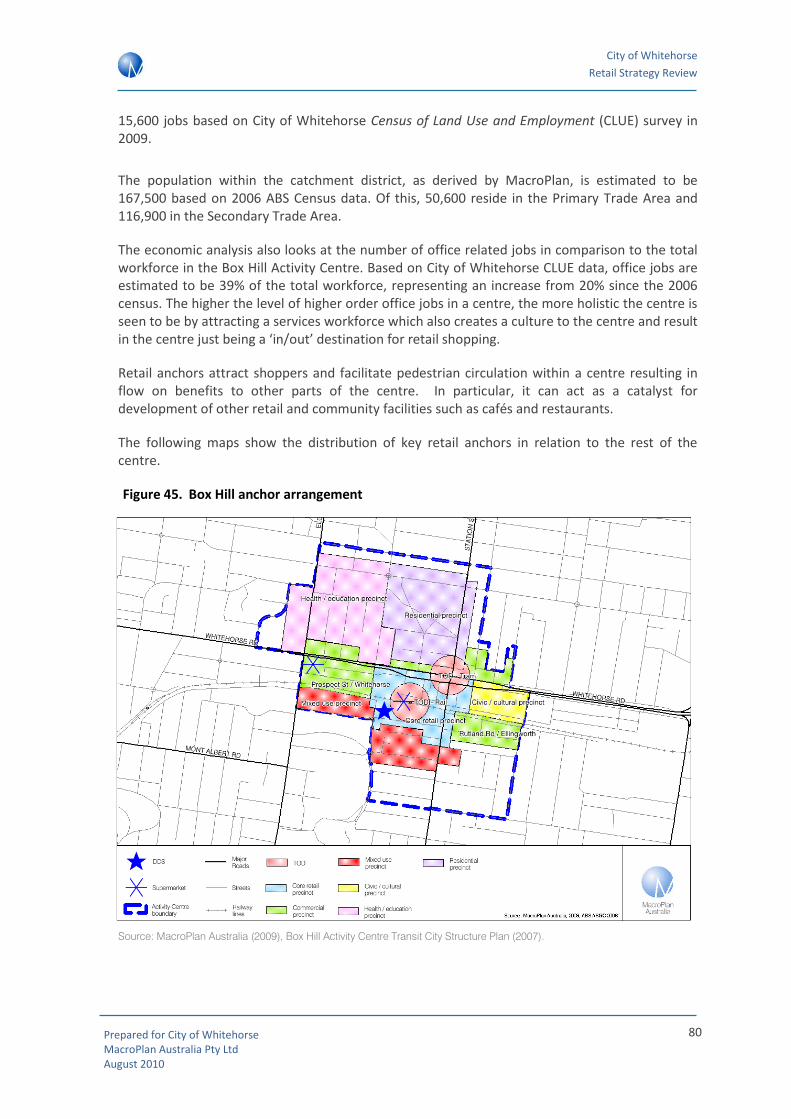
City of Whitehorse
Retail Strategy Review
Prepared for City of Whitehorse MacroPlan Australia Pty Ltd August 2010
80
15,600 jobs based on City of Whitehorse Census of Land Use and Employment (CLUE) survey in 2009.
The population within the catchment district, as derived by MacroPlan, is estimated to be 167,500 based on 2006 ABS Census data. Of this, 50,600 reside in the Primary Trade Area and 116,900 in the Secondary Trade Area.
The economic analysis also looks at the number of office related jobs in comparison to the total workforce in the Box Hill Activity Centre. Based on City of Whitehorse CLUE data, office jobs are estimated to be 39% of the total workforce, representing an increase from 20% since the 2006 census. The higher the level of higher order office jobs in a centre, the more holistic the centre is seen to be by attracting a services workforce which also creates a culture to the centre and result in the centre just being a ‘in/out’ destination for retail shopping.
Retail anchors attract shoppers and facilitate pedestrian circulation within a centre resulting in flow on benefits to other parts of the centre. In particular, it can act as a catalyst for development of other retail and community facilities such as cafés and restaurants.
The following maps show the distribution of key retail anchors in relation to the rest of the centre.
Figure 45. Box Hill anchor arrangement
Source: MacroPlan Australia (2009), Box Hill Activity Centre Transit City Structure Plan (2007).
City of Whitehorse
Retail Strategy Review
Prepared for City of Whitehorse MacroPlan Australia Pty Ltd August 2010
81
While there are a high level of key anchor tenants and activity within the Box Hill centre, it must be noted that there is a lack of a large department store (Myer/David Jones) and Cinema and other entertainment facilities.
Box Hill Social Indicators
According to the Box Hill Transport Interchange Concept Design (Arup and McGauran Soon, 2002), the Box Hill centre is required to act more as an interchange point between train lines, retail and commercial, and other public transport networks. Essentially, the strategy is trying to build the Box Hill centre into a major Transit Orientated Development (TOD) that can service other areas outside the Melbourne CBD.
The brief outlines the need for Box Hill to be of a “world class standard” by strongly focussing on integrating transport with business, better linking differing transport modes, and ensuring the wellbeing of pedestrians and passengers on the public transport network through better accessibility and safety. These problems generally align with issues raised by the passengers themselves. All of these outcomes must be achieved within the busiest train and bus network outside the CBD.
The Box Hill Interchange Concept Design outlines the following key transport infrastructure and strategic destinations within the district and nearby:
• The Eastern Freeway and the then proposed Eastlink
• The main east west road corridors of Whitehorse Road, Canterbury Road and Burwood Highway
• Tram routes 109 (Whitehorse Road), 70 (Riversdale Road) and 75 (Burwood Highway)
• The Belgrave/Lilydale rail line
• Regional shopping centres of The Glen and Doncaster Shopping Town
• Sub-regional shopping centres including Forest Hill Chase, Camberwell, The Pines, Burwood East.
There are approximately 8,700 car bays, both public and private within the Box Hill Activity Centre. During week days, off street parking is generally above 80% capacity (Concept design doc).
Notably, a large amount of the public transport use in the Box Hill Activity Centre is not for access to the area as a final destination. In many cases, Box Hill is utilised as a hub for passengers wanting to connect to another destination. 49% of total bus passengers transferred to another bus in the Box Hill centre. Comparatively, only 19% walked to, or from another destination.
This further highlights the importance of Box Hill’s role as a transport hub, and not primarily as a final destination.
With regards to ‘walkability’ within the Box Hill Activity Centre, there are a few problems associated with the large volume of traffic the centre has to cope with. Many of these are pedestrian-vehicle issues around the main retail core, however within centres there are some

City of Whitehorse
Retail Strategy Review
Prepared for City of Whitehorse MacroPlan Australia Pty Ltd August 2010
82
issues with pedestrian-pedestrian issues within the main entrance of Centro Box Hill South, where shoppers and transport users cross.
As part of the City of Whitehorse Bicycle strategy, council has outlined the need for more racks/hooks/storage within train stations at Box Hill.
MacroPlan has assessed housing density within the Box Hill Activity Centre and has found that there is a need to continue to encourage high density dwellings. There is still a need for a larger level of high density residential due to the proximity to requirements of shops, transport, health and education services. It is noted in the Box Hill Structure Plan that a move towards higher density residential could accommodate an estimated 1,400 -2,700 additional dwellings throughout the centre.
Environmental Indicators
Journey to work data indicates that a higher proportion of people who live in the Box Hill trade area use public transport to get to their final destination than travel by private vehicle. This could be used as a proxy for those who live outside the Box Hill area and travel to work in the centre.
Centres such as Box Hill and Forest Hill have the lowest level of private vehicle usage of the centres studied, at 74% and 77% respectively according to MacroPlan analysis. These centres tend to have a higher degree of public transport interchanges and are positioned in a way that provides easier access for visitors to the centre via public transport.
Box Hill Activity Centre is able to encourage lower levels of private vehicle use as the Box Hill railway station and bus interchange are positioned within the main retail shopping centre. This direct integration with the retail precinct provides commuters with streamlined access to the main employment and retail precincts of the Activity Centre.
7.2.4 Retail floor space requirements
MacroPlan has assessed retail floor space requirement for the Box Hill centre as outlined in Section 7.1. According to analysis in Section 5.2 (Existing Supply) of this report, the current retail floor space of the Box Hill centre is approximately 58,700sq.m.
Figure 46. Retail Floor space Requirements to 2031 (sq.m)
MacroPlan has assessed that current floor space is slightly behind the current potential for the centre, in particular when considered the newfound status as outlined in Melbourne 2030. Over
Retai l format type 2009 2011 2016 2021 2026 2031 2009-2031
Food retailing
Supermarket 17,578 17,772 18,056 18,399 18,692 18,923 1,346
Food retail specialties 11,590 11,718 11,906 12,131 12,325 12,477 887
Restaurants and cafés 9,672 12,513 12,714 12,955 13,161 13,324 3,652
Total food-based 38,840 42,004 42,676 43,484 44,177 44,725 5,885
Non-Food retailing
Dept. Stores / DDS 6,708 6,863 6,973 7,105 7,218 7,307 600
Non-food specialties 5,355 5,453 5,540 5,645 5,735 5,806 451
Bulky goods 1,784 1,796 1,825 1,859 1,889 1,912 128
Total Non-food based 13,847 14,112 14,337 14,609 14,842 15,026 1,179
Retail services
Retail services specialties 4,259 4,299 4,368 4,451 4,522 4,578 319
Total retai l 56,945 60,415 61,381 62,544 63,541 64,328 7,383

City of Whitehorse
Retail Strategy Review
Prepared for City of Whitehorse MacroPlan Australia Pty Ltd August 2010
83
the next 20 years, MacroPlan estimates the Box Hill centre will have the potential to expand by around 7,700sq.m in terms of retail floor space, to a total level of around 64,300sq.m by 2031.
7.2.5 Recommendations
MacroPlan understands the strategic importance that has been placed on the Box Hill Activity Centre being a focal point for the region and indeed the City of Whitehorse in the future.
Understandably, the public transport usage for Box Hill as a hub and final destination are well above average. MacroPlan believes continued importance must be placed on the higher order commercial aspect of the centre. The injection of a business district ambiance into the centre will attract higher quality tenants and services, and will recreate Box Hill as a final destination more so than a transportation link.
The large-scale expansion of the hospital will assist in bringing about this change by cementing the hospital, along with the Box Hill Institute and transport hub as non-retail anchors for the centre.
7.3 Nunawading/MegaMile Major Activity Centre
7.3.1 Locational context
The Nunawading/MegaMile Centre is more than 3km of primarily bulky goods retailing along Whitehorse Road and Maroondah Highway either side of Springvale Road. The centre is constrained by the Belgrave/Lilydale rail line to the south, which has 3 stops near the centre.
Figure 47. Nunawading/MegaMile Centre Satellite Image
Source: Google Maps 2006

City of Whitehorse
Retail Strategy Review
Prepared for City of Whitehorse MacroPlan Australia Pty Ltd August 2010
84
7.3.2 Trade Area Analysis
The Nunawading/MegaMile is a unique centre in the Melbourne metropolitan region, which incorporates a large amount of bulky goods retailers, attracting a wide catchment that extends well beyond the Whitehorse LGA boundary.
The PTA has an approximate radius of 5km and extends past the Eastlink freeway in the north and stretches to High Street Road in the south. It is also constrained in part by natural boundaries such as rivers, parklands and golf courses to the east and west.
The STA extends almost 10km in parts, and incorporates a huge catchment of over 440,000 people. Key physical boundary constraints include Burke road in the east, rivers and parklands in the north and the Monash freeway to the south.
It is also expected that MegaMile attracts a relatively large beyond trade catchment, with people travelling from wider areas for large-scale bulky goods purchases.
Figure 48. Nunawading/MegaMile Trade Catchment
Source: MacroPlan 2010

City of Whitehorse
Retail Strategy Review
Prepared for City of Whitehorse MacroPlan Australia Pty Ltd August 2010
85
7.3.3 Centre competitiveness
MacroPlan has assessed the competitiveness of the MegaMile to identify its strengths and weaknesses in relation to its performance as part of a Major Activity Centre (MAC). The performance of a MAC is based on policy objectives and Triple Bottom Line (TBL) outcomes and compared against other MACs as detailed in Section 5.
MacroPlan’s assessment resulted in a total score for the Nunawading/MegaMile Activity Centre of 24.6 out of 45 with the economic bottom line scoring extremely well, however, due to the structure of the centre, social and environmental factors rated average. This places the MegaMile Centre within the ‘Positive’ assessment category – only slightly above the critical 23 point threshold. This is an indication that the centre is currently performing around average when compared with other MACs and can still improve in a number of areas as outlined below.
Figure 49. Nunawading/MegaMile competitiveness indicators
Economic Indicator Score Information
Number of Jobs 4.2 5,500 Jobs in centre
Population Catchment 4.2150,548 people in the Primary Trade Area and 289,952 people
in the Secondary Trade Area
Higher order commercial 0.8 8% of total jobs
Anchors and retail network 4
JB Hifi, Harvey Norman, Bunnings, The Good Guys, Freedom.
Not noted as "anchors" as such due to the arrangement of a
bulky goods precinct.
Social Indicators
Accessibility - within centre 1
Congestion and safety issues around Whitehorse
Road/Springvale Rd intersection. Long strip and potential
purchase means walking is often not a viable option
Accessibility - to the centre 3
Due to the layout and extent of the centre accessibility is quite
difficult. There are 3 train stations along the centre which the
bulky good area has access to. Significant bus access includes at
least 10 routes connecting to other major centres.
Residential Density 1.5
Relatively poor. Sections near the Nunawading train station to
have average lot sizes of 900sqm. Could be higher residential
capacity. Areas have been noted within the Structure Plan
Environmental Indicators
Optimise public transport network 2.814% of journey to work trips in Primary Trade Area are via
public transport
Reduce private vehicle trips 3.179% of journey to work trips in Primary Trade Area are solely
by car
Triple Bottom Line
Economic13.2
Rates extremely well economically, with high catchment and
job creation
Social5.5
Poor accessibility, walkability and density surrounding leaves
room for improvement
Environmental
5.9
Due to the poor accessibility and nature of purchase, vehicular
travel is often the only viable option - relatively poor
environmental rating
Activity Centre Rating 24.6 POSITIVE CENTRE

City of Whitehorse
Retail Strategy Review
Prepared for City of Whitehorse MacroPlan Australia Pty Ltd August 2010
86
Nunawading/MegaMile Economic Indicators
Primarily a bulky goods centre, the Nunawading/MegaMile centre has a large number of key tenants. Due to the arrangement of the Major Activity Centre (MAC) there no single ‘anchor’ drawcard as such in a classic shopping centre layout.
That being said, a few of the key retailers include, Bunnings, JB Hifi, Harvey Norman, the Good Guys, Freedom and the Home HQ complex. The centre has a large amount of retail floor space when compared to other centres in the municipality (discussed in more detail in Section 5). The large amount of trade within the centre as discussed above creates a large amount of jobs – as estimated using ABS data at 5,500 workers. However, of these jobs, only a very low amount around 8% of jobs in the centre are higher order commercial, and due to the widespread structure it is unlikely that a higher level would be feasible to create an economically higher quality centre.
Nunawading/MegaMile Social Indicators
Being primarily a ‘bulky goods’ centre, the Nunawading / MegaMile MAC is difficult to define in terms of the accessibility of the entire centre. The spread of retail, commercial and residential along Whitehorse Road makes pedestrian access to the core ‘anchors’ extremely difficult. MegaMile is ideally accessed by vehicular means in order to transport the ‘bulky goods’ to their final destination.
With this being the case, there have also been noted problems with traffic congestion and safety at intersections in particular with the busy Whitehorse Road / Springvale Road intersection.
According to 2006 ABS Census data, Nunawading has a larger proportion of detached houses compared to the average across Australia and only 8.9% of dwellings are flats, unit or apartment, compared to 14.2% nationwide.
Near the western end of the MegaMile precinct is an area outlined in the Whitehorse Housing Study as a potential area for higher density development. Average lot sizes to the western end of the precinct are 750sq.m, but it is estimated that a high density development could add an additional 84 dwellings near the Blackburn rail station. Towards the eastern end of the Nunawading/MegaMile precinct lot sizes average 900sq.m. A move to higher density in this area could add an estimate 180 dwellings near the Nunawading train station.
Nunawading/MegaMile Environmental Indicators
Both the Kmart and Nunawading/MegaMile Activity Centres have the highest levels of private vehicle usage when compared to other benchmark centres. In both centres, around 80% of workers in and around the centre to travel by private vehicles.
Despite the co-location of MegaMile to public transport, the operations of the centre mean that people who travel to the centre to purchase bulky goods are more likely to use a private vehicle than public transport – further inflating the journey to work figure.
7.3.4 Retail floor space requirements

City of Whitehorse
Retail Strategy Review
Prepared for City of Whitehorse MacroPlan Australia Pty Ltd August 2010
87
MacroPlan has assessed retail floor space requirements for the Nunawading/MegaMile centre as outlined in Section 7.1. According to analysis in Section 5.2 (Existing Supply) of this report, the current retail floor space of the MegaMile centre is approximately 158,000sq.m.
Figure 50. Retail Floor space Requirements to 2031 (sq.m)
MacroPlan has assessed that current floor space in line with the current potential for the centre, with MacroPlan estimating a floor space requirement for the centre of 157,200sq.m in 2009.
Over the next 20 years, MacroPlan estimates the Nunawading/MegaMile centre will have the potential to expand by around 23,000sq.m in terms of retail floor space, to a total level of around 180,200sq.m by 2031. Whilst this appears to be a high amount of additional floor space, the scale of the stores at the centre mean that this level of floor space could be let by as little as three large tenancies.
7.3.5 Recommendations
MacroPlan’s key recommendations surrounding the Nunawading/MegaMile relate to creating better linkages within the centre. Measures to improve pedestrian access along Whitehorse Road in line with councils current strategic plans will benefit the social bottom line of the centre.
The upgrade of the Nunawading train station has allowed for better access to key sections of the centre and may see a greater future level of retail demand from rail if the section of Springvale Road connecting to Whitehorse road becomes a greater retail focal point and a ‘gateway’ to the centre.
The accommodation of an additional 23,000sq.m of retail floor space in the centre (in line with demand estimates) will be challenging given that there are limited vacant land parcels and that densification of retail floorspace on BZ4 land is challenging from a feasibility perspective. Council should therefore consider how the additional demand could be accommodated at other centres.
Retai l format type 2009 2011 2016 2021 2026 2031 2009-2031
Food retailing
Supermarket 3,720 3,772 3,894 4,032 4,162 4,287 567
Food retail specialties 723 736 767 801 835 867 144
Restaurants and cafés 3,826 3,883 4,045 4,226 4,402 4,574 747
Total food-based 8,270 8,392 8,706 9,059 9,399 9,728 1,459
Non-Food retailing
Dept. Stores / DDS 38,427 38,966 39,773 40,718 41,566 42,334 3,908
Non-food specialties 25,527 25,875 26,473 27,166 27,798 28,380 2,853
Bulky goods 81,937 83,230 86,183 89,550 92,829 96,054 14,117
Total Non-food based 145,890 148,070 152,428 157,434 162,193 166,768 20,878
Retail services
Retail services specialties 3,076 3,137 3,267 3,413 3,555 3,694 618
Total retai l 157,237 159,599 164,402 169,906 175,147 180,191 22,954

City of Whitehorse
Retail Strategy Review
Prepared for City of Whitehorse MacroPlan Australia Pty Ltd August 2010
88
7.4 Forest Hill Chase Activity Centre
7.4.1 Locational context
The Forest Hill Chase centre is located to the south of Canterbury Road in Forest Hill. It is surrounded by housing to the south, east and west. The centre is located on around 10 hectares of land and has 57,500sq.m of floor space, of which approximately 55,000sq.m is retail. The Forest Hill centre is spread across 3 levels and it includes a strip shop to the east of the main centre.
Figure 51. Forest Hill Centre Satellite Image
Source: Google Maps 2006
7.4.2 Trade Area Analysis
Forest Hill Chase is a prime example of a suburban shopping centre layout, incorporating a large amount of specialty retail and key anchor tenancies of Myer, Hoyts, Big W, Target, Coles and Woolworths.
Due to the proximity to Box Hill, Centro The Glen and Knox Shopping centre it does not have the potential for expansion in a catchment. The PTA has an approximate radius of 1km and extends to the Nunawading/MegaMile Centre in the north and to Hawthorn Road in the south. It is also constrained by competition to the east in smaller scale shops in Vermont and the Knox Shopping Centre.
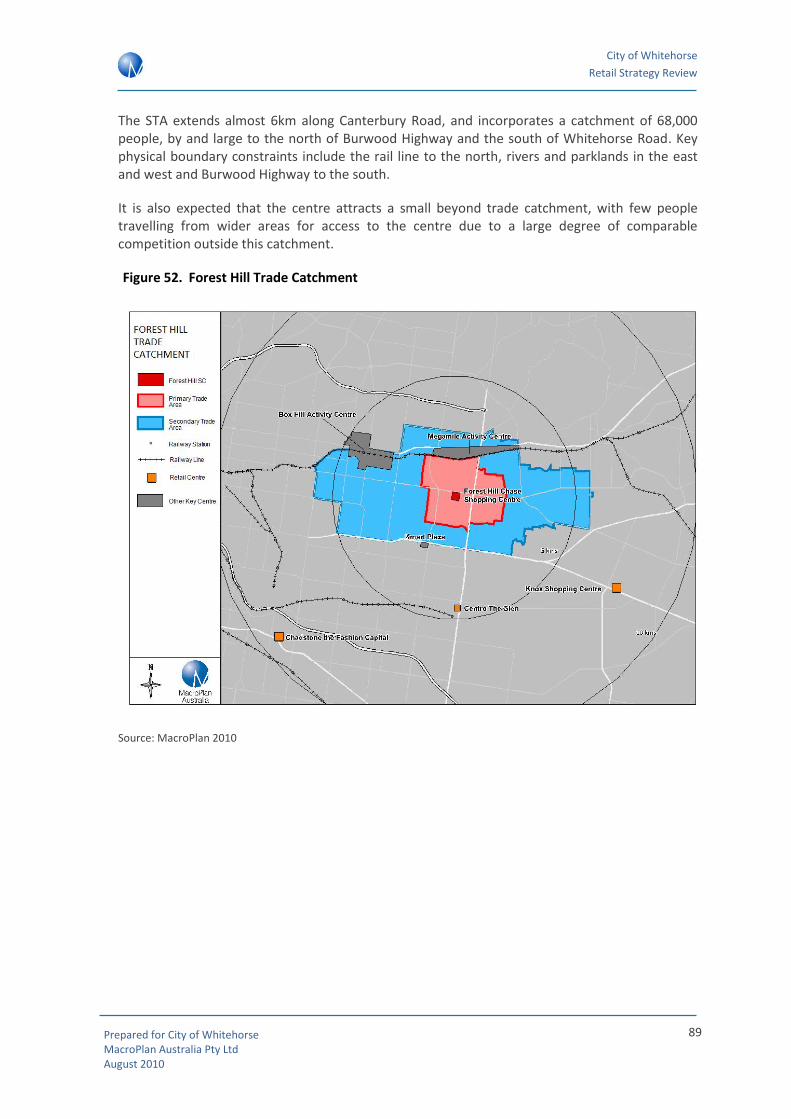
City of Whitehorse
Retail Strategy Review
Prepared for City of Whitehorse MacroPlan Australia Pty Ltd August 2010
89
The STA extends almost 6km along Canterbury Road, and incorporates a catchment of 68,000 people, by and large to the north of Burwood Highway and the south of Whitehorse Road. Key physical boundary constraints include the rail line to the north, rivers and parklands in the east and west and Burwood Highway to the south.
It is also expected that the centre attracts a small beyond trade catchment, with few people travelling from wider areas for access to the centre due to a large degree of comparable competition outside this catchment.
Figure 52. Forest Hill Trade Catchment
Source: MacroPlan 2010
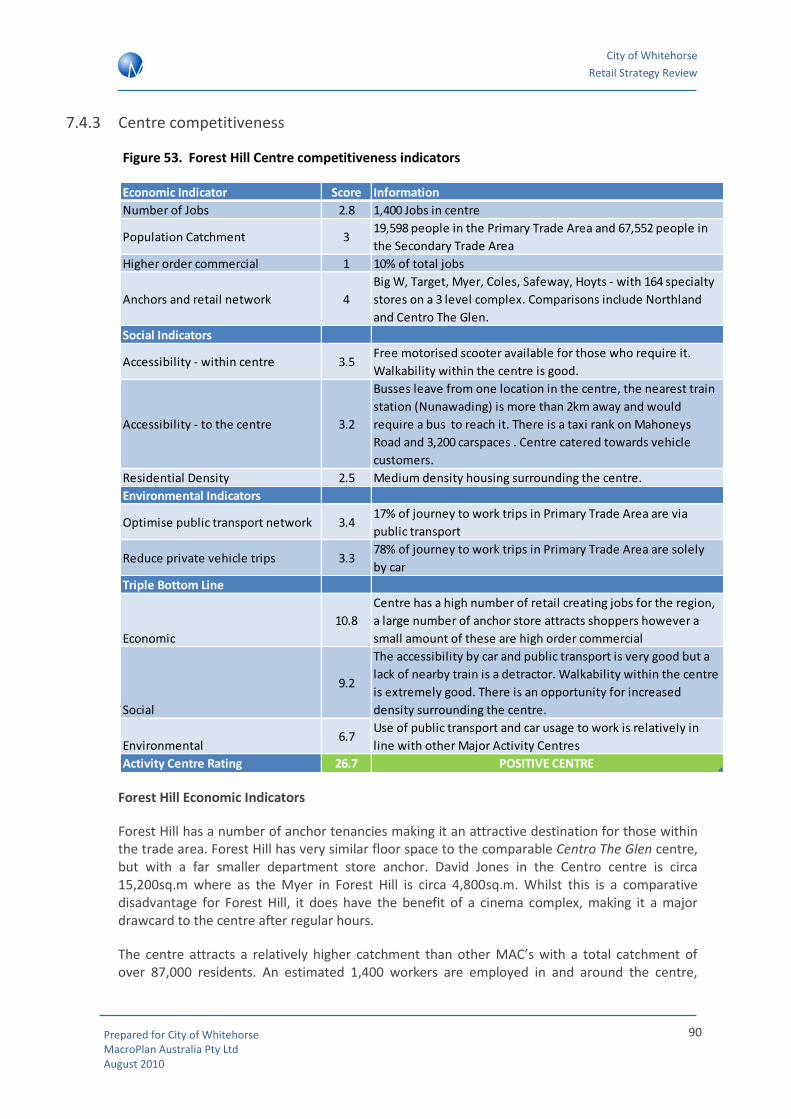
City of Whitehorse
Retail Strategy Review
Prepared for City of Whitehorse MacroPlan Australia Pty Ltd August 2010
90
7.4.3 Centre competitiveness
Figure 53. Forest Hill Centre competitiveness indicators
Forest Hill Economic Indicators
Forest Hill has a number of anchor tenancies making it an attractive destination for those within the trade area. Forest Hill has very similar floor space to the comparable Centro The Glen centre, but with a far smaller department store anchor. David Jones in the Centro centre is circa 15,200sq.m where as the Myer in Forest Hill is circa 4,800sq.m. Whilst this is a comparative disadvantage for Forest Hill, it does have the benefit of a cinema complex, making it a major drawcard to the centre after regular hours.
The centre attracts a relatively higher catchment than other MAC’s with a total catchment of over 87,000 residents. An estimated 1,400 workers are employed in and around the centre,
Economic Indicator Score Information
Number of Jobs 2.8 1,400 Jobs in centre
Population Catchment 319,598 people in the Primary Trade Area and 67,552 people in
the Secondary Trade Area
Higher order commercial 1 10% of total jobs
Anchors and retail network 4
Big W, Target, Myer, Coles, Safeway, Hoyts - with 164 specialty
stores on a 3 level complex. Comparisons include Northland
and Centro The Glen.
Social Indicators
Accessibility - within centre 3.5Free motorised scooter available for those who require it.
Walkability within the centre is good.
Accessibility - to the centre 3.2
Busses leave from one location in the centre, the nearest train
station (Nunawading) is more than 2km away and would
require a bus to reach it. There is a taxi rank on Mahoneys
Road and 3,200 carspaces . Centre catered towards vehicle
customers.
Residential Density 2.5 Medium density housing surrounding the centre.
Environmental Indicators
Optimise public transport network 3.417% of journey to work trips in Primary Trade Area are via
public transport
Reduce private vehicle trips 3.378% of journey to work trips in Primary Trade Area are solely
by car
Triple Bottom Line
Economic
10.8
Centre has a high number of retail creating jobs for the region,
a large number of anchor store attracts shoppers however a
small amount of these are high order commercial
Social
9.2
The accessibility by car and public transport is very good but a
lack of nearby train is a detractor. Walkability within the centre
is extremely good. There is an opportunity for increased
density surrounding the centre.
Environmental6.7
Use of public transport and car usage to work is relatively in
line with other Major Activity Centres
Activity Centre Rating 26.7 POSITIVE CENTRE
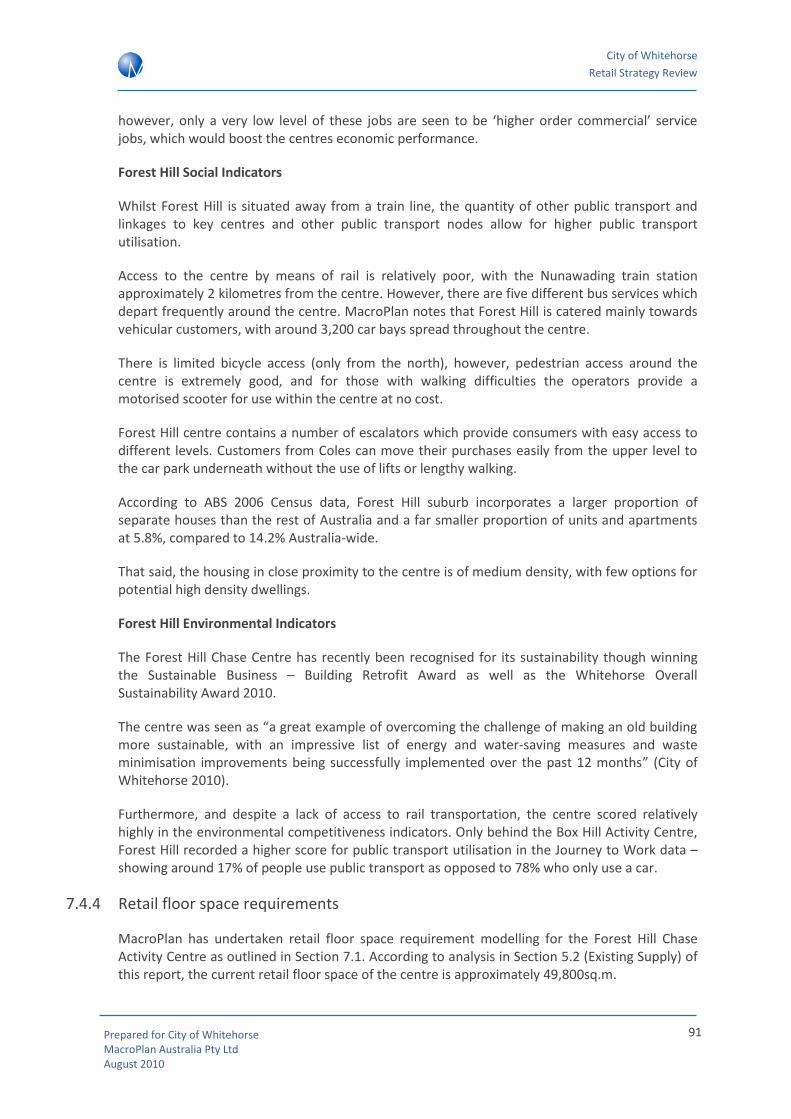
City of Whitehorse
Retail Strategy Review
Prepared for City of Whitehorse MacroPlan Australia Pty Ltd August 2010
91
however, only a very low level of these jobs are seen to be ‘higher order commercial’ service jobs, which would boost the centres economic performance.
Forest Hill Social Indicators
Whilst Forest Hill is situated away from a train line, the quantity of other public transport and linkages to key centres and other public transport nodes allow for higher public transport utilisation.
Access to the centre by means of rail is relatively poor, with the Nunawading train station approximately 2 kilometres from the centre. However, there are five different bus services which depart frequently around the centre. MacroPlan notes that Forest Hill is catered mainly towards vehicular customers, with around 3,200 car bays spread throughout the centre.
There is limited bicycle access (only from the north), however, pedestrian access around the centre is extremely good, and for those with walking difficulties the operators provide a motorised scooter for use within the centre at no cost.
Forest Hill centre contains a number of escalators which provide consumers with easy access to different levels. Customers from Coles can move their purchases easily from the upper level to the car park underneath without the use of lifts or lengthy walking.
According to ABS 2006 Census data, Forest Hill suburb incorporates a larger proportion of separate houses than the rest of Australia and a far smaller proportion of units and apartments at 5.8%, compared to 14.2% Australia-wide.
That said, the housing in close proximity to the centre is of medium density, with few options for potential high density dwellings.
Forest Hill Environmental Indicators
The Forest Hill Chase Centre has recently been recognised for its sustainability though winning the Sustainable Business – Building Retrofit Award as well as the Whitehorse Overall Sustainability Award 2010.
The centre was seen as “a great example of overcoming the challenge of making an old building more sustainable, with an impressive list of energy and water-saving measures and waste minimisation improvements being successfully implemented over the past 12 months” (City of Whitehorse 2010).
Furthermore, and despite a lack of access to rail transportation, the centre scored relatively highly in the environmental competitiveness indicators. Only behind the Box Hill Activity Centre, Forest Hill recorded a higher score for public transport utilisation in the Journey to Work data – showing around 17% of people use public transport as opposed to 78% who only use a car.
7.4.4 Retail floor space requirements
MacroPlan has undertaken retail floor space requirement modelling for the Forest Hill Chase Activity Centre as outlined in Section 7.1. According to analysis in Section 5.2 (Existing Supply) of this report, the current retail floor space of the centre is approximately 49,800sq.m.
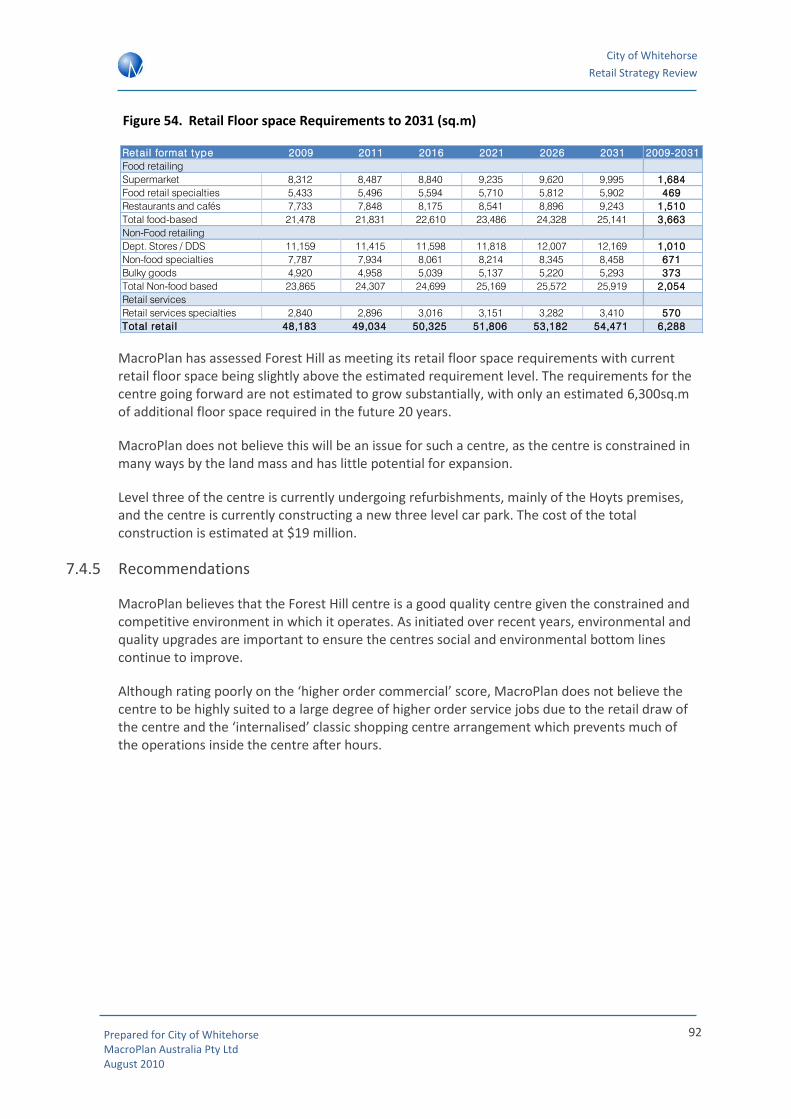
City of Whitehorse
Retail Strategy Review
Prepared for City of Whitehorse MacroPlan Australia Pty Ltd August 2010
92
Figure 54. Retail Floor space Requirements to 2031 (sq.m)
MacroPlan has assessed Forest Hill as meeting its retail floor space requirements with current retail floor space being slightly above the estimated requirement level. The requirements for the centre going forward are not estimated to grow substantially, with only an estimated 6,300sq.m of additional floor space required in the future 20 years.
MacroPlan does not believe this will be an issue for such a centre, as the centre is constrained in many ways by the land mass and has little potential for expansion.
Level three of the centre is currently undergoing refurbishments, mainly of the Hoyts premises, and the centre is currently constructing a new three level car park. The cost of the total construction is estimated at $19 million.
7.4.5 Recommendations
MacroPlan believes that the Forest Hill centre is a good quality centre given the constrained and competitive environment in which it operates. As initiated over recent years, environmental and quality upgrades are important to ensure the centres social and environmental bottom lines continue to improve.
Although rating poorly on the ‘higher order commercial’ score, MacroPlan does not believe the centre to be highly suited to a large degree of higher order service jobs due to the retail draw of the centre and the ‘internalised’ classic shopping centre arrangement which prevents much of the operations inside the centre after hours.
Retai l format type 2009 2011 2016 2021 2026 2031 2009-2031
Food retailing
Supermarket 8,312 8,487 8,840 9,235 9,620 9,995 1,684
Food retail specialties 5,433 5,496 5,594 5,710 5,812 5,902 469
Restaurants and cafés 7,733 7,848 8,175 8,541 8,896 9,243 1,510
Total food-based 21,478 21,831 22,610 23,486 24,328 25,141 3,663
Non-Food retailing
Dept. Stores / DDS 11,159 11,415 11,598 11,818 12,007 12,169 1,010
Non-food specialties 7,787 7,934 8,061 8,214 8,345 8,458 671
Bulky goods 4,920 4,958 5,039 5,137 5,220 5,293 373
Total Non-food based 23,865 24,307 24,699 25,169 25,572 25,919 2,054
Retail services
Retail services specialties 2,840 2,896 3,016 3,151 3,282 3,410 570
Total retai l 48,183 49,034 50,325 51,806 53,182 54,471 6,288

City of Whitehorse
Retail Strategy Review
Prepared for City of Whitehorse MacroPlan Australia Pty Ltd August 2010
93
7.5 Kmart / East Burwood Plaza Precinct
7.5.1 Locational context
As noted in Figure 55below, the Burwood/Kmart Activity Centre is well placed geographically on approximately 5.5 ha of land on the south-west corner of Burwood Highway and Blackburn Road. The Kmart Plaza has approximately 15,440sq.m of floor space with 13,672sq.m of this being retail use. This floor space is spread across one level.
Figure 55. Kmart / East Burwood Plaza Satellite Image
Source: Google Maps 2006
7.5.2 Trade Area Analysis
The PTA of Kmart has an approximate radius of 1km and extends to Middleborough Road in the west and to High Street Road in the south. It is also constrained by competition by Forest Hill Chase to the north and Centro The Glen to the south-east.
The STA extends far more than an ordinary centre of its size, due primarily to the catchment gain from the 24 hour Kmart. At times, residents within a certain radius may require retail needs at a time where other outlets are closed, and as such they may travel the extra distance to the Kmart/East Burwood Plaza. For this reason, the STA incorporates a catchment of 110,500 people. Key physical boundary constraints include the rail line to the north, Warrigal Highway to the west, rivers and parklands in the east and the Monash Freeway to the south.

City of Whitehorse
Retail Strategy Review
Prepared for City of Whitehorse MacroPlan Australia Pty Ltd August 2010
94
It is also expected that Kmart attracts a small beyond trade catchment, with only a small level people travelling from wider areas for access to the centre. Those who do travel to the centre from outside the MTA are expected to do so primarily for the afterhours use of the 24 hour Kmart.
Figure 56. Kmart Plaza Trade Catchment
Source: MacroPlan 2010
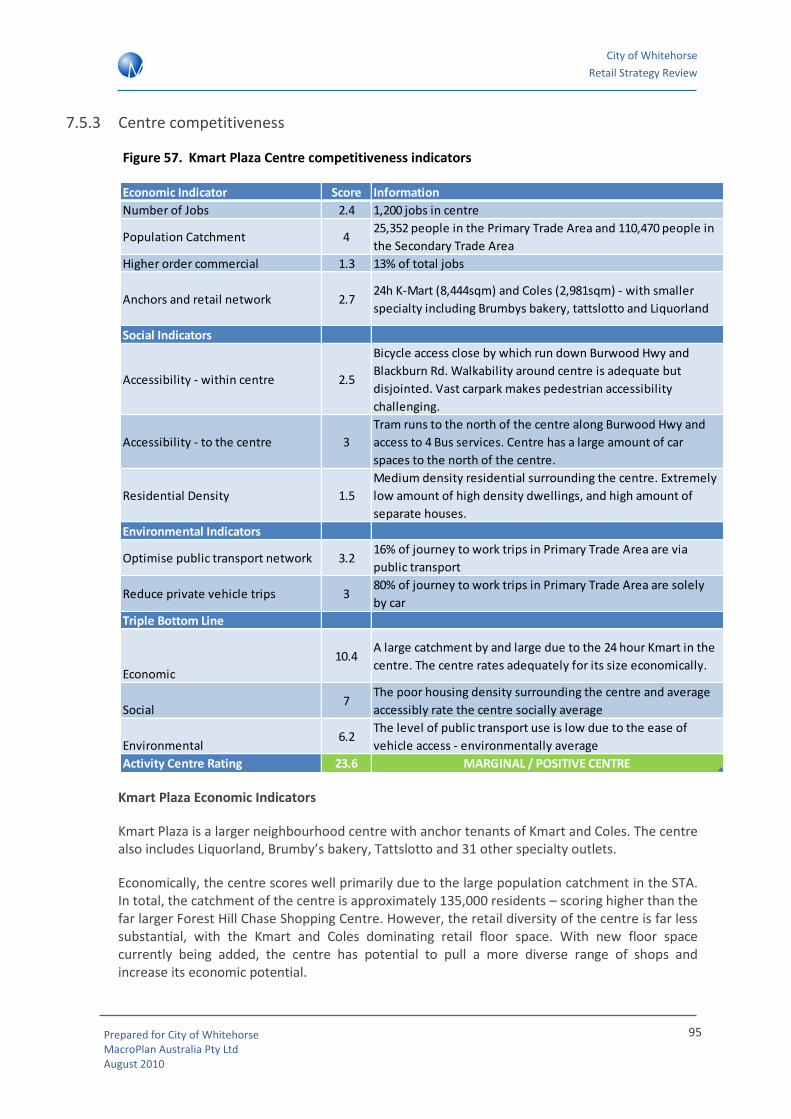
City of Whitehorse
Retail Strategy Review
Prepared for City of Whitehorse MacroPlan Australia Pty Ltd August 2010
95
7.5.3 Centre competitiveness
Figure 57. Kmart Plaza Centre competitiveness indicators
Kmart Plaza Economic Indicators
Kmart Plaza is a larger neighbourhood centre with anchor tenants of Kmart and Coles. The centre also includes Liquorland, Brumby’s bakery, Tattslotto and 31 other specialty outlets.
Economically, the centre scores well primarily due to the large population catchment in the STA. In total, the catchment of the centre is approximately 135,000 residents – scoring higher than the far larger Forest Hill Chase Shopping Centre. However, the retail diversity of the centre is far less substantial, with the Kmart and Coles dominating retail floor space. With new floor space currently being added, the centre has potential to pull a more diverse range of shops and increase its economic potential.
Economic Indicator Score Information
Number of Jobs 2.4 1,200 jobs in centre
Population Catchment 425,352 people in the Primary Trade Area and 110,470 people in
the Secondary Trade Area
Higher order commercial 1.3 13% of total jobs
Anchors and retail network 2.724h K-Mart (8,444sqm) and Coles (2,981sqm) - with smaller
specialty including Brumbys bakery, tattslotto and Liquorland
Social Indicators
Accessibility - within centre 2.5
Bicycle access close by which run down Burwood Hwy and
Blackburn Rd. Walkability around centre is adequate but
disjointed. Vast carpark makes pedestrian accessibility
challenging.
Accessibility - to the centre 3
Tram runs to the north of the centre along Burwood Hwy and
access to 4 Bus services. Centre has a large amount of car
spaces to the north of the centre.
Residential Density 1.5
Medium density residential surrounding the centre. Extremely
low amount of high density dwellings, and high amount of
separate houses.
Environmental Indicators
Optimise public transport network 3.216% of journey to work trips in Primary Trade Area are via
public transport
Reduce private vehicle trips 380% of journey to work trips in Primary Trade Area are solely
by car
Triple Bottom Line
Economic
10.4A large catchment by and large due to the 24 hour Kmart in the
centre. The centre rates adequately for its size economically.
Social7
The poor housing density surrounding the centre and average
accessibly rate the centre socially average
Environmental6.2
The level of public transport use is low due to the ease of
vehicle access - environmentally average
Activity Centre Rating 23.6 MARGINAL / POSITIVE CENTRE

City of Whitehorse
Retail Strategy Review
Prepared for City of Whitehorse MacroPlan Australia Pty Ltd August 2010
96
It also has the potential to score higher in terms of higher order commercial – through the provision of more service based jobs in the centre. The current 1,200 jobs scores well for a centre with such parameters, however, with the future extensions a focus on providing higher order commercial jobs will ensure the centre has a better mix of employment.
Kmart Plaza Social Indicators
Access to the centre via public transport is relatively good with a tram service and 4 bus services. Like Forest Hill, the centre is mainly catered towards vehicular customers, with large car parks to the north and west.
Access within the centre is good with bicycle access to the north, south and east of the centre running along Burwood Highway and Blackburn Road. Being a one level complex, much of the inter-complex accessibility is relatively good.
ABS 2006 Census data indicates a very low proportion of units and apartments relative to detached houses in comparison to the rest of Australia. Burwood East has only 4.6% of dwellings being units and apartments, compared to 14.2% nationwide. Medium density residential surrounding the centre. Extremely low amount of high density dwellings and high amount of separate houses.
Kmart Plaza Environmental Indicators
In the context of the Kmart/Burwood centre, while there is an adequate level of public transport access to the centre, the high availability of car parking incentivises private vehicle usage. MacroPlan believes this is the key reason that 80% of people who work in the centre use private vehicles, while only 16% use some form of public transport.
Due to these factors, the Kmart Centre is assessed by the MacroPlan Competitiveness Index as being environmentally ‘average’.
7.5.4 Retail floor space requirements
MacroPlan has considered retail floor space requirements for the Kmart/Burwood centre as outlined in Section 7.1. According to analysis in Section 5.2 (Existing Supply) of this report, the current retail floor space of the centre is approximately 15,400sq.m.
Figure 58. Retail Floor space Requirements to 2031 (sq.m)
Retai l format type 2009 2011 2016 2021 2026 2031 2009-2031
Food retailing
Supermarket 2,680 2,723 2,823 2,924 3,023 3,131 451
Food retail specialties 1,694 1,723 1,792 1,861 1,930 2,006 311
Restaurants and cafés 2,515 2,567 2,734 2,908 3,089 3,281 766
Total food-based 6,889 7,014 7,349 7,693 8,043 8,418 1,528
Non-Food retailing
Dept. Stores / DDS 6,154 6,328 6,575 6,824 7,071 7,326 1,172
Non-food specialties 4,517 4,626 4,805 4,985 5,165 5,351 834
Bulky goods 2,526 2,559 2,658 2,758 2,857 2,961 434
Total Non-food based 13,198 13,513 14,038 14,567 15,093 15,638 2,441
Retail services
Retail services specialties 831 852 908 965 1,025 1,089 258
Total retai l 20,918 21,379 22,294 23,226 24,161 25,145 4,227
City of Whitehorse
Retail Strategy Review
Prepared for City of Whitehorse MacroPlan Australia Pty Ltd August 2010
97
MacroPlan estimates that the centre has current capacity for additional floor space, with the requirement growing to 25,150sq.m by 2031 – around 4,200sq.m more than present levels.
In February 2010, the centre began early works on a new $50 million expansion which will include a new supermarket of 5,500sq.m, which Coles will move operations to. Further to this, the extensions to the west of the centre will include an Indoor sports & leisure centres, bowling alleys, squash courts, gymnasiums. Floor space will double from circa 15,000sq.m to 30,000sq.m.
Furthermore, less than 1 kilometre to the east of the Kmart Plaza, is a $24 million development for an Aldi supermarket and Aldi Australia headquarters which will accommodate 6,700sq.m of floor space.
Based on the above, MacroPlan believes this expansion will bring the floor space requirements in line with the long term requirements of the local catchment.
7.5.5 Recommendations
MacroPlan believes that the new expansions to the Kmart / Burwood East Plaza will be more than sufficient to service the local catchment given the proximity of more sizeable and competitive centres. The centre must also take into account the unlikely, but possible risk of a reduction market share due to other centres opening 24 hour discount department stores.
There is further development potential to the northern section of the site, currently used for car parking however, MacroPlan believes that the current extension to the centre will help achieve its retail floor space requirements into the medium-term.
Socially, recreational facilities at the site will add community benefit and encourage non-retail uses at the centre. Residential density in and around the centre is very low and has the potential to grow – with the shopping centre as a focal point.
Environmentally, the extremely low level of public transport usage is only slightly higher than Nunawading/MegaMile, which is a negative for the centre. Potentially, better targeted bus services to the north and south west could increase public transport use of nearby residents to the centre.
7.6 Key Centre Summary
Section 7 has assessed the competitiveness and potential growth in retail floorspace for the four key centres of Box Hill, Nunawading/MegaMile, Forest Hill and Kmart/East Burwood Plaza.
As assessed against other Central Activities Districts, Box Hill Activity Centre scores very well placing it in the ‘successful’ category for centres.
Other centres remain strong on many elements, but do not fulfil their designated role to their full potential.
Current redevelopment of the Burwood (Kmart) Plaza centre will assist to improve this centre substantially for higher order social and environmental areas.

City of Whitehorse
Retail Strategy Review
Prepared for City of Whitehorse MacroPlan Australia Pty Ltd August 2010
98
Overall, the key centres rate above average in comparison to centres of a similar hierarchy. Changes to the general amenity, ‘walkability’ and continual incentives for public transport utilisation will further increase the centres competitiveness in the City of Whitehorse.
Figure 59. Comparison of Competitiveness Index Scores
Source: MacroPlan, 2010
Further to rating the centres on their economic, social and environmental indicators, MacroPlan also assessed that the overall demand growth in retail floor space for the individual centres. Overall between the four centres there is an increase in demand of 42,569sq.m with 13,659 in food based retailing, 25,676sq.m in non-food retailing and 3,234sq.m in retail service specialties as noted in the figure below.
Figure 60. Comparison of growth in retail floorspace (2009 – 2031)
Source: MacroPlan, 2010
Economic Indicator Box Hill N'wading/MegaMile Forest Hill E. Burwood Plaza
Number of Jobs 4.3 4.2 2.8 2.4
Population Catchment 4.3 4.2 3 4
Higher order commercial 3.9 0.8 1 1.3
Anchors and retail network 3.9 4 4 2.7
Social Indicators
Accessibility - within centre 3.2 1 3.5 2.5
Accessibility - to the centre 4.2 3 3.2 3
Residential Density 2.2 1.5 2.5 1.5
Environmental Indicators
Optimise public transport network 4 2.8 3.4 3.2
Reduce private vehicle trips 3.9 3.1 3.3 3
Triple Bottom Line
Economic 16.4 13.2 10.8 10.4
Social 9.6 5.5 9.2 7
Environmental 7.9 5.9 6.7 6.2
Activity Centre Rating 33.9 24.6 26.7 23.6
Retai l format type
(Growth 2009 - 2031)Box Hi l l
N'wading/Me
gaMi leForest Hi l l
E.Burwood
PlazaTotal
Food retailing
Supermarket 1,346 567 1,684 451 4,047
Food retail specialties 887 144 469 311 1,812
Restaurants and cafés 3,652 747 1,510 766 6,676
Total food-based 5,885 1,459 3,663 1,528 12,535
Non-Food retailing
Dept. Stores / DDS 600 3,908 1,010 1,172 6,690
Non-food specialties 451 2,853 671 834 4,809
Bulky goods 128 14,117 373 434 15,052
Total Non-food based 1,179 20,878 2,054 2,441 26,551
Retail services
Retail services specialties 319 618 570 258 1,765
Total retai l 7,383 22,954 6,288 4,227 40,852
City of Whitehorse
Retail Strategy Review
Prepared for City of Whitehorse MacroPlan Australia Pty Ltd August 2010
99
8 Policy and Actions
MacroPlan has used the above analysis and our assessment and consideration of best practice policy in other jurisdictions to provide policy and action guidance in the following:
1. Guiding policy principles for retail strategy
2. A framework for the conduct of retail sustainability assessments (RSAs) submitted as part of a development application
3. Trigger points for the requirement for a RSA
4. Specific policy initiatives for the retail hierarchy in the study area
5. Specific policy actions for key centres
8.1 Guiding principles
There are a number of key guiding policies and principles that should be considered by developers / landowners as part of a development application for an expansion in retail floorspace that may be inconsistent with an endorsed Structure Plan.
MacroPlan recommends the following key principles are considered by stakeholders and highlighted in the Planning Scheme as key objectives:
ACCESS TO SERVICES: Insuring a distribution of retail floorspace throughout Whitehorse to allow for improved access to retail goods and services by all members of the community
COMPETITION: A catchment should be defined within reasonable boundaries to ensure consistency with the centres role in the retail hierarchy. This will assist in distributing market shares more evenly throughout the retail hierarchy.
EVIDENCE: Development applications that request an expansion in the size of a centre should be supported by evidence – preferably by a resident survey – to demonstrate why a centres catchment is growing and why demand exceeds existing supply.
INNOVATION: Innovation in retailing will continue to drive new retail formats and is supported where it can be demonstrated that consumer trends are evolving. In practice this means that new retail formats can be supported to meet changes in consumer preferences.
LOCATION: Activity centres should be located and planned to promote reduced transport energy demands and private vehicle kilometres per capita.
EMPLOYMENT IMPACT: A proposed development should consider the labour force profile of the catchment and demonstrate how it will assist in the improvement of employment self sufficiency across various industry sectors of the economy. Developments that improve employment self sufficiency in non-retail sectors as well as the retail sector will be viewed favourably.

City of Whitehorse
Retail Strategy Review
Prepared for City of Whitehorse MacroPlan Australia Pty Ltd August 2010
100
ENVIRONMENTAL IMPACTS: Development applications should consider not only economic or turnover impacts on other centres but the environmental impact of the development in relation to traffic generation and emissions. Existing and future developments should all comply with environmental regulations and more environmentally friendly and sustainable developments should be encouraged for development provided such a development has a successful triple bottom line (i.e. sustainable economically, socially and environmentally). Developments which provide benefits such as good public transport access, a low carbon footprint and good environmental practices (high level of recycling) should be prioritised.
RETURN ON GOVERNMENT INVESTMENT IN PUBLIC TRANSPORT: A development should encourage a more effective use of public transport (existing and planned) and retail expansions adjacent to principal public transport (particularly rail) will be considered more favourably.
SUPPORTING A HIERARCHY: A commitment to maintaining and enhancing the defined hierarchy of activity centres that balances the need for a distribution of retail floorspace with the importance of critical mass in non-food retailing at higher order centres.
SOCIAL IMPACTS: Development applications that include a Triple Bottom Line (TBL) assessment that clearly highlight positive social impacts will assist consideration of the application. Issues including impacts on night time activity, unemployment, community interaction, safety, amenity etc should be addressed for major development applications.
Subject to these policy principals MacroPlan has developed guidelines on what should be included in a RSA submitted as part of a development application and appropriate trigger points for the need for an RSA.
The purpose of these guidelines is to provided developers and centre owners with more certainty as to Council’s policy objectives and requirements.
8.2 Undertaking a Retail Sustainability Assessment
Traditionally a RSA has as a minimum assessed turnover impacts on other centres and confirmed the demand for retail floorspace within a defined catchment.
Council’s clear commitment to sustainable economic development and triple bottom line consideration of development applications confirms that the overall costs and benefits of a proposed development including social and economic impacts is important in the consideration of activity centre development.
Minimum requirements for an RSA
As a minimum a RSA should include the following:
Definition of a Primary and Secondary Trade Area for retail floorspace and a defined Main Trade Area
Calculation of the total retail expenditure pool generated by the catchment and the retained expenditure that is expected ‘pre’ and ‘post’ development.
City of Whitehorse
Retail Strategy Review
Prepared for City of Whitehorse MacroPlan Australia Pty Ltd August 2010
101
Assessment of whether the volume of retail expenditure that is expected to be retained in the catchment ‘post’ development is consistent with the centres position in the retail hierarchy
An RSA should clearly define why the expected retail turnover per m2 has been chosen for a proposed retail format and compare it to State and National benchmarks. Variations in performance between the proposed retail tenancies and benchmark standards should be explained. (i.e. why is the proposed new supermarket expected to trade at $6,000 per m2 when existing older supermarkets are trading at $8,000 per m2)
Clear reporting on the market shares that are expected for retail floorspace across key retail categories in the Primary and Secondary trade areas including food and ‘non-food’ retail floorspace
Clear indications of where additional trade is expected to be sourced (i.e. from existing centres, future planned centres and centres outside the defined catchment (i.e. escape expenditure)
Expected trading impacts on existing and proposed centres for each stage of the development that is proposed in % and $ terms
Calculation of employment impacts and impacts on the unemployment rate in the region subject to the volume of jobs the centre is expected to support.
8.3 Trigger Points for a retail sustainability assessment by hierarchy
The trigger point for a retail sustainability assessment (RSA) is fundamentally important as it allows for the balancing of the sustainable development of activity centres in the City of Whitehorse with the target of ensuring an adequate supply of retail floorspace to meet consumer needs.
It is important that an RSA is not bluntly applied to any development application received for a retail centre. A trigger point for the requirement for an RSA is therefore critical. These trigger points will allow for greater developer certainty and a smoother development assessment process.
MacroPlan believes that a more rigorous RSA framework does have a place in the assessment process, however it is not appropriate at all levels of the retail hierarchy. An RSA should not be required for a centre that is developing within the boundaries of an endorsed Centre Structure Plan and should only be required for centres that plan to deliver a significant variation in retail floorspace above the volume endorsed within the Centre Structure Plan.
The figure below outlines recommendations on the trigger point for an RSA for development inconsistent with a Centre Structure Plan. These triggers are not only applicable for a centre that may be expanding within its designated retail hierarchy; they are also potentially applicable if a centre is proposing to deliver a format of retail floorspace or a volume of retail floorspace that would effectively elevate its role to a new level of the centres hierarchy.
MacroPlan recommends that there are no restrictions on the supply of non-retail floorspace (i.e. office) at the Box Hill CAD or MACs.

City of Whitehorse
Retail Strategy Review
Prepared for City of Whitehorse MacroPlan Australia Pty Ltd August 2010
102
Figure 61. Trigger points for a RSA – CADs, MACs and NACs
Source: MacroPlan Australia 2010
• The Box Hill CAD should expand in line with market need and any endorsed centre structure plan.
• Council should consider how expansions at the existing centre will assist in the achievement of employment growth in Whitehorse
• There should be no retail floorspace or commercial floorspace cap at this level of the hierachy
• Any expansion in retail floorspace by Centro should be supported given the centres co-location to the PPTN and employment
Cen
tral
A
ctiv
itie
s D
istr
ict
•Existing MACs should be required to submit a RSA for any expansion in shop floorspace above 3,000m2 NLA .
•Retail catchments defined in an RSA should preferably be supported by a resident survey.
• The RSA should include elements listed in part 8.2 of this report
•Expansions in retail floorspace at MACs co-located to principal public transport infrastructure (particularly rail) could be supported without a RSA if Council has a policy objective to activate the centre as a Transit Oreinted Development.M
ajo
r A
ctiv
ity
Cen
tres
•An RSA should be submitted for expansions above 2,000m2 or 1,000m2 for an individual shop if a Centre Structure Plan is not in place or does not provide guidance on requirements for additional retail floorspace.
•The expansion should meet the requirements of an RSA outlined in part 8.2 of this report.
•Expansions in retail floorspace at Neighbourhood Centres co-located to public transport infrastructure (particularly rail) could be supported without an RSA at the discretion of Council if activation as a TOD is consistent with Council policy.
• Residential densification around existing NACs should be enhanced to encourage utilisation of existing commercial and social infrastructure.N
eigh
bo
urh
oo
d
Act
ivit
y C
entr
es

City of Whitehorse
Retail Strategy Review
Prepared for City of Whitehorse MacroPlan Australia Pty Ltd August 2010
103
8.4 Specific Policy Initiatives applying to the Local Planning Policy
Future retail development in the City of Whitehorse should be guided by the need for additional retail development, and an evaluation of the net community benefits of any additional development. The Whitehorse Planning Scheme should consider the following elements:
Reinforce City of Whitehorse as providing the leading supply of retail facilities and services.
Promote orderly development of retail floorspace in existing shopping districts, and new retail precincts (i.e. Burwood Square) as required.
Provide recommendations for the planning framework upon which future retail facilities will be planned, assessed and developed.
The key objectives of the City of Whitehorse Retail Strategy are to:
Maintain a retail centre hierarchy which strengthens existing retail and commercial areas.
Continue to strengthen the Box Hill CAD as the major shopping and business centre in the region.
Encourage the provision and distribution of local and neighbourhood shopping centres to serve local communities.
Maximise the efficient use of existing and planned infrastructure.
Encourage landlords to increase investment and encourage retail tenants to remain in Whitehorse.
Improve the potential for multi-purpose trips to maintain or increase market share.
Introduce design guidelines to maintain and improve the appearance and operation of existing and future development, and
Improve access, connectivity to public transport, and in some cases, parking in line with consumer requirements.
The retail development strategy identifies a number of initiatives for Council and key private stakeholders to assist in improving the performance of Whitehorse’s retail sector. The following recommendations detail actions, management structures, key performance indicators and priorities for each initiative.
1. Working in Partnership
Continue to develop an improved working relationship between the City of Whitehorse and the business / retail community, including communication channels and strategic planning.
2. Encourage Landlord Reinvestment
Increase the levels of landlord reinvestment in the all Whitehorse retail precincts in order to improve the trading positions, shop fronts and visual aesthetic of retailers.
City of Whitehorse
Retail Strategy Review
Prepared for City of Whitehorse MacroPlan Australia Pty Ltd August 2010
104
This will provide an improved retail shopping experience and increase the competitiveness of retailers.
3. Enhance Precinct Definition
To improve precinct definition and access for key retail areas in City of Whitehorse and to improve the general ambience and security of all shopping districts.
This may be achieved by introducing uniform and consistent signage and street lighting within each precinct, and strategic transport routes, including major transport arterials.
4. Coordinated increased trading hours, including night time economy
To implement a coordinated approach to enhance a night time economy so that City of Whitehorse retailers can take full advantage of retail trade from visitors and workers.
Combine and enhance cultural, leisure, entertainment and hospitality experiences with shopping, to enhance the ability for retailers to increase their weekly trade.
5. Address Development Opportunities and Service Gaps
To address development opportunities and service gaps as they arise, based on thorough research on tenancy mix and scale of development through a demand and needs assessment and net community benefit assessment.
There continues to be a number of retail opportunities available to retailers in Whitehorse City already in the development lifecycle; these developments should be of an appropriate size and assessed for the appropriate use mix.
8.5 Specific Actions by Centre
In developing a set of recommended guidelines for consideration, MacroPlan has considered the following factors:
Discussions from stakeholders and business groups.
Best practice national policy and relevant directions from legislation.
Consideration of the constraints and benefits of development applications and their requirements from an assessment perspective.
Consideration of normative resident and worker catchments at each level of the activity centre hierarchy as defined in part 5 of this report.
Policy objectives of the Victorian State Government.
City of Whitehorse
Retail Strategy Review
Prepared for City of Whitehorse MacroPlan Australia Pty Ltd August 2010
105
Following consideration of the factors outlined in Appendix B, MacroPlan believes that a set of development application guidelines should be supported. However, their application needs to be clear and that the parts of the centres hierarchy that they apply to should be restricted, for example where an Economic Impact Assessment is required.
MacroPlan recommends that the City of Whitehorse should direct an applicant to pay for the cost of a peer review of an assessable application by Council if required.
MacroPlan still believes this is an important issue to provide the City of Whitehorse with the opportunity to seek independent advice on the appropriateness of a development application.
The figure below provides a number of recommendations for key centres in the Whitehorse LGA.
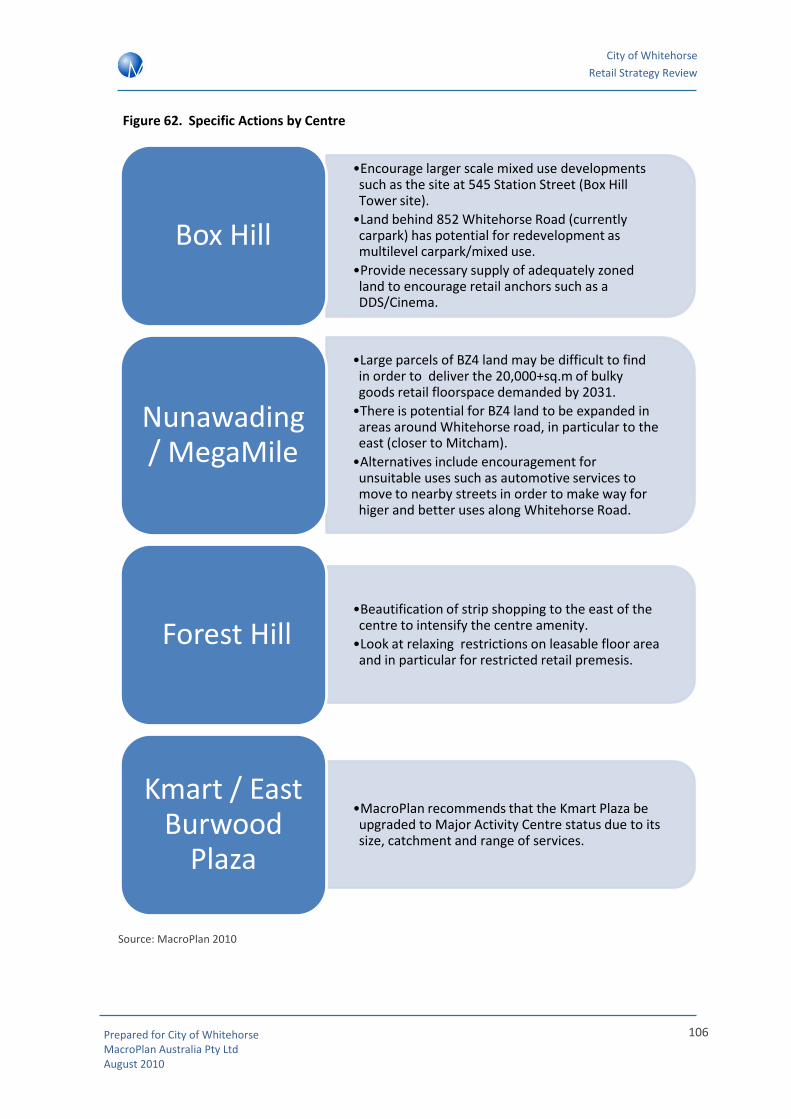
City of Whitehorse
Retail Strategy Review
Prepared for City of Whitehorse MacroPlan Australia Pty Ltd August 2010
106
Figure 62. Specific Actions by Centre
Source: MacroPlan 2010
•Encourage larger scale mixed use developments such as the site at 545 Station Street (Box Hill Tower site).
•Land behind 852 Whitehorse Road (currently carpark) has potential for redevelopment as multilevel carpark/mixed use.
•Provide necessary supply of adequately zoned land to encourage retail anchors such as a DDS/Cinema.
Box Hill
•Large parcels of BZ4 land may be difficult to find in order to deliver the 20,000+sq.m of bulky goods retail floorspace demanded by 2031.
•There is potential for BZ4 land to be expanded in areas around Whitehorse road, in particular to the east (closer to Mitcham).
•Alternatives include encouragement for unsuitable uses such as automotive services to move to nearby streets in order to make way for higer and better uses along Whitehorse Road.
Nunawading / MegaMile
•Beautification of strip shopping to the east of the centre to intensify the centre amenity.
•Look at relaxing restrictions on leasable floor area and in particular for restricted retail premesis.
Forest Hill
•MacroPlan recommends that the Kmart Plaza be upgraded to Major Activity Centre status due to its size, catchment and range of services.
Kmart / East Burwood
Plaza
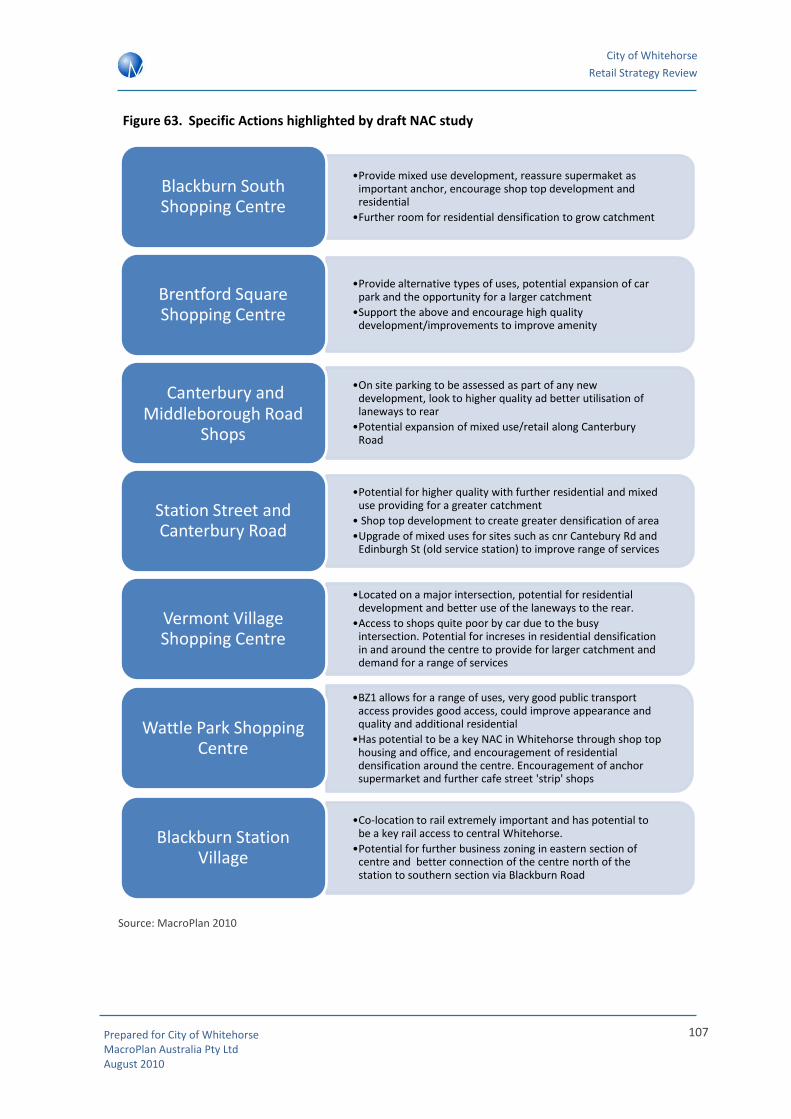
City of Whitehorse
Retail Strategy Review
Prepared for City of Whitehorse MacroPlan Australia Pty Ltd August 2010
107
Figure 63. Specific Actions highlighted by draft NAC study
Source: MacroPlan 2010
•Provide mixed use development, reassure supermaket as important anchor, encourage shop top development and residential
•Further room for residential densification to grow catchment
Blackburn South Shopping Centre
•Provide alternative types of uses, potential expansion of car park and the opportunity for a larger catchment
•Support the above and encourage high quality development/improvements to improve amenity
Brentford Square Shopping Centre
•On site parking to be assessed as part of any new development, look to higher quality ad better utilisation of laneways to rear
•Potential expansion of mixed use/retail along Canterbury Road
Canterbury and Middleborough Road
Shops
•Potential for higher quality with further residential and mixed use providing for a greater catchment
• Shop top development to create greater densification of area
•Upgrade of mixed uses for sites such as cnr Cantebury Rd and Edinburgh St (old service station) to improve range of services
Station Street and Canterbury Road
•Located on a major intersection, potential for residential development and better use of the laneways to the rear.
•Access to shops quite poor by car due to the busy intersection. Potential for increses in residential densification in and around the centre to provide for larger catchment and demand for a range of services
Vermont Village Shopping Centre
•BZ1 allows for a range of uses, very good public transport access provides good access, could improve appearance and quality and additional residential
•Has potential to be a key NAC in Whitehorse through shop top housing and office, and encouragement of residential densification around the centre. Encouragement of anchor supermarket and further cafe street 'strip' shops
Wattle Park Shopping Centre
•Co-location to rail extremely important and has potential to be a key rail access to central Whitehorse.
•Potential for further business zoning in eastern section of centre and better connection of the centre north of the station to southern section via Blackburn Road
Blackburn Station Village

City of Whitehorse
Retail Strategy Review
Prepared for City of Whitehorse MacroPlan Australia Pty Ltd August 2010
108
8.6 Concluding Recommendations
MacroPlan has made a number of recommendations regarding alterations to the Whitehorse Local Planning Scheme to enable a dynamic retail environment and a more certain framework for developers.
Clause 21.07 – Economic Development
While the provisions within the economic development clause is supported, MacroPlan recommends further guiding principles such as those outlined in Section 8.1 of the report be incorporated into the LPP to guide economic development within the municipality.
Clause 22.06 – Activity Centres
MacroPlan recommends that clause 22.06 includes general policy principles such as those outlined within 8.4 and 8.5 of the report.
A key recommendation is to further focus on the importance of the upgraded East Burwood Plaza. While long term future growth of the centre will be constrained by low population growth and increased supply of retail floorspace in the catchment, the mix of uses provides for more focus that a typical Neighbourhood Activity Centre. MacroPlan believes the centre to fall within the Major Activity Centre category of the hierarchy.
Finally, MacroPlan has outlined some key areas of future action for Neighbourhood Activity Centres outlined in Figure 62 above. Focussing efforts on increasing density, shop top developments, upgrading quality and allowing mixed use zoning in these areas will provide quality convenience retail for localised catchments.
RSA Trigger
MacroPlan has suggested trigger points for retail sustainability assessments which assess among other things the economic impacts of a proposal on surrounding retail premises’. The provisions outlined within Section 8.3 of the report should be included within the LPP the provide for an RSA to be conducted under certain circumstances outside the allowances of the relevant structure plan.

City of Whitehorse
Retail Strategy Review
Prepared for City of Whitehorse MacroPlan Australia Pty Ltd August 2010
109
Appendix A – Whitehorse Retail Precincts
Centre Name Address Suburb
Box Hill District Centre Box Hill Box Hill
Forest Hill Chase Mahoney's Road
Canterbury Road, Forest Hill
Burwood (K-mart) Shops Burwood K-mart. Burwood Highway, Burwood East
Burwood Highway Burwood Village, Burwood
Mitcham Shopping Centre Cnr Maroondah Hwy & Mitcham Road, Mitcham
Blackburn Station Village South Pde & Railway Road, Blackburn
Vermont South Shopping Centre
Burwood Highway, Vermont South
North Blackburn Square Shoping Centre
Springfield Road Blackburn North
Burwood Heights Shopping Centre
Burwood Highway, East Burwood
Box Hill South Shopping Centre
Station St & Canterbury Rd; Box Hill
Mont Albert Shopping Centre Mont Albert & Hamilton, Mont Albert
Wattle Park Shopping Centre Elgar Rd & Riversdale Rd, Surrey Hills
Cromwell & McIntyre Shops Cromwell & McIntyre, Burwood
Arcade Rd Shops Arcade Rd (Dunloe & Access) Mont Albert North
Bennettswood Shopping Centre
Station Street & Burwood Highway, Bennettswood
Station & Thames St Shops Station & Thames St, Box Hill
Woodhouse Grove & Station St Shops
Woodhouse Grove & Station St, Box Hill
Trawool & Dorking Shops Trawool Street; Box Hill North
Second Ave & Cherry Orchard Rise Shops
Second Ave & Cherry Orchard Rise, Box Hill North
Houston Shopping Centre Middleborough Rd, Burwood
Riversdale Rd & Ferndale St shops
Riversdale Rd & Ferndale St, Surrey Hills
Kerrimuir Shopping Centre Corner Springfield & Middleborough Rds,
Blackburn North
Woodhouse Grove & Elgar Rd Shops
Woodhouse Grove & Elgar Rd; Box Hill North
Station St & Asquith Shops Station St & Asquith, Box Hill South
Milne & Sewell Shops Milne & Sewell, Mont Albert North
Oakwood Shops Eley & Middleborough Rd; Blackburn South
Faelen & Puerta Shops Faelen & Puerta, Burwood
Elgar & Belmore Shops Elgar & Behnore Rd, Box Hill North
Devon St & Birdwood Shops Devon St & Birdwood, Box Hill South
Gladstone & Elgar Rd's shops Gladstone & Elgar Rd, Surrey Hills
Blackburn South Shops Canterbury Rd, Blackburn South
Nunawading Shops Springvale Rd, Nunawading
Brentford Square Shopping Centre
Brentford Square, Forest Hill
Beech Street Shops Corner Beech Street & Rooks Road, Nunawading
Mitcham & Park Rd's Shops Mitcham & Park Rd's, Mitcham
Francis & Claire Shops Francis & Claire, Blackburn
Vermont Village Shopping Centre
Cnr Boronia & Canterbury Rd's, Mitcham
Canterbury & Springvale Rd shops
Canterbury & Springvale Rd's, Nunawading
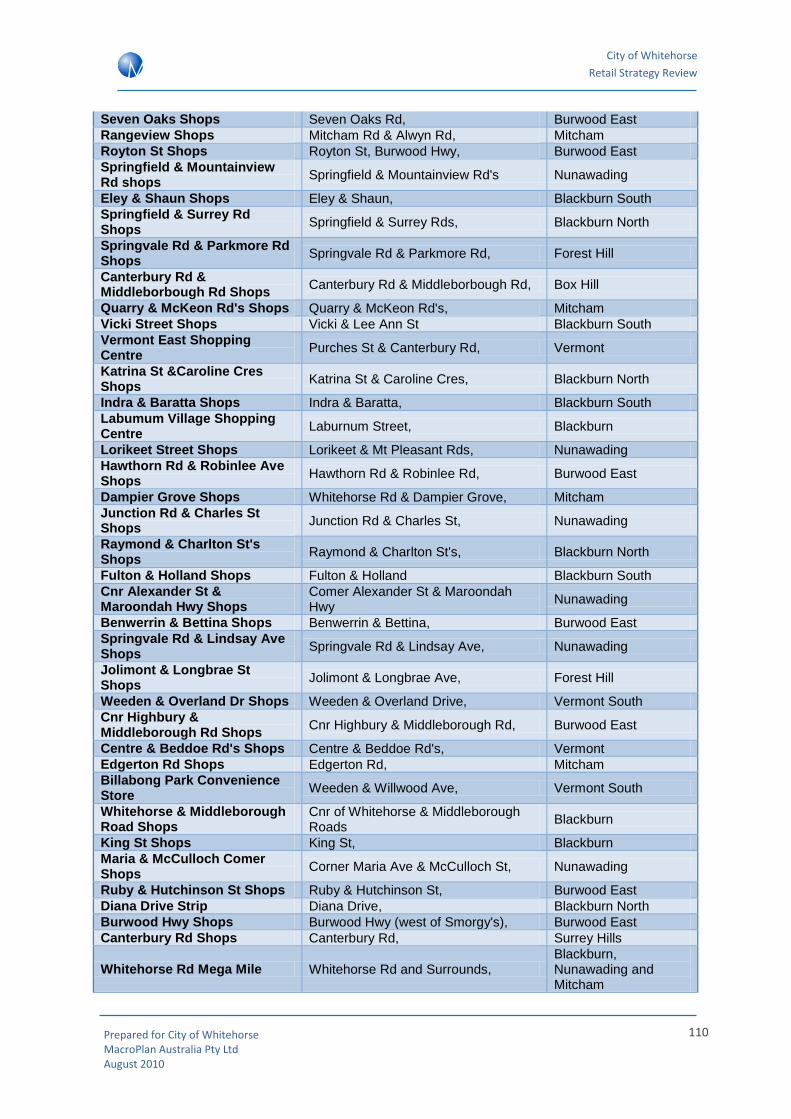
City of Whitehorse
Retail Strategy Review
Prepared for City of Whitehorse MacroPlan Australia Pty Ltd August 2010
110
Seven Oaks Shops Seven Oaks Rd, Burwood East
Rangeview Shops Mitcham Rd & Alwyn Rd, Mitcham
Royton St Shops Royton St, Burwood Hwy, Burwood East
Springfield & Mountainview Rd shops
Springfield & Mountainview Rd's Nunawading
Eley & Shaun Shops Eley & Shaun, Blackburn South
Springfield & Surrey Rd Shops
Springfield & Surrey Rds, Blackburn North
Springvale Rd & Parkmore Rd Shops
Springvale Rd & Parkmore Rd, Forest Hill
Canterbury Rd & Middleborbough Rd Shops
Canterbury Rd & Middleborbough Rd, Box Hill
Quarry & McKeon Rd's Shops Quarry & McKeon Rd's, Mitcham
Vicki Street Shops Vicki & Lee Ann St Blackburn South
Vermont East Shopping Centre
Purches St & Canterbury Rd, Vermont
Katrina St &Caroline Cres Shops
Katrina St & Caroline Cres, Blackburn North
Indra & Baratta Shops Indra & Baratta, Blackburn South
Labumum Village Shopping Centre
Laburnum Street, Blackburn
Lorikeet Street Shops Lorikeet & Mt Pleasant Rds, Nunawading
Hawthorn Rd & Robinlee Ave Shops
Hawthorn Rd & Robinlee Rd, Burwood East
Dampier Grove Shops Whitehorse Rd & Dampier Grove, Mitcham
Junction Rd & Charles St Shops
Junction Rd & Charles St, Nunawading
Raymond & Charlton St's Shops
Raymond & Charlton St's, Blackburn North
Fulton & Holland Shops Fulton & Holland Blackburn South
Cnr Alexander St & Maroondah Hwy Shops
Comer Alexander St & Maroondah Hwy
Nunawading
Benwerrin & Bettina Shops Benwerrin & Bettina, Burwood East
Springvale Rd & Lindsay Ave Shops
Springvale Rd & Lindsay Ave, Nunawading
Jolimont & Longbrae St Shops
Jolimont & Longbrae Ave, Forest Hill
Weeden & Overland Dr Shops Weeden & Overland Drive, Vermont South
Cnr Highbury & Middleborough Rd Shops
Cnr Highbury & Middleborough Rd, Burwood East
Centre & Beddoe Rd's Shops Centre & Beddoe Rd's, Vermont
Edgerton Rd Shops Edgerton Rd, Mitcham
Billabong Park Convenience Store
Weeden & Willwood Ave, Vermont South
Whitehorse & Middleborough Road Shops
Cnr of Whitehorse & Middleborough Roads
Blackburn
King St Shops King St, Blackburn
Maria & McCulloch Comer Shops
Corner Maria Ave & McCulloch St, Nunawading
Ruby & Hutchinson St Shops Ruby & Hutchinson St, Burwood East
Diana Drive Strip Diana Drive, Blackburn North
Burwood Hwy Shops Burwood Hwy (west of Smorgy's), Burwood East
Canterbury Rd Shops Canterbury Rd, Surrey Hills
Whitehorse Rd Mega Mile Whitehorse Rd and Surrounds, Blackburn, Nunawading and Mitcham

City of Whitehorse
Retail Strategy Review
Prepared for City of Whitehorse MacroPlan Australia Pty Ltd August 2010
111
Whitehorse Rd and Victoria Cres Shops
Whitehorse Rd, Mont Albert
Whitehorse & Pendle Rd Shops
Whitehorse & Pendle Roads, Box Hill
Mitcham Rd & Andover Ave Shops
Mitcham Rd & Andover Ave Mitcham
Station Street at Albion Road Shops
Station Street Box Hill Box Hill
Morack Road at Burwood Highway
Cnr Morack Road and Burwood Highway
Vermont South
Banksia Street in Burwood 14-22 Banksia st Burwood
Whitehorse Rd & Pope Rd shops
Whitehorse Rd & Pope Rd Blackburn
Whitehorse Rd & Williams St Shops
Whitehorse Rd & Williams St Blackburn