retail markets monitoring report ceer report
TRANSCRIPT
1Council of European Energy Regulators asbl
Cours Saint-Michel 30a, Box F – 1040 Brussels, Belgium Arrondissement judiciaire de Bruxelles – RPM 0861.035.445
CIBM WG/MMR TF
Retail Markets Monitoring Report
CEER Report
Ref: C17-MMR-83-02 21 November 2017
Ref: C17-MMR-83-02 Retail Markets Monitoring Report
2/54
TABLE OF CONTENT
EXECUTIVE SUMMARY ............................................................................................................ 6
OVERVIEW OF SELECTED RETAIL MARKET DEVELOPMENTS IN EUROPE SINCE 12011 ........................................................................................................................................... 9
Market structure ............................................................................................................ 9 1.1
Number of suppliers and customers ................................................................ 9 1.1.1
Market concentration ..................................................................................... 13 1.1.2
Customers switching activities..................................................................................... 16 1.2
Price regulation ........................................................................................................... 17 1.3
MARKET STRUCTURE ..................................................................................................... 19 2
Household segment .................................................................................................... 19 2.1
Number of customers .................................................................................... 19 2.1.1
Consumption levels ....................................................................................... 21 2.1.2
Number of suppliers and entry/exit activity .................................................... 24 2.1.3
Market shares and market concentration ....................................................... 26 2.1.4
Non-household segment ............................................................................................. 29 2.2
Number of customers and consumption levels .............................................. 29 2.2.1
Number of suppliers and entry/exit activity .................................................... 30 2.2.2
Market shares and market concentration ....................................................... 32 2.2.3
CUSTOMER SWITCHING ACTIVITIES ............................................................................. 36 3
Household segment .................................................................................................... 36 3.1
External switching rates ................................................................................. 36 3.1.1
Internal switching ........................................................................................... 38 3.1.2
Switching activities of customers with regulated prices .................................. 39 3.1.3
Non-household segment ............................................................................................. 40 3.2
Annual switching rates ................................................................................... 40 3.2.1
Barriers to supplier switching ...................................................................................... 41 3.3
INTERVENTION IN PRICE SETTING AND PRICE REGULATION ................................... 44 4
Household segment .................................................................................................... 44 4.1
Existence and types of price intervention and regulation ............................... 44 4.1.1
Number of household customers under regulated end-user prices ................ 45 4.1.2
Roadmaps for the removal of regulated retail prices ...................................... 47 4.1.3
Non-household segment ............................................................................................. 48 4.4
Existence of regulated prices ......................................................................... 48 4.4.1
Number of non-household customers under regulated end-user prices ......... 49 4.4.2
Roadmaps for removal of regulated retail prices ............................................ 51 4.4.3
TABLE OF FIGURES ............................................................................................................... 52

Ref: C17-MMR-83-02 Retail Markets Monitoring Report
3/54
ABOUT CEER .......................................................................................................................... 54
Ref: C17-MMR-83-02 Retail Markets Monitoring Report
4/54
INFORMATION PAGE
Abstract
This document (C17-MMR-83-02) presents the Retail Markets Monitoring Report.
This document seeks to support the findings of ACER/CEER’s position paper “Energy Regulation: A Bridge to 2025”. Therefore, the report shall deliver an overview on the recent retail markets developments and intends to provide a valuable input for discussions triggered by the “Clean Energy Package” proposals of the European Commission.
Target Audience European Commission, energy suppliers, investors, traders, gas/electricity customers, gas/electricity industry, consumer representative groups, network operators, Member States, academics and other interested parties.
Keywords Electricity retail markets, Gas retail markets, Consumer issues, Supplier switching, 3rd Package, Market monitoring, National Regulatory Authorities (NRAs) If you have any queries relating to this paper please contact: CEER Secretariat Tel. +32 (0)2 788 73 30 Email: [email protected]

Ref: C17-MMR-83-02 Retail Markets Monitoring Report
5/54
Related Documents CEER documents
CEER Report on commercial barriers to supplier switching in EU retail energy markets, 07.07.2016, Ref. C15-CEM-80-04
CEER Paper “Handbook for National Energy Regulators - How to assess retail market functioning”, 24.01.2017, Ref. C16-SC-52-03
ACER-CEER documents
Energy Regulation: A Bridge to 2025, Conclusions Paper, September 2014
ACER-CEER Market Monitoring Report 2015, November 2016
ACER-CEER Market Monitoring Report 2016, October 2017 External documents related
Consumer survey in the Netherlands, ACM, 2016
Consumers survey in Ireland, CER, 2015
Empowering electricity consumers in retail and wholesale markets, Project report, CERRE, 2017
Status quo bias in decision making, Samuelson, W. & Zeckhauser, Journal of Risk and Uncertainty, 1988
Anomalies: The Endowment Effect, Loss Aversion, and Status Quo Bias, Daniel Kahneman, Jack L. Knetsch, Richard H. Thaler, Journal of Economic Perspectives, 1991
Behavioural Economics, Sendhil Mullainathan and Richard H. Thaler, NBER Working Paper No. 7948, 2000
Do Defaults Save Lives? Johnson, Eric J. and Goldstein, Daniel G., Science, Vol. 302, pp. 1338-1339, 2003
The Effect of Perceived Value and Switching Barriers on Customer Price Tolerance in Industrial Energy Markets, García-Acebrón, Constantino and Vázquez, Rodolfo & Iglesias, Víctor, Journal of Business-to-business Marketing, 2010
Whatever the customer wants, the customer gets? Exploring the gap between consumer preferences and default electricity products in Germany, Josef Kaenzig, Stefanie Lena Heinzle and Rolf Wüstenhagen, Energy Policy, 2013
Managing customer loyalty in liberalized residential energy markets: The impact of energy branding, Patrick Hartmann and Vanessa Apaolaza Ibanez, Energy Policy, 2007
Green defaults: Information presentation and pro-environmental behavior, Daniel Pichert, Konstantinos V.Katsikopoulos, 2008, Journal of Environmental Psychology
Why Do More British Consumers Not Switch Energy Suppliers? The Role of Individual Attitudes, Xiaoping He and David Reiner, Cambridge Working Paper in Economics, 2015
Libertarian Paternalism, Richard Thaler and Cass Sunstein, American Economic Review, 2003
Ref: C17-MMR-83-02 Retail Markets Monitoring Report
6/54
EXECUTIVE SUMMARY
The ACER-CEER position paper “Energy Regulation: A Bridge to 2025” highlights the importance of competitive and fully integrated internal markets for all European consumers and states that an efficient monitoring of retail markets is necessary to evaluate progress and assure that its (positive) effects are to the benefit of all consumers. The main objective of this report is to provide further insights on some of the most important aspects of European retail markets1 and to contribute to the discussions triggered by the European Commission’s “Clean Energy Package for all Europeans” proposals. To follow this objective, the document consists of an aggregated analysis on the overall impact of the Third Package on European retail markets since 20112 and of an analysis of recent developments related to market structures, switching rates and to market regulation in Member States between 2015 and 2016. The data used in this report is entirely stemming from NRAs’ input to CEER’s National Indicators Database. Main findings of the report Although the European electricity and gas retail markets are still driven by many national differences (e.g. in their structure and legislation), the aggregated and country-based analysis shows that:
- A well-functioning retail market requires sufficient competition among suppliers, which tends to be positively related to the number of active suppliers and to DSOs acting as neutral and efficient market facilitators on a level playing field. These conditions are critical to ensuring that a high degree of competition and innovation thrives to the benefit of customers.
- As a result of unbundling, other liberalization measures and favourable wholesale market access and price conditions in this period, many new companies entered the retail markets and are operating as alternatives to incumbent suppliers. In that sense, compared to 2011, European household customers could, in average, benefit from the increasing supplier variety both on gas and electricity markets. (e.g. in the household segment, the total number of suppliers increased from 2,251 to 3,165 or 41% in electricity and from 1,366 to 1,792 or 34% in gas, while non-domestic retail markets also show similar patterns). Nevertheless, these values significantly vary among Member States (e.g. from over 1,000 electricity and over 800 gas household suppliers in Germany to only one electricity and/or gas supplier in several MS).
- The overall number of suppliers and the number of suppliers that are active nationwide also varies widely among MS. In a few countries, like Germany and Italy,
1 Information on e.g. prices and price developments can be found in the Retail volume of the ACER-CEER Market
Monitoring Report 2016. 2 From 2009 on, Member States (MS) had 18 months to transpose the directives of the Third Package into
national law, which has been followed by the liberalization of electricity and gas markets in many countries.

Ref: C17-MMR-83-02 Retail Markets Monitoring Report
7/54
the total number of suppliers is much higher than the number of nationwide suppliers showing an important market activity on a regional level.
- The analysed data confirms the existing evidence and shows that the level of entry-exit activity on supplier side of electricity and gas retail markets has been noticeably increased. This seems to be a common trend in every MS, although several countries did not show any increase in market activity for several years, mainly because of price regulation and often because of the existence of only one main supplier.
- Even though new suppliers are mainly national, there are several suppliers which are present in many MS (i.e. E.ON is present in the majority of MS, while RWE, EDF, ENI, ENGIE, Alpiq are also active across several MS).
- However, despite the increase in the number of suppliers, the entry-exit activity and the slight decrease in the market shares of the three largest suppliers, retail markets remain highly concentrated. The HHI3 values, which indicate the degree of concentration in the market, are below 2,000 in only 5 out of 21 national electricity retail markets for households and in only 3 national gas retail markets for households. Although, the national electricity and gas retail markets for non-households are generally less concentrated, the number of retail markets for non-households with HHI values below 2,000 is also very low (i.e. 7 out of 19 in electricity and 7 out of 18 in gas).
- A significant increase in the number of non-household customers can be observed, which might (to a big extent) be explained by the stabilization of the economic situation after the financial crisis.
- The average switching rate in European electricity retail markets for household customers increased from 5.0% to 6.4%, when comparing the 2011 and 2016 levels with a decline being observed in 2015. The highest value of switching rate has been recorded in 2016. For gas, the switching rates of household customers increased unsteadily from 5.5% in 2011 to 6.4%. The average switching rates in the electricity and gas retail markets for non-households are generally much higher than these for households.
- Customer switching rates differ significantly across MS, same goes for the development of switching activity over time: in some countries high rates (> 10%) are observed, while in other countries more or less no switching activity (< 1%) is reported.
- MS choose different paths on the way to liberalisation. Even though some progress can be observed in few countries, some countries still keep some form of price intervention, either for the majority of consumers or for vulnerable customers only. For households 11 countries still have some sort of price regulation for electricity and 12 countries still regulate prices for gas. For non-household customers 7 MS still apply some sort of price regulation for electricity and 8 for gas with price regulation hampering competition, especially if prices are set below cost4.
3 It ranges between 0 for an infinite number of small firms and 10,000 for one firm with 100% market share. Based
on guidance from the EC, an HHI above 2,000 signifies a highly concentrated market. 4 This is analysed in more detail in the ACER-CEER Market Monitoring Report 2015.

Ref: C17-MMR-83-02 Retail Markets Monitoring Report
8/54
- In countries like France and Portugal that are in a process of phasing out regulated prices, a significant progress can be noticed in the market activity, namely in the increased number of suppliers, and in the increased percentage of customers with an alternative supplier etc. This is particularly the case in France due to the removal of regulated prices for the majority of non-household customers.

Ref: C17-MMR-83-02 Retail Markets Monitoring Report
9/54
Overview of selected Retail Market Developments in Europe since 2011 1 A secure, competitive and sustainable supply of energy is the main target of the Third Package. This can be achieved through investments, enhanced cross-border trade and through diversified energy resources on the one hand and through the enforcement of competition on wholesale and retail markets on the other. The implementation of these steps contributes to a well-functioning and integrated internal market, where customers can benefit from more choice and competitive prices. The following section shows, in an aggregated way, the selected electricity and gas retail markets’ development in Europe since 20115
. Although the European electricity and gas retail markets are still driven by many national differences (e.g. in their structure and legislation), an aggregated analysis is aimed at delivering the overall impact of European legislation on European retail markets.
Market structure 1.1
Number of suppliers and customers 1.1.1 From 3 September 2009 on, Member States (MS) had 18 months to transpose the directives of the Third Package into national law, which was followed by the liberalization of electricity and gas markets in many countries. As a result of unbundling, other liberalization measures, favourable wholesale market access and price conditions in this period, many new companies entered retail markets and are operating as alternatives to incumbent suppliers. The total number of active electricity suppliers6 offering contracts to either household and/or non-household customers in European countries7 has increased from 2,871 to 3,719 between 2011 and 2016 (Figure 1), with an average annual growth rate of 4.9%.The highest relative increase has been reported by Bulgaria (from 5 to 45 suppliers) and by Latvia (from 5 to 27 suppliers) in this period. While 10 MS reported no change or decrease in the number of suppliers in 2016 compared to 2011. A similar trend can be observed in the number of active electricity suppliers for household customers. The total number of these suppliers increased from 2,251 to 3,165 resulting in a growth of 40.6%. On the contrary, the number of suppliers for non-household customers showed a clear growing rate until 2014 and slowed down since then. It is remarkable that in this period the increase in the number of both household and non-household customers (and hence the market size growth) was rather limited (< 0.5%), while at the same time the number of customers with social tariffs (for vulnerable customers) rose from 6.31 Mill. to 9.25 Mill. in 10 MS.
5 The analysis in this chapter has been limited to the extent of available data in the CEER retail database for the
period 2011-2016. 6 In at least one part of the country (e.g. one region), and having at least one customer.
7 A significant share of this number has been reported by Germany; more than 1/3 of the suppliers are operating
in German retail market.

Ref: C17-MMR-83-02 Retail Markets Monitoring Report
10/54
Despite the fact that an analysis of retail market functioning requires a multidimensional approach based on a variety of metrics8 (as market entry barriers, market concentration or price related issues), on the basis of developments mentioned above, it is clear that an enhanced activity took place on the suppliers’ side compared to 2011.
Figure 1: Development of a number of active suppliers and customers in Europe – Electricity
In gas, the total number of all active suppliers9 offering contracts to either household and/or non-household customers in Europe increased with an average annual growth rate of 6.4%, from 1,666 to 2,304 between 2011 and 2016 (Figure 2). The most significant increase has been recorded in Belgium, in Czech Republic and in France. 8 MS reported no change or a decrease in 2016 compared to 2011.
8 See CEER Paper “Handbook for National Energy Regulators - How to assess retail market functioning”, 2017
9 In at least one part of the country (e.g. one region) and having at least one customer

Ref: C17-MMR-83-02 Retail Markets Monitoring Report
11/54
The number of active suppliers in the non-household segment grew by 30.6% between 2012 and 201610. This trend has been observed, at European level, in the number of suppliers in the household segment as well, which achieved, in average, a yearly increase of 5%. The total number of household customers in Europe was rather stable. On the contrary, the number of non-household customers rose from 5.6 Mill. to 7 Mill., implying an average growth rate of 4.3 % p.a. This might be explained to a big extent by the economic recovery after the 2007 financial crisis, which has finally reached the industrial segment.
Figure 2: Development of a number of active suppliers and customers in Europe - Gas
A well-functioning retail market requires sufficient competition among suppliers, which tends to be positively related to the number of active suppliers, with DSOs acting as neutral and efficient facilitators of a level playing field. These conditions are crucial to ensuring that a high degree of competition and of innovation thrives to the benefit of customers.
10
Data for 2011 is not available for the majority of countries.

Ref: C17-MMR-83-02 Retail Markets Monitoring Report
12/54
In that sense, compared to 2011, European household customers could benefit from an increasing variety of suppliers. However, this is strongly linked to the size of the market. Countries with relatively high customer numbers (as Italy, Spain, Great Britain and Germany) present a higher number of suppliers in DSO networks. In electricity, the average number of suppliers in European DSO networks11 increased from 30 to 39 and hence with an annual average growth rate of 5.2% p.a. (Figure 3, 3a). Nevertheless, these values significantly vary among countries. In particular, countries with relatively high customer numbers (as Italy, Spain, Great Britain and Germany) present a higher number of supplier number in DSOs. If one considers these differences in customer numbers, the weighted European average12 (Figure 3, 3b) increased from 61 in 2011 to 79 in 2016 with an average annual growth rate of 4.8%. This increase seems to be a common trend in all but 3 examined countries (Belgium, Greece, Norway), where a slight decrease, compared to 2011, has been reported. Highest relative growth of the number of suppliers in DSO networks has been recorded in Poland, in Portugal and in Romania.
Figure 3: Development of an average number of household customers in European DSO networks - Electricity
11
Average number of suppliers across DSO networks considering the proportion of customers in each DSO area
relative to the total number of customers in a country. 12
Weighted European averages in Chapter 1 are calculated by weighting each country’s value by the number of
customers of this country. It implies that respective values of countries with e.g. higher number of customer number have a greater weight in the European average.

Ref: C17-MMR-83-02 Retail Markets Monitoring Report
13/54
In the gas sector, even a greater increase of the average number of suppliers for European household customers in DSO networks has been observed in this period. This average number rose from appr. 14 in 2011 to 28 in 2016, which is subject to an average growth rate of 17.2% p.a. (Figure 4, 4a). This does not seem to be a general trend among reporting MS; as 11 of 25 MS reported no change or decrease. Among the countries with an improvement in this number, Poland, Italy and Great Britain recorded the highest increase in this period. Considering the differences between customer numbers in single countries again, the positive development is more obvious (4b).
Figure 4: Average number of suppliers for household customers in European DSO networks - Gas
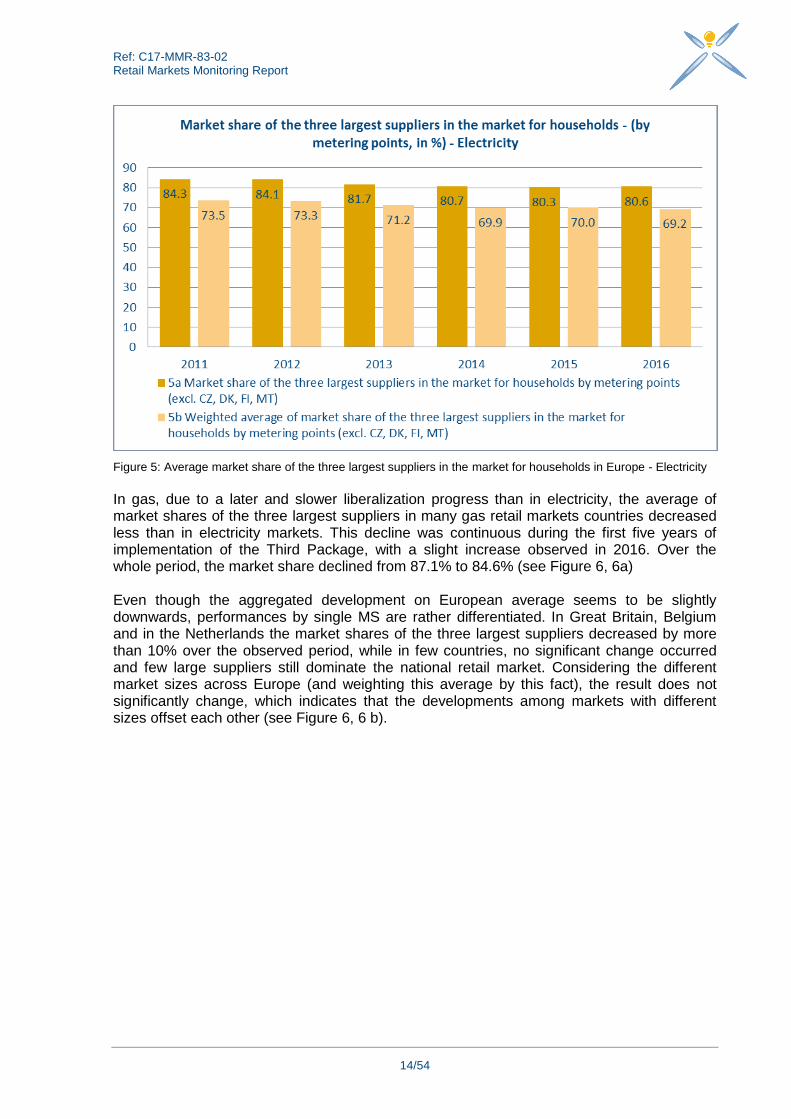
Market concentration 1.1.2 Some slow but positive developments can be recorded in the market concentration measure CR3, which shows the market share of the three largest suppliers in the electricity and gas retail markets. Between 2011 and 2016, the European average market share of the three largest suppliers in the retail electricity household segment fell from 84.3% to 80.6% (Figure 5, 5a), ranging between 38% and 100% by MS. Only 5 out of 23 MS reported no change or increase of the market shares by the three largest suppliers in 2016 compared to 2011. The most significant reductions in CR3 in this period are reported by Germany, Great Britain and by Slovenia.
Ref: C17-MMR-83-02 Retail Markets Monitoring Report
14/54
Figure 5: Average market share of the three largest suppliers in the market for households in Europe - Electricity
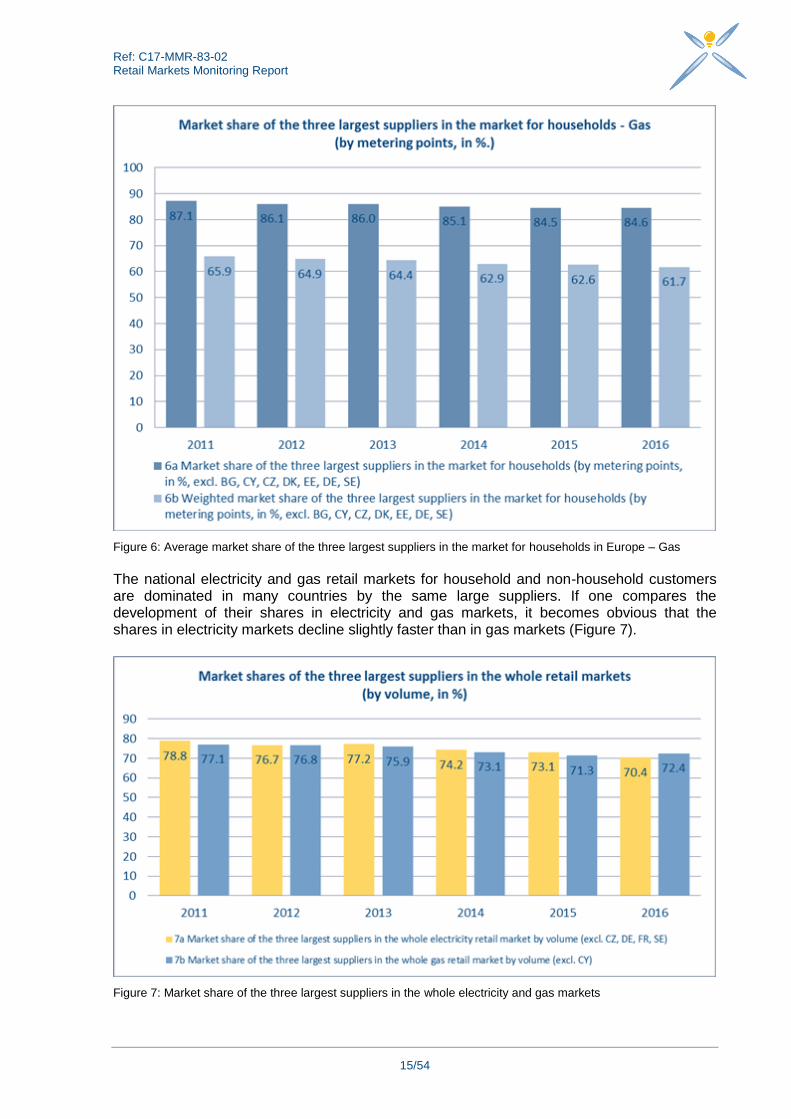
In gas, due to a later and slower liberalization progress than in electricity, the average of market shares of the three largest suppliers in many gas retail markets countries decreased less than in electricity markets. This decline was continuous during the first five years of implementation of the Third Package, with a slight increase observed in 2016. Over the whole period, the market share declined from 87.1% to 84.6% (see Figure 6, 6a) Even though the aggregated development on European average seems to be slightly downwards, performances by single MS are rather differentiated. In Great Britain, Belgium and in the Netherlands the market shares of the three largest suppliers decreased by more than 10% over the observed period, while in few countries, no significant change occurred and few large suppliers still dominate the national retail market. Considering the different market sizes across Europe (and weighting this average by this fact), the result does not significantly change, which indicates that the developments among markets with different sizes offset each other (see Figure 6, 6 b).
Ref: C17-MMR-83-02 Retail Markets Monitoring Report
15/54
Figure 6: Average market share of the three largest suppliers in the market for households in Europe – Gas
The national electricity and gas retail markets for household and non-household customers are dominated in many countries by the same large suppliers. If one compares the development of their shares in electricity and gas markets, it becomes obvious that the shares in electricity markets decline slightly faster than in gas markets (Figure 7).
Figure 7: Market share of the three largest suppliers in the whole electricity and gas markets

Ref: C17-MMR-83-02 Retail Markets Monitoring Report
16/54
Customers switching activities 1.2
The average switching rate in the European retail electricity markets for household customers increased from 5.0% to 6.4%, when comparing the 2011 and 2016 levels with a decline being observed in 2015. The highest value of switching rate has been recorded in 2016 (Fig. 8, 8a). However, there are still major differences between MS ranging from 0.02% to 20.7%. In addition, considering the number of household customers and their weights in the whole European market, the average increase is approximately of 1% (Fig. 8, 8b). The average switching rate in the non-household segment across Europe has in general higher values than in the household segment, where the performance over the years is more volatile. This can be explained to a big extent by the usually high saving potential of industrial consumers13.
Note: In case of the Netherlands, due to data availability reasons, the specific indicator for external switching of household and non-household customers cannot be calculated separately. The external switching activity on the whole retail electricity market was 16 per cent in 2016 and on average 12.8 per cent from 2011 to 2015.
Figure 8: Development of switching rates in electricity retail markets
13
See Chapter 3 for a discussion on the possible reasons.

Ref: C17-MMR-83-02 Retail Markets Monitoring Report
17/54
In terms of switching, retail gas markets show a similar development to the retail electricity markets although with lower switching rates for both on household and non-household segments (Figure 9). This might be explained by the factors described in Ch. 3.3 (e.g. weak switching incentives due to low price differences) but also by the late opening of gas markets to free competition and related customer awareness issues in many countries.
Note: Due to data availability reasons the specific indicator for external switching of household and non-household customers cannot be calculated separately. The external switching activity on the whole retail gas market in NL was 16 per cent in 2016 and on average 12.8 per cent from 2011 to 2015.
Figure 9: Development of switching rates in gas retail markets
Price regulation 1.3
The key driver of well-functioning retail markets is competition. Regulation of energy prices and price intervention from 3rd Parties (e.g. Governments, NRAs or other institutions) harm competition’s dynamics on supply-side and constitute barriers to demand-side participation. For this reason, the Third Package postulates that end-user prices are determined only by supply and demand mechanisms of the market, and may not include any component other than network charges, levies and taxes. After 6 years from the implementation of the Third Package, 11 out of 28 MS still report some type of energy price regulation in the electricity retail end-user prices in 2016, compared to 1614 in 2011. 5 MS (Croatia, Estonia, Greece, Italy and Latvia) abolished price regulation since 2011, which is still behind European goals. In addition, 6 out of 28 MS reported diverse changes in terms of intervention in price setting and regulation over this period, while 8 NRAs reported the existence of interventions in price setting mechanisms in 2016.
14
Incl. Belgium: Please see Chapter 4 for more information
Ref: C17-MMR-83-02 Retail Markets Monitoring Report
18/54
In the non-household electricity segment, 12 and 7 out of 28 MS reported the application of end-user price regulation in 2011 and 2016 respectively. At the same time, 18 MS plus Norway do not apply any type of end-user price regulation for non-household customers. In terms of competences, 9 NRAs, 4 governments and in 2 MS other institutions were directly responsible for setting regulated energy prices in 2016. In gas, there are still 12 MS, where prices are regulated by NRAs or by governments (1512 in 2011). In 2016, Romania exited the regulation of the energy prices. Furthermore, 5 out of 26 MS reported diverse changes in terms of intervention in price setting and in regulation in the last years, while 7 NRAs reported the existence of interventions in price setting in 2016, with no change being observed since 2014. For gas non-household customers, 11 of 26 MS reported some type of end-user price regulation, in 2011 and this number decreased to 8 in 2016. In terms of competences, 8 NRAs, 4 governments and 3 MS other institutions directly set regulated prices in 2016. MS choose different paths on the way to liberalisation. Even though some progress can be observed in few countries, some countries still keep some form of price intervention, either for the majority of consumers or vulnerable customers only. For households 11 countries still have some sort of price regulation for electricity and 8 for gas. For non-household customers, 8 MS still apply some sort of price regulation for electricity and for gas.

Ref: C17-MMR-83-02 Retail Markets Monitoring Report
19/54
Market structure 2 This chapter examines the main developments in the electricity and gas market structure, in relation to previous year(s), which are important elements in analysing the level of competition and the overall functioning of retail energy markets. The overall trends are showing that the retail electricity and gas markets develop continuously but slowly, with the exception of a few countries, where no progress can be noted since several years, mainly because of price regulation/intervention in the setting of the energy price and often because of the presence of only one main supplier and therefore very little choice and switching activity among customers. In few countries like in Germany and in Italy, the total number of suppliers is much higher than the number of nationwide suppliers, which is showing an important market activity on a regional level. In countries like France and Portugal that are in a process of removal of regulated prices, a significant progress can be noticed in the market activity, namely in the increased number of suppliers, and the increased percentage of customers with an alternative supplier. This is particularly the case in France due to the removal of regulated prices for the majority of non-household customers.
Household segment 2.1
Number of customers 2.1.1
Non-surprisingly, the number of household customers on the electricity market in 2016 in all MS remained stable compared to 2015. The number of household customers with a different supplier than their incumbent one is varying across MS. This number is the highest in Great Britain (69 %), which can be seen as a sign of a market open to competition. However, like in other countries with no price regulation, there might be a certain number of customers, who are not with an alternative supplier if they have never switched since market liberalisation and/or if they have switched but then have returned to the incumbent supplier. In other MS, either this data is unavailable; either these MS still have price regulation that makes this data equal to zero. For instance, in France, where price regulation still exists for household customers, the number of customers that changed their supplier and got a contract at a market price with an alternative supplier, is increasing over the past year; showing that more and more customers are choosing other suppliers than the incumbent ones. However, compared to the total number of households this number is around 14% which is relatively low. There is a similar situation in Portugal, where regulated prices were removed for electricity household customers, but with a transitory period of three years, leading to more and more customers, around 74% in 2016, being with an alternative supplier. It is quite interesting to note that there are 71% of the total number of households in Germany that are with an incumbent supplier or with previously monopolistic suppliers, which are today default suppliers, and are still considered as incumbent suppliers today, although there is a huge choice of suppliers. This shows the local activity of ex-monopolies in Germany and either a strong attachment of households towards these suppliers or a high rate of inactive customers. In countries like Cyprus or Malta, where the household market is still closed, with only one supplier present on this market, the number is 0 as all household customers are supplied by the one incumbent supplier.

Ref: C17-MMR-83-02 Retail Markets Monitoring Report
20/54
On the gas market, as Figure 11 shows, there are few countries with a very small number of household gas consumers, like Finland, Sweden, Estonia or Bulgaria and Luxembourg. Only 16 countries out of 24 responding in total have available information regarding the number of customers with a supplier different than the incumbent one. In 5 countries, namely Finland, Latvia, Lithuania15, Greece and Hungary, the answer was 0, meaning that all of these countries have only one incumbent supplier and the household gas customers do not have the possibility of another alternative supplier. In Portugal and in Great Britain, there are 77% and 65% respectively, of the total number of households with an alternative supplier. On the other side, in France and in Germany, only 23% and 24% respectively, of the households are with an alternative supplier, showing that the majority of the households in these countries still have contracts with an incumbent supplier.
Figure 10: Number of household customers and number of household customers with a different supplier than the incumbent one in electricity for selected countries
Figure 11: Number of household customers and number of household customers with a different supplier than the incumbent one in gas for selected countries
15
In Lithuania, in the retail natural gas supply market the biggest share of the market is attributed to the one
incumbent supplier, but there are other three smaller suppliers that supply with the natural gas the customers located in different regions of the country. The market share of those suppliers is equal to 0.2 %”.

Ref: C17-MMR-83-02 Retail Markets Monitoring Report
21/54
Consumption levels 2.1.2 The results are showing that the overall trends of the household consumption in electricity are slightly decreasing between 2015 and 2016 in the majority of countries, which is different for gas, where the results are mixed. There is not a clear reason for this, explained by the MS, but it might be linked to the consumers’ behaviour or to weather conditions. The highest consumption levels for household customers are reported by France, Germany and Great Britain with over 100 TWh for electricity and more for gas, which is not surprising as these countries have the highest number of household customers as well. The data should be taken with caution by taking into account the total amount of household customers but also, the total number of one country’s population. Therefore the average European consumption as weighted by the number of electricity households is 25.2 TWh. The data for electricity shows that in some countries like France, Great Britain, Norway and Sweden, the total household consumption is much higher compared to the reference of the total number of households, showing that a proportion of the households in these countries have high consumption levels and consume an amount of electricity that is higher than the typical annual household consumption in the country as shown below. In another group of countries like Germany, Spain, Hungary, Bulgaria or Croatia, the level of consumptions compared to the number of households in the country corresponds to their typical annual household consumption. However, in countries like Italy or Romania, the total household volume is low, showing a low average annual consumption compared to the European average consumption per customer. The 2016 weighted average European annual electricity consumption level per household was 3,090 KWh.
Note: The bubble size represents the total household electricity consumption per country. The colours are chosen randomly. Figure 12: Number of household customers, typical annual consumption per household customer and the total household volume in electricity in 2016 for selected countries
Ref: C17-MMR-83-02 Retail Markets Monitoring Report
22/54
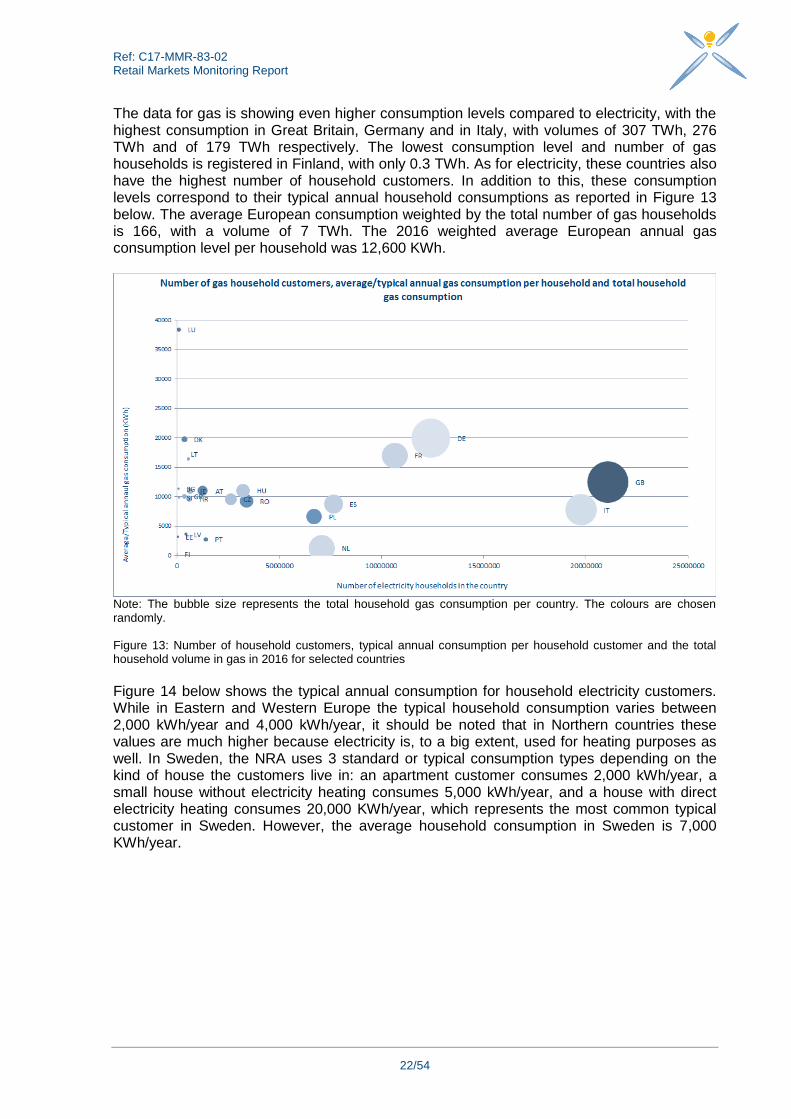
The data for gas is showing even higher consumption levels compared to electricity, with the highest consumption in Great Britain, Germany and in Italy, with volumes of 307 TWh, 276 TWh and of 179 TWh respectively. The lowest consumption level and number of gas households is registered in Finland, with only 0.3 TWh. As for electricity, these countries also have the highest number of household customers. In addition to this, these consumption levels correspond to their typical annual household consumptions as reported in Figure 13 below. The average European consumption weighted by the total number of gas households is 166, with a volume of 7 TWh. The 2016 weighted average European annual gas consumption level per household was 12,600 KWh.
Note: The bubble size represents the total household gas consumption per country. The colours are chosen randomly. Figure 13: Number of household customers, typical annual consumption per household customer and the total household volume in gas in 2016 for selected countries
Figure 14 below shows the typical annual consumption for household electricity customers. While in Eastern and Western Europe the typical household consumption varies between 2,000 kWh/year and 4,000 kWh/year, it should be noted that in Northern countries these values are much higher because electricity is, to a big extent, used for heating purposes as well. In Sweden, the NRA uses 3 standard or typical consumption types depending on the kind of house the customers live in: an apartment customer consumes 2,000 kWh/year, a small house without electricity heating consumes 5,000 kWh/year, and a house with direct electricity heating consumes 20,000 KWh/year, which represents the most common typical customer in Sweden. However, the average household consumption in Sweden is 7,000 KWh/year.

Ref: C17-MMR-83-02 Retail Markets Monitoring Report
23/54
Figure 14: Typical annual household consumption in electricity in 2016 for selected countries
Figure 15 shows the typical annual household consumption in gas for 2016, where it can be seen that the typical gas consumption varies more than in electricity. The highest value is for Luxembourg16, where gas households consume typically 38,500 kWh of gas per year (not shown on the figure, see footnote). In some countries, this consumption varies between 9,000 kWh/year and 20,000 kWh/year, whereas in other countries it ranges from 1,000 kWh/year to 7,000 kWh/year.
16
The typical annual household consumption in gas for Luxembourg is too high for a single household as it
includes collective residential heating and also commercial consumption in buildings jointly used by household consumers.

Ref: C17-MMR-83-02 Retail Markets Monitoring Report
24/54
Figure 15: Typical annual household consumption in gas in 2016 for selected countries
Number of suppliers and entry/exit activity 2.1.3 The indicators of the number of suppliers and of the entry and exit activity of suppliers are indicative of consumers’ choice and options that are available in each national market, of the existence of entry barriers and of the importance of regional markets etc. As results show for electricity and for gas, there is a significant difference in some countries, such as Germany, France and Italy, between the total number of suppliers and the number of suppliers that are active nationwide. In the aforementioned countries, the majority of suppliers are active in their local area only, whereas the total number of suppliers takes into account both regional and nationwide suppliers. In Germany, there are in total 1,300 electricity suppliers and around 800 in gas, but only around 60 in electricity and 30 in gas are active nationwide. Similarly, in Italy there are 460 local electricity suppliers, but only 40 are active nationwide. The number of electricity suppliers for households that are active nationwide is the highest in Norway and in Sweden with an average of 80 suppliers. In other countries, this figure varies from 10 suppliers for smaller countries to an average of 50 suppliers in countries like Germany, Italy or Great Britain. In the gas market, the number of household suppliers that are active nationwide is the highest in Czech Republic, followed by Romania and by the Netherlands. However, it is to be noted that there is a difference in some countries, between a supplier holding a license and therefore being allowed for offering electricity or gas nationwide, and those suppliers who actually do it.

Ref: C17-MMR-83-02 Retail Markets Monitoring Report
25/54
The figures below show the percentages of nationwide suppliers in electricity and in gas out of the total number of suppliers in the countries. Some countries are missing from the figures, especially in gas as they do not have all the data available either for the total number of suppliers, either for the number of nationwide suppliers.
Figure 16: Percentage of nationwide suppliers out of the total number of supplies for household customers in electricity in 2016 for selected countries
Figure 17: Percentage of nationwide suppliers out of the total number of supplies for household customers in gas in 2016 for selected countries

Ref: C17-MMR-83-02 Retail Markets Monitoring Report
26/54
The previous paragraphs are to be linked to the entry and exit activity of the suppliers, which can change the situation in each market. A higher number of suppliers usually implies more offers and more choice that are available to customers. It also acts as a driver for consumer switching. However, our findings show that even in some countries with a relatively high number of suppliers available on a market, the household switching rates results in the next chapter are showing that customers do not take full advantage of the diversity of suppliers (and of products). In some MS, a very significant market activity with an exit and entry activity of suppliers occurred in 2016. In Germany, in the whole household electricity market there were 97 new entrants and only 7 suppliers that exited the market. In Italy, 54 new suppliers entered the household electricity market, of which only 4 are from a different country, which means new national suppliers started an activity. But in Italy, there are also 21 suppliers that exited the market. In Romania and in Bulgaria, there were 17 new national suppliers for each country that entered the household electricity market in 2016, but in Romania 7 suppliers exited the market. Some exit and entry activity is also recorded in other countries albeit with a less significant number of entrants and fewer suppliers that exited their market. The results show that the gas market is less active in terms of entry and exit activities, as only Germany and Italy have an average of 45 suppliers that entered their household market, of which, 19 suppliers left the market in Italy, whereas in Germany this information is not available. For the other countries, the number of suppliers that entered the gas household market varies between 2 and 10 with very small number of exits, between 1 and 2.
Market shares and market concentration 2.1.4 Figures 19 and 20 illustrate the level of concentration of European retail markets for households in electricity and in gas for 2016, measured by the concentration ratio CR317, expressed as the sum of the market shares of the three largest suppliers in a market by metering points and the number of suppliers with a market share above 5%.
17
CR is a traditional structural measure of market concentration based on market shares. In this report we measure the
concentration ration 3 which measures the total market shares of the 3 largest suppliers in one market.

Ref: C17-MMR-83-02 Retail Markets Monitoring Report
27/54
Note: The size of the bubble represents the number of suppliers with a market share above 5%. The colours of the bubbles are chosen randomly. Figure 18: Market share of three largest nationwide suppliers (CR3) and number of main suppliers with a market share above 5% in electricity on the household market for selected countries
Note: The size of the bubble represents the number of suppliers with a market share above 5%. The colours of the bubbles are chosen randomly. Figure 19: Market share of three largest nationwide suppliers (CR3) and number of main suppliers with a market share above 5% in gas on the household market for selected countries

Ref: C17-MMR-83-02 Retail Markets Monitoring Report
28/54
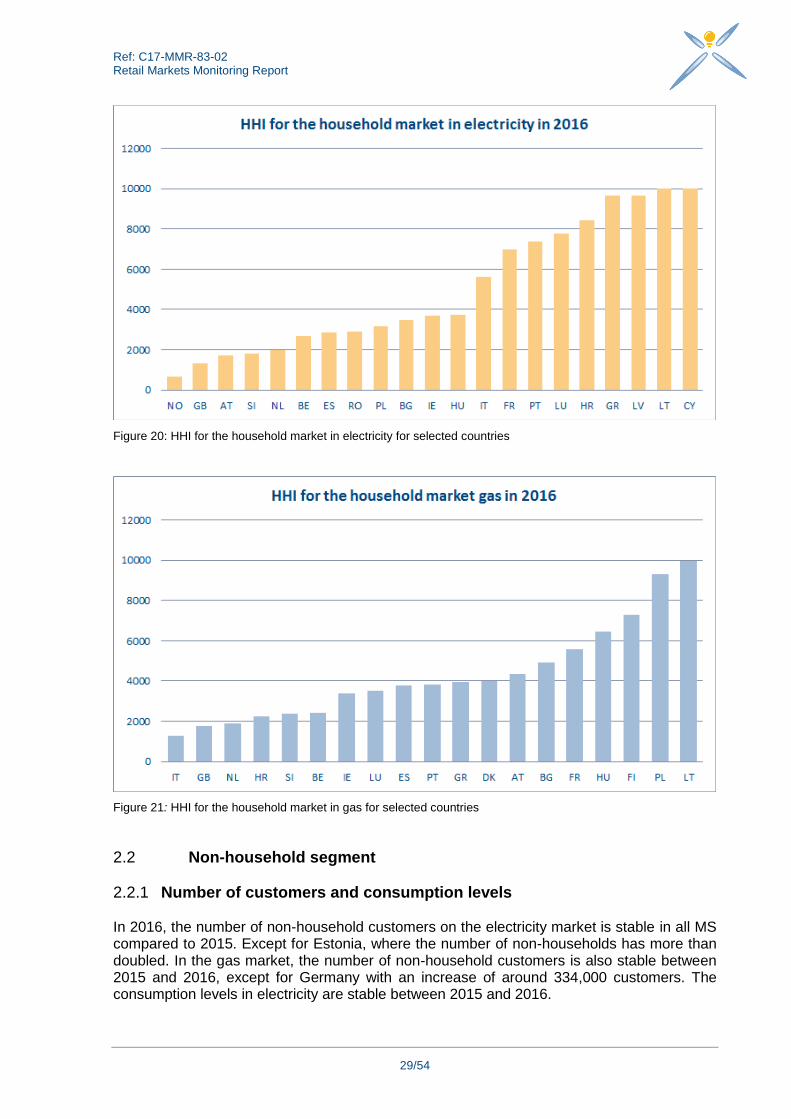
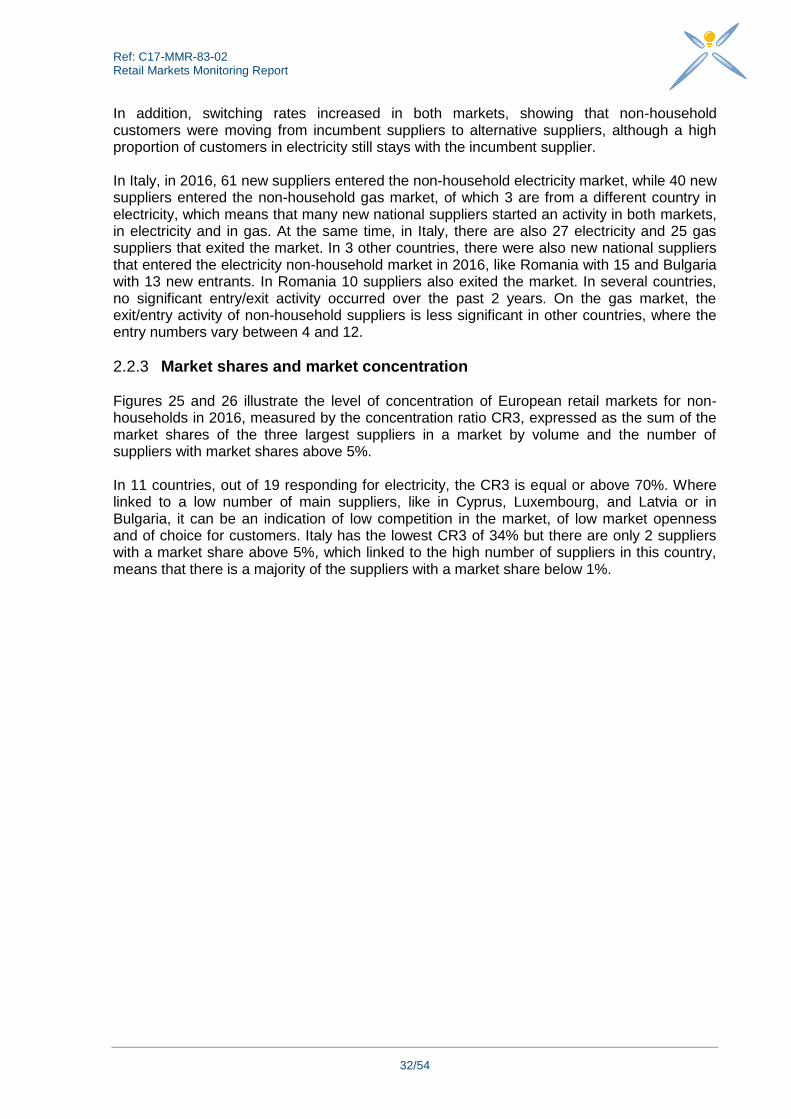
In countries like Austria18, Great Britain or Slovenia, with low concentrated household electricity markets according to the CR3, the number of suppliers with a market share above 5% varies between 5 and 7. On the other side, in these same countries, the number of overall suppliers with a market share below 1%, is 122 in Austria (out of 151 suppliers in the country), and 35 in Great Britain out of 46 suppliers in total in the country. These figures show that there is still a quite high number of suppliers with low market shares, which on the other hand are active only on regional level. But, the large number of suppliers with a low market share (<1%) might also reflect the high number of new nationwide suppliers that have entered one’s market very recently. For gas, Germany has the lowest CR3, with many suppliers having a market share below 1%. Like in Germany, many other countries like Italy, Czech Republic, Great Britain and Romania, also have a high number of suppliers with a market share below 1% on the gas market. As in electricity, for some countries, like Germany and Italy, this implies an existence of an important number of suppliers but with a low market share as they are active only on a local/regional level. However this does not explain the situation in other countries like in the Czech Republic or in Romania, where the total number of suppliers in the country is equal to the number of suppliers active nationwide. The HHI19 indicates the degree of concentration in the market and is calculated as the sum of the market squares of all firms in the market. Figures 21 and 22 show the HHI for electricity and for gas in the household segment. The results in the figure below show that in only 5 out of the 21 countries responding20 in electricity, the HHI is below 2,000 showing a low concentration in the household market. There is one country, Cyprus, were the HHI is 10,000, which according to the interpretation of the HHI would mean that only one supplier exists in the market, making that market highly concentrated without any competition. But in Lithuania, with an HHI of 9,999 there is one main incumbent supplier for household customers, however, these customers are free to choose a market based price offer with another alternative supplier. The retail electricity markets for households are also highly concentrated in many other countries, where the HHI values between 3,000 and 8,000. In the gas retail market, in 3 countries, in Italy, Great Britain and in the Netherlands, out of 20 responding, the household markets have a low concentration with an HHI below 2,000. In 7 countries, the HHI is between 2,000 and 4,000, which means that these gas markets are concentrated but that alternatives in terms of other suppliers exist. Only in 2 countries, in Poland and in Lithuania, the HHI is almost 10,000 which means that these markets are highly concentrated (in Lithuania there is one incumbent nationwide supplier in gas, but there are other smaller suppliers supplying gas to customers located in different regions of the country and that have a market share of 0.2%).
18 It ranges between 0 for an infinite number of small firms and 10,000 for one firm with 100% market share. Based on
guidance from the EC, an HHI above 2000 signifies a highly concentrated market. However in Austria, HHI calculation for households on a national level is not representative for the concentration level of the household market for both fuels, as the relevant geographic market is the DSO area for both fuels.
19 It ranges between 0 for an infinite number of small firms and 10,000 for one firm with 100% market share. Based on
guidance from the EC, an HHI above 2,000 signifies a highly concentrated market. 20
Some countries do not monitor this indicator like Sweden or Germany for instance, among others and did not answer this
question.
Ref: C17-MMR-83-02 Retail Markets Monitoring Report
29/54
Figure 20: HHI for the household market in electricity for selected countries
Figure 21: HHI for the household market in gas for selected countries
Non-household segment 2.2
Number of customers and consumption levels 2.2.1 In 2016, the number of non-household customers on the electricity market is stable in all MS compared to 2015. Except for Estonia, where the number of non-households has more than doubled. In the gas market, the number of non-household customers is also stable between 2015 and 2016, except for Germany with an increase of around 334,000 customers. The consumption levels in electricity are stable between 2015 and 2016.

Ref: C17-MMR-83-02 Retail Markets Monitoring Report
30/54
The highest consumption levels for non-household customers are reported by Germany, France and by Great Britain with over 200 TWh, which is expected as these countries have the highest number of non-household customers. Italy, Spain and Poland are right behind with consumed volumes between 190 TWh and 100 TWh. The lowest non-household electricity consumption is in Malta and in Cyprus with 1.4 TWh and 2.8 TWh respectively. The weighted average by the total number of non-households European electricity consumption is 3 TWh. In the gas market, consumption levels for non-households increased in the majority of the countries between 2015 and 2016. This is also the case for the countries, as in electricity, that reported the highest consumption levels like Germany, Italy, France and Great Britain and the lowest for Slovenia and for Bulgaria. In the gas market, the highest number of non- household customers is in Germany, followed by Great Britain, Italy and France. These findings are, of course, to be linked to the size of the population in these countries and to the size of their markets. Therefore, the weighted average gas consumption by the number of non-households in Europe is 978,000 MWh.
Number of suppliers and entry/exit activity 2.2.2 The indicators, the number of suppliers and the entry and exit activity of suppliers might show some signs of consumers’ choice and options that are available. The total number of electricity suppliers in a country ranges between one in Cyprus and in Malta to 1,126 in Germany and 488 in Italy and between one in Latvia and 387 in Italy for gas. However, as the figure below shows, in some countries there is a significant difference between the total number of suppliers and the number of suppliers that are active nationwide. This shows that in some countries, the majority of suppliers are active in their local area only (e.g. in Germany, Italy, France, Norway and in Austria in the electricity market). Therefore, the number of suppliers active nationwide is much smaller in most of these countries, 44 in Italy, 28 in France. The number of electricity suppliers for non-households that are active nationwide is the highest in Spain, as all the suppliers in the country are also active nationwide, as it is the case in Poland with 129 suppliers and in Romania with 96 suppliers. The same conclusions cannot be drawn for the gas market, as some countries like Germany or Austria, with an important number of non-household suppliers in total, do not have data available for the number of suppliers active nationwide. However, according to the results in gas, only in two countries, in Italy and in France, out of 21 countries responding, the number of nationwide suppliers is much lower than the total number of suppliers in these countries, where a certain activity of suppliers on a local/regional level is noted. The two figures below show the percentages of the nationwide suppliers compared to the total number of suppliers in one country, where data is available. In some countries the data is only available either for the total number of suppliers, either for the number of nationwide suppliers.

Ref: C17-MMR-83-02 Retail Markets Monitoring Report
31/54
Figure 22: Percentage of nationwide suppliers out of the total number of suppliers for non-household customers in electricity in 2016 for selected countries
Figure 23: Total number of suppliers and number of nationwide suppliers for non-household customers in gas in 2016 for selected countries
The previous paragraph is linked to the entry and exit activity of the suppliers. A higher number of suppliers could be translated into more offers and more choice available to customers. This can be confirmed for some countries, like France21, where with the removal of end-user regulated prices, the number of suppliers in electricity increased from 21 in 2014 to 28 in 2016, and the number of gas suppliers increased from 21 in 2013 to 29 in 2016.
21
For one part of the non-households as of 1st of January 2016 in electricity and in few stages, as of 2014 for
gas.
Ref: C17-MMR-83-02 Retail Markets Monitoring Report
32/54
In addition, switching rates increased in both markets, showing that non-household customers were moving from incumbent suppliers to alternative suppliers, although a high proportion of customers in electricity still stays with the incumbent supplier. In Italy, in 2016, 61 new suppliers entered the non-household electricity market, while 40 new suppliers entered the non-household gas market, of which 3 are from a different country in electricity, which means that many new national suppliers started an activity in both markets, in electricity and in gas. At the same time, in Italy, there are also 27 electricity and 25 gas suppliers that exited the market. In 3 other countries, there were also new national suppliers that entered the electricity non-household market in 2016, like Romania with 15 and Bulgaria with 13 new entrants. In Romania 10 suppliers also exited the market. In several countries, no significant entry/exit activity occurred over the past 2 years. On the gas market, the exit/entry activity of non-household suppliers is less significant in other countries, where the entry numbers vary between 4 and 12.
Market shares and market concentration 2.2.3 Figures 25 and 26 illustrate the level of concentration of European retail markets for non-households in 2016, measured by the concentration ratio CR3, expressed as the sum of the market shares of the three largest suppliers in a market by volume and the number of suppliers with market shares above 5%. In 11 countries, out of 19 responding for electricity, the CR3 is equal or above 70%. Where linked to a low number of main suppliers, like in Cyprus, Luxembourg, and Latvia or in Bulgaria, it can be an indication of low competition in the market, of low market openness and of choice for customers. Italy has the lowest CR3 of 34% but there are only 2 suppliers with a market share above 5%, which linked to the high number of suppliers in this country, means that there is a majority of the suppliers with a market share below 1%.

Ref: C17-MMR-83-02 Retail Markets Monitoring Report
33/54
Note: The size of the bubble represents the number of suppliers with a market share above 5%. The colours of the bubbles are chosen randomly. Figure 24: Market share of three largest nationwide suppliers (CR3) and number of main suppliers with a market share above 5% for non-household customers in electricity for selected countries
Note: The size of the bubble represents the number of suppliers with a market share above 5%.The colours of the bubbles are chosen randomly. Figure 25: Market share of three largest nationwide suppliers (CR3) and number of main suppliers with a market share above 5% for non-household customers in gas for selected countries

Ref: C17-MMR-83-02 Retail Markets Monitoring Report
34/54
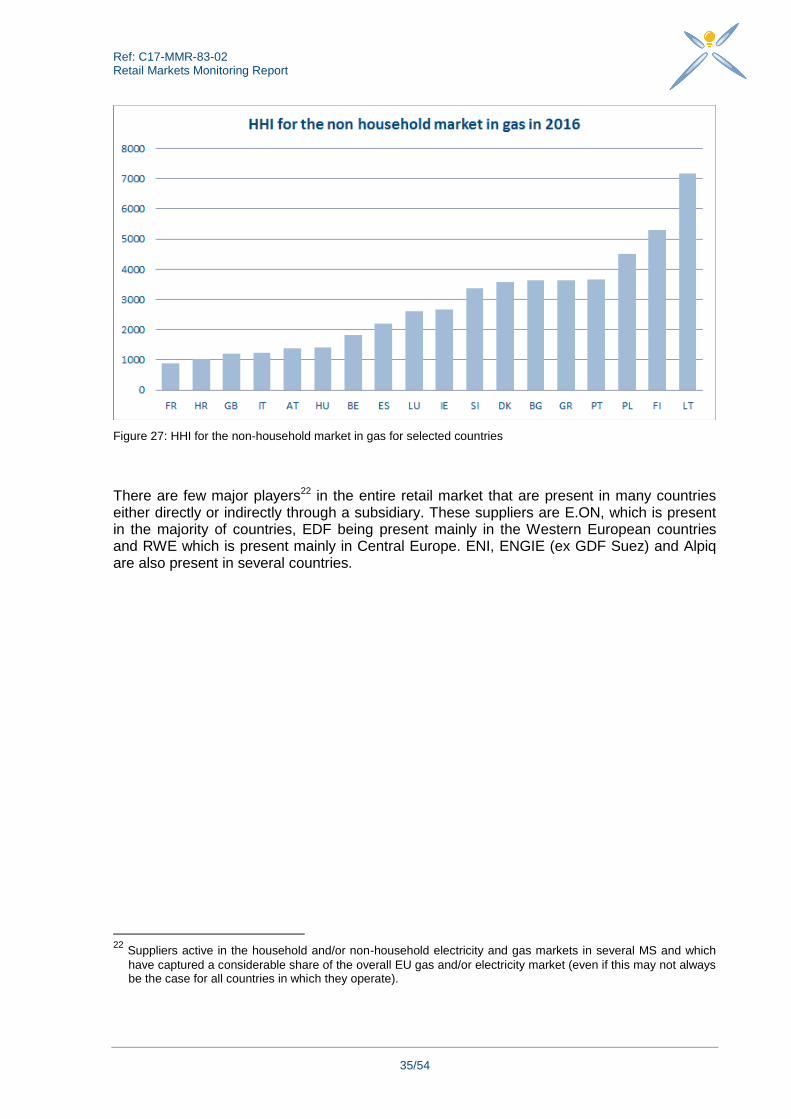
Regarding the non-household market, the Figures below show the HHI in electricity and in gas, where on the electricity market there are 10 countries, out of 20 responding, that have low concentrated household markets according to the HHI. Italy and Romania have the lowest HHI with values of 757 and 808 respectively. However, in Italy there are 2 suppliers only with a market share above 5% and a CR3 of 34 % in volume, which linked to the high number of suppliers in this country, means that there is the majority of suppliers that have a market share below 1%. In Romania, 4 suppliers have a market share above 5% and the three largest suppliers in the non-household market in electricity represent 41% in total. On the other side, in these same countries, the number of overall suppliers with a market share below 1 % is quite high. These figures show that there is still quite a high number of suppliers with low market shares. One explanation could be that these suppliers might be active only in certain regions of the country. But also, the high number of non-household suppliers with low market shares might reflect the high number of new entrants and also the fact that many of these suppliers may just serve a few large industrial customers. In Cyprus, the HHI is 10 000 meaning that only one supplier exists on the non-household market making that market a monopolistic one. The other countries responding are in the concentrated market zone with values of the HHI between 2 000 and 5 000, recording a better performance in the non-household segment than in the household segment in electricity. On the gas market, 7 countries, out of 18 responding, have an HHI below 2,000. France has the lowest value in 2016 of HHI, which is 867 and compared to 2014, the year of the regulated price removal, when the HHI was 1,619. A progress can be noticed on the French non-household gas market, meaning that it becomes less and less concentrated.
Figure 26: HHI for the non-household market in electricity for selected countries
Ref: C17-MMR-83-02 Retail Markets Monitoring Report
35/54
Figure 27: HHI for the non-household market in gas for selected countries
There are few major players22 in the entire retail market that are present in many countries either directly or indirectly through a subsidiary. These suppliers are E.ON, which is present in the majority of countries, EDF being present mainly in the Western European countries and RWE which is present mainly in Central Europe. ENI, ENGIE (ex GDF Suez) and Alpiq are also present in several countries.
22
Suppliers active in the household and/or non-household electricity and gas markets in several MS and which
have captured a considerable share of the overall EU gas and/or electricity market (even if this may not always be the case for all countries in which they operate).
Ref: C17-MMR-83-02 Retail Markets Monitoring Report
36/54
Customer switching activities 3 Customers’ switching rate is one of the key indicators for a competitive development in energy retail markets. Empowered customers, a broad availability of worthwhile choices and easy switching processes are vital requirements for high switching rates. This section will present the main developments of switching activity in the electricity and gas markets. The focus is to show relevant trends for different customer types. Possible explanations for a different switching behaviour can be presented in this exercise only at a general and aggregated level.
Household segment 3.1 This section assesses the level of switching activity developed in different categories: in external and in internal switching and switching in and out of regulated prices.
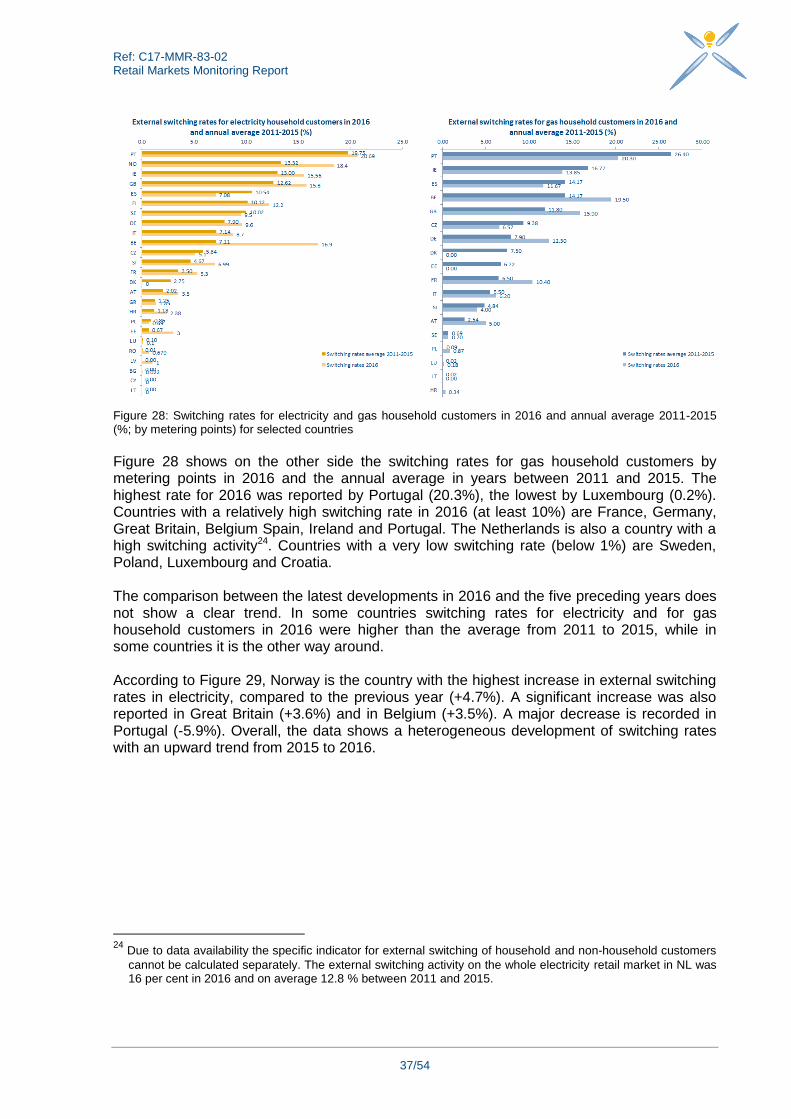
External switching rates 3.1.1 External switching is defined as the voluntary action by which a customer changes his supplier. Among the MS, external switching rates of household customers differ significantly. The highest rate in 2016 was reported by Portugal (21%) and the lowest by Bulgaria (0.02%). Spain, for example, includes switching with suppliers of the same group in the switching rates for the period of 2011-2015. Since 2015, switching with the same group is, in Spain, reported as internal switching. Figure 28 shows on the one side switching rates for electricity household customers by metering points in 2016 and on the other side the annual average from 2011 to 2015. Countries with a relatively high switching rate for electricity household customers by metering points in 2016 (at least 10%) are Finland, Belgium, Great Britain, Ireland, Norway and Portugal. The Netherlands is also a country with a high switching activity.23 Countries with a very low switching rate (below 1%) are Poland, Luxembourg, Romania and Bulgaria. In most of the cases, switching rates in 2016 were higher than the average of the years from 2011 to 2015.
23
Due to data availability the specific indicator for external switching of household and non-household customers
cannot be calculated separately. The external switching activity on the whole gas retail market in NL was 16.4 per cent in 2016 and on average 12.7 per cent between 2011-2015.
Ref: C17-MMR-83-02 Retail Markets Monitoring Report
37/54
Figure 28: Switching rates for electricity and gas household customers in 2016 and annual average 2011-2015 (%; by metering points) for selected countries
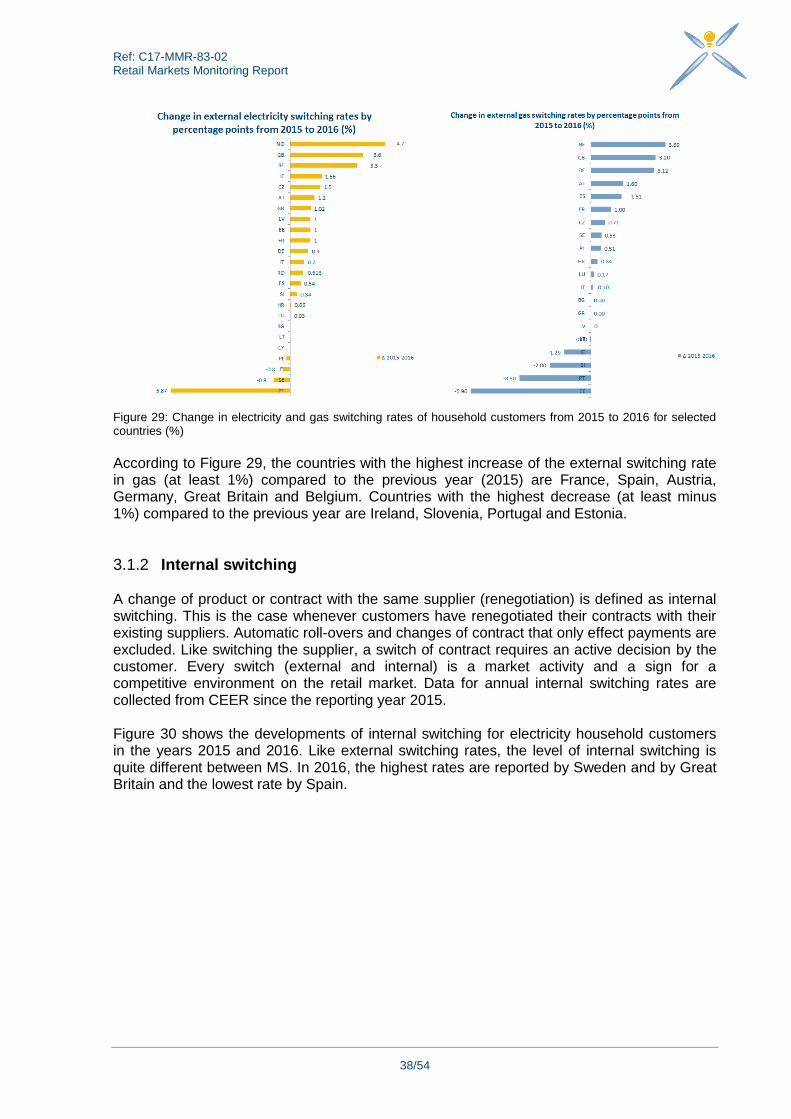
Figure 28 shows on the other side the switching rates for gas household customers by metering points in 2016 and the annual average in years between 2011 and 2015. The highest rate for 2016 was reported by Portugal (20.3%), the lowest by Luxembourg (0.2%). Countries with a relatively high switching rate in 2016 (at least 10%) are France, Germany, Great Britain, Belgium Spain, Ireland and Portugal. The Netherlands is also a country with a high switching activity24. Countries with a very low switching rate (below 1%) are Sweden, Poland, Luxembourg and Croatia. The comparison between the latest developments in 2016 and the five preceding years does not show a clear trend. In some countries switching rates for electricity and for gas household customers in 2016 were higher than the average from 2011 to 2015, while in some countries it is the other way around. According to Figure 29, Norway is the country with the highest increase in external switching rates in electricity, compared to the previous year (+4.7%). A significant increase was also reported in Great Britain (+3.6%) and in Belgium (+3.5%). A major decrease is recorded in Portugal (-5.9%). Overall, the data shows a heterogeneous development of switching rates with an upward trend from 2015 to 2016.
24
Due to data availability the specific indicator for external switching of household and non-household customers
cannot be calculated separately. The external switching activity on the whole electricity retail market in NL was 16 per cent in 2016 and on average 12.8 % between 2011 and 2015.
Ref: C17-MMR-83-02 Retail Markets Monitoring Report
38/54
Figure 29: Change in electricity and gas switching rates of household customers from 2015 to 2016 for selected countries (%)
According to Figure 29, the countries with the highest increase of the external switching rate in gas (at least 1%) compared to the previous year (2015) are France, Spain, Austria, Germany, Great Britain and Belgium. Countries with the highest decrease (at least minus 1%) compared to the previous year are Ireland, Slovenia, Portugal and Estonia.
Internal switching 3.1.2 A change of product or contract with the same supplier (renegotiation) is defined as internal switching. This is the case whenever customers have renegotiated their contracts with their existing suppliers. Automatic roll-overs and changes of contract that only effect payments are excluded. Like switching the supplier, a switch of contract requires an active decision by the customer. Every switch (external and internal) is a market activity and a sign for a competitive environment on the retail market. Data for annual internal switching rates are collected from CEER since the reporting year 2015. Figure 30 shows the developments of internal switching for electricity household customers in the years 2015 and 2016. Like external switching rates, the level of internal switching is quite different between MS. In 2016, the highest rates are reported by Sweden and by Great Britain and the lowest rate by Spain.

Ref: C17-MMR-83-02 Retail Markets Monitoring Report
39/54
Figure 30: Annual internal switching rates for electricity and gas household customers for selected countries (%; by metering points)
Figure 30 shows the developments of internal switching rates for gas household customers in the years 2015 and 2016. Like the rates for external switching, the level of internal switching in gas is quite different as well. The highest rate is reported by Great Britain, the lowest rate by Luxembourg.
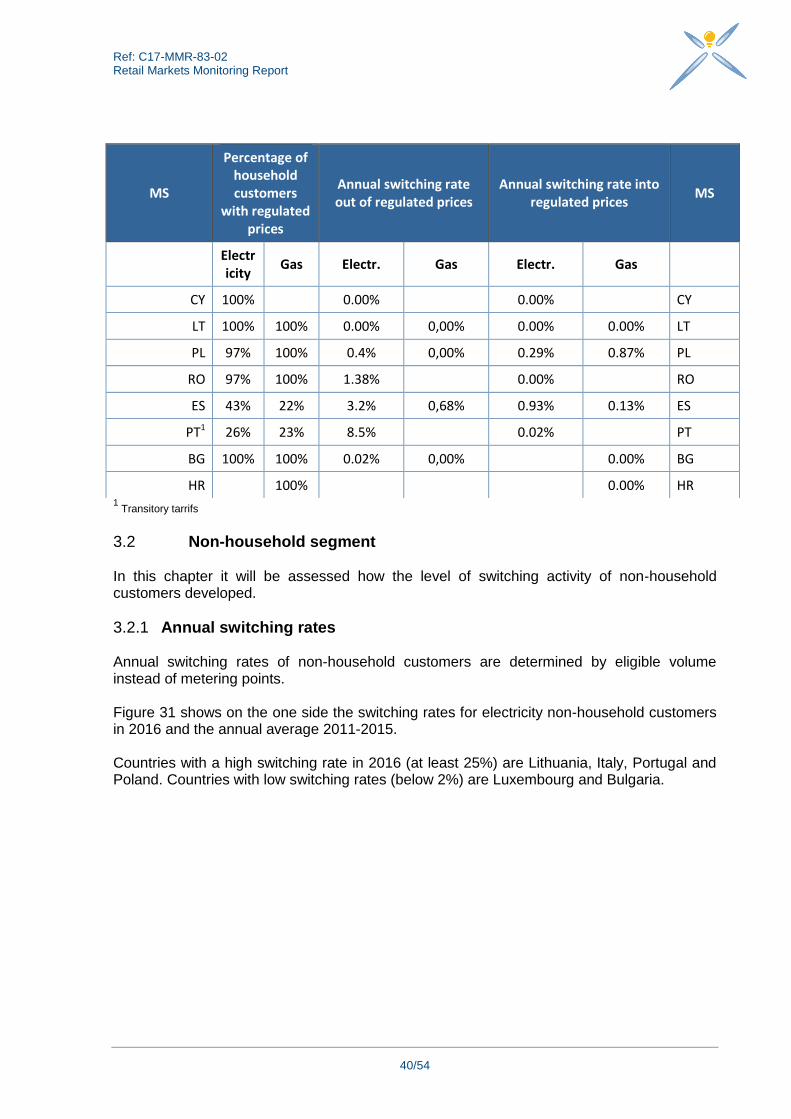
Switching activities of customers with regulated prices 3.1.3 Portugal, Spain, Bulgaria, Romania and Poland are the countries that reported switching activities for regulated prices in 2016 for electricity customers. For gas customers, only Spain and Poland reported switching activities for regulated prices in 2015.25 In 2016, Portugal was the country with the highest switching rate of all four countries that reported any switching activities out of regulated prices (8.5% for electricity customers). In the gas sector, only Spain reported any switching activities out of regulated prices (1.6%) in 2015. Switching into regulated prices is a rare phenomenon. Among three countries with switching activities into regulated prices for the year 2015, Spain was the one with the highest switching rate (0.9%) in the electricity sector. In the gas sector only Poland and Spain reported the following switching rates into regulated prices for the year 2016.
25
More information about countries with intervention in price setting and in price regulation can be found in Ch. 4.
Ref: C17-MMR-83-02 Retail Markets Monitoring Report
40/54
1 Transitory tarrifs
Non-household segment 3.2 In this chapter it will be assessed how the level of switching activity of non-household customers developed.
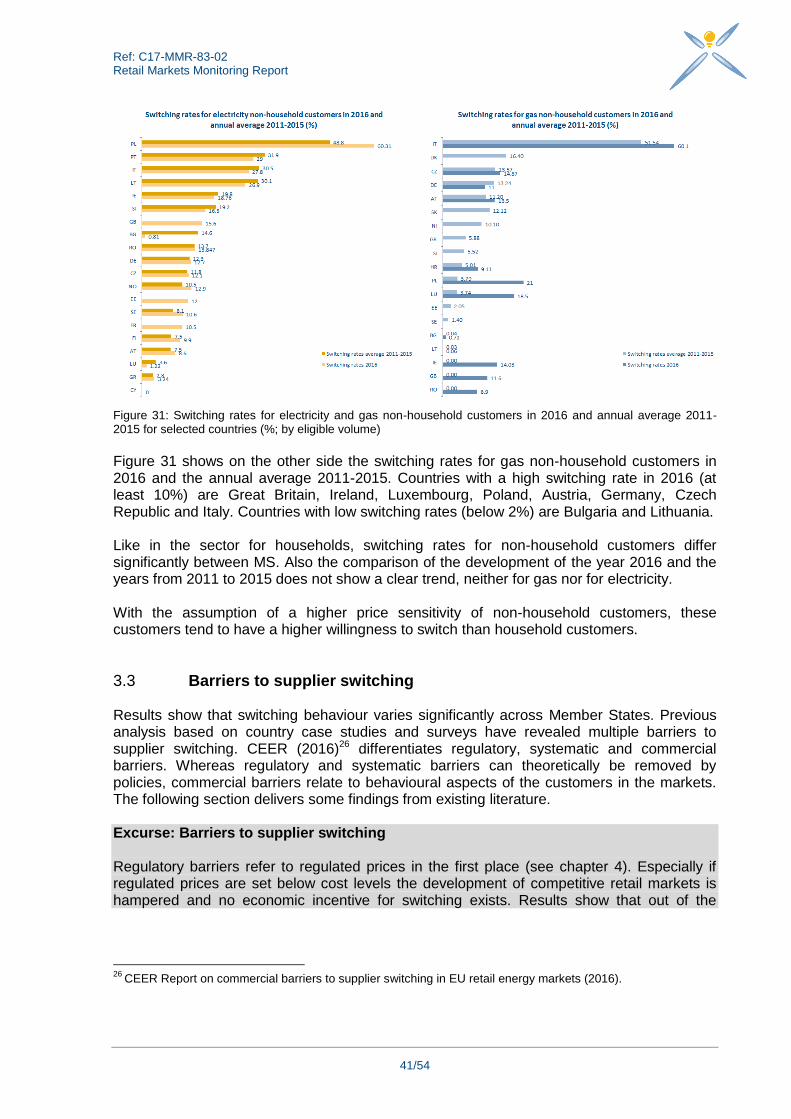
Annual switching rates 3.2.1 Annual switching rates of non-household customers are determined by eligible volume instead of metering points. Figure 31 shows on the one side the switching rates for electricity non-household customers in 2016 and the annual average 2011-2015. Countries with a high switching rate in 2016 (at least 25%) are Lithuania, Italy, Portugal and Poland. Countries with low switching rates (below 2%) are Luxembourg and Bulgaria.
MS
Percentage of household customers
with regulated prices
Annual switching rate out of regulated prices
Annual switching rate into regulated prices
MS
Electricity
Gas Electr. Gas Electr. Gas
CY 100% 0.00%
0.00%
CY
LT 100% 100% 0.00% 0,00% 0.00% 0.00% LT
PL 97% 100% 0.4% 0,00% 0.29% 0.87% PL
RO 97% 100% 1.38%
0.00%
RO
ES 43% 22% 3.2% 0,68% 0.93% 0.13% ES
PT1 26% 23% 8.5%
0.02%
PT
BG 100% 100% 0.02% 0,00%
0.00% BG
HR 100%
0.00% HR
Ref: C17-MMR-83-02 Retail Markets Monitoring Report
41/54
Figure 31: Switching rates for electricity and gas non-household customers in 2016 and annual average 2011-2015 for selected countries (%; by eligible volume)
Figure 31 shows on the other side the switching rates for gas non-household customers in 2016 and the annual average 2011-2015. Countries with a high switching rate in 2016 (at least 10%) are Great Britain, Ireland, Luxembourg, Poland, Austria, Germany, Czech Republic and Italy. Countries with low switching rates (below 2%) are Bulgaria and Lithuania. Like in the sector for households, switching rates for non-household customers differ significantly between MS. Also the comparison of the development of the year 2016 and the years from 2011 to 2015 does not show a clear trend, neither for gas nor for electricity. With the assumption of a higher price sensitivity of non-household customers, these customers tend to have a higher willingness to switch than household customers.
Barriers to supplier switching 3.3 Results show that switching behaviour varies significantly across Member States. Previous analysis based on country case studies and surveys have revealed multiple barriers to supplier switching. CEER (2016)26 differentiates regulatory, systematic and commercial barriers. Whereas regulatory and systematic barriers can theoretically be removed by policies, commercial barriers relate to behavioural aspects of the customers in the markets. The following section delivers some findings from existing literature. Excurse: Barriers to supplier switching Regulatory barriers refer to regulated prices in the first place (see chapter 4). Especially if regulated prices are set below cost levels the development of competitive retail markets is hampered and no economic incentive for switching exists. Results show that out of the
26
CEER Report on commercial barriers to supplier switching in EU retail energy markets (2016).

Ref: C17-MMR-83-02 Retail Markets Monitoring Report
42/54
twelve countries27 with regulated prices only four reported switching of customers out of regulated prices. Systematic barriers address issues such as the time it takes to perform a switch or low customer awareness on their rights on the energy markets. Systematic barriers can be removed by rules limiting switching time and by information policies intended to raise awareness on customers’ switching possibilities. However, even if regulatory and systematic barriers to switching are removed, commercial barriers still limit the willingness of customers to switch to a different supplier or contract. An analysis of these barriers focuses on behavioural aspects and asks how customers across Europe perceive the market, how they make choices and how they interact with suppliers. Based on the answers of customer organizations in 15 MS to the ACER questionnaire on retail markets, the main reasons not to switch are insufficient monetary gain, a lack of trust in the market and in other suppliers, the perception of a complex switching process and the satisfaction with the incumbent supplier combined with loyalty to the supplier. The findings are supported by several case studies on switching and theoretical elaborations28. a) Insufficient monetary gains Customers only switch to a new contract if the perceived monetary gain offsets the perceived transaction cost of switching. Perception in this case does not necessarily correspond to reality. Especially if the biggest cost share of the bill is fixed by law (tariffs, access fees, taxes) the difference in variable costs can hardly offset the transaction cost of switching. A low level of price difference can be another factor. The transaction cost of switching consists of several components, such as searching time and activity needed to compare offers, build trust, understand and sign a contract.
27
BE, BG, CY, DK, ES, FR, HU, LT, MT, PL, PT, RO, see also Chapter 4 of this report. 28
(see e.g. García-Acebrón et al. 2010, Hartmann and Apaolaza-Ibáñez 2007, Kahneman et al. 1991,Johnson
and Goldstein 2003, Samuelson and Zeckhauser 1988, Mullainathan and Thaler 2000, Thaler and Sunstein 2003, He and Rainer 2015, Pichert and Katsikopoulos 2008, ACM 2016, CER 2015):

Ref: C17-MMR-83-02 Retail Markets Monitoring Report
43/54
b) Complex perception process If the process of switching is or is perceived to be complex, transaction costs rise. The switching process follows a few steps depending on the specific market in each Member State. A lack of clarity for customers on what steps have to be taken at what time, who has to be informed etc. can result in an inactive attitude. Transparent and clear information provided by independent bodies is therefore critical for customers’ decision making. Customers’ choice can additionally be facilitated by reliable comparison tools allowing for a comprehensively comparing of suppliers. c) Lack of trust Trust in the market and in its players is essential for a competitive market to function in the long run. A lack of trust can result from bad experience or no experience. Distrust is triggered by non-transparent contractual terms or lock-in policies such as long-term contracts with excessive termination fees. The Centreforum’s ‘Reforming retails markets’ report (2015) notes that misconduct and scandals may have fed a lack of trust (e.g. sales representatives underestimating the price of tariff, aggressive sales strategies such as door-to-door or telesales which make tariff comparison difficult). d) Satisfaction/ Loyalty Surveys also reveal that customers do not switch because they are satisfied with their current supplier. If economic incentives to switch are large enough, such satisfaction can be explained by a loyalty to the current supplier. Loyalty is closely related to the previously described lack of trust in new suppliers. The power of default approach seeks to explain why individuals stay with products they are used to even though there are alternatives on the market which would meet their preferences better. As default products are often used as reference products, customers may see opting-out of the default as risky, compared to the perceived safety of the default mix29). Status quo biases additionally influenced customer behaviour especially in the context of low involvement products such as electricity30. Making an active decision requires physical effort and thus increases transaction cost.31 Especially when customers have to deal with complex decision-making processes such as switching, they tend to not make any decision at all or delay it to a later point in time, thus creating the problem of inertia and procrastination. In addition, non-monetary gains like green energy tariffs or bundled packages can also influence customers’ decisions. In conclusion, from a customers’ perspective, the perceived economic gain has to offset the risk and transaction cost of switching. Independent, complete, comparable and understandable information is necessary to facilitate the decision-making process.
29
Kaenzing 2013
30 Kahneman et al., 1991; Samuelson and Zeckhauser, 1988
31 Samuelson and Zeckhauser, 1988
Ref: C17-MMR-83-02 Retail Markets Monitoring Report
44/54
Intervention in price setting and price regulation 4
This chapter focuses on the different forms of intervention in retail price setting mechanism or in (energy) price regulation. MS choose different paths on the way to liberalisation. Some progress can be noted in some countries; still keeping some forms of intervention for a majority of consumers or at least for vulnerable consumers, whilst other countries managed to move from 100% regulated prices to a completely liberalised market. In this report, when talking about regulation, we consider the end-user price (the energy component) only, which is a price subject to regulation or controlled by a public authority like a government, an NRA, etc. This section analyses steps MS have taken towards the removal of price regulation (where data permits it and, where applicable to countries).
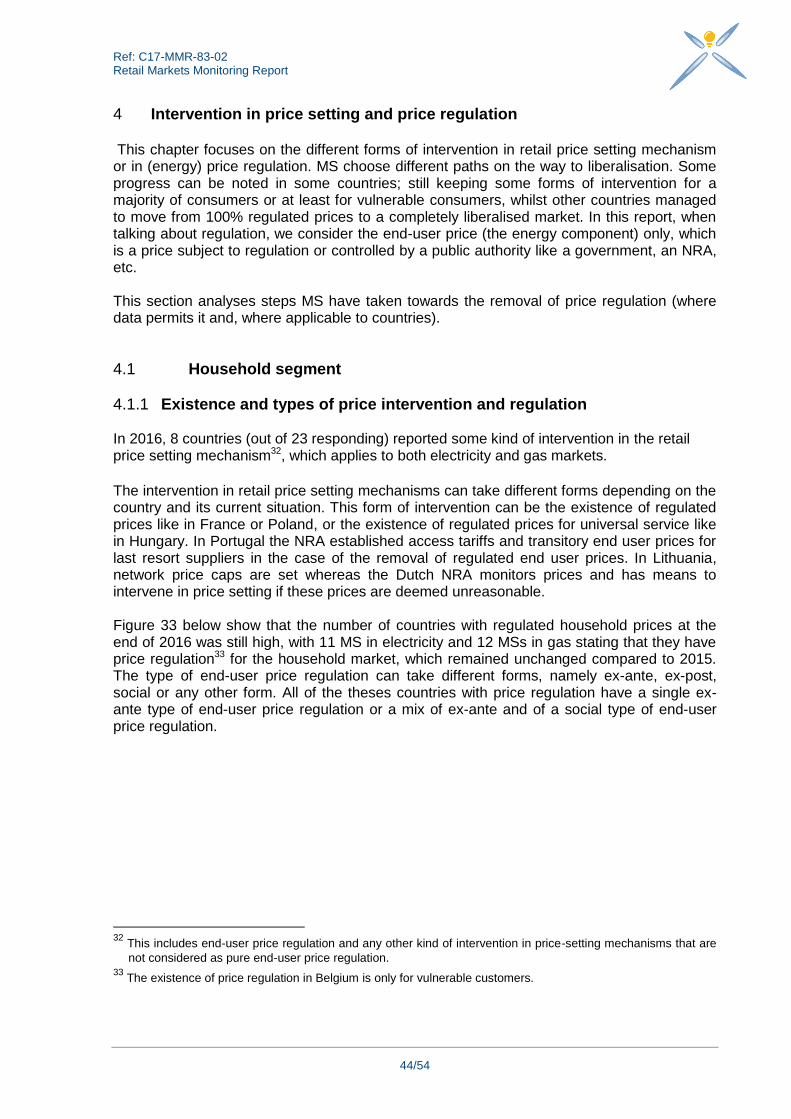
Household segment 4.1
Existence and types of price intervention and regulation 4.1.1 In 2016, 8 countries (out of 23 responding) reported some kind of intervention in the retail price setting mechanism32, which applies to both electricity and gas markets. The intervention in retail price setting mechanisms can take different forms depending on the country and its current situation. This form of intervention can be the existence of regulated prices like in France or Poland, or the existence of regulated prices for universal service like in Hungary. In Portugal the NRA established access tariffs and transitory end user prices for last resort suppliers in the case of the removal of regulated end user prices. In Lithuania, network price caps are set whereas the Dutch NRA monitors prices and has means to intervene in price setting if these prices are deemed unreasonable. Figure 33 below show that the number of countries with regulated household prices at the end of 2016 was still high, with 11 MS in electricity and 12 MSs in gas stating that they have price regulation33 for the household market, which remained unchanged compared to 2015. The type of end-user price regulation can take different forms, namely ex-ante, ex-post, social or any other form. All of the theses countries with price regulation have a single ex-ante type of end-user price regulation or a mix of ex-ante and of a social type of end-user price regulation.
32
This includes end-user price regulation and any other kind of intervention in price-setting mechanisms that are
not considered as pure end-user price regulation. 33
The existence of price regulation in Belgium is only for vulnerable customers.
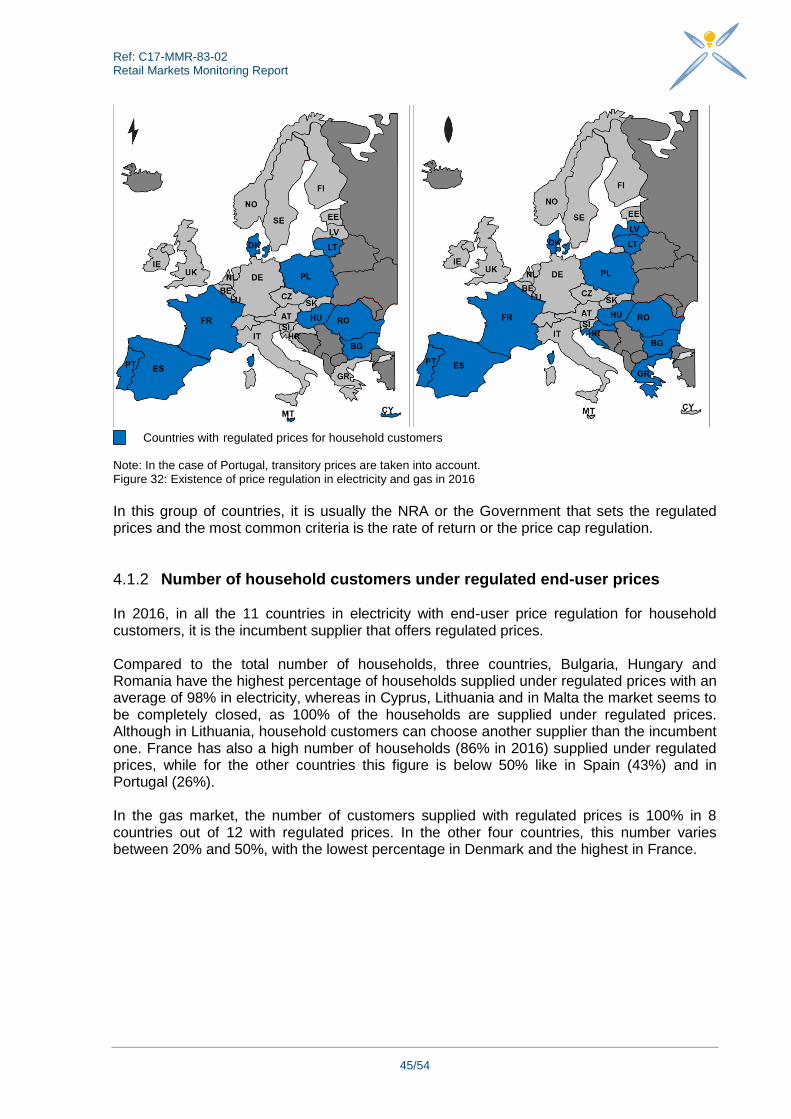
Ref: C17-MMR-83-02 Retail Markets Monitoring Report
45/54
Countries with regulated prices for household customers
Note: In the case of Portugal, transitory prices are taken into account. Figure 32: Existence of price regulation in electricity and gas in 2016
In this group of countries, it is usually the NRA or the Government that sets the regulated prices and the most common criteria is the rate of return or the price cap regulation.
Number of household customers under regulated end-user prices 4.1.2 In 2016, in all the 11 countries in electricity with end-user price regulation for household customers, it is the incumbent supplier that offers regulated prices. Compared to the total number of households, three countries, Bulgaria, Hungary and Romania have the highest percentage of households supplied under regulated prices with an average of 98% in electricity, whereas in Cyprus, Lithuania and in Malta the market seems to be completely closed, as 100% of the households are supplied under regulated prices. Although in Lithuania, household customers can choose another supplier than the incumbent one. France has also a high number of households (86% in 2016) supplied under regulated prices, while for the other countries this figure is below 50% like in Spain (43%) and in Portugal (26%). In the gas market, the number of customers supplied with regulated prices is 100% in 8 countries out of 12 with regulated prices. In the other four countries, this number varies between 20% and 50%, with the lowest percentage in Denmark and the highest in France.

Ref: C17-MMR-83-02 Retail Markets Monitoring Report
46/54
Note: In the case of Portugal, transitory prices are taken into account. Figure 33: Number of household customers in electricity with regulated prices compared to the total number of household customers in the country
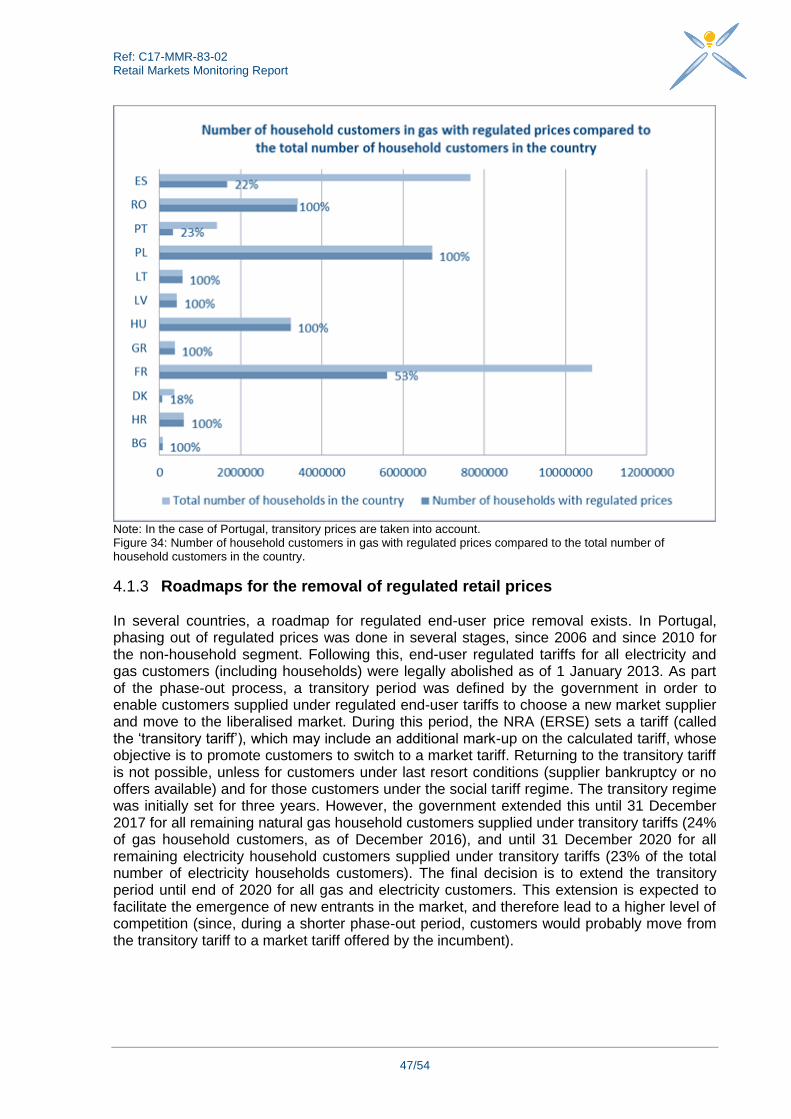
Ref: C17-MMR-83-02 Retail Markets Monitoring Report
47/54
Note: In the case of Portugal, transitory prices are taken into account. Figure 34: Number of household customers in gas with regulated prices compared to the total number of household customers in the country.
Roadmaps for the removal of regulated retail prices 4.1.3 In several countries, a roadmap for regulated end-user price removal exists. In Portugal, phasing out of regulated prices was done in several stages, since 2006 and since 2010 for the non-household segment. Following this, end-user regulated tariffs for all electricity and gas customers (including households) were legally abolished as of 1 January 2013. As part of the phase-out process, a transitory period was defined by the government in order to enable customers supplied under regulated end-user tariffs to choose a new market supplier and move to the liberalised market. During this period, the NRA (ERSE) sets a tariff (called the ‘transitory tariff’), which may include an additional mark-up on the calculated tariff, whose objective is to promote customers to switch to a market tariff. Returning to the transitory tariff is not possible, unless for customers under last resort conditions (supplier bankruptcy or no offers available) and for those customers under the social tariff regime. The transitory regime was initially set for three years. However, the government extended this until 31 December 2017 for all remaining natural gas household customers supplied under transitory tariffs (24% of gas household customers, as of December 2016), and until 31 December 2020 for all remaining electricity household customers supplied under transitory tariffs (23% of the total number of electricity households customers). The final decision is to extend the transitory period until end of 2020 for all gas and electricity customers. This extension is expected to facilitate the emergence of new entrants in the market, and therefore lead to a higher level of competition (since, during a shorter phase-out period, customers would probably move from the transitory tariff to a market tariff offered by the incumbent).

Ref: C17-MMR-83-02 Retail Markets Monitoring Report
48/54
In Romania, where price regulation still exists for households, there is a roadmap enforced by the NRA (ANRE), to gradually remove end-user regulated prices. The calendar of the roadmap ensures that an established percentage (quota) of the household electricity consumption will be purchased on the competitive market. The process started in 2013 and should be finalised by December 2017. All the stages have been successfully implemented, as stated by ANRE, with the final goal that by the end of 2017 all household customers will benefit of market prices. In Spain, a special regime of regulation exists for consumers with contracted power connection below 10 kW. The Spanish electricity market was fully liberalised on 1 July 2003. Since then, all consumers have been able to choose their supplier. The Act 24/2013 of the Power Sector and the Royal Decree 216/2014 modified the regime of the last resort supply and introduced the PVPC for consumers with a contracted power connection below 10 kW. As a result, as of 1 January 2014, the last resort regulated tariff for small consumers was replaced by the PVPC system. Under the new system, the energy price paid by consumers is the price resulting in the day-ahead spot market and ancillary services cost during the billing period as opposed to the previous system based on specific long-term hedging products. The objective of this new mechanism is to avoid the risk premium internalised in long-term energy markets. As of October 2015, customers equipped with smart meters will be billed based on metered hourly consumption and hourly prices. As the discrepancy between standard consumption profiles and the actual demand of a given customer can be quite significant, the billing based on hourly metered consumption is a more efficient way to charge customers. The ‘reference suppliers’ have the obligation to apply these prices to small consumers that wish to be supplied at a variable price. Additionally, the reference suppliers have the obligation to offer a price which is fixed for one year, is not regulated, and can be freely set by these suppliers. This is because some consumers may wish to choose an ex ante fixed price instead of a variable price. However, most small consumers have variable price contracts.
Non-household segment 4.4 This section focuses on the different forms of price intervention or regulation for the non-household segment. As for household customers, MS choose different paths on the way to liberalisation. Whereas some countries moved from 100% regulated prices to a completely liberalized market, other still keep some form of price intervention. This section analyses the steps in the path towards the removal of price regulation (where data permits it and, where applicable to countries).
Existence of regulated prices 4.4.1 Figure 36 illustrates that in 2016, in 7 countries in electricity and 8 in gas, out of 25 MS responding for electricity and 22 MS responding for gas, there is an application of end-user price regulation for non-household customers. In 2015, there were 8 countries in this situation, as Portugal removed price regulation for their non-household customers.

Ref: C17-MMR-83-02 Retail Markets Monitoring Report
49/54
Countries with regulated prices for non-household customers
Note: In the case of Portugal, transitory prices are taken into account.
Figure 35: Existence of price regulation in electricity and in gas in 2016
Number of non-household customers under regulated end-user prices 4.4.2 Compared to the total number of electricity non-households, Bulgaria and France have the highest percentage of non-households supplied under regulated prices, whereas in Cyprus and in Malta the market seems to be completely closed, as 100% of the non-households are supplied under regulated prices. In the other countries, there is a range of 19% to 34% of non-households supplied under end-user regulated prices. The lowest percentages are in Portugal and in Belgium, where there is less than 1% of non-household customers that are supplied under end-user regulated prices. In the gas market, in 5 countries out of 8 in total with regulated prices, the number of customers with regulated prices is high and ranges between 80% in Hungary and 100% in the other countries. In three countries Portugal, France and in Denmark, these figures are lower and range between 10% and 19%. The situation in France is much more different in gas than in electricity, showing that the gas non-household market is developing more quickly. There are only 12% of the non-household customers that are supplied under regulated prices in 2016, compared to 50% in 2013 before the process of phase-out of regulated prices has started on the gas non-household market in France.

Ref: C17-MMR-83-02 Retail Markets Monitoring Report
50/54
Note: In the case of Portugal, transitory prices are taken into account.
Figure 36: Number of non-household customers in electricity with regulated prices compared to the total number of non-household customers in the country
Note: In the case of Portugal, transitory prices are taken into account.
Figure 37: Number of non-household customers in gas with regulated prices compared to the total number of non-household customers in the country

Ref: C17-MMR-83-02 Retail Markets Monitoring Report
51/54
Roadmaps for removal of regulated retail prices 4.4.3 Portugal removed the end-user price regulation for non-household customers and the transitory period ended in 2016. As part of the phase-out process, which started in 2010 for gas non-household customers and in 2011 for electricity non-household customers, a transitory period was defined by the government in Portugal in order to enable customers supplied under regulated end-user prices to choose a new market supplier and move to the liberalised market. During this period, the NRA (ERSE), sets a tariff (called the ‘transitory tariff’), which may include an additional value, whose objective is to promote customers to switch to a market tariff. Further, in the electricity and gas non-household French markets, only a certain share of non-households are still eligible to an end-user regulated price. As of 31 December 2015, France has removed regulated electricity prices for large and medium industrial consumers, i.e. with an electric power connection of more than 36 kVA. Industrial consumers with an electric power connection lower than 36 kVA are not affected by the removal of regulated electricity tariffs within the current legal framework. Regulated prices for non-household consumers in the French gas market were removed gradually between 2014 and 2016, where gas industrial customers with consumption level over 30 MWh cannot choose a regulated tariff anymore. Industrial consumers whose gas consumption level is below 30 MWh per year are not affected by the removal of regulated gas tariffs, so they can choose between regulated tariffs with the incumbent and non-regulated tariffs with a non-incumbent supplier.
Ref: C17-MMR-83-02 Retail Markets Monitoring Report
52/54
TABLE OF FIGURES Figure 1: Development of a number of active suppliers and customers in Europe – Electricity ............................................................................................................................................ 10 Figure 2: Development of a number of active suppliers and customers in Europe - Gas ...... 11 Figure 3: Development of an average number of household customers in European DSO networks - Electricity ............................................................................................................ 12 Figure 4: Average number of suppliers for household customers in European DSO networks - Gas .................................................................................................................................... 13 Figure 5: Average market share of the three largest suppliers in the market for households in Europe - Electricity ............................................................................................................... 14 Figure 6: Average market share of the three largest suppliers in the market for households in Europe – Gas ...................................................................................................................... 15 Figure 7: Market share of the three largest suppliers in the whole electricity and gas markets ............................................................................................................................................ 15 Figure 8: Development of switching rates in electricity retail markets ................................... 16 Figure 9: Development of switching rates in gas retail markets ............................................ 17 Figure 10: Number of household customers and number of household customers with a different supplier than the incumbent one in electricity for selected countries ...................... 20 Figure 11: Number of household customers and number of household customers with a different supplier than the incumbent one in gas for selected countries ............................... 20 Figure 12: Number of household customers, typical annual consumption per household customer and the total household volume in electricity in 2016 for selected countries ......... 21 Figure 13: Number of household customers, typical annual consumption per household customer and the total household volume in gas in 2016 for selected countries .................. 22 Figure 14: Typical annual household consumption in electricity in 2016 for selected countries ............................................................................................................................................ 23 Figure 15: Typical annual household consumption in gas in 2016 for selected countries ..... 24 Figure 17: Percentage of nationwide suppliers out of the total number of supplies for household customers in electricity in 2016 for selected countries ........................................ 25 Figure 18: Percentage of nationwide suppliers out of the total number of supplies for household customers in gas in 2016 for selected countries ................................................. 25 Figure 19: Market share of three largest nationwide suppliers (CR3) and number of main suppliers with a market share above 5% in electricity on the household market for selected countries .............................................................................................................................. 27 Figure 20: Market share of three largest nationwide suppliers (CR3) and number of main suppliers with a market share above 5% in gas on the household market for selected countries .............................................................................................................................. 27 Figure 21: HHI for the household market in electricity for selected countries ....................... 29 Figure 22: HHI for the household market in gas for selected countries ................................ 29 Figure 23: Percentage of nationwide suppliers out of the total number of suppliers for non-household customers in electricity in 2016 for selected countries ........................................ 31 Figure 24: Total number of suppliers and number of nationwide suppliers for non-household customers in gas in 2016 for selected countries ................................................................... 31 Figure 25: Market share of three largest nationwide suppliers (CR3) and number of main suppliers with a market share above 5% for non-household customers in electricity for selected countries ................................................................................................................ 33 Figure 26: Market share of three largest nationwide suppliers (CR3) and number of main suppliers with a market share above 5% for non-household customers in gas for selected countries .............................................................................................................................. 33 Figure 27: HHI for the non-household market in electricity for selected countries ................ 34 Figure 28: HHI for the non-household market in gas for selected countries ......................... 35
Ref: C17-MMR-83-02 Retail Markets Monitoring Report
53/54
Figure 29: Switching rates for electricity and gas household customers in 2016 and annual average 2011-2015 (%; by metering points) for selected countries ...................................... 37 Figure 30: Change in electricity and gas switching rates of household customers from 2015 to 2016 for selected countries (%)........................................................................................ 38 Figure 31: Annual internal switching rates for electricity and gas household customers for selected countries (%; by metering points) ........................................................................... 39 Figure 32: Switching rates for electricity and gas non-household customers in 2016 and annual average 2011-2015 for selected countries (%; by eligible volume) ........................... 41 Figure 33: Existence of price regulation in electricity and gas in 2016 .................................. 45 Figure 34: Number of household customers in electricity with regulated prices compared to the total number of household customers in the country ...................................................... 46 Figure 35: Number of household customers in gas with regulated prices compared to the total number of household customers in the country. ........................................................... 47 Figure 36: Existence of price regulation in electricity and in gas in 2016 .............................. 49 Figure 37: Number of non-household customers in electricity with regulated prices compared to the total number of non-household customers in the country ........................................... 50 Figure 38: Number of non-household customers in gas with regulated prices compared to the total number of non-household customers in the country ..................................................... 50

Ref: C17-MMR-83-02 Retail Markets Monitoring Report
54/54
About CEER The Council of European Energy Regulators (CEER) is the voice of Europe's national regulators of electricity and gas at EU and international level. CEER’s members and observers (from 33 European countries) are the statutory bodies responsible for energy regulation at national level. One of CEER's key objectives is to facilitate the creation of a single, competitive, efficient and sustainable EU internal energy market that works in the public interest. CEER actively promotes an investment-friendly and harmonised regulatory environment, and consistent application of existing EU legislation. Moreover, CEER champions consumer issues in our belief that a competitive and secure EU single energy market is not a goal in itself, but should deliver benefits for energy consumers. CEER, based in Brussels, deals with a broad range of energy issues including retail markets and consumers; distribution networks; smart grids; flexibility; sustainability; and international cooperation. European energy regulators are committed to a holistic approach to energy regulation in Europe. Through CEER, NRAs cooperate and develop common position papers, advice and forward-thinking recommendations to improve the electricity and gas markets for the benefit of consumers and businesses. The work of CEER is structured according to a number of working groups and task forces, composed of staff members of the national energy regulatory authorities, and supported by the CEER Secretariat. This report was prepared by the Market Monitoring and Reporting Task Force of CEER’s Implementation Benchmarking and Monitoring Working Group. CEER wishes to thank in particular the following regulatory experts for their work in preparing this report: David Allmann, Deniz Erdem, Sebastian Kempka and Mladena Pavlova. More information at www.ceer.eu.