retail market research & strategic plan overview
TRANSCRIPT

Retail Strategies | 120 18th Street South, Suite 201 | Birmingham, AL 35233 | 205.313.3676 | 205.313.3677 | www.retailstrategies.com
Retail Market Research & Strategic Plan Overview

our purpose | Retail Strategies
Retail Strategies was formed to help cities take a comprehensive approach to retail recruitment. We go beyond research, recognizing the need for our clients to have a partner involved in the execution of a specific Retail Recruitment Strategy.

our team: by the numbers | Retail Strategies
30 Team Members
125 Years of Retail Real Estate Experience
4 Average Clients Per Team Member
4 Offices: Birmingham, Fort Worth, New Orleans and New York City (coming late spring 2015)

our research | Retail Strategies

retail economic impact | Retail Strategies

retail economic impact | Retail Strategies

retail expansion plans | Retail Strategies

DEMOGRAPHIC REPORTS Detailed Demographics Age by Gender Age by Income Household Wealth Income and Disposable Income Consumer Behaviors Consumer Attitudes TAPESTRY SEGMENTATION ANALYSIS PEER ANALYSIS RETAIL SPENDING REPORTS Consumer Expenditures Consumer Attitudes RETAIL GAP ANALYSIS RETAIL VOID ANALYSIS
our research | Retail Strategies

basecamp | Retail Strategies

market analysis | Retail Strategies
Category 5 Minute
10 Minute
15 Minute
Population 2014 33,097 156,068 476,480
Population 2019 35,571 165,037 503,006
Median Household
Income 2014
$47,451 $58,603 $67,176
Median Household
Income 2019
$55,014 $68,648 $78,237
Median Disposable
Income 2014
$39,111 $49,022 $54,273
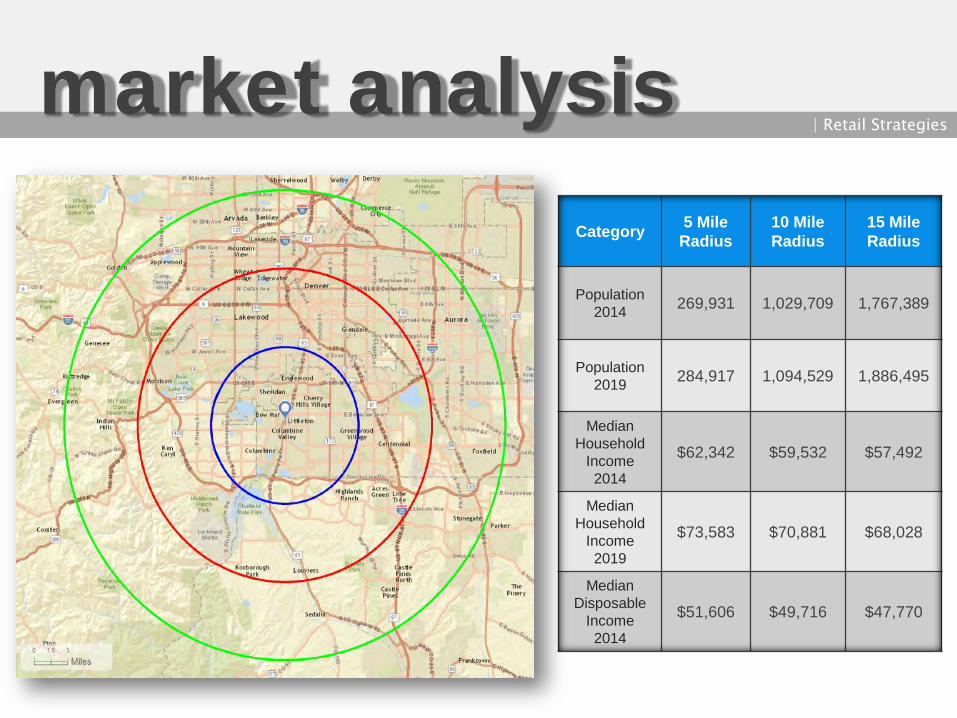
market analysis | Retail Strategies
Category 5 Mile Radius
10 Mile Radius
15 Mile Radius
Population 2014 269,931 1,029,709 1,767,389
Population 2019 284,917 1,094,529 1,886,495
Median Household
Income 2014
$62,342 $59,532 $57,492
Median Household
Income 2019
$73,583 $70,881 $68,028
Median Disposable
Income 2014
$51,606 $49,716 $47,770
| Retail Strategies
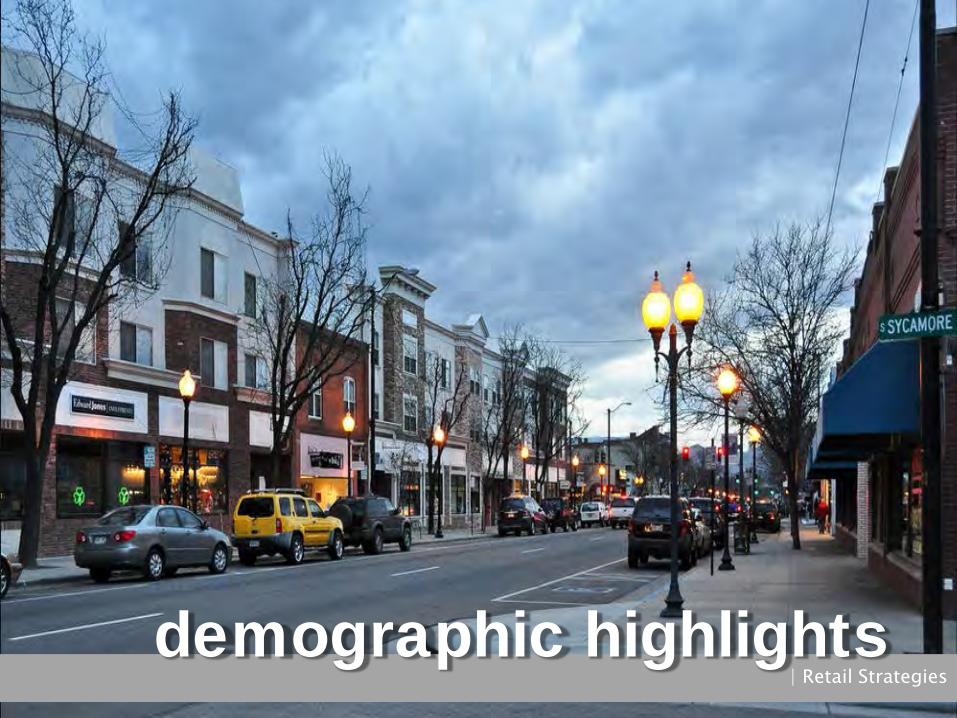
demographic highlights | Retail Strategies

| Retail Strategies tapestry segmentation
Segmentation systems operate on the theory that people with similar tastes, lifestyles, and behaviors seek others with the same tastes—“like seeks like.” These behaviors can be measured, predicted, and targeted. Esri’s Tapestry Segmentation system combines the “who” of lifestyle demography with the “where” of local neighborhood geography to create a model of various lifestyle classifications or segments of actual neighborhoods with addresses—distinct behavioral market segments.
Segmentation 101
Tapestry Segmentation represents the fourth generation of market segmentation systems that began more than 30 years ago. The 65-segment Tapestry Segmentation system classifies US neighborhoods based on their socioeconomic and demographic compositions. The power of Tapestry Segmentation allows you to profile consumers and constituents.
What is Tapestry Segmentation?
All companies, agencies, and organizations need to understand consumers/constituents in order to supply them with the right products and services and to reach them via their preferred media. These applications require a robust segmentation system that can accurately profile these diverse markets. The versatility and predictive power of Tapestry Segmentation allow users to integrate their own data or national consumer surveys into Tapestry Segmentation to identify their best market segments and reach them through the most effective channels.
Who Should Use Tapestry Segmentation?
www.esri.com/library/brochures/pdfs/tapestry-segmentation.pdf

| Retail Strategies demographic highlights
14.3% of Households within a 5 Minute Drive Time of Littleton, CO.

| Retail Strategies demographic highlights
16.4% of Households within a 5 Minute Drive Time of Littleton, CO.

8.9% of Households within a 5 Mile Radius Time of Littleton, CO.
| Retail Strategies demographic highlights

| Retail Strategies peer&gap analysis

The Peer Analysis focuses on identifying cities across the Midwestern United States that are similar to the City of Littleton from an economic and demographic perspective.
peer analysis | Retail Strategies
City State Population (2010)
Population (2014)
Population (2019)
Households (2014)
Average Household
Income (2014)
Total Retail Expenditures
(2014)
Cedar Hill TX 44,915 47,988 51,669 16,337 $81,673 $422,344,287
Ankeny IA 45,608 47,472 50,205 18,505 $85,808 $496,362,576
Wylie TX 41,437 44,865 50,315 14,406 $84,390 $381,110,442
Bountiful UT 42,552 44,857 48,773 15,322 $89,517 $419,894,201
Littleton CO 41,737 43,972 46,727 18,935 $83,186 $489,219,051
Burleson TX 37,276 39,309 42,583 13,813 $81,622 $356,274,979

gap analysis | Retail Strategies
The Gap Analysis is a summary of the primary spending Gaps segmented by retail category. It measures actual consumer expenditures within the City’s trade area and compares it to the potential retail revenue generated by retailers in the same area. The difference between the two numbers reflects leakages, or the degree to which consumers travel outside the community for certain retail goods and services. The Gap analysis is a useful tool to gauge retail supply and demand within the community. The summary includes the Number of Retailers Targeted in Plan. These figures represent the number of retailers potentially required to fill the particular Gap in each category.
Retail GAP Summary - Littleton CO City Boundary
Retail Stores Opportunity GAP
General Merchandise Stores $37,084,431
Pharmacies and Drug Stores $24,644,299
Department Stores $21,658,241 Hardware, Outdoor Power Equipment, Nursery & Garden Centers $15,294,655
Appliances, TVs, Electronics Stores $10,799,562
Full-Service Restaurants $5,315,981
Gift, Novelty and Souvenir Stores $3,004,576
Office Supplies and Stationery Stores $2,836,589
Furniture and Home Furnishings $2,594,692
Optical Goods Stores $1,318,110
Cosmetics, Beauty Supplies, Perfume Stores $1,147,600
Total $125,698,736

| Retail Strategies retail sales tax collections
$45 to $80 Million
$1-$3 Million
Local - $1.3 to $3.2 million Local - $180 to $300,000
Local - $30 to $90,000
$6-10 Million
$3-$6 Million
Local - $90 to $180,000

| Retail Strategies site selection process

current retail overview | Retail Strategies

focus properties | Retail Strategies
• Address and Property Description • Coordinates • Listing Agent if applicable • Contact Info for Agent or Owner • Website address for Agent or Owner • Link to Property Information on Agent or Owner’s Website
• Google Earth Link to aerial and ground photo • Total Size of Center if existing • Available Space in Center • Parcel Size if vacant land • Existing Tenants if existing shopping center • Traffic Count at property • Summary of Recruitment opportunities specific to property
• Specific Prospects for property • Overall strategy for property • General comments
information collected on BOG tour …..
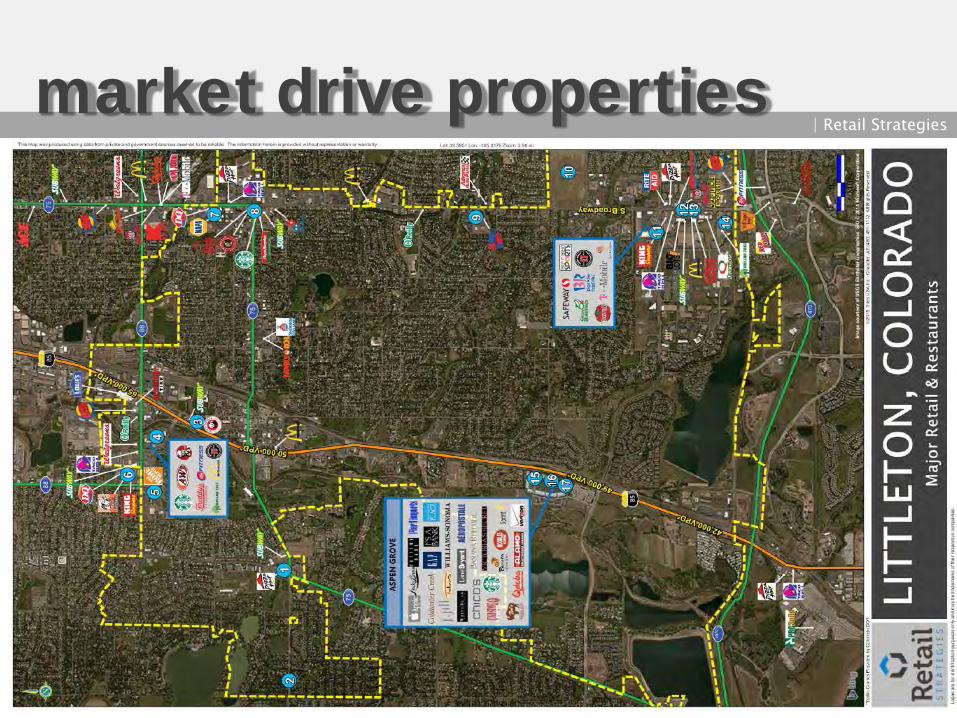
market drive properties | Retail Strategies

development&redevelopment zones | Retail Strategies
Long term Redevelopment Zones
Boutique Retail and Restaurant recruitment zone
Big Box Recruitment and Development

| Retail Strategies retail prospects

marketing objectives | Retail Strategies
• Leverage Retail Strategies’ national network of retail, restaurant, developer and investor relationships on behalf of Littleton
• Focus on marketing the primary retail redevelopment, new development and infill opportunities and zones
• Communicate with local real estate professionals and support their efforts where needed through research and contacts
• Continue aggressive outreach/marketing campaign to targeted retailers and restaurant prospects through direct contact, tenant representatives, preferred developer relationships as well as industry conferences/trade shows (ICSC)
• Connect landowners with out of market developers as appropriate • Connect leasing/brokerage professionals with potential tenants based on location
and real estate requirements • Assist any current retail development and redevelopment projects with custom
research reports • Present opportunities to retailers during Portfolio Reviews (already taking place) • Work with Arapahoe Community College regarding student population and
incorporate into research and marketing materials

recruitment objectives | Retail Strategies
• Analyze the Return on Investment of potential developments including complimentary retail opportunities at or near the development site
• Leverage the traffic generated by new developments to position additional retail development and/or redevelopment opportunities in Littleton
• Pro-actively reach out to current shopping center owners to determine their interest in updating and targeting new retail or their interest in re-positioning the current tenant mix
• Aggressively market the City of Littleton and specific sites to “new to market” restaurant concepts
• Identify through Retail Strategies resources – retailers planning to expand into the Colorado market over the next several years
• Target Denver metro area chef driven restaurants and boutique retailers to open 2nd/3rd locations
• Position the Littleton trade area as an alternative location to the contiguous commercial trade area(s), specifically Lone Tree, Highlands Ranch, Centennial and Englewood
• Incorporate the Platte River recreational area into custom research and market appropriate sites to targeted retailers

site selection process | Retail Strategies

recruitment objectives | Retail Strategies

| Retail Strategies marketing & recruitment

marketing guide | Retail Strategies