results - ulb halle: online-publikationen · that rtg-2 does not carry the sv40 antigen and arti...
TRANSCRIPT

Chapter 3
Results
3.1 Screening for a fish cell model
and method development
3.1.1 Screening of fish cell lines
Up to date, all data about the action of the two rainbow trout GRs (rtGR1 and rtGR2)were obtained in artificial mammalian cell lines COS-7 and CHO. These cell lines aredesigned to be easily transfected and, most importantly, do not express endogenousreceptors.
One goal of this thesis was to use a rainbow trout cell line to study the rainbow troutGRs in a system that originated from this species. For this purpose, the first objectivewas to establish a rainbow trout fish cell line model. An ideal cell line would expressnone or only one of both rainbow trout GRs. Therefore, eight rainbow trout cell lines,derived from various organs, were tested for the presence of both rtGR1 and rtGR2mRNAs. Results of the screening are summarized in Table 3.1
The general description of the eight fish cell lines showed that all cell lines testedexpressed mRNA of both rtGR1 and rtGR2 (Table 3.1). Only the cell line RTG-2 hasbeen described before to possess cortisol binding sites (Lee and Bols, 1989) and thepresence of mRNA is a confirmation of this. Because none of the cell lines lacked oneor both of rainbow trout GR mRNAs, none was perfect for the transfection studies.To carry out transfection studies with many different treatments a lot of cells wouldbe needed. Therefore I focused on growth rats as the second attribute of choise. Fishcells are cultured at low temperatures of 19◦C and flasks are confluent within a weekif split at ratios of 1 : 1. Among all fish cell lines tested, RTG-2 possessed the highestgrowth rate and flasks were confluent within 3 days when split at a ratio of 1 : 1. This
27

Results
Table 3.1: Presence of rtGR1 and rtGR2 mRNA in diverse fish cell linesCell line origin rtGR1 rtGR2
mRNA mRNARTL-W1 liver + +RI liver + +RTH-149 hepatoma + +RTgill gill + +RTgut gut + +RTG-2 gonads + +RTbrain brain + +(+) mRNA was easily discernable by conventional rtPCRand subsequent gel electrophoresis
high growth rate was found as an advantage of the RTG-2 cell line and RTG-2 wasfinally chosen as the fish cell model for this study.
3.1.2 Development of a transfection techniquefor RTG-2 and COS-7
After selection of the fish cell line, the transfection method of choice needed to bedeveloped. Two issues were important. First, the selected technique had to achievea high transfection efficiency in RTG-2. Second, the same technique had to also besuitable for transfection of COS-7. This was particularly important as some transfec-tion techniques can change the outcome of results and comparing data obtained withdifferent cell lines would be questionably if different transfection techniques would beused. Three different transfection techniques were tested; the calcium phosphate pre-cipitation, the electroporation and the liposome based transfection using Lipofectamine2000.
First, the calcium phosphate precipitation (Sambrook and Russell 2000, MolecularCloning) was the standard transfection technique used for COS-7. This method didnot turn out suitable for transfection of RTG-2 because transfection efficiency was< 1 % and salt crystals formed, indicating the reaction of medium compounds withprecipitation products while incubating over night. I further adapted the protocol ofthe calcium phosphate precipitation after Zarafullah et al., (1988). This methodologyis performed similar to calcium phosphate precipitation but after 4 h incubation of thecells with the DNA-precipitate cells were shocked with 15 % glycerol. This techniquehas been described for transient transfection of the fish cell line RTH-149 (Zarafullahet al., 1988). However, transfection efficiency remained low and only 2 % of the totalcells were transfected.
I then tested electroporation for transfection of RTG-2 cells. The transfection efficiencywas about 30 % and no cytotoxic effects of the treatment were observed for RTG-2 cells.
28

Results
In contrast, using electroporation for the transfection of COS-7 cells turned out to becytotoxic to COS-7 cells. For that reason electroporation was not used for transfectionin the presented study.
I continued testing the commercially available liposome based transfection reagentLipofectamine 2000. If cells were incubated over night with Lipofectamine 2000, asstated in the manufactures protocol, RTG-2 cells had dislodged from the growth sur-face. I then tested the incubation of the cells with the Lipofectamine/DNA complexfor 4 h. None of the cells dislodged after the treatment and about 30 % of the cells weretransfected. In addition COS-7 cells are easy to transfect using Lipofectamine 2000.About 30 % of the cells were transfected and no cytotoxic effects were observed, usingthe same 4 h incubation period.
3.2 Mechanistic studies
of fish glucocorticoid receptors
3.2.1 Cellular localisation of GFP-rtGR1 and GFP-rtGR2
To examine the subcellular localisation and dynamics of nuclear translocation of therainbow trout glucocorticoid receptors, rtGR1 and rtGR2, GFP-tagged versions ofthese receptors were constructed. Before using these to study nuclear import, theexpression and functional integrity of the GFP-fusion proteins were examined. First,the expression levels of GFP-tagged rainbow trout GRs in transiently transfected COS-7 cells were compared. Immunoblots showed single bands at expected sizes (Fig 3.1A)and GFP-tagged proteins were expressed at similar levels. Second, the functionalintegrity of both trout glucocorticoid receptor GFP fusion proteins were examinedusing transactivation assays. Both trout GRs induced transactivation of MMTV-Lucreporter gene and the two chimeras possessed the same sensitivity and followed thesame kinetics of induction than known for the wild type receptors (Figure 3.1 B).
After verifying the proper function of both trout GRs, I quantified trout GR locali-sation by confocal laser scanning microscopy. I observed that the majority of COS-7cells transfected with GFP-rGRC656G and without hormone treatment (termed naıve)showed a predominantly cytoplasmic receptor distribution (C > N 64 % ± 7 %) withthe remaining cells showing an about equal distribution of fluorescence between thecytoplasm and nucleus (N = C 36 % ± 7 %; Figure 3.2 A). A comparable distributionpattern for wildtype GFP- tagged rGRC656G using this transfection technique has beendescribed (N > C 28 % ± 9 %; C = N 18 % ± 3 %; Savory et al., 1999). This patterndiffers greatly from that observed for the trout receptors. About half of the naıveGFP-rtGR1 expressed in COS-7 cells was equally distributed between the nucleus andcytoplasm (C = N 51 % ± 2 %). The other half was predominantly located in the nu-cleus (N > C 48 % ± 1 %; Figure 3.2 B) and when expressed in RTG-2 cells GFP-rtGR1was mainly equally distributed between cytoplasm and nucleus (C = N 88 % ± 8 %;
29

Results
Figure 3.1: Characterisation of expression levels and function of the GFP-tagged rtGR1and rtGR2. (A) Western Blot analysis of the levels of transiently transfected GFP-tagged troutglucocorticoid receptors. Specific bands were stained using anti-GFP antibody JL-8. Pictureshown by courtesy of Dr. Armin Sturm (B) Transcriptional activation of MMTV-luciferase reportergene in COS-7 cells co-transfected with either rtGR1 (filled square), GFP-rtGR1 (open square),rtGR2 (filled triangle) or GFP-rtGR2 (open triangle) expression vectors, as well as pSVβ plasmid.Luciferase activity was measured 24 h following treatment with varying concentrations of cortisol.Transactivation activity was normalized to the internal β-galactosidase control, and expressed asa percent of the respective construct activity measured in the presence of 10 µM cortisol. Valuesrepresent means ± S.E.M. of three independent experiments, with each experiment performedin duplicates.
Figure 3.2: Subcellular localisation of GFP-tagged rtGR1, rtGR2, and rat GRC656G
before and after a 30 min treatment with 1 µM cortisol. GFP-tagged receptors were transientlytransfected in (A) COS-7 and (B) RTG-2 cells using Lipofectamine 2000. Localisation wasdetermined by fluorescence microscopy. All quantifications are compilations of at least threeindependent experiments. Error bars indicate means ± S.E.M. Representative micrographs areshown beneath each data set. N, nucleus; C, cytoplasm.
30
Results
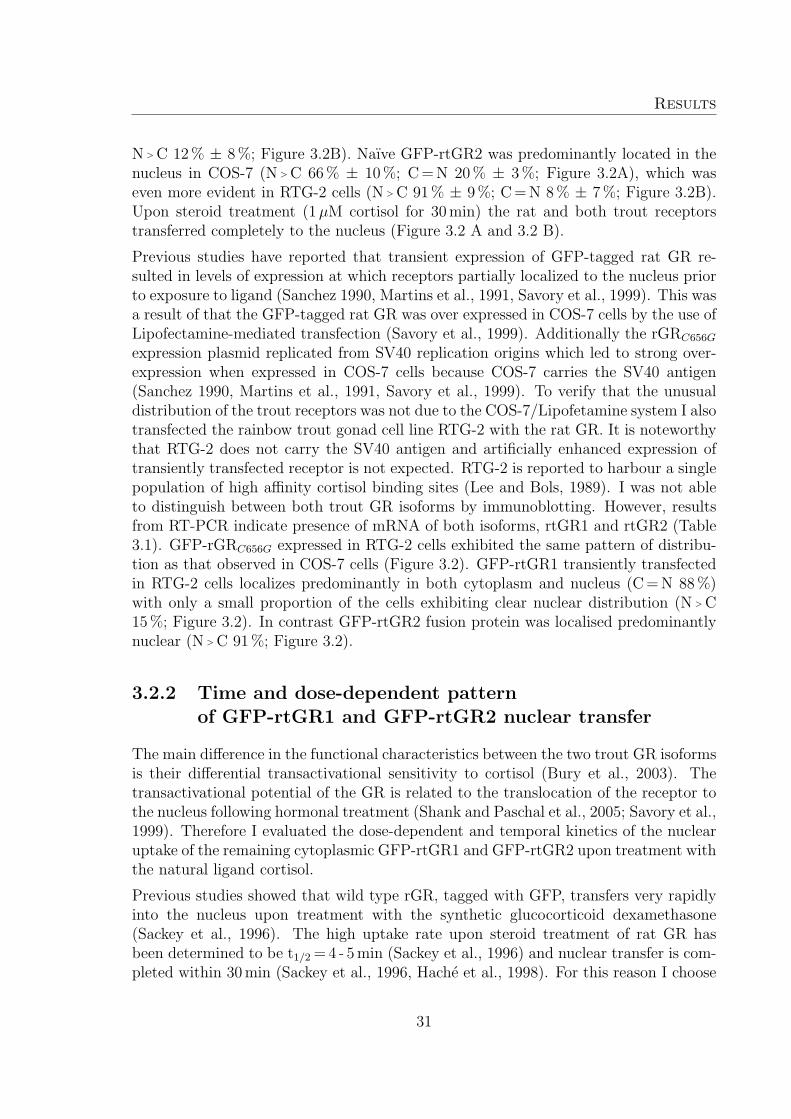
N > C 12 % ± 8 %; Figure 3.2B). Naıve GFP-rtGR2 was predominantly located in thenucleus in COS-7 (N > C 66 % ± 10 %; C = N 20 % ± 3 %; Figure 3.2A), which waseven more evident in RTG-2 cells (N > C 91 % ± 9 %; C = N 8 % ± 7 %; Figure 3.2B).Upon steroid treatment (1 µM cortisol for 30 min) the rat and both trout receptorstransferred completely to the nucleus (Figure 3.2 A and 3.2 B).
Previous studies have reported that transient expression of GFP-tagged rat GR re-sulted in levels of expression at which receptors partially localized to the nucleus priorto exposure to ligand (Sanchez 1990, Martins et al., 1991, Savory et al., 1999). This wasa result of that the GFP-tagged rat GR was over expressed in COS-7 cells by the use ofLipofectamine-mediated transfection (Savory et al., 1999). Additionally the rGRC656G
expression plasmid replicated from SV40 replication origins which led to strong over-expression when expressed in COS-7 cells because COS-7 carries the SV40 antigen(Sanchez 1990, Martins et al., 1991, Savory et al., 1999). To verify that the unusualdistribution of the trout receptors was not due to the COS-7/Lipofetamine system I alsotransfected the rainbow trout gonad cell line RTG-2 with the rat GR. It is noteworthythat RTG-2 does not carry the SV40 antigen and artificially enhanced expression oftransiently transfected receptor is not expected. RTG-2 is reported to harbour a singlepopulation of high affinity cortisol binding sites (Lee and Bols, 1989). I was not ableto distinguish between both trout GR isoforms by immunoblotting. However, resultsfrom RT-PCR indicate presence of mRNA of both isoforms, rtGR1 and rtGR2 (Table3.1). GFP-rGRC656G expressed in RTG-2 cells exhibited the same pattern of distribu-tion as that observed in COS-7 cells (Figure 3.2). GFP-rtGR1 transiently transfectedin RTG-2 cells localizes predominantly in both cytoplasm and nucleus (C = N 88 %)with only a small proportion of the cells exhibiting clear nuclear distribution (N > C15 %; Figure 3.2). In contrast GFP-rtGR2 fusion protein was localised predominantlynuclear (N > C 91 %; Figure 3.2).
3.2.2 Time and dose-dependent patternof GFP-rtGR1 and GFP-rtGR2 nuclear transfer
The main difference in the functional characteristics between the two trout GR isoformsis their differential transactivational sensitivity to cortisol (Bury et al., 2003). Thetransactivational potential of the GR is related to the translocation of the receptor tothe nucleus following hormonal treatment (Shank and Paschal et al., 2005; Savory et al.,1999). Therefore I evaluated the dose-dependent and temporal kinetics of the nuclearuptake of the remaining cytoplasmic GFP-rtGR1 and GFP-rtGR2 upon treatment withthe natural ligand cortisol.
Previous studies showed that wild type rGR, tagged with GFP, transfers very rapidlyinto the nucleus upon treatment with the synthetic glucocorticoid dexamethasone(Sackey et al., 1996). The high uptake rate upon steroid treatment of rat GR hasbeen determined to be t1/2 = 4 - 5 min (Sackey et al., 1996) and nuclear transfer is com-pleted within 30 min (Sackey et al., 1996, Hache et al., 1998). For this reason I choose
31

Results
an observation time of 30 min for studying the nuclear translocation of trout GRs. Toprovide a clear representation of the results, the percentage of cells with totally nuclearGFP-GR [N] or mostly nuclear GFP-GR [N > C] are displayed.
Nuclear translocation of the remaining cytoplasmatic GFP-rtGR1, transiently expressedin COS-7 cells, occurred in a dose dependent manner in the concentration range of cor-tisol (1 nM to 1 µM) (Figure 3.3 A). Complete nuclear transfer occurred after 5 min inthe presence of 1 µM cortisol, whereas treatment with 1 nM cortisol resulted in only60 % of the cells exhibiting GFP-rtGR1 fluorescence signal in the nucleus after 30 minof treatment (Figure 3.3 A). The remaining cytoplasmic GFP-rtGR2 fusion proteins,expressed in COS-7, transferred more efficiently from the cytoplasm to the nucleus atlow cortisol concentrations compared to GFP-rtGR1 translocation (Figure 3.3 B), and1 nM cortisol induced nuclear transfer with the same efficiency as 1 µM, with nucleartransfer being completed within 5 min upon hormone addition (Figure 3.3 B). Similarresults are seen when expressed as the % of cells with a complete nuclear expression [N].Again, rtGR2 nuclear transfer at 1 nM cortisol was very efficient compared to rtGR1(Figure 3.3).
32

Results
Figure 3.3: Kinetics of (A) GFP-rtR1 and (B) GFP-rtGR2 nuclear transfer transientlyexpressed in COS-7. Cells were transiently transfected in medium without steroid supplementusing Lipofectamine 2000, and cultured for another 16 h in serum free medium prior to transferstudies. Image acquisition was performed in a temperature-controlled chamber at 37◦C. Nucleartransfer of the receptors was induced upon addition of 1 µM (filled square), 100 nM (triangleup), 10 nM (triangle down), 1 nM (diamond), 100 pM (dot) cortisol, and the solvent ethanol(open square). For 30 min, changes in subcellular distribution were evaluated by confocal laserscanning microscopy. Of each time point analysed, an average of 20 - 80 cells were quantifiedfor the cellular localisation of the receptor. Each data point represents a compilation of threeindependent experiments. N, nucleus; C, cytoplasm.
In RTG-2, transiently transfected with GFP-rtGR1, a similar dose dependent translo-cation of GFP-rtGR1 was observed (Figure 3.4 A). However, there appeared to be adifference between the two cell lines, with the nuclear localisation response to cortisolbeing less sensitive in the rainbow trout gonad cell line. No response to cortisol wasseen in transfected RTG-2 cells at 1 nM cortisol which was in contrast to findings inCOS-7. One explanation could be that the RTG-2 cells possess an endogenous GRpopulation, as described by Lee and Bols (1989), which masks the answer of the GFP-tagged receptors. RTG-2 cells transfected with GFP-rtGR2 showed a mostly nucleardistribution in the absence of hormone (N > C 91 %; Figure 3.4B). On addition of hor-mone, a greater proportion of cells demonstrated complete nuclear distribution. Thistemporal pattern of complete nuclear localisation was dose dependent with concentra-tions above 10 nM cortisol causing 85 - 100 % nuclear distribution by 15 min of exposure(Figure 3.4 B).
33

Results
Figure 3.4: Kinetics of (A) GFP-rtGR1 and (B) GFP-rtGR2 nuclear transfer transientlyexpressed in RTG-2 cells. Cells were transiently transfected in medium without steroid sup-plement using Lipofectamine 2000, and cultured for another 16 h in serum-free medium prior totransfer studies. Image acquisition was performed at room temperature. Nuclear transfer of thereceptors was induced upon addition of 1 µM (filled square), 100 nM (triangle up), 10 nM (trian-gle down), 1 nM (diamond), 100 pM (dot) cortisol, and the solvent ethanol (open square). For30 min, changes in subcellular distribution were evaluated by confocal laser scanning microscopy.For each time point analysed, an average of 20 - 80 cells were quantified for the cellular localisationof the receptor. Each data point represents a compilation of three independent experiments.N,nucleus; C, cytoplasm
3.2.3 Ligand specificity of GFP-rtGR1 and GFP-rtGR2
In addition to cortisol, I employed treatment with dexamethasone, RU486, aldosterone,and progesterone to examine ligand specificity of GFPrtGR1 and GFP-rtGR2 tran-siently expressed in COS-7 cells (Figure 3.5) and RTG-2 cells (Figure 3.6). The syn-thetic glucocorticoid dexamethasone is a very potent inducer of nuclear transfer ofGFP-rtGR1 and GFP-rtGR2 expressed in both cell lines. Progesterone, a weak ag-onist of the mammalian GR (Htun et al., 1995), did not induce nuclear transfer ofGFP-rtGR1 in COS-7 but was able to induce nuclear import of GFP-rtGR2 with adelay of 15 min and only 50 % of the cells exhibiting the receptor in the nucleus af-ter 30 min. Aldosterone, the natural ligand of the mineralocorticoid receptor did notinduce GFP-rtGR1 nuclear transfer but induced very efficiently the transfer of GFP-rtGR2 into the nucleus. The synthetic steroid RU486 induced slower initial nuclear
34

Results
transfer of GFP-rtGR1. In contrast, GFP- rtGR2 nuclear transfer was induced veryefficiently, possessing dynamic rates comparable to cytoplasmic-nuclear transport ofGFP-rtGR1 induced by 1 µM cortisol. These results suggest that rtGR2 nuclear trans-fer is stimulated more efficiently than that of rtGR1 by other natural corticosteroidsand progestins as well as synthetic glucocorticoids and the mammalian GR antagonistRU486.
Figure 3.5: Ligand specificity of (A) GFP-rtGR1 and (B) GFP-rtGR2 transiently ex-pressed in COS-7. Cells were transiently transfected in medium without serum and culturedfor additional 16 h in steroid-free medium and then treated with 1 µM cortisol (filled square),1 µM dexamethason (triangle up), 10 µM RU486 (triangle down), 1 µM aldosteron (dot), and1 µM progesterone (open square). Image acquisition was performed in a temperature-controlledchamber at 37◦C. For 30 min, changes in subcellular distribution were evaluated by confocal laserscanning microscopy. For each time point analysed, an average of 20 - 80 cells were quantifiedfor the cellular localisation of the receptor. Each data point represents a compilation of threeindependent experiments.N, nucleus; C, cytoplasm.
35

Results
Figure 3.6: Ligand specifity of (A) GFP-rtGR1 and (B) GFP-rtGR2 transiently ex-pressed in RTG-2. Cells were transiently transfected in medium without serum and cultured foradditional 16 h in steroid-free medium and then treated with 1 µM cortisol (filled square), 1 µMdexamethason (triangle up), 10 µM RU486 (triangle down), 1 µM aldosteron (dot), and 1 µMprogesterone (open square). Image acquisition was performed at room temperature. For 30 minchanges in subcellular distribution were evaluated by confocal laser scanning microscopy. For eachtime point analysed, an average of 20 - 80 cells were quantified for the cellular localisation of thereceptor. Each data point represents a compilation of three independent experiments.N, nucleus;C, cytoplasm.
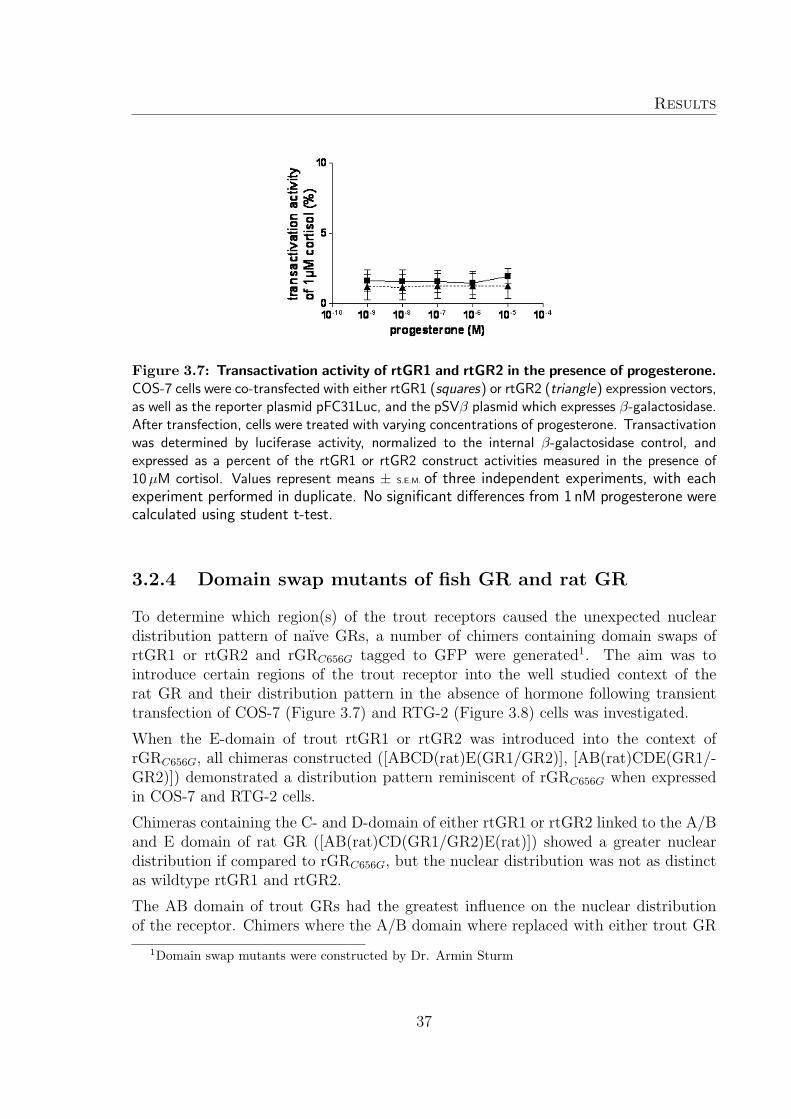
Because the potential of progesterone to activate rainbow trout GR-mediated tran-scription had not been described, I tested progesterone in transactivation assays. Pro-gesterone was unable to induce transactivation activity for of rtGRs (Figure 3.7).
36
Results
Figure 3.7: Transactivation activity of rtGR1 and rtGR2 in the presence of progesterone.COS-7 cells were co-transfected with either rtGR1 (squares) or rtGR2 (triangle) expression vectors,as well as the reporter plasmid pFC31Luc, and the pSVβ plasmid which expresses β-galactosidase.After transfection, cells were treated with varying concentrations of progesterone. Transactivationwas determined by luciferase activity, normalized to the internal β-galactosidase control, andexpressed as a percent of the rtGR1 or rtGR2 construct activities measured in the presence of10 µM cortisol. Values represent means ± S.E.M. of three independent experiments, with eachexperiment performed in duplicate. No significant differences from 1 nM progesterone werecalculated using student t-test.
3.2.4 Domain swap mutants of fish GR and rat GR
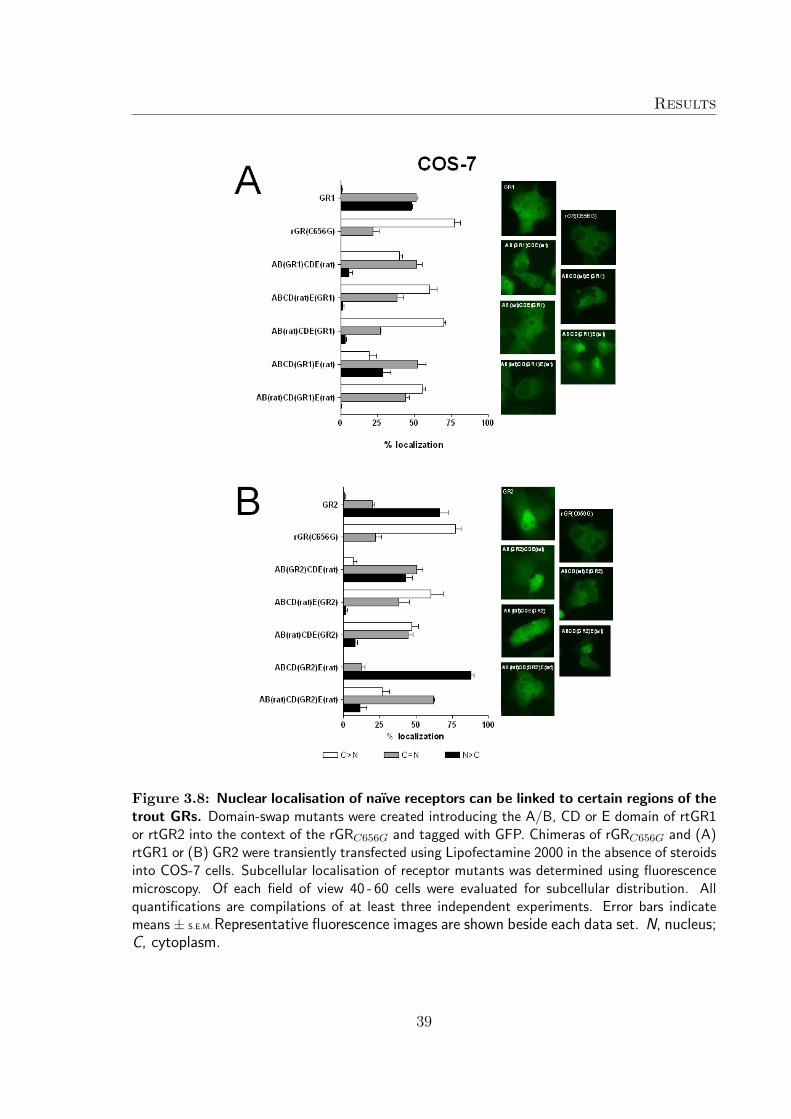
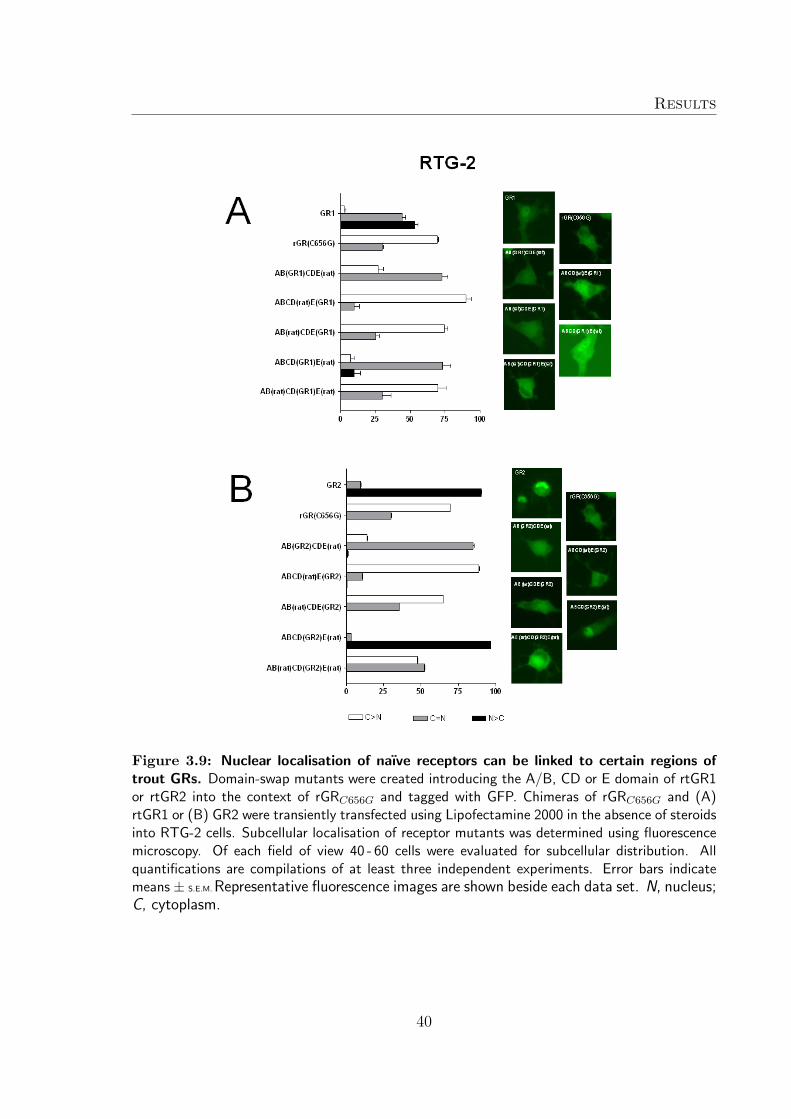
To determine which region(s) of the trout receptors caused the unexpected nucleardistribution pattern of naıve GRs, a number of chimers containing domain swaps ofrtGR1 or rtGR2 and rGRC656G tagged to GFP were generated1. The aim was tointroduce certain regions of the trout receptor into the well studied context of therat GR and their distribution pattern in the absence of hormone following transienttransfection of COS-7 (Figure 3.7) and RTG-2 (Figure 3.8) cells was investigated.
When the E-domain of trout rtGR1 or rtGR2 was introduced into the context ofrGRC656G, all chimeras constructed ([ABCD(rat)E(GR1/GR2)], [AB(rat)CDE(GR1/-GR2)]) demonstrated a distribution pattern reminiscent of rGRC656G when expressedin COS-7 and RTG-2 cells.
Chimeras containing the C- and D-domain of either rtGR1 or rtGR2 linked to the A/Band E domain of rat GR ([AB(rat)CD(GR1/GR2)E(rat)]) showed a greater nucleardistribution if compared to rGRC656G, but the nuclear distribution was not as distinctas wildtype rtGR1 and rtGR2.
The AB domain of trout GRs had the greatest influence on the nuclear distributionof the receptor. Chimers where the A/B domain where replaced with either trout GR
1Domain swap mutants were constructed by Dr. Armin Sturm
37

Results
A/B domain ([AB(GR1/GR2)CDE(rat)]) were found to be shifted towards the nucleardistribution in the absence of hormone in COS-7 and RTG-2 cells.
However, the chimeric constructs that mimicked the wildtype rtGR distribution patterncontained both the A/B-, as well as the C- and D-domains ([ABCD(GR1/GR2)E(rat)])suggesting a degree of co-operation between the A/B-domain and C- and D-domain isneeded to determine nuclear location of the naıve trout GR.
38
Results
Figure 3.8: Nuclear localisation of naıve receptors can be linked to certain regions of thetrout GRs. Domain-swap mutants were created introducing the A/B, CD or E domain of rtGR1or rtGR2 into the context of the rGRC656G and tagged with GFP. Chimeras of rGRC656G and (A)rtGR1 or (B) GR2 were transiently transfected using Lipofectamine 2000 in the absence of steroidsinto COS-7 cells. Subcellular localisation of receptor mutants was determined using fluorescencemicroscopy. Of each field of view 40 - 60 cells were evaluated for subcellular distribution. Allquantifications are compilations of at least three independent experiments. Error bars indicatemeans ± S.E.M. Representative fluorescence images are shown beside each data set. N, nucleus;C, cytoplasm.
39
Results
Figure 3.9: Nuclear localisation of naıve receptors can be linked to certain regions oftrout GRs. Domain-swap mutants were created introducing the A/B, CD or E domain of rtGR1or rtGR2 into the context of rGRC656G and tagged with GFP. Chimeras of rGRC656G and (A)rtGR1 or (B) GR2 were transiently transfected using Lipofectamine 2000 in the absence of steroidsinto RTG-2 cells. Subcellular localisation of receptor mutants was determined using fluorescencemicroscopy. Of each field of view 40 - 60 cells were evaluated for subcellular distribution. Allquantifications are compilations of at least three independent experiments. Error bars indicatemeans ± S.E.M. Representative fluorescence images are shown beside each data set. N, nucleus;C, cytoplasm.
40

Results
3.3 Toxicological analysis
of fish glucocorticoid receptors
3.3.1 Screening for environmental contaminantsimpairing rtGR1 and rtGR2 action
After detailed description of subcellular localisation of naıve trout GRs and determiningtemporal and dose dependent pattern of nuclear transfer, I evaluated the possibility ofenvironmental contaminants to impair the function of trout GRs in vitro.
A broad set of contaminants found in the aquatic environment, representing model sub-stances of the different classes of environmental pollutants, were investigated. PCB126and TCDD, the metals copper, cadmium, and nickel, as well as the benzo[a]pyreneand the pharmaceuticals, diclofenac, metoprolol, clofibric acid and carbamazepin havebeen included in the investigations. Hydrogen peroxide (H2O2) was used as a positivecontrol for impact on fish GR because of the known impairment of human GR nucleartranslocation (Okamoto et al., 1999). All substances were screened first to select pol-lutants with a high impact on trout GR function. Results are summarized in Table3.2. Concentrations used of the respective substance are summarized in Table 2.5.
Table 3.2: Impact of xenobiotics on rtGR1 and rtGR2 actioncontaminant Nuclear import Transactivation
rtGR1 rtGR2 rtGR1 rtGR2H2O2 ⇓ ⇓ ⇓ ⇓
PCB126 - - - -TCDD - - - -BaP - - n.d. n.d.
metals Copper ⇓ ⇓ - -Cadmium ⇓ ⇓ ⇓ ⇓Nickel n.d. n.d. - -
Pharmaceuticals Diclofenac ⇓ ⇓ ⇓ ⇓Metoprolol n.d. n.d. - -Clofibric acid n.d. n.d. - -Carbamazepin n.d. n.d. - -
Nonylphenol ⇑ ⇑ ⇑ ⇑(-) no change compared to control; (⇑) induction;(⇓) repression; (n.d.) not determined
41

Results
Of all substances tested, diclofenac, copper, cadmium, nonylphenol and, as expected,the positive control H2O2 had a clear impact on trout GR transactivation activity.These contaminants were studied in more detail for their impact on three levels ofGR action. First the potency of the selected contaminants to alter the subcellularlocalisation was investigated. Second, I observed the impact of the selected pollutantsto interfere with the nuclear import kinetics. Third, how selected contaminants impairthe level of transactivation of target genes.
Using the previously described reporter gene assay for testing transactivation of targetgenes by rtGR1 and rtGR2, this experimental setup was used for the first time toinvestigate pollutants and their impact on transactivation activity of both trout GRs.Transactivation experiments were only carried out in COS-7 cells because the fish cellline RTG-2 proved not suitable to study transactivation, probably because of presenceof endogenous receptors (Lee and Bols, 1989 and this study).
3.3.2 Alteration of subcellular localisation of GFP-rtGR1 andGFP-rtGR2 by selected environmental contaminants inthe absence of cortisol
The potential of diclofenac, nonylphenol, copper, cadmium, as well as the positivecontrol hydrogen peroxide (H2O2) to alter subcellular localisation of naıve rainbowtrout GRs was investigated. COS-7 cells were transiently transfected with either GFP-rtGR1 (Figure 3.10) or GFP-rtGR2 (Figure 3.11). The subcellular localization ofGFP tagged receptors was first described in 3 categories (C > N, C = N, N > C) as inthe studies on naıve and cortisol activated rtGRs (see left panel in Figure 3.10 and3.11). Additionally, the subcellular localization was described in 4 categories (C > N,C = N, N > C, N)for better representation of small changes in the nuclear localizationof naıve receptors (see right panels of Figure 3.10 and 3.11). As shown in Figure3.10, GFP-rtGR1 was partially but significantly shifted towards the nuclear componentafter incubation of the transfected cells for 24 h with high and low concentrations ofdiclofenac, the high concentration of copper and the high concentration of nonylphenol.The compounds cadmium and H2O2 had no influence on subcellular localisation ofunliganded receptor compared to control. GFP-rtGR2 was significantly shifted towardsthe nucleus after incubation with both concentrations of diclofenac and nonylphenol.Cadmium and copper had no influence on GFP-rtGR2 subcellular localisation (Figure3.11). In contrast to COS-7 expressing GFP-tagged rtGR1, cells expressing GFP-rtGR2 cells had detached after treatment with 0.5 µM H2O2 for 24 h, so that the effectof this compound on GFP-rtGR2 localisation could not be assessed in this cellularsystem (Figure 3.11).
42

Results
Figure 3.10: Influence of environmental contaminants on GFP-rtGR1 subcellular local-isation in the absence of cortisol. Trout rtGR1 tagged with GFP was transiently transfectedusing Lipofectamine 2000 in the absence of steroids into COS-7. 16 h after transfection cellswere treated with contaminants for 24 h. Subcellular localisation of GFP-rtGR1 was determinedusing fluorescence microscopy. Of each field of view 40 - 60 cells were evaluated for subcellulardistribution. All quantifications are compilations of at least two independent experiments. Errorbars indicate means ± S.E.M. Asterisks indicate significant differences from control calculatedusing Chi-square test. Representative fluorescence images are shown beside each bar graphset. N, nucleus; C, cytoplasm; DF, diclofenac; NP, nonylphenol; Cd, cadmium; Cu, copper.
43

Results
Figure 3.11: Influence of environmental contaminants on GFP-rtGR2 subcellular local-isation in the absence of cortisol. Trout rtGR2 tagged with GFP was transiently transfectedusing Lipofectamine 2000 in the absence of steroids into COS-7. 16 h after transfection cellswere treated with contaminants for 24 h. Subcellular localisation of GFP-rtGR2 was determinedusing fluorescence microscopy. Of each field of view 40 - 60 cells were evaluated for subcellulardistribution. All quantifications are compilations of at least two independent experiments. Errorbars indicate means ± S.E.M. Asterisks indicate significant differences from control calculatedusing Chi-square test. Representative fluorescence images are shown beside each bar graphset. N, nucleus; C, cytoplasm; DF, diclofenac; NP, nonylphenol; Cd, cadmium; Cu, copper;n.q., not quantified.
3.3.3 Kinetics of GFP-rtGR1 and GFP-rtGR2 nuclear trans-fer in the presence by selected environmental contami-nants
I subsequently investigated the ability of diclofenac, nonylphenol, copper and cad-mium to interfere with ligand-dependent nuclear translocation of both rainbow troutglucocorticoid receptors. Figure 3.12 shows that GFP-rtGR1 nuclear transfer was en-hanced in the presence of the low concentration of diclofenac (Figure 3.12 A) as wellas both concentrations of nonylphenol (Figure 3.12 B). Both concentrations of copperimpaired nuclear translocation of GFP-rtGR1 (Figure 3.12 C). However, 30 min aftercortisol addition a similar number of cells expressed the GFP-tagged receptor in thenucleus compared to control cells. Cadmium had no effect on nuclear translocation of
44

Results
GFP-rtGR1 (Figure 3.12 D). Ligand-dependent nuclear translocation of GFP-rtGR1was markedly delayed upon the addition of H2O2 (Figure 3.12 D).
Figure 3.12: Kinetics of GFP-rtGR1 nuclear transfer is altered in the presence of contam-inants. Cells were transiently transfected with GFP-rtGR1 in medium without steroid supplementusing Lipofectamine 2000, and cultured for another 16 h in medium without serum supplement.Cells were then treated for 24 h with (A) diclofenac, (B) nonylphenol (C) copper, and (D) cad-mium and H2O2. Image acquisition was performed in a temperature-controlled chamber at 37◦C.Nuclear transfer of the receptors was induced upon addition of 1 µM cortisol at t = 0. For 30 min,changes in subcellular distribution were evaluated by fluorescence microscopy. At each time pointanalysed, an average of 20 - 80 cells were quantified for the cellular localisation of the receptor.The percentage of the cells with complete nuclear localisation are displayed. All quantificationsare compilations of at least two independent experiments. Error bars indicate means ± S.E.M.
Statistical differences were calculated using Kolmogorov-Smirnov test but did not yieldedsignificant differences DF, diclofenac; NP, nonylphenol. DF, diclofenac; NP, nonylphenol;Cd, cadmium; Cu, copper.
GFP-rtGR2 nuclear import rate was increased in the presence of the high concentra-tion of diclofenac (Figure 3.13 A). The low concentration of nonylphenol significantlyincreased the amount of cells showing a completely nuclear localisation of fluorescencealready before cortisol was added (Figure 3.13 B). The low concentration of copper(Figure 3.13 C) and cadmium (Figure 3.13 D) significantly decreased the import effi-ciency of GFP-rtGR2. Nuclear translocation of GFP-rtGR2 in the presence of H2O2
could not be observed because cells were detached after treatment with H2O2 for 24 h.
45

Results
Figure 3.13: Kinetics of GFP-rtGR2 nuclear transfer is altered in the presence of contam-inants. Cells were transiently transfected with GFP-rtGR2 in medium without steroid supplementusing Lipofectamine 2000, and cultured for another 16 h in medium without serum supplement.Cells were then treated for 24 h with (A) diclofenac, (B) nonylphenol (C) copper, and (D) cad-mium, and H2O2. Image acquisition was performed in a temperature-controlled chamber at 37◦C.Nuclear transfer of the receptors was induced upon addition of 1 µM cortisol at t = 0. For 30 min,changes in subcellular distribution were evaluated by fluorescence microscopy. At each time pointanalysed, an average of 20 - 80 cells were quantified for the cellular localisation of the receptor.The percentage of the cells with complete nuclear localisation are displayed. All quantifications arecompilations of at least two independent experiments. Error bars indicate means ± S.E.M. Asteriskin the legend indicate exposure conditions that led to significant differences from the controlcurve calculated using the Kolmogorov-Smirnof Test. DF, diclofenac; NP, nonylphenol; Cd,cadmium; Cu, copper.
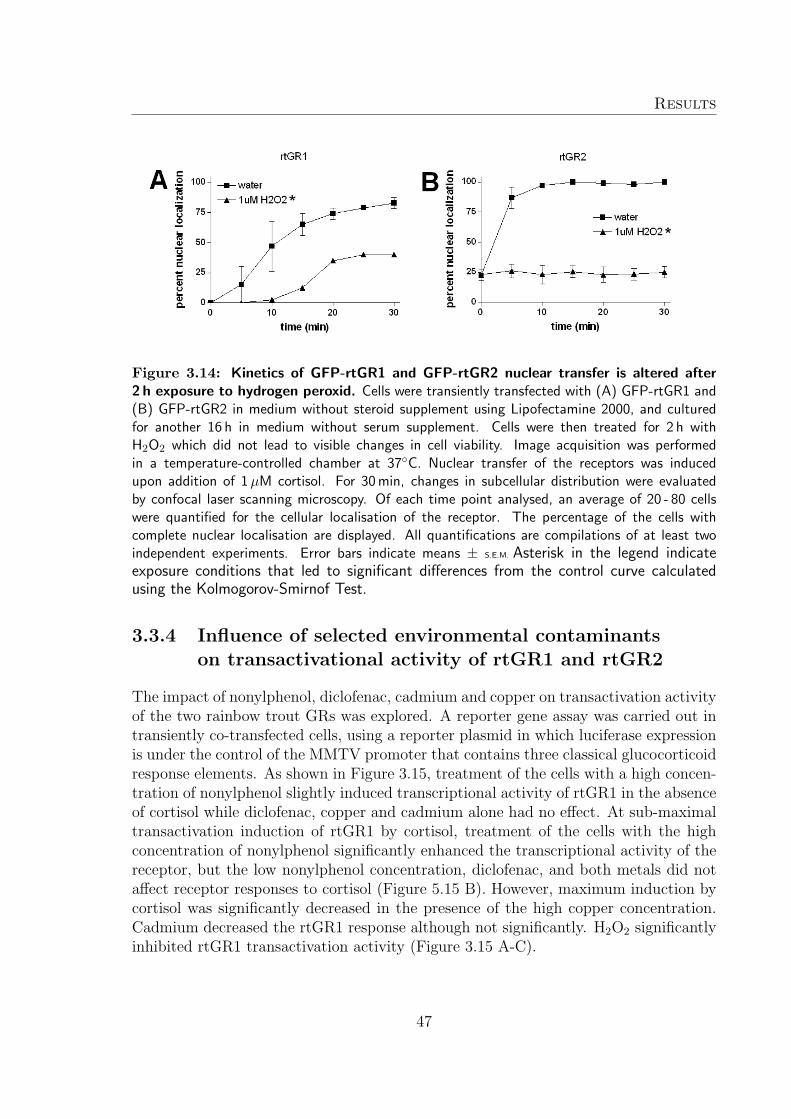
Okamoto observed that human GR, when treated with H2O2 for 2 h, decreases importrates due to inhibition of certain cystein residues within the receptor. To compare theresults directly to the findings of Okamoto (1999), transfected COS-7 cells, expressingthe GFP-tagged receptors, were treated for only 2 h with H2O2. Interestingly, H2O2
significantly decreased nuclear transfer of GFP-rtGR1 and 30 min after addition ofcortisol less than 50 % of the cells showed a predominantly nuclear signal (Figure 3.14A). GFP-rtGR2 nuclear translocation was completely abolished in the presence of H2O2
(Figure 3.14 B).
46
Results
Figure 3.14: Kinetics of GFP-rtGR1 and GFP-rtGR2 nuclear transfer is altered after2 h exposure to hydrogen peroxid. Cells were transiently transfected with (A) GFP-rtGR1 and(B) GFP-rtGR2 in medium without steroid supplement using Lipofectamine 2000, and culturedfor another 16 h in medium without serum supplement. Cells were then treated for 2 h withH2O2 which did not lead to visible changes in cell viability. Image acquisition was performedin a temperature-controlled chamber at 37◦C. Nuclear transfer of the receptors was inducedupon addition of 1 µM cortisol. For 30 min, changes in subcellular distribution were evaluatedby confocal laser scanning microscopy. Of each time point analysed, an average of 20 - 80 cellswere quantified for the cellular localisation of the receptor. The percentage of the cells withcomplete nuclear localisation are displayed. All quantifications are compilations of at least twoindependent experiments. Error bars indicate means ± S.E.M. Asterisk in the legend indicateexposure conditions that led to significant differences from the control curve calculatedusing the Kolmogorov-Smirnof Test.
3.3.4 Influence of selected environmental contaminantson transactivational activity of rtGR1 and rtGR2
The impact of nonylphenol, diclofenac, cadmium and copper on transactivation activityof the two rainbow trout GRs was explored. A reporter gene assay was carried out intransiently co-transfected cells, using a reporter plasmid in which luciferase expressionis under the control of the MMTV promoter that contains three classical glucocorticoidresponse elements. As shown in Figure 3.15, treatment of the cells with a high concen-tration of nonylphenol slightly induced transcriptional activity of rtGR1 in the absenceof cortisol while diclofenac, copper and cadmium alone had no effect. At sub-maximaltransactivation induction of rtGR1 by cortisol, treatment of the cells with the highconcentration of nonylphenol significantly enhanced the transcriptional activity of thereceptor, but the low nonylphenol concentration, diclofenac, and both metals did notaffect receptor responses to cortisol (Figure 5.15 B). However, maximum induction bycortisol was significantly decreased in the presence of the high copper concentration.Cadmium decreased the rtGR1 response although not significantly. H2O2 significantlyinhibited rtGR1 transactivation activity (Figure 3.15 A-C).
47
Results
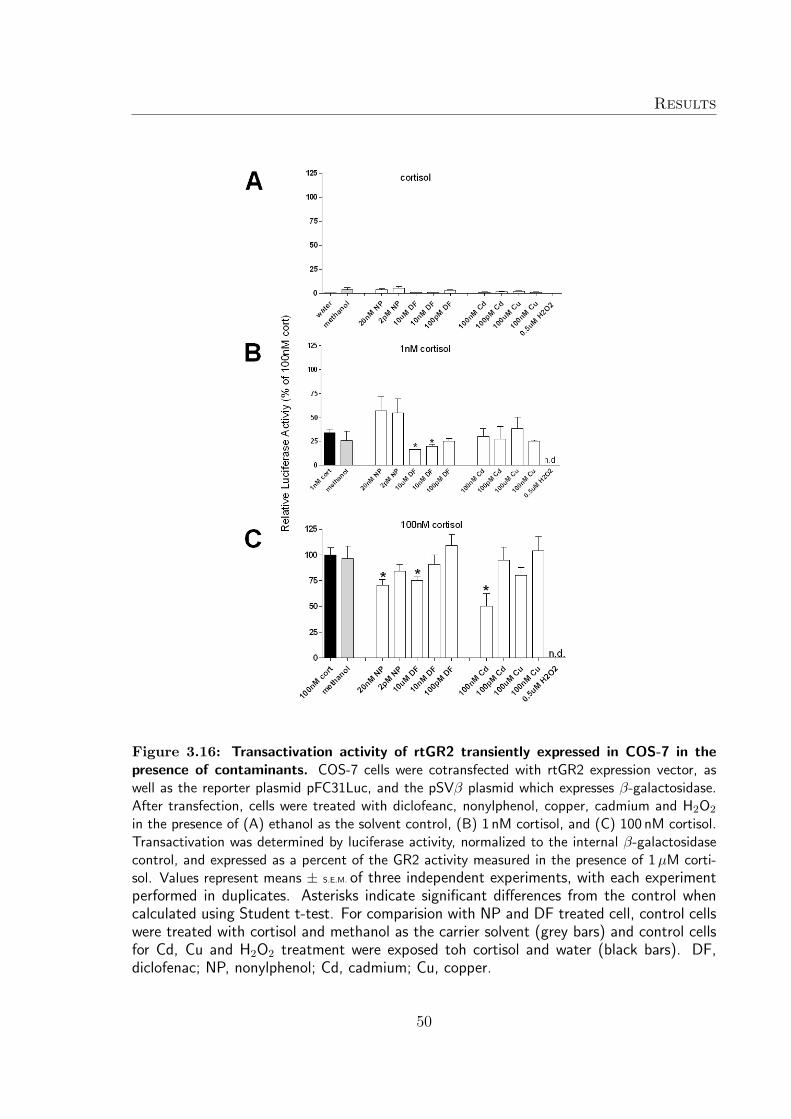
rtGR2 transactivational activity was induced by exposing transiently transfected cellsto the high concentration of nonylphenol and diclofenac for 24 h in the absence of cor-tisol (Figure 3.16 A). Copper and cadmium had no effect on transactivational activityof rtGR1 (Figure 3.16 A). At sub-maximal cortisol-induced transactivation activity ofrtGR2, both nonylphenol concentrations were able to enhance the receptor transac-tivation although not significantly (Figure 3.16 B). Further, in the presence of bothconcentrations of diclofenac, the transactivational activity of rtGR2 was significantlydecreased (Figure 14 B). In contrast, copper and cadmium did not alter cortisol medi-ated activity of rtGR2 (Figure 3.16 B). The maximal receptor activity of rtGR2 wasmore vulnerable and significant reduction of transactivational activity was observed inthe presence of high concentrations of diclofenac, nonylphenol, copper, and cadmium(Figure 3.16 C). When cells were transfected with the rtGR2 coding plasmid, all cellshad detached after 24 h of exposure to H2O2 and transactivational activity was notquantified (Figure 3.16 A-C).
48

Results
Figure 3.15: Transactivation activity of rtGR1 transiently expressed in COS-7 in thepresence of contaminants. COS-7 cells were cotransfected with rtGR1 expression vector, aswell as the reporter plasmid pFC31Luc, and the pSVβ plasmid which expresses β-galactosidase.After transfection, cells were treated with diclofeanc, nonylphenol, copper, cadmium and H2O2
in the presence of (A) ethanol as the solvent control, (B) 30 nM cortisol, and (C) 1 µM cortisol.Transactivation was determined by luciferase activity, normalized to the internal β-galactosidasecontrol, and expressed as a percent of the GR1 activity measured in the presence of 1 µM corti-sol. Values represent means ± S.E.M. of three independent experiments, with each experimentperformed in duplicates. Asterisks indicate significant differences from the control whencalculated using Student t-test. For comparision with NP and DF treated cell, control cellswere treated with cortisol and methanol as the carrier solvent (grey bars) and control cellsfor Cd, Cu and H2O2 treatment were exposed toh cortisol and water (black bars). DF,diclofenac; NP, nonylphenol; Cd, cadmium; Cu, copper.
49
Results
Figure 3.16: Transactivation activity of rtGR2 transiently expressed in COS-7 in thepresence of contaminants. COS-7 cells were cotransfected with rtGR2 expression vector, aswell as the reporter plasmid pFC31Luc, and the pSVβ plasmid which expresses β-galactosidase.After transfection, cells were treated with diclofeanc, nonylphenol, copper, cadmium and H2O2
in the presence of (A) ethanol as the solvent control, (B) 1 nM cortisol, and (C) 100 nM cortisol.Transactivation was determined by luciferase activity, normalized to the internal β-galactosidasecontrol, and expressed as a percent of the GR2 activity measured in the presence of 1 µM corti-sol. Values represent means ± S.E.M. of three independent experiments, with each experimentperformed in duplicates. Asterisks indicate significant differences from the control whencalculated using Student t-test. For comparision with NP and DF treated cell, control cellswere treated with cortisol and methanol as the carrier solvent (grey bars) and control cellsfor Cd, Cu and H2O2 treatment were exposed toh cortisol and water (black bars). DF,diclofenac; NP, nonylphenol; Cd, cadmium; Cu, copper.
50