results – sq ’10 investor presentation excel volume growth led by bars and surf excel matic...
TRANSCRIPT

Results – SQ ’10
October 26, 2010
Investor Presentation

SQ‘10 Results - Oct 26, 2010
Safe Harbour Statement
This Release / Communication, except for the historical information, may contain statements, including the words or phrases such as ‘expects, anticipates, intends, will, would, undertakes, aims, estimates, contemplates, seeks to, objective, goal, projects, should’ and similar expressions or variations of these expressions or negatives of these terms indicating future performance or results, financial or otherwise, which are forward looking statements. These forward looking statements are based on certain expectations, assumptions, anticipated developments and other factors which are not limited to, risk and uncertainties regarding fluctuations in earnings, market growth, intense competition and the pricing environment in the market, consumption level, ability to maintain and manage key customer relationship and supply chain sources and those factors which may affect our ability to implement business strategies successfully, namely changes in regulatory environments, political instability, change in international oil prices and input costs and new or changed priorities of the trade. The Company, therefore, cannot guarantee that the forward looking statements made herein shall be realized. The Company, based on changes as stated above, may alter, amend, modify or make necessary corrective changes in any manner to any such forward looking statement contained herein or make written or oral forward looking statements as may be required from time to time on the basis of subsequent developments and events. The Company does not undertake any obligation to update forward looking statements that may be made from time to time by or on behalf of the Company to reflect the events or circumstances after the date hereof.

SQ‘10 Results - Oct 26, 2010
Agenda
• Market Context
• SQ’10 Highlights
• Performance Review
• Category Overview
• SQ’10 – Financial Results
• Looking ahead
SQ‘10 Results - Oct 26, 2010
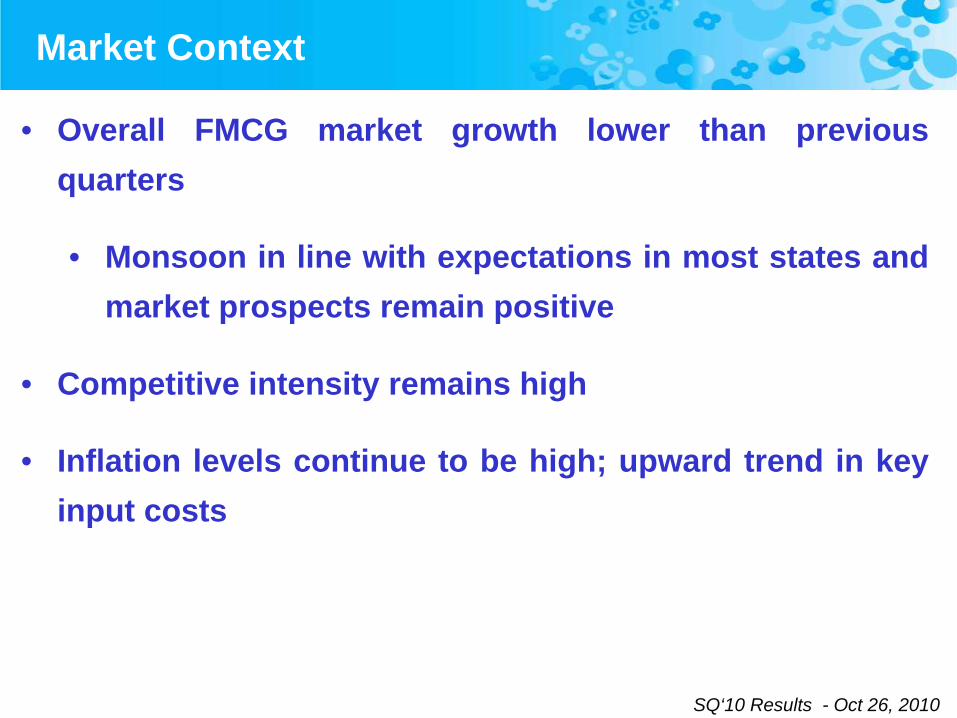
• Overall FMCG market growth lower than previous quarters
• Monsoon in line with expectations in most states and market prospects remain positive
• Competitive intensity remains high
• Inflation levels continue to be high; upward trend in key input costs
Market Context

SQ‘10 Results - Oct 26, 2010
• Strong 14% underlying volume growth in Domestic Consumer business
• Net Sales grows 11%; ahead of market
• Soaps & Detergents sustain robust volume growth
• Personal Products: 6th consecutive quarter of double digit growth
• Packaged Foods & Water continue strong growth momentum
• Actions to defend our leadership positions yielding positive results
• Strong momentum in emerging categories
SQ’10 Highlights

SQ‘10 Results - Oct 26, 2010
• Buying efficiencies and cost savings programmes partly offset input cost inflation and competitive pricing in Soaps & Detergents
• Gross Margin lower by 20 bps
• Step-up in Brand investment maintained
• A&P up 30 bps; Advertising spend up 90 bps
• Other expenses higher from step up in packaging moulds for innovations and higher volumes
• Operating Margins lower by 170 bps
• PAT (bei) Rs.534 crore, up 6.8%; Net Profit Rs. 566 crore, improves 32.1%
• Interim Dividend Rs.3 per share
SQ’10 Highlights

SQ‘10 Results - Oct 26, 2010
2%
11%14%
5%
11%
SQ'09 DQ'09 MQ'10 JQ'10 SQ'10
Accelerating volume growth momentum
Domestic Consumer Business (FMCG including Water) Underlying Volume Growth
SQ‘10 Results - Oct 26, 2010
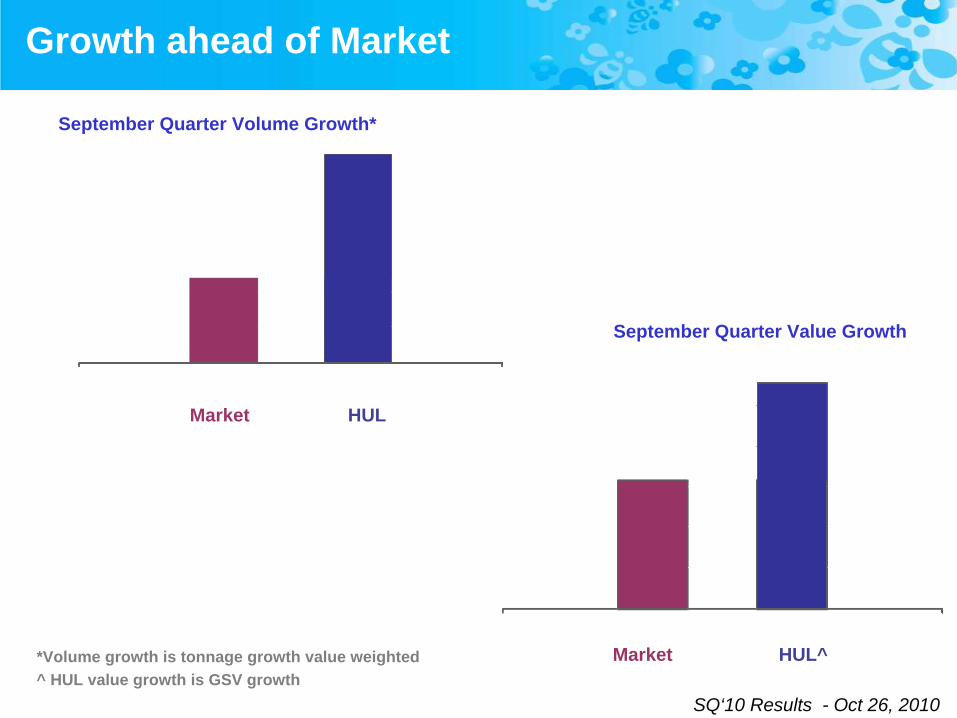
Growth ahead of Market
Market HUL
Market HUL^*Volume growth is tonnage growth value weighted^ HUL value growth is GSV growth
September Quarter Volume Growth*
September Quarter Value Growth

SQ‘10 Results - Oct 26, 2010
Strengthening the core: SQ’10 launches
Lux Sandal & Cream launch
Lifebuoy relaunch with “100% better protection from germs”
Vim relaunch “with extra power of Lime”
“OK” dish wash bar launch: Straddling portfolio at mass end
Vaseline Petroleum Jelly Relaunch with 2 new variants
Modern: Chapati & Kream Roll

SQ‘10 Results - Oct 26, 2010
Thrust to build emerging categories continues
Launch of Vaseline Moisturizing Cream
Lip Care: Launch of 2 new variants
Premium Skin Care: Lakme Perfect Radiance
Knorr Soupy Noodles: being rolled out nationally
Pureit Marvella: entry in to premium segment
Anti Aging: Age Miracle Serum

SQ‘10 Results - Oct 26, 2010
Competitive environment continues to be intense
Increased competitive intensity reflected in GRP trends
*FH’10 = JQ’09+SQ’09; SH’10 = DQ’09+MQ’10

SQ‘10 Results - Oct 26, 2010
13.5 14.1 14.515.7 13.8
2
5
11 1114
SQ'09 DQ'09 MQ'10 JQ'10 SQ'10
A&P % of sales UVG
%%
Continued Brand Building investment
Advertising Spend grew by 21%; 90 bps up

SQ‘10 Results - Oct 26, 2010
Inflationary trend in input costs
Indexed Chart average market prices (Source: Market Rate, Tea auction average). HUL buying cost may be different
CPO Benzene
100
121
144 146
158
2007 2008 2009 JQ'10 SQ'10
Tea
SQ‘10 Results - Oct 26, 2010
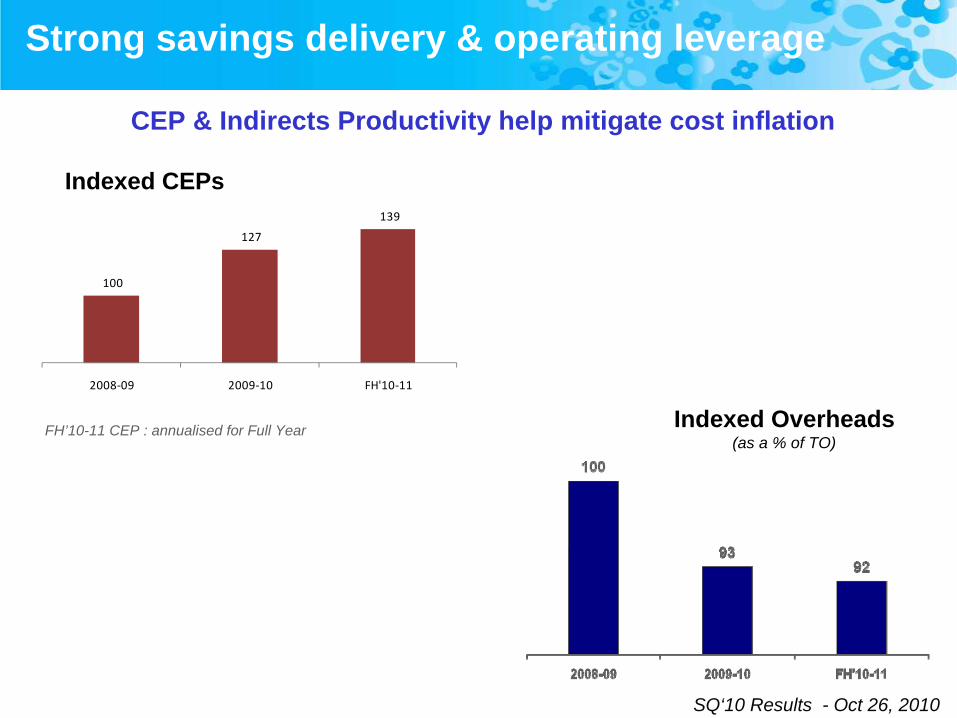
Indexed Overheads(as a % of TO)
Indexed CEPs
CEP & Indirects Productivity help mitigate cost inflation
Strong savings delivery & operating leverage
100
127
139
2008‐09 2009‐10 FH'10‐11
FH’10-11 CEP : annualised for Full Year
SQ‘10 Results - Oct 26, 2010
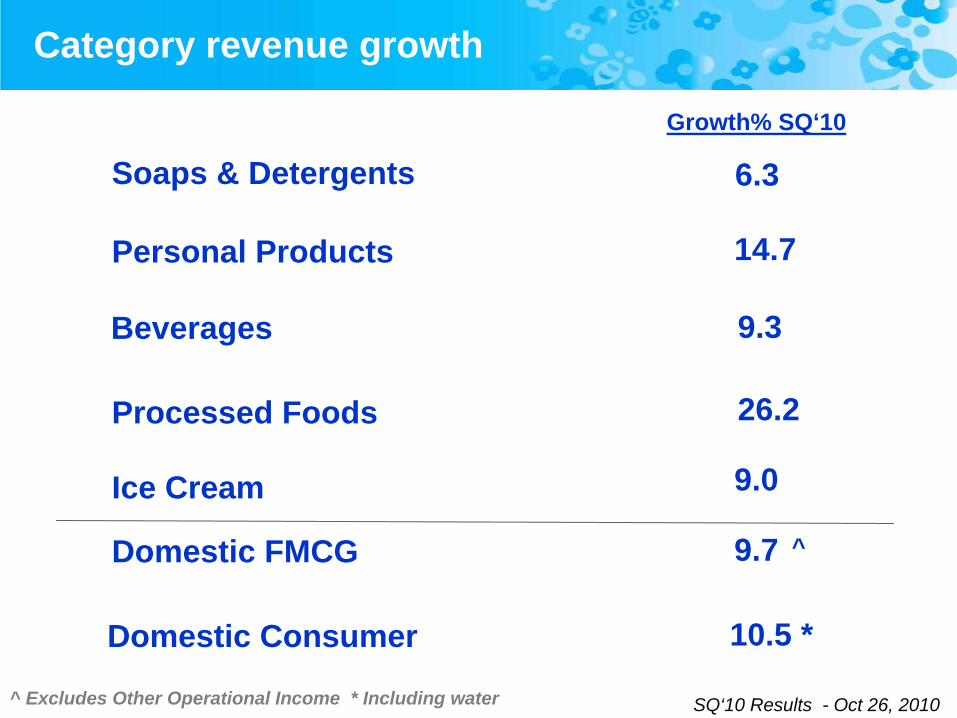
Soaps & Detergents
Personal Products
Ice Cream
Processed Foods
Beverages
6.3
14.7
9.3
9.0
26.2
Domestic FMCG 9.7
Category revenue growth
Growth% SQ‘10
^
^ Excludes Other Operational Income * Including water
Domestic Consumer 10.5 *

SQ‘10 Results - Oct 26, 2010
• Growth ahead of market - in value and volume
• Surf Excel volume growth led by bars and Surf Excel Matic powder
• Rin delivers double digit growth post relaunch
• Wheel Powder volumes grow ahead of segment growth
• Comfort fabric conditioner is national and growing rapidly
Laundry: Strengthened leadership position
Market Growth Source: AC Nielsen

SQ‘10 Results - Oct 26, 2010
FH'09‐10 SH'09‐10 FH'10‐11FH'09‐10 SH'09‐10 FH'10‐11
FH'09-10 SH'09-10 FH'10-11Volume Growth Value Growth
HUL Market
Volume growth across BrandsGrowth ahead of market
Consistent volume growth in Powders
Market Growth Source: AC Nielsen *FH =JQ+SQ; *SH=DQ+MQ
Bars: Accelerating volume growth
Laundry: Competitive growth momentum
Charts depict indexed volume

SQ‘10 Results - Oct 26, 2010
• Personal wash delivered strong growth, ahead of market
• Value and volume
• Across all segments
• Lux records double digit growth
• New variants performing well; Lux Sandal & Cream launched
• Strong growth in fast growing Premium segment
• Dove Rs.20 price pack driving consumption; Launch of Fresh Moisture variant
• Pears growing in double digit – No.1 Brand in Modern Trade
• Lifebuoy Franchise strengthened:
• Relaunch with Active 5: “100% better germ protection”
• Expanded portfolio in Handwash & Sanitizer
Personal Wash: Step up in growth momentum
Market Growth Source: AC Nielsen
New Lifebuoy

SQ‘10 Results - Oct 26, 2010
Lifebuoy Relaunch
• New & Improved Lifebuoy
• Advanced Germ Protection ingredients
• Recommended by Indian Public Health Association
• World’s No.1 germ protection soap

SQ‘10 Results - Oct 26, 2010
Skin Care: Market development yielding results
• Skin care delivers strong growth led by successful innovations
• Portfolio expansion in male grooming; successful launch of FAL Max Fairness for Men & Vaseline Menz
• Pond’s White Beauty continues strong growth; building premium skin lightening market
• Vaseline delivers robust growth backed by innovations
• Facial Cleansing sales double
SQ‘10 Results - Oct 26, 2010
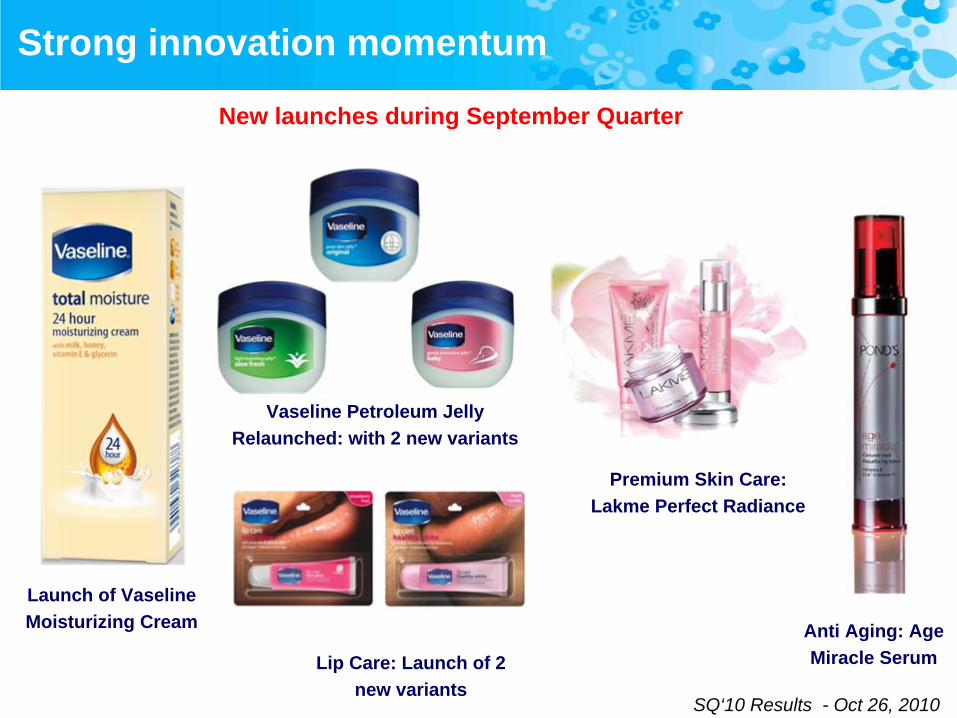
Strong innovation momentum
Vaseline Petroleum Jelly Relaunched: with 2 new variants
Launch of Vaseline Moisturizing Cream
Lip Care: Launch of 2 new variants
Premium Skin Care: Lakme Perfect Radiance
Anti Aging: Age Miracle Serum
New launches during September Quarter

SQ‘10 Results - Oct 26, 2010
• Hair continues double digit growth momentum, ahead
of market
• Strong volumes drive growth across portfolio for
fourth consecutive quarter
• Strong innovation and market development
• Sunsilk Blackshine “Hair Expert Campaign”
performing well
• Clinic Plus drives strong market development
through “3X3=3” campaign
• Hair Conditioners grow strongly, well ahead of the
market
Hair: Competitive growth continues
Market Growth Source: AC Nielsen

SQ‘10 Results - Oct 26, 2010
• Toothpaste regains momentum; growth
led by volumes
• Close-up & Pepsodent deliver growth
• Pepsodent rejuvenated with strong
relaunch: Superior “Germi Check”
proposition
Oral Care: Gaining traction
Market Growth Source: AC Nielsen

SQ‘10 Results - Oct 26, 2010
Beverages grow in a slowing market
• Tea:
• Market growth slows due to high commodity costs
• Red Label grows strongly; especially low unit price
(LUP) packs
• Premium portfolio maintained volumes amidst
downtrading
• Coffee:
• Double digit sales growth underpinned by strong
volume growth
• Bru: Now even better
Market Growth Source: AC Nielsen

SQ‘10 Results - Oct 26, 2010
Processed Foods: Strong & profitable growth
• Robust growth in Processed Foods business; led by Knorr and Kissan
• Knorr Portfolio:
• Soups perform well led by “Thick Tomato”
• Soupy Noodles being rolled out nationally – Consumer response
continues to be extremely positive
• Kissan:
• Growth led by both Jams & Ketchup
• Modern:
• Chapati & Kream Roll launch

SQ‘10 Results - Oct 26, 2010
Pureit continues growth momentum
• Pureit continues to deliver strong growth
underpinned by volumes
• Portfolio now “straddles the pyramid” at
four price points
• Entry at top end, “Pureit Marvella” –
fully automatic water purifier
• Continued to invest behind the brandMass
Mid Priced
Premium

SQ‘10 Results - Oct 26, 2010
SQ’10 – Results
Rs Crores SQ'10 SQ'09 Growth%
Net Sales 4681 4228 10.7
PBITDA 647 652 (0.8)
PBIT 592 606 (2.3)
PBIT margin (%age) 12.6 14.3 -
PBT bei 668 652 2.6
Exceptional Items 40 (135) -
PBT 709 516 37.3
PAT bei 534 500 6.8
Extraordinary Items (net of Tax) - -
Net Profit 566 429 32.1
Rs Cr

SQ‘10 Results - Oct 26, 2010
SQ’10 – Exceptional Items
Particulars SQ'10 SQ'09
Assets Sale 26 31
Restructuring Cost (3) (166)
Sale of investment 20
Others (3)Total 40 (135)
Rs Cr

SQ‘10 Results - Oct 26, 2010
First Half FY’11 – Results
Rs Crores FH'10-11 FH'09-10 Growth%
Net Sales 9475 8704 8.9
PBITDA 1328 1367 (2.9)
PBIT 1219 1278 (4.6)
PBIT margin (%age) 12.9 14.7 -
PBT bei 1338 1352 (1.1)
Exceptional Items 59 (132) -
PBT 1397 1220 14.5
PAT bei 1055 1037 1.7
Extraordinary Items (net of Tax) - 4
Net Profit 1099 972 13.1
Rs Cr
SQ‘10 Results - Oct 26, 2010
Summary
• Growth ahead of market in aggregate – both volume and value
• Underlying volume growth 14% – sustained momentum
• Actions to strengthen leadership yielding positive results
• Effective cost management mostly offsets input cost increases and pricing impact
• PAT (bei) Rs.534 crore, up 6.8%; Net profit Rs.566 crore, up 32.1%
• Interim dividend of Rs.3 Per share

SQ‘10 Results - Oct 26, 2010
Looking ahead
• Good monsoon augurs well for FMCG markets
• Commodity inflation on the rise; continued focus on cost and cash management
• Competitive intensity will remain high
• We remain committed to –
• Win Today: Improve competitiveness and strengthen leadership in core categories
• Win tomorrow: Lead market development of emerging categories and channels

SQ‘10 Results - Oct 26, 2010
Thank you
For more information, please visit For more information, please visit http://www.hul.co.inhttp://www.hul.co.in

Results – SQ ’10
October 26, 2010
Investor Presentation